


Abstract
Forest parks are expected to balance ecological protection with high-quality ecotourism experiences, yet quantitative, multi-dimensional assessments at the regional scale remain limited. This study evaluates ecotourism experience quality across 37 national forest parks in Shaanxi Province, China, using a five-dimensional, 32-indicator framework (science popularization, landscape esthetics, ecological resources, cultural resources, and supporting conditions). Indicator weights were elicited through the Fuzzy Analytic Hierarchy Process (FAHP), and park performance was ranked via TOPSIS; key constraints were diagnosed using an obstacle degree model. Results show that landscape esthetics received the highest criterion weight (0.245), followed by ecological resources (0.215) and supporting conditions (0.195). The mean experience score across parks was 0.559, with high-quality parks concentrated in the Guanzhong region. Obstacle analysis indicates that insufficient cultural resource protection and interpretation, inadequate public service facilities, and weak science-education functions are the most persistent barriers to improving experience quality. The proposed FAHP–TOPSIS–obstacle framework supports benchmarking and priority setting for sustainable management and targeted investments in forest parks.
1. Introduction
In the context of global efforts to combat climate change and promote sustainable development, the importance of forest ecosystems is becoming increasingly evident. Forest parks are not only crucial carbon sinks and repositories of biodiversity, but also directly contribute to human well-being and socio-economic development through providing ecosystem services such as recreation and education [1,2]. Ecotourism, especially forest ecotourism based on forest parks, has become a key path for achieving a balance between protection and utilization and promoting regional green development. In recent years, with the deep implementation of the concept of “green mountains and clear waters are as valuable as gold and silver” and the proposal of China’s “carbon neutrality” goals, the development of low-carbon and sustainable forest tourism models has gained unprecedented policy impetus and practical urgency. At the same time, the acceleration of urbanization and increased living pressure have led to a continuous rise in public demand for close contact with nature and the pursuit of high-quality recreational experiences [3]. The data shows that the number of tourists engaging in forest tourism in China has accounted for approximately 30% of the total domestic tourism visits, creating significant social and economic value and demonstrating its important position as a green industry. In this context, scientifically assessing and continuously improving the quality of ecological tourism experiences in forest parks has become a core link for achieving the synergistic enhancement of their ecological, social, and economic functions [4]. This study aims to conduct a comparable comprehensive evaluation of multiple forest parks at the provincial scale in terms of sustainable ecotourism and identify the weakest factors that require the most urgent improvement.
Carrying out a scientific evaluation of the quality of forest park experiences is an important way to enhance the construction level and promote sustainable tourism development [5]. Existing studies have accumulated rich results on this topic, laying a theoretical foundation for this research. In general, the relevant progress mainly manifests in three aspects: the expansion of evaluation dimensions, the innovation of methodology, and the deepening of empirical research. One aspect is the expansion of evaluation dimensions. The research focus has shifted from a single aspect of tourist satisfaction to a comprehensive sustainability experience indicator system, covering multiple key elements such as ecological carrying capacity, environmental education effectiveness, cultural identity, service facility adaptability, and community participation [6]. For instance, some studies have explored the enhancing effect of nature reserves on the resilience of urban tourism and sustainable development strategies; some have constructed an integrated performance evaluation system for ecological efficiency from three aspects: ecosystem, economic system, and environmental system; and some scholars have examined the impact of esthetic expectations and esthetic experiences on tourist satisfaction [7]. The second aspect is the innovation in methodology. Research tools are undergoing a profound transformation from traditional statistical analysis to multi-criteria decision-making techniques. Early studies mostly relied on questionnaires and descriptive statistics, which could depict satisfaction levels but were unable to handle multi-indicator weights and uncertainties. The weighting methods represented by the Analytic Hierarchy Process (AHP) are widely used, but they have limitations in dealing with the ambiguity of expert judgments and the selection of multiple options [8]. Therefore, the academic community has gradually introduced more precise combination models. The Fuzzy Analytic Hierarchy Process (FAHP) handles uncertainties by constructing fuzzy complementary judgment matrices, making the weight assignment more in line with the real decision-making context, and has been widely applied in the assessment of ecological tourism suitability [9], the evaluation of wetland service quality, and the analysis of land resource potential [10]. The Technique for Order Preference by Similarity to Ideal Solution (TOPSIS) calculates the distance of each object to the positive and negative ideal solutions to achieve quantitative classification of the advantages and disadvantages of multiple options, and is often combined with the Entropy Weight Method for use in forest ecological security assessment [11]. The combined application of FAHP-TOPSIS forms a complete process of “weighting—ranking”: FAHP determines scientific weights, and TOPSIS conducts refined ranking. For instance, in the assessment of the ecological tourism prospects in the northwest of the Himalayas, the combination of AHP-TOPSIS significantly enhanced the reliability of the assessment [12]. Moreover, to reduce the subjectivity of weight setting, objective weighting methods such as Data Envelopment Analysis (DEA) [13] and the entropy method [14] are often used in conjunction with multi-criteria decision-making models, forming a new pattern that integrates subjective and objective elements and combines qualitative and quantitative aspects. The integration of Geographic Information System (GIS) [15] enables the assessment to have spatial analysis capabilities, achieving the visual identification of potential ecological tourism areas. This evolution from a single method to a mixed model, from subjective judgment to the integration of subjective and objective elements, indicates that the evaluation of forest parks is moving towards a more systematic and precise stage. The third aspect is the deepening of empirical research. The research scope has expanded from a single case analysis of a park to a systematic comparison at the regional level and temporal-spatial dynamic analysis. From the perspective of research scale, the macroscopic research at the national level reveals the distribution characteristics, temporal and spatial evolution patterns, and regional differences in tourism ecological efficiency of China’s national nature reserves [16]. Research at the urban agglomeration [17] and provincial levels [18] mainly focuses on the spatial structure optimization of nature reserves, the mechanism of investment efficiency impact, the assessment of ecological functions, and their supporting role in the social economy. The micro-analysis of typical cases focuses on issues such as recreation value assessment [19], soundscapes evaluation [20], measurement of tourism carrying capacity [21], etc., providing solid data support for precise management. The complementary nature of studies at different scales has jointly promoted a multi-dimensional understanding of the quality of forest park experiences.
Although the evaluation of forest parks has achieved fruitful results and provided important references for the construction of the development quality of forest parks, when comprehensively reviewing the existing literature, there are still the following research gaps: First, most studies focus on a single dimension [22] (such as landscape or economy [13]) or a single park case, lacking the integration of multi-dimensional indicators (such as ecology, esthetics [23], culture, and services [24]), and conducting comprehensive evaluation research on systematic and macroscopic comparisons of multiple forest parks within a specific geographical area [25]. Second, although the AHP method is widely used, studies combining it with fuzzy theory, TOPSIS, etc. [26,27,28], are still insufficient in regional forest park experience evaluation. More importantly, the existing evaluations mostly stop at scoring or ranking, lacking the diagnostic analysis of key obstacles that constrain the improvement of experience quality, making it difficult to convert the evaluation results into specific and prioritized control measures [29]. Third, for regions like Shaanxi Province, which have complex natural geographical patterns and profound historical cultural backgrounds, there is still a lack of using the “evaluation-diagnosis” integrated framework [30] to deeply analyze the experience quality of national forest parks and address the unique management challenges with targeted results.
Based on the above analysis, the main contributions of this paper to the existing literature lie in the following three aspects. Firstly, it constructs a comprehensive evaluation system covering multiple dimensions of criteria. Secondly, it integrates the FAHP and TOPSIS methods and innovatively introduces the obstacle degree model to identify the key obstacle factors that restrict the improvement of experience quality. Finally, this comprehensive framework is applied to the empirical study of national forest parks in Shaanxi Province, with the aim of providing a scientific basis and precise management insights for the high-quality and sustainable development of forest tourism in this region.
2. Materials and Methods
2.1. Research Area
Shaanxi Province is located in the inland area of China. Its terrain is high in the north and low in the middle, and it is divided into three natural regions from north to south: the Shaanxi Northern Plateau, the Guanzhong Plain, and the Qinba Mountainous Area. The landforms are diverse, covering transitional sandy areas, the Loess Plateau region [31], the Guanzhong Plain region, the Qinling Mountain area, the Hanjiang Basin area, and the Dabashan area. The province spans two major river basins, the Yellow River and the Yangtze River, and crosses three monsoon climate zones: the mid-temperate zone, the warm temperate zone, and the northern subtropical zone.
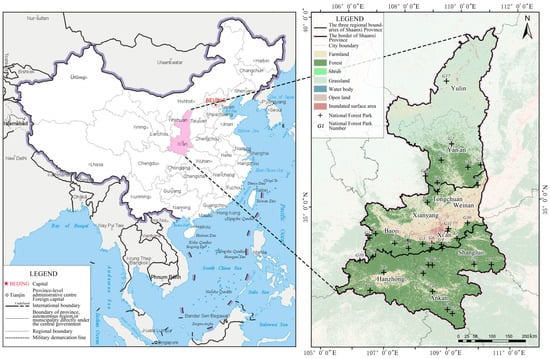
Shaanxi Province has a superior forest resource endowment. According to the data from the Ninth National Forest Resources Census, the total forest area of the province is 8.87 million hectares, with a forest coverage rate of 43.06%, and the forest volume is approximately 606 million cubic meters. Relying on its abundant forest resources, Shaanxi Province has built 90 nature reserves, including 37 national nature reserves and 53 provincial nature reserves, jointly forming an important network integrating ecological protection, scientific research, and recreational and tourism functions (Figure 1).
Figure 1.
Location Analysis Map.
2.2. Methods
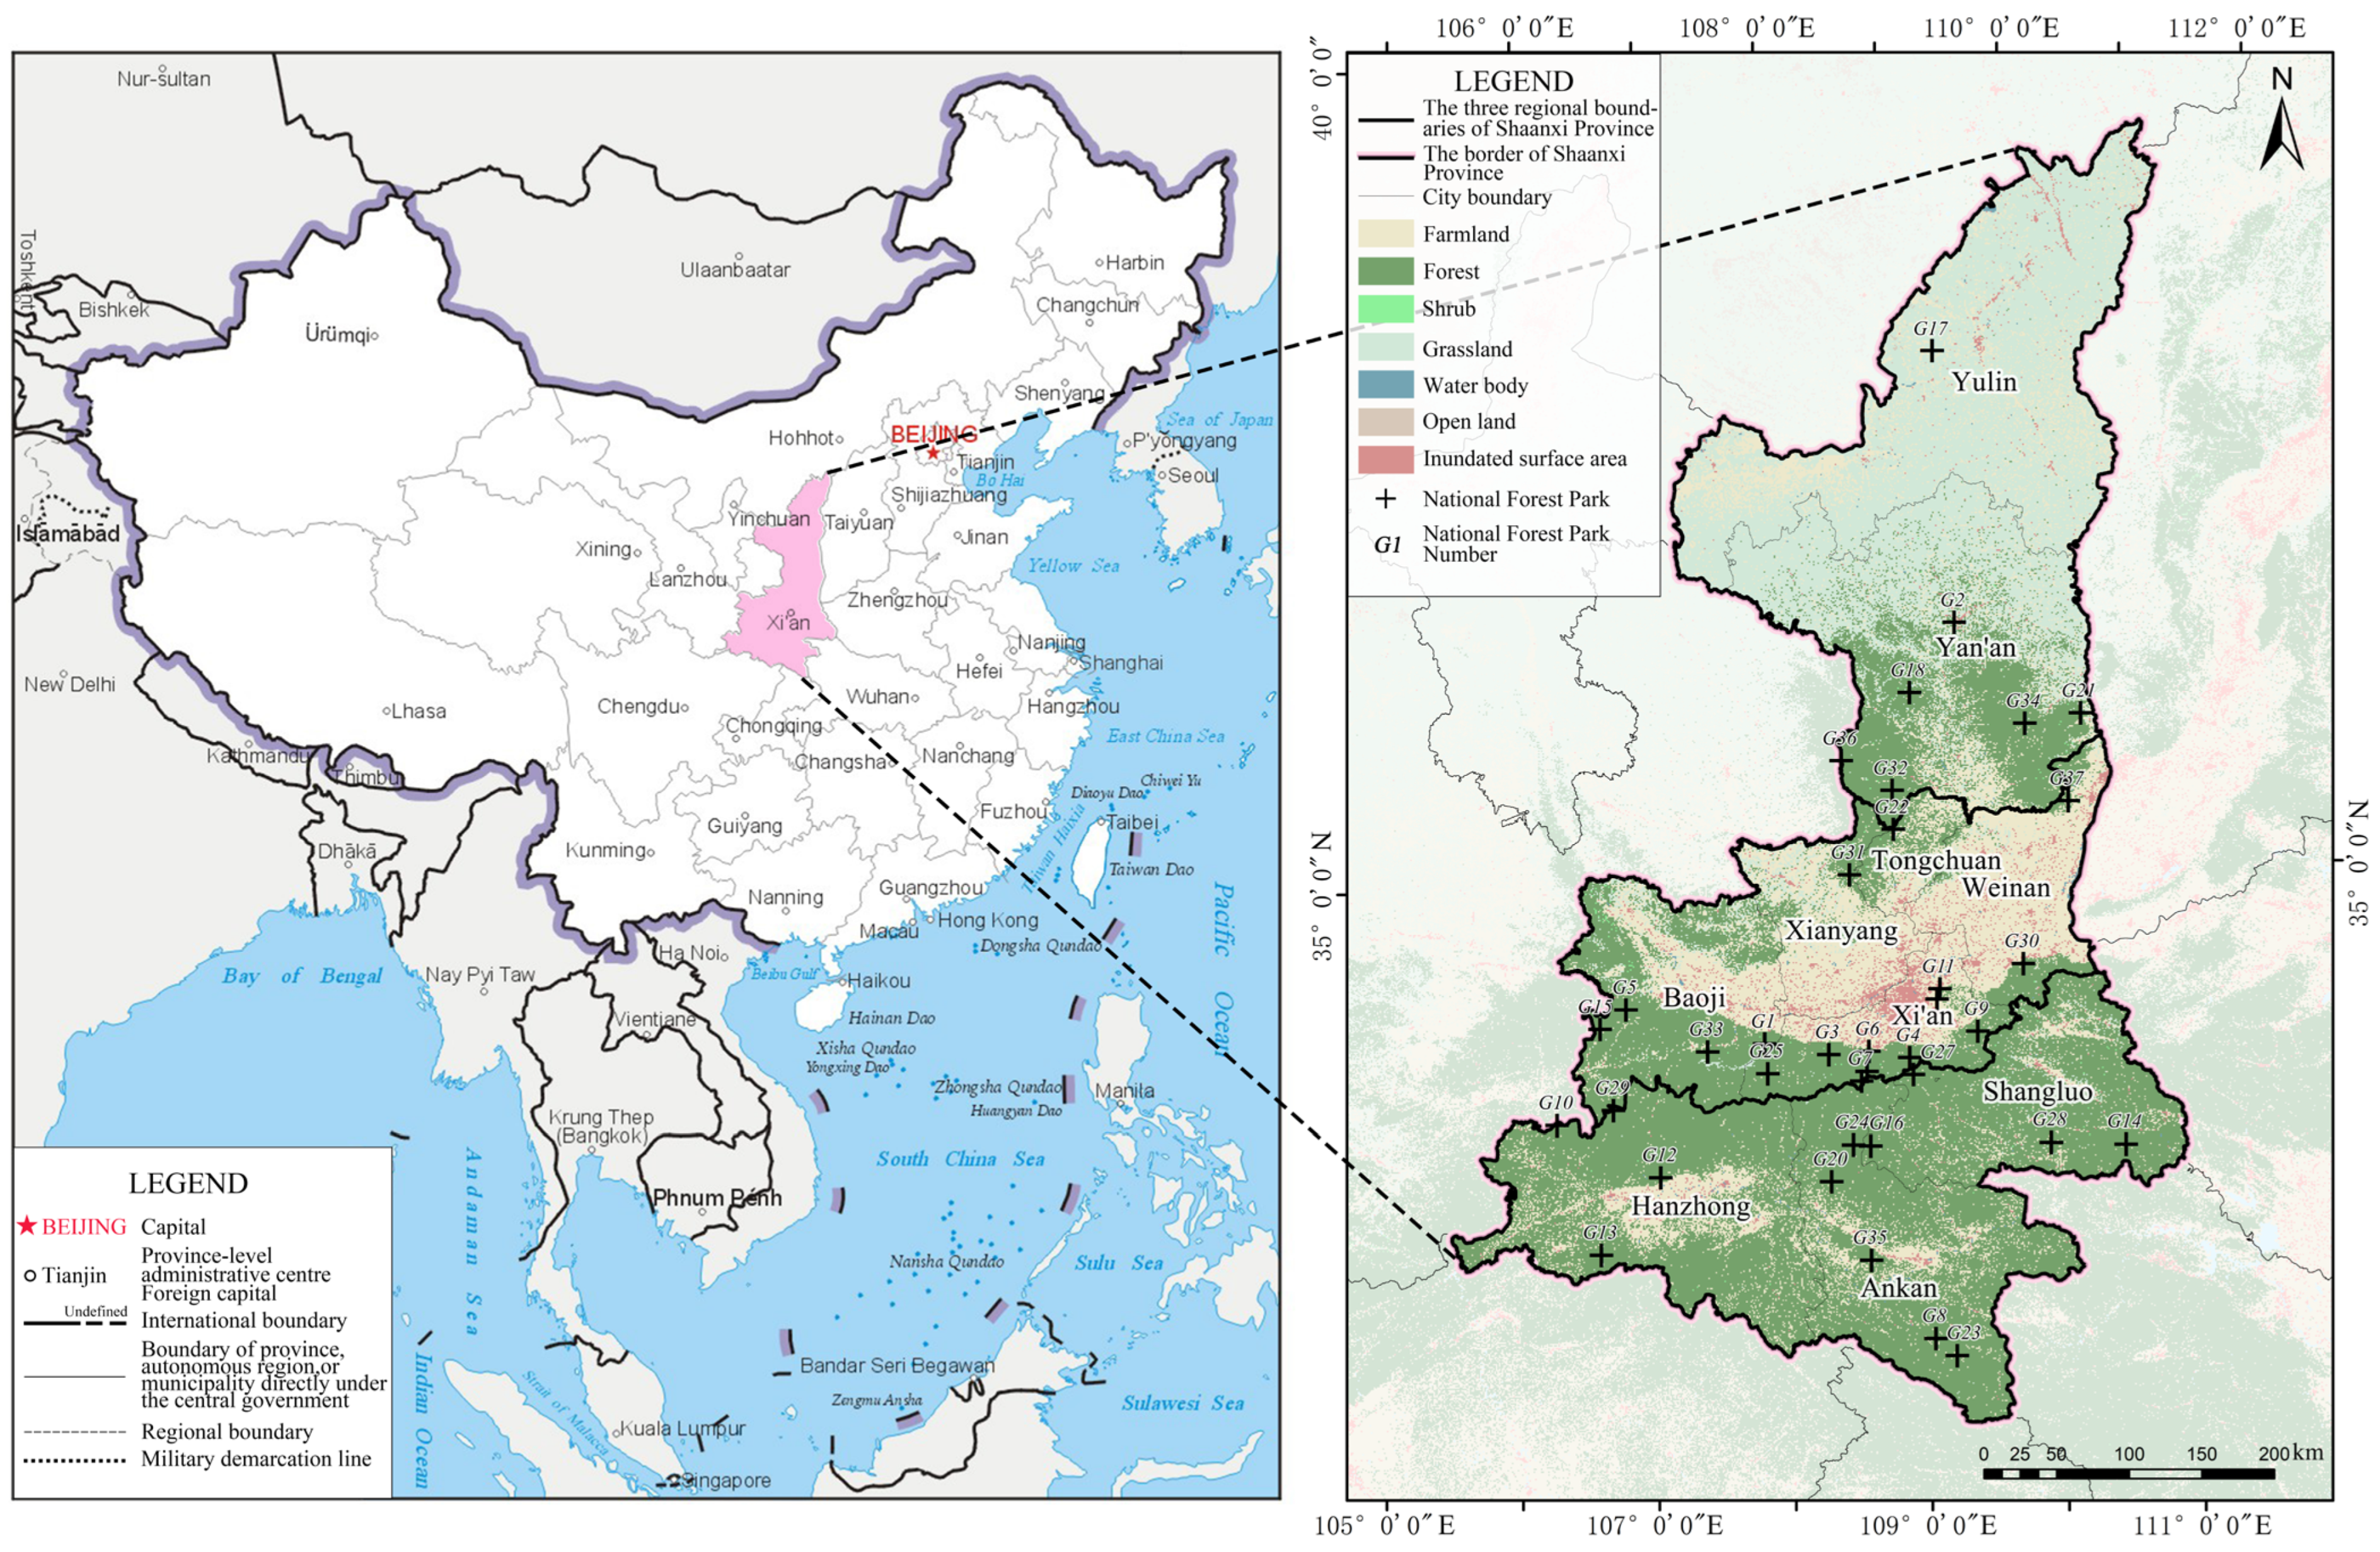
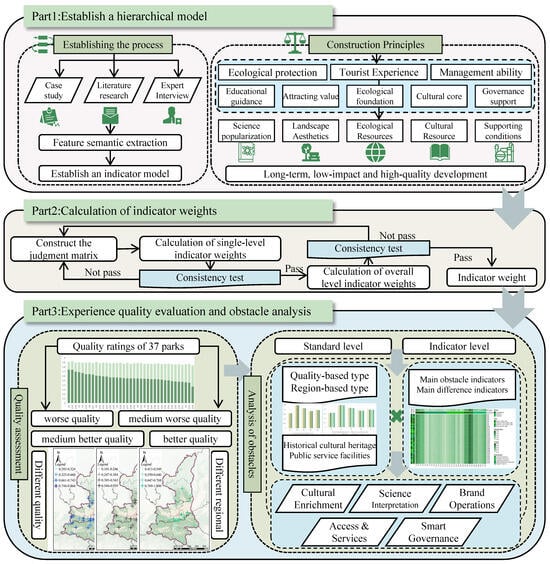
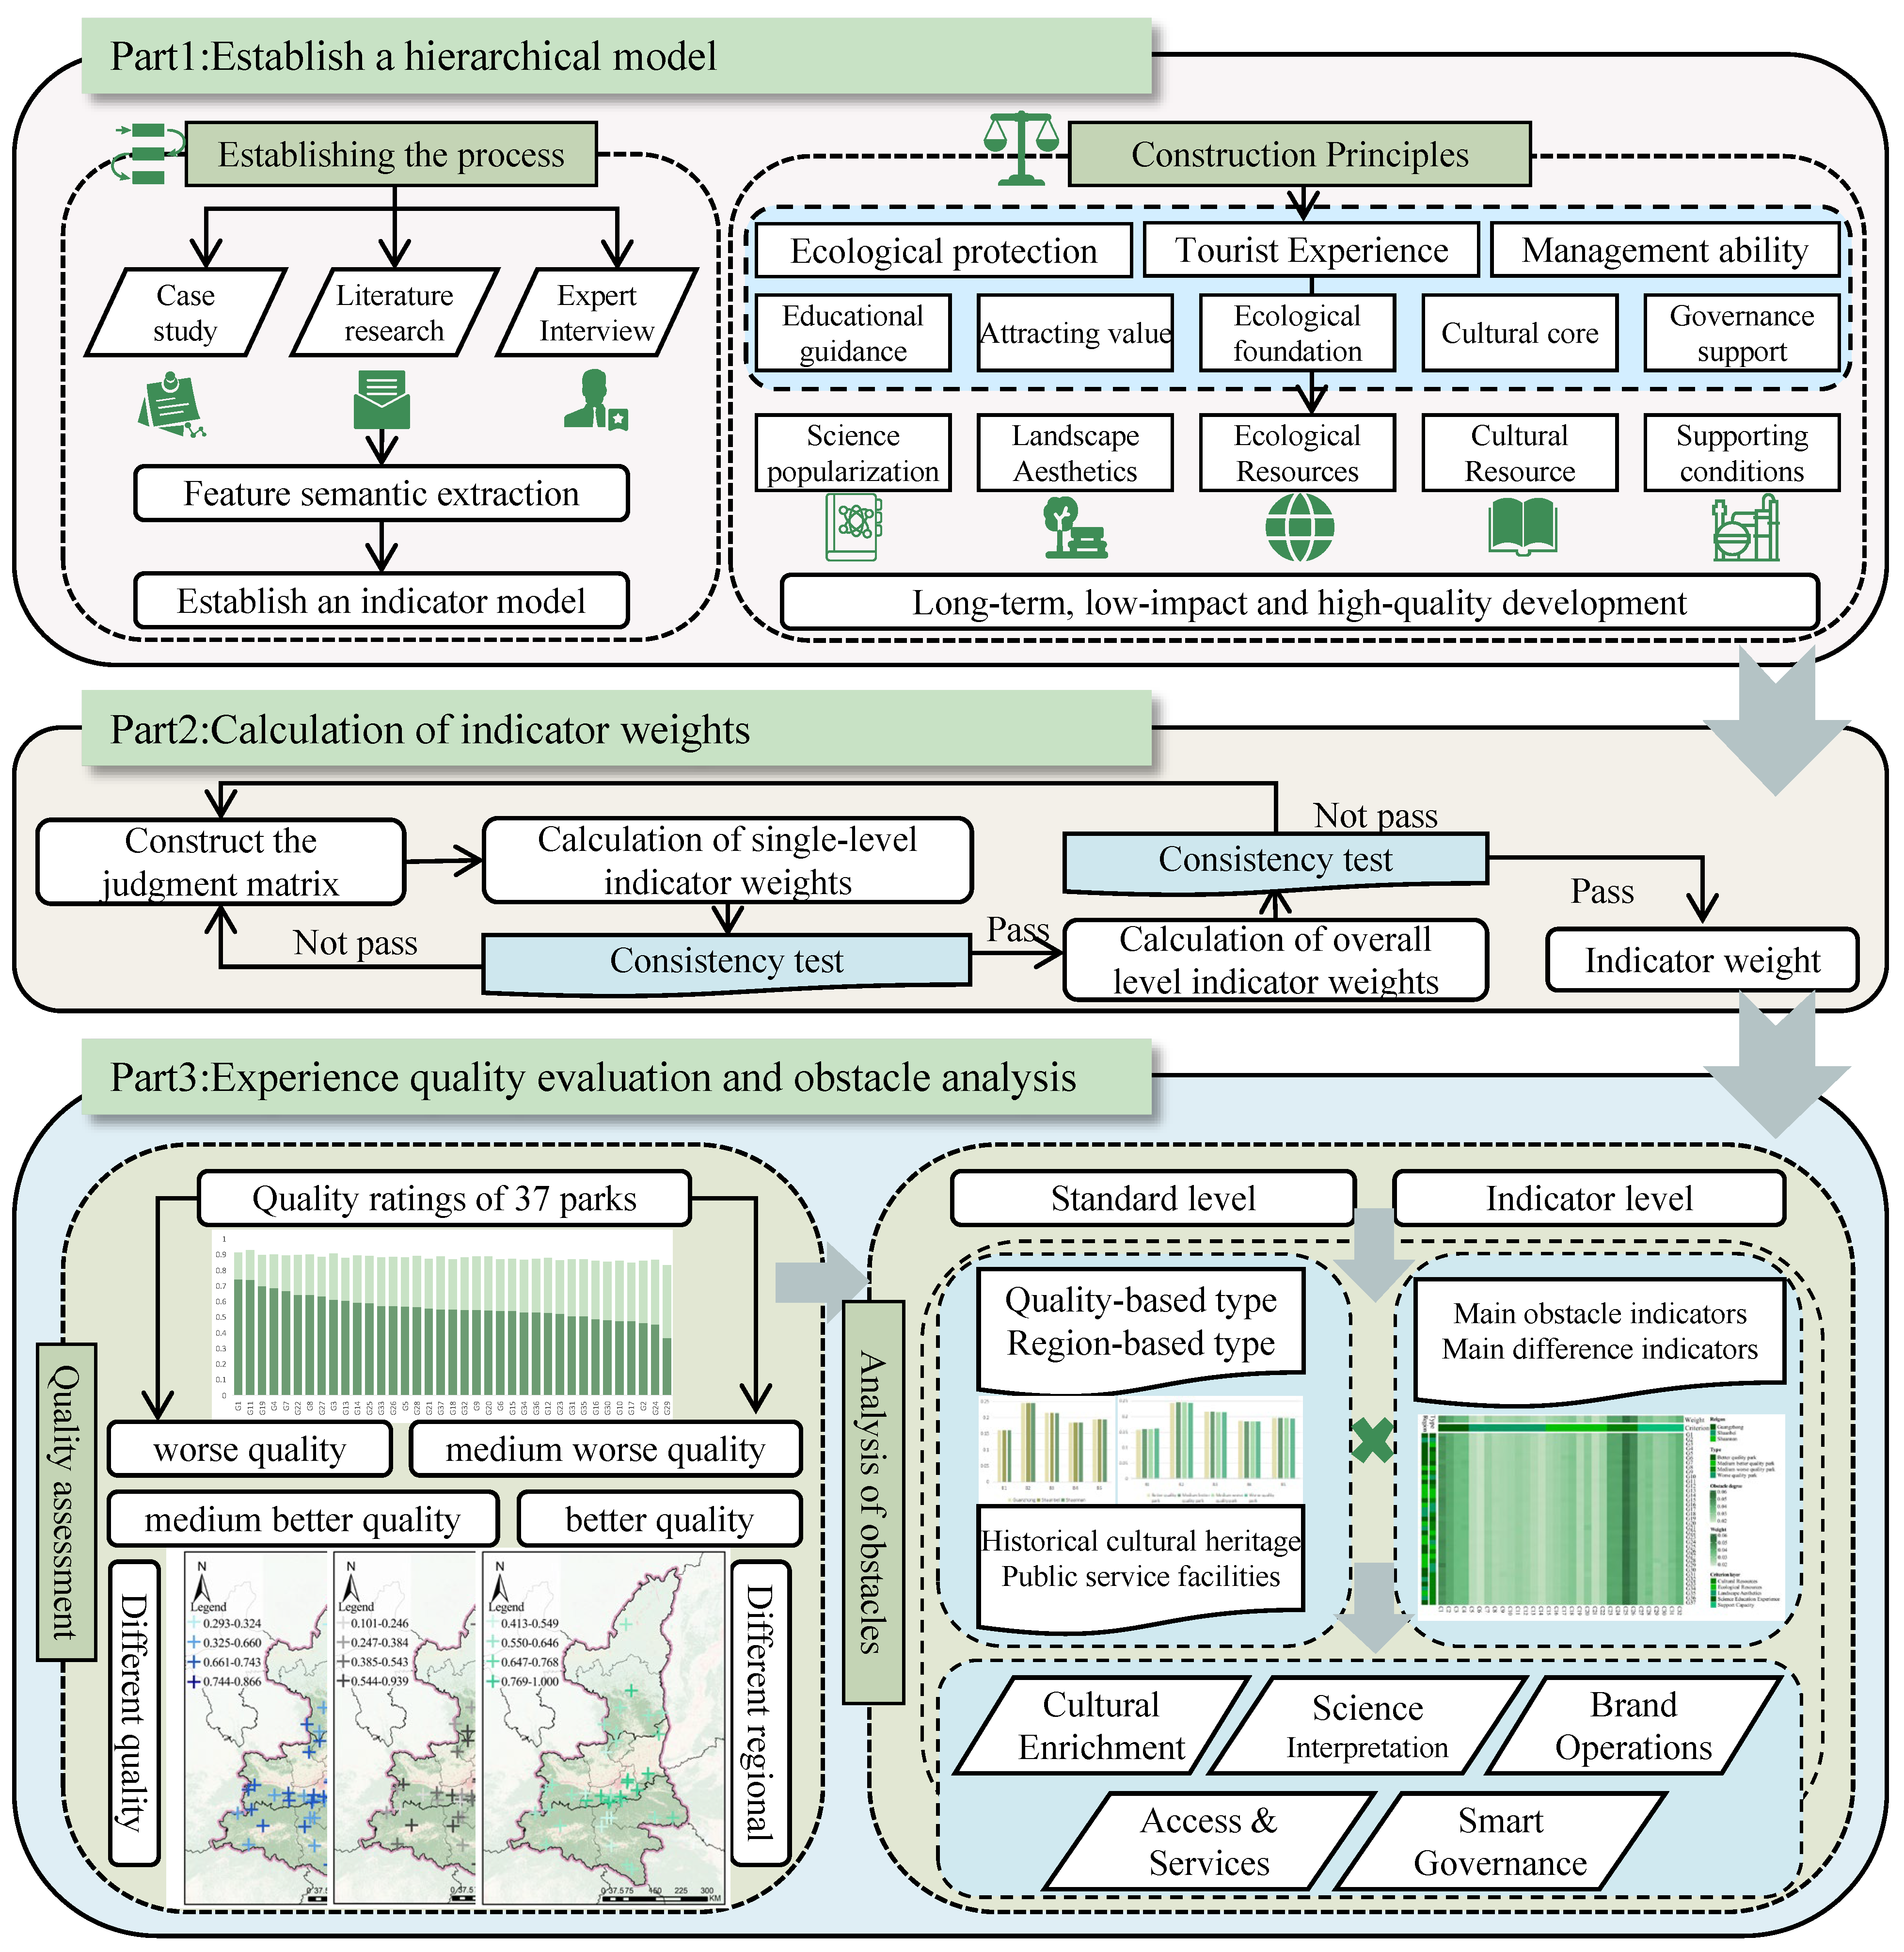
This research follows the overall approach of “indicator construction—weight determination—comprehensive evaluation—obstacle diagnosis” to form a complete technical route. Firstly, based on the connotation of sustainable ecotourism, an evaluation index system for experience quality is constructed, and an evaluation matrix that can be used for quantitative analysis is formed. Secondly, experts in related fields are invited to compare each indicator, and the FAHP method is used to determine the weights of the indicators on the basis of handling the ambiguity and uncertainty of judgments, and the consistency test is conducted to ensure the reliability of the weight results. Thirdly, the indicator data of each forest park is standardized, and a weighted standardized matrix is constructed by combining the weights obtained from the FAHP. The distance and relative proximity of each evaluation object to the positive and negative ideal solutions are calculated using the TOPSIS method to achieve the comprehensive measurement and ranking of the experience quality of the forest parks. Finally, based on the comprehensive evaluation results, the obstacle degree model is introduced to decompose and attribute each indicator’s obstacle degree, identify the key obstacles that restrict the improvement of experience quality, and provide a basis for proposing management optimization strategies for sustainable ecotourism in the future (Figure 2).
Figure 2.
Research framework diagram.
2.2.1. Construction of Evaluation Index System
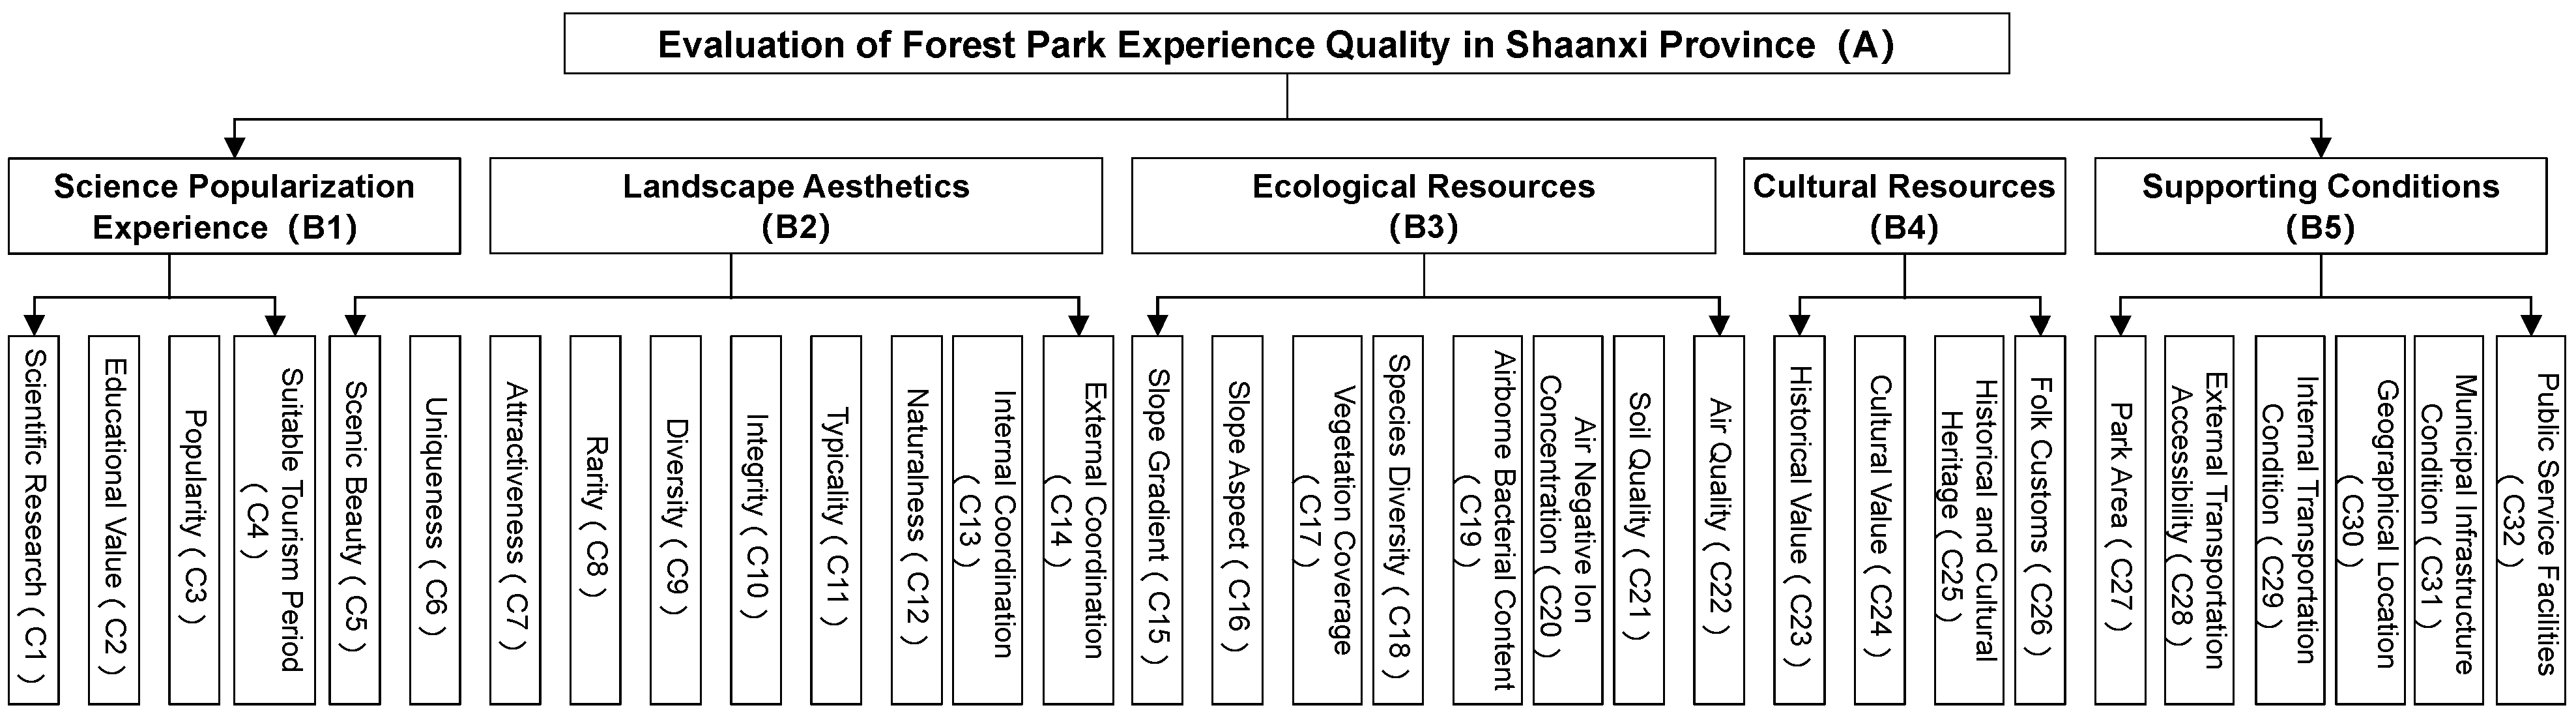
The assessment of the experience quality of a forest park oriented towards sustainable ecological tourism is a typical multi-objective decision-making problem, which requires the coordination of three goals: ecological protection, tourist experience, and management ability [32,33,34]. Therefore, the forest park can be regarded as a complex adaptive system composed of ecological, social, and management elements. Each subsystem interacts with each other and jointly determines whether tourism activities can achieve long-term, low-impact, and high-quality development under the constraints of resources and environment. Specifically, this paper constructs an evaluation framework from the following five dimensions: (1) The scientific popularization experience dimension emphasizes enhancing tourists’ ecological awareness and responsible behavior through environmental education, thereby reducing disturbances and reducing ecological pressure caused by improper use. It not only reflects the subjective sense of gain of tourists in terms of cognitive learning and self-improvement [35], but also reflects the supply capacity of the scenic area in the explanation system, environmental interpretation, and educational activities, which is an important support for achieving “promoting conservation through tourism and promoting management through education”; (2) the landscape esthetics dimension is the core attraction of the forest park and the direct source of competitiveness in the ecological tourism market. By quantifying factors such as visual appeal, scarcity, and coordination, the esthetic value and integrity of the landscape resources can be identified [36]. On the one hand, the higher the esthetic value, the better the experience quality will be; on the other hand, its integrity and coordination are also closely related to the health of the ecosystem, the stability of the landscape pattern, and the tolerable intensity of recreational activities [37,38], which are key manifestations of achieving “prioritizing protection and moderate utilization”; (3) the ecological resources dimension focuses on the health status, stability, and sensitivity of the ecosystem, aiming to measure whether the ecological base can support continuous recreational utilization and provide a basis for controlling development intensity, optimizing route layout, and implementing ecological restoration [39]; (4) the cultural resources dimension carries regional cultural memory and spiritual connotations, which is an important source of the “local” experience in ecological tourism. The evaluation of the protection and display level of cultural resources can not only enhance the depth of tourists’ experience and the differentiated competitiveness of the destination, but also help strengthen local identity and cultural inheritance [40]; (5) the supporting conditions dimension covers hardware facilities, management and service levels, etc., which affects the convenience and safety of the tourist experience, and also determines whether key links such as garbage treatment and sewage, maintenance of recreational order, environmental monitoring and emergency management can operate effectively, thereby affecting the ecological footprint and long-term operational performance of the tourism activities.
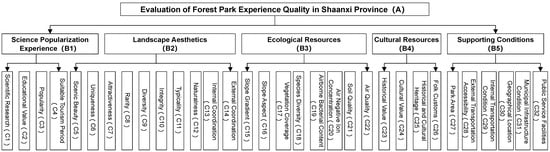
In summary, under the theoretical framework of sustainable ecological tourism, a hierarchical and progressive evaluation index system is constructed from the five dimensions of “education guidance—attractive value—ecological foundation—cultural core—governance support” to systematically assess the ecological tourism experience quality of the forest park. The index system is divided into the target layer, criterion layer, and index layer. The index layer selects 32 specific indicators to achieve a comprehensive evaluation and diagnosis of the key elements of the ecological tourism experience quality oriented towards sustainable ecological tourism (Figure 3).
Figure 3.
Evaluation Index System for Forest Park Experience Quality in Shaanxi Province.
2.2.2. FAHP
The AHP is a multi-criteria decision-making method that hierarchically breaks down complex decision-making problems and determines the relative importance weights of each factor through pairwise comparisons. The traditional AHP has limitations when dealing with the inherent fuzziness and uncertainty in expert judgments. Therefore, this study introduces the fuzzy theory and adopts the fuzzy analytic hierarchy process to determine the weights of the indicators, in order to handle the fuzziness of the judgment information more scientifically. To ensure the authority and representativeness of the judgment results, this study invited a total of 15 experts from related fields to participate in the questionnaire survey for pairwise comparison of the indicators. The professional fields covered four main directions: forest ecology (4 people), tourism planning and management (5 people), landscape architecture (3 people), and urban and rural planning (3 people). All experts had more than five years of research or practical experience in their respective fields, and experts with on-site research experience in Shaanxi Provincial Forest Parks or those who had presided over related projects were given priority to ensure the regional nature of the judgment [41]. The main implementation steps of FAHP are as follows:
(1) Establish a fuzzy complementary judgment matrix
Using a scale of 0.1 to 0.9 (Table 1), make pairwise comparisons of factors and obtain the fuzzy judgment matrix.
Table 1.
Criteria for Assessing the Importance of Factors.
The FAHP adopts a fuzzy scale ranging from 0.1 to 0.9. This choice is mainly based on the following considerations: Firstly, it maintains consistency with the inherent framework of the fuzzy set theory. In fuzzy set theory, the membership degree is typically within the range of [0, 1]. This scale can seamlessly integrate with operations such as fuzzy synthesis and fuzzy reasoning, ensuring the theoretical rigor of subsequent weight calculations. Secondly, compared to the traditional 1–9 scale used in AHP, the 0.1–0.9 scale is more likely to meet the consistency requirements when constructing the fuzzy consistent matrix, enabling faster calculation of the weight vector and significantly reducing the complex adjustment process caused by inconsistent matrices.
(2) Determining the Weights
Among them, represents the sum of the elements in the i-th row.
(3) Calculate the feature matrix
Let be the weight vector of the fuzzy judgment matrix A, where , define:
For example, , its result is equal to . After the data at each position of the matrix is calculated using the values from the weight vector W, and an n-order matrix is obtained:
is referred to as the characteristic matrix of the judgment matrix A.
(4) Calculate the compatibility index
Let matrices and be both fuzzy judgment matrices, and the formula is as follows:
represents the compatibility index of A and B
(5) Consistency Test
Calculate the compatibility index by comparing the fuzzy judgment matrix A with its characteristic matrix . If The consistency test is considered passed. The smaller the value, the higher the decision-maker’s requirement for the consistency of the fuzzy judgment matrix. Generally, can be set to 0.1.
2.2.3. TOPSIS Method
TOPSIS is a technique for solving multiple-criterion decision-making problems [42], of which the basic thought is to define the positive ideal solution and negative ideal solution for the decision-making problem first, then rank the solutions according to the distance of every feasible solution from the positive ideal solution and the negative ideal solution, respectively [43]. The positive ideal solution maximizes the benefit and also minimizes the total cost, while the negative ideal solution minimizes the benefit and also maximizes the total cost [44].
This method can systematically analyze the degree of closeness between the ecological tourism quality of the forest park and the ideal conditions, thereby objectively reflecting the existing problems of the forest park. The specific steps are as follows:
First, convert the expert scores into a matrix of n evaluation objects and a matrix of m normalized evaluation factors.
Next, determine the positive and negative ideal solutions. The positive ideal solution is composed of the maximum values of each column in the weighted standardized matrix, while the negative ideal solution is made up of the minimum values of each column.
Then, the Euclidean distance is used to calculate the distance between the object and the positive ideal solution as well as the negative ideal solution.
Then, the relative closeness degree is calculated using the negative ideal solution distance and ranked accordingly. The relative closeness degree ranges from 0 to 1. The larger the value, the farther it is from the negative ideal solution, and the better it is.
2.2.4. Obstacle Analysis
Based on the evaluation results, it is necessary to further explore the key factors that constrain the quality of ecological tourism in forest parks. Van LamSweerde and Letier developed a simplified version of the KAOS framework for reasoning about obstacles to the satisfaction of goals and requirements [45]. In this framework, a goal was defined as a set of desired behaviors, and an obstacle was defined as a set of undesirable behaviors. Obstacles, which are associated with the behaviors they hinder, need to be identified and qualified in order to find solutions [46]. Therefore, by applying the obstacle analysis to diagnose and analyze the obstacles that constrain the optimization of the ecological tourism quality in forest parks, more practical solutions can be provided for the improvement of the ecological tourism quality in each forest park. The formula of the obstacle analysis model is as follows:
Based on the hierarchical relationship of the indicators, the degree of obstacles of the lower-level indicators are summed up and aggregated upwards to obtain the degree of obstacles of the upper-level indicators.
2.3. Date
The data on educational value, popularity, and suitability period are derived from the official annual reports released by provincial and municipal forestry or tourism bureaus. The suitability period is determined based on the official annual suitable visiting days announced by the parks. The indicators at the landscape esthetics level are highly professional, and their data come from two sources: one is the interpretation and analysis of high-definition remote sensing images of the study area using geographic information system technology; the other is conducting on-site investigations, surveys, and visits, and obtaining the research data through methods such as on-site observation, interviews, and questionnaire distribution. At the ecological resource level, the data on slope and aspect are sourced from the 30 m resolution digital elevation model (DEM) provided by the Chinese Academy of Sciences’ Resource and Environment Science and Data Center (https://www.resdc.cn (accessed on 12 November 2025)), and are extracted and analyzed using ArcGIS 10.8 software. The data on vegetation coverage and species diversity are derived from the latest master plans and annual ecological monitoring reports of each forest park. Data on soil quality and air quality mainly come from the air quality monitoring stations of local environmental protection bureaus and the published literature in the relevant research areas. Data at the cultural resource level is mainly obtained based on local chronicles, the published lists of cultural relics protection units by the cultural relics bureau, and the lists of intangible cultural heritage. For the supporting conditions, the park area, external transportation accessibility, and geographical location are directly quoted from the master plans of each forest park or retrieved from the API of Gaode Map. The data on internal transportation conditions, municipal infrastructure conditions, and public service facilities are sourced from the observations and ratings made by researchers during their field investigations.
3. Results
3.1. Determine the Weights
Table 2, Table 3, Table 4, Table 5, Table 6 and Table 7 show the fuzzy judgment matrices, normalized factor priority values and their rankings. After obtaining the normalized weights, the maximum eigenvalue and eigenvector of each judgment matrix are calculated for consistency assessment (Table A1). The calculation results indicate that CR is all less than 0.1 (Table 8). Each judgment matrix is valid and the weights meet the consistency requirements.
Table 2.
Fuzzy comparison matrix of the criteria A and Fuzzy weights.
Table 3.
Fuzzy comparison matrix of the criteria B1 and Fuzzy weights.
Table 4.
Fuzzy comparison matrix of the criteria B2 and Fuzzy weights.
Table 5.
Fuzzy comparison matrix of the criteria B3 and Fuzzy weights.
Table 6.
Fuzzy comparison matrix of the criteria B4 and Fuzzy weights.
Table 7.
Fuzzy comparison matrix of the criteria B5 and Fuzzy weights.
Table 8.
CR of comparison matrix.
As shown in Table 2, the weights of each indicator in the criterion layer are in the following order: landscape esthetics (0.245) > ecological resources (0.215) > supporting conditions (0.195) > cultural resources (0.185) > scientific popularization experience (0.16). This indicates that the evaluation system for the ecological tourism resources quality of Shaanxi Province’s forest parks has formed a multi-dimensional, comprehensive consideration framework. Landscape esthetics and ecological resources jointly constitute the most core evaluation basis. Among them, the weight of landscape esthetics is significantly the highest, indicating that it is the most critical dimension affecting the evaluation of the ecological tourism resources quality of Shaanxi Province’s forest parks, and it occupies a core position in the overall resource quality assessment. Specifically, the evaluation of the landscape esthetics of the forest park focuses on the expressiveness of internal landscape elements and the coordination of the overall space presentation. Looking at the evaluation factors in the depth of the landscape esthetics, the weight of typicality (0.115) and attractiveness (0.113) ranks first and second among all indicators, the weight of naturalness and integrity is also relatively high, and it can be seen that the tourists’ intuitive perception, the representativeness of the landscape, the original state of the ecology, and the completeness of the landscape system are the key elements for evaluating the visual landscape esthetic value of the forest park. The ecological resources ranks second, and it is an important fundamental factor affecting the quality of the resources. For Shaanxi Province’s forest parks, it is necessary to attach great importance to its ecological background value, deeply protect and enhance its ecological landscape. Regarding the specific weight of the evaluation factors under this dimension, species diversity (0.148) and air negative ion concentration (0.139) are the two with the highest weights, and the weight of vegetation coverage (0.136) follows closely. The Supporting Conditions ranks third, mainly evaluating the park’s scale foundation and internal and external development conditions, among which the weight of public service facilities (0.200) is the highest within this criterion layer, and the external transportation accessibility (0.173) and municipal facilities conditions (0.173) are second. Under the cultural resources dimension, the evaluation factor of historical cultural heritage (0.292) has a significantly higher weight than other cultural indicators, and folk customs (0.258) ranks second. The weight of scientific popularization experience within the criterion layer is relatively low, indicating that its direct impact on the overall resource quality evaluation is weaker than the previous four, but it is still an indispensable supporting condition. The scientific popularization experience mainly evaluates the scientific education function potential of the park, and the weight of the evaluation factors is generally low, among which scientific research (0.292) is relatively the highest.
3.2. Comprehensive Assessment
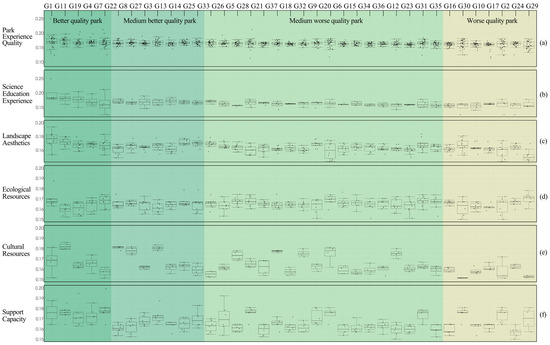
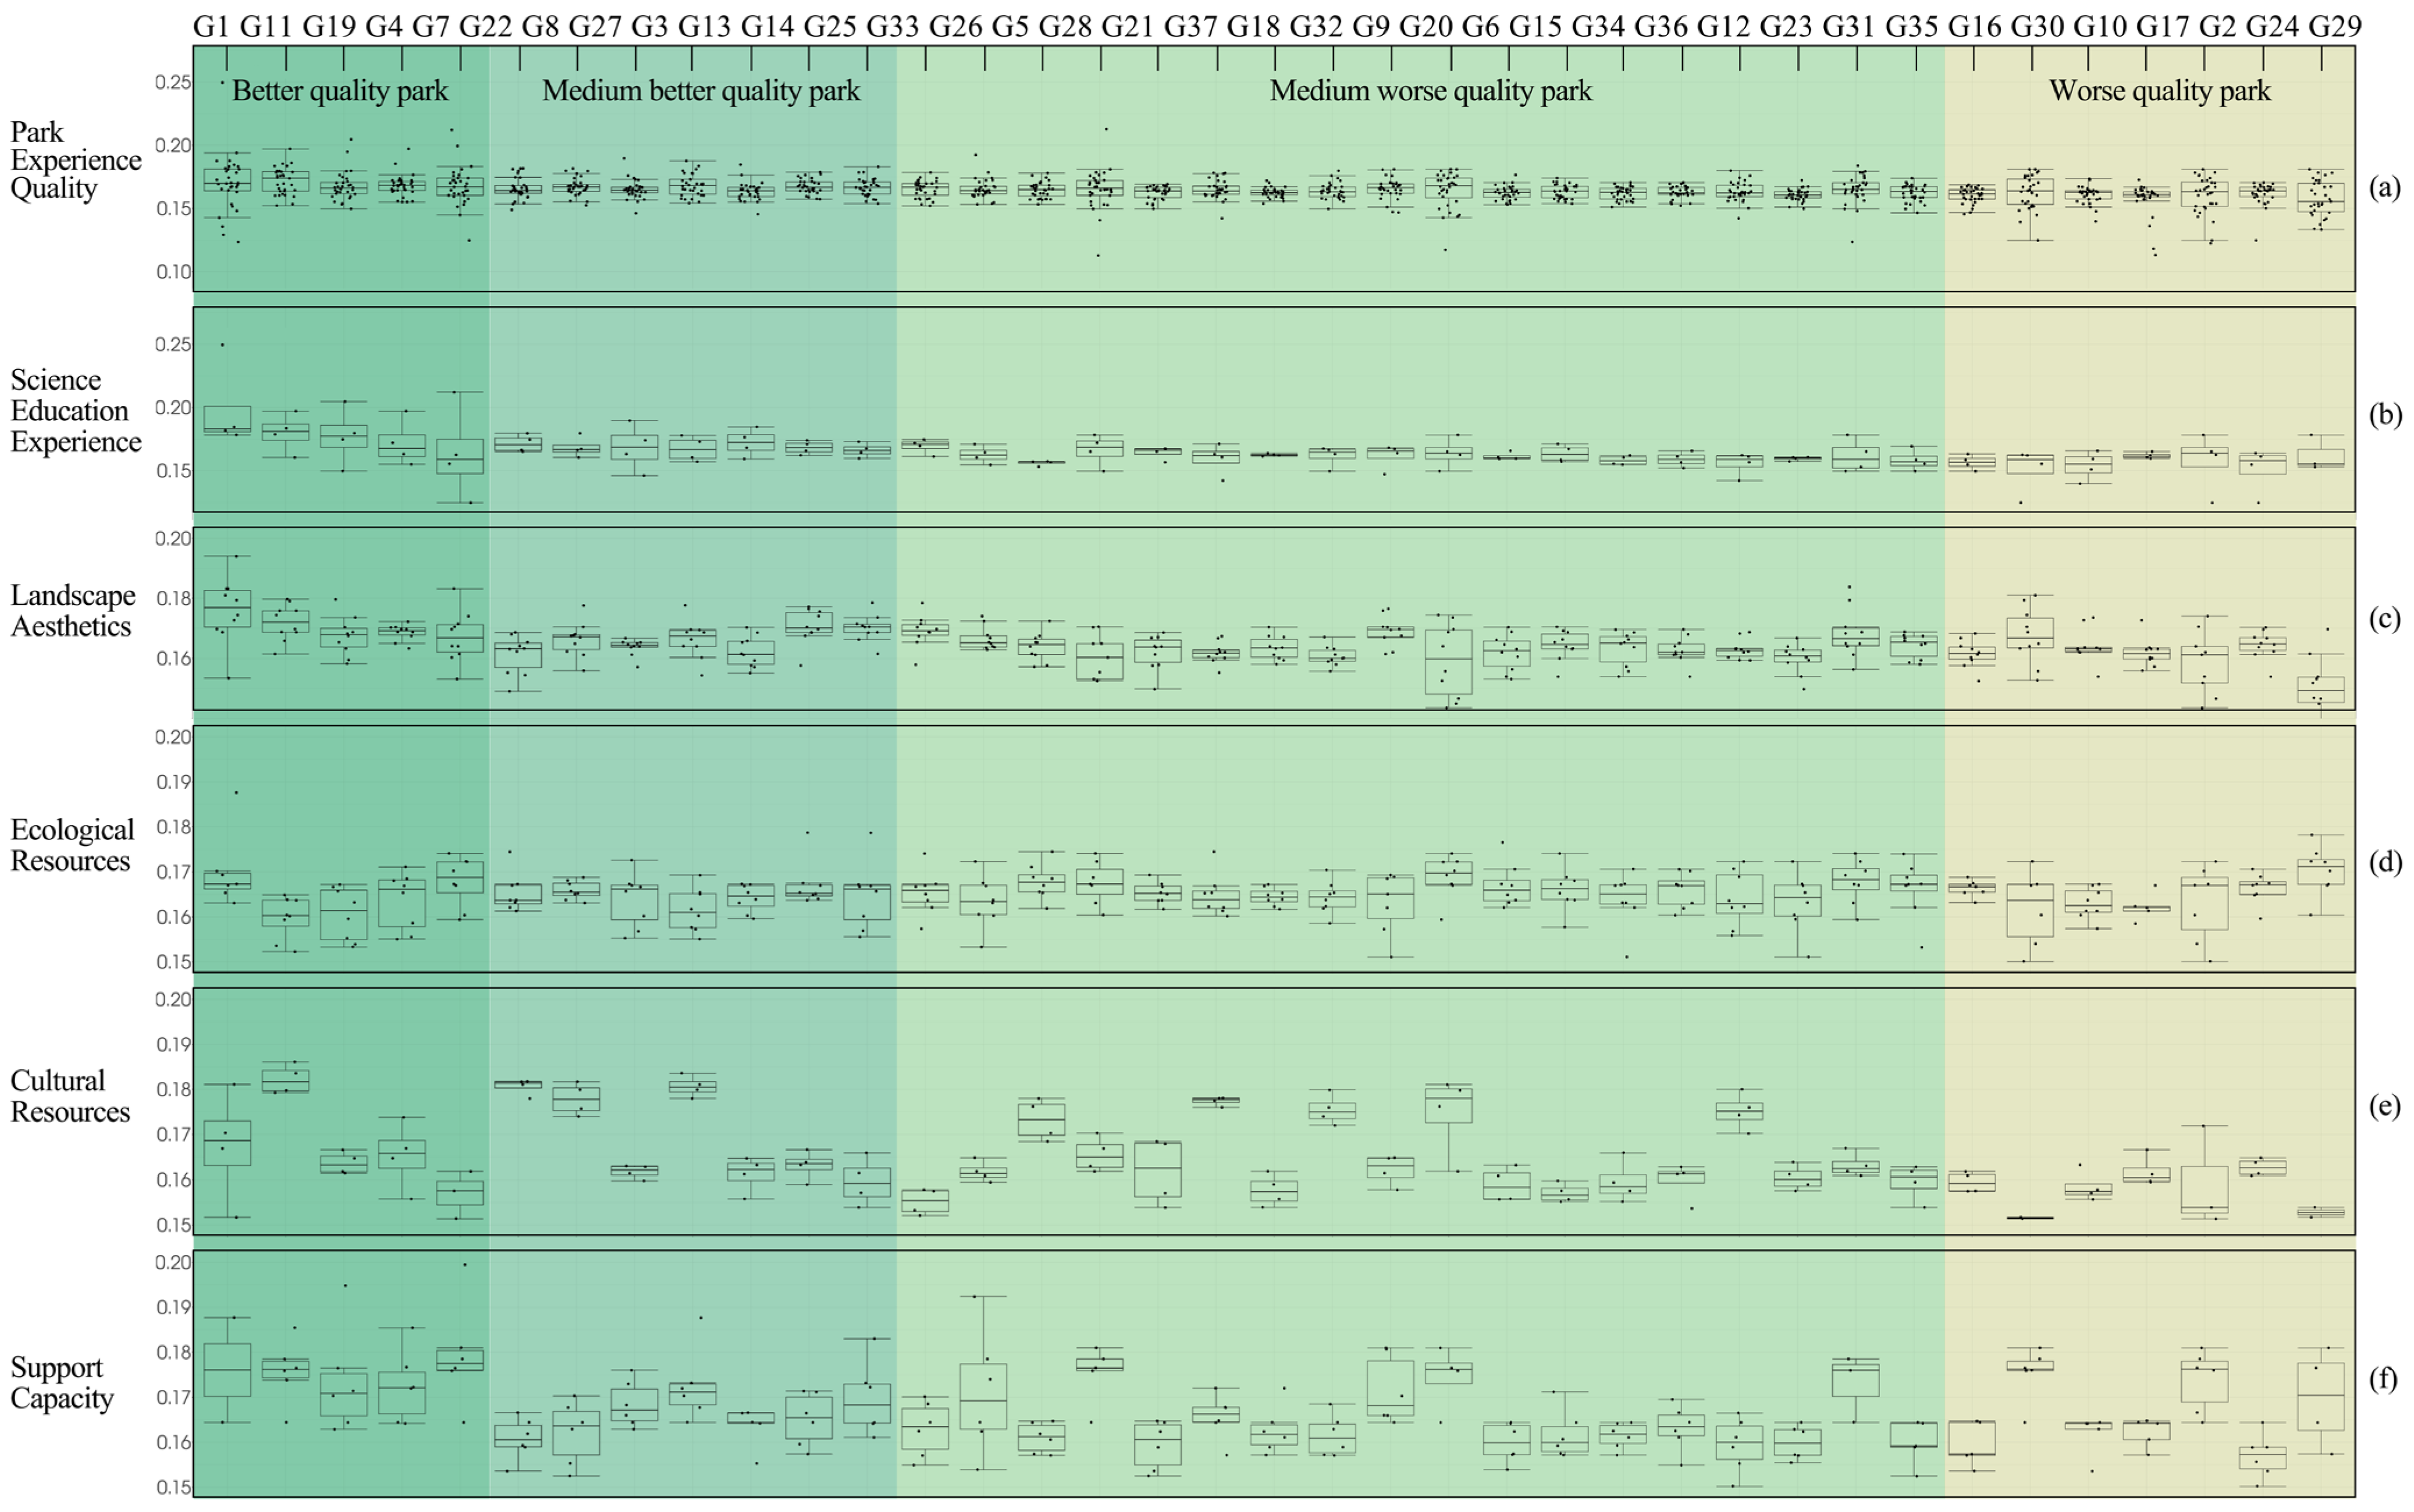
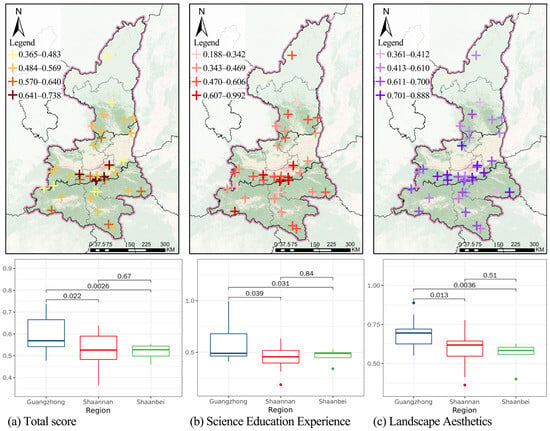
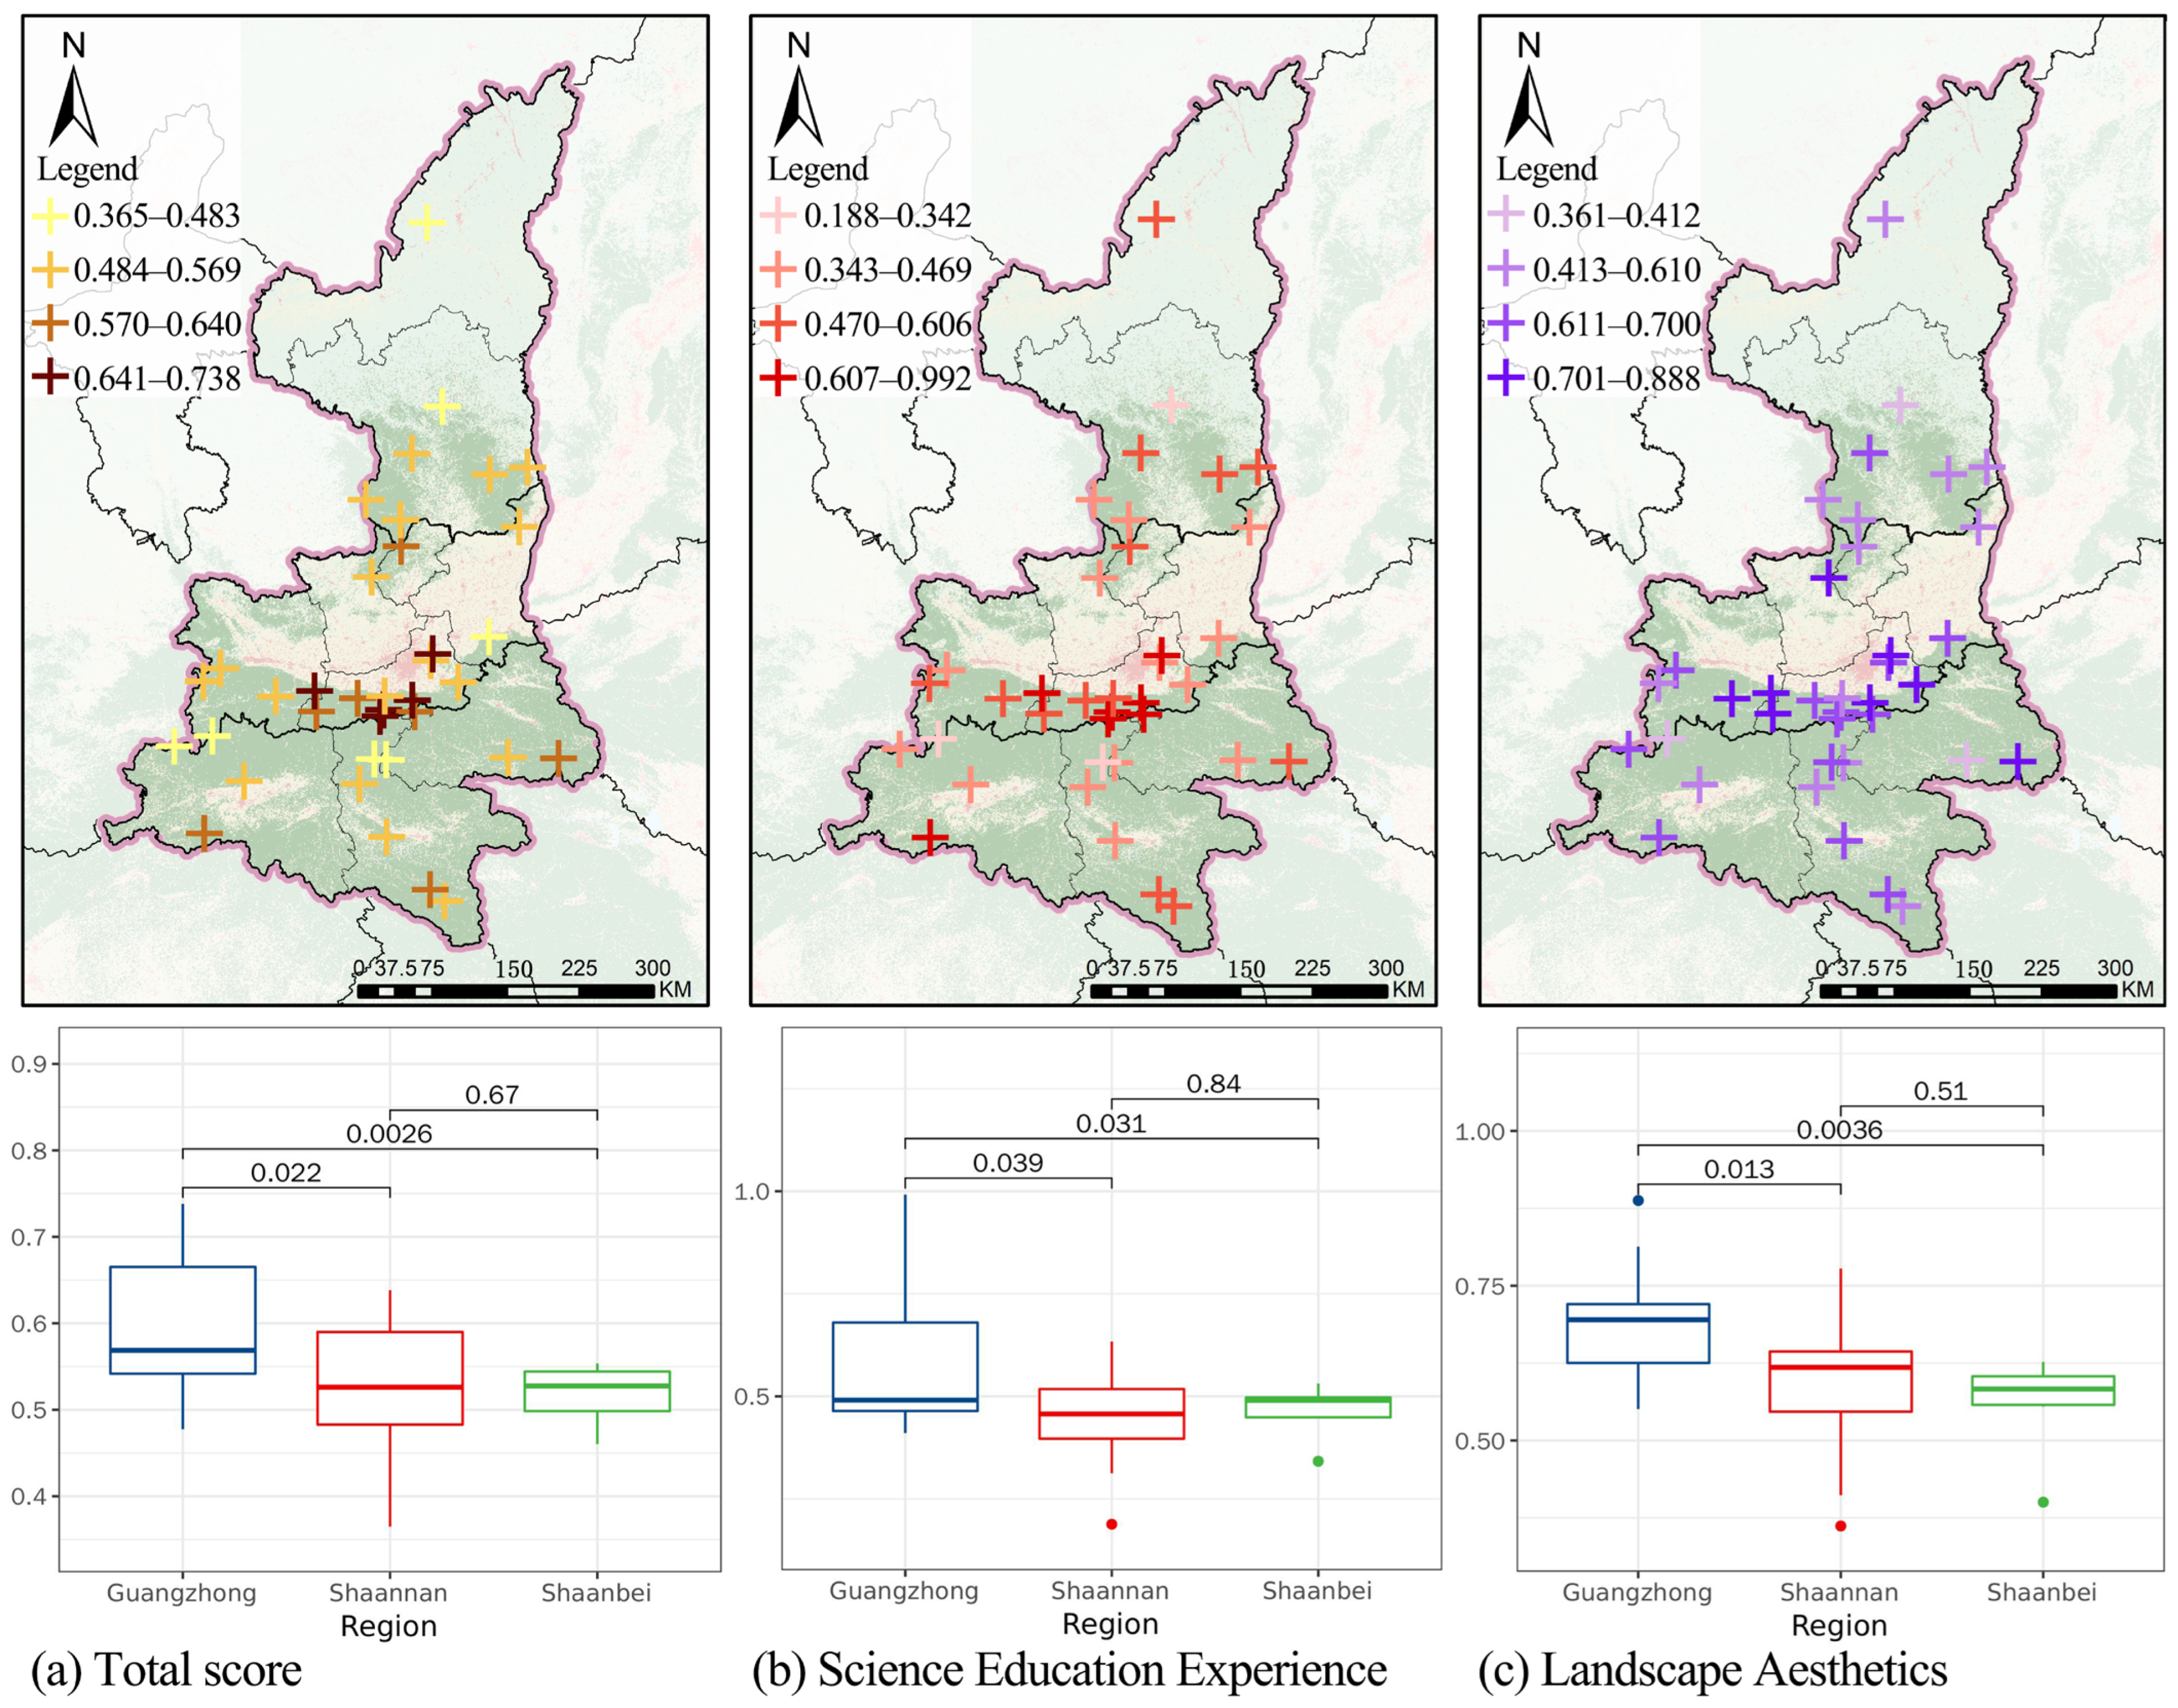
Based on the “Evaluation of forest park experience quality in Shaanxi Province”, a survey was conducted on 37 national nature parks in Shaanxi Province. The survey content was quantitatively evaluated and analyzed, and then the comprehensive scores of the parks were calculated and normalized using the TOPSIS method (Table A2). The natural breakpoints method in ArcGIS was applied to divide the 37 parks into 4 grades based on the total score (Figure 4): the total score between 0.365 and 0.483 is a worse quality park, the total score of 0.484–0.569 is a medium worse quality park, the total score of 0.570–0.640 is a medium better quality, and the total score of 0.641–0.738 is a better quality park. (Figure 5a). It is worth noting that the parks with better quality are all concentrated in the Guanzhong region, the medium-quality parks are widely distributed in the Guanzhong and Shaannan regions, and there are no parks with medium better quality in the Shaanbei region. Figure 4 shows the ecological tourism experience quality of the four types of parks from different dimensions. The dimensions of the parks with better quality are relatively balanced, indicating that these parks have achieved balanced development in terms of scientific popularization experience, landscape esthetics, ecological resources, cultural resources, and supporting conditions, and have a relatively high overall experience quality. In the other three types of parks, the proportion of the score for cultural resources is relatively small. Therefore, these parks must give priority to the scientific protection and reasonable development of important historical and cultural heritage within the park, and focus on exploring and showcasing local folk cultural elements, integrating cultural connotations into landscape creation and recreational activity design, in order to enhance tourists’ cultural experience.
Figure 4.
Scores of different dimensions of the experience quality of the four types of national forest parks: (a) Park Experience Quality; (b) Scores of Science Education Experience; (c) Scores of Landscape Aesthetics; (d) Scores of Ecological Resources; (e) Scores of Cultural Resources; (f) Scores of Support Capacity.
Figure 5.
Overall Experience Score of Forest Parks in Shaanxi Province and Scores of Dimension B1 and B2: (a) Total score; (b) Scores of Science Education Experience; (c) Scores of Landscape Aesthetics.
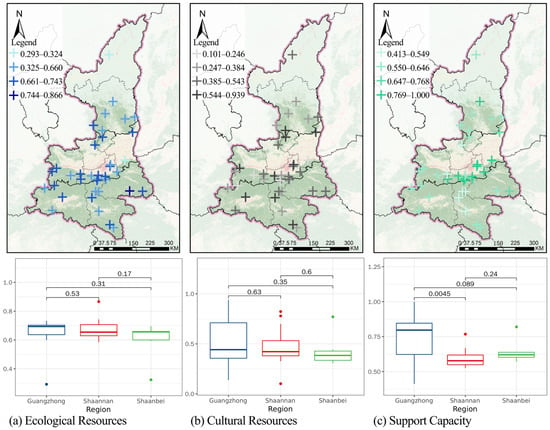
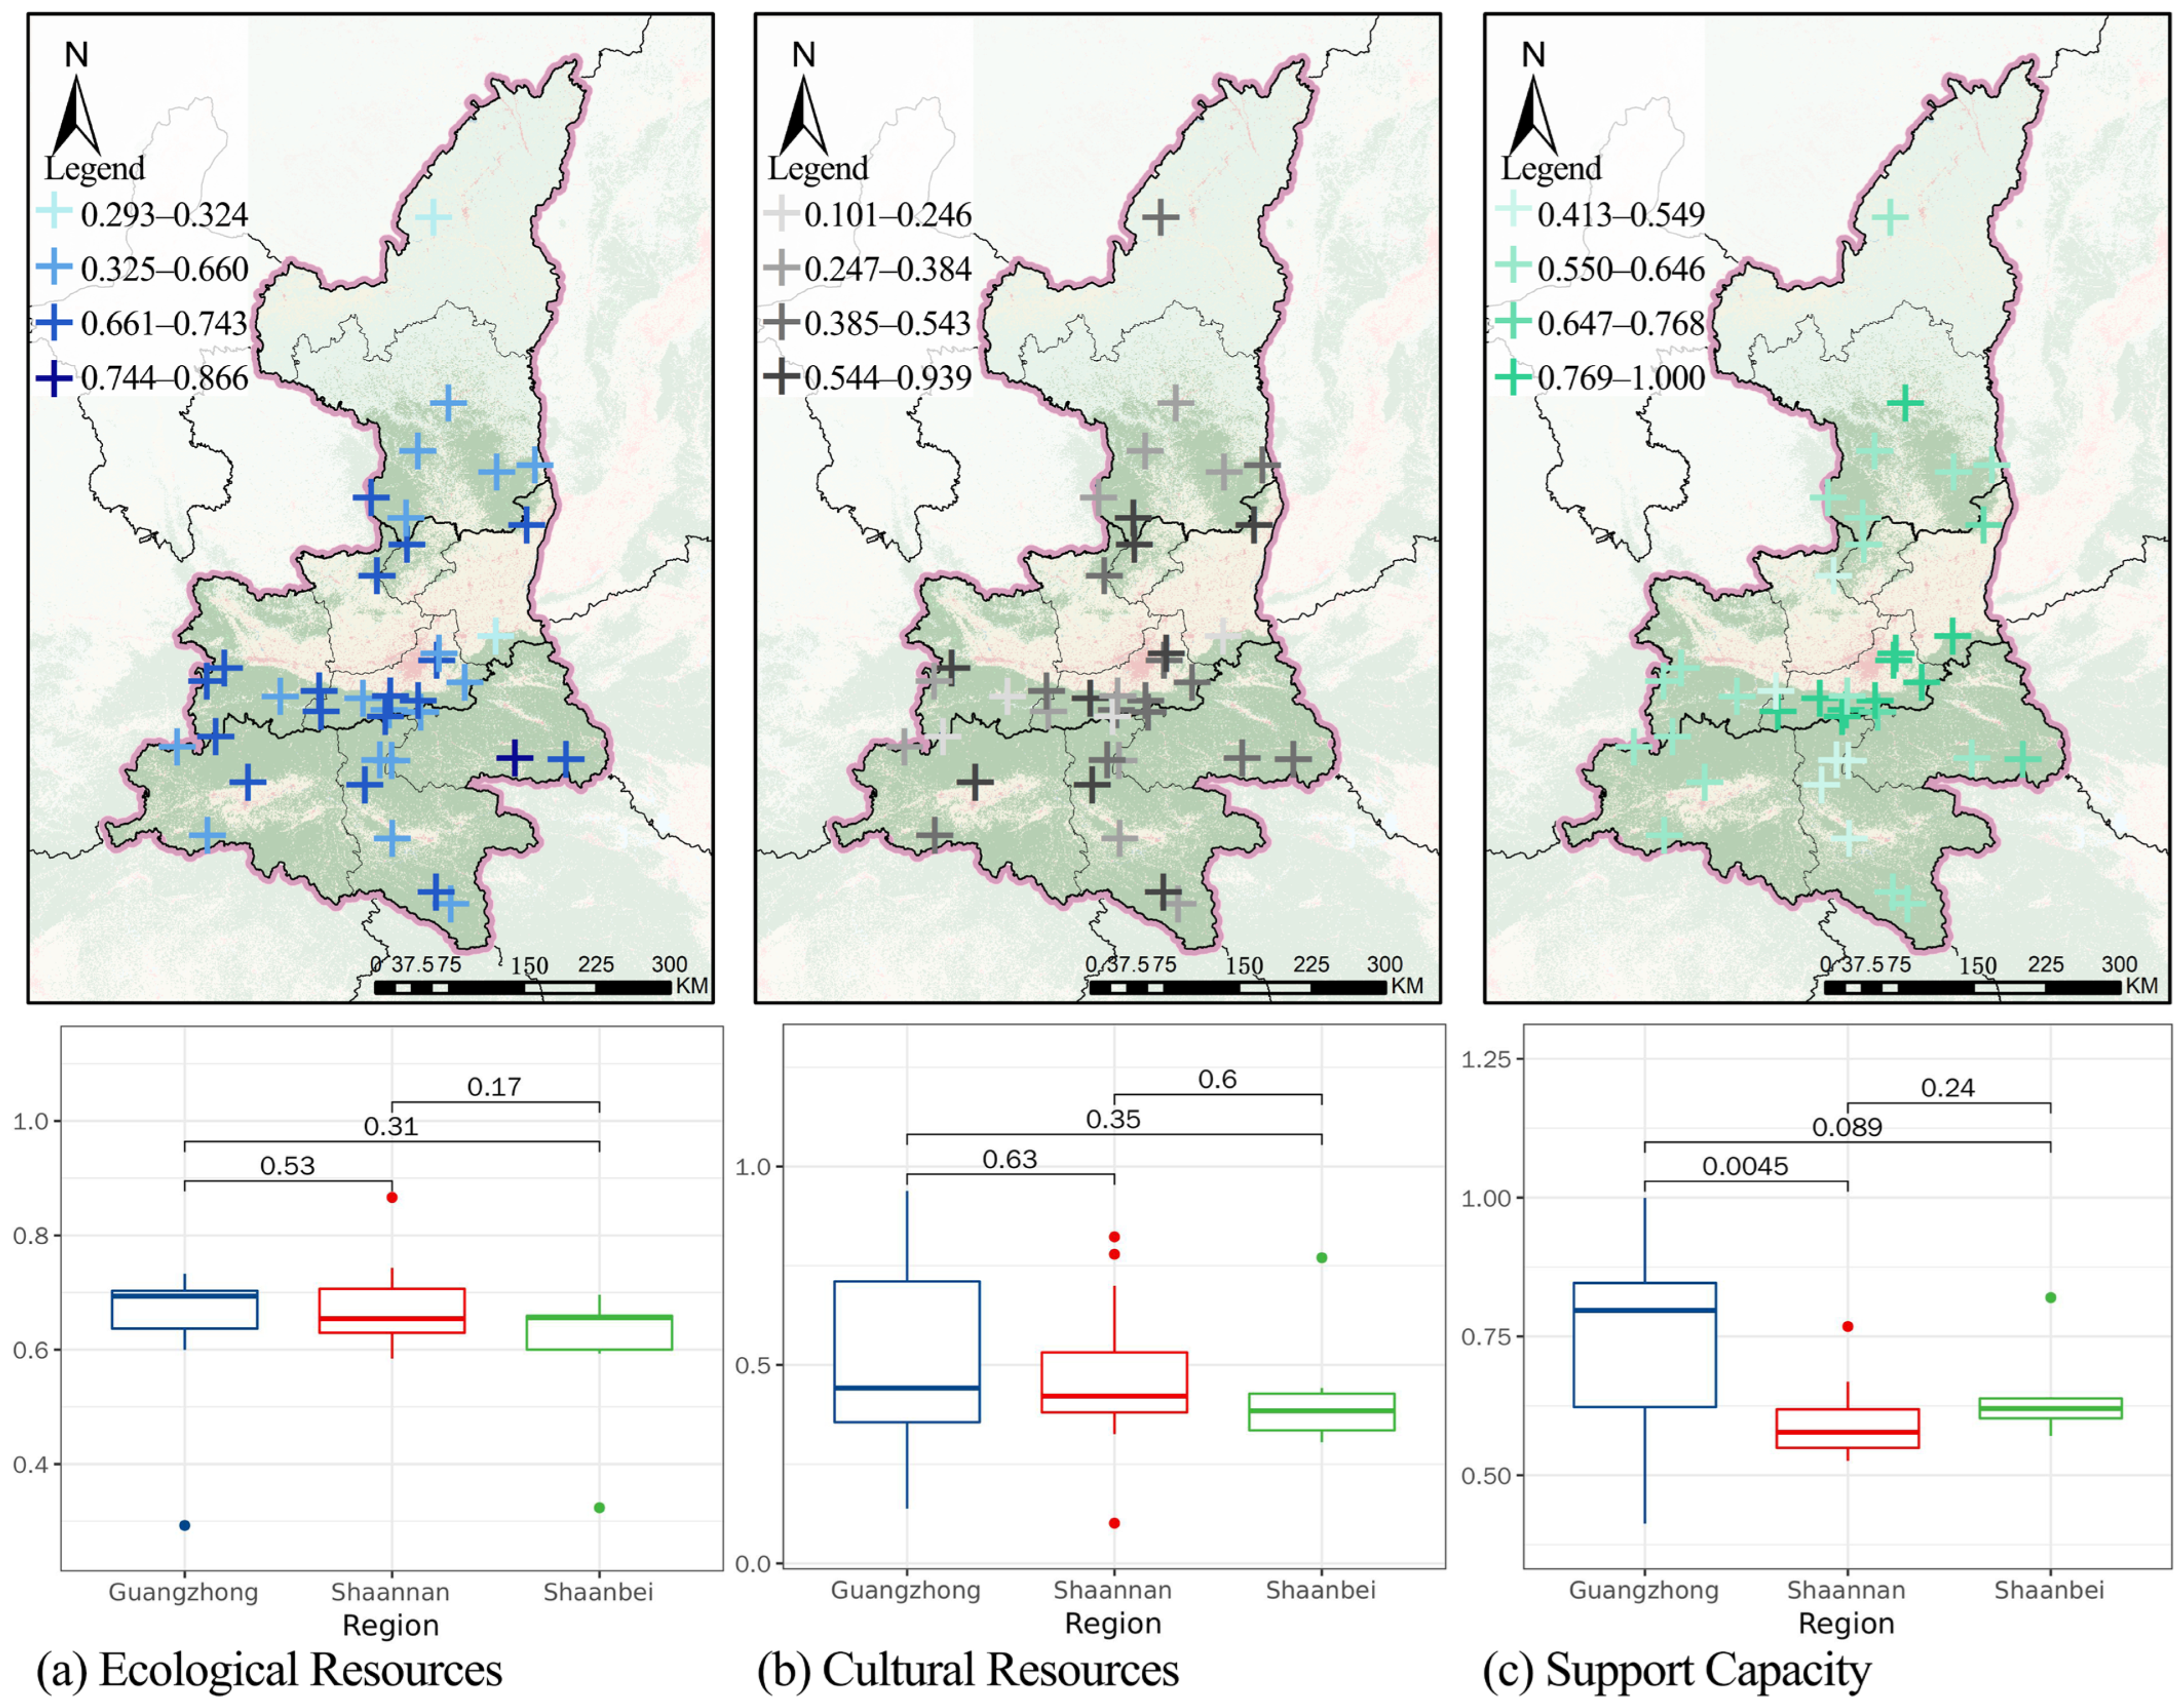
Figure 5 and Figure 6 show the spatial distribution of experience quality across five dimensions. The Guanzhong region overall leads, demonstrating multi-dimensional advantages; the ecological resources dimension in the Shaannan region has the highest mean value of 0.677, but its support capacity mean value is the lowest at 0.597; the comprehensive score in the Shaanbei region is relatively low, and it is generally low in dimensions such as landscape esthetics, cultural resources, and scientific popularization experience. There are significant regional differences in landscape esthetics and supporting conditions, while ecological resources and cultural resources are relatively balanced across different regions. In recent years, the Guanzhong region has demonstrated multi-dimensional advantages centered around Xi’an, which may be attributed to its stronger local customer base and higher travel capabilities. Statistical bulletins indicate that in 2023, the permanent population of Xi’an was 13.08 million, and the number of motor vehicles reached 5.30 million, providing a considerable potential demand base for weekend and short-distance leisure travel. In contrast, Shaannan is mostly located in the Qinba Mountains area, with a good natural ecological background. However, the mountainous terrain and scattered spatial layout make transportation organization, parking and connection, emergency rescue, and service facility construction costs higher, and some areas are strongly constrained by ecological protection, limiting the expansion of development intensity and reception scale, leading to weak support capacity; while Shaanbei has a terrain type mainly composed of loess plateaus, gullies, and sand dunes, and landscape esthetics often rely more on systematic experience design. Its landscape value is more difficult to be effectively perceived, with stronger ecological vulnerability and seasonality, and the tourist peak season is concentrated, resulting in relatively weak service facilities and talent teams.
Figure 6.
Rating of the B3/B4/B5dimensions of the experience quality of forest parks in Shaanxi Province: (a) Scores of Ecological Resources; (b) Scores of Cultural Resources; (c) Scores of Support Capacity.
The 37 parks vary significantly. Table 9 shows the average scores of the four types of parks with different levels of experience quality, as well as the park with the highest and lowest scores in each category. First, the average evaluation scores for parks with better quality, medium better quality, medium worse quality, and worse quality are 0.703, 0.614, 0.539, and 0.454, respectively. The average score of the better quality parks is 1.5 times that of the worst quality parks. Overall, the average experience quality score of the 37 parks is 0.559, which is at a medium quality. The parks with higher experience quality are Taibai Mountain, Lishan Mountain, Taiping Mountain, and Zhongnan Mountain National Forest Park, with scores of 0.738, 0.736, 0.695, and 0.682, respectively. Taibai Mountain has the best quality, located on the northern slope of the Qinling Mountains, being the main peak of the Qinling Mountains with significant altitude differences, forming a typical vertical climate and vegetation band spectra, and nurturing rich biodiversity and typical ecosystems. This provides a solid foundation for ecological resource value and natural education. Taibai Mountain was the first to achieve scenic areaization and brand operation, and formed composite functions such as sightseeing, leisure vacation, and scientific research exploration, which helps to continuously transform the advantages of natural resources into stable tourist experiences and comprehensive evaluation advantages. Among the parks with better quality, Lishan Mountain, Taiping Mountain, Zhongnan Mountain, and Zhuque National Forest Park all belong to Xi’an City. Xi’an’s suburban national forest parks have obvious location and accessibility advantages. For example, Lishan Mountain is located in the Lintong District of Xi’an City, about 25 km away from the city center, with a high concentration of historical culture and tourism resources around it. which is conducive to forming a stable tourist source and high-frequency leisure travel market, thereby improving the overall experience quality. As the provincial capital and regional tourism center of Xi’an, the cultural and tourism development policies and public investment are more concentrated, and the scenic areas are more likely to form comparative advantages in traffic organization, tourist service facilities, management capabilities, and product supply.
Table 9.
Experience Quality Scores of National Forest Parks in Shaanxi Province.
3.3. Obstacle Analysis
3.3.1. Obstacles at the Criteria Layer
The study employed an obstacle analysis model to assess the degree of obstacles in 37 national forest parks and identify the main obstacles. Among them, cultural resource-related factors are the main obstacles restricting the improvement of the ecological tourism quality of forest parks, while the influence of landscape esthetics-related factors and ecological resource-related factors is relatively weak. Specifically, historical cultural heritage and public service facilities are the main obstacles to the best-quality forest parks, indicating that even in parks with relatively high overall quality, there are still significant shortcomings in cultural display and tourism facilities. For the other three types of forest parks, in addition to cultural resources, scientific popularization experience-related factors, and internal transportation conditions have gradually become important obstacles, reflecting the systematic deficiencies in the integration of tourism functions and the deepening of tourism experiences.
3.3.2. Obstacles at the Indicator Layer
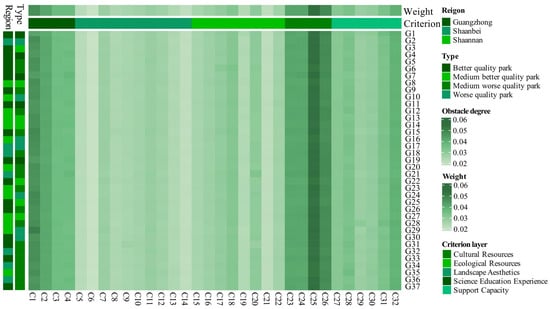
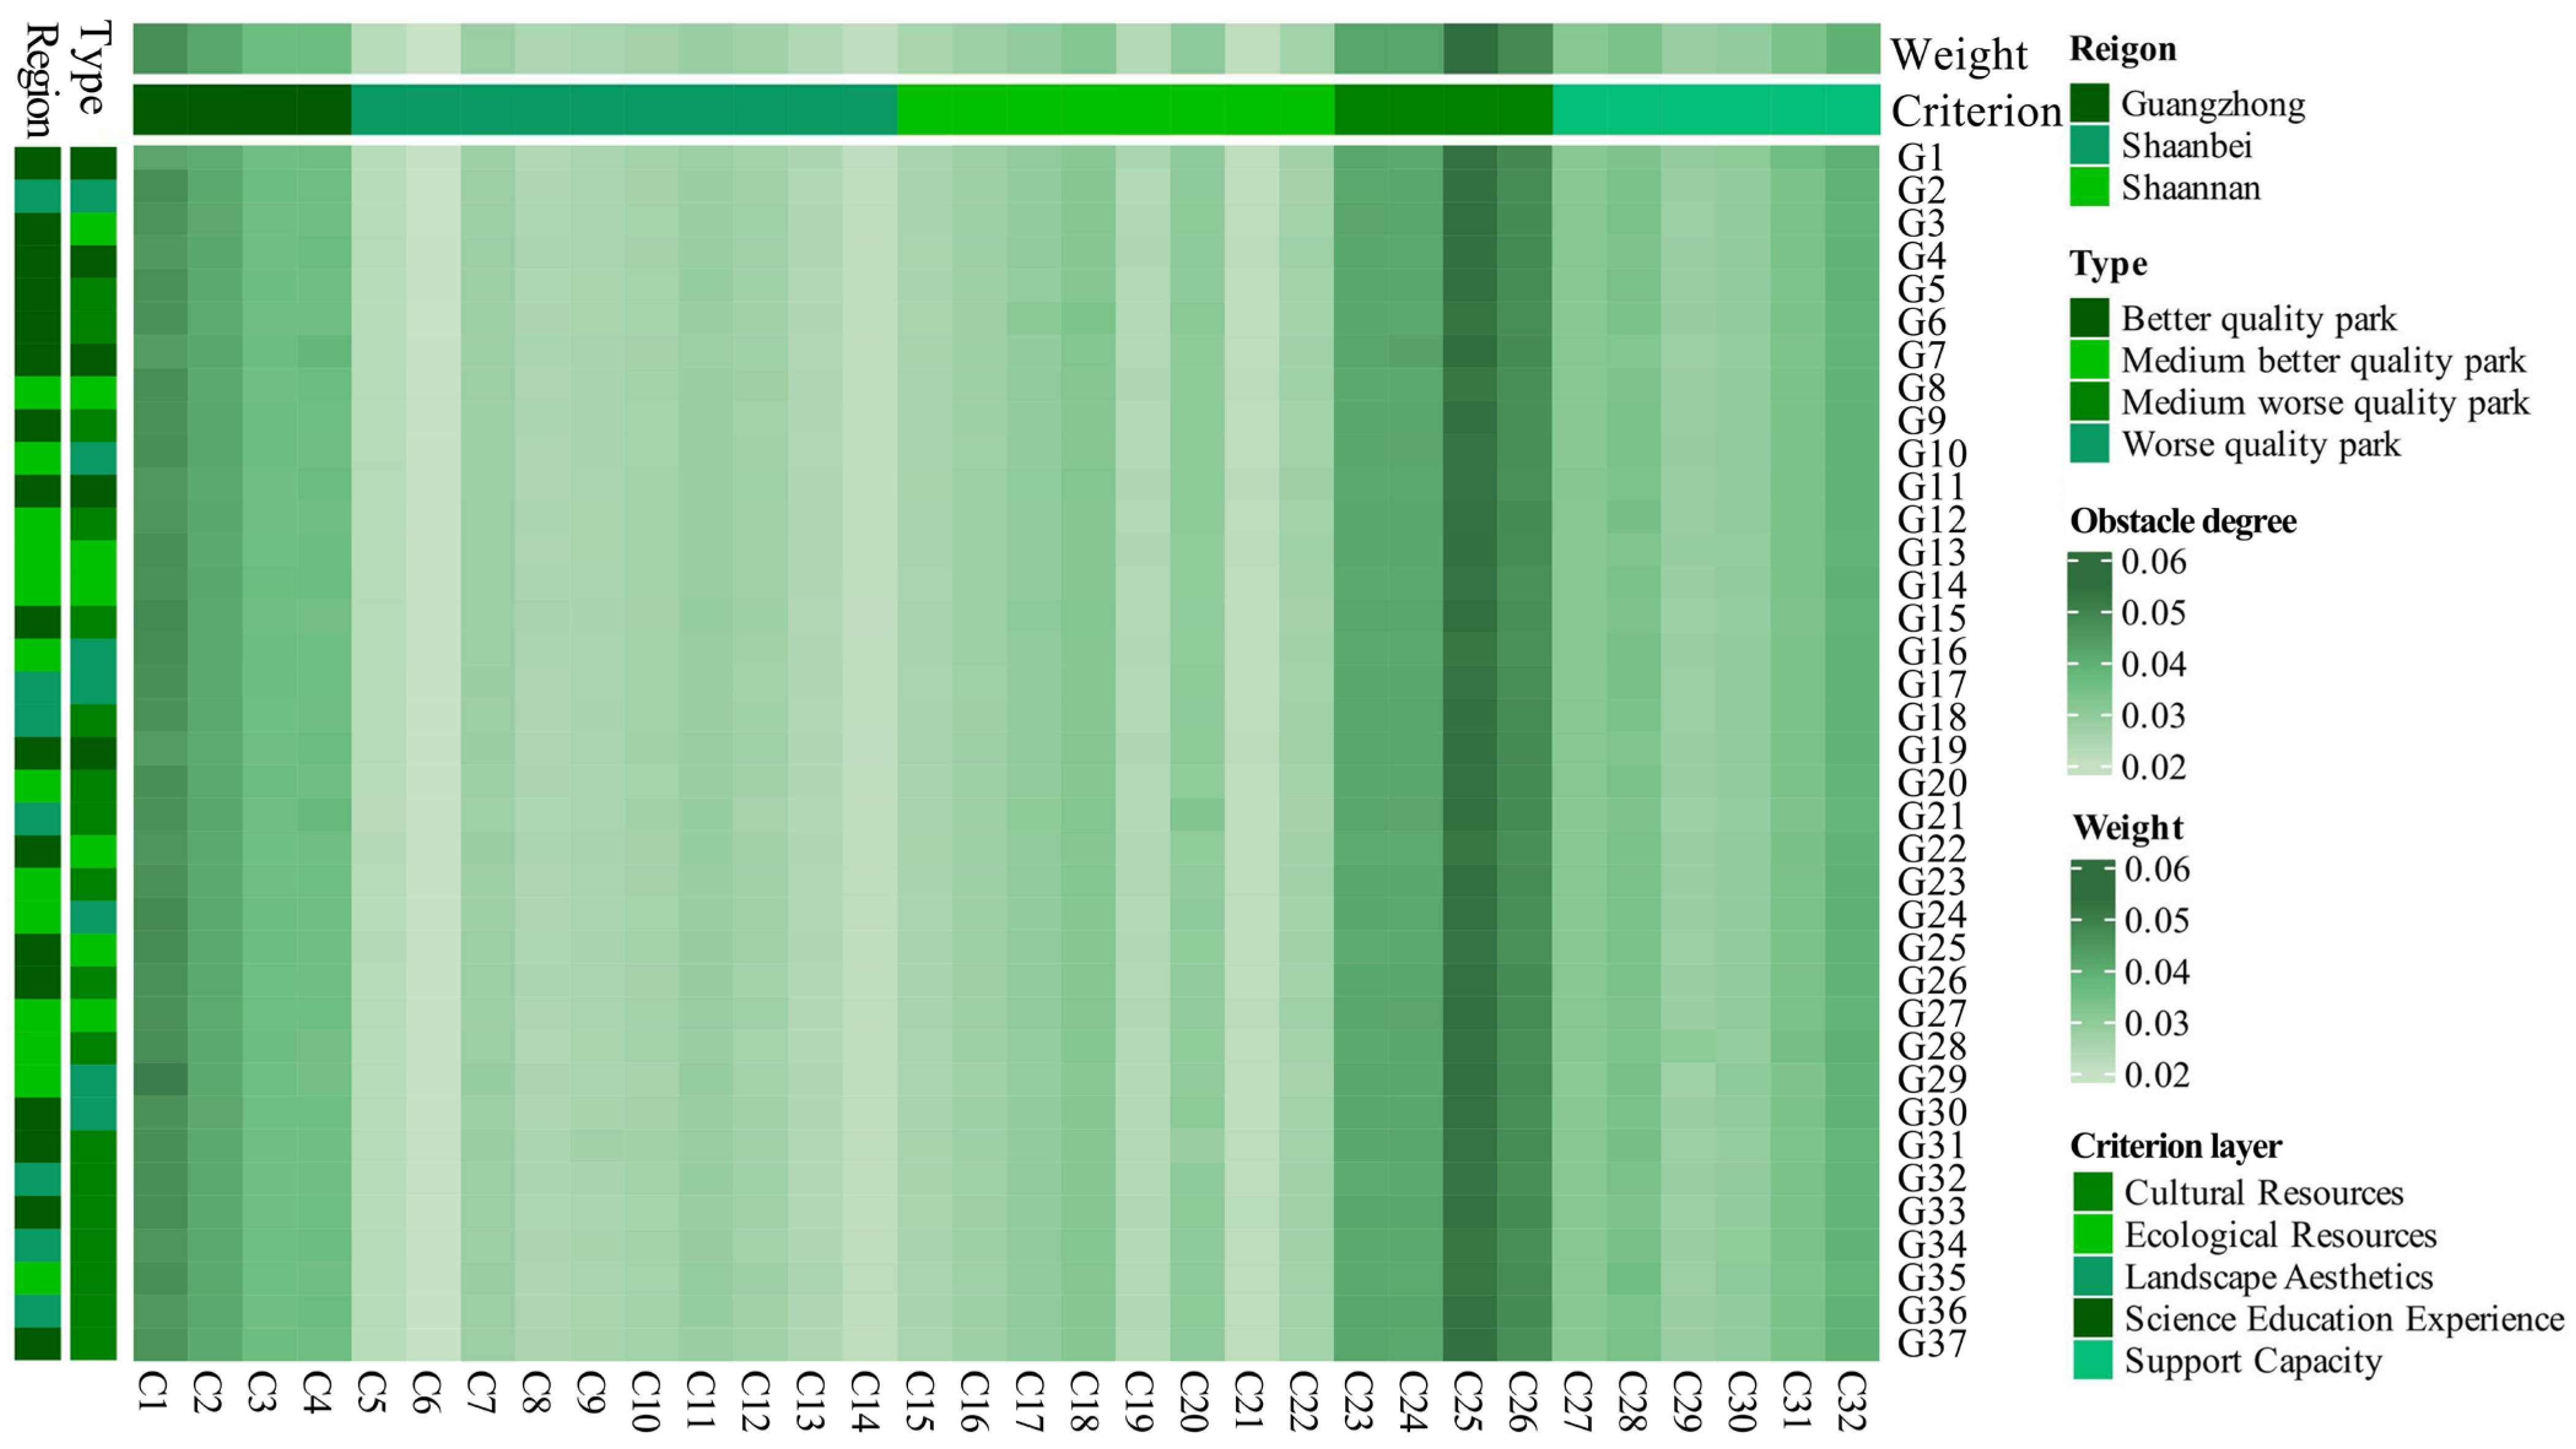
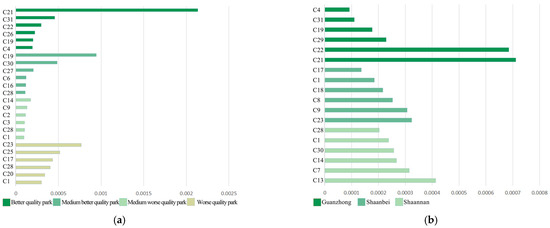
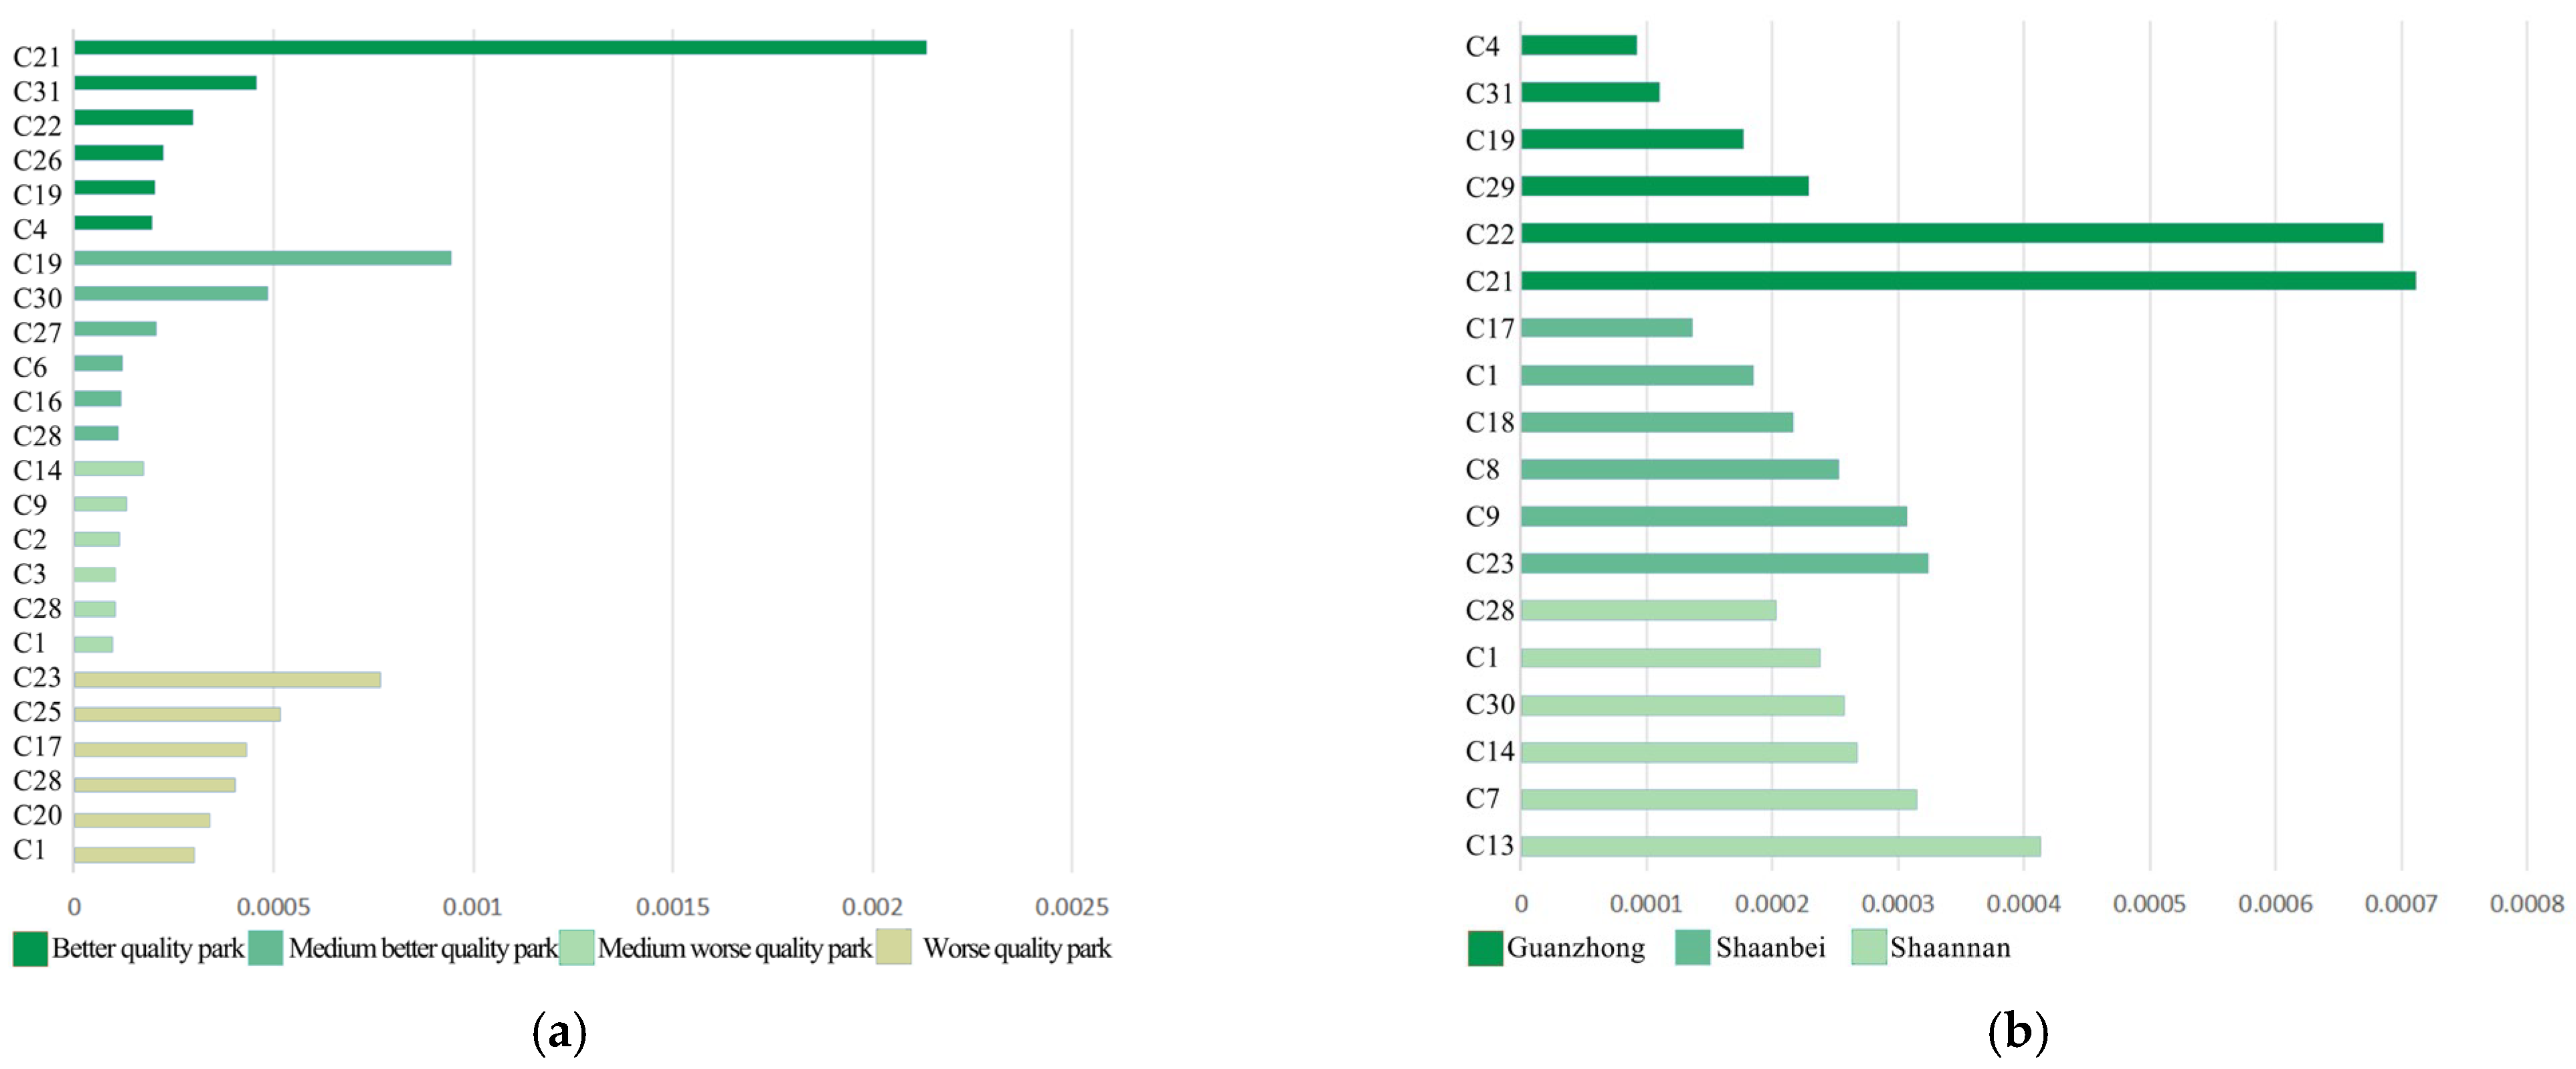
This paper extracts the main obstacle indicators of parks of different quality levels to identify the common key shortcomings of each group; it also extracts the main difference obstacle indicators to measure the characteristic obstacles of a group relative to other groups, to depict the differences between parks of different quality levels. The results show that the main obstacle factors of various types of parks are basically stable: the top five factors of the four types of parks are all composed of historical cultural heritage, folk customs, scientific research, cultural value, and historical value, indicating that the related shortcomings of cultural resource elements and scientific and educational capabilities have significant commonalities. At the same time, scientific research shows a continuous upward trend as the quality level decreases, indicating that the scientific and educational support shortcomings of low-quality parks are more likely to become the key bottleneck restricting the improvement of experience quality. In addition to the core cultural-educational indicators, the supporting guarantee and accessibility indicators show different performances in different types of parks: in the medium and low-quality categories, external transportation conditions rank high, while in the higher-quality groups, municipal facility conditions are more prominent. Based on the analysis of the main difference obstacle indicators, the most characteristic obstacle factor of the lowest quality group is scientific research, followed by external transportation conditions and vegetation coverage, indicating that low-quality parks are more likely to be constrained by environmental quality and accessibility conditions; while in the higher-quality groups, the difference obstacles are more reflected in indicators such as the relative prominence of tourist suitability periods, suggesting that when the core shortcomings are partially improved, seasonal suitability and micro-environment quality may transform into new constraints (Figure 7).
Figure 7.
Heatmap of Obstacles in the Indicator Layer.
From the perspective of different regions, the insufficient exploration of cultural resources endowment and the inadequate supply of educational and scientific functions remain common problems across regions. The main differences in obstacle factors among different regions are mainly reflected in supporting capabilities, accessibility, and environmental indicators. The Guanzhong region mainly shows a relatively prominent situation in municipal facilities conditions and internal transportation conditions; the Shaanbei region’s differences in obstacles mainly concentrate on ecological resource indicators, such as vegetation coverage, species diversity, and scientific research; the Shaanxi South region mainly relies on accessibility and location-related indicators as the main sources of differences, with external transportation conditions, scientific research, and geographical location having certain characteristics (Figure 8).
Figure 8.
Analysis of Disparity Factors: (a) Disparity factors for the top six parks of different types; (b) Disparity factors for the top six parks in different regions.
4. Discussion
4.1. Development Suggestions
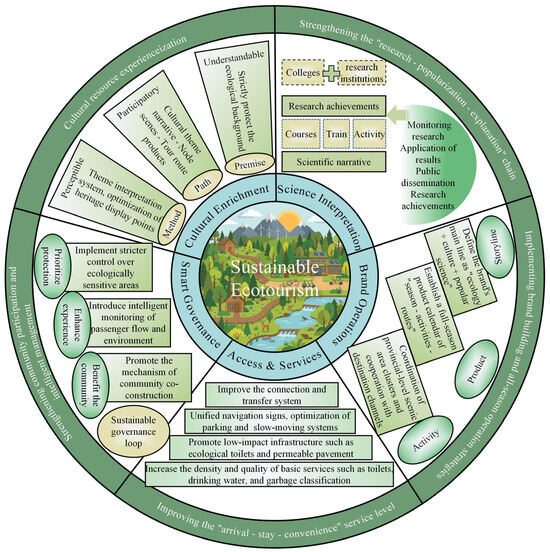
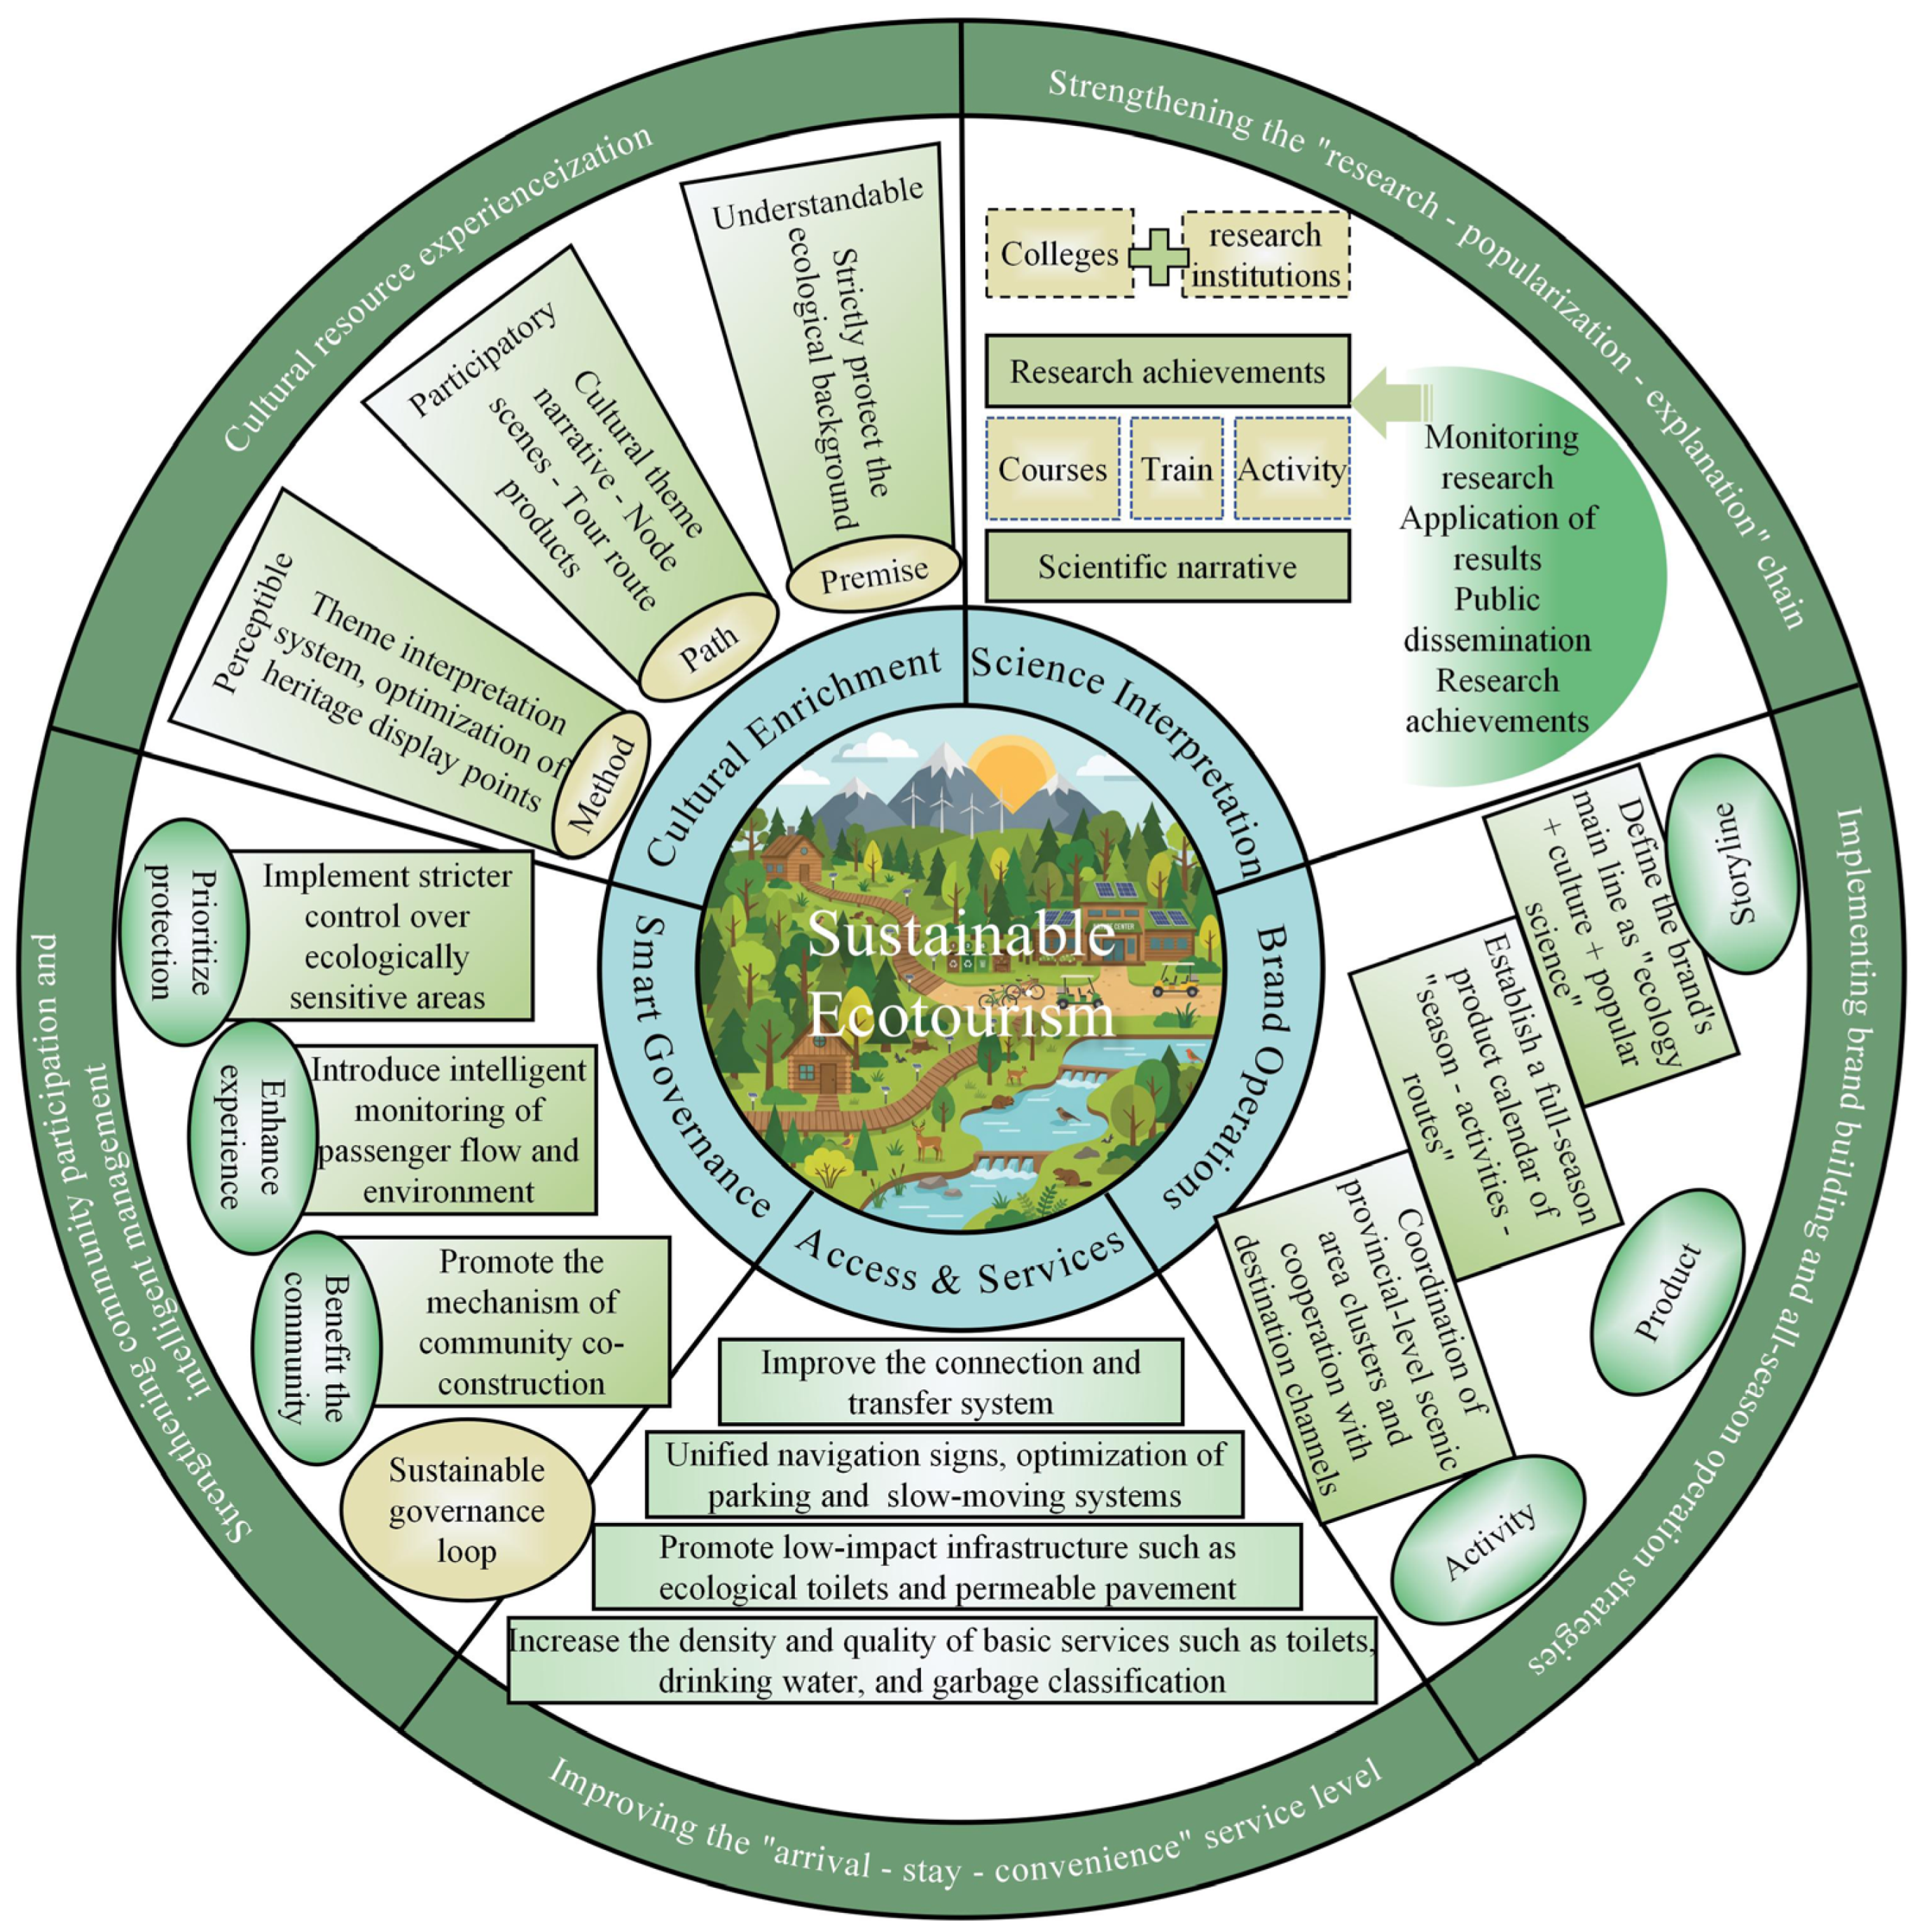
Based on the research results of this study, the following five targeted suggestions are proposed for the improvement of the ecological tourism quality of national forest parks in Shaanxi Province (Figure 9): (1) With “cultural resource experiential development” as the main direction, promote the collaborative growth of ecology and culture [40]. Under the premise of strict protection of the ecological background, systematically carry out cultural resource surveys and classification protection, through thematic explanation systems, heritage display points optimization, and the appropriate embedding of intangible cultural heritage and folk customs experiences, etc., make cultural elements shift from “existence as resources” to “understandable, participatory, and perceptible” low-disturbance experience supply, avoiding the weakening of authenticity and ecological security caused by homogeneous commercial development. (2) Strengthen the “research—popularization—interpretation” chain, systematically improve the quality of scientific and educational experiences. For the prominent obstacles in indicators such as “scientific research, popularization education”, establish a long-term cooperation mechanism with universities and research institutions, and form an integrated platform for monitoring research, application of results, and public dissemination [39]. (3) Implement brand-building and all-season operation strategies. For obstacles in indicators such as popularity and tourism suitability, it is recommended to clearly define the brand’s main line as “ecology + culture + popularization”, establish an all-season product calendar of “season—activity—route”, and through combination of off-season theme activities, microclimate-friendly facilities, and indoor science popularization spaces, reduce the constraints of seasonal fluctuations on the experience quality [47]. (4) Improve the overall service level of “arrival—stay—convenience”. For high-obstacle indicators such as external transportation, municipal facilities, and public service facilities, improve the connection and transfer system, unify navigation and guiding signs, optimize peripheral parking and internal slow traffic organization; simultaneously enhance the density and quality of basic services such as toilets, drinking water, garbage classification and disposal, emergency rescue, barrier-free facilities, and rest nodes, and promote low-impact infrastructure [24]. (5) Implement precise governance by zones and categories, and strengthen the synergy of community participation and intelligent management. Based on the resource endowment and environmental carrying capacity differences in Shaanxi’s southern, central, and northern regions [48], use GIS and other technologies to conduct ecological sensitivity assessment and recreational suitability zoning, form an integrated plan of “function zoning—capacity control—facility layout—route organization” [49], and implement stricter control and time-based reservation and diversion for ecologically sensitive areas. Simultaneously, promote community co-construction and sharing mechanisms, and apply big data and intelligent monitoring for passenger flow regulation, environmental warning, and operation decision-making, achieving a sustainable governance closed loop of “prioritizing protection, enhancing experience, benefiting the community”.
Figure 9.
Strategy Diagram for Enhancing the Quality of National Forest Park Experiences for Sustainable Ecotourism.
4.2. Method Comparison
First, a quantitative comparison of the weight results of FAHP and AHP was conducted. From the overall difference perspective, the difference between the two weight vectors was L1 = 0.635, L2 = 0.140, and the cosine similarity was 0.780. This indicates that there are significant differences in the structure of the indicator importance allocation between the two methods. Further, from the perspective of ranking consistency, the Spearman rank correlation of the two sets of weights was ρ = 0.086 (p = 0.641), and the Kendall rank correlation was τ = 0.084 (p = 0.505). Both were not significant, indicating that the consistency of the indicator importance ranking level between FAHP and AHP is weak. Regarding the source of the differences, the weight differences mainly concentrated on a few indicators: for example, the weights of “attractiveness”, “typicality”, and “naturalness” were significantly higher under AHP, while under FAHP, they were compressed to approximately 0.027–0.028; conversely, FAHP assigned higher weights to indicators related to cultural and educational connotations, indicating that compared to traditional AHP, FAHP is more inclined to suppress the extreme large weights of a few indicators and transfer the weights partially to indicators with stronger interpretive attributes.
Secondly, the study conducted a sensitivity test on the ranking by comparing two sets of weight schemes and single-factor weight perturbations. One approach was to consider AHP and FAHP as two reasonable weight scenarios and compare the ranking results of 37 national forest parks. The results showed that the two methods presented a high degree of consistency at the ranking level: the Spearman correlation was ρ = 0.914 (p < 0.001), the Kendall correlation was τ = 0.752 (p < 0.001), and the 95% confidence interval of the Spearman bootstrap method was [0.809, 0.955]. This indicates that the overall ranking structure has strong robustness under the two sets of weight scenarios. Secondly, by selecting the indicator with the highest weight, “Historical Cultural Heritage”, while maintaining the comparability of the weight system, increasing its weight by 20% and decreasing it by 20% respectively, and recalculating the TOPSIS comprehensive evaluation and ranking. The results show that, compared with the benchmark ranking, the overall consistency is extremely high. In the scenario of increasing the weight by 20%, the Spearman rank correlation is 0.997 (p < 0.001), and Kendall’s τ is 0.970 (p < 0.001), with 25 out of 37 parks (67.6%) maintaining the same ranking. In the scenario of decreasing the weight by 20%, the Spearman is 0.999 (p < 0.001), and Kendall’s τ is 0.985 (p < 0.001), with 31 out of 37 parks (83.8%) maintaining the same ranking. Moreover, in both perturbation scenarios, the parks in the Top-5, Top-10, and Bottom-5 are completely consistent with the benchmark ranking. This indicates that under a significant single-factor perturbation, the overall structure of the ranking remains almost unchanged and has significant robustness.
4.3. Compared with Previous Studies
Compared with previous studies, this research has deepened and expanded in the following three aspects: First, it broke through the limitation of previous studies that focused mainly on a single park or a single dimension, and constructed a multi-dimensional comprehensive index system. It also conducted a horizontal comparison and systematic evaluation of multiple typical national forest parks within Shaanxi Province, providing more regional-integrated management insights [50,51]. Second, it innovatively integrated the FAHP and TOPSIS models, enhancing the scientificity of weight determination and the discrimination of ranking results. Third, it further introduced the obstacle degree model to quantitatively diagnose the key obstacle factors that restrict the improvement of the experience quality of each national forest park, making the research conclusions more management-oriented.
4.4. Limitation and Future Direction
The current research has the following limitations:
(1) Although FAHP can better express the uncertainty of judgments compared to AHP, both still belong to the expert subjective weighting paradigm. The weight results are inevitably influenced by the expert structure, experience preferences, and cognitive framework. The weight ranking consistency of FAHP and AHP in this paper is weak, which also indicates that the weight structure is sensitive to the method selection. Future research can enhance robustness through two paths: first, introduce tourist preference data to calibrate the weights; second, integrate subjective weights with objective weighting to test the dependence of the conclusion on the weighting method.
(2) In this study, the main identified obstacle factors are also the core indicators with higher weights. This is because the calculation of obstacle degree is essentially a composite function of weights and deviation degrees of the indicators. When the differences in deviation degrees of multiple indicators are not significant, the obstacle ranking is more likely to be dominated by high-weight indicators, resulting in a phenomenon where the obstacle Top factors and the weight Top factors are highly overlapping. The results of this study’s obstacle analysis are closer to the weighted governance priority ranking, rather than necessarily being equivalent to the weakest weak points. Therefore, future research should decompose the obstacle output into “weight contribution” and “deviation degree contribution”, and simultaneously output strategic priorities and shortcoming remediation items through equal-weight comparison or importance-performance matrices, so as to more accurately distinguish the obstacle sources driven by weight and performance.
(3) Although the research utilized ecological resource indicators such as air quality, bacterial content in the air, and air negative ion concentration, it has not yet established a clear analytical chain for “how the improvement of experience quality translates into the enhancement of human well-being”. The goal of ecotourism is not only about resource attraction and service provision, but also involves dimensions of well-being such as mental health, cultural identity, educational access, social relationships, and local benefits [52]. Future research could introduce well-being variables at the indicator level and clarify the relationship between ecotourism experiences and human well-being, thereby making the evaluation conclusions more relevant to social policy implications.
(4) The sample in this study is limited to the national parks in Shaanxi Province. This region has specific characteristics in terms of natural geography, historical and cultural resources, management systems, and market structure. Therefore, the conclusions are still subject to verification at the national scale or in other provincial regions. Future research can be conducted on a larger spatial scale to carry out cross-regional comparisons, to test the applicability and stability of the model in different regional scenarios, and to explore the common constraints and different paths of ecological tourism experience quality in different regions.
5. Conclusions
This paper focuses on the “ecological protection—tourist experience—management capability” synergy goal of sustainable ecotourism, and constructs a comprehensive evaluation system consisting of 5 criterion layers (including scientific popularization experience, landscape esthetics, ecological resources, cultural resources, and supporting conditions), and 32 specific indicators. It integrates the use of FAHP and TOPSIS methods to conduct an empirical evaluation and obstacle factor diagnosis of the ecological tourism experience quality of 37 national forest parks in Shaanxi Province. The main research conclusions are as follows: (1) The quality of the forest park experience is first determined by the combined attraction of landscape and ecological base, and is also significantly influenced by governance and support capacity. (2) The 37 national forest parks are divided into four grades. The parks with the best quality are concentrated in the Guanzhong region, the medium-quality parks are mainly distributed in the Guanzhong and Shaannan regions, and there are few high-grade parks in Shaanbei. This reveals the important role of accessibility, market conditions, and infrastructure investment in sustainable experiences. (3) The quality of the experiences varies significantly. The average score for all parks is 0.559, which is at a medium worse quality. The average score of the better quality parks is approximately 1.5 times that of the worse quality parks. (4) The obstacle factors have high commonality. Insufficient protection and display of cultural resources, incomplete public service facilities, and weak scientific education functions are the key bottlenecks restricting the improvement of experience quality; even in the higher-grade parks, cultural display and service facilities may still be the main bottlenecks.
Author Contributions
Conceptualization, X.K. and K.Y.; methodology, X.K.; software, X.K.; validation, K.Y., Y.W. and Z.Z.; formal analysis, L.B.; investigation, K.Y.; resources, Y.W.; data curation, X.K.; writing—original draft preparation, K.Y.; writing—review and editing, L.B.; visualization, Z.Z.; supervision, K.Y.; project administration, Y.W.; funding acquisition, K.Y. All authors have read and agreed to the published version of the manuscript.
Funding
This study is funded by the National Natural Science Foundation of China (52278047), 2025 Project of Shaanxi Province’s Art Science Planning (SYH2025029), General Project of Humanities and Social Sciences Research of the Ministry of Education (25YJC850010), Project of Education Science Planning of Shaanxi Province for the 14th Five-Year Plan (SGH25Y2895).
Data Availability Statement
The original contributions presented in this study are included in the article. Further inquiries can be directed to the corresponding authors.
Acknowledgments
The authors would like to thank the editors and reviewers for their constructive comments on this research. Thanks also to the members of the research team and everyone who helped us during the survey. The authors also gratefully acknowledge the support from the Shaanxi Federation of Social Sciences, where Yu serves as a specially appointed research fellow.
Conflicts of Interest
The authors declare no conflicts of interest.
Abbreviations
The following abbreviations are used in this manuscript:
| FAHP | Fuzzy Analytic Hierarchy Process |
| TOPSIS | Technique for Order Preference by Similarity to Ideal Solution |
Appendix A
Table A1.
Evaluation Standards and Weights for Ecotourism Experience Quality of National Forest Parks in Shaanxi Province.
Table A2.
The names, numbers, locations and rating rankings of 37 national parks in Shaanxi Province.
References
- Wang, F.; Zhao, Z.; Wang, P.; Zhong, L.; Yang, S.; Tang, J.; Hou, S.; Tseng, T.-H.; Cao, Y.; Yang, R. Over 1/4 of China’s terrestrial area significantly contributed both to biodiversity conservation and carbon neutrality, requiring protection. Sci. Total Environ. 2024, 912, 169070. [Google Scholar] [CrossRef] [Scilit]
- Li, S.; Yu, D.; Li, X. Exploring the impacts of ecosystem services on human well-being in Qinghai Province under the framework of the sustainable development goals. J. Environ. Manag. 2023, 345, 118880. [Google Scholar] [CrossRef] [Scilit] [PubMed]
- You, S.; Zheng, Q.; Chen, B.; Xu, Z.; Lin, Y.; Gan, M.; Zhu, C.; Deng, J.; Wang, K. Identifying the spatiotemporal dynamics of forest ecotourism values with remotely sensed images and social media data: A perspective of public preferences. J. Clean. Prod. 2022, 341, 130715. [Google Scholar] [CrossRef] [Scilit]
- Liu, S.; Dong, Y.; Liu, H.; Wang, F.; Yu, L. Review of Valuation of Forest Ecosystem Services and Realization Approaches in China. Land 2023, 12, 1102. [Google Scholar] [CrossRef] [Scilit]
- Li, Y.; Liu, Y.; Solangi, Y.A. Analysis of factors and strategies for the implementation of sustainable tourism in a green economic structure in China. J. Clean. Prod. 2024, 434, 140011. [Google Scholar] [CrossRef] [Scilit]
- Zhang, X.; Zhang, J.; Cao, Z.; Wang, J.; Dolah, J.; Mao, X. Aligning Tourist Demand with Urban Forest Ecosystem Services: Sustainable Development Strategies for Enhancing Urban Tourism Resilience in Kunming. Forests 2025, 16, 1501. [Google Scholar] [CrossRef] [Scilit]
- Gao, Y.; Zhang, T.; Zhang, W.; Meng, H.; Zhang, Z. Research on visual behavior characteristics and cognitive evaluation of different types of forest landscape spaces. Urban For. Urban Green. 2020, 54, 126788. [Google Scholar] [CrossRef] [Scilit]
- Min, J.; Pan, T. Landscape Evaluation of Forest Park Based on Analytic Hierarchy Process. Math. Probl. Eng. 2022, 2022, 7496570. [Google Scholar] [CrossRef] [Scilit]
- Huang, S.; Sheng, D.; Wang, P.; Xiao, J.; Li, Q.; Liu, H. Assessment of ecotourism suitability in Qilian mountain National park. Sci. Rep. 2025, 15, 19529. [Google Scholar] [CrossRef] [Scilit]
- Mei, R.; Han, L. Evaluation System of Rural Sustainable Tourism Land Based on Ecosystem Service Value. Ecol. Chem. Eng. S 2022, 29, 347–369. [Google Scholar] [CrossRef] [Scilit]
- Guo, Y.; Ma, X.; Zhu, Y.; Chen, D.; Zhang, H. Research on Driving Factors of Forest Ecological Security: Evidence from 12 Provincial Administrative Regions in Western China. Sustainability 2023, 15, 5505. [Google Scholar] [CrossRef] [Scilit]
- Lone, B.A.; Jeelani, P.; Ganaie, M.I.; Shah, S.A.; Mayer, I.A. Multicriteria Evaluation of Tourism Potential of Designated Tourist Destinations in Kashmir Himalayas, India. J. Qual. Assur. Hosp. Tour. 2023, 26, 167–184. [Google Scholar] [CrossRef] [Scilit]
- Huang, X.; An, R.; Yu, M.-M.; He, F. Tourism efficiency decomposition and assessment of forest parks in China using dynamic network data envelopment analysis. J. Clean. Prod. 2022, 363, 132405. [Google Scholar] [CrossRef] [Scilit]
- Bai, X.; Ma, W.; Huang, J.; Liang, C.; Zhang, X. Performance assessment and improvement of district cooling system: A case study of enhancing energy efficiency of hospital buildings. Case Stud. Therm. Eng. 2024, 56, 104187. [Google Scholar] [CrossRef] [Scilit]
- Chen, J.; Ming, Q. Study on Characteristics and Differences of Spatial Structure of Forest Parks in Chongqing. IOP Conf. Ser. Earth Environ. Sci. 2021, 829, 012014. [Google Scholar] [CrossRef] [Scilit]
- Fan, H.; Hong, T.; Song, P.; Wu, C.; Hong, W.; Chen, C.; Gao, S. Analysis of Quantitative Characteristics of National Forest Park in China. J. Beihua Univ. (Nat. Sci.) 2008, 9, 4. [Google Scholar]
- Wang, Z.; Meng, Q.; Allam, M.; Hu, D.; Zhang, L.; Menenti, M. Environmental and anthropogenic drivers of surface urban heat island intensity: A case-study in the Yangtze River Delta, China. Ecol. Indic. 2021, 128, 107845. [Google Scholar] [CrossRef] [Scilit]
- Piao, H.; Zhang, J.; Chen, K.; Lyu, J. How Do Investment Structure and Business Category Affect the Ecological Efficiency of Forest Parks?—A Case Study from Liaoning Province, China. Forests 2023, 14, 2423. [Google Scholar] [CrossRef] [Scilit]
- Liao, B.; Chen, Y.; Dai, S. A Critique on the Ecological Tourism of Simingshan National Forest Park in Zhejiang. J. Ningbo Univ. (Lib. Arts Ed.) 2015, 28, 7. [Google Scholar]
- Hong, X.; Zhang, W.; Chen, K.; Lin, Z.; Zhu, L.; Lan, S. Soundscape Evaluation of Suburban Forest Park based on F-AHP. For. Inventory Plan. 2016, 41, 58–63+71. [Google Scholar]
- Kang, N. Assessing Tourism Carrying Capacity Based on Visitors’ Experience Utility: A Case Study of Xian-Ren-Tai National Forest Park, China. Forests 2023, 14, 1694. [Google Scholar] [CrossRef] [Scilit]
- Zhao, M.; Dong, S.; Xia, B.; Li, Y.; Li, Z.; Chen, W. Effective and Sustainable Managed Protected Areas: Evaluation and Driving Factors of Eco-Efficiency of China’s Forest Parks. Forests 2022, 13, 1406. [Google Scholar] [CrossRef] [Scilit]
- Han, X.; Sun, T.; Cao, T. Study on landscape quality assessment of urban forest parks: Take Nanjing Zijinshan National forest Park as an example. Ecol. Indic. 2021, 120, 106902. [Google Scholar] [CrossRef] [Scilit]
- Zhao, J.; Abdul Aziz, F.; Song, M.; Zhang, H.; Ujang, N.; Xiao, Y.; Cheng, Z. Evaluating Visitor Usage and Safety Perception Experiences in National Forest Parks. Land 2024, 13, 1341. [Google Scholar] [CrossRef] [Scilit]
- Zhang, H.; Wang, Z.; Bi, Y.; Nie, Y.; Zhao, J.; Huang, B. Quality Evaluation of Ecological Experience Resources and Optimization of Resource Management Policies in National Parks: Taking the Laohegou Area of Giant Panda National Park as an Example. Land 2025, 14, 2414. [Google Scholar] [CrossRef] [Scilit]
- Srdjevic, B.; Lakicevic, M.; Srdjevic, Z. Fuzzy AHP Assessment of Urban Parks Quality and Importance in Novi Sad City, Serbia. Forests 2023, 14, 1227. [Google Scholar] [CrossRef] [Scilit]
- Cao, S. Development Potential Evaluation for Land Resources of Forest Tourism Based on Fuzzy AHP Method. Math. Probl. Eng. 2022, 2022, 4545146. [Google Scholar] [CrossRef] [Scilit]
- Mathew, M.; Chakrabortty, R.K.; Ryan, M.J. A novel approach integrating AHP and TOPSIS under spherical fuzzy sets for advanced manufacturing system selection. Eng. Appl. Artif. Intell. 2020, 96, 103988. [Google Scholar] [CrossRef] [Scilit]
- Liu, X.; Min, Q.; Jiao, W. Revealing Changes in the Management Capacity of the Three-River-Source National Park, China: An Application of the Best Practice-Based Evaluation Method. Land 2022, 11, 1565. [Google Scholar] [CrossRef] [Scilit]
- He, X.; Cai, C.; Tang, J.; Shi, J.; Yang, R. Analysis of coupling coordination and obstacle factors between tourism development and ecosystem services value: A case study of the Yellow River Basin, China. Ecol. Indic. 2023, 157, 111234. [Google Scholar] [CrossRef] [Scilit]
- Jing, W.; Zhang, W.; Luo, P.; Wu, L.; Wang, L.; Yu, K. Assessment of Synergistic Development Potential between Tourism and Rural Restructuring Using a Coupling Analysis: A Case Study of Southern Shaanxi, China. Land 2022, 11, 1352. [Google Scholar] [CrossRef] [Scilit]
- Yi, K.; Zhu, J.; Zhang, Q.; Li, F.; Li, X. Push and pull in the sustainable development of ecological landscape and ecological resources: A dual perceptions of tourists and service staff. Sustain. Dev. 2023, 31, 2402–2415. [Google Scholar] [CrossRef] [Scilit]
- Zheng, X.; Yang, Z. Coordination or contradiction? The spatiotemporal relationship between ecological environment and tourism development within the tourism ecological security framework in China. Ecol. Indic. 2023, 157, 111247. [Google Scholar] [CrossRef] [Scilit]
- Zhang, X.; Zhong, L.; Yu, H.; Wang, L.-E. Sustainability Assessment for the Protected Area Tourism System from the Perspective of Ecological-Economic-Social Coordinated Development. Forests 2023, 14, 890. [Google Scholar] [CrossRef] [Scilit]
- Zhang, J.; Jin, L.; Pan, X.; Wang, Y. Pro-Environmental Behavior of Tourists in Ecotourism Scenic Spots: The Promoting Role of Tourist Experience Quality in Place Attachment. Sustainability 2024, 16, 8984. [Google Scholar] [CrossRef] [Scilit]
- Pahlavan, P.; Hosseini, S.M.; Hosseini, S. Evaluation of visual quality of ecological services of forest parks (Case study: Chaldareh Forest Park). J. Environ. Stud. 2024, 49, 457–470. [Google Scholar]
- Wen, Y.; Luo, F.; Li, H. The Impact of Aesthetic Expectations and Aesthetic Experiential Qualities on Tourist Satisfaction: A Case Study of the Zhangjiajie National Forest Park. Forests 2024, 15, 378. [Google Scholar] [CrossRef] [Scilit]
- Qiu, Y.; Pan, H.; Kalantari, Z.; Giusti, M.; Che, S. The natural focus: Combining deep learning and eye-tracking to understand public perceptions of urban ecosystem aesthetics. Ecol. Indic. 2023, 156, 111181. [Google Scholar] [CrossRef] [Scilit]
- Lu, J.; Chen, H. Dynamic Evaluation and Forecasting Analysis of Touristic Ecological Carrying Capacity of Forest Parks in China. Forests 2023, 15, 38. [Google Scholar] [CrossRef] [Scilit]
- Cheng, Y.; Zhao, B.; Peng, S.; Li, K.; Yin, Y.; Zhang, J. Effects of cultural landscape service features in national forest parks on visitors’ sentiments: A nationwide social media-based analysis in China. Ecosyst. Serv. 2024, 67, 101614. [Google Scholar] [CrossRef] [Scilit]
- Li, J.; He, J.; Lu, P.; Ran, X.; Yi, J. Evaluation of Geosites in Changbaishan Global Geopark based on Fuzzy AHP and TOPSIS. Geoheritage 2025, 17, 43. [Google Scholar] [CrossRef] [Scilit]
- Chen, W.; Shen, Y.; Wang, Y. Evaluation of economic transformation and upgrading of resource-based cities in Shaanxi province based on an improved TOPSIS method. Sustain. Cities Soc. 2018, 37, 232–240. [Google Scholar] [CrossRef] [Scilit]
- Behzadian, M.; Khanmohammadi Otaghsara, S.; Yazdani, M.; Ignatius, J. A state-of the-art survey of TOPSIS applications. Expert Syst. Appl. 2012, 39, 13051–13069. [Google Scholar] [CrossRef] [Scilit]
- Azadeh, A.; Kor, H.; Hatefi, S.-M. A hybrid genetic algorithm-TOPSIS-computer simulation approach for optimum operator assignment in cellular manufacturing systems. J. Chin. Inst. Eng. 2011, 34, 57–74. [Google Scholar] [CrossRef] [Scilit]
- Van Lamsweerde, A.; Letier, E. Handling obstacles in goal-oriented requirements engineering. IEEE Trans. Softw. Eng. 2000, 26, 978–1005. [Google Scholar] [CrossRef] [Scilit]
- Lutz, R.; Patterson-Hine, A.; Nelson, S.; Frost, C.R.; Tal, D.; Harris, R. Using obstacle analysis to identify contingency requirements on an unpiloted aerial vehicle. Requir. Eng. 2006, 12, 41–54. [Google Scholar] [CrossRef] [Scilit]
- Wang, L.; Damdinsuren, M.; Qin, Y.; Gonchigsumlaa, G.; Zandan, Y.; Zhang, Z. Forest Wellness Tourism Development Strategies Using SWOT, QSPM, and AHP: A Case Study of Chongqing Tea Mountain and Bamboo Forest in China. Sustainability 2024, 16, 3609. [Google Scholar] [CrossRef] [Scilit]
- He, J.; Zhu, Y.; Zhong, W.; Yuan, Q.; Zhang, R.; Li, J.; Yao, S.; Zhong, T.; Li, Z. Ecological Sensitivity Zoning and Functional Optimization of the Longyuwan National Forest Park. Forests 2025, 16, 1565. [Google Scholar] [CrossRef] [Scilit]
- Lin, Y.-C.; Liu, W.-Y. Assessment of the management performance of a National Urban Forest Park in Taiwan. Urban For. Urban Green. 2021, 60, 127056. [Google Scholar] [CrossRef] [Scilit]
- Meng, L.; Yan, F.; Fang, Q.; Si, W. Research on the Educational Tourism Development of Intangible Cultural Heritage: Suitability, Spatial Pattern, and Obstacle Factor. Sustainability 2024, 16, 4647. [Google Scholar] [CrossRef] [Scilit]
- Yang, L.; Hao, Y.; Wang, B.; Li, X.; Gao, W. Evaluation of the water resources carrying capacity in Shaanxi Province based on DPSIRM–TOPSIS analysis. Ecol. Indic. 2025, 173, 113369. [Google Scholar] [CrossRef] [Scilit]
- Korcz, N. Nature Deficit in the Context of Forests and Human Well-Being: A Systematic Review. Forests 2025, 16, 1537. [Google Scholar] [CrossRef] [Scilit]
- GB/T 50298-2018; Standard for Scenic and Historic Area General Planning. China Architecture & Building Press: Beijing, China, 2018.
- GB/T 18972-2017; Classification, Investigation and Evaluation of Tourism Resources. China Standard Quality Inspection Press: Beijing, China, 2017.
- GB/T 18005-1999; China Forest Park Landscape Resourcesgrade Evaluation. China Standard Publishing House: Beijing, China, 1999.
- SL/300-2013; The Evaluation Standard of Water Park. China Water & Electric Press: Beijing, China, 2013.
- GB 3095—2012; Ambient Air Qualty Standrds. China Environmental Science Press: Beijing, China, 2012.

Disclaimer/Publisher’s Note: The statements, opinions and data contained in all publications are solely those of the individual author(s) and contributor(s) and not of MDPI and/or the editor(s). MDPI and/or the editor(s) disclaim responsibility for any injury to people or property resulting from any ideas, methods, instructions or products referred to in the content. |
© 2026 by the authors. Licensee MDPI, Basel, Switzerland. This article is an open access article distributed under the terms and conditions of the Creative Commons Attribution (CC BY) license.