


Abstract
Lightning is a major natural ignition source of wildfires across forest, grassland, and cropland ecosystems. Accurate prediction of lightning-ignited fire occurrence remains challenging due to uncertainties in spatiotemporal alignment caused by vegetation-dependent smoldering delays and the difficulty of representing heterogeneous fuel conditions in mixed-vegetation regions. This study proposes a semi-automated lightning–fire alignment framework that integrates land cover information and historical fire records to improve spatiotemporal matching across different vegetation types and to reduce misclassification from human-induced fires in agricultural areas. To better characterize fuel conditions, two feature-level vegetation fusion parameters—total vegetation cover and leaf area index weight—are introduced and combined with hourly meteorological variables and lightning characteristics to develop a tuned random forest prediction model. The framework is applied at a regional scale in the Greater Khingan Mountains and southwestern forest regions of China, with predictions conducted at an event-based temporal scale using hourly inputs. The vegetation-fused model achieves an AUC of 0.93, outperforming models without vegetation fusion. Analysis of model outputs indicates that hourly maximum temperature, leaf area index weight, precipitation, and wind speed are key factors influencing lightning-ignited fire occurrence. This study demonstrates the value of semi-automated alignment and vegetation feature fusion for improving lightning-ignited fire prediction in heterogeneous landscapes, supporting regional wildfire risk assessment and potential early-warning applications.
1. Introduction
Lightning-ignited fires (LIFs) represent a major natural ignition source of wildfires worldwide and play a particularly important role in boreal, temperate forest, and mixed vegetation ecosystems. Previous studies have shown that lightning accounts for approximately 20%–40% of wildfire ignitions globally, while contributing disproportionately to burned area, especially in boreal forests and mountainous regions with low population density [1,2]. Compared with human-caused fires, LIFs are often characterized by uncertain ignition timing, delayed detection, and strong dependence on meteorological and fuel conditions. The presence of holdover fires, in which ignition occurs hours to days after a lightning strike, further complicates both the attribution and prediction of LIF occurrence [3,4]. As climate warming is projected to increase lightning activity and fuel aridity in many regions, accurately predicting lightning-ignited fire occurrence has become an increasingly important topic in wildfire risk assessment and management [5].
Early studies on lightning-caused fires primarily focused on identifying causative lightning strikes using fixed spatiotemporal windows, in which fire detections were linked to lightning events occurring within predefined temporal and spatial thresholds [6]. To improve attribution accuracy, index-based matching methods were subsequently developed, combining distance and time lag into composite indices to quantify lightning–fire associations [7]. More recent work has explored probabilistic and Bayesian frameworks, which estimate ignition likelihood by explicitly modeling uncertainty in lightning location, detection delay, and fire reporting [8]. In parallel, machine-learning-based ignition models, including logistic regression and random forest approaches, have been widely applied to predict lightning-caused fire occurrence using meteorological, lightning, and fuel-related variables [9,10]. While these approaches have substantially advanced LIF research, they are often developed for specific vegetation types or regions and may rely on assumptions that limit scalability in heterogeneous landscapes.
Despite this progress, several challenges remain insufficiently addressed. First, ignition delay varies substantially among vegetation types. Forest fires often exhibit holdover periods ranging from one to several days, whereas grassland and cropland fires are typically detected within hours to one day after ignition due to faster flame spread and higher detection probability [11]. Applying uniform spatiotemporal thresholds across vegetation types can therefore introduce systematic misclassification. Second, in agricultural and mixed-use landscapes, human-caused fires, such as residue or stubble burning, frequently contaminate lightning–fire matching results, leading to overestimation of LIF occurrence [12]. Third, representing fuel conditions in regions with complex vegetation mosaics remains challenging. Many existing models rely on categorical vegetation types or multiple correlated vegetation variables, which may increase dimensionality, reduce interpretability, and limit generalization across regions [13,14]. These issues highlight the need for vegetation-adaptive alignment strategies and parsimonious yet informative fuel descriptors.
In this study, we propose a vegetation-adaptive lightning–fire alignment framework that integrates land cover information and historical fire records. To represent fuel conditions in heterogeneous landscapes, two feature-level vegetation fusion parameters—total vegetation cover and leaf area index (LAI) weight—are introduced and evaluated within a unified prediction framework.
The objectives of this study are to: (1) develop a vegetation-adaptive and semi-automated workflow for an existing lightning–fire alignment method; (2) design interpretable vegetation fusion parameters to represent fuel characteristics in mixed-vegetation regions; and (3) construct and evaluate a machine-learning-based model to predict lightning-ignited fire occurrence at a regional, event-based scale. The remainder of this paper is organized as follows: Section 2 describes the study area and data sources; Section 3 details the methodology; Section 4 presents the results; and Section 5 discusses the implications and limitations of the proposed approach.
2. Study Area and Data Sources
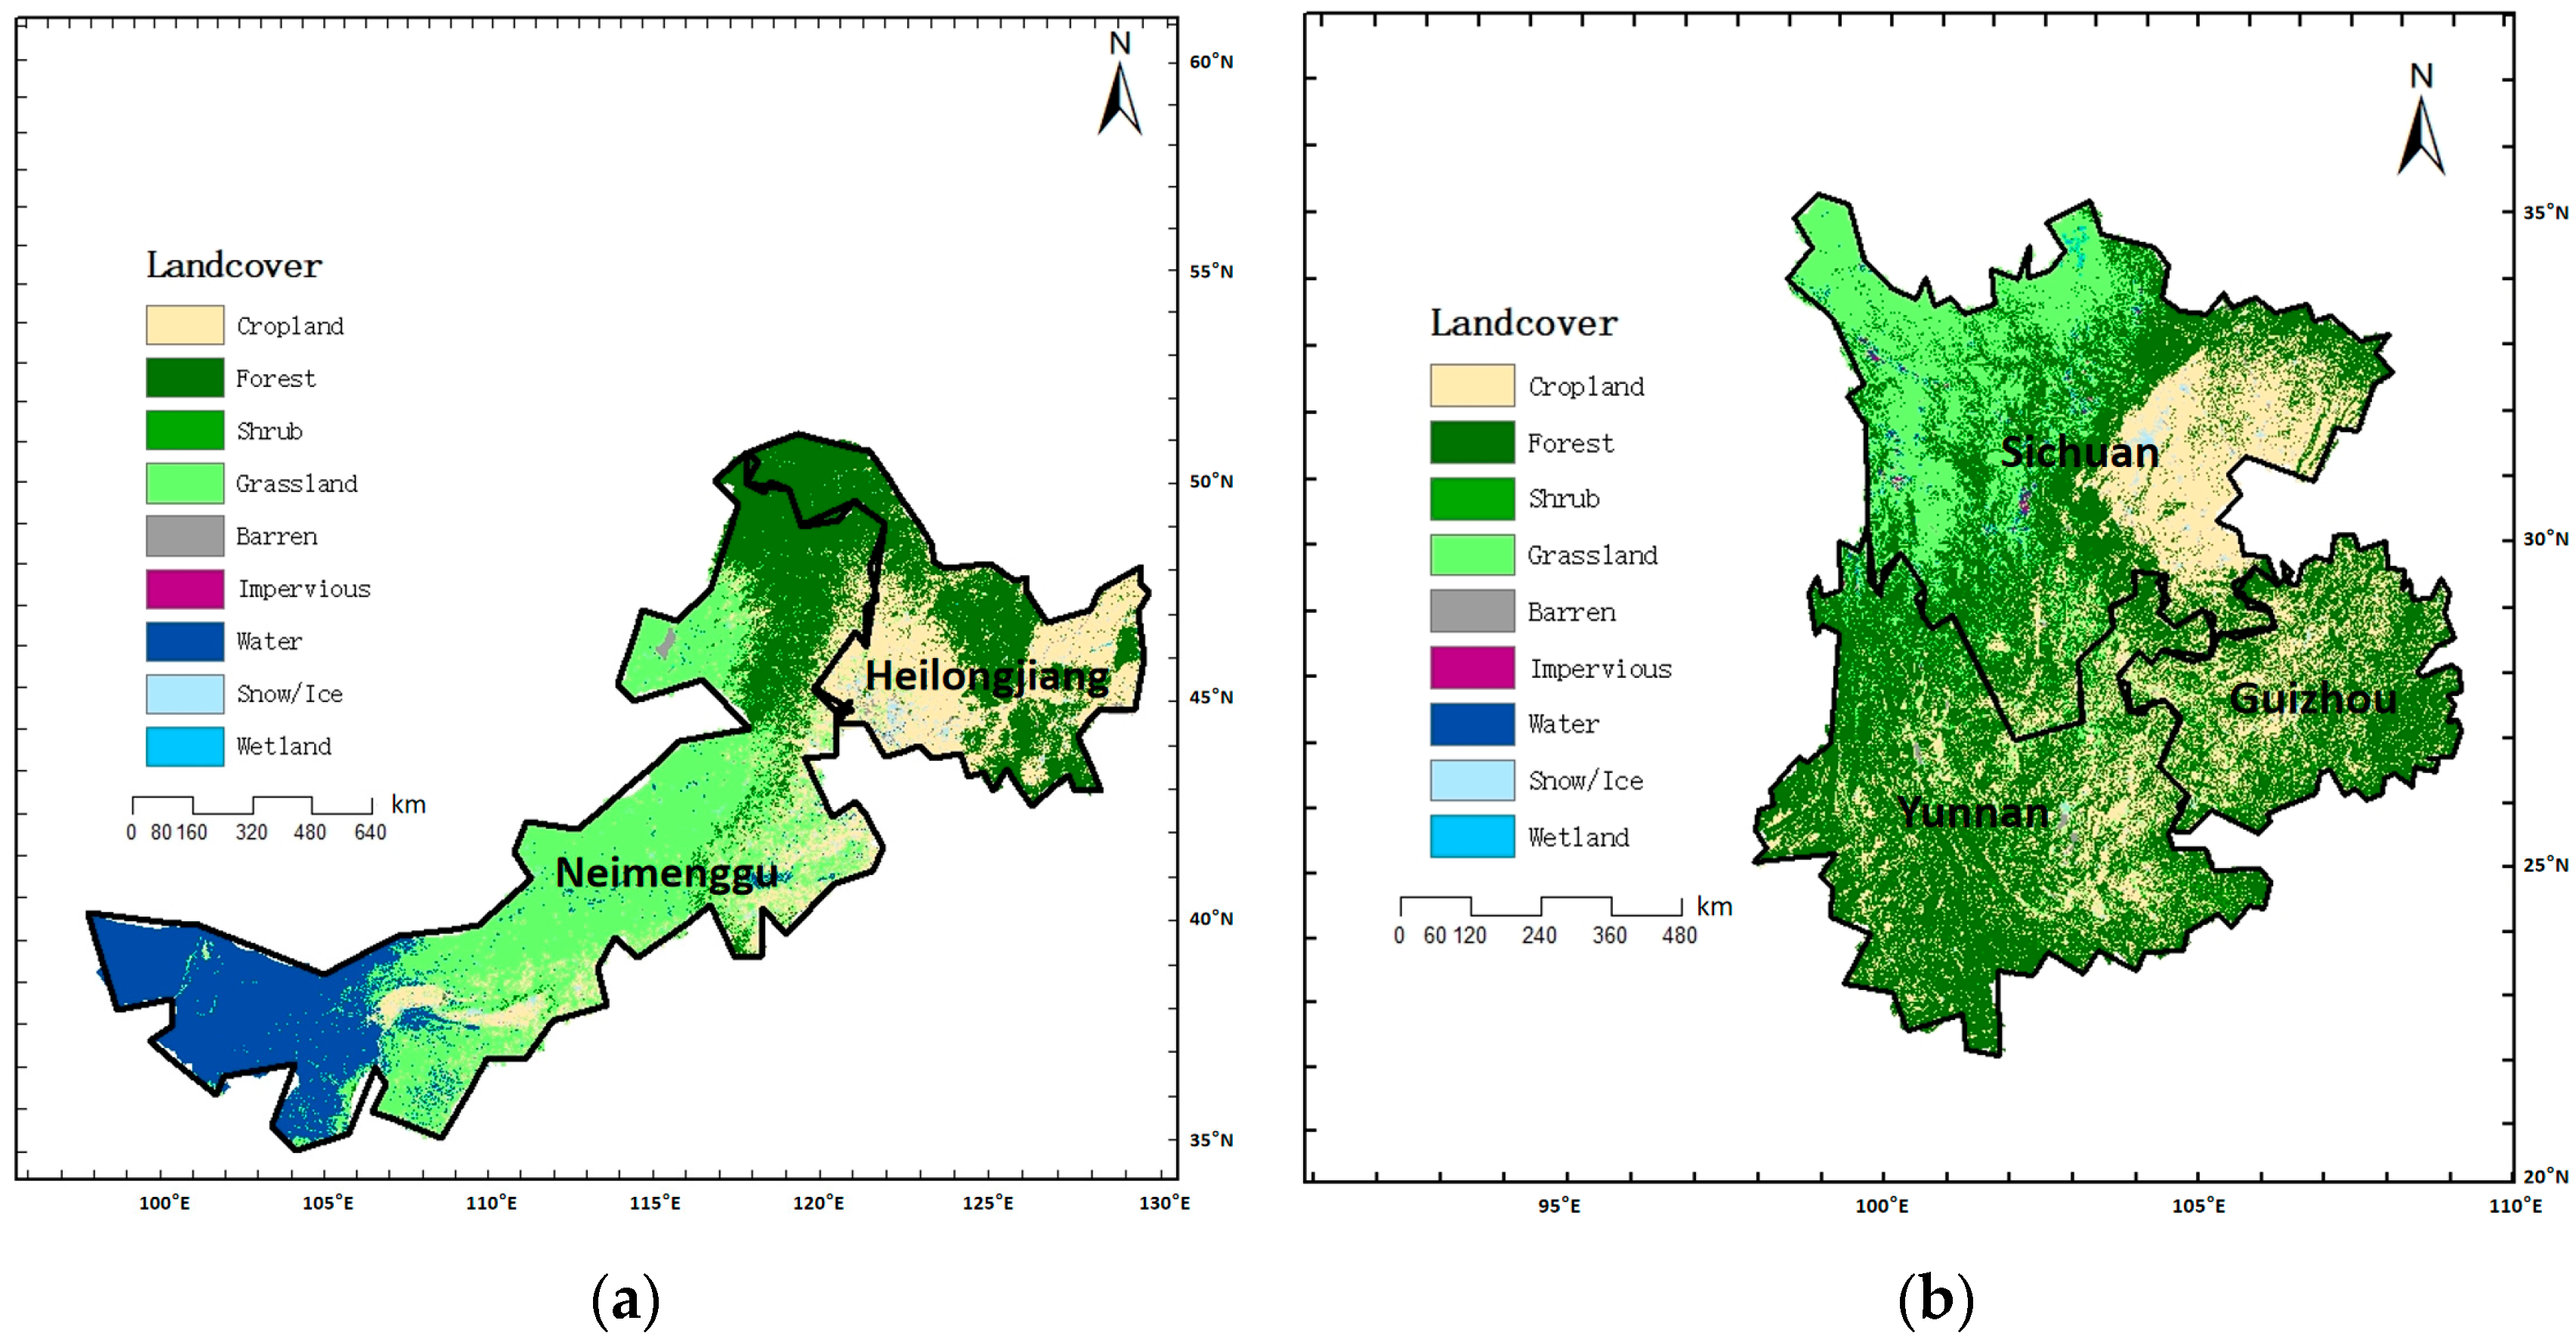
2.1. Study Area (Figure 1)
The study was conducted in two representative regions of China that experience frequent lightning activity and lightning-ignited fires, while encompassing diverse vegetation types, including forests, grasslands, and croplands [15]. The first region is located in northeastern China, covering parts of the Greater Khingan Mountains, approximately bounded by 121–127° E and 49–53° N. This region is dominated by boreal and temperate forests and is widely recognized as one of the most lightning–fire-prone areas in China [16,17]. The second region is located in southwestern China, approximately bounded by 98–104° E and 22–28° N, characterized by complex topography and a heterogeneous vegetation mosaic consisting of forest, grassland, and agricultural land [18].
These regions were selected for three main reasons. First, lightning-ignited fires occur frequently in both regions, providing sufficient samples for methodological evaluation. Second, the strong contrast in vegetation composition allows assessment of vegetation-dependent ignition processes and spatiotemporal alignment strategies. Third, high-quality and consistent multi-source datasets, including lightning observations, fire detections, meteorological reanalysis, and land cover data, are available for these regions.
The analysis focuses on the year 2021, which was selected because complete and consistent datasets were available across all data sources used in this study. While this provides a representative case for demonstrating and evaluating the lightning–fire alignment and prediction framework, the use of a single year limits the assessment of interannual climatic variability. Therefore, multi-year analyses are required to evaluate long-term representativeness and robustness.
Figure 1.
Land cover types in the study area (a) The Greater Khingan Forest Region. (b) The Southwest Forest Region.
2.2. Data Sources
2.2.1. Lightning Data
Lightning data were provided by the Institute of Forest Ecology, Environment and Protection, Chinese Academy of Forestry (CAF). The dataset includes the geographic location (latitude and longitude), occurrence time, polarity, and peak current intensity of cloud-to-ground lightning flashes. Lightning peak current in the original dataset is recorded in kiloamperes (), where 1 equals amperes (), which is the standard SI unit of electric current. The unit is commonly used in lightning studies because lightning peak currents typically range from several kiloamperes to several tens of kiloamperes. In this study, the original unit was retained for consistency with the source data and with standard practice in lightning research. The lightning dataset is confidential and maintained internally by the providing institution; it has not been publicly released and is therefore not available for open distribution.
The temporal resolution is on the order of milliseconds, and the spatial location accuracy is sufficient for regional-scale lightning–fire association analysis. The lightning dataset has been widely used in previous studies on lightning-caused fires in China and provides reliable support for ignition attribution.
2.2.2. VIIRS Fire Detection Data
Active fire detections were obtained from the Visible Infrared Imaging Radiometer Suite (VIIRS) 375 m active fire product [19]. The VIIRS sensor identifies fire pixels using a contextual algorithm based on thermal anomalies detected in the mid-infrared and thermal infrared bands. Each fire detection includes geographic location, detection time, and confidence information.
In this study, VIIRS fire detections were used as indicators of fire occurrence rather than precise ignition points. Because satellite-detected fire times may lag actual ignition, particularly for lightning-caused fires exhibiting holdover behavior, fire detections were later associated with lightning events through spatiotemporal alignment procedures described in Section 3. Low-confidence detections and non-vegetated surface detections were excluded to reduce false positives.
2.2.3. Land Cover Data
Land cover information was obtained from the China Land Cover Dataset (CLCD), which provides nationwide land cover classification at a spatial resolution of 30 m [20]. The dataset includes major land cover types such as forest, grassland, cropland, water bodies, and impervious surfaces.
In this study, the CLCD was used to (1) identify vegetation types at fire and lightning locations, (2) distinguish cropland areas with a high likelihood of human-caused fires, and (3) support vegetation-dependent spatiotemporal alignment strategies. Fire detections located on water bodies or impervious surfaces were excluded from further analysis.
2.2.4. Meteorological and Vegetation Data
Meteorological variables were obtained from the ERA5 reanalysis dataset produced by the European Centre for Medium-Range Weather Forecasts (ECMWF) [21]. ERA5 provides hourly meteorological data at a spatial resolution of approximately 0.25° (~30 km). Variables used in this study include hourly maximum temperature, wind speed, precipitation, relative humidity, and surface pressure.
Vegetation-related variables, including leaf area index (LAI) and fractional vegetation cover, were derived from satellite-based vegetation products with spatial resolutions ranging from 500 m to 1 km. To integrate these data with point-based lightning and fire observations, all meteorological and vegetation variables were spatially assigned using a grid-based nearest-neighbor approach at the ERA5 grid level. Although this introduces a scale mismatch between coarse-resolution meteorological data and fine-resolution fire detections, such an approach is widely adopted in wildfire ignition modeling and is appropriate for regional-scale analyses.
All datasets were temporally harmonized to an hourly scale to support event-based lightning–fire alignment and prediction.
2.3. Data Preprocessing Overview
Prior to analysis, all datasets were projected to a common coordinate system. Lightning and fire data were filtered based on spatial location, land cover type, and data quality. Meteorological and vegetation variables were normalized and checked for missing values. These preprocessing steps ensure consistency among multi-source datasets and provide a reliable basis for the subsequent lightning–fire alignment and prediction modeling.
However, this approach may introduce spatial representativeness errors, particularly in regions with complex terrain or heterogeneous land cover. The potential implications of this scale mismatch are discussed in Section 5.
3. Methods
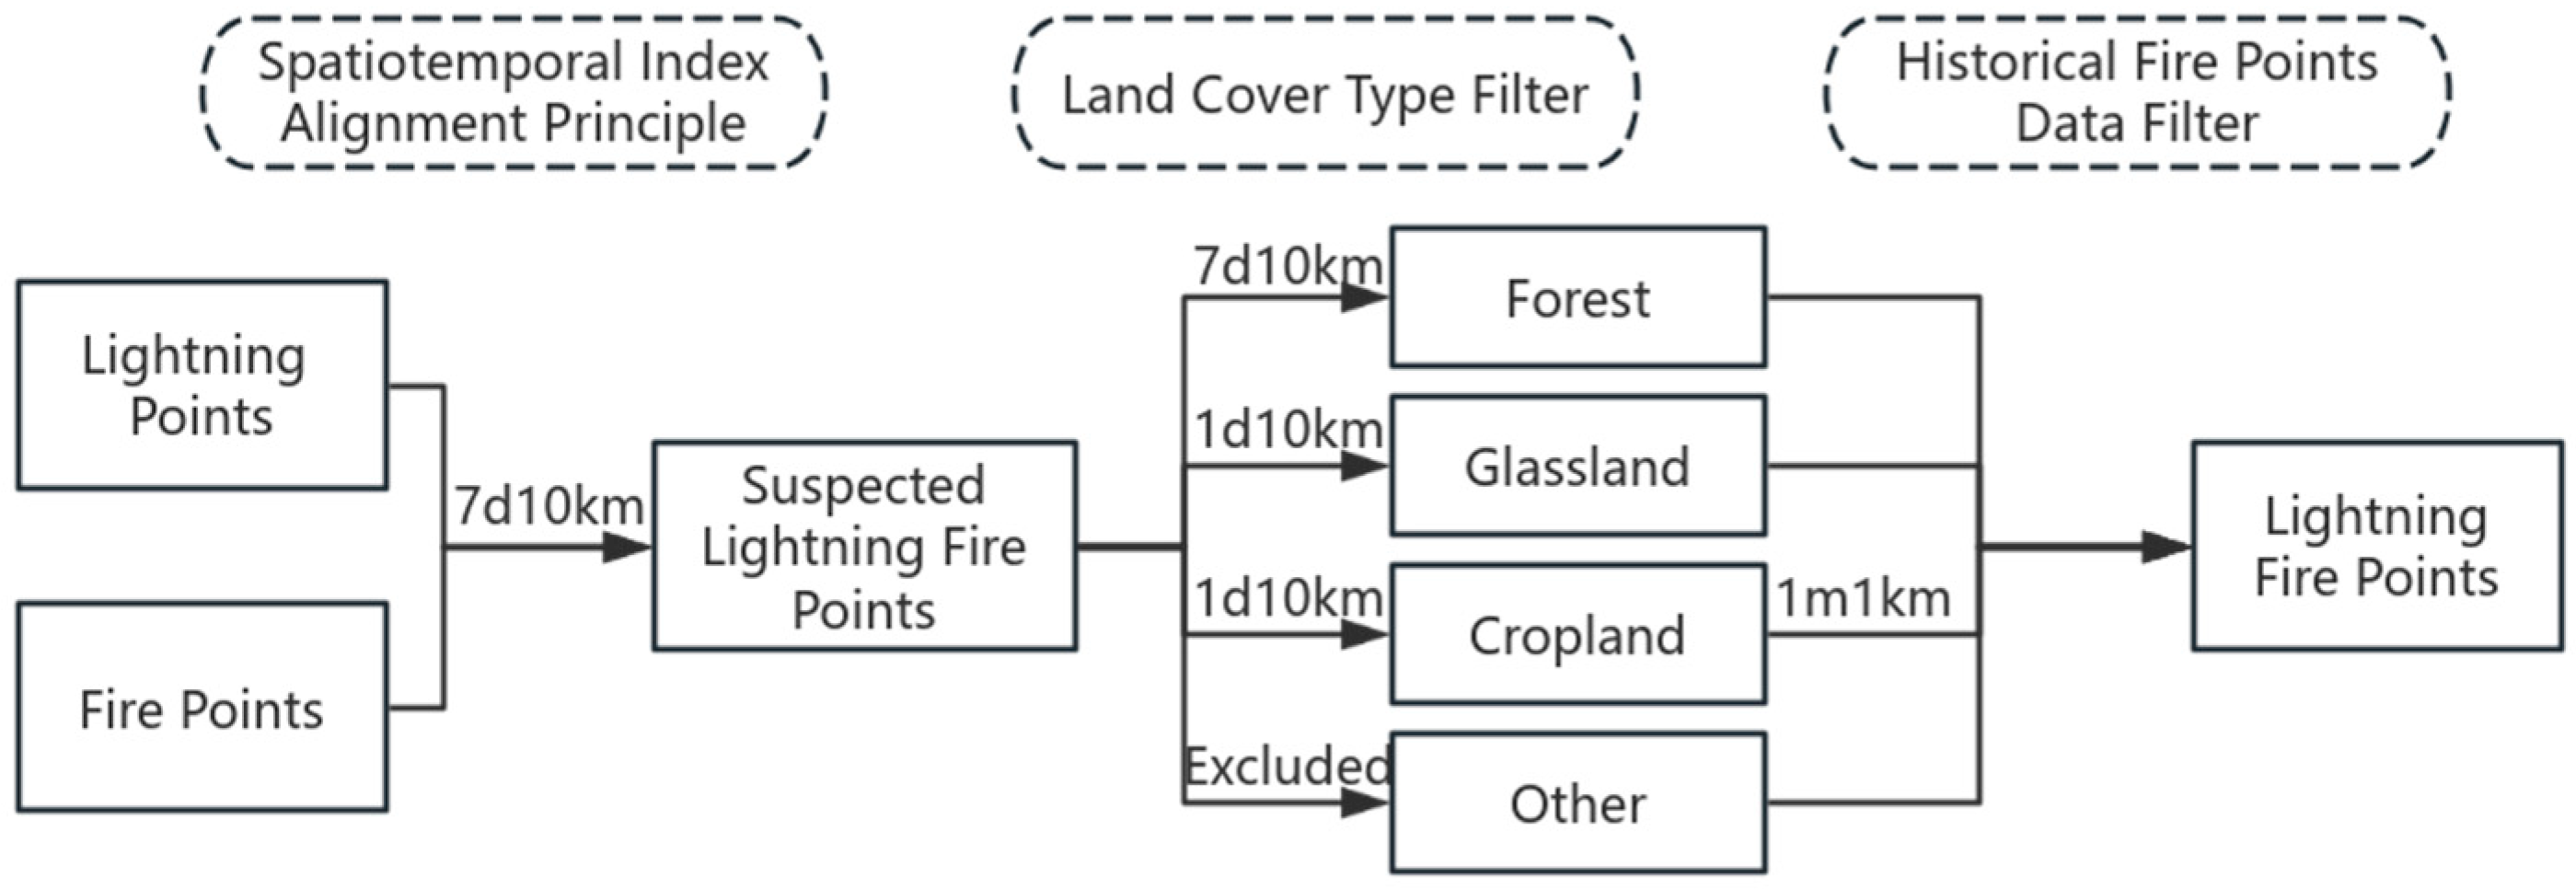
3.1. Lightning–Fire Alignment Framework (Figure 2)
The lightning–fire alignment process was designed as a semi-automated workflow that integrates lightning records, satellite-detected fire points, land-cover information, and meteorological data. The lightning–fire matching strategy adopted in this study is based on an existing spatiotemporal index alignment approach proposed in previous studies [6], rather than a newly developed matching paradigm. The main contribution of this study lies in the vegetation-adaptive parameterization and semi-automated implementation of the framework. The objective is to identify the most probable lightning event associated with each detected fire under consistent spatiotemporal and environmental constraints.
The procedure consists of four main steps. First, candidate lightning events are extracted within predefined temporal and spatial windows around each fire detection. Second, land-cover constraints are applied to exclude non-flammable surface types. Third, each candidate lightning event is assigned a spatiotemporal attribution score that combines temporal proximity, spatial distance, land-cover weighting, and historical fire occurrence. Finally, the lightning event with the highest attribution score is selected as the most probable associated lightning event.
In this study, the workflow is semi-automated. The data ingestion, candidate generation, feature extraction, and score calculation are automated, whereas the parameter search is constrained by predefined candidate ranges derived from prior ecological knowledge.
Figure 2.
Lightning–fire alignment framework.
3.1.1. Spatiotemporal Index Alignment Principle
The spatiotemporal index alignment principle involves establishing a comprehensive evaluation metric and mathematical model to quantitatively analyze the spatiotemporal correlation between lightning-induced fire points and lightning strikes [6]. The formula for calculating the spatiotemporal index is as follows:
Among them, A represents the spatiotemporal index, is the time difference factor, is the spatial distance factor, T is the lag time, Tmax is the maximum time window, S is the lag distance, and Smax is the maximum radius distance.
3.1.2. Vegetation-Dependent Spatiotemporal Windows
Considering the differences in smoldering latency among vegetation types, different temporal windows were applied for lightning–fire matching. Forest fuels can sustain longer holdover periods due to thicker organic layers and lower oxygen availability, whereas grassland and cropland fuels typically ignite and spread more rapidly [22].
Based on this ecological difference and previous studies on lightning-ignited fires, a temporal window of up to seven days was applied for forested areas, while a one-day window was used for grassland and cropland areas. A spatial threshold of 10 km was used for all vegetation types to account for uncertainties in lightning location accuracy and fire detection timing [23].
These thresholds were not arbitrarily assigned. Instead, they were selected based on model calibration and performance consistency across the labeled dataset. The selected values represent a practical compromise between attribution accuracy and sample availability.
3.1.3. Semi-Automated Alignment Method for Lightning–Fire Points
During the spatiotemporal index alignment process for lightning–fire points, manually screening land cover types and historical fire records for suspected lightning fires is labor-intensive and time-consuming. To address this, this study proposes a semi-automated lightning–fire point alignment method. Machine learning is employed to determine weights for land cover types and historical fire points, leading to an improved spatiotemporal index alignment formula:
where A is the spatiotemporal index, is the time difference factor, is the spatial distance factor, is the land cover type weight, and is the historical fire point screening weight.
The attribution score includes weighting factors for land-cover type and historical fire occurrence. In the original formulation, candidate weight values were defined based on prior knowledge of ignition likelihood across different surface types. The predefined candidate weight ranges were guided by prior ecological understanding of lightning ignition likelihood across land-cover types, which has been commonly adopted in wildfire ignition modeling studies [3]. For example, forested areas generally exhibit higher lightning–fire ignition probability than cropland, where many fires are human-induced.
The weight parameters were not manually fixed. Instead, they were determined through a grid-based parameter search using the labeled lightning–fire dataset.
Specifically, candidate weight combinations were generated within predefined ranges for land-cover weight and historical-fire weight (Table 1 and Table 2). For each combination, the alignment score A was computed for all lightning events, and a binary classification was performed using different decision thresholds.
Table 1.
Candidate weight ranges for land cover types.
Table 2.
Candidate weight ranges for historical fire screening.
Model performance was evaluated using the F1-score and AUC under five-fold cross-validation. The final weight combination and decision threshold (A ≥ 0.3) were selected based on the best average classification performance across folds.
This procedure ensured that the final weights were data-driven rather than manually assigned.
The classification threshold was selected near the optimal operating point of the model during calibration, where the balance between precision and recall was maximized. Based on the updated spatiotemporal index formula, a new classification threshold is proposed: when A ≥ 0.3, the fire event is classified as a lightning-ignited fire; when 0.3 > A ≥ 0.1, it is marked as a suspected lightning-ignited fire requiring manual verification; and when A < 0.1, it is classified as a non-lightning-ignited fire. Sensitivity tests during calibration showed that thresholds between 0.25 and 0.35 produced similar classification performance, with A = 0.3 providing the best balance between precision and recall. Therefore, A ≥ 0.3 was selected as the operational threshold. This calibration process also serves as a sensitivity analysis, indicating that the alignment results were relatively stable within the tested threshold range.
Although the weight values were optimized through a data-driven parameter search, the candidate ranges were defined based on prior ecological knowledge and therefore represent prior assumptions. Consequently, the proposed framework should be regarded as semi-automated rather than fully automated.
3.2. Predictive Model for Lightning-Ignited Fire Occurrence in Multiple Vegetation Types
3.2.1. Feature-Level Fusion of Vegetation Data
Data fusion refers to the integration of data from diverse sources, types, or formats to provide more comprehensive and accurate information. Its core purpose is to enhance data quality and application value through synthetic processing [24]. Feature-level fusion is a multi-source data fusion approach that integrates data from different sources during the feature extraction stage, generating more representative features for subsequent analysis and decision-making [25]. Compared with data-level fusion and decision-level fusion, feature-level fusion effectively reduces data dimensionality while retaining critical information, thereby improving computational efficiency [26].
High and low vegetation cover reflect the vertical stratification of vegetation in a given region. High vegetation cover refers to the coverage of the upper canopy, typically dominated by tall trees such as conifers and broad-leaved species, while low vegetation cover refers to the coverage of the understory layer, including shrubs, grasslands, or young trees.
The leaf area index (LAI) is defined as the total one-sided leaf area per unit ground area and is widely used as an indicator of canopy density and vegetation productivity. In the context of wildfire ignition, LAI can be interpreted as a proxy for effective fuel continuity, reflecting the structural density of the vegetation canopy and its potential influence on ignition probability under heterogeneous vegetation conditions.
High vegetation cover combined with high LAI indicates strong spatial continuity of vegetation, which facilitates the formation of lightning conduction pathways. Dense canopy areas may also enhance local electric fields, thereby attracting lightning strikes. In contrast, low vegetation cover and low LAI reflect vegetation fragmentation, which may impede fire spread under certain conditions but increase flammability when dry. Dry, low-stature vegetation tends to have higher electrical resistance, making it more likely to ignite upon lightning strike [27].
In this study, two integrated vegetation indices—total vegetation cover and leaf area index weight—are proposed to characterize vegetation features in regions with diverse vegetation types.
These fusion indicators are formulated as simple linear combinations. The use of linear formulations provides several practical advantages. First, linear fusion maintains physical interpretability, allowing each component to be directly associated with observable vegetation characteristics. Second, it reduces model complexity and parameter uncertainty, which is particularly important under limited sample sizes. Third, linear indicators are more robust and transferable across heterogeneous landscapes, where complex nonlinear interactions may be difficult to estimate reliably. Therefore, the fusion parameters are intended as compact, interpretable proxies of fuel structure rather than complete representations of all vegetation–fire interaction processes.
Total vegetation cover is calculated using an additive fusion method, expressed as:
where is total vegetation cover, denotes high vegetation cover, and denotes low vegetation cover.
The leaf area index weight is calculated using a weighted average fusion method, expressed as:
where is the leaf area index weight, represents the leaf area index for high vegetation, represents the leaf area index for low vegetation, and ϵ (set to 1 × 10⁻⁶) is a small constant added to prevent division by zero.
3.2.2. Grid Search Method
Grid search is a classic hyperparameter optimization method that selects the optimal parameters by exhaustively evaluating all possible combinations within a given parameter space, based on cross-validation performance [28]. Its core steps are as follows:
- (1)
- Parameter Space Gridification: Define the hyperparameters to be optimized and their respective value ranges, discretizing continuous values into grid points. For example, if hyperparameter has possible values , ,…, and has values , ,…, , the parameter space G is the Cartesian product of all such sets:
- (2)
- Generation of Parameter Combinations: Generate all possible hyperparameter combinations in the grid via the Cartesian product. For instance, represents one specific combination.
- (3)
- Exhaustive Search and Validation: Iterate through each parameter combination, train the model, and evaluate its performance (typically using cross-validation). Record evaluation metrics on the validation set (e.g., accuracy, F1-score, etc.).
- (4)
- Selection of Optimal Parameters: Choose the hyperparameter combination that yields the best performance on the validation set as the final model parameters.
3.2.3. Random Forest Classification Model
Random forest is an ensemble learning method widely used in classification and regression tasks [29]. It improves model accuracy and robustness by constructing multiple decision trees and aggregating their predictions. Its core mechanisms include bootstrap sampling, random feature selection, and classification/regression.
For an input sample x, the prediction of the t-th decision tree is:
where K is the number of classes. During training, each decision tree is built on a different bootstrap subsample and considers only a randomly selected subset of features at each node split, enhancing model diversity. The final classification outcome is determined by majority voting across all decision trees:
In this study, the model was implemented using the following configuration:
- (1)
- Number of trees: 200
- (2)
- Maximum tree depth: unrestricted
- (3)
- Minimum samples per leaf: 1
- (4)
- Feature subset strategy: square-root of total features
- (5)
- Random seed: fixed for reproducibility
The model was trained using the labeled lightning dataset, where aligned lightning events were treated as positive samples and non-aligned lightning events were treated as negative samples. Because the labeled dataset was approximately balanced (137 fire vs. 113 non-fire samples), no additional class-balancing strategy (e.g., class weighting or resampling) was applied during random forest training.
3.2.4. Model Evaluation Metrics
This study primarily employed five model evaluation metrics: Accuracy, Precision, Recall, F1-score, and the ROC curve. Accuracy represents the proportion of correctly predicted samples relative to the total sample size, calculated as:
where TP is the number of true positive samples (predicted positive and actually positive), TN is the number of true negative samples (predicted negative and actually negative), FP is the number of false positive samples (predicted positive but actually negative), and FN is the number of false negative samples (predicted negative but actually positive).
Precision focuses on the quality of positive predictions, i.e., the accuracy of the predicted positive outcomes, calculated as:
Recall, also known as sensitivity, measures the ability to identify positive samples, i.e., the comprehensiveness of coverage, calculated as:
The F1-score is the harmonic mean of Precision and Recall, with values closer to 1 indicating better overall model performance, calculated as:
The ROC curve visually represents model performance across different classification thresholds, with the horizontal axis representing the False Positive Rate (FPR) and the vertical axis representing the True Positive Rate (TPR), which is equivalent to Recall. The False Positive Rate is calculated as:
When the curve is closer to the upper-left corner, the False Positive Rate is lower, the True Positive Rate is higher, and the model performance is better. The AUC (Area Under the ROC Curve) quantifies the area under the ROC curve, with larger values indicating better model performance.
3.2.5. Feature Importance Analysis Based on Random Forest
To identify the dominant drivers of lightning-ignited fire occurrence, feature importance was evaluated using the mean decrease in impurity (MDI), also known as Gini importance, derived from the trained random forest model [10].
In a random forest, each decision tree is constructed using bootstrap samples and random feature subsets. During tree construction, splits are selected to maximize impurity reduction. For classification tasks, impurity is typically measured using the Gini index, defined as:
where is the proportion of samples belonging to class within a node, and is the total number of classes.
When a feature is used to split a node, the reduction in impurity before and after the split is calculated. The importance of feature is obtained by accumulating the impurity reductions across all trees and normalizing the results:
where is the importance of feature , is the total number of trees, is the set of nodes in tree where feature is used for splitting, is the impurity reduction at node in tree .
The resulting importance values are normalized so that the sum of all feature importances equals one. Higher values indicate that a feature contributes more to reducing classification uncertainty across the ensemble.
In this study, feature importance was computed from the tuned random forest model trained on the vegetation-fused dataset. The importance rankings were then used to interpret the relative contributions of meteorological, lightning, and vegetation-related variables to lightning-ignited fire occurrence.
4. Results and Analysis
4.1. Screening Results of Lightning-Ignited Fire Points
After spatiotemporal index alignment, a total of 258 suspected lightning-ignited fire points were identified within the study area. Following land-cover type screening of these suspected points, grassland fire points decreased from 25 to 5, cropland fire points decreased from 92 to 29, and six fire points located on impervious surfaces or water bodies were excluded. This step retained 164 out of 258 suspected points, corresponding to approximately 63.6% of the initially aligned dataset.
To further mitigate the influence of human-induced burning in cropland areas, historical fire data were applied for additional screening, resulting in a reduction in cropland fire points from 29 to 2. After this step, 137 fire points remained, corresponding to approximately 53.1% of the initial suspected set. These 137 points were used to construct the final aligned lightning–fire dataset.
Table 3 summarizes the screening results across different vegetation types. The proposed alignment procedure substantially reduced the number of cropland fire points, indicating that the historical-fire filter effectively removed recurring human-induced fire locations.
Table 3.
Results of lightning-ignites.
The semi-automated lightning–fire point alignment method proposed in this study achieved high agreement rates within the labeled dataset, particularly for forest and grassland cases, indicating that the alignment framework performs consistently across major vegetation types. Examples from the validation set are shown in Table 4.
Table 4.
Validation example of the semi-automated lightning-ignited fire point alignment model.
The optimized spatiotemporal index formula demonstrates high sensitivity to lightning-ignited fires across different vegetation types. This method is capable of processing large-scale data without extensive manual screening, making it suitable for real-time lightning fire monitoring systems.
4.2. Analysis of Lightning Characteristics
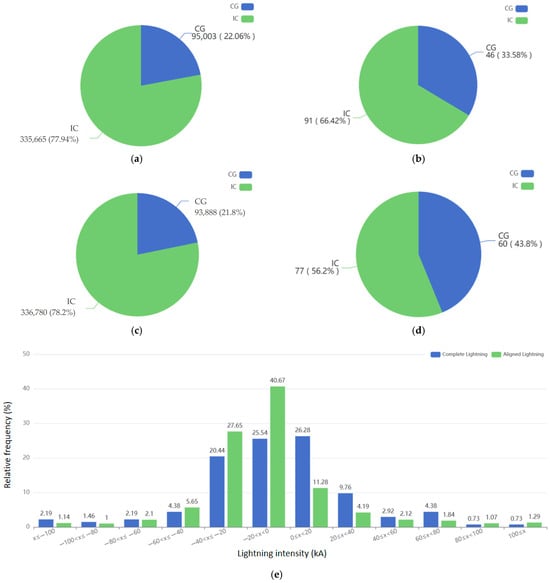
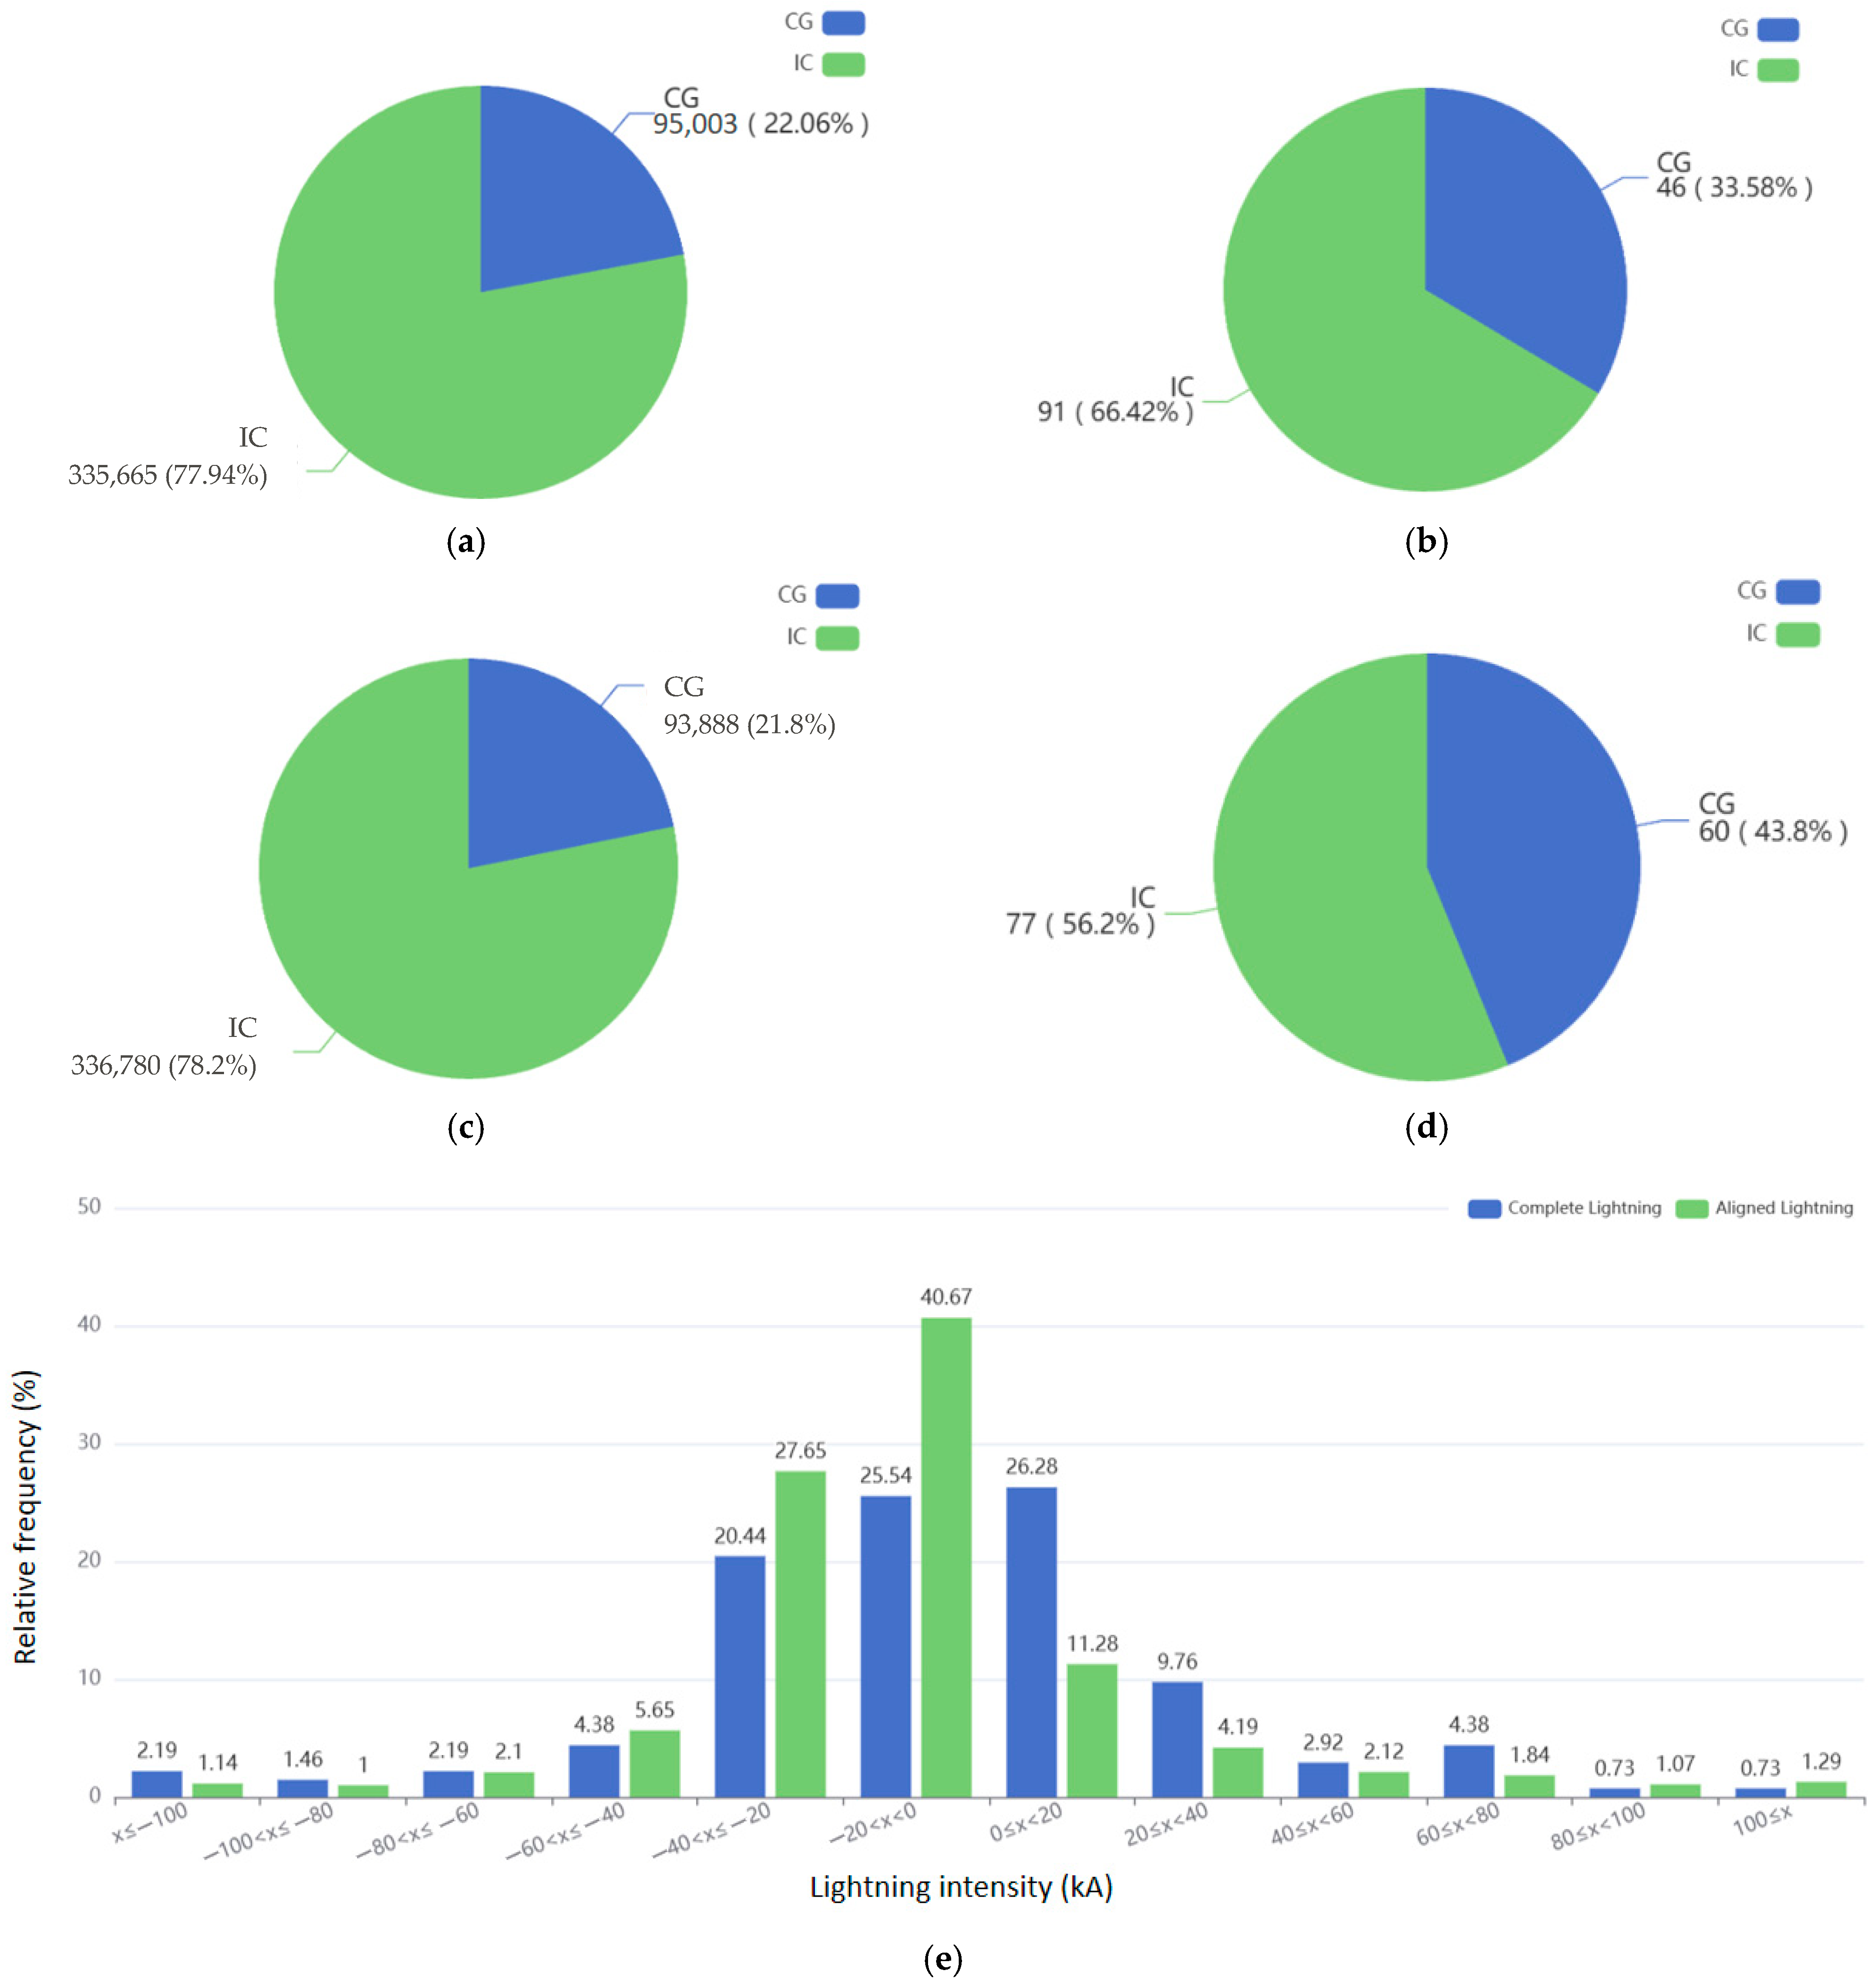
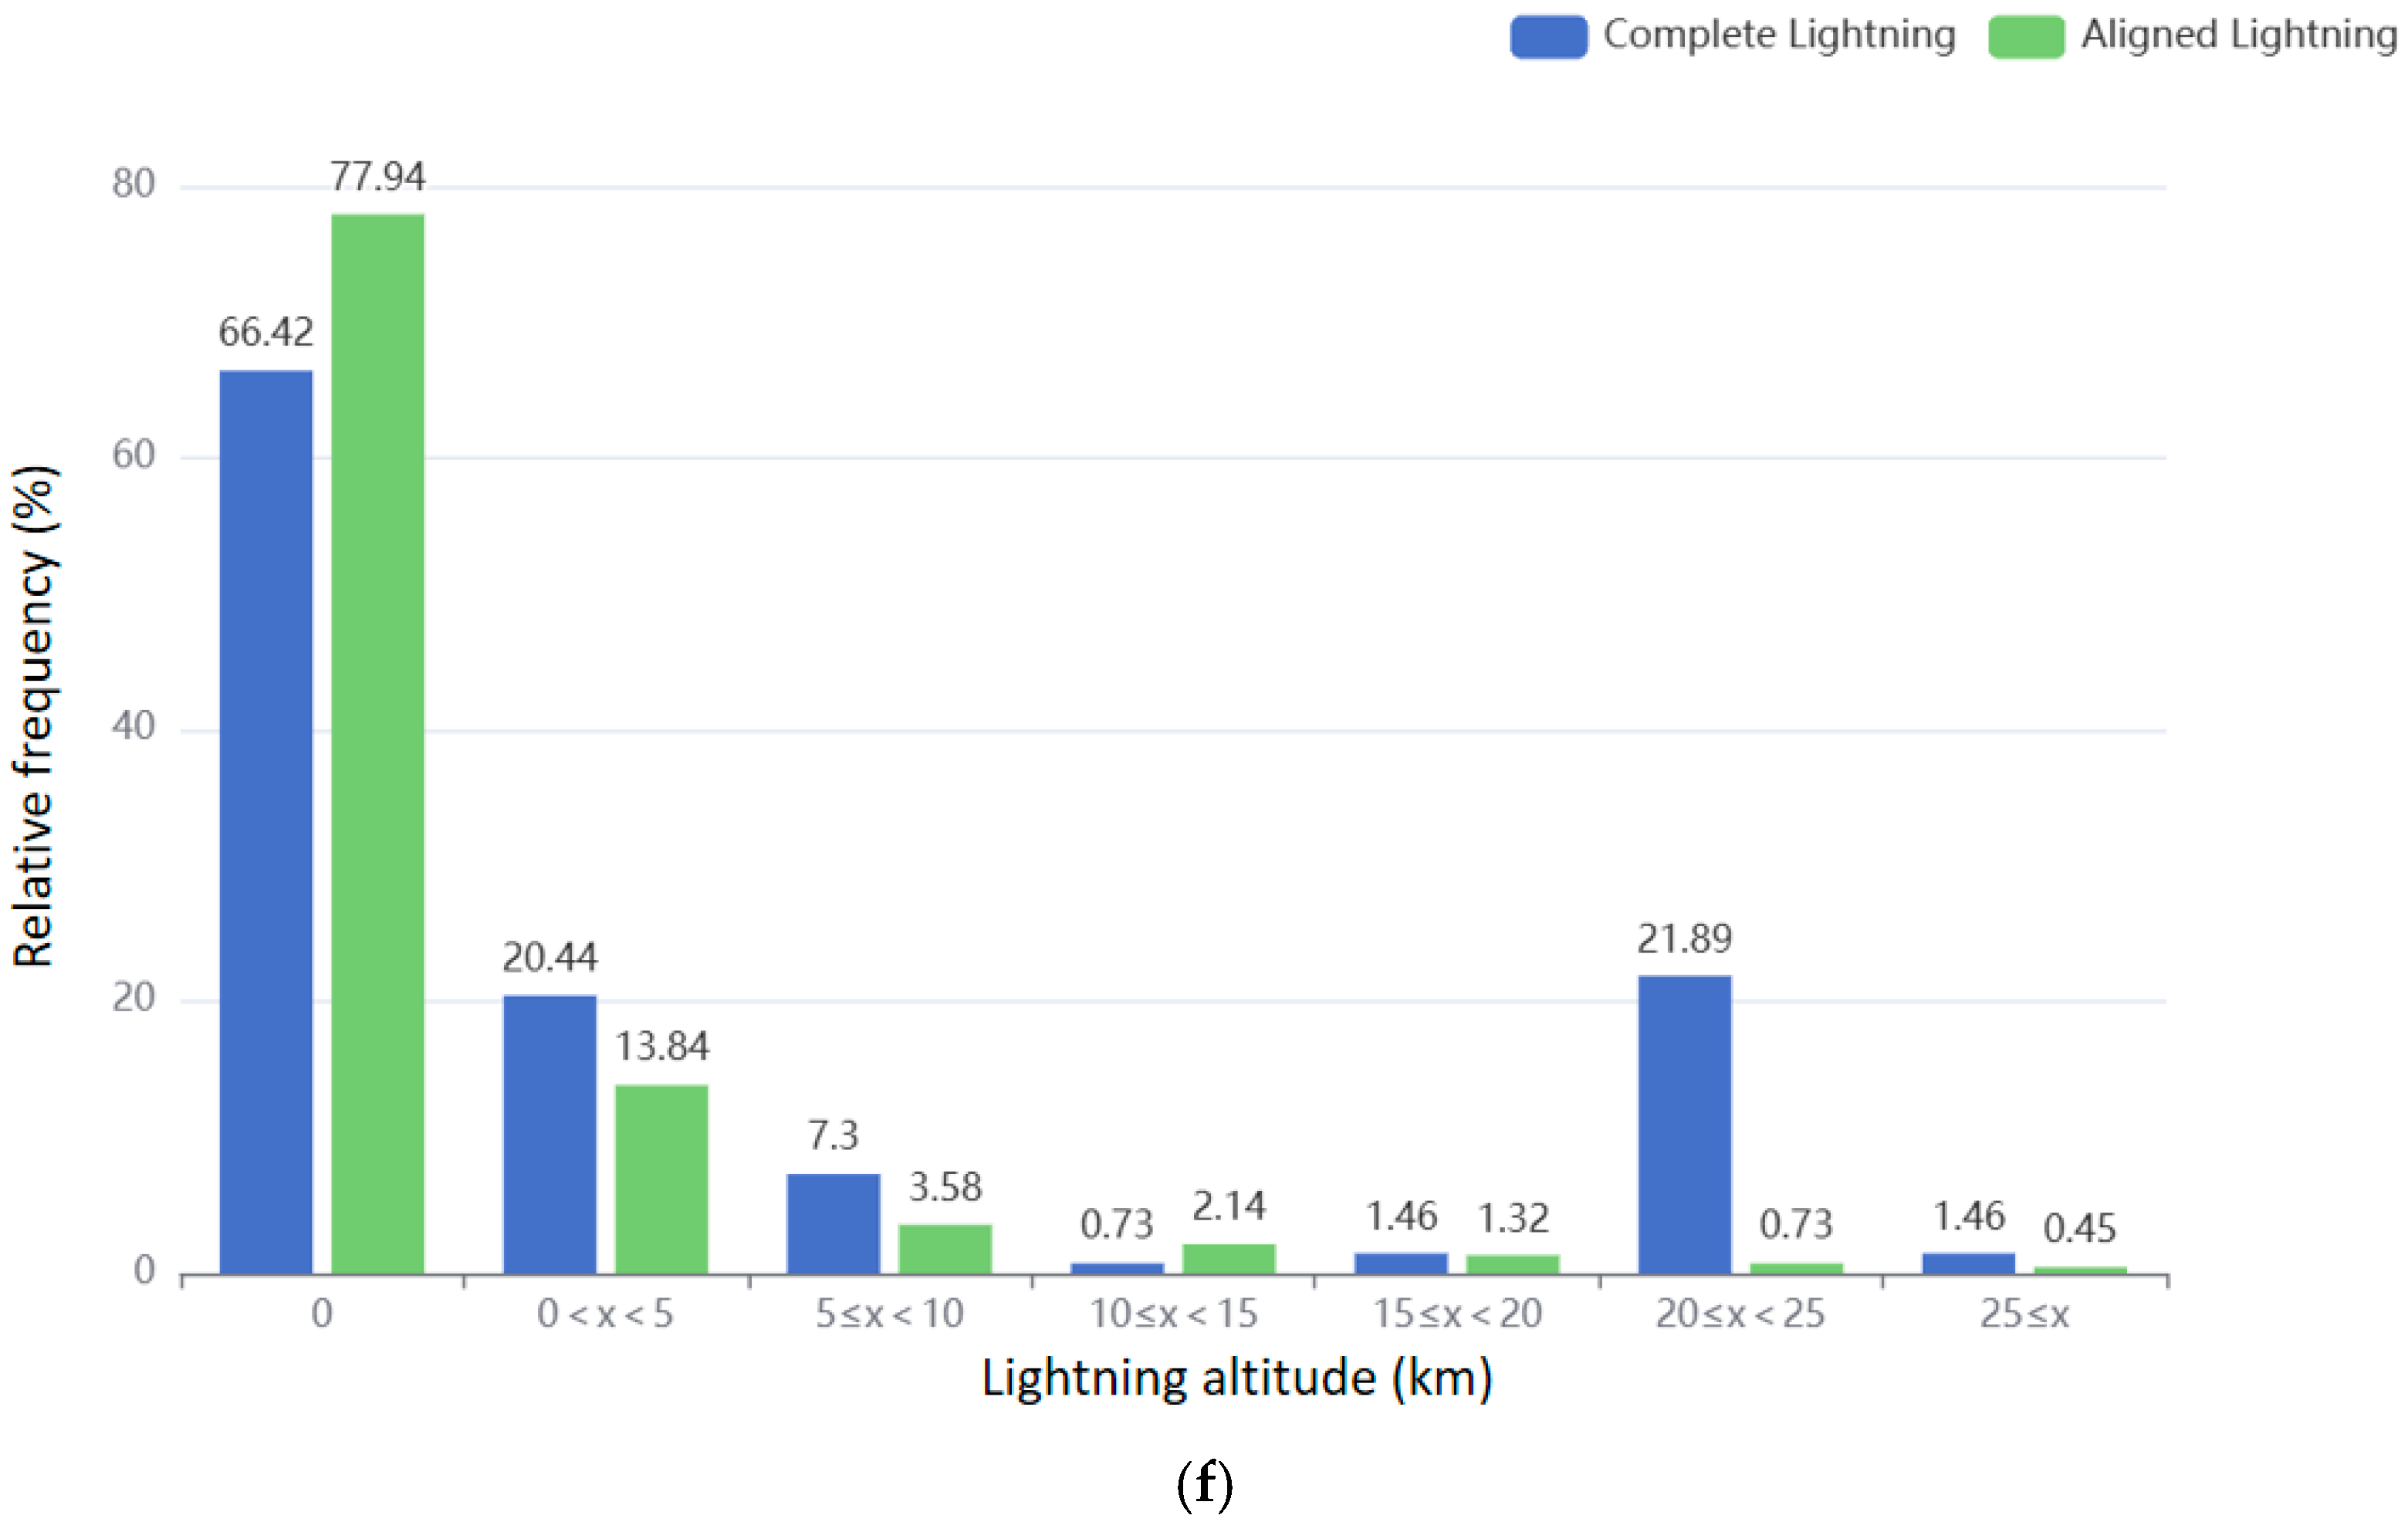
As shown in Figure 3, comparing the screened lightning data with the full dataset of over 400,000 lightning records reveals differences in lightning characteristics that, to some extent, reflect the distinct properties of lightning strikes capable of igniting fires.
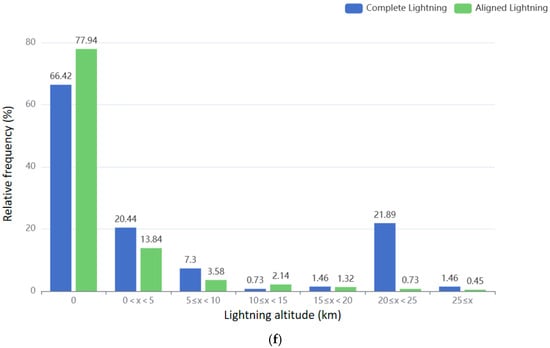
Figure 3.
Lightning characteristics analysis. (a) total lightning type. (b) aligned lightning type. (c) total lightning polarity. (d) aligned lightning polarity. (e) lightning intensity. (f) lightning altitude.
Regarding lightning type, both the complete lightning dataset and the aligned lightning dataset exhibit a higher proportion of cloud-to-ground (CG) flashes compared to intra-cloud (IC) flashes. However, the proportion of CG flashes in the aligned dataset is lower than that in the complete dataset. This observation suggests that while lightning fires are more likely to be ignited by CG flashes, not all CG flashes result in fire ignition, indicating that the occurrence of lightning fires is also influenced by factors such as surface vegetation and meteorological conditions.
In terms of lightning polarity, both datasets are dominated by negative flashes, with negative flashes outnumbering positive flashes. However, the proportion of negative flashes is higher in the aligned dataset compared to the complete dataset. Although negative flashes generally release less energy per event than positive flashes, their higher frequency increases the likelihood of igniting combustible materials. In contrast, positive flashes, though less frequent, are characterized by longer discharge durations and stronger currents, making them more prone to igniting fires under conditions such as drought.
Regarding lightning altitude, the majority of flashes in both the complete and aligned datasets are distributed within the 0–5 km range. Aligned lightning also shows a secondary concentration between 20–25 km. While some differences in altitude distribution exist in other intervals, the overall trends remain consistent. Lightning altitude may influence its interaction with ground-level fuels, with lower-altitude flashes being more likely to strike surface vegetation, thereby increasing the risk of lightning fire ignition.
In terms of lightning intensity, the intensity of ground flashes in the complete dataset is mainly distributed between −40 kA and 20 kA, while the aligned dataset shows a more concentrated distribution within this range. Although intensity distributions differ across the entire range, the overall trend remains consistent. Moderate to high-intensity lightning may be more effective in igniting fires, whereas extremely high-intensity flashes may release energy too rapidly, reducing their likelihood of sustained ignition.
In summary, lightning intensity, altitude, and polarity in the aligned dataset exhibit more concentrated distribution patterns, suggesting that lightning fire occurrence is likely influenced by specific combinations of lightning parameters. The slightly higher proportion of positive flashes in the aligned dataset supports findings from some studies [30,31] indicating that positive flashes are more prone to igniting fires under certain conditions. This analysis provides a basis for selecting key parameters in lightning fire early warning models, such as prioritizing the monitoring of lightning with specific intensity, altitude, or polarity characteristics to enhance prediction accuracy.
4.3. Evaluation of the Lightning-Ignited Fire Prediction Model
After constructing the aligned dataset, 137 successfully matched lightning records were treated as positive samples. In addition, 113 lightning records not associated with fire points were randomly selected as negative samples, forming a dataset of 250 samples.
Based on these data, two random-forest-based models were developed: one without vegetation-fused variables and one with vegetation-fused variables. The purpose of this comparison was to evaluate the contribution of the two proposed vegetation fusion parameters—total vegetation cover and leaf area index weight—to the predictive performance of the lightning-ignited fire model. The input variables for the two model configurations are summarized in Table 5.
Table 5.
Input variables for the integrated model predicting lightning-ignited fire occurrence.
Both models share common input variables, including weather data and lightning data. In the vegetation-fused data model, the original vegetation data were replaced by the feature-fused parameters: total vegetation cover and leaf area index weight. This study employed five evaluation metrics—Accuracy, Precision, Recall, F1-score, and the ROC curve—to assess model performance. The evaluation results of the vegetation-fused model are presented in Table 6.
Table 6.
Evaluation of the vegetation-integrated data fusion model.
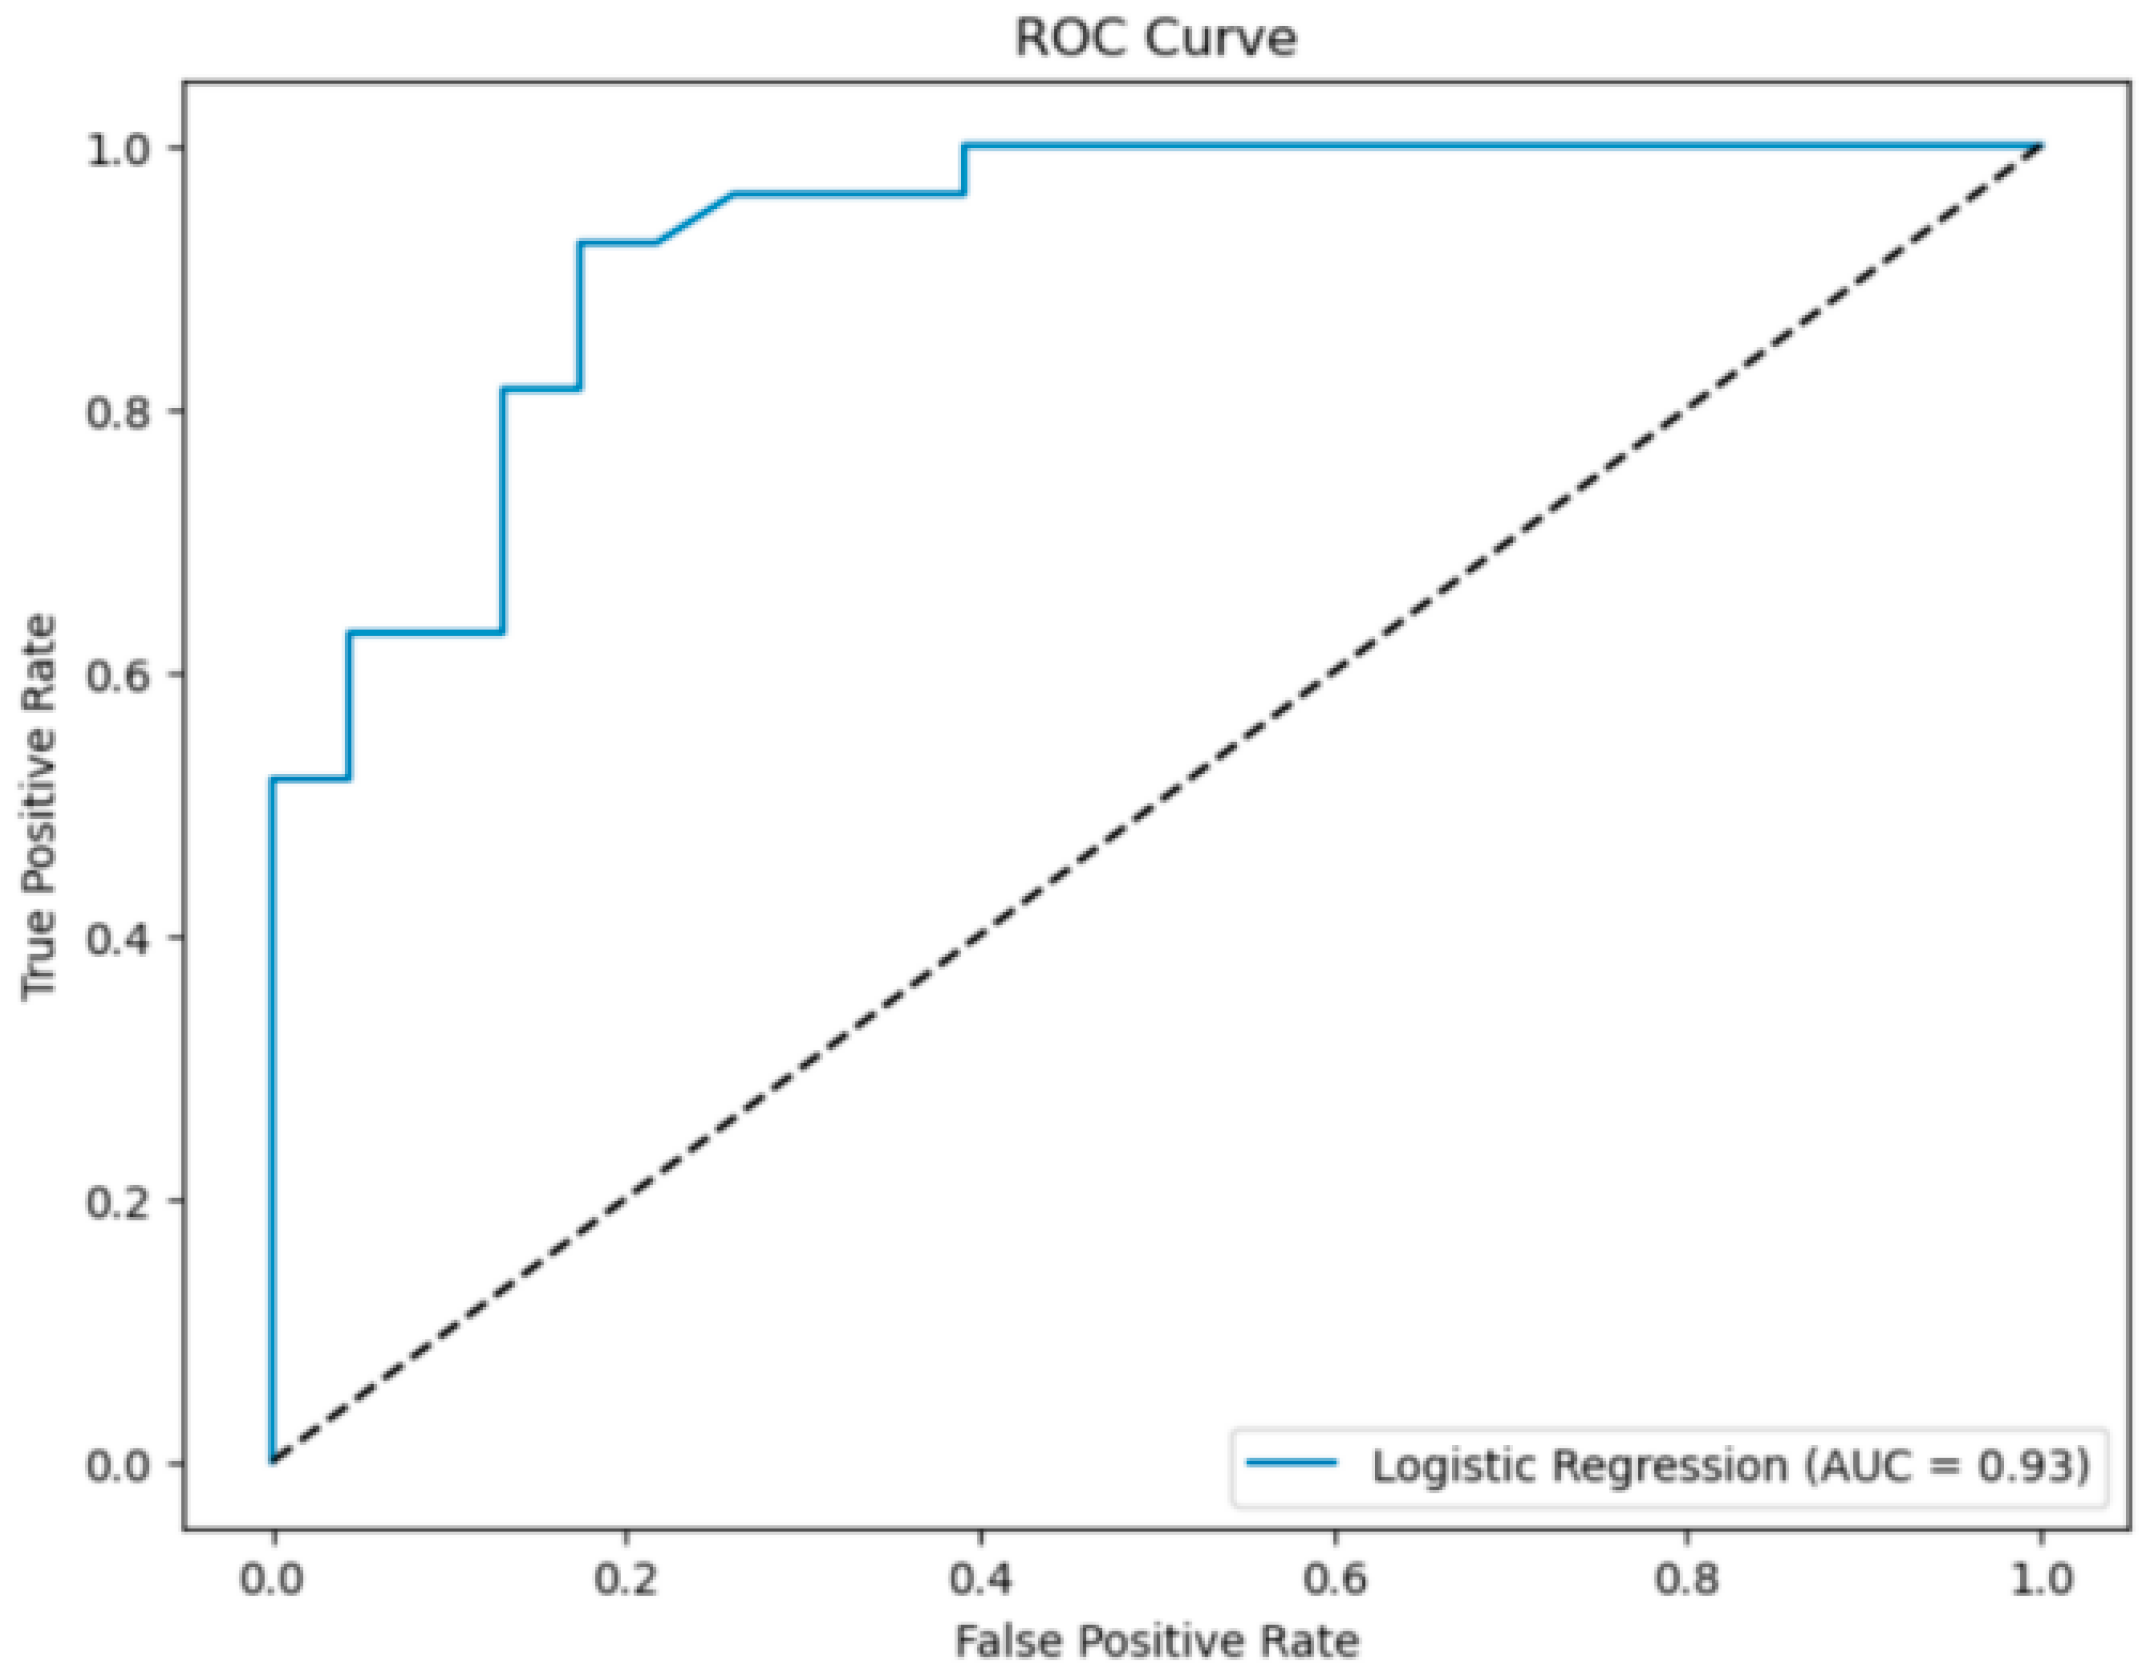
The vegetation-fused data model achieved an AUC value of 0.93. Comparing models with and without vegetation-fused data, the introduction of the two vegetation fusion parameters—total vegetation cover and leaf area index weight—improved the AUC by 0.02. This indicates that the fused total vegetation cover and leaf area index weight collectively capture both fuel load and canopy flammability, making these integrated indicators more suitable for lightning–fire prediction models across multiple vegetation types.
In addition to examining vegetation-fused data, this study also investigated the impact of three different modeling approaches—logistic regression, random forest, and tuned random forest—on prediction performance. The evaluation results are presented in Table 7.
Table 7.
Evaluation of different alternative models.
The tuned random forest model achieved an accuracy of 0.86 and an AUC of 0.93, both of which are higher than those of the baseline random forest model and the logistic regression model. This result demonstrates that the random forest model, leveraging its nonlinear modeling capability and resistance to overfitting, is better suited for predicting lightning-ignited fires across multiple vegetation types. Moreover, parameter tuning further enhanced model performance by optimizing key hyperparameters and sampling strategies [32].
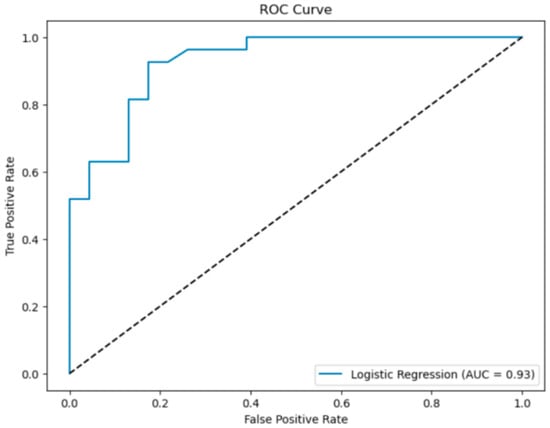
The ROC curve of the best-performing model—the tuned random forest with vegetation-fused data—is shown in Figure 4.
Figure 4.
ROC curve of the optimal model.
4.4. Analysis of Driving Factors Based on Random Forest Feature Importance (Table 8)
To explore the relative contributions of different variables to lightning-ignited fire occurrence, feature importance was evaluated using the tuned random forest model with vegetation-fused parameters. The importance values were calculated using the mean decrease in impurity (MDI), which reflects the extent to which each feature contributes to reducing classification uncertainty within the ensemble. It should be noted that MDI importance represents the role of variables within the model structure and does not necessarily imply direct physical causality.
Table 8.
Analysis of driving factors based on random forest feature importance.
The importance ranking indicates that hourly maximum temperature contributed the largest share of the total model importance, followed by leaf area index weight, precipitation, wind components, lightning intensity, total vegetation cover, and lightning altitude. In contrast, categorical variables such as vegetation type, lightning polarity, and lightning type exhibited relatively lower importance values.
Temperature emerged as the most influential variable within the model. This result is consistent with the general understanding that higher temperatures are associated with lower fuel moisture and enhanced convective activity, both of which may increase the likelihood of lightning-ignited fires. However, it should be emphasized that the importance value reflects the predictive contribution of temperature within the model rather than a direct causal relationship.
Vegetation-related variables also ranked among the top predictors. The leaf area index weight showed high importance, suggesting that the structural characteristics of vegetation may provide useful information for distinguishing ignition-prone conditions. Similarly, total vegetation cover contributed to model performance, indicating that aggregated measures of fuel availability can enhance predictive capability. These findings support the use of vegetation fusion parameters as compact descriptors of fuel conditions across heterogeneous landscapes.
Precipitation and wind components showed moderate importance values. These variables are closely linked to fuel moisture dynamics and atmospheric conditions associated with convective storms. While precipitation generally increases fuel moisture, short-term rainfall followed by warm conditions may lead to rapid drying of fine fuels. Wind components may influence both fuel drying and the early spread of smoldering fires. Nevertheless, these interpretations should be viewed cautiously, as the importance values reflect statistical associations within the dataset rather than direct mechanistic processes.
Lightning-related variables, including lightning intensity and altitude, exhibited lower importance compared with meteorological and vegetation variables. This suggests that, within the present modeling framework, environmental conditions may provide stronger predictive signals than lightning electrical characteristics alone. However, this result may also be influenced by the limited sample size and the resolution of available lightning parameters.
Categorical variables such as vegetation type, lightning polarity, and lightning type showed comparatively small importance values. This outcome may indicate that continuous environmental variables provide more detailed information for classification than categorical descriptors. It may also reflect the effect of vegetation fusion parameters, which summarize vegetation conditions into continuous indicators and thereby reduce the reliance on discrete vegetation categories.
Overall, the feature importance analysis suggests that the predictive performance of the model is primarily associated with a combination of thermal conditions, vegetation structure, and moisture-related variables. However, these results should be interpreted as model-based importance rather than definitive physical drivers. The importance rankings are influenced by the specific dataset, feature engineering strategy, and model configuration used in this study. Further validation using larger datasets, additional years, and alternative modeling approaches would be beneficial for confirming the robustness of these findings.
5. Conclusions and Discussion
This study proposes a semi-automated lightning–fire alignment framework based on spatiotemporal indexing and vegetation-adaptive weighting, and evaluates a random forest model for predicting lightning-ignited fires across multiple vegetation types. Using multi-source datasets, including lightning observations, satellite-detected fires, meteorological reanalysis data, and land-cover information, the proposed approach enables consistent alignment of lightning and fire events and provides a basis for regional-scale ignition modeling.
The results indicate that the spatiotemporal alignment method can effectively identify likely lightning-ignited fire events under different vegetation conditions. After vegetation and historical-fire filtering, the number of suspected lightning-ignited fire points was reduced substantially, indicating that the proposed alignment strategy can mitigate the influence of human-induced fires, particularly in cropland areas. The alignment framework showed high agreement within the labeled dataset in forest and grassland regions, demonstrating its applicability in heterogeneous landscapes.
The results suggest that the proposed vegetation fusion indicators—total vegetation cover and leaf area index weight—provide additional information related to fuel structure and availability. These variables improved model performance across different vegetation types, indicating that simplified vegetation descriptors can effectively capture key aspects of fuel conditions. Previous lightning-ignition prediction studies typically reported AUC values ranging from approximately 0.75–0.90, depending on the study region, data availability, and modeling approach. The performance obtained in this study (AUC ≈ 0.93) falls within the upper range of these reported results. However, direct comparison should be interpreted cautiously because of differences in datasets, spatial scales, and sample sizes across studies.
From a management perspective, the results highlight differences in lightning–fire behavior across fuel types. In forested areas, longer smoldering periods and greater fuel continuity suggest the importance of extended monitoring windows following lightning events. In grassland areas, where ignition and spread occur more rapidly, short-term monitoring under high-temperature and strong-wind conditions may be more critical. In cropland regions, the influence of human-induced fires remains substantial, and the use of historical-fire filtering or management-based screening may help reduce false detections and improve attribution accuracy.
Compared with previous lightning–fire studies that rely on fixed spatiotemporal windows or single vegetation-type assumptions, the proposed framework introduces a vegetation-adaptive alignment strategy and compact vegetation fusion indicators. This approach provides a practical compromise between physical interpretability and model simplicity, and may be particularly useful in regions with heterogeneous land-cover mosaics. Unlike probabilistic, Bayesian, or dynamic-window approaches, this study does not aim to introduce a new matching paradigm. Instead, it adopts and adapts an established index-based alignment framework [6] and focuses on improving its applicability across heterogeneous vegetation types. The results are broadly consistent with previous findings that meteorological factors, especially temperature, wind, and precipitation, play dominant roles in lightning–fire occurrence, while vegetation structure influences ignition probability through fuel continuity and moisture dynamics.
However, several limitations should be acknowledged. First, the number of labeled lightning–fire events used for model development remains relatively small. This is mainly due to the rarity of lightning-ignited fires and the limited availability of reliable fire records in many regions of China, particularly in remote forest areas. Although the alignment workflow was applied to a large initial dataset (approximately 370,000 lightning records and over 20,000 fire detections), only a limited number of confidently aligned samples were retained after screening. Consequently, the reported predictive performance may be optimistic and should be interpreted as exploratory rather than definitive evidence of model robustness. Further validation using independent datasets with broader spatial and temporal coverage is therefore required.
Second, the alignment results may be influenced by the predefined candidate weight ranges, which reflect prior assumptions regarding ignition likelihood across land-cover types and historical fire occurrence. Although cross-validation was used to optimize parameter selection, alternative prior ranges may lead to slightly different alignment outcomes.
Third, uncertainty and sensitivity are partly reflected in the grid-search-based parameter calibration. Multiple candidate weight ranges and decision thresholds were evaluated during cross-validation, and similar classification performance was observed across neighboring parameter settings. This suggests that the alignment results are relatively stable within the tested parameter space. However, broader sensitivity analyses using alternative weight ranges and independent datasets would be beneficial for further assessing uncertainty.
Forth, although the random forest model demonstrates strong classification performance within the study dataset, potential overfitting and uncertainty cannot be completely excluded due to the limited sample size. In addition, feature importance values derived from the model represent predictive contributions rather than direct causal relationships between environmental variables and ignition processes.
In addition, the current framework does not explicitly account for seasonal fuel dynamics or detailed phenological changes. While the meteorological and vegetation datasets partially reflect seasonal variation, the model does not incorporate explicit indicators of live fuel moisture or phenological transitions, which may influence ignition probability.
Finally, although the proposed workflow is automated in terms of data processing and alignment scoring, its performance has been evaluated under the conditions of this study only. Before operational, real-time deployment, the framework would require additional validation using real-time data streams, latency analysis, and prospective testing. Therefore, the present results should be interpreted as demonstrating the potential of the proposed framework to support regional lightning–fire risk assessment and early-warning applications when integrated into an operational workflow, rather than as evidence of a fully operational real-time system. Therefore, the current results should be regarded as exploratory, and multi-year external validation is essential before operational deployment.
Overall, this study provides a methodological framework and exploratory demonstration of lightning–fire alignment and prediction under limited labeled data conditions. The proposed approach may support regional lightning–fire risk assessment and contribute to the integration of multi-source environmental data in wildfire monitoring and management applications.
Author Contributions
Methodology, Y.Z.; resources, Y.Z. and C.Z.; software, Y.Z. and L.S.; writing, Y.Z.; format calibration, Y.T., F.Z., C.Z. and J.D. All authors have read and agreed to the published version of the manuscript.
Funding
This research was funded by the National Key R&D Program of China under Grant 2023YFC3006805.
Data Availability Statement
The lightning dataset used in this study was provided by the Institute of Forest Ecology, Environment and Protection, Chinese Academy of Forestry, and is subject to institutional data-sharing restrictions. The dataset has not been publicly released and cannot be distributed by the authors. Requests for access to the lightning data should be directed to the data-providing institution, subject to their approval and data-sharing policies. Other datasets used in this study are publicly available from the sources cited in the manuscript.
Acknowledgments
The authors would like to thank the Beijing Forestry University and the National Natural Science Foundation of China for their support, as well as all those who provided invaluable comments on this article. Additionally, the authors acknowledge the Beijing Super Cloud Center (BSCC) for providing HPC resources that contributed to the research results reported in this paper.
Conflicts of Interest
The authors declare no conflicts of interest.
References
- Jones, M.W.; Finney, D.L.; Werf, G.R.; Veraverbeke, S. Extratropical forests increasingly at risk due to lightning fires. Nat. Geosci. 2023, 16, 1136–1144. [Google Scholar] [CrossRef] [Scilit]
- Veraverbeke, S.; Rogers, B.M.; Goulden, M.L.; Jandt, R.R.; Miller, C.E.; Wiggins, E.B.; Randerson, J.T. Lightning as a major driver of recent large fire years in North American boreal forests. Nat. Clim. Change 2017, 7, 529–534. [Google Scholar] [CrossRef] [Scilit]
- Wotton, B.M.; Martell, D.L. A lightning fire occurrence model for Ontario. Can. J. For. Res. 2005, 35, 1389–1401. [Google Scholar] [CrossRef] [Scilit]
- Moris, J.V.; Conedera, M.; Nisi, L.; Bernardi, M.; Cesti, G.; Pezzatti, G.B. Lightning-caused fires in the Alps: Identifying the igniting strokes. Agric. For. Meteorol. 2020, 290, 108022. [Google Scholar] [CrossRef] [Scilit]
- Abatzoglou, J.T.; Williams, A.P. Impact of anthropogenic climate change on wildfire across western US forests. Proc. Natl. Acad. Sci. USA 2016, 113, 11770–11775. [Google Scholar] [CrossRef] [Scilit]
- Nadeem, K.; Taylor, S.W.; Woolford, D.G.; Dean, C.B. Mesoscale spatiotemporal predictive models of daily human- and lightning-caused wildland fire occurrence in British Columbia. Int. J. Wildland Fire 2019, 29, 11–27. [Google Scholar] [CrossRef] [Scilit]
- Alonso-Betanzos, A.; Fontenla-Romero, O.; Guijarro-Berdiñas, B.; Hernández-Pereira, E.; Jiménez, E.; Legido, J.L.; Carballas, T. An intelligent system for forest fire risk prediction and fire fighting management in Galicia. Expert Syst. Appl. 2003, 25, 545–554. [Google Scholar] [CrossRef] [Scilit]
- Sevinc, V.; Kucuk, O.; Goltas, M. A Bayesian network model for prediction and analysis of possible forest fire causes. For. Ecol. Manag. 2020, 457, 117723. [Google Scholar] [CrossRef] [Scilit]
- Zhou, Q.; Zhang, H.; Zhang, Q.; Zhao, P.; Nuo, M.; Wang, J.; Gao, J.; Zhao, M.; Yang, Z. Identification and prediction models of driving factors for forest fires in Daxing’an Mountains of Inner Mongolia, northern China. J. For. Res. 2020, 31, 1523–1536. [Google Scholar]
- Jain, P.; Coogan, S.C.P.; Subramanian, S.G.; Crowley, M.; Taylor, S.W.; Flannigan, M.D. A review of machine learning applications in wildfire science and management. Environ. Rev. 2020, 28, 478–505. [Google Scholar] [CrossRef] [Scilit]
- Pausas, J.G.; Keeley, J.E. A burning story: The role of fire in the history of life. BioScience 2019, 69, 593–601. [Google Scholar] [CrossRef] [Scilit]
- Hall, J.V.; Loboda, T.V.; Giglio, L.; McCarty, G.W. A MODIS-based burned area assessment for Russian croplands: Mapping requirements and challenges. Remote Sens. Environ. 2016, 184, 506–521. [Google Scholar] [CrossRef] [Scilit]
- Forkel, M.; Dorigo, W.; Lasslop, G.; Chuvieco, E.; Hantson, S.; Heil, A.; Teubner, I.; Thonicke, K.; Harrison, S.P. Recent global and regional trends in burned area and their compensating environmental controls. Environ. Res. Commun. 2019, 1, 51005. [Google Scholar] [CrossRef] [Scilit]
- Kane, V.R.; Lutz, J.A.; Alina Cansler, C.; Povak, N.A.; Churchill, D.J.; Smith, D.F.; Kane, J.T.; North, M.P. Water balance and topography predict fire and forest structure patterns. For. Ecol. Manag. 2015, 338, 1–13. [Google Scholar] [CrossRef] [Scilit]
- Wu, Z.; He, H.S.; Yang, J.; Liu, Z.; Liang, Y. Relative effects of climatic and local factors on fire occurrence in boreal forest landscapes of northeastern China. For. Ecol. Manag. 2014, 493, 472–480. [Google Scholar] [CrossRef] [Scilit]
- Lu, Z.; Hou, S.; Zhou, Y.; Hu, B. Analysis of Temperature Change Characteristies in Daxinganling Region in the Last 30 Years. Heilongjiang Meteorol. 2023, 40, 22–24. [Google Scholar]
- Yu, J.; Feng, Y.; Gao, C.; He, X.; Yu, G. Path of scientific development in Greater Khingan Mountains area of Heilongjiang Province, China. Chin. J. Appl. Ecol. 2025, 36, 2535–2540. [Google Scholar]
- Zhang, H.; Wang, W.; Wang, A.; Li, P.; Ban, Q. Spatial and Temporal Dynamics of Wildfires in Yunnan Province Based on Remote Sensing Data from 2001 to 2020. J. Southwest For. Univ. 2025, 45, 141–148. [Google Scholar]
- Schroeder, W.; Oliva, P.; Giglio, L.; Csiszar, I.A. The New VIIRS 375 m active fire detection data product: Algorithm description and initial assessment. Remote Sens. Environ. 2014, 143, 85–96. [Google Scholar] [CrossRef] [Scilit]
- Yang, J.; Huang, X.; Li, X.; Li, X.; Huang, J. China’s 30 m annual land cover dataset and its dynamics from 1990 to 2019. Earth Syst. Sci. Data 2021, 13, 3907–3925. [Google Scholar] [CrossRef] [Scilit]
- Hersbach, H.; Bell, B.; Berrisford, P.; Hirahara, S.; Horányi, A.; Muñoz-Sabater, J.; Nicolas, J.; Peubey, C.; Radu, R.; Schepers, D.; et al. The ERA5 global reanalysis. Q. J. R. Meteorol. Soc. 2020, 146, 1999–2049. [Google Scholar] [CrossRef] [Scilit]
- Fan, M.; Fan, H.; Li, X. A parallel computing model for forest fire forecast. Eng. J. Wuhan Univ. 2024, 47, 135–140. [Google Scholar]
- Liu, S.; Lv, J.; Wang, S. A primitive study of fire detection method based on data fusion and BP neural network. Appl. Sci. Technol. 2011, 38, 9–12. [Google Scholar]
- Lin, Y.; Jin, F.; Wang, S.; Zuo, X.; Dai, L.; Huang, Z. Multi-branch and Dual-task Method for Road Extraction from Multimodal Remote Sensing Images. J. Geo-Inf. Sci. 2024, 26, 1547–1561. [Google Scholar]
- Atrey, P.K.; Hossain, M.A.; El Saddik, A.; Kankanhalli, M.S. Multimodal fusion for multimedia analysis: A survey. Multimed. Syst. 2020, 26, 345–379. [Google Scholar] [CrossRef] [Scilit]
- Wang, N.; Tian, J.; Tian, Q. A method for reconstructing long-term daily resolution EVIs based on MODIS daily surface reflectance products. Natl. Remote Sens. Bull. 2024, 38, 969–980. [Google Scholar] [CrossRef] [Scilit]
- Si, L.; Wang, M.; Chen, F.; Shu, L.; Zhao, F.; Li, W. Distribution Characteristics of Lightning and the Warning of Lightning-Caused Forest Fires. Sci. Silvae Sin. 2023, 59, 1–8. [Google Scholar]
- Xing, C.; Liang, J.; Jin, H.; Xu, J.; Wu, H. Multi-objective exam paper generation guided by reinforcement learning and matrix completion. J. Comput. Appl. 2025, 45, 48–58. [Google Scholar]
- Jiao, Y.; Han, Z.; Wang, W.; Liu, D.; Pan, P.; Li, B.; Zhang, N.; Wang, P.; Tao, J.; Fan, M. Driving Factors and Forecasting Model of Lightning-Caused Forest Fires in Daxing’anling Mountains Based on Multi-Sources Data and Machine Learning Method. Sci. Silvae Sin. 2023, 59, 74–87. [Google Scholar]
- Si, L.; Li, W.; Wang, M.; Shu, L.; Yuan, S.; Li, W.; Zhang, H.; Shi, Y.; Zhou, N. Characteristics of Temporal and Spatial Variations of Lightning in China’s Key Forest Areas. Sci. Silvae Sin. 2023, 61, 50–62. [Google Scholar]
- Zang, R.; Shu, L.; Wang, M.; Zhao, F.; Tong, X.; Si, L.; Chen, F. Analysis of spatial and temporal distribution and driving factors of lightning-caused fires in Daxing’anling forest region of Heillongjiang. J. Northwest AF Univ. (Nat. Sci. Ed.) 2022, 50, 64–76. [Google Scholar]
- Zeng, Q. Forest fire prediction in Guizhou province based on machine learning algorithm. For. Constr. 2025, 43, 48–54. [Google Scholar]

Disclaimer/Publisher’s Note: The statements, opinions and data contained in all publications are solely those of the individual author(s) and contributor(s) and not of MDPI and/or the editor(s). MDPI and/or the editor(s) disclaim responsibility for any injury to people or property resulting from any ideas, methods, instructions or products referred to in the content. |
© 2026 by the authors. Licensee MDPI, Basel, Switzerland. This article is an open access article distributed under the terms and conditions of the Creative Commons Attribution (CC BY) license.