


Abstract
Accurate, high-resolution information on economic forest resources, here referring to fruit-tree plantations and economic tree crops, is essential for land-use planning and resource management in arid regions. Xinjiang, China—one of the country’s most important fruit-producing areas—exhibits highly fragmented and heterogeneous distributions of economic tree plantations, posing challenges for large-scale and long-term monitoring. In this study, we integrated multi-source remote sensing data by combining multi-temporal Sentinel-2 optical imagery with Sentinel-1 SAR backscatter and texture features to characterize the spatial and temporal distribution patterns of major economic tree plantations from 2019 to 2024. An optimized Random Forest classifier was applied across five key production regions (Aksu, Bazhou, Hotan, Kashgar, and Turpan–Hami). The mapping results achieved overall accuracies ranging from 0.85 to 0.97, with Kappa coefficients between 0.80 and 0.95. The results indicate that economic tree plantations are predominantly distributed along oasis corridors of the Tarim Basin and the alluvial plains on both sides of the Tianshan Mountains, forming belt- and patch-like spatial patterns. While the overall spatial configuration remained relatively stable during the study period, localized expansion was observed, mainly associated with walnut, jujube, and grape plantations. These findings provide insights into the spatial dynamics of economic tree plantations and support land-use optimization and agricultural planning in arid and semi-arid regions.
1. Introduction
Accurate knowledge of the spatial distribution of economic forest resources, here referring to fruit-tree plantations and other economically cultivated tree crops, is essential for land-use planning, agricultural management, and ecosystem service assessment in arid and semi-arid regions [1]. Unlike natural or semi-natural forests, economic forests are intensively managed production systems primarily established for fruits, nuts, medicinal materials, and other commercial products [2]. These systems play an increasingly important role in improving rural livelihoods, optimizing land-use patterns [3], and enhancing ecosystem resilience under climate stress [4]. China is currently the world’s largest producer of economic forests, with a planting area exceeding 50 million hectares, making these systems a key component of national agricultural development and regional ecological strategies.
Xinjiang Uyghur Autonomous Region is one of China’s most distinctive economic forest production areas, well known for large-scale cultivation of fruit-tree plantations such as jujube, walnut, and grape. Shaped by an arid to semi-arid continental climate, strong diurnal temperature variation, and river-fed oasis systems, agricultural production in Xinjiang is highly concentrated within oasis–desert ecotones, resulting in characteristic belt- and patch-like distributions of economic tree plantations [5]. However, complex topography, heterogeneous land-cover backgrounds, and intensive human management have produced highly fragmented plantation landscapes [6]. Plantation patch sizes vary considerably, and their spectral and structural signals are strongly influenced by irrigation conditions, soil properties, phenological stages, and surrounding non-vegetated surfaces [7]. These characteristics pose substantial challenges for large-scale species-level mapping and long-term monitoring of economic forests, particularly under the dual pressures of ecological conservation and high-quality agricultural development.
Recent advances in remote sensing have substantially improved the identification and monitoring of economic forest plantations. Early studies primarily relied on medium- to low-resolution optical sensors such as MODIS and Landsat [8], which were effective for regional-scale vegetation mapping but often insufficient for distinguishing fragmented and spectrally heterogeneous orchard systems. With the availability of high-resolution imagery from Sentinel-2, PlanetScope, and the Gaofen series, finer discrimination of fruit-tree plantations has become feasible, particularly by exploiting spectral and phenological characteristics [9]. However, optical data alone remain sensitive to cloud contamination and are often insufficient to capture structural differences among tree species under complex background conditions [10]. To address these limitations, an increasing number of studies have incorporated Sentinel-1 synthetic aperture radar (SAR) data, demonstrating that radar backscatter and texture features provide complementary information related to canopy structure, surface roughness, and moisture conditions, thereby improving classification accuracy in orchard and agroforestry systems [11]. Furthermore, incorporating multi-temporal features has proven effective for enhancing tree species discrimination by capturing phenological differences among crops and perennial plantations [12,13]. Meanwhile, comparing remote sensing imagery acquired in different months and exploiting phenological differences between crops and perennial fruit trees during key growth stages has been shown to effectively improve species discrimination. However, under multi-source data conditions, the increasing number of features may introduce redundancy and reduce model robustness. Therefore, feature selection methods such as recursive feature elimination (RFE), minimum redundancy maximum relevance (mRMR), and Boruta are widely applied to identify informative features and mitigate the curse of dimensionality in high-dimensional remote sensing applications [14]. In terms of classification algorithms, traditional machine learning approaches, including Random Forest (RF) and Support Vector Machine (SVM), remain widely used due to their strong performance with limited training samples and heterogeneous input features [15,16]. Although deep learning models (e.g., convolutional neural networks and Transformers) have demonstrated strong potential for vegetation mapping, their application at regional scales is often constrained by large data requirements and high computational costs [17]. Meanwhile, cloud-computing platforms such as Google Earth Engine (GEE) have greatly enhanced the feasibility of processing multi-source and multi-temporal remote sensing datasets at regional to continental scales [18]. Nevertheless, many existing studies still focus on single species, short time periods, or localized study areas, while comprehensive frameworks that jointly address multi-species composition, long-term dynamics, and regional heterogeneity remain limited—particularly in arid oasis–desert transition zones such as Xinjiang.
To address these gaps, this study focuses on five major economic forest production regions in Xinjiang, China. Using multi-temporal Sentinel-1 and Sentinel-2 imagery from 2019 to 2024, we constructed a multi-source feature space integrating optical, radar, and environmental variables. An optimized Random Forest classifier, combined with recursive feature elimination (RFE) for feature optimization and the tree-structured Parzen estimator (TPE) for hyperparameter tuning, was applied to map dominant economic forest species and analyze their spatial and temporal dynamics. The specific objectives of this study are to:
- (1)
- construct optimized feature sets for major economic forest species in Xinjiang using multi-source remote sensing data and RFE;
- (2)
- identify region-specific optimal temporal phases and model parameters using TPE-optimized RF to support multi-temporal mapping and area estimation from 2019 to 2024; and
- (3)
- characterize the spatial distribution patterns and area changes of major economic forest types across five production regions, and examine their temporal variations during the study period.
This study provides a regionally consistent framework for monitoring economic forest dynamics in arid oasis–desert ecotones and offers methodological insights for large-scale, multi-species agricultural mapping using multi-source remote sensing data.
2. Materials and Methods
2.1. Study Area Overview
The Xinjiang Uygur Autonomous Region, located in northwestern China at the core of the Eurasian continent, is characterized by a temperate continental climate with arid conditions, scarce precipitation, abundant sunshine, and pronounced diurnal temperature variations [19]. These environmental conditions provide favorable light–heat resources for fruit tree cultivation and have made Xinjiang one of China’s most important production bases for economic forests, particularly within oasis agricultural systems.
In this study, five major economic forest production regions were selected: Bayingolin Mongol Autonomous Prefecture (Bazhou), the Turpan–Hami region (Tuha), Aksu Prefecture, Kashgar Prefecture, and Hotan Prefecture (Figure 1). Together, these regions represent the core fruit-producing areas of Xinjiang, encompassing diverse geomorphological settings, climatic gradients, and oasis structures, as well as distinct planting patterns and species compositions. This study focuses on six major economic forest species in Xinjiang: apple (Malus domestica), apricot (Prunus armeniaca), pear (Pyrus spp.), jujube (Ziziphus jujuba), grape (Vitis vinifera), and walnut (Juglans regia). These species represent the most widely cultivated fruit trees in Xinjiang, account for a substantial proportion of the region’s total economic forest planting area, and form the backbone of its fruit-based agricultural economy. Moreover, these species exhibit pronounced differences in canopy structure, phenological characteristics, and management practices, making them well suited for evaluating the effectiveness and generalizability of multi-source remote sensing–based classification approaches across heterogeneous oasis landscapes.
Figure 1.
Location of the study area in Xinjiang, China, showing the five representative economic forest production regions: Aksu, Bayingolin Mongol Autonomous Prefecture (Bazhou), Hotan, Kashgar, and Turpan-Hami (Tuha). Colored symbols represent the dominant economic forest species: purple = Apple, orange = Apricot, red = Jujube, green = Pear, and brown = Walnut. Panels (af) present typical sample site imagery for major economic forest species with corresponding acquisition dates: (a) Pear (June 2024), (b) Walnut (July 2024), (c) Apple (September 2023), (d) Apricot (November 2023), (e) Grape (May 2024), and (f) Jujube (July 2024).
2.2. Sample Data
The sample data used in this study were compiled from two primary sources.
(1) Institutional datasets: Survey records provided by the Xinjiang Academy of Forestry Sciences, including georeferenced sample points of major economic forest species such as apple, apricot, grape, jujube, pear, and walnut. These datasets were collected between 2015 and 2025 and cover representative economic forest production areas across Xinjiang. The institutional survey data were primarily used to support sample interpretation, species identification, and regional representativeness, rather than to directly infer temporal changes.
(2) Field investigations: To supplement and validate the institutional datasets, six field surveys were conducted between 2023 and 2025 in major fruit-producing regions, including Hami, Turpan, Aksu, Korla, Kashgar, Hotan, and Bayingolin. Field observations focused on dominant economic forest species and resulted in a total of 2860 valid georeferenced sample points. These field samples were primarily used for classifier training and accuracy assessment.
To ensure the accuracy and reliability of the data, all multi-source samples have undergone strict quality control procedures. Through manual interpretation and attribute consistency checks, samples with inaccurate spatial positioning, inconsistent tree species attributes, or duplicate records were eliminated. During the sample set construction process, the economic forest planting structure and area proportions in different regions were comprehensively considered, and a stratified sampling strategy by region was adopted to reduce sample bias. Finally, a representative sample data set covering the main economic forest tree species and production areas was formed. The details of the regional and tree species distribution are shown in Table A1.
2.3. Sentinel-2 Optical Data and Preprocessing
In this study, Sentinel-2 Level-2A products were used as the primary optical remote sensing data source. With a spatial resolution of 10 m and a revisit cycle of 5 days, Sentinel-2 imagery is well suited for regional-scale vegetation mapping and month-specific classification analysis [20]. The data were accessed via the Google Earth Engine (GEE) platform and covered the main growing seasons of economic forest species from 2019 to 2024. The Level-2A products had been atmospherically corrected and included a Scene Classification Layer (SCL), which was used to mask clouds, cloud shadows, water bodies, and snow. Based on the quality-controlled imagery, annual median composites were generated to obtain stable and consistent yearly representations of surface conditions, which were subsequently clipped to the study area. For spectral feature extraction, ten Sentinel-2 bands (B2–B4, B5–B7, B8, B8A, B11, and B12) were selected, covering the visible, red-edge, near-infrared, and shortwave infrared regions [21]. These bands provide complementary spectral information related to vegetation vigor, canopy properties, moisture conditions, and soil background, and served as the primary spectral inputs for subsequent feature construction and classification.
2.4. Sentinel-1 SAR Data and Texture Feature Extraction
Polarimetric synthetic aperture radar (SAR) data provide complementary information on vegetation structure, spatial arrangement, and surface moisture conditions, effectively mitigating spectral confusion and cloud contamination commonly encountered in optical remote sensing. Consequently, SAR data have been widely applied to enhance the stability and discriminative capability of economic forest classification [22]. In this study, Sentinel-1 Interferometric Wide (IW) mode data were employed, including VV and VH polarization channels with a spatial resolution of 10 m. To obtain stable radar representations, median composites of VV and VH backscatter were generated using the Google Earth Engine (GEE) platform (accessed in 2024). The two polarization channels were retained as basic radar features [23]. To further characterize structural heterogeneity among economic forest species, gray-level co-occurrence matrix (GLCM) texture features were derived from the VV and VH bands [24]. After normalization and gray-level quantization, a 4 4 moving window was applied to extract 18 commonly used GLCM texture metrics for each polarization, including angular second moment, contrast, correlation, variance, inverse difference moment, entropy, dissimilarity, inertia, and related measures (Table A2). Considering both VV and VH polarizations, a total of 36 texture features were generated. The 4 4 window size has been widely used in previous studies on vegetation and land cover classification based on SAR, and it matches the spatial resolution of 10 m of Sentinel-1 data [25,26].The extracted SAR texture features from this can effectively characterize the structural changes and spatial heterogeneity of economic forest canopies and serve as important input features for the classification model.
2.5. Topographic Variables and Spectral Indices
To provide complementary environmental and surface information beyond the original spectral bands, topographic variables and spectral indices were incorporated to construct a multidimensional feature space for economic forest classification [27]. In this study, three terrain-related variables and eleven optical indices were considered as auxiliary features. Topographic variables were derived from the Shuttle Radar Topography Mission (SRTM) digital elevation model (SRTMGL1_003) provided by the United States Geological Survey. Based on this dataset, elevation-derived attributes including slope, aspect, and hillshade were calculated to represent terrain variability across the study area [28]. All topographic layers were resampled to a spatial resolution of 10 m and co-registered with the Sentinel-2 optical and Sentinel-1 SAR datasets to ensure spatial consistency.
In addition, eleven widely used vegetation and surface indices were calculated from Sentinel-2 imagery to characterize differences in vegetation vigor, canopy physiological condition, canopy structure, soil background, and built-up or bare surface conditions. These indices include NDVI, EVI, NDWI, NDBI, BSI, IBI, REP, SSI, DVI, RVI, and GCVI (Table A3), and have been widely applied in agricultural and vegetation classification studies [29]. Specifically, NDVI and EVI were used to describe overall vegetation vigor and fractional cover [30]; red-edge–based indices such as REP were included to capture chlorophyll-related and physiological differences among tree species; and greenness- or productivity-related indices such as GCVI were employed to characterize variations in canopy greenness and photosynthetic capacity [31]. Other indices (e.g., NDWI, BSI, IBI, SSI) were included to account for moisture conditions and background heterogeneity commonly observed in oasis–desert transition zones. The inclusion of these indices was intended to enrich the candidate feature set, while their relative importance and redundancy were subsequently evaluated through the recursive feature elimination (RFE) procedure, ensuring that only indices providing additional discriminatory information were retained in the final regional feature subsets.
2.6. Random Forest Classification Framework
In this study, a Random Forest (RF) classification framework was employed to integrate multi-source remote sensing features for economic forest mapping. The multi-source remote sensing features include Sentinel-2 optical imagery, Sentinel-1 SAR data, and topographic variables derived from a digital elevation model (DEM). The framework combines feature selection and hyperparameter optimization procedures to support stable model construction and consistent classification performance across regions. The overall workflow includes multi-source feature assembly, feature selection, hyperparameter tuning, model training, and spatial mapping, as illustrated in Figure 2.
Figure 2.
Workflow for multi-temporal economic forest mapping using multi-source remote sensing data in Xinjiang.
2.6.1. Construction of Random Forest Classifier
In this study, the Random Forest (RF) algorithm was adopted as the primary classifier for economic forest mapping because it can model nonlinear relationships and handle heterogeneous, high-dimensional inputs commonly encountered in multi-source remote sensing. RF is an ensemble method that combines multiple decision trees trained on bootstrapped samples and random feature subsets, which helps reduce variance and improves model stability in practice [32]. The available samples were randomly split into training and testing subsets using a 7:3 ratio. Stratified sampling was applied to preserve the class proportions in both subsets. The training subset was used for model construction and optimization procedures, whereas the testing subset was reserved for independent accuracy assessment. The initial RF model incorporated all candidate multi-source features as inputs, including Sentinel-2 spectral bands, Sentinel-1 VV/VH backscatter and derived GLCM texture features, topographic variables, and Sentinel-2 spectral indices, resulting in a total of 62 candidate features. Feature importance scores produced by this initial RF model provided the basis for subsequent feature selection.
2.6.2. Recursive Feature Elimination (RFE) Optimization
To reduce feature redundancy and control the dimensionality of the multi-source feature space, Recursive Feature Elimination (RFE) was employed for feature selection [33]. RFE is a wrapper-based selection strategy that iteratively trains a model, ranks features according to an importance criterion, and removes the least informative features in a stepwise manner until a stopping condition is met [34]. In implementation, an RF model with 150 trees (n_estimators = 150), balanced class weights (class_weight = “balanced”), and a fixed random seed (random_state = 42) was used as the estimator for RFE. Starting from the full set of 62 features, the procedure removed one feature per iteration based on the minimum RF importance score. Model performance during the elimination process was monitored using classification accuracy and the Kappa coefficient. To avoid premature termination caused by short-term performance fluctuations during stepwise feature elimination, the RFE process was stopped when classification accuracy showed no improvement over 100 consecutive iterations (patience = 100), indicating stabilization of model performance with respect to feature removal. The feature subset corresponding to the best observed accuracy during the RFE process was retained for subsequent hyperparameter tuning.
2.6.3. TPE-Based Bayesian Hyperparameter Optimization
After feature selection, RF hyperparameters were tuned using the Tree-structured Parzen Estimator (TPE), a Bayesian optimization approach that models the relationship between hyperparameter configurations and an objective function and proposes new configurations by balancing exploration and exploitation [35]. Hyperparameter optimization was conducted exclusively on the training subset using five-fold cross-validation (cv = 5) to evaluate candidate configurations. The search space was defined as follows: n_estimators: 100–500 (step 10), max_depth: 10–200 (step 5), min_samples_split: 2–20 (step 1), min_samples_leaf: 1–10 (step 1), and max_features ∈ {sqrt, log2, None}. A total of 50 evaluations (max_evals = 50) were performed to identify a suitable hyperparameter combination for RF training under the selected feature subset. The optimized RF model was then trained on the full training subset and evaluated on the reserved testing subset.
2.6.4. Model Accuracy Evaluation
Model performance was evaluated using multiple metrics derived from the confusion matrix [36]. Overall Accuracy (OA) was used to summarize the proportion of correctly classified samples. The Kappa coefficient was reported to account for chance agreement. In addition, Producer’s Accuracy (PA) and User’s Accuracy (UA) were calculated to quantify omission and commission errors, respectively, for each class. The F1 score was further used as a balanced metric that integrates precision and recall, which is particularly informative when class frequencies are uneven. Together, these metrics provide a comprehensive evaluation of classification performance across both overall and class-specific perspectives.
2.7. MaxEnt Ecological Suitability Modeling
To support the interpretation of the spatial distribution patterns of economic forest plantations derived from remote sensing classification, a Maximum Entropy (MaxEnt) species distribution model was employed to characterize the potential ecological suitability of major economic forest species [37,38]. The MaxEnt analysis was used as a climate-based suitability reference, enabling a comparative assessment between the mapped plantation distributions and their potential suitable environments, rather than as an independent predictive model of future land-use change.
Occurrence data for MaxEnt modeling were obtained from field survey samples and institutional datasets provided by the Xinjiang Academy of Forestry Sciences. To reduce spatial clustering and sampling bias, presence points were spatially filtered using a minimum separation distance of 1 km, ensuring that at most one occurrence point was retained within each 1 km neighborhood [39]. All occurrence points were spatially aligned with the environmental predictor layers.
Environmental predictors included bioclimatic variables (BIO1–BIO19), topographic factors (elevation, slope, and aspect), and a vegetation indicator (NDVI) (Table A5). Bioclimatic variables were derived from the WorldClim CMIP6 downscaled dataset under the SSP245 scenario for the 2021–2040 period [40,41]. The SSP245 scenario was selected because it represents a moderate emission pathway and provides climatic conditions that are temporally close to the present, making it suitable for assessing near-term ecological suitability in relation to current plantation patterns. All environmental variables were resampled to a consistent spatial resolution of 1 km and spatially co-registered prior to modeling.
MaxEnt modeling was implemented using default feature classes and regularization settings, with background points sampled from the study region to represent available environmental conditions. Model outputs were generated in logistic format, representing relative ecological suitability rather than absolute occurrence probabilities. The resulting suitability maps were overlaid with the 2024 remote sensing–derived economic forest distribution maps to examine spatial correspondence and to assess whether current plantation structures are generally aligned with climatically suitable zones or exhibit potential spatial mismatches (Figure A6, Figure A7, Figure A8, Figure A9 and Figure A10). Given its supporting analytical role, MaxEnt outputs were not incorporated into the quantitative accuracy assessment or area estimation framework. The models were implemented using default settings and without formal validation metrics (e.g., AUC or omission rate assessment), as the outputs were used exclusively for relative suitability comparison and spatial overlay analysis rather than as validated predictive models. Accordingly, comprehensive validation of the MaxEnt models is deferred to future work integrating independent species occurrence data.
3. Results
3.1. Classification Models
3.1.1. Feature Selection for Economic Forest Classification Based on RFE
RFE-based feature selection produced region-specific optimal feature subsets across the five study regions, revealing clear spatial heterogeneity in both selected feature composition and classification performance (Figure 3). Compared with the full feature set, the RFE-optimized subsets consistently achieved higher overall accuracy while using fewer input variables. Among the five regions, Bazhou exhibited the highest overall accuracy (OA = 0.9141), followed by Tuha (0.9019) and Hotan (0.8711). Kashgar (0.8584) and Aksu (0.8107) showed comparatively lower accuracies, indicating differences in class separability across regions. The number of selected features also varied substantially. Aksu required the fewest features (13), dominated by optical spectral bands with limited contributions from vegetation indices and SAR texture features. Bazhou retained 16 features, whereas Hotan selected 24 features. In contrast, Tuha and Kashgar each required 33 features, incorporating a broader combination of optical indices, SAR texture measures, and topographic variables. Overall, the RFE results demonstrate pronounced regional variability in optimal feature dimensionality and composition. Based on these results, subsequent classification and temporal analyses were conducted using the region-specific optimal feature subsets.
Figure 3.
Accuracy and Kappa trends during the RFE process for the five study regions (a–e). Red dashed lines indicate the highest overall accuracy achieved in each region, and green dashed lines denote the corresponding optimal number of selected features. The optimal accuracy/feature-number combinations are as follows: Aksu (0.8107/13), Bazhou (0.9141/16), Hotan (0.8711/24), Kashgar (0.8584/33), and Tuha (0.9019/33).
3.1.2. Optimal Identification Periods Across Regions
Classification performance exhibited clear temporal variability across the five study regions when monthly imagery from the growing season was used (Figure 4). The optimal identification period differed markedly among regions, indicating pronounced regional heterogeneity in temporal classification performance. In Aksu, the highest classification accuracy was achieved in July, with an overall accuracy (OA) of 0.8107 and a Kappa coefficient of 0.7554. In contrast, Bazhou and Hotan reached their peak performance in November, achieving OA values of 0.9141 and 0.8711, and Kappa coefficients of 0.8611 and 0.8078, respectively. Kashgar and Tuha exhibited different temporal patterns, with Kashgar attaining its highest accuracy in March (OA = 0.8584, Kappa = 0.7501) and Tuha peaking in April (OA = 0.9019, Kappa = 0.8501). Overall, the results indicate substantial regional differences in optimal identification periods for economic forest classification. The identified optimal months provide a reference for the most informative phenological window, while the annual maps represent classification results at the yearly scale.
Figure 4.
Monthly variation of Overall Accuracy (OA) and Kappa coefficient for the five study regions based on monthly classification results. Green circles represent Kappa coefficients, blue circles represent overall accuracy (OA), and red circles are used for visual emphasis.
3.1.3. Optimal Model Parameters Across Regions
The optimized Random Forest hyperparameter configurations differed across the five study regions (Table 1), reflecting regional variability in model parameter requirements. For each region, a distinct set of optimal hyperparameters was identified, including the number of trees, maximum tree depth, minimum sample constraints, and feature selection strategy at each split. These region-specific optimal parameter combinations were subsequently adopted for economic forest classification in each study area.
Table 1.
TPE-optimized Random Forest parameters by study area.
3.2. Classification Accuracy Assessment
Using region-specific optimal feature subsets, optimal identification months, and optimized Random Forest hyperparameters, classification performance was evaluated for the five study regions. Overall Accuracy (OA) ranged from 0.8539 to 0.9713, and Kappa coefficients ranged from 0.8012 to 0.9552 (Figure 5). Most economic forest types achieved high classification accuracy, while relatively lower performance in certain classes is closely associated with region-specific misclassification patterns evident in the confusion matrices (Figure 6).
Figure 5.
Species-level classification performance across five sub-regions (a–e), illustrated by Overall Accuracy (OA), Kappa coefficient, User’s Accuracy (UA), Producer’s Accuracy (PA), and F1 Score.
Figure 6.
Normalized confusion matrices for major economic forest species classification in the five study regions.
Bazhou achieved the highest overall performance (OA = 0.9713, Kappa = 0.9552), with consistently high F1 scores across all classes (Apricot: 0.9489; Grape: 0.9655; Jujube: 0.9738; Pear: 0.9764). The confusion matrix indicates minimal inter-class confusion, with the most notable errors involving Grape misclassified as Jujube (6.7%) and Pear misclassified as Jujube (2.3%). Tuha also exhibited high classification accuracy (OA = 0.9595, Kappa = 0.9388). All classes showed strong performance, with F1 scores of 0.9379 for Apricot, 0.9720 for Grape, and 0.9633 for Jujube. Misclassification was limited, primarily involving Grape classified as Apricot (3.2%) and Apricot classified as Jujube (3.8%). Hotan showed stable regional performance (OA = 0.8917, Kappa = 0.8390). Grape, Jujube, and Walnut achieved high F1 scores (0.9139, 0.9018, and 0.9095, respectively), whereas Apricot exhibited comparatively lower accuracy (F1 = 0.7241). The confusion matrix shows that Apricot was most frequently classified as Walnut (25.9%), followed by Jujube (7.4%). Kashgar achieved an OA of 0.8869 with a Kappa coefficient of 0.8012. Grape and Walnut performed strongly (F1 = 0.9655 and 0.9084), while Apricot and Jujube showed comparatively lower F1 scores (0.7795 and 0.8301). Misclassification was dominated by Apricot being classified as Walnut (34.7%) and Jujube being classified as Walnut (19.8%). Aksu recorded the lowest overall accuracy among the five regions (OA = 0.8539, Kappa = 0.8115). Pear and Apple achieved relatively higher F1 scores (0.8958 and 0.8653), whereas Jujube showed comparatively lower performance (F1 = 0.8125). The confusion matrix indicates that the most prominent misclassification involved Jujube classified as Walnut (12.8%) and Apple classified as Walnut (5.3%). In addition, Walnut was occasionally classified as Apricot (3.4%).
3.3. Spatio-Temporal Distribution Patterns of Economic Forests in Xinjiang
Based on annual classification results derived from multi-source remote sensing data for the period 2019–2024, the major economic forest species in Xinjiang (apple, apricot, pear, jujube, grape, and walnut) exhibited highly aggregated and relatively stable spatial distribution patterns. At the regional scale, economic forests were mainly concentrated along the margins of the Tarim Basin, within oasis belts on both the northern and southern slopes of the Tianshan Mountains, and across river-valley alluvial plains. Within these areas, economic forests formed distinct banded or patch-like clusters, particularly along river corridors and oasis margins (Figure 7).
Figure 7.
Spatial distribution maps of major economic forest species in Xinjiang from 2019 to 2024 (a–f).
Clear differences in spatial organization and species composition were observed among the five study regions (Figure A1, Figure A2, Figure A3, Figure A4 and Figure A5). In Aksu Prefecture, economic forests were primarily distributed along piedmont alluvial fans and oasis plains at the southern foot of the Tianshan Mountains, showing an overall east–west alignment. Walnut and jujube were the dominant species, mainly concentrated in counties such as Kuqa and Wensu. Apple formed localized high-density patches in Aksu City and Wensu County, while apricot was mainly distributed in Kuqa, Baicheng, and Wushi. In Bazhou, economic forests followed a belt-shaped distribution along the northern margin of the Tarim Basin oasis corridor, with Korla City serving as the core planting area where multiple fruit species coexisted in mixed patches. Eastward from Korla toward Yuli and Luntai, jujube and apricot exhibited relatively continuous distributions, whereas grape was primarily concentrated in Heshuo County. In Hotan Prefecture, economic forests displayed a linear corridor pattern along the southern edge of the Tarim Basin and were widely distributed across oasis areas, with jujube and walnut as the principal species, while apricot and grape were mainly concentrated in counties such as Pishan, Yutian, and Moyu. In Kashgar Prefecture, economic forests were mainly concentrated within river-valley oases and lowland basin areas, where walnut formed continuous distribution belts along the Kashgar River and its tributaries, and jujube and grape aggregated into dense patches within oasis zones. The Tuha region was characterized by highly concentrated economic forest distributions within the Turpan Basin and surrounding oases, where grape formed extensive, high-density, and continuous dominant patches in Turpan City, Shanshan, and Toksun, while apricot, jujube, and walnut appeared as smaller, fragmented mosaics along basin margins.
From 2019 to 2024, the overall spatial configuration of economic forests in Xinjiang remained relatively stable. The patch structures and boundaries of core oasis planting zones showed strong consistency, with no evidence of large-scale spatial relocation. Nevertheless, localized interannual changes were observed in several regions. In Bazhou, jujube patches in the Yuli–Luntai area expanded between 2023 and 2024, transitioning from fragmented distributions to larger and more contiguous clusters. In Kashgar, walnut cultivation expanded outward between 2021 and 2022, particularly in northern river-valley areas where patches extended toward oasis peripheries. In the Tuha region, grape cultivation exhibited continuous expansion from 2020 to 2024, with increased patch extent and enhanced spatial connectivity along the northern edge of Toksun.
3.4. Area Statistics and Interannual Variations
Based on the classification results from 2019 to 2024, interannual variations in the planting areas of major economic forest species were quantified across the five principal production regions in Xinjiang (Figure 8). Overall, year-to-year fluctuations in planting area were relatively moderate, and the area composition of dominant species remained broadly consistent during the study period, with no obvious structural changes observed (Table A4).
Figure 8.
Interannual changes in planting area (km2) of major economic forest species across five sub-regions of Xinjiang from 2019 to 2024.
In Aksu Prefecture, walnut consistently represented the dominant economic forest species, with planting areas ranging from approximately 1046 to 1963 km2. A relatively low walnut area was observed in 2023. Jujube remained comparatively stable, with planting areas between about 710 and 772 km2. Apple exhibited stage-like variation, reaching a relatively high planting area of approximately 317 km2 in 2022. Apricot and pear occupied smaller planting areas, fluctuating within an approximate range of 100 to 198 km2. In Bazhou, the four major economic forest species showed relatively balanced area distributions. Jujube and pear generally remained within 350–520 km2, whereas grape exhibited more pronounced interannual variability and reached a relatively high planting area in 2020. In Hotan and Kashgar, walnut and jujube were the dominant economic forest species throughout the study period. In Hotan Prefecture, jujube reached a relatively high planting area in 2021 (approximately 645.88 km2), while walnut areas remained generally stable. In Kashgar Prefecture, walnut areas varied only slightly, whereas apricot showed a gradual increase from 2019 to 2024. In the Tuha region, grape was the primary economic forest species. Its planting area remained highly stable from 2019 to 2024, ranging between approximately 590 and 652 km2, indicating strong spatial persistence and limited interannual variability.
4. Discussion
4.1. Feature Selection and Month-Specific Classification Sensitivity
The results indicate that both feature selection and classification identification month play a critical role in determining the accuracy of economic forest classification in Xinjiang. Their influence, however, is not uniform across regions, but varies in response to differences in orchard distribution patterns and background complexity, which shape how multi-source remote sensing information contributes to species discrimination.
In regions where orchards are spatially aggregated and embedded within relatively homogeneous oasis landscapes, classification performance stabilizes with a limited set of spectral and vegetation-related features [42]. Under such conditions, dominant tree species tend to form coherent patches with reduced interference from surrounding land-cover types, allowing optical reflectance characteristics to remain distinct [43]. Similar patterns have been reported in studies showing that in structurally simple agricultural landscapes, additional features yield diminishing returns once core spectral separability is achieved [44,45]. By contrast, in areas characterized by fragmented oases, mixed land-cover mosaics, and frequent transitions between orchards, bare soil, and shrubland, spectral confusion becomes a dominant limiting factor. Here, the integration of SAR-derived structural information plays a critical role by introducing sensitivity to canopy geometry and surface roughness that optical data alone cannot capture [46,47]. This complementary contribution of radar features has been widely recognized in orchard and tree-crop mapping, particularly in arid and semi-arid environments where background reflectance variability is high and planting patterns are irregular [48,49]. The need for richer feature combinations in such regions therefore reflects landscape-driven constraints rather than model complexity per se [14]. Sensitivity to classification identification month further highlights the interaction between image acquisition timing and landscape context. The observed month-specific differences do not imply explicit phenological modeling but instead arise from transient contrasts between orchard canopies and surrounding surfaces [50]. Early-season imagery can enhance separability in regions where fruit trees initiate growth ahead of other vegetation [51], while mid-season imagery accentuates differences in canopy structure and vigor [52,53]. In contrast, in regions dominated by deciduous species, images acquired during late-season or leaf-off conditions often improve discrimination by increasing soil–canopy and structural contrast [54]. Taken together, these patterns indicate that effective economic forest mapping depends less on universally optimal feature sets or fixed temporal windows than on aligning feature composition and classification identification months with region-specific separability mechanisms. This finding reinforces the importance of adaptive, context-aware classification strategies when applying multi-source remote sensing across heterogeneous dryland environments [55,56,57].
4.2. Spatial Distribution Characteristics and Area Dynamics of Economic Forests in Xinjiang
The spatial distribution patterns and interannual area variations of economic forests in Xinjiang indicate that their formation and evolution reflect the long-term coupling between environmental constraints and regional oasis-based agricultural systems. Across the five major production regions, economic forests exhibit differentiated spatial organizations and stability characteristics, which are closely related to oasis structure, water resource availability, and long-established planting systems shaped by both natural and socio-historical processes [58]. In regions where oases are relatively large and spatially continuous (e.g., Aksu and Hotan), economic forests tend to cluster along river valleys and irrigated plains, forming corridor-like spatial patterns. This configuration reflects a strong dependence on stable water supply and mature irrigation systems [59], while simultaneously constraining the expansion or contraction of planting areas beyond oasis boundaries. These patterns are consistent with previous findings in arid inland basins, which suggest that perennial orchard distributions are jointly shaped by soil–hydrological conditions and long-term irrigation regimes, resulting in high spatial stability over multi-year timescales [60]. In Xinjiang, such stability has also been reinforced by the persistence of oasis settlement systems along the historical Silk Road [61], where orchard-based agriculture has been maintained over centuries, further anchoring economic forest distribution within established irrigation corridors. By contrast, in regions with more fragmented oasis structures and diversified planting systems (e.g., Kashgar and parts of Bazhou), overall spatial configurations remain stable, but species composition exhibits greater flexibility. In these areas, multiple economic forest species often coexist within the same oasis corridors, and interannual changes are more likely to manifest as gradual rebalancing among species or localized adjustments in patch structure rather than abrupt spatial reorganization [62]. Such internally driven adjustments suggest that structural diversity may buffer environmental fluctuations and management variability, allowing agricultural systems to adapt without large-scale spatial restructuring. In Bazhou, for example, the irrigation infrastructure of the Kaidu River Basin provides a stable hydrological foundation, while traditional advantageous production zones such as Korla—supported by geographical indication branding (e.g., Korla Fragrant Pear)—have promoted balanced multi-species development within core oases, reinforcing spatial persistence [63]. In contrast to diversified systems, regions dominated by a single economic forest species (e.g., the Tuha region) typically exhibit highly concentrated spatial distributions and pronounced interannual stability, with planting areas largely confined to core oasis zones [64]. This pattern reflects strong environmental suitability and well-established production management. However, previous studies have noted that although highly specialized orchard systems may enhance production efficiency, their structural simplicity can reduce overall resilience to external disturbances such as climatic anomalies or market fluctuations [65].
Overall, the stability and limited interannual variation of economic forest distributions in Xinjiang are primarily shaped by long-term hydrological and geomorphological constraints, within which planting structures evolve through gradual adjustments rather than large-scale spatial shifts. This understanding provides a system-level perspective for interpreting remote sensing mapping results and offers spatial insights into the stability and adjustment pathways of economic forests in arid and semi-arid regions.
4.3. Comparative Analysis Between Current Distribution and Predicted Suitable Planting Areas
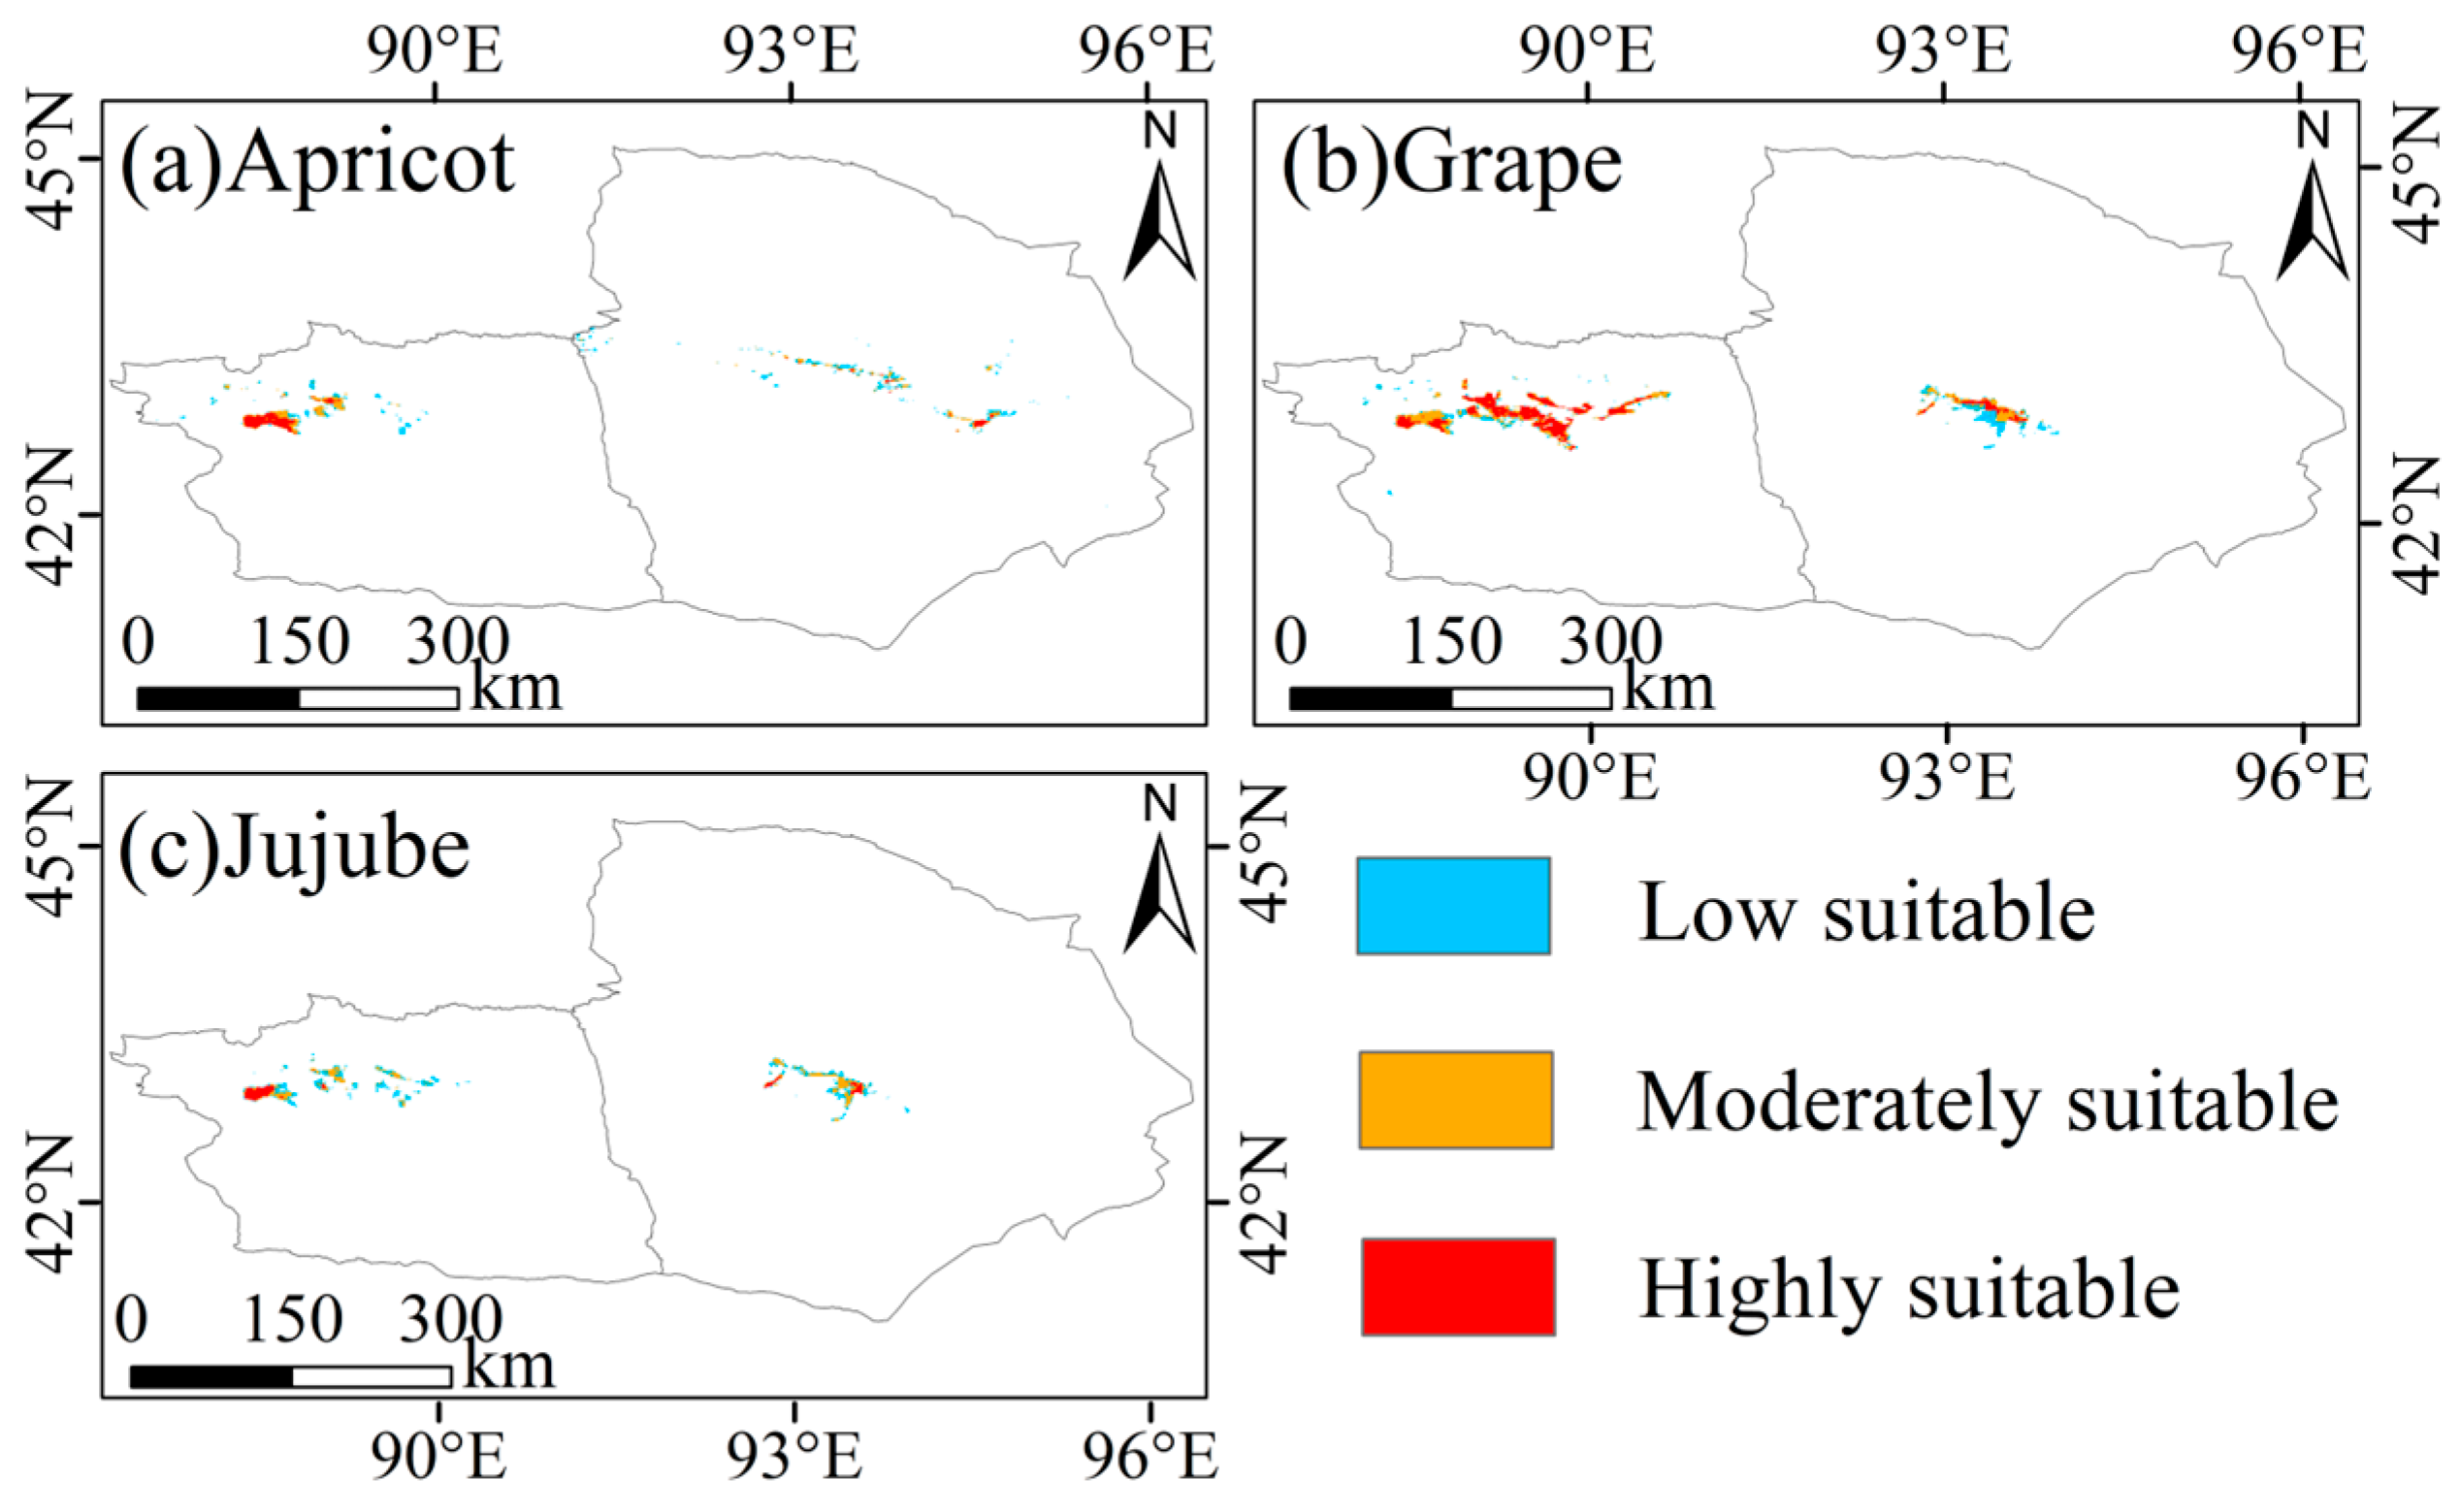
To examine the consistency between the current spatial distribution of major economic forest species in Xinjiang and their ecological suitability, the Maximum Entropy (MaxEnt) model was employed as a complementary analytical framework. Bioclimatic variables under the SSP245 scenario for 2021–2040 [38,66], together with topographic factors and NDVI (Table A5), were used to simulate climatic suitability patterns for representative fruit tree species (Figure A6, Figure A7, Figure A8, Figure A9 and Figure A10). These suitability maps were overlaid with the 2024 remote sensing–derived distributions to quantify spatial correspondence and to identify areas with potential for structural optimization.
The boxplot results (Figure 9) indicate that, under the 2030s climate scenario, the spatial relationship between current orchard distributions and highly suitable zones is characterized by overall consistency accompanied by localized mismatches. For most dominant species, plantations within major production areas show substantial overlap with highly suitable zones. For example, in Hotan, 78.6% of walnut plantations and 48.9% of jujube plantations are located within highly suitable areas. Similarly, more than 40% of apple plantations in Aksu, as well as apricot and walnut plantations in Kashgar, fall within highly suitable zones. These patterns provide quantitative support for the notion that oasis-based orchard layouts have been progressively shaped by long-term environmental filtering, whereby climatic conditions and irrigation feasibility jointly favor the persistence of perennial fruit trees in ecologically compatible locations. Compared with the overall pattern of spatial agreement, localized suitability mismatches warrant particular attention [67]. Although jujube in Ruoqiang County and pear in Korla City represent emblematic regional specialty crops, their overlap with highly suitable zones is relatively low, at 12.7% and 23.0%, respectively. Such low correspondence does not necessarily imply immediate climatic unsuitability. In arid regions, orchard establishment and persistence are often strongly mediated by socio-hydrological constraints—including irrigation infrastructure, water allocation regimes, land accessibility, and institutional arrangements—as well as by industrial path dependence related to cultivar selection, processing capacity, and branding strategies [68]. Consequently, observed planting patterns may deviate from a purely climate-defined environmental envelope, reflecting the shaping influence of socio-economic and management factors on local land-use configurations [69]. The Turpan–Hami region provides an additional perspective. Remote sensing results show that grape cultivation exhibits a highly stable spatial pattern, yet only 39.4% of grape plantations overlap with highly suitable zones [70]. This suggests that a substantial proportion of vineyards may be located in moderately suitable areas, where climatic limitations are compensated for through intensive irrigation management and agronomic inputs. At the same time, the presence of unutilized highly suitable areas suggests a potential direction for future orchard expansion [71]. However, the realization of this potential depends on whether key supporting conditions—such as water availability, soil salinity, infrastructure, and competition for land—can be adequately addressed.
Figure 9.
Spatial consistency between current distribution and future climatic suitability of economic forest species in Xinjiang.
More importantly, the overlay analysis highlights several potential expansion zones that are predominantly situated along oasis margins. These include the gently sloping piedmont terraces from Wensu to Shaya in northern Aksu, the oasis fringe between Yuli and Luntai in Bazhou, the river valley corridor from Shufu to the northern edge of Yingjisha in Kashgar, and the alluvial–proluvial fans extending from Toksun to northern Shanshan in the Turpan–Hami region. These areas share common characteristics such as gentle slopes, river terraces, and partially unused sandy uplands, and are typically located away from core cultivated zones. From a land-system perspective, cautiously guiding orchard expansion toward high-suitability zones along oasis margins—rather than intensifying cultivation within core oasis farmlands—may help alleviate land-use competition between fruit trees and grain crops, reduce pressure on limited water resources, and enhance the overall synergy of ecosystem service [72]. Nevertheless, such expansion must remain constrained by ecological carrying capacity and water governance considerations.
Overall, the comparison between MaxEnt-derived suitability patterns and remote sensing–mapped distributions supports a more robust optimization logic for economic forest development: suitability-guided prioritization, clustered spatial configuration, and controlled expansion intensity. Highly suitable areas may be regarded as priority zones for improving irrigation efficiency and infrastructure investment, whereas more conservative strategies should be adopted in low-suitability areas, accompanied by strengthened monitoring and resource-threshold regulation. Advancing the integration of suitability assessment with oasis-unit spatial planning—through dynamic updates and fine-scale regulation—can support a gradual transition from experience-driven to evidence-informed orchard layout optimization, thereby enhancing land-use efficiency and strengthening the resilience of oasis agricultural systems in arid regions.
4.4. Uncertainty Analysis
Despite the robust performance achieved by integrating multi-source remote sensing data, feature selection, and region-specific temporal optimization, several sources of uncertainty should be acknowledged when interpreting the results of this study.
At the spatial scale, uncertainty mainly arises from the interaction between sensor resolution and the structural characteristics of economic forests [73]. In Xinjiang, orchards are typically distributed as narrow belts or fragmented patches along oasis margins, river corridors, and alluvial fans. Under the 10–20 m spatial resolution of Sentinel-1 and Sentinel-2 data, small orchards, boundary zones, and transitional areas between fruit trees, cropland, and bare land are susceptible to mixed-pixel effects [74]. This may lead to localized misclassification or boundary smoothing, particularly in ecotonal settings. However, such effects are spatially limited and do not substantially influence the identification of dominant orchard zones, regional distribution patterns, or the stability of major production areas discussed in Section 4.2 and Section 4.3.
Temporal uncertainty constitutes another important consideration. Although classification identification months were optimized separately for each region to enhance class separability, this optimization was based on empirical classification performance rather than explicit phenological metrics. Image availability and quality in arid regions remain constrained by environmental factors such as cloud cover, dust storms, and unfavorable illumination conditions [75], which may limit the availability of suitable imagery during theoretically informative seasonal windows. In addition, while temporal differences in classification performance are consistent with seasonal changes in vegetation condition and background contrast, no independent phenological indicators (e.g., growing degree days or satellite-derived phenology metrics) were incorporated to explicitly validate phenological mechanisms [76]. Therefore, temporal interpretations in this study should be understood as seasonal associations linked to observation timing and spectral–structural contrast, rather than as verified phenology-driven processes. Nevertheless, because annual classification was conducted using a consistent region-specific strategy, interannual comparisons are driven by stable classification logic rather than by random temporal fluctuations. As a result, the observed interannual patterns primarily reflect persistent spatial organization and gradual structural adjustments, rather than artifacts of temporal sampling.
Uncertainty also affects the interpretation of interannual area dynamics. Economic forests in Xinjiang are subject to diverse management practices, including orchard renewal, partial replanting, fallowing, and small-scale expansion, many of which may occur within existing orchard boundaries or below the spatial resolution of the imagery [77]. Consequently, some short-term area fluctuations detected by remote sensing may reflect management-induced spectral variability rather than fundamental land-use transitions. In addition, area estimates derived from pixel-based classification differ conceptually from agricultural statistics based on field parcels or administrative records, which may lead to discrepancies in absolute values. These differences highlight the importance of interpreting remote sensing–based area estimates as indicators of spatial trends and relative change, rather than as direct substitutes for census data.
Finally, uncertainty is also associated with the use of ecological suitability modeling as an auxiliary analytical tool. In this study, the MaxEnt model was not intended to predict future land-use change, but to provide a climate-based reference framework for interpreting current orchard distributions and identifying potential optimization zones. The suitability results therefore represent relative ecological compatibility under near-term climate conditions, rather than deterministic expansion targets. The emphasis on spatial consistency and localized mismatch, rather than on absolute prediction, helps avoid overinterpretation and supports a cautious, planning-oriented use of suitability information.
Taken together, these sources of uncertainty indicate that the results of this study are most appropriately interpreted at the regional and multi-year scales emphasized in the Discussion. Within this scope, the coherence of spatial patterns across regions, the stability of dominant production zones, and the consistency between remote sensing interpretation and ecological suitability provide strong support for the reliability of the main conclusions. Future research incorporating higher-resolution imagery, denser time series, and improved spatiotemporal fusion techniques may further reduce uncertainty and enhance sensitivity to fine-scale management dynamics, thereby strengthening the application of remote sensing in economic forest management and spatial planning in arid regions.
5. Conclusions
This study developed a classification framework integrating multi-source remote sensing data, recursive feature selection, and TPE-optimized random forest modeling to characterize the spatiotemporal dynamics of major economic forest species in Xinjiang between 2019 and 2024 and to examine their consistency with ecological suitability patterns. The results demonstrate that all five principal production regions achieved high classification performance (overall accuracies ranging from 0.8539 to 0.9713, with F1 scores above 0.75), while the separability of economic forests and their reliance on remote sensing features exhibited pronounced spatial heterogeneity. Spatially, remote sensing–derived maps indicate a pattern characterized by edge agglomeration, core stability, and localized peripheral expansion. Comparison with ecological suitability further reveals structural mismatches between current planting layouts and projected high-suitability zones under near-term climate scenarios. Characteristic varieties such as apples in Aksu, jujubes in Ruoqiang, and pears in Korla—despite their established industrial advantages—occupy relatively low proportions of highly suitable areas. In contrast, regions including the Wensu–Shaya piedmont slopes, the Yuli–Luntai interfluves, the northern margin of the Shufu–Yingjisha corridor, and the alluvial fans north of Toksun combine favorable thermal, hydrological, and spatial conditions, representing key potential zones for optimizing future economic forest distribution.
By establishing a high-precision classification and suitability assessment framework, this study provides a robust basis for spatial governance and dynamic monitoring of orchard cultivation in arid regions while highlighting opportunities to alleviate existing ecological mismatches. Under the premise of safeguarding cropland security and ecological protection thresholds, guiding orchard expansion toward highly suitable areas may enhance resource-use efficiency and climate resilience. In the context of increasing climatic variability, these findings offer practical insights for improving site–species matching, supporting orchard structure optimization, and strengthening the stability of oasis-based agricultural systems in arid environments.
Author Contributions
Conceptualization, R.F.; methodology, R.F., J.Z., L.W., G.Z., J.A. and K.Z.; software, R.F., G.Z., J.A. and K.Z.; validation, R.F., J.Z. and L.W.; formal analysis, R.F.; investigation, R.F., G.Z., J.A. and K.Z.; resources, L.W.; data curation, R.F., J.Z. and L.W.; writing—original draft preparation, R.F.; writing—review and editing, J.Z., L.W., G.Z., J.A., X.W., K.Z. and L.L.; visualization, R.F.; supervision, J.Z. and L.W.; project administration, L.W.; funding acquisition, L.W. All authors have read and agreed to the published version of the manuscript.
Funding
This research was funded by the project “Construction of Forest and Fruit Resource Data System Based on Space-Air-Ground Multi-Source Remote Sensing Monitoring Technology” (Project No. 2023B02004-1), supported by the Xinjiang Academy of Forestry Science and the Xinjiang Key Laboratory of Desertification Control and Sand Industry. The authors gratefully acknowledge these institutions for their support in data provision and technical assistance. The Article Processing Charge (APC) was funded by the same project.
Data Availability Statement
The data presented in this study are available on request from the corresponding author due to data use agreements with data providers.
Acknowledgments
The authors gratefully acknowledge the Xinjiang Academy of Forestry Science and the Xinjiang Key Laboratory of Desertification Control and Sand Industry for their support in data provision and technical assistance.
Conflicts of Interest
The authors declare no conflicts of interest.
Appendix A
Table A1.
Sample sizes of major economic forest species by sub-region and data source.
Table A2.
List of GLCM-based texture features derived from Sentinel-1 VV and VH polarization channels.
Table A3.
Spectral indices used in this study and their calculation formulas.
Table A4.
Annual Area Statistics (2019–2024) of Major Economic Forest Fruit Crops in the Five Main Production Regions of Xinjiang (unit: km2).
Table A5.
All environmental variables used for the MaxEnt model in this study.
Figure A1.
Spatiotemporal distribution dynamics of major economic forest species in Aksu Prefecture, Xinjiang, from 2019 to 2024 (a–f).
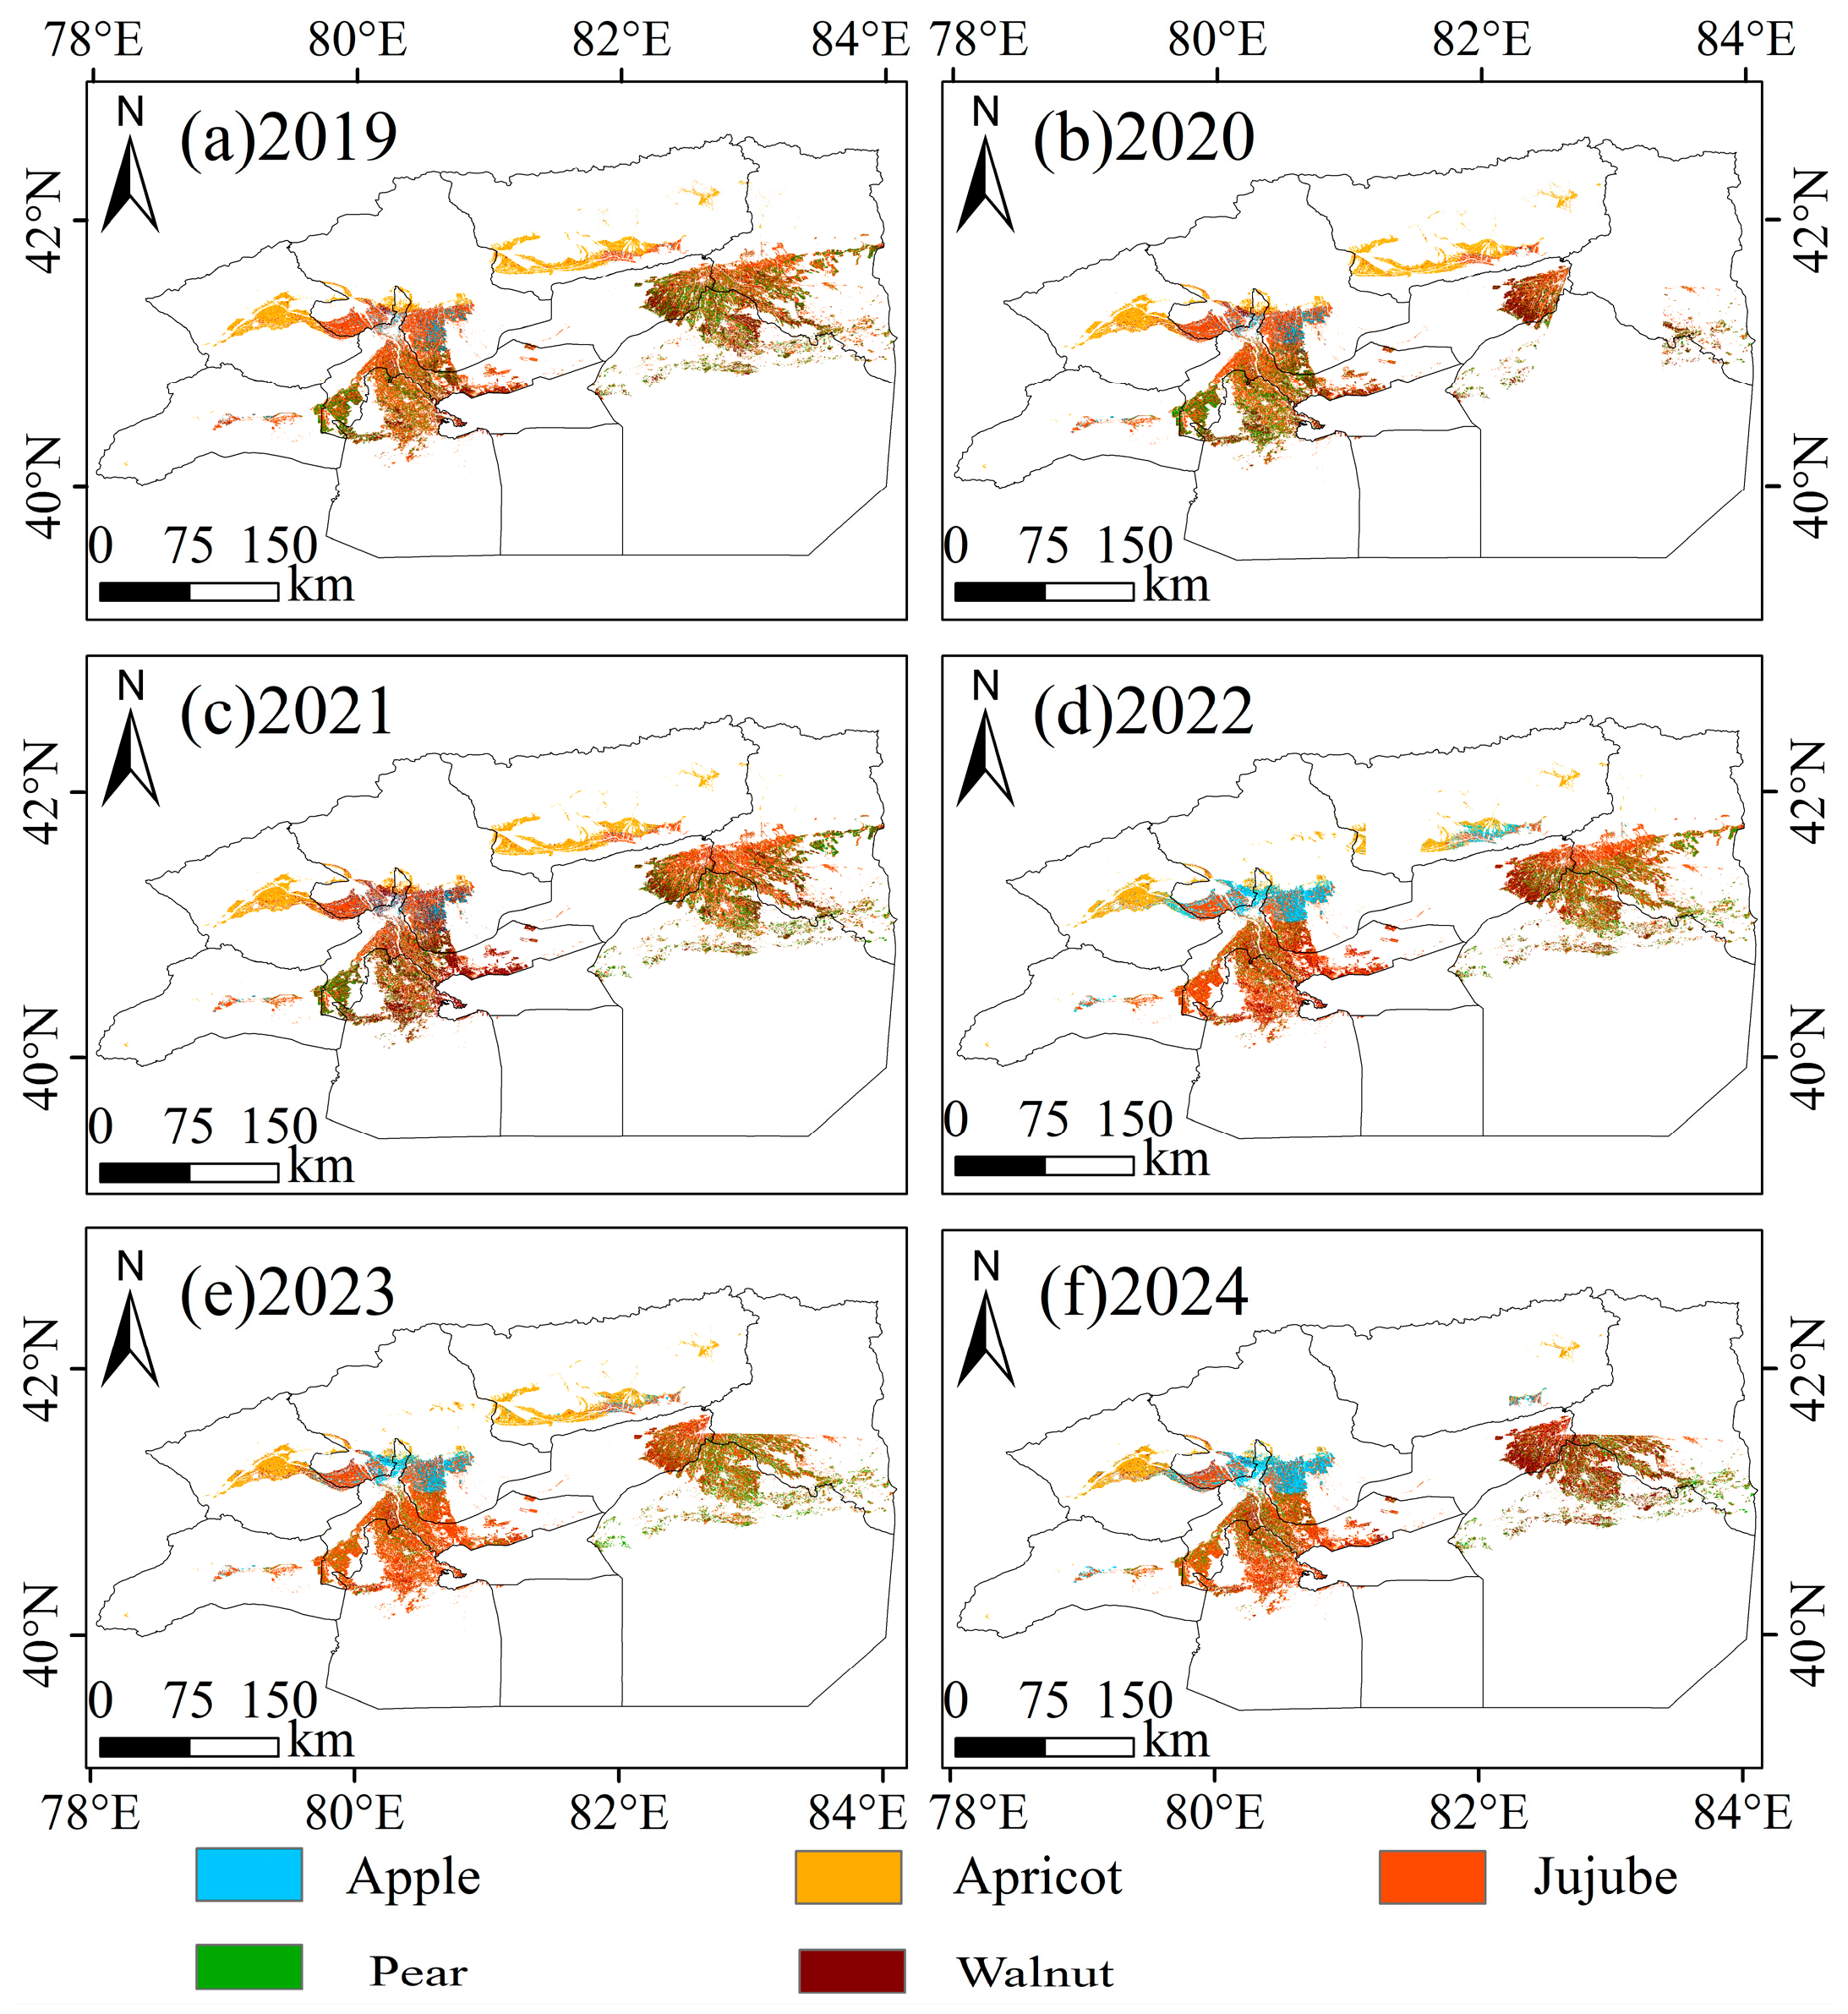
Figure A2.
Spatiotemporal distribution dynamics of major economic forest species in Bazhou Prefecture, Xinjiang, from 2019 to 2024 (a–f).
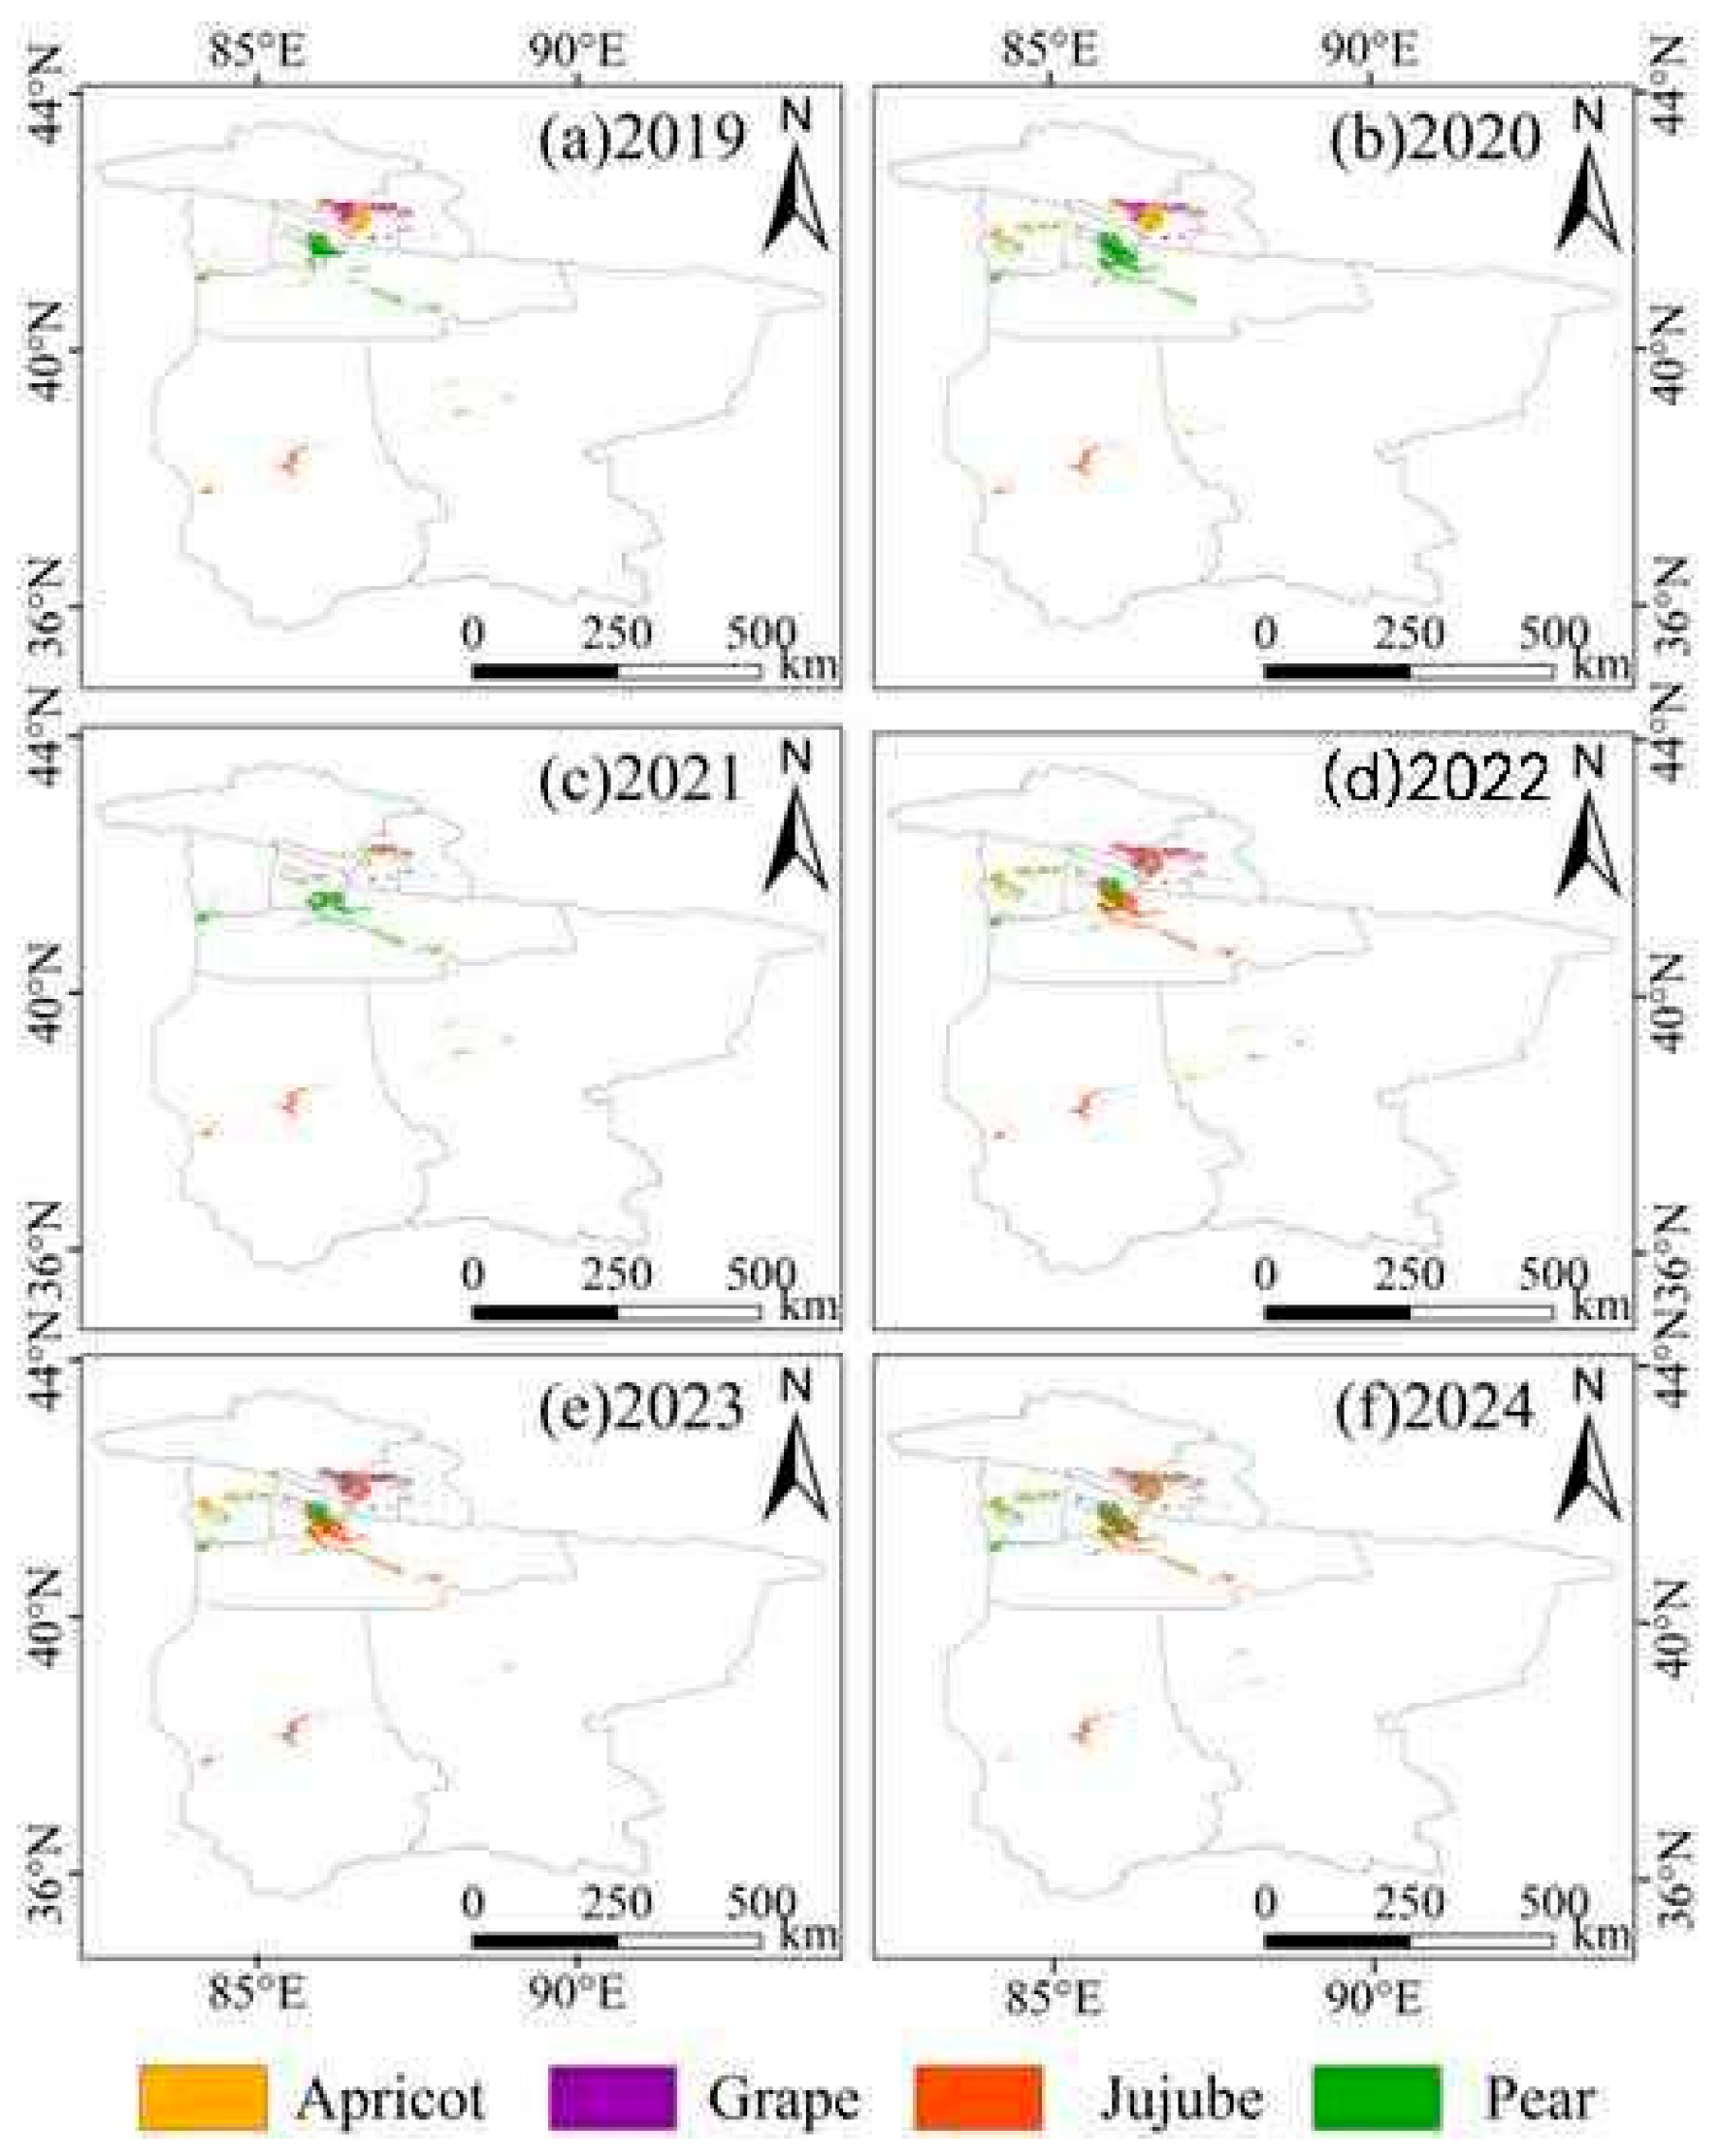
Figure A3.
Spatiotemporal distribution dynamics of major economic forest species in Hotan Prefecture, Xinjiang, from 2019 to 2024 (a–f).
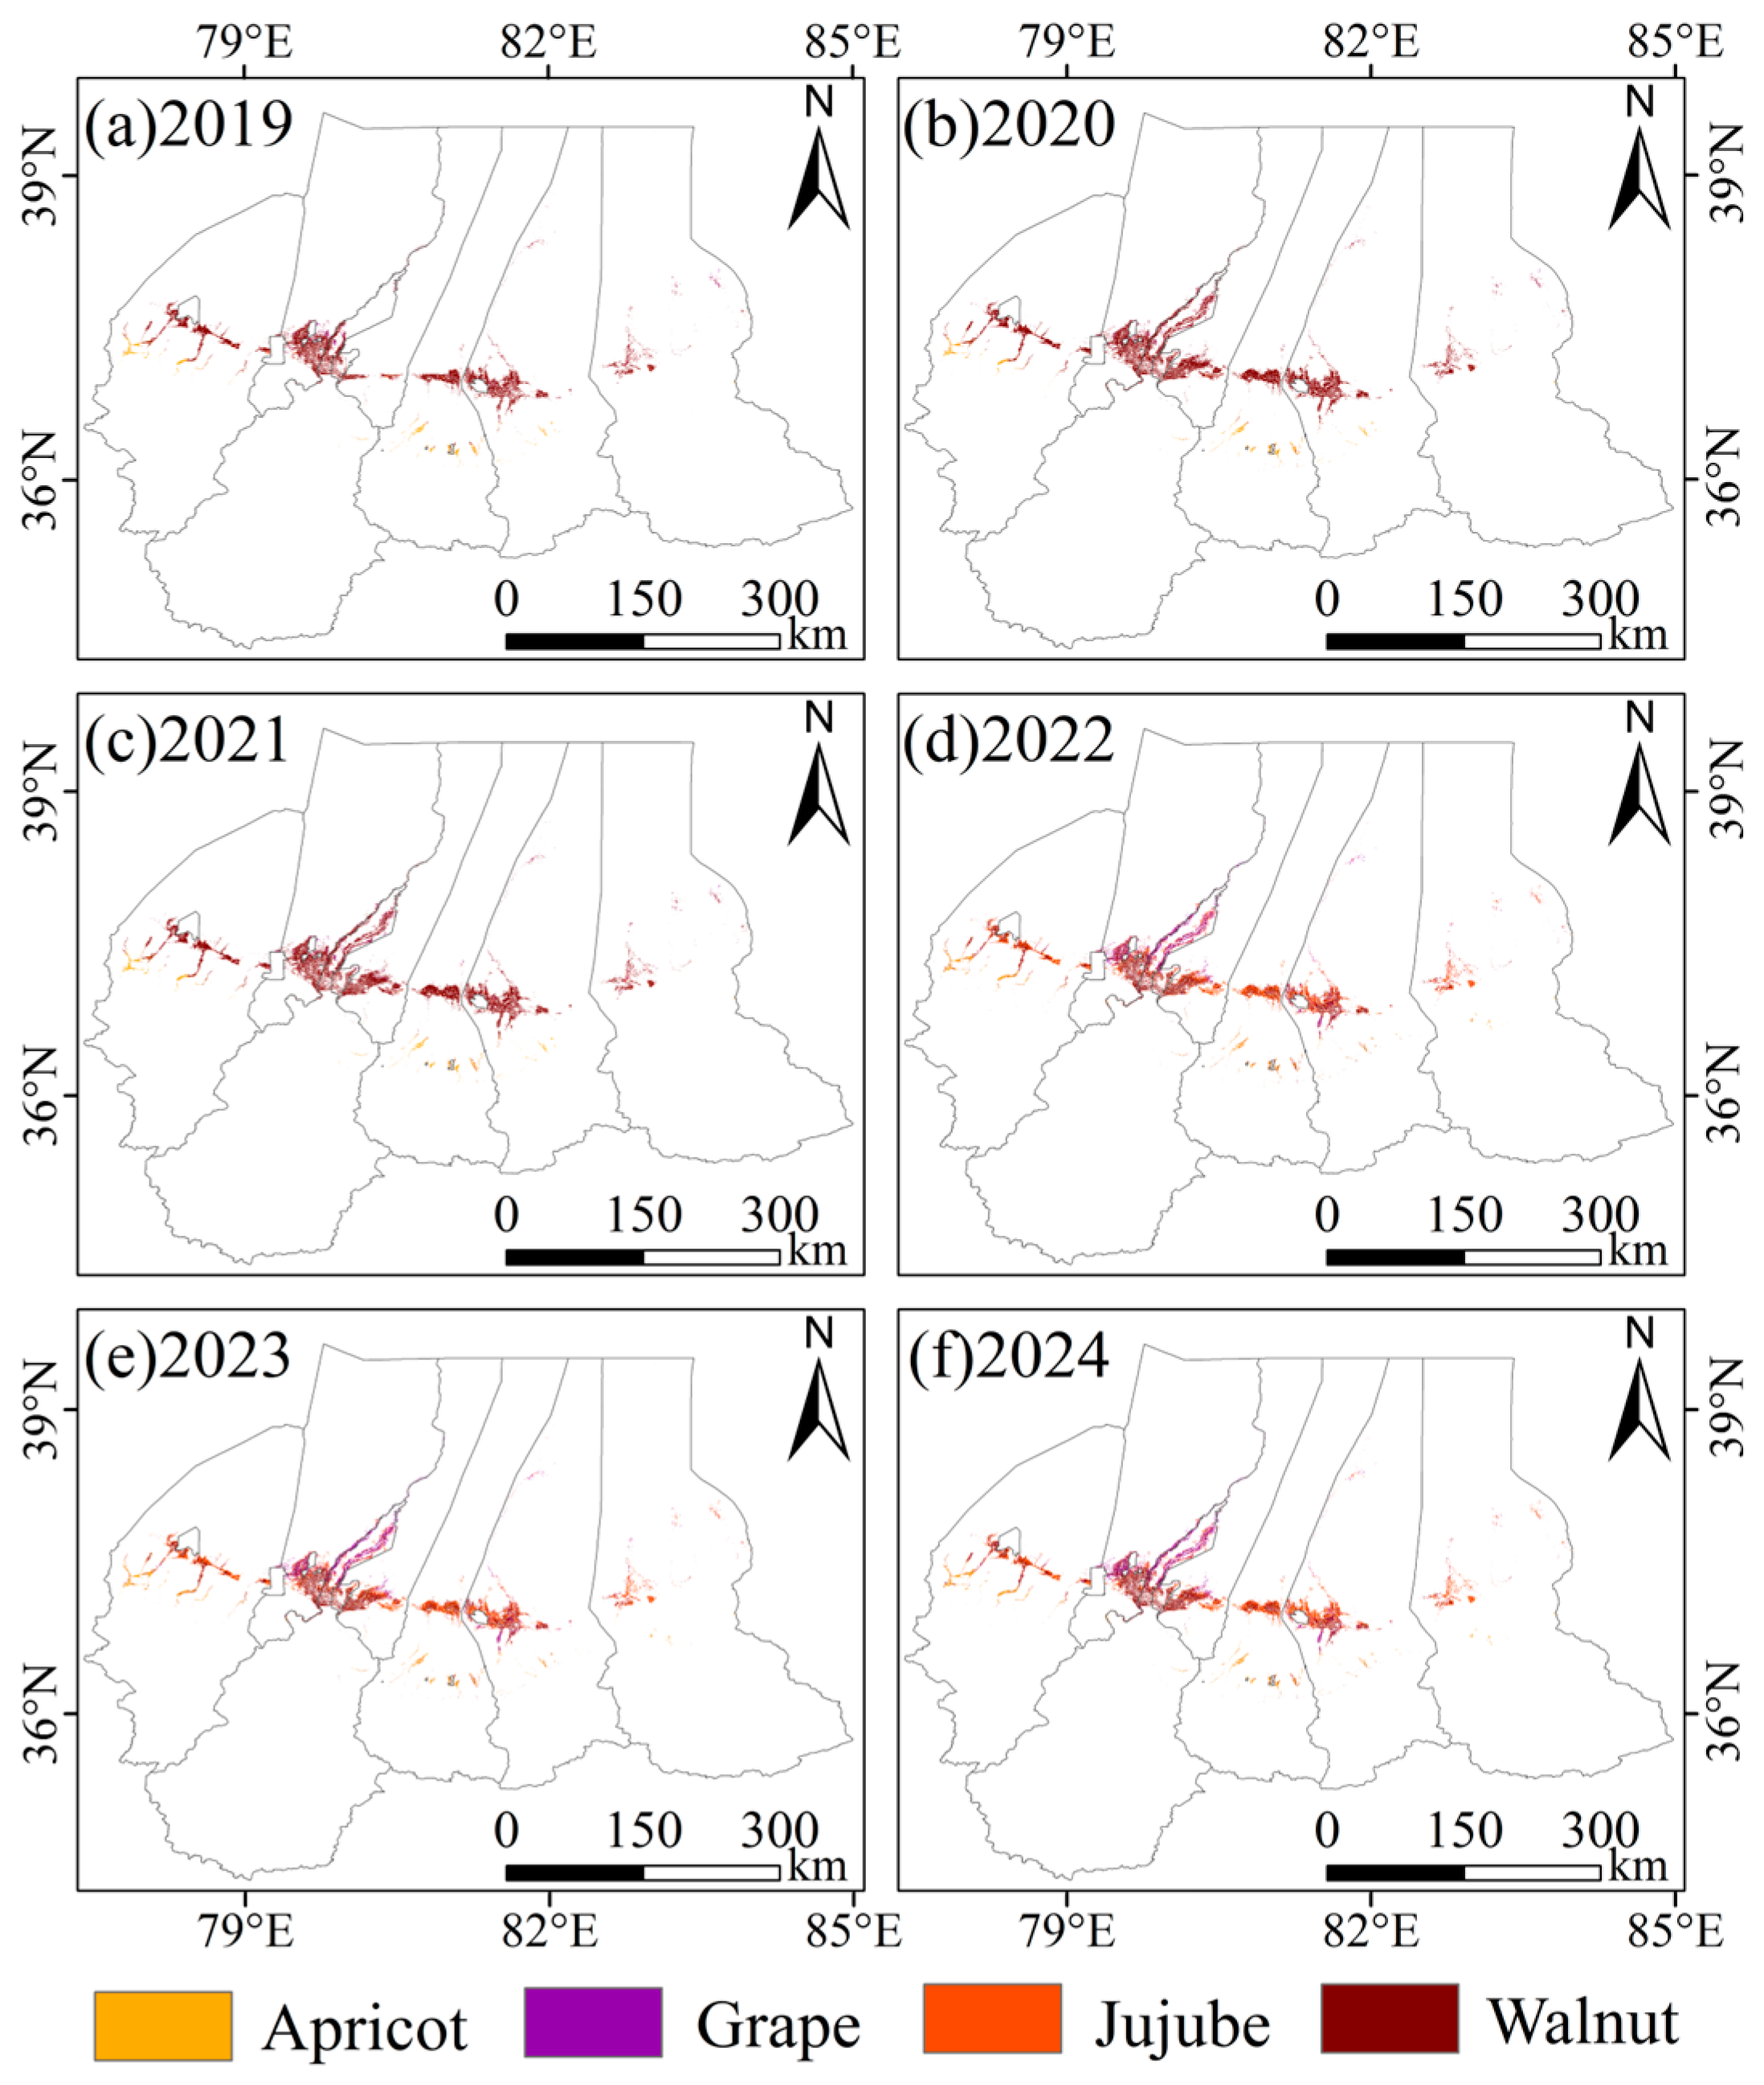
Figure A4.
Spatiotemporal distribution dynamics of major economic forest species in Kashgar Prefecture, Xinjiang, from 2019 to 2024 (a–f).
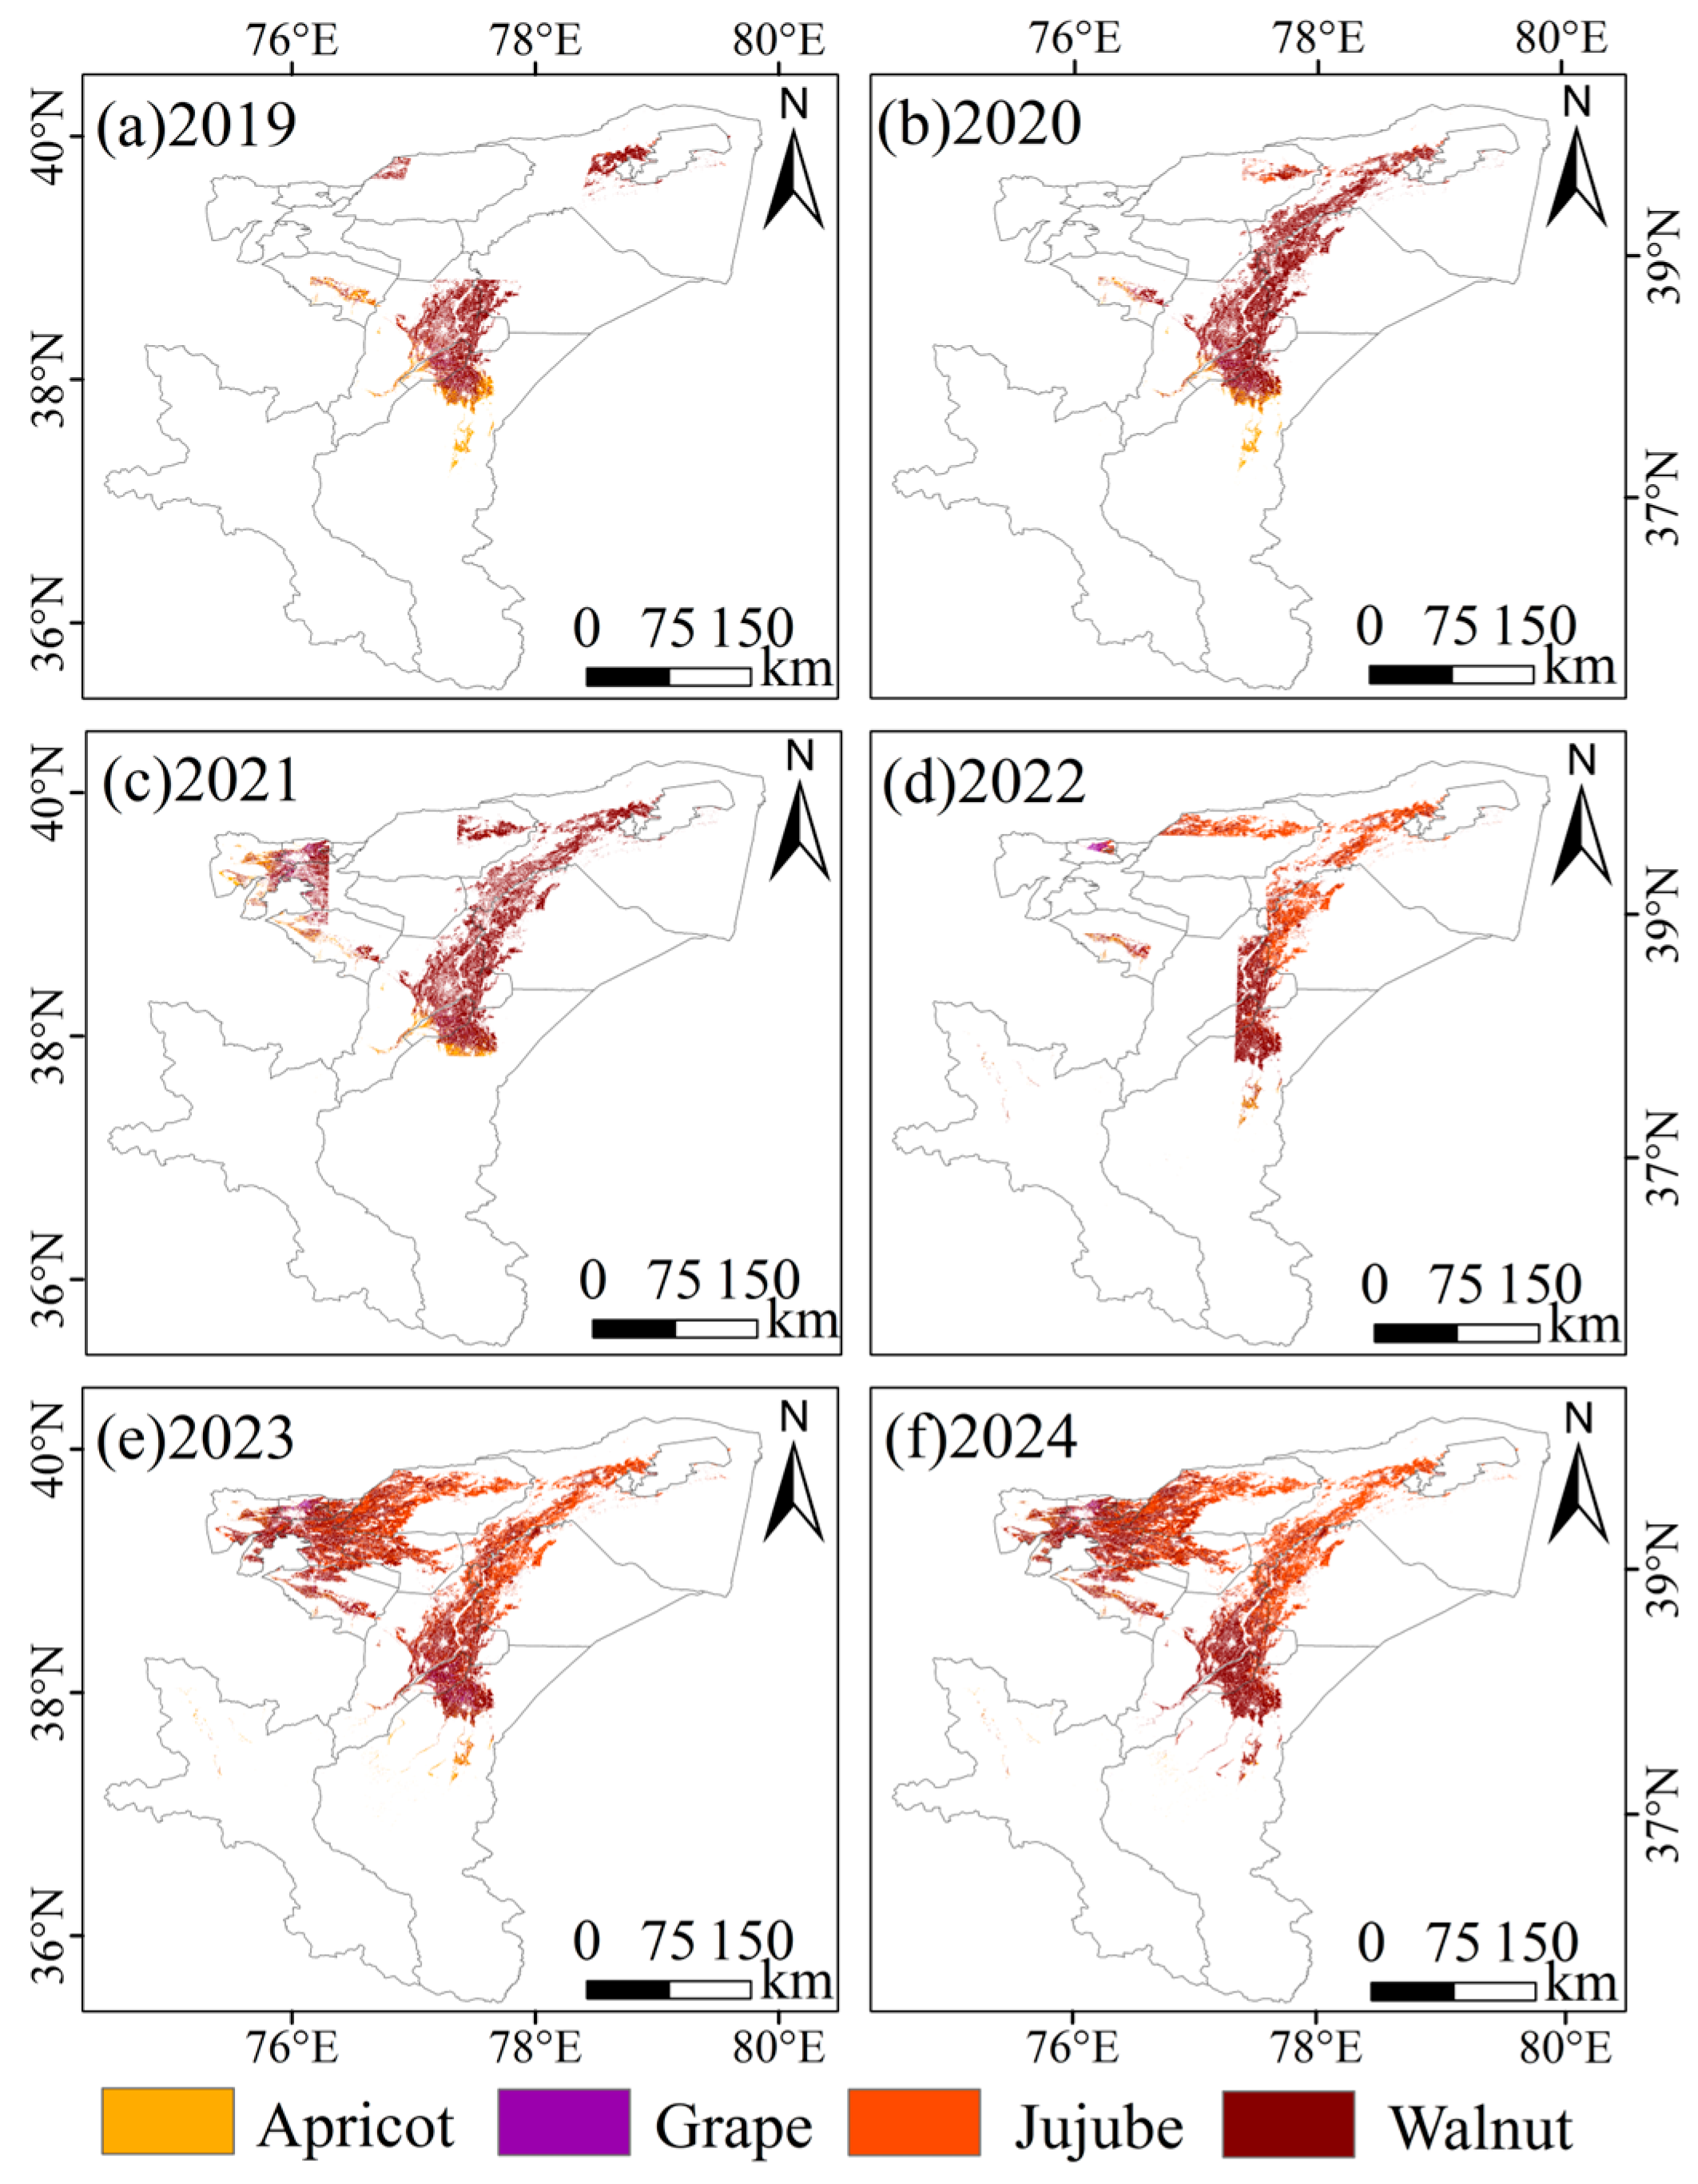
Figure A5.
Spatiotemporal distribution dynamics of major economic forest species in Turpan-Hami (Tuha) Prefecture, Xinjiang, from 2019 to 2024 (a–f).
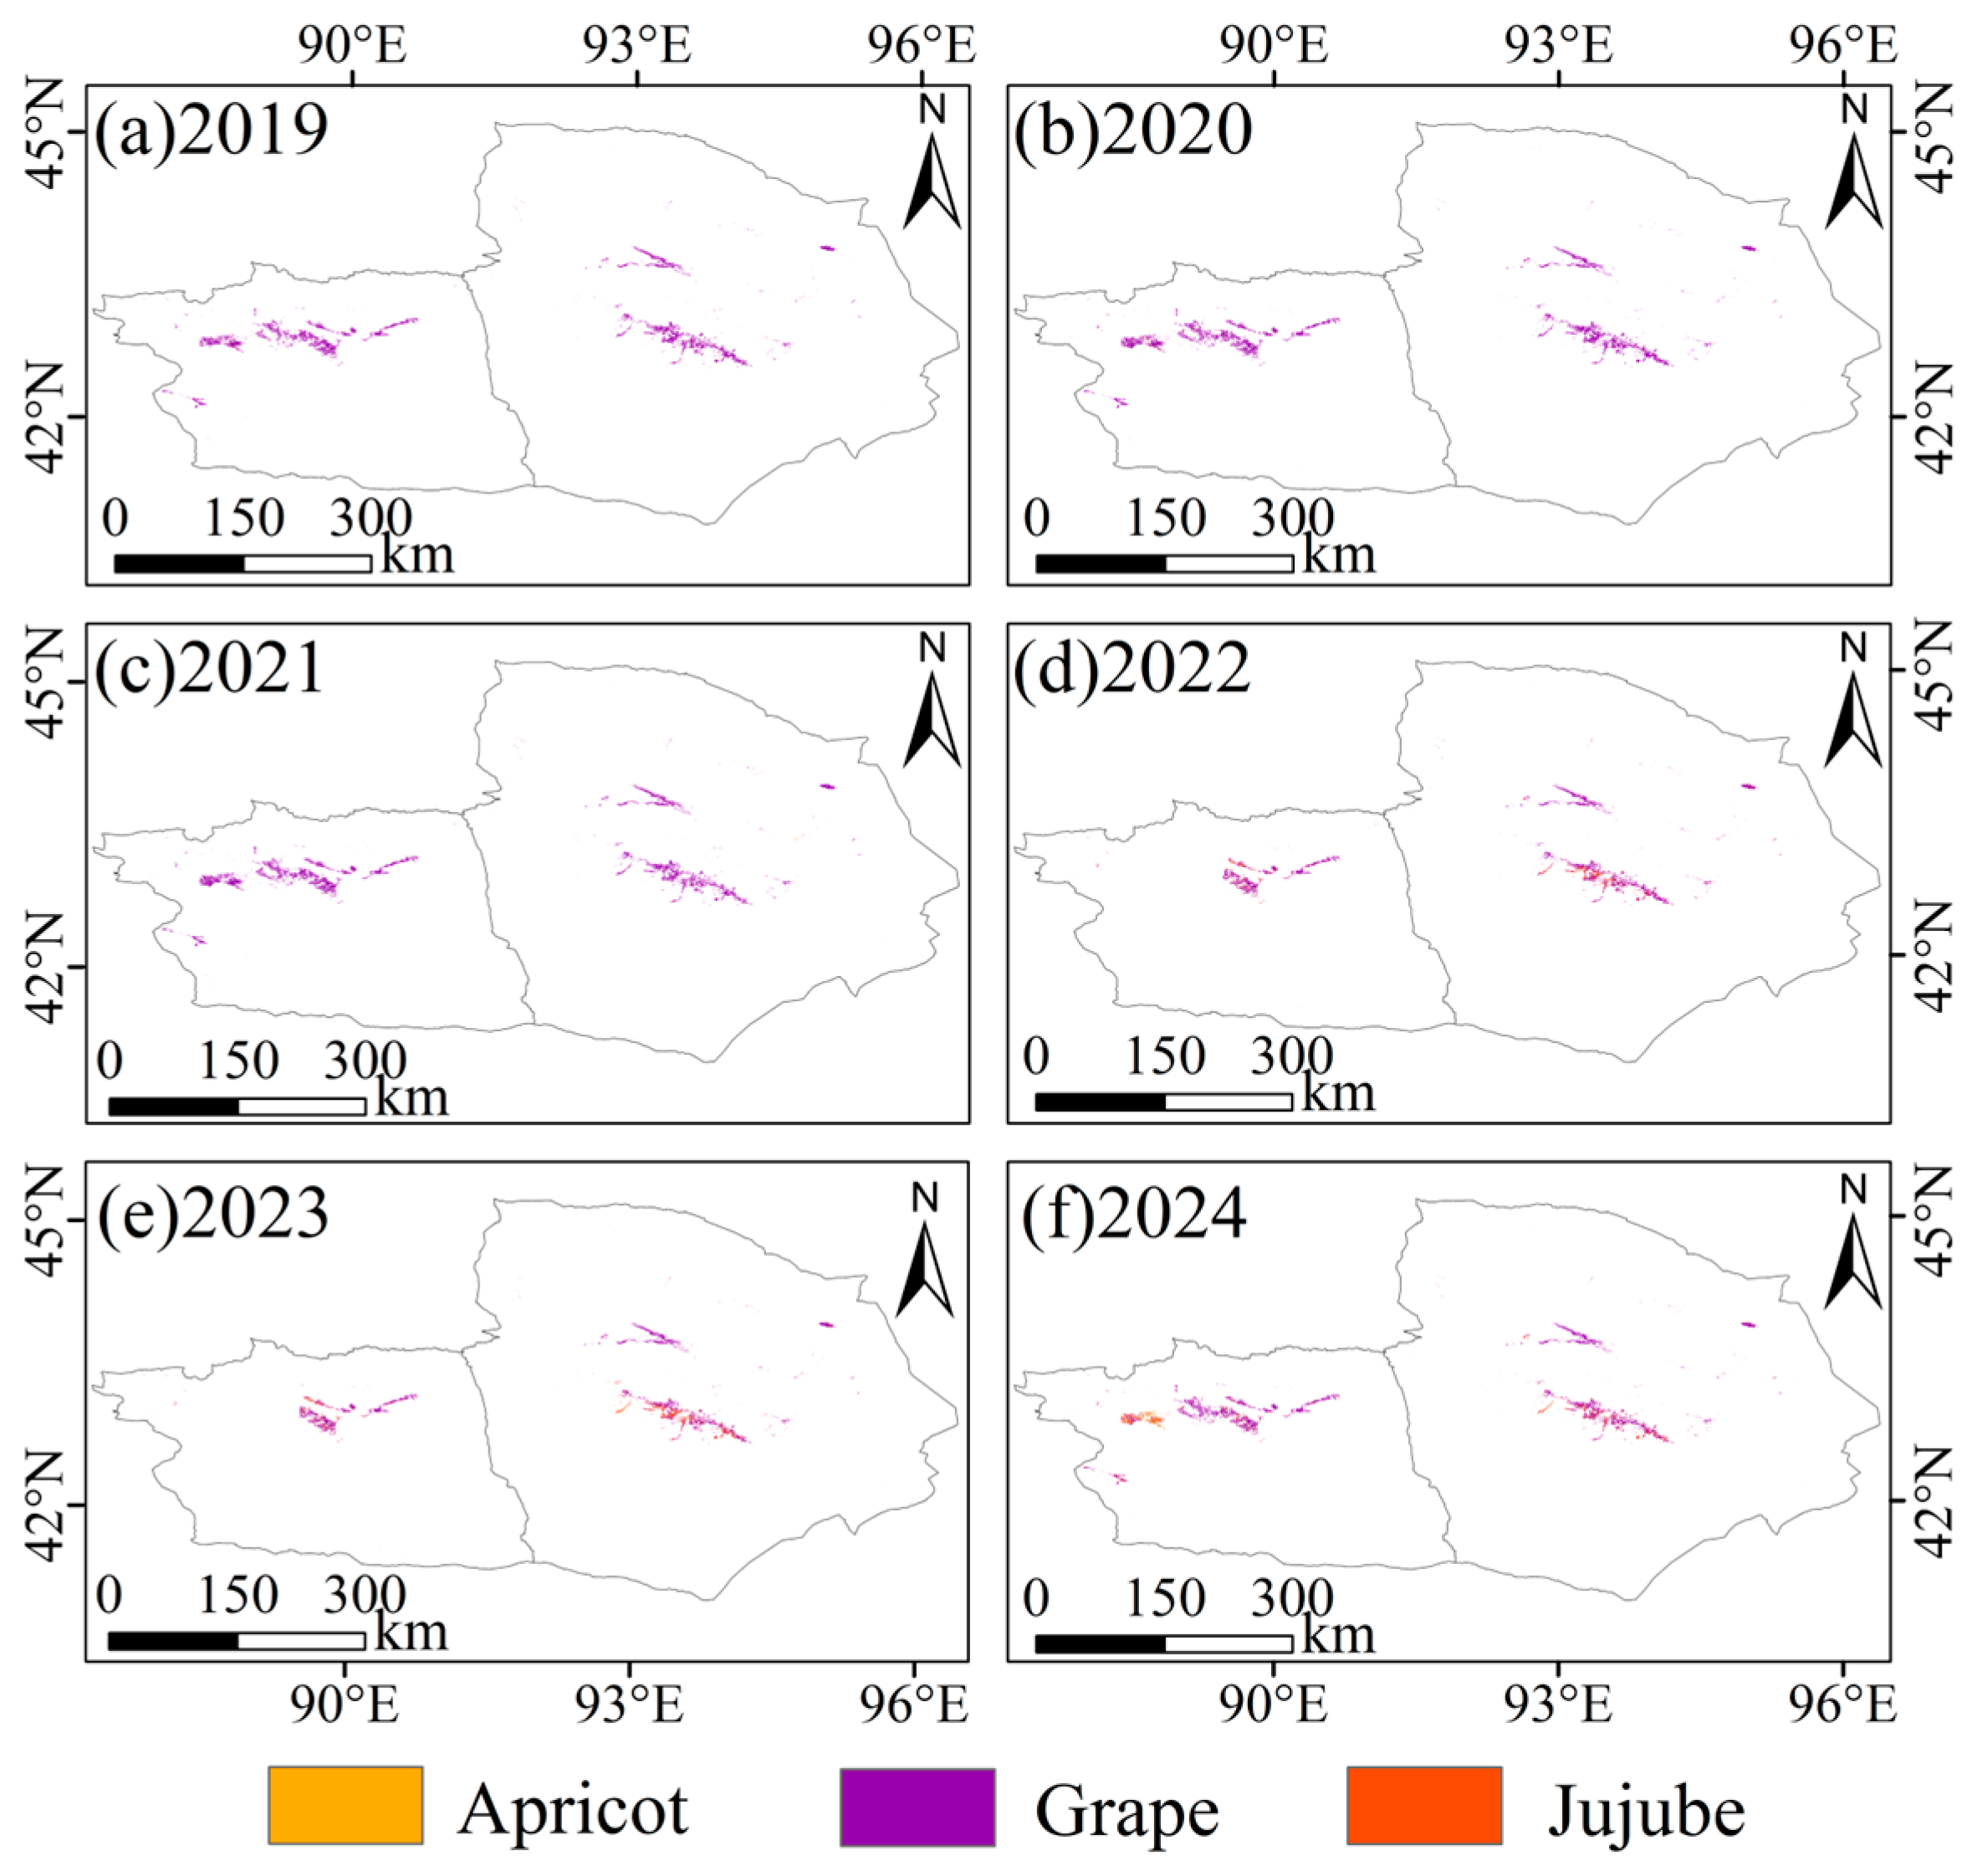
Figure A6.
Potentially suitable areas for major economic forest species in Aksu under the SSP245 scenario (2021–2040), predicted by the MaxEnt model. (a) Apple, (b) Apricot, (c) Jujube, (d) Pear, and (e) Walnut. Suitability classes are categorized as low, moderate, and high.
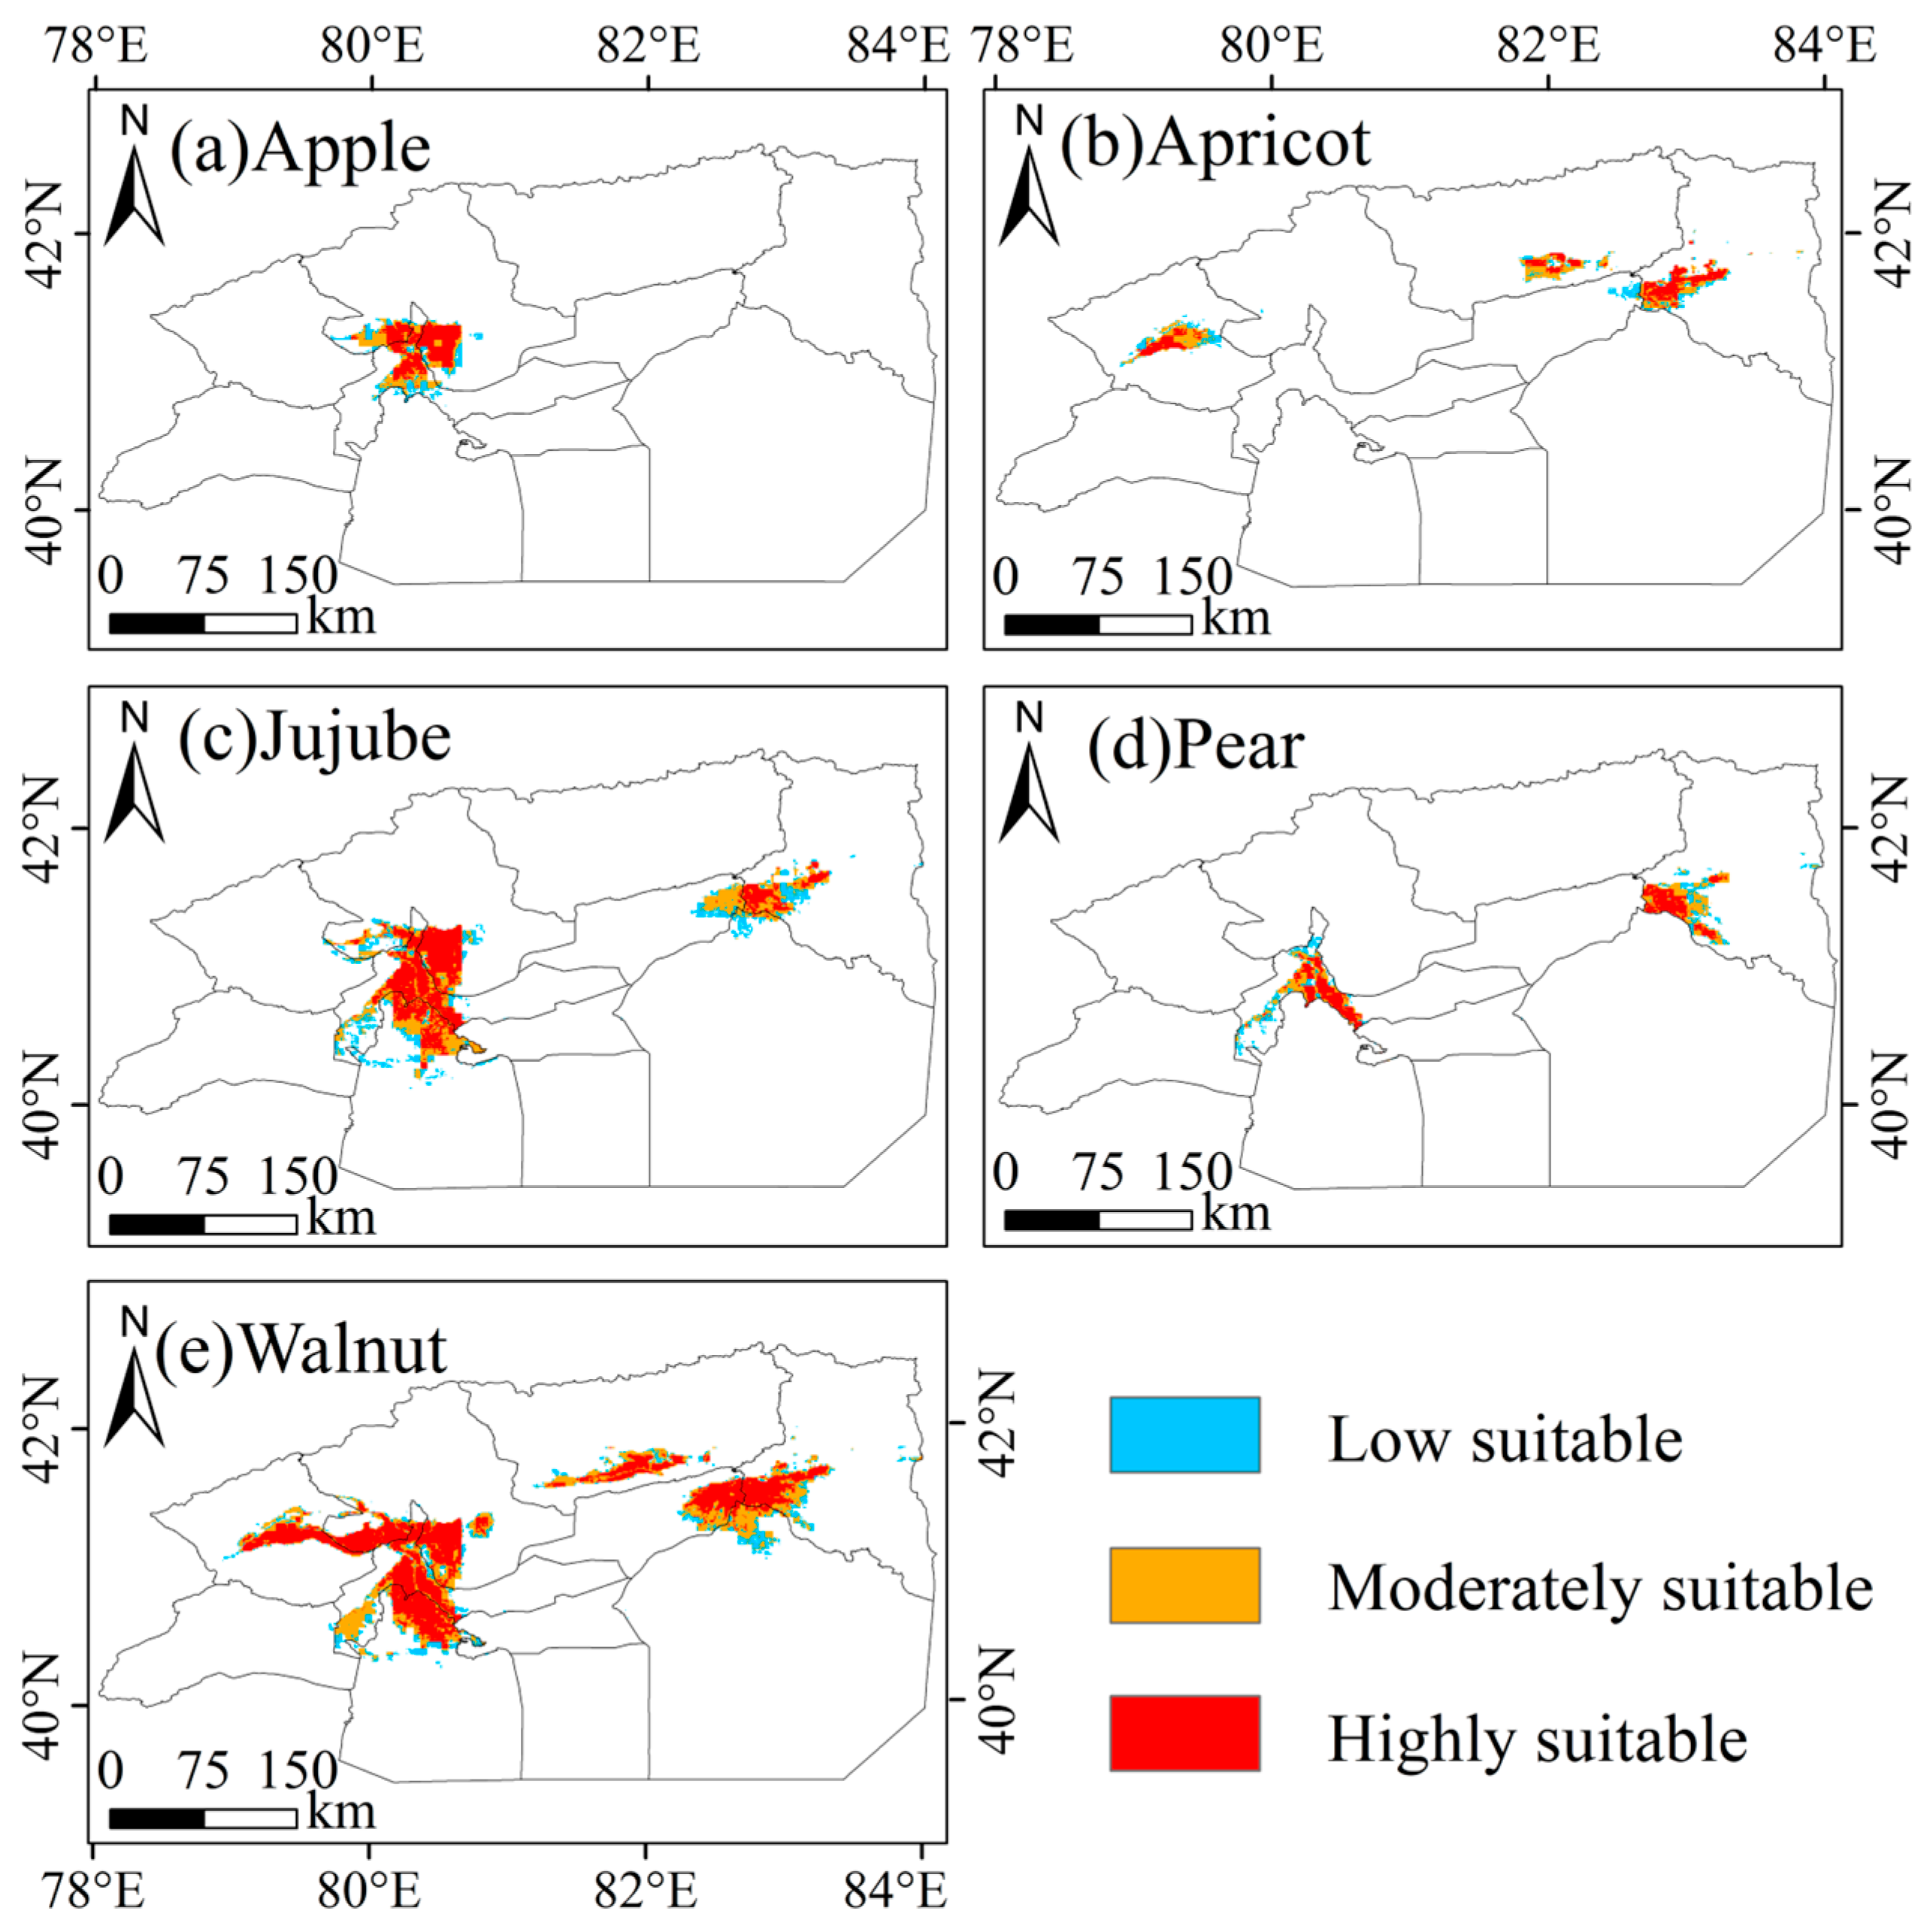
Figure A7.
Potentially suitable areas for major economic forest species in Bazhou under the SSP245 scenario (2021–2040), predicted by the MaxEnt model. (a) Apricot, (b) Grape, (c) Jujube, and (d) Pear.
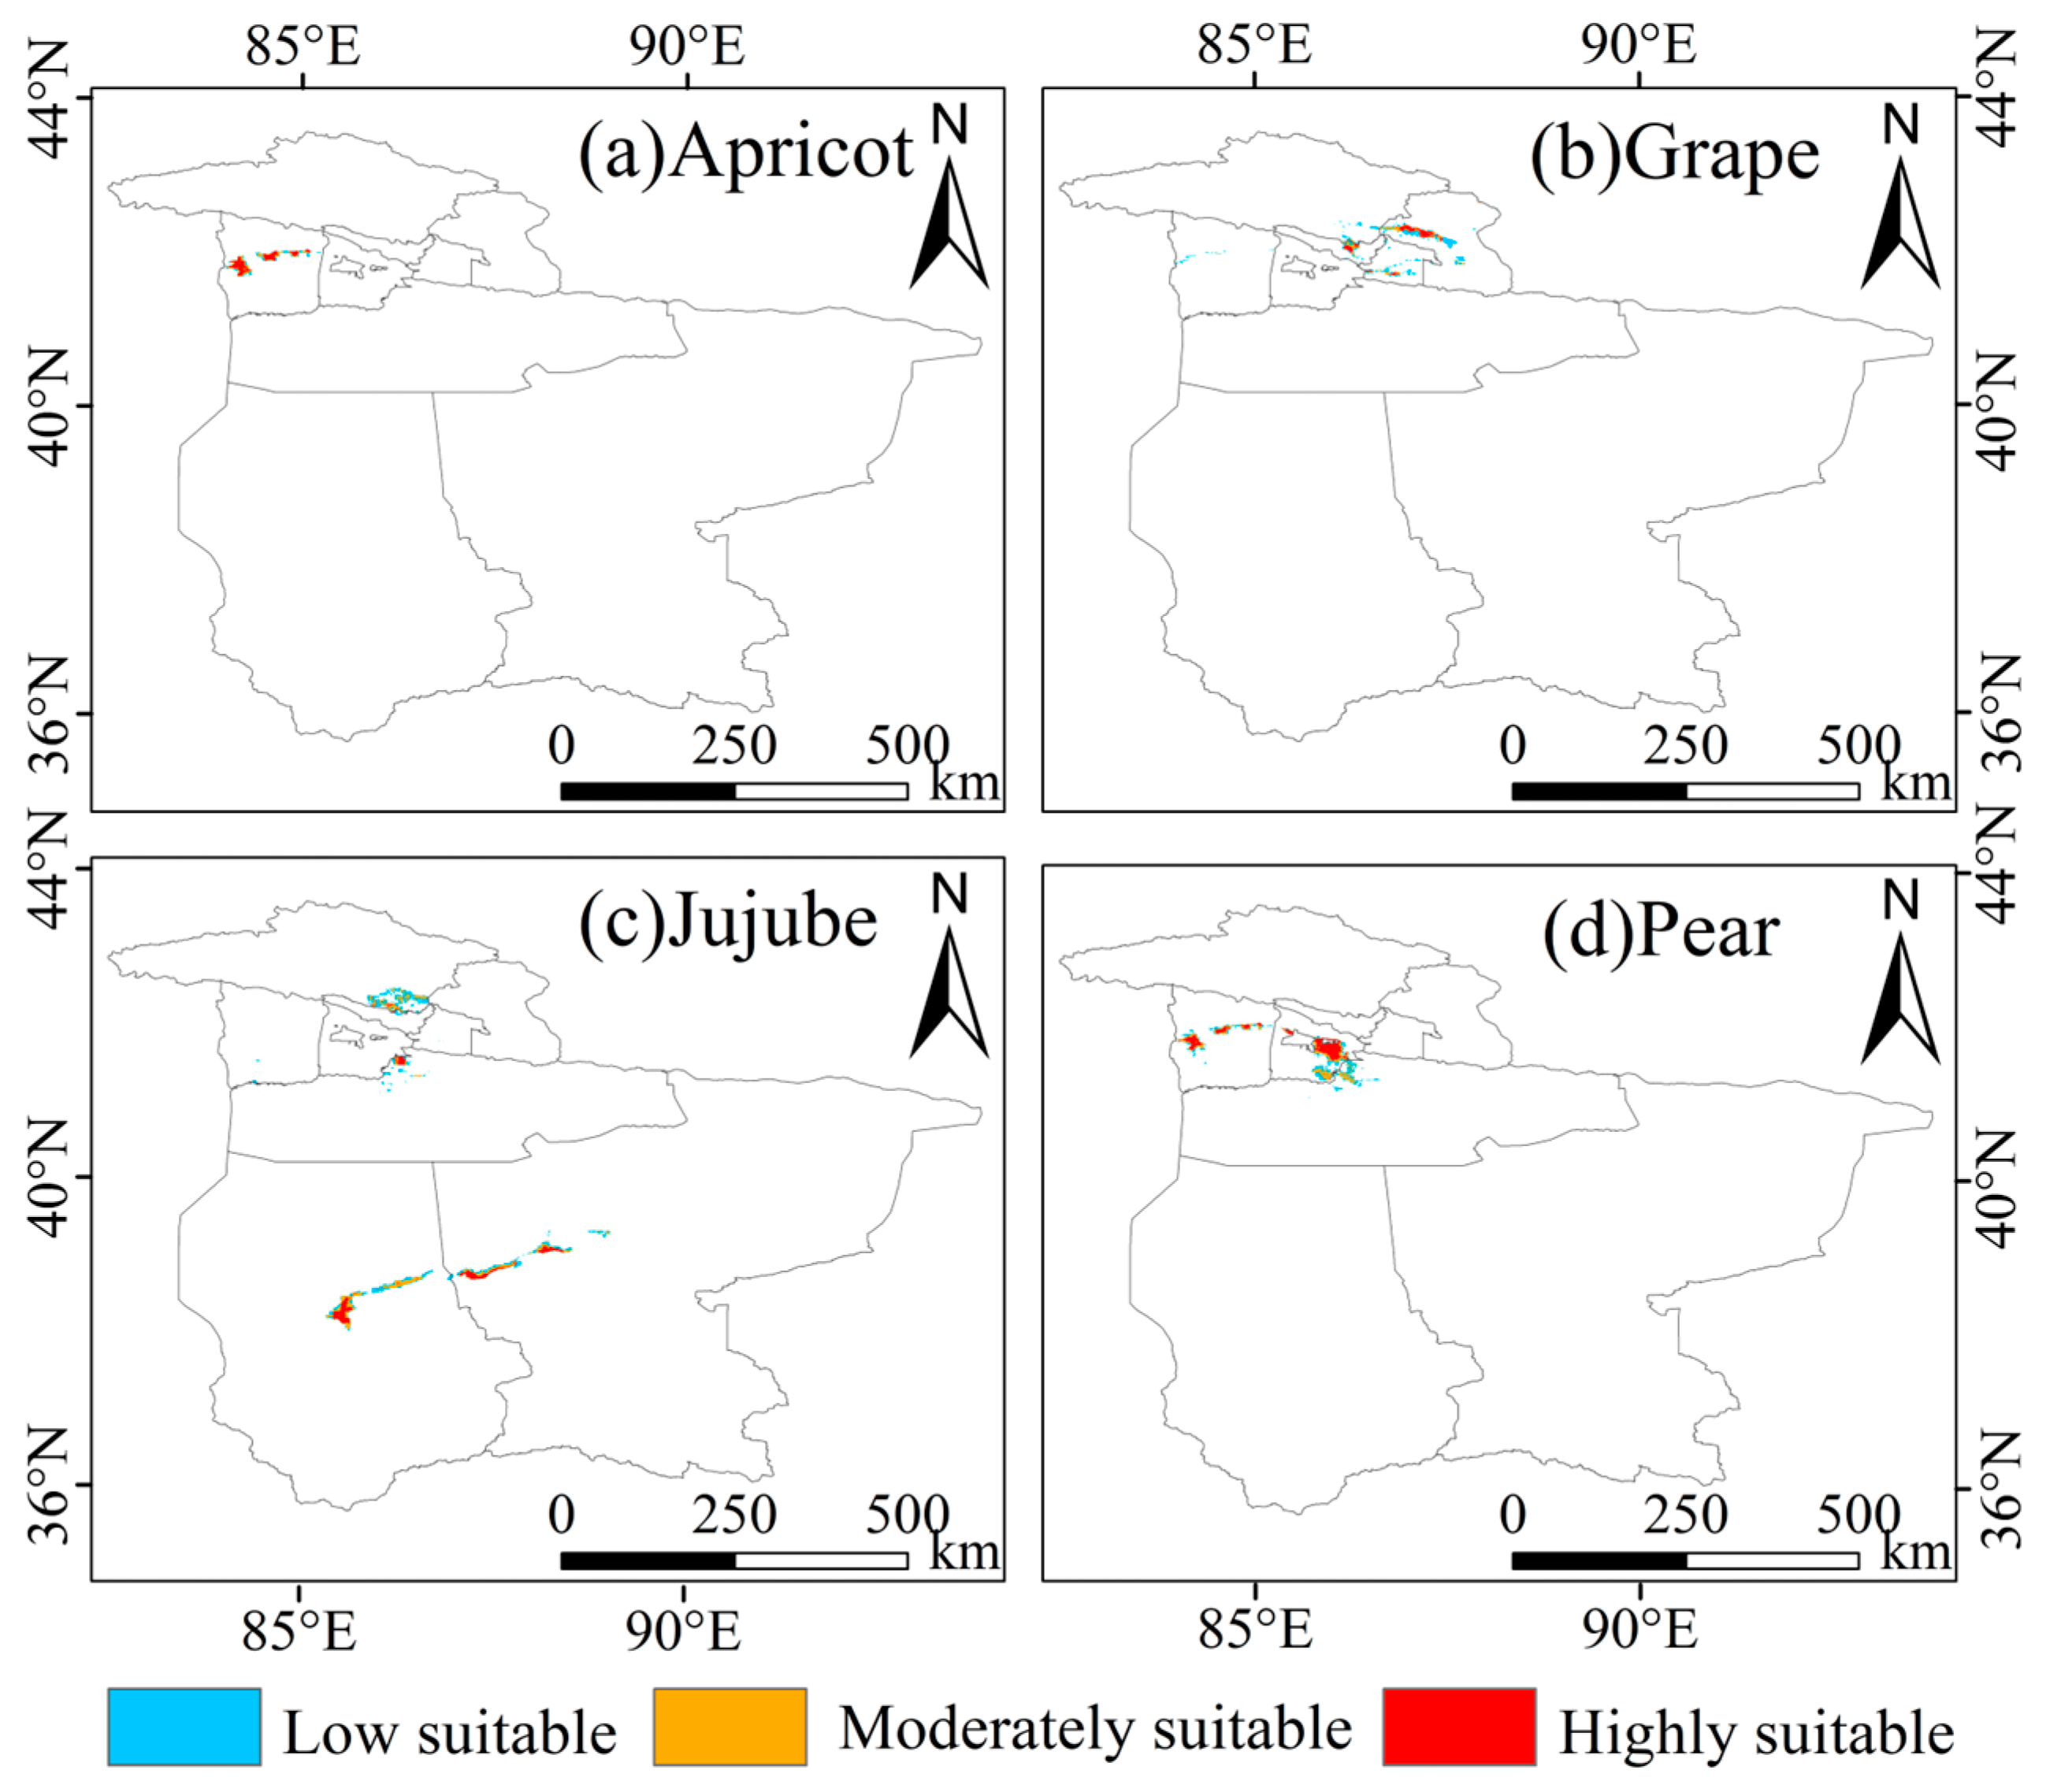
Figure A8.
Potentially suitable areas for major economic forest species in Hotan under the SSP245 scenario (2021–2040), predicted by the MaxEnt model. (a) Apricot, (b) Grape, (c) Jujube, and (d) Walnut.
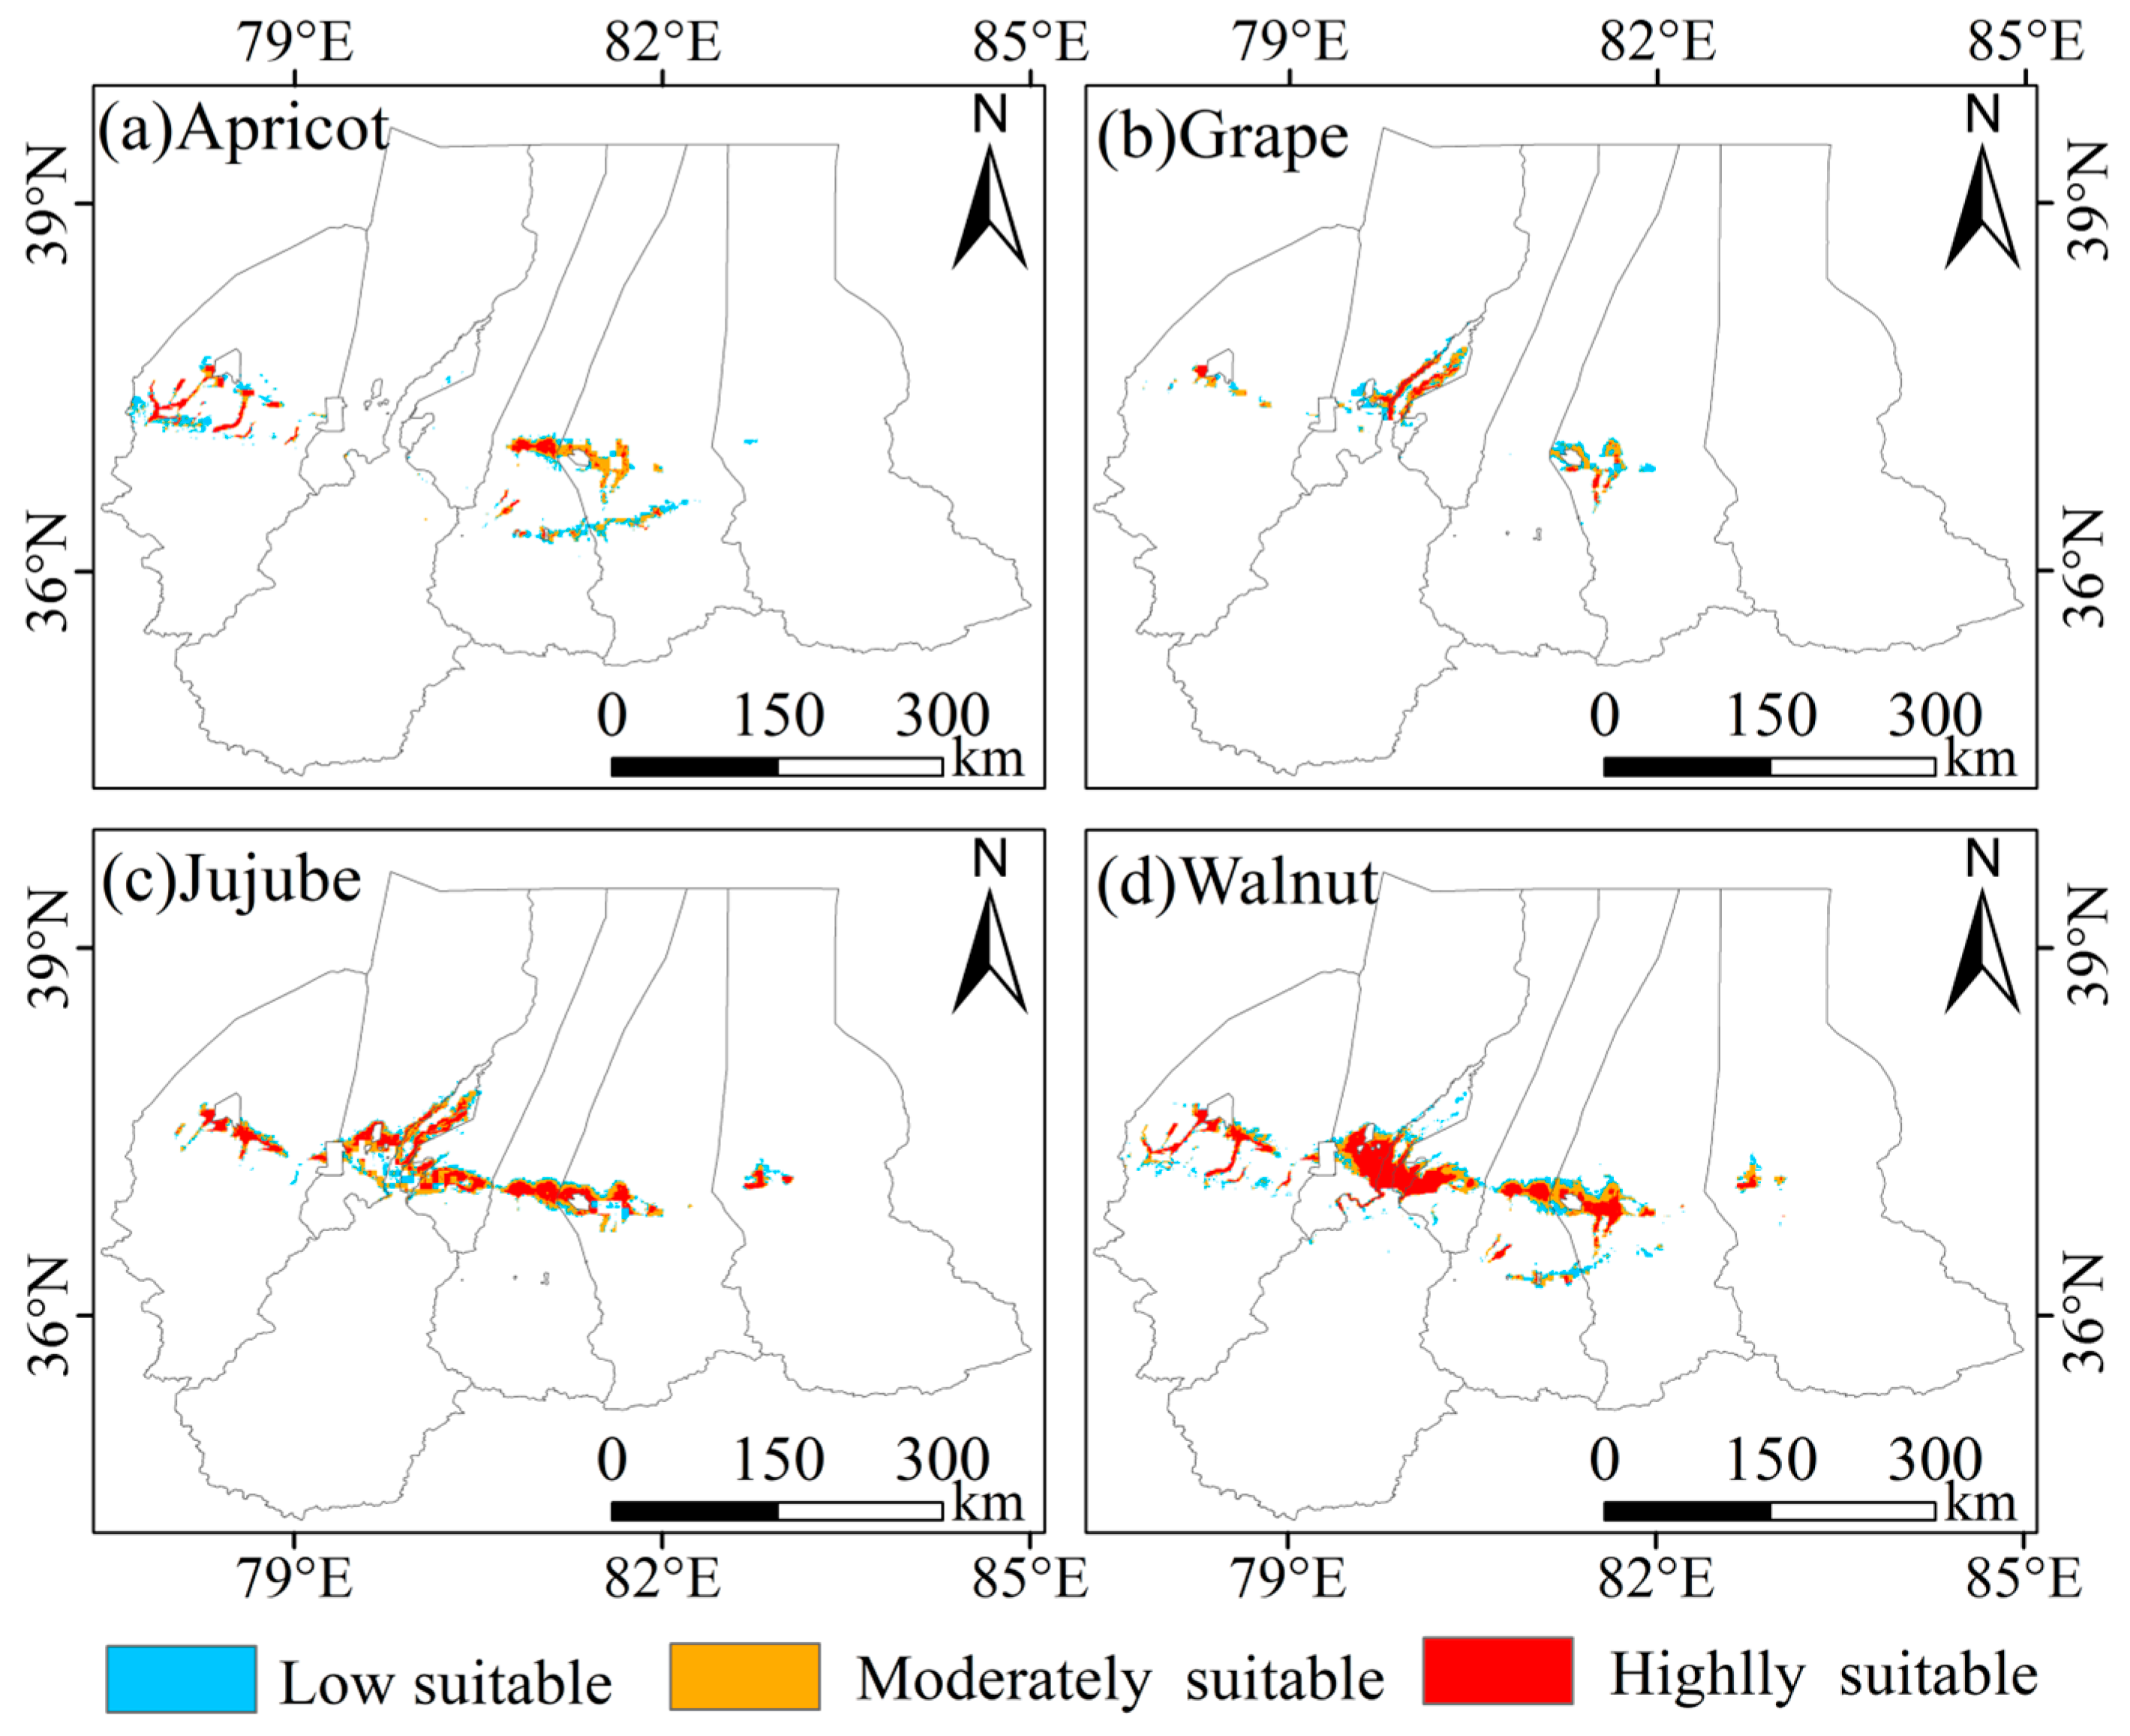
Figure A9.
Potentially suitable areas for major economic forest species in Kashgar under the SSP245 scenario (2021–2040), predicted by the MaxEnt model. (a) Apricot, (b) Grape, (c) Jujube, and (d) Walnut.
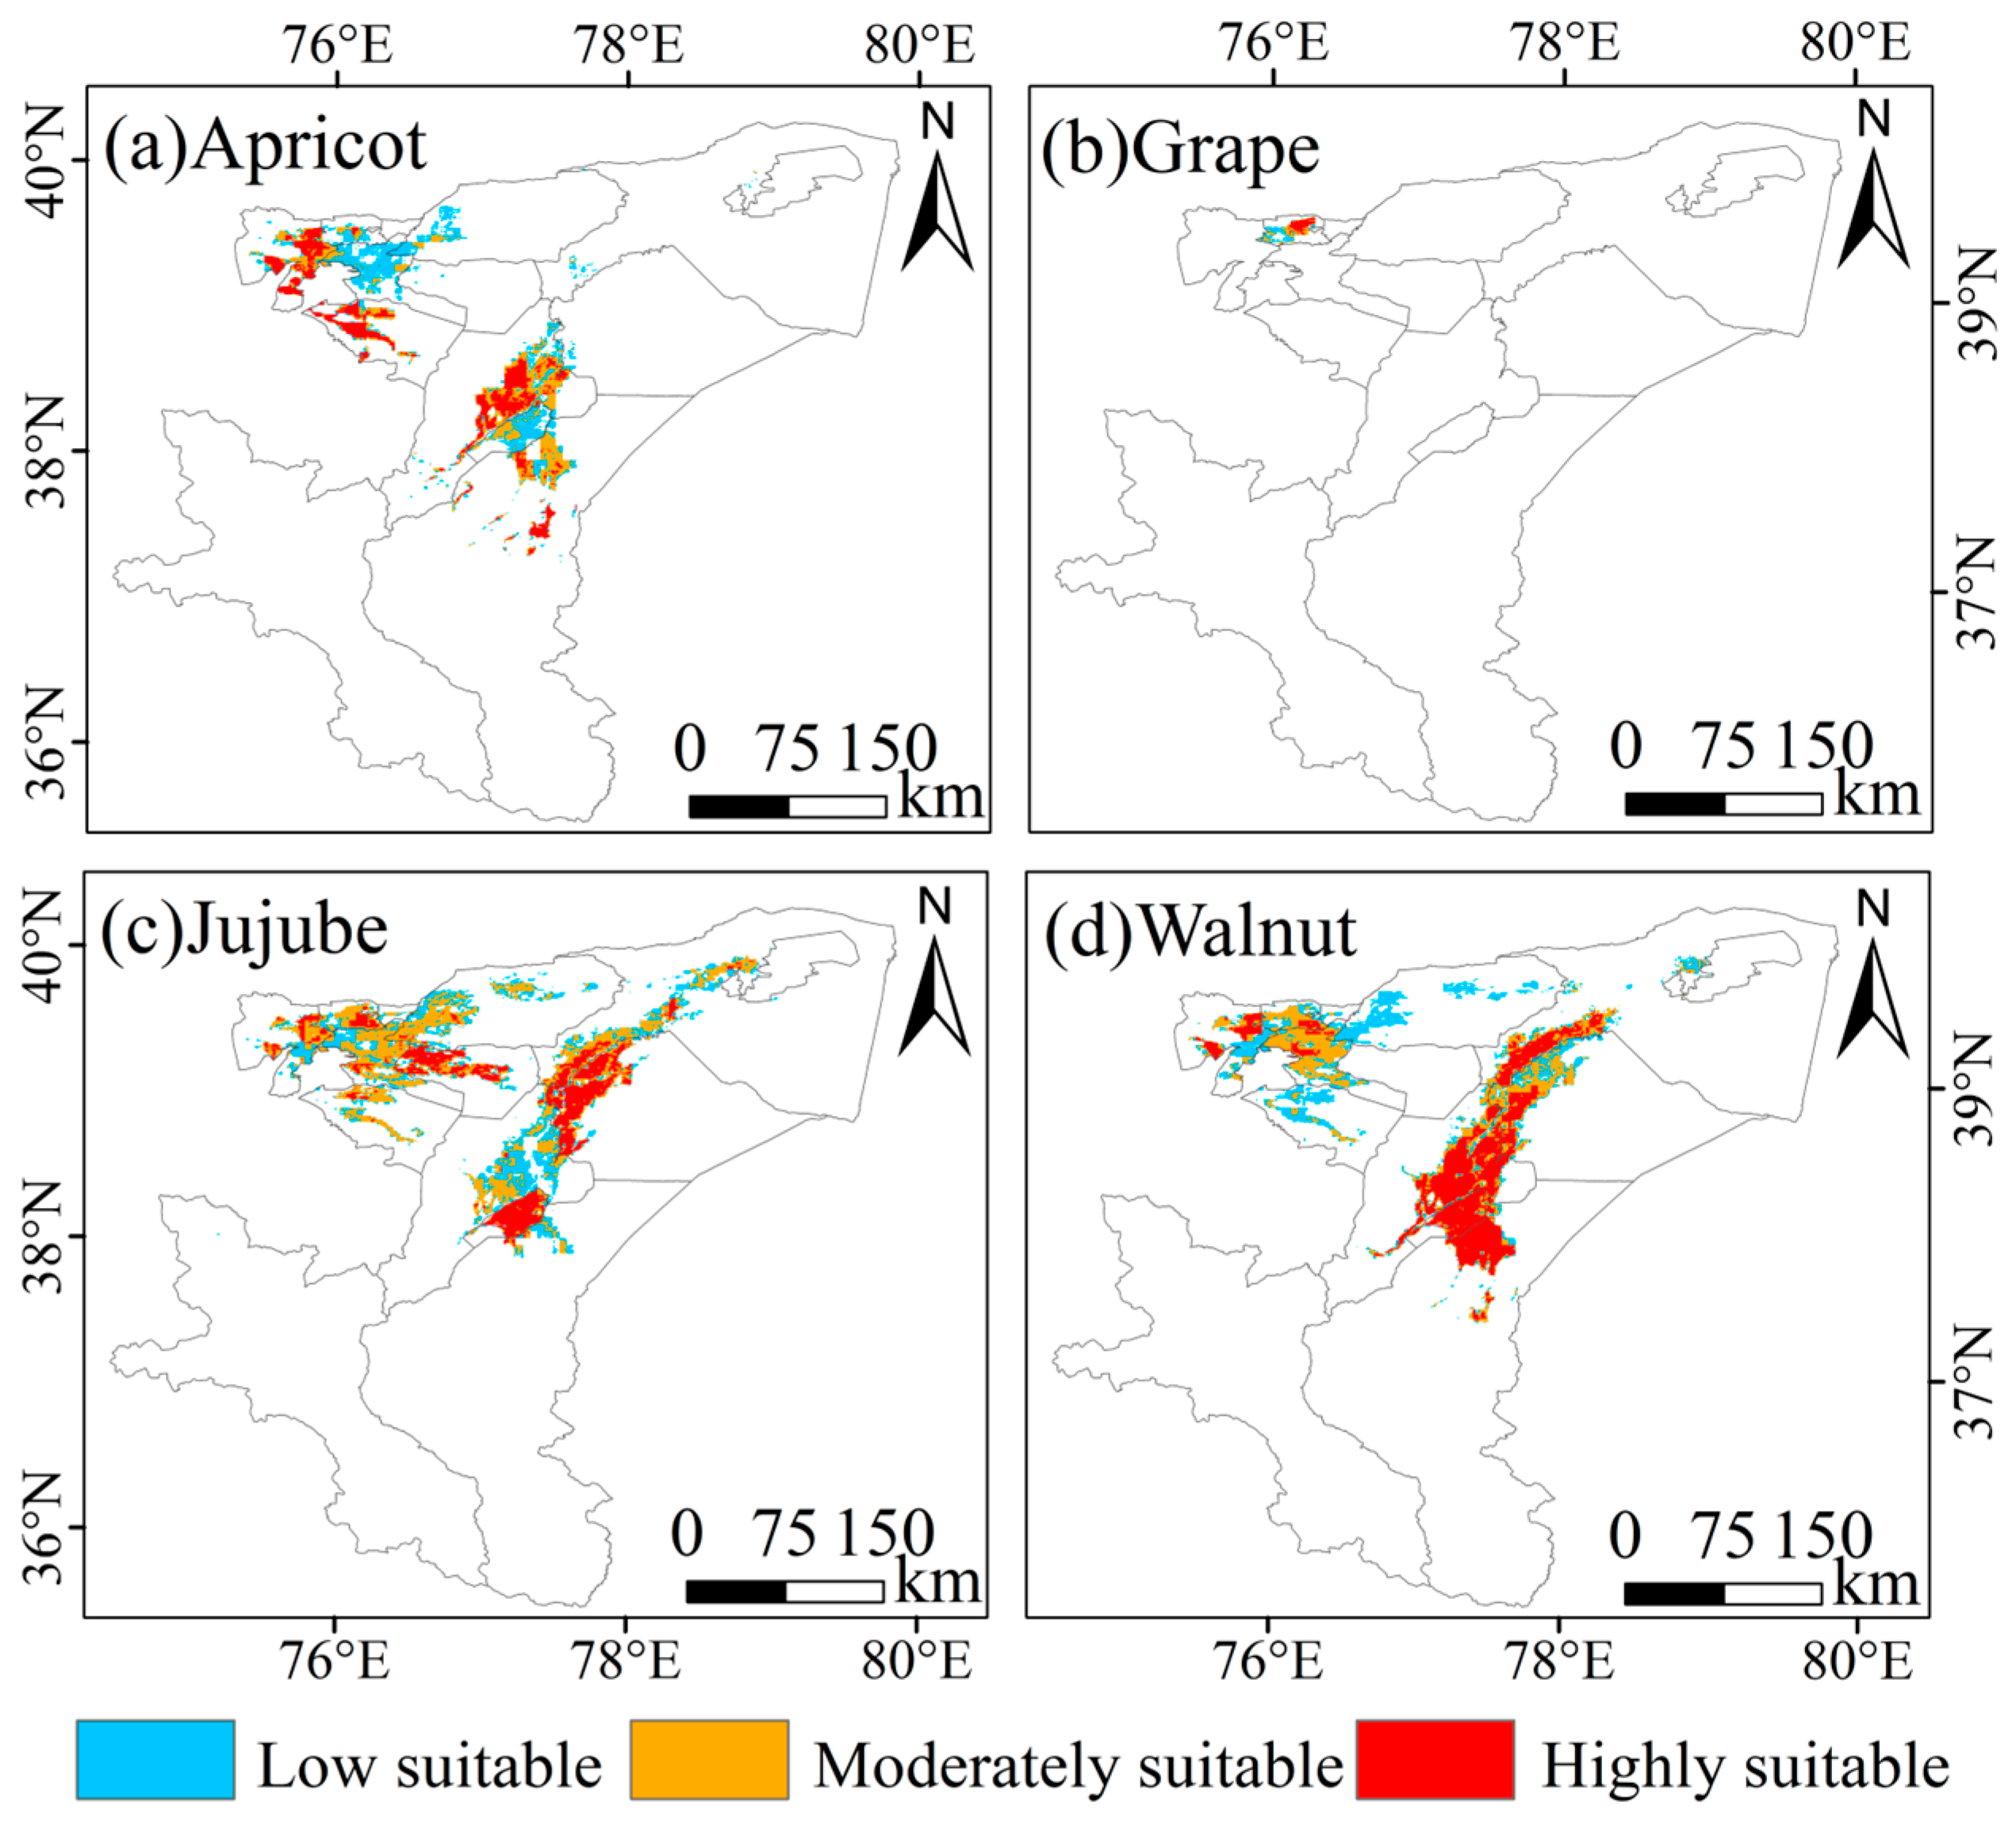
Figure A10.
Potentially suitable areas for major economic forest species in Tuha under the SSP245 scenario (2021–2040), predicted by the MaxEnt model. (a) Apricot, (b) Grape, and (c) Jujube.
References
- Zeng, Y.; Wang, S.; Luan, J.; Yu, M. The Analysis of Tree Species Distribution Information Extraction and Landscape Pattern Based on Remote Sensing Images. Front. Environ. Sci. 2017, 5, 46. [Google Scholar] [CrossRef] [Scilit]
- Filewod, B.; Kant, S. Identifying Economically Relevant Forest Types from Global Satellite Data. For. Policy Econ. 2021, 127, 102452. [Google Scholar] [CrossRef] [Scilit]
- Lin, X.; Chang, B.; Huang, Y.; Jin, X. Predicting the Impact of Climate Change and Land Use Change on the Potential Distribution of Two Economic Forest Trees in Northeastern China. Front. Plant Sci. 2024, 15, 1407867. [Google Scholar] [CrossRef] [Scilit]
- Lu, F.; Li, G.; Wang, R.; Zhang, J. Benefit Analysis of Soil and Water Conservation of Two Typical Economic Forests in Yuyao City. IOP Conf. Ser. Earth Environ. Sci. 2019, 295, 012043. [Google Scholar] [CrossRef] [Scilit]
- Hong, Z.; Jian-Wei, W.; Qiu-Hong, Z.; Yun-Jiang, Y. A Preliminary Study of Oasis Evolution in the Tarim Basin, Xinjiang, China. J. Arid. Environ. 2003, 55, 545–553. [Google Scholar] [CrossRef] [Scilit]
- Yan, H.; Tao, W.; Shao, F.; Su, L.; Wang, Q.; Deng, M.; Zhou, B. Spatiotemporal Patterns and Evolutionary Trends of Eco-Environmental Quality in Arid Regions of Northwest China. Environ. Monit. Assess. 2024, 196, 176. [Google Scholar] [CrossRef] [Scilit]
- Tang, Q.; Chen, H. Water Resources and Oasis Construction in Tarim Basin. Chin. Geogr. Sci. 1992, 2, 173–182. [Google Scholar] [CrossRef] [Scilit]
- Fassnacht, F.E.; Latifi, H.; Stereńczak, K.; Modzelewska, A.; Lefsky, M.; Waser, L.T.; Straub, C.; Ghosh, A. Review of Studies on Tree Species Classification from Remotely Sensed Data. Remote Sens. Environ. 2016, 186, 64–87. [Google Scholar] [CrossRef] [Scilit]
- Xi, Y.; Tian, J.; Jiang, H.; Tian, Q.; Xiang, H.; Xu, N. Mapping Tree Species in Natural and Planted Forests Using Sentinel-2 Images. Remote Sens. Lett. 2022, 13, 544–555. [Google Scholar] [CrossRef] [Scilit]
- Lin, H.; Liu, X.; Han, Z.; Cui, H.; Dian, Y. Identification of Tree Species in Forest Communities at Different Altitudes Based on Multi-Source Aerial Remote Sensing Data. Appl. Sci. 2023, 13, 4911. [Google Scholar] [CrossRef] [Scilit]
- Balzter, H.; Cole, B.; Thiel, C.; Schmullius, C. Mapping CORINE Land Cover from Sentinel-1A SAR and SRTM Digital Elevation Model Data Using Random Forests. Remote Sens. 2015, 7, 14876–14898. [Google Scholar] [CrossRef] [Scilit]
- Griffiths, P.; Kuemmerle, T.; Baumann, M.; Radeloff, V.C.; Abrudan, I.V.; Lieskovsky, J.; Munteanu, C.; Ostapowicz, K.; Hostert, P. Forest Disturbances, Forest Recovery, and Changes in Forest Types across the Carpathian Ecoregion from 1985 to 2010 Based on Landsat Image Composites. Remote Sens. Environ. 2014, 151, 72–88. [Google Scholar] [CrossRef] [Scilit]
- Zhao, Y.; Diao, C.; Augspurger, C.K.; Yang, Z. Monitoring Spring Leaf Phenology of Individual Trees in a Temperate Forest Fragment with Multi-Scale Satellite Time Series. Remote Sens. Environ. 2023, 297, 113790. [Google Scholar] [CrossRef] [Scilit]
- Belgiu, M.; Drăguţ, L. Random Forest in Remote Sensing: A Review of Applications and Future Directions. ISPRS J. Photogramm. Remote Sens. 2016, 114, 24–31. [Google Scholar] [CrossRef] [Scilit]
- Aziz, G.; Minallah, N.; Saeed, A.; Frnda, J.; Khan, W. Remote Sensing Based Forest Cover Classification Using Machine Learning. Sci. Rep. 2024, 14, 69. [Google Scholar] [CrossRef] [Scilit]
- Maxwell, A.E.; Warner, T.A.; Fang, F. Implementation of Machine-Learning Classification in Remote Sensing: An Applied Review. Int. J. Remote Sens. 2018, 39, 2784–2817. [Google Scholar] [CrossRef] [Scilit]
- Zhong, L.; Hu, L.; Zhou, H. Deep Learning Based Multi-Temporal Crop Classification. Remote Sens. Environ. 2019, 221, 430–443. [Google Scholar] [CrossRef] [Scilit]
- Amani, M.; Ghorbanian, A.; Ahmadi, S.A.; Kakooei, M.; Moghimi, A.; Mirmazloumi, S.M.; Moghaddam, S.H.A.; Mahdavi, S.; Ghahremanloo, M.; Parsian, S.; et al. Google Earth Engine Cloud Computing Platform for Remote Sensing Big Data Applications: A Comprehensive Review. IEEE J. Sel. Top. Appl. Earth Obs. Remote Sens. 2020, 13, 5326–5350. [Google Scholar] [CrossRef] [Scilit]
- Yao, J.; Chen, Y.; Guan, X.; Zhao, Y.; Chen, J.; Mao, W. Recent Climate and Hydrological Changes in a Mountain–Basin System in Xinjiang, China. Earth-Sci. Rev. 2022, 226, 103957. [Google Scholar] [CrossRef] [Scilit]
- Duan, Q.; Tan, M.; Guo, Y.; Wang, X.; Xin, L. Understanding the Spatial Distribution of Urban Forests in China Using Sentinel-2 Images with Google Earth Engine. Forests 2019, 10, 729. [Google Scholar] [CrossRef] [Scilit]
- Yang, K.; Luo, Y.; Li, M.; Zhong, S.; Liu, Q.; Li, X. Reconstruction of Sentinel-2 Image Time Series Using Google Earth Engine. Remote Sens. 2022, 14, 4395. [Google Scholar] [CrossRef] [Scilit]
- Mullissa, A.; Vollrath, A.; Odongo-Braun, C.; Slagter, B.; Balling, J.; Gou, Y.; Gorelick, N.; Reiche, J. Sentinel-1 SAR Backscatter Analysis Ready Data Preparation in Google Earth Engine. Remote Sens. 2021, 13, 1954. [Google Scholar] [CrossRef] [Scilit]
- Dagne, S.S.; Hirpha, H.H.; Tekoye, A.T.; Dessie, Y.B.; Endeshaw, A.A. Fusion of Sentinel-1 SAR and Sentinel-2 MSI Data for Accurate Urban Land Use-Land Cover Classification in Gondar City, Ethiopia. Environ. Syst. Res. 2023, 12, 40. [Google Scholar] [CrossRef] [Scilit]
- Tassi, A.; Vizzari, M. Object-Oriented LULC Classification in Google Earth Engine Combining SNIC, GLCM, and Machine Learning Algorithms. Remote Sens. 2020, 12, 3776. [Google Scholar] [CrossRef] [Scilit]
- Haralick, R.M.; Shanmugam, K.; Dinstein, I. Textural Features for Image Classification. IEEE Trans. Syst. Man Cybern. 1973, SMC-3, 610–621. [Google Scholar] [CrossRef] [Scilit]
- Caballero, G.R.; Platzeck, G.; Pezzola, A.; Casella, A.; Winschel, C.; Silva, S.S.; Ludueña, E.; Pasqualotto, N.; Delegido, J. Assessment of Multi-Date Sentinel-1 Polarizations and GLCM Texture Features Capacity for Onion and Sunflower Classification in an Irrigated Valley: An Object Level Approach. Agronomy 2020, 10, 845. [Google Scholar] [CrossRef] [Scilit]
- Ji, L.; Peters, A.J. Assessing Vegetation Response to Drought in the Northern Great Plains Using Vegetation and Drought Indices. Remote Sens. Environ. 2003, 87, 85–98. [Google Scholar] [CrossRef] [Scilit]
- Su, Y.; Guo, Q. A Practical Method for SRTM DEM Correction over Vegetated Mountain Areas. ISPRS J. Photogramm. Remote Sens. 2014, 87, 216–228. [Google Scholar] [CrossRef] [Scilit]
- Wardlow, B.D.; Egbert, S.L. A Comparison of MODIS 250-m EVI and NDVI Data for Crop Mapping: A Case Study for Southwest Kansas. Int. J. Remote Sens. 2010, 31, 805–830. [Google Scholar] [CrossRef] [Scilit]
- Huete, A.; Didan, K.; Miura, T.; Rodriguez, E.P.; Gao, X.; Ferreira, L.G. Overview of the Radiometric and Biophysical Performance of the MODIS Vegetation Indices. Remote Sens. Environ. 2002, 83, 195–213. [Google Scholar] [CrossRef] [Scilit]
- Clevers, J.G.P.W.; Gitelson, A.A. Remote Estimation of Crop and Grass Chlorophyll and Nitrogen Content Using Red-Edge Bands on Sentinel-2 and -3. Int. J. Appl. Earth Obs. Geoinf. 2013, 23, 344–351. [Google Scholar] [CrossRef] [Scilit]
- Hologa, R.; Scheffczyk, K.; Dreiser, C.; Gärtner, S. Tree Species Classification in a Temperate Mixed Mountain Forest Landscape Using Random Forest and Multiple Datasets. Remote Sens. 2021, 13, 4657. [Google Scholar] [CrossRef] [Scilit]
- Chen, C.; Liang, J.; Sun, W.; Yang, G.; Meng, X. An Automatically Recursive Feature Elimination Method Based on Threshold Decision in Random Forest Classification. Geo-Spat. Inf. Sci. 2024, 28, 1494–1519. [Google Scholar] [CrossRef] [Scilit]
- Persson, M.; Lindberg, E.; Reese, H. Tree Species Classification with Multi-Temporal Sentinel-2 Data. Remote Sens. 2018, 10, 1794. [Google Scholar] [CrossRef] [Scilit]
- Ma, X.; Blaschko, M.B. Additive Tree-Structured Conditional Parameter Spaces in Bayesian Optimization: A Novel Covariance Function and a Fast Implementation. IEEE Trans. Pattern Anal. Mach. Intell. 2021, 43, 3024–3036. [Google Scholar] [CrossRef] [Scilit]
- Foody, G.M. Explaining the Unsuitability of the Kappa Coefficient in the Assessment and Comparison of the Accuracy of Thematic Maps Obtained by Image Classification. Remote Sens. Environ. 2020, 239, 111630. [Google Scholar] [CrossRef] [Scilit]
- Phillips, S.J.; Anderson, R.P.; Schapire, R.E. Maximum Entropy Modeling of Species Geographic Distributions. Ecol. Model. 2006, 190, 231–259. [Google Scholar] [CrossRef] [Scilit]
- Elith, J.; Phillips, S.J.; Hastie, T.; Dudík, M.; Chee, Y.E.; Yates, C.J. A Statistical Explanation of MaxEnt for Ecologists. Divers. Distrib. 2011, 17, 43–57. [Google Scholar] [CrossRef] [Scilit]
- Boria, R.A.; Olson, L.E.; Goodman, S.M.; Anderson, R.P. Spatial Filtering to Reduce Sampling Bias Can Improve the Performance of Ecological Niche Models. Ecol. Model. 2014, 275, 73–77. [Google Scholar] [CrossRef] [Scilit]
- Fick, S.E.; Hijmans, R.J. WorldClim 2: New 1-Km Spatial Resolution Climate Surfaces for Global Land Areas. Int. J. Climatol. 2017, 37, 4302–4315. [Google Scholar] [CrossRef] [Scilit]
- O’Neill, B.C.; Tebaldi, C.; van Vuuren, D.P.; Eyring, V.; Friedlingstein, P.; Hurtt, G.; Knutti, R.; Kriegler, E.; Lamarque, J.-F.; Lowe, J.; et al. The Scenario Model Intercomparison Project (ScenarioMIP) for CMIP6. Geosci. Model Dev. 2016, 9, 3461–3482. [Google Scholar] [CrossRef] [Scilit]
- Savitha, C.; Talari, R. Evaluating the Performance of Random Forest, Support Vector Machine, Gradient Tree Boost, and CART for Improved Crop-Type Monitoring Using Greenest Pixel Composite in Google Earth Engine. Environ. Monit. Assess. 2025, 197, 437. [Google Scholar] [CrossRef] [Scilit] [PubMed]
- Brinkhoff, J.; Vardanega, J.; Robson, A.J. Land Cover Classification of Nine Perennial Crops Using Sentinel-1 and -2 Data. Remote Sens. 2020, 12, 96. [Google Scholar] [CrossRef] [Scilit]
- Huang, Y.; Li, D.; Liu, X.; Ren, Z. Monitoring Canopy SPAD Based on UAV and Multispectral Imaging over Fruit Tree Growth Stages and Species. Front. Plant Sci. 2024, 15, 1435613. [Google Scholar] [CrossRef] [Scilit]
- Luo, H.; Dai, S.; Hu, Y.; Zheng, Q.; Yu, X.; Chen, B.; Li, Y.; Wang, C.; Li, H. Integrating Knowledge-Based and Machine Learning for Betel Palm Mapping on Hainan Island Using Sentinel-1/2 and Google Earth Engine. Plants 2025, 14, 2696. [Google Scholar] [CrossRef] [Scilit]
- Liang, X.; Chen, J.; Gong, W.; Puttonen, E.; Wang, Y. Influence of Data and Methods on High-Resolution Imagery-Based Tree Species Recognition Considering Phenology: The Case of Temperate Forests. Remote Sens. Environ. 2025, 323, 114654. [Google Scholar] [CrossRef] [Scilit]
- Hemati, M.; Hasanlou, M.; Mahdianpari, M.; Mohammadimanesh, F. Iranian Wetland Inventory Map at a Spatial Resolution of 10 m Using Sentinel-1 and Sentinel-2 Data on the Google Earth Engine Cloud Computing Platform. Environ. Monit. Assess. 2023, 195, 558. [Google Scholar] [CrossRef] [Scilit]
- Rehman, A.U.; Zhang, L.; Sajjad, M.M.; Raziq, A. Multi-Temporal Sentinel-1 and Sentinel-2 Data for Orchards Discrimination in Khairpur District, Pakistan Using Spectral Separability Analysis and Machine Learning Classification. Remote Sens. 2024, 16, 686. [Google Scholar] [CrossRef] [Scilit]
- Silveira, E.M.O.; Radeloff, V.C.; Martinuzzi, S.; Martinez Pastur, G.J.; Bono, J.; Politi, N.; Lizarraga, L.; Rivera, L.O.; Ciuffoli, L.; Rosas, Y.M.; et al. Nationwide Native Forest Structure Maps for Argentina Based on Forest Inventory Data, SAR Sentinel-1 and Vegetation Metrics from Sentinel-2 Imagery. Remote Sens. Environ. 2023, 285, 113391. [Google Scholar] [CrossRef] [Scilit]
- Borlaf-Mena, I.; García-Duro, J.; Santoro, M.; Villard, L.; Badea, O.; Tanase, M.A. Seasonality and Directionality Effects on Radar Backscatter Are Key to Identify Mountain Forest Types with Sentinel-1 Data. Remote Sens. Environ. 2023, 296, 113728. [Google Scholar] [CrossRef] [Scilit]
- Laborde, H.; Douzal, V.; Ruiz Piña, H.A.; Morand, S.; Cornu, J.-F. Landsat-8 Cloud-Free Observations in Wet Tropical Areas: A Case Study in South East Asia. Remote Sens. Lett. 2017, 8, 537–546. [Google Scholar] [CrossRef] [Scilit]
- Han, L.; Wang, X.; Li, D.; Yu, W.; Feng, Z.; Lu, X.; Wang, S.; Zhang, Z.; Gao, X.; Fan, J. A Novel Approach to Mapping the Spatial Distribution of Fruit Trees Using Phenological Characteristics. Agronomy 2024, 14, 150. [Google Scholar] [CrossRef] [Scilit]
- Valderrama-Landeros, L.; Flores-Verdugo, F.; Rodríguez-Sobreyra, R.; Kovacs, J.M.; Flores-de-Santiago, F. Extrapolating Canopy Phenology Information Using Sentinel-2 Data and the Google Earth Engine Platform to Identify the Optimal Dates for Remotely Sensed Image Acquisition of Semiarid Mangroves. J. Environ. Manag. 2021, 279, 111617. [Google Scholar] [CrossRef] [Scilit] [PubMed]
- Dingle Robertson, L.; Davidson, A.M.; McNairn, H.; Hosseini, M.; Mitchell, S.; de Abelleyra, D.; Verón, S.; le Maire, G.; Plannells, M.; Valero, S.; et al. C-Band Synthetic Aperture Radar (SAR) Imagery for the Classification of Diverse Cropping Systems. Int. J. Remote Sens. 2020, 41, 9628–9649. [Google Scholar] [CrossRef] [Scilit]
- Valero, S.; Arnaud, L.; Planells, M.; Ceschia, E. Synergy of Sentinel-1 and Sentinel-2 Imagery for Early Seasonal Agricultural Crop Mapping. Remote Sens. 2021, 13, 4891. [Google Scholar] [CrossRef] [Scilit]
- Cheng, G.; Ding, H.; Yang, J.; Cheng, Y. Crop Type Classification with Combined Spectral, Texture, and Radar Features of Time-Series Sentinel-1 and Sentinel-2 Data. Int. J. Remote Sens. 2023, 44, 1215–1237. [Google Scholar] [CrossRef] [Scilit]
- Van Tricht, K.; Gobin, A.; Gilliams, S.; Piccard, I. Synergistic Use of Radar Sentinel-1 and Optical Sentinel-2 Imagery for Crop Mapping: A Case Study for Belgium. Remote Sens. 2018, 10, 1642. [Google Scholar] [CrossRef] [Scilit]
- Altobelli, F.; Napoli, M.; Benedetti, A.; Vargas, R.; Corti, G.; Montanarella, L. Land Set up Systems and beyond: Influence of Soil Management on Water and Soil Conservation Sewed up to a Variety of Pedoclimatic Environments and Farming Systems: Soils and the European Green Deal. Ital. J. Agron. 2020, 15, 1771. [Google Scholar] [CrossRef] [Scilit]
- Siebert, S.; Burke, J.; Faures, J.M.; Frenken, K.; Hoogeveen, J.; Döll, P.; Portmann, F.T. Groundwater Use for Irrigation—A Global Inventory. Hydrol. Earth Syst. Sci. 2010, 14, 1863–1880. [Google Scholar] [CrossRef] [Scilit]
- Kirchhoff, M.; Romes, T.; Marzolff, I.; Seeger, M.; Aït Hssaine, A.; Ries, J.B. Spatial Distribution of Argan Tree Influence on Soil Properties in Southern Morocco. SOIL 2021, 7, 511–524. [Google Scholar] [CrossRef] [Scilit]
- Suwarno, A.; Hein, L.; Weikard, H.-P.; van Noordwijk, M.; Nugroho, B. Land-Use Trade-Offs in the Kapuas Peat Forest, Central Kalimantan, Indonesia. Land Use Policy 2018, 75, 340–351. [Google Scholar] [CrossRef] [Scilit]
- Liu, J.-J.; Diao, Z.-H.; Xu, X.-R.; Xie, Q. Effects of Dissolved Oxygen, Salinity, Nitrogen and Phosphorus on the Release of Heavy Metals from Coastal Sediments. Sci. Total Environ. 2019, 666, 894–901. [Google Scholar] [CrossRef] [Scilit]
- Zhang, Q.; Sun, C.; Chen, Y.; Chen, W.; Xiang, Y.; Li, J.; Liu, Y. Recent Oasis Dynamics and Ecological Security in the Tarim River Basin, Central Asia. Sustainability 2022, 14, 3372. [Google Scholar] [CrossRef] [Scilit]
- Wei, X.-P.; Pan, X.-Y.; Zhao, C.-M.; Wang, G.-X.; Deng, J.-M. Response of Three Dominant Shrubs to Soil Water and Groundwater along the Oasis-Desert Ecotone in Northwest China. Russ. J. Ecol. 2008, 39, 475–482. [Google Scholar] [CrossRef] [Scilit]
- Kremen, C.; Miles, A. Ecosystem Services in Biologically Diversified versus Conventional Farming Systems: Benefits, Externalities, and Trade-Offs. Ecol. Soc. 2012, 17, 40. [Google Scholar] [CrossRef] [Scilit]
- Elith, J.H.; Graham, C.P.H.; Anderson, R.P.; Dudík, M.; Ferrier, S.; Guisan, A.; Hijmans, R.J.; Huettmann, F.; Leathwick, J.R.; Lehmann, A.; et al. Novel Methods Improve Prediction of Species’ Distributions from Occurrence Data. Ecography 2006, 29, 129–151. [Google Scholar] [CrossRef] [Scilit]
- Zurell, D.; Franklin, J.; König, C.; Bouchet, P.; Dormann, C.; Elith, J.; Fandos, G.; Feng, X.; Guillera-Arroita, G.; Guisan, A.; et al. A Standard Protocol for Reporting Species Distribution Models. Ecography 2020, 43, 1261–1277. [Google Scholar] [CrossRef] [Scilit]
- Javanbakht-Sheikhahmad, F.; Rostami, F.; Azadi, H.; Veisi, H.; Amiri, F.; Witlox, F. Agricultural Water Resource Management in the Socio-Hydrology: A Framework for Using System Dynamics Simulation. Water Resour. Manag. 2024, 38, 2753–2772. [Google Scholar] [CrossRef] [Scilit]
- Araújo, M.B.; Anderson, R.P.; Márcia Barbosa, A.; Beale, C.M.; Dormann, C.F.; Early, R.; Garcia, R.A.; Guisan, A.; Maiorano, L.; Naimi, B.; et al. Standards for Distribution Models in Biodiversity Assessments. Sci. Adv. 2019, 5, eaat4858. [Google Scholar] [CrossRef] [Scilit]
- Minhas, P.; Yadav, R.; Sharma, P. Managing Salt-Affected Soils for Sustainable Agriculture; Directorate of Knowledge Management in Agriculture, Indian Council of Agricultural Research: New Delhi, India, 2021; ISBN 978-81-7164-196-3. [Google Scholar]
- Vasconcelos, R.N.; Cantillo-Pérez, T.; Franca Rocha, W.J.S.; Aguiar, W.M.; Mendes, D.T.; de Jesus, T.B.; de Santana, C.O.; de Santana, M.M.M.; Oliveira, R.P. Advances and Challenges in Species Ecological Niche Modeling: A Mixed Review. Earth 2024, 5, 963–989. [Google Scholar] [CrossRef] [Scilit]
- Zhang, X.; Yang, M.; Guo, R.; Li, Y.; Zhong, F. Land Use Transition and Regional Development Patterns Under Shared Socioeconomic Pathways: Evidence from Prefecture-Level Cities in China. Land 2025, 14, 454. [Google Scholar] [CrossRef] [Scilit]
- Jensen, R.R.; Hardin, P.J.; Hardin, A.J. Classification of Urban Tree Species Using Hyperspectral Imagery. Geocarto Int. 2012, 27, 443–458. [Google Scholar] [CrossRef] [Scilit]
- Dong, C.; Naghedolfeizi, M.; Aberra, D.; Zeng, X. Spectral–Spatial Discriminant Feature Learning for Hyperspectral Image Classification. Remote Sens. 2019, 11, 1552. [Google Scholar] [CrossRef] [Scilit]
- Frantz, D.; Röder, A.; Stellmes, M.; Hill, J. Phenology-Adaptive Pixel-Based Compositing Using Optical Earth Observation Imagery. Remote Sens. Environ. 2017, 190, 331–347. [Google Scholar] [CrossRef] [Scilit]
- Cai, L.; Shi, W.; Miao, Z.; Hao, M. Accuracy Assessment Measures for Object Extraction from Remote Sensing Images. Remote Sens. 2018, 10, 303. [Google Scholar] [CrossRef] [Scilit]
- Abera, T.A.; Vuorinne, I.; Munyao, M.; Pellikka, P.K.E.; Heiskanen, J. Land Cover Map for Multifunctional Landscapes of Taita Taveta County, Kenya, Based on Sentinel-1 Radar, Sentinel-2 Optical, and Topoclimatic Data. Data 2022, 7, 36. [Google Scholar] [CrossRef] [Scilit]
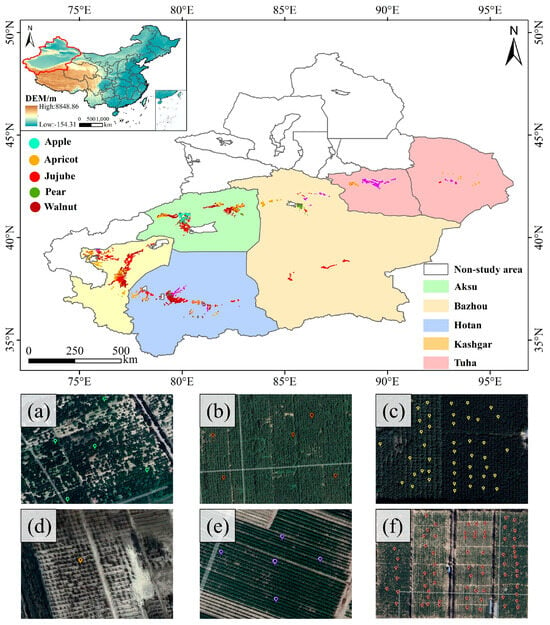
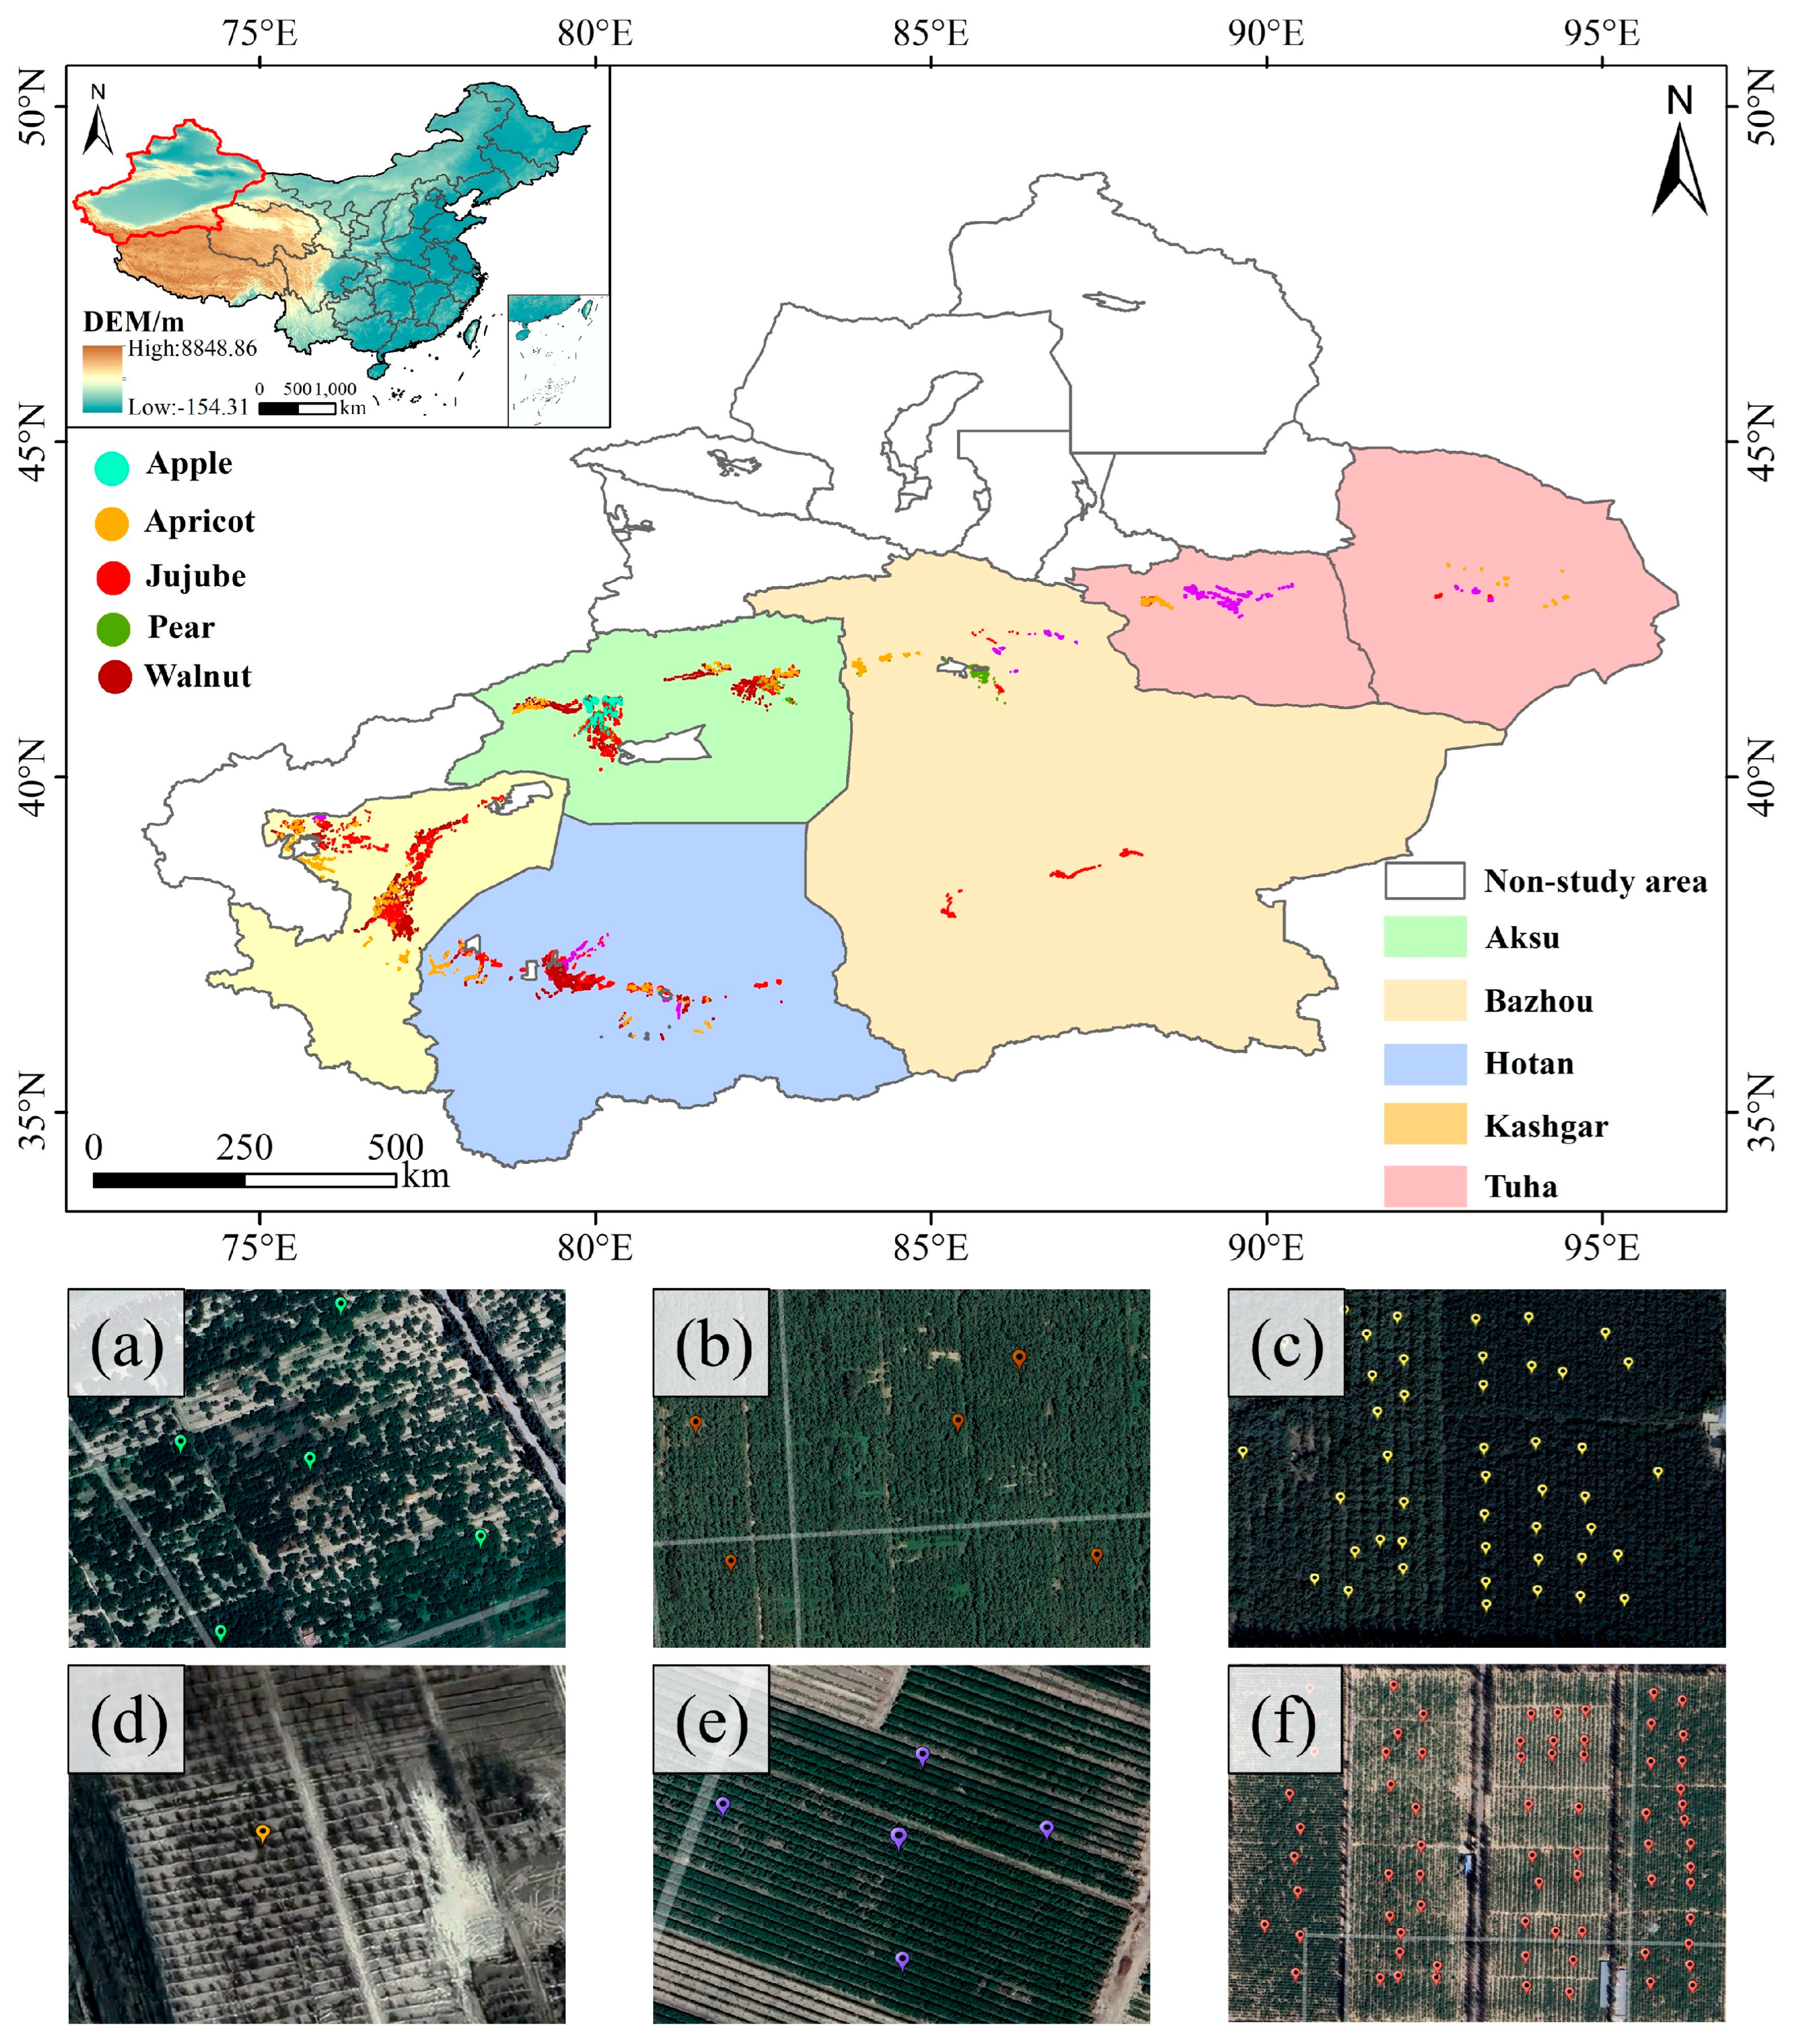
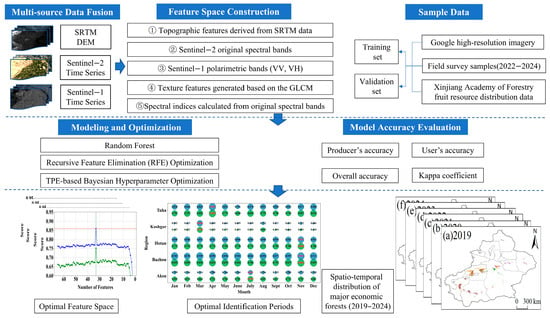
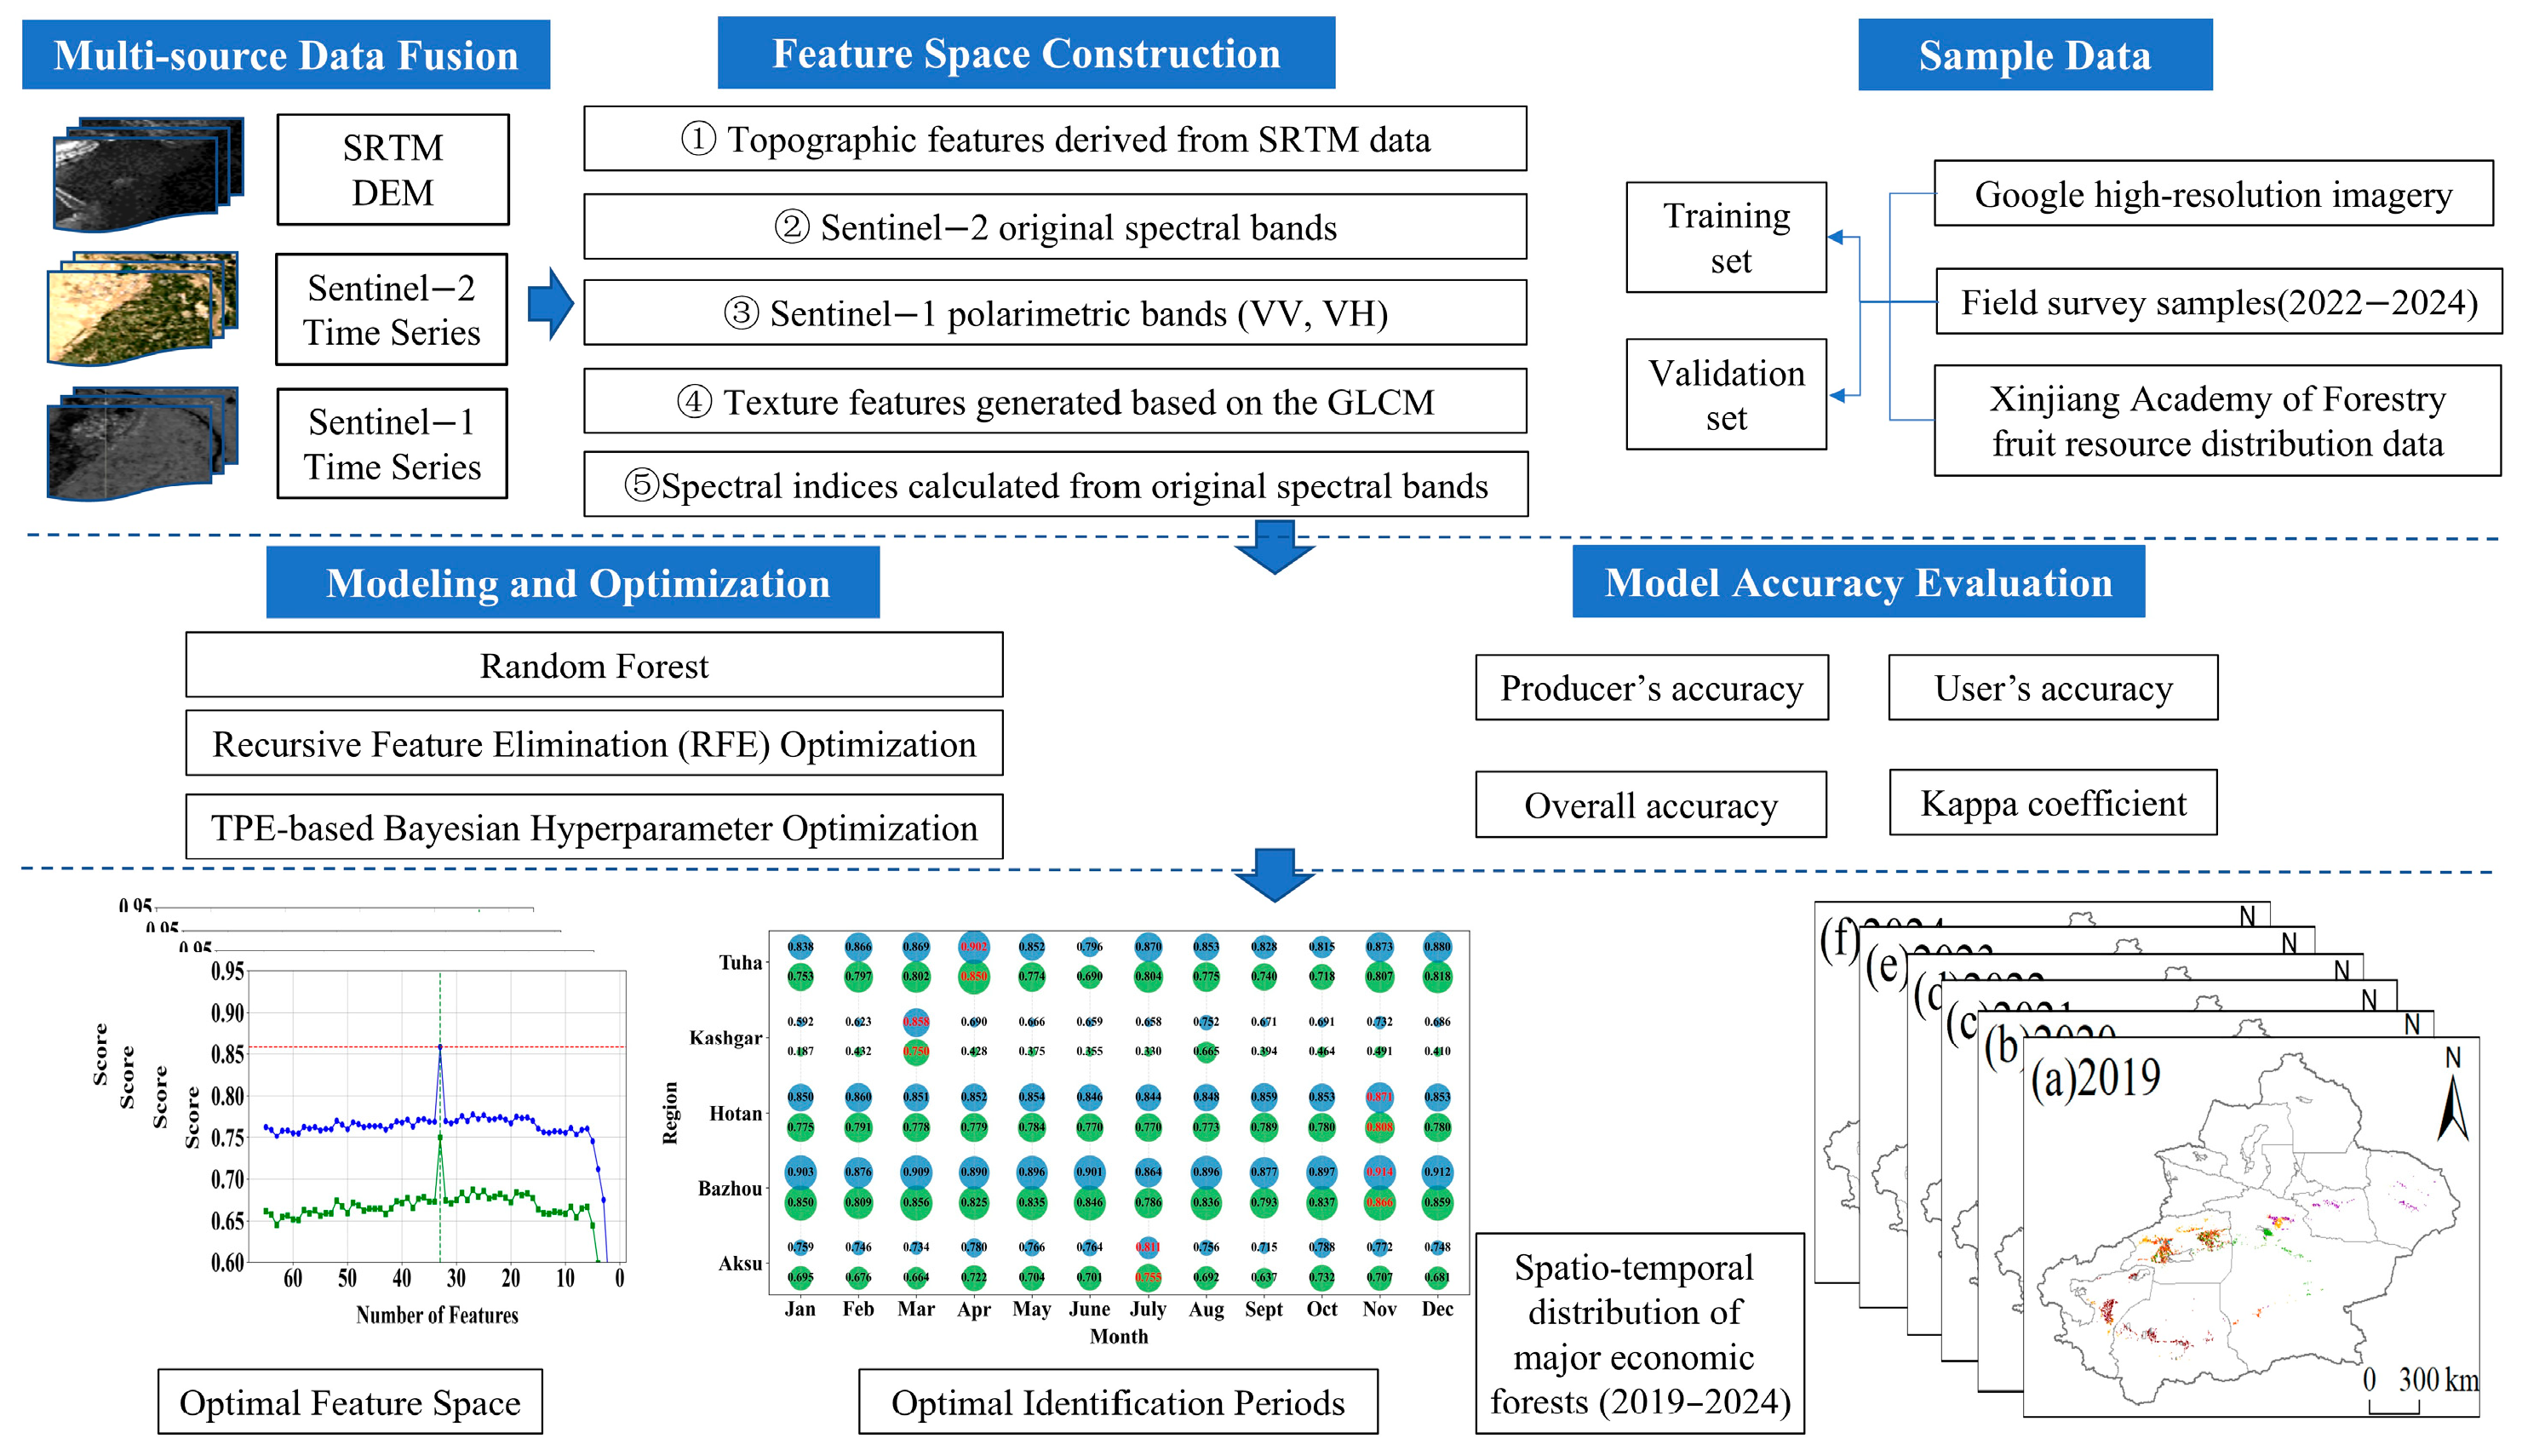
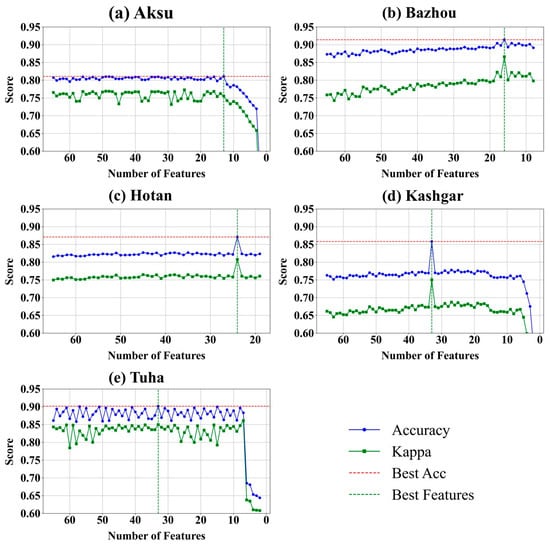
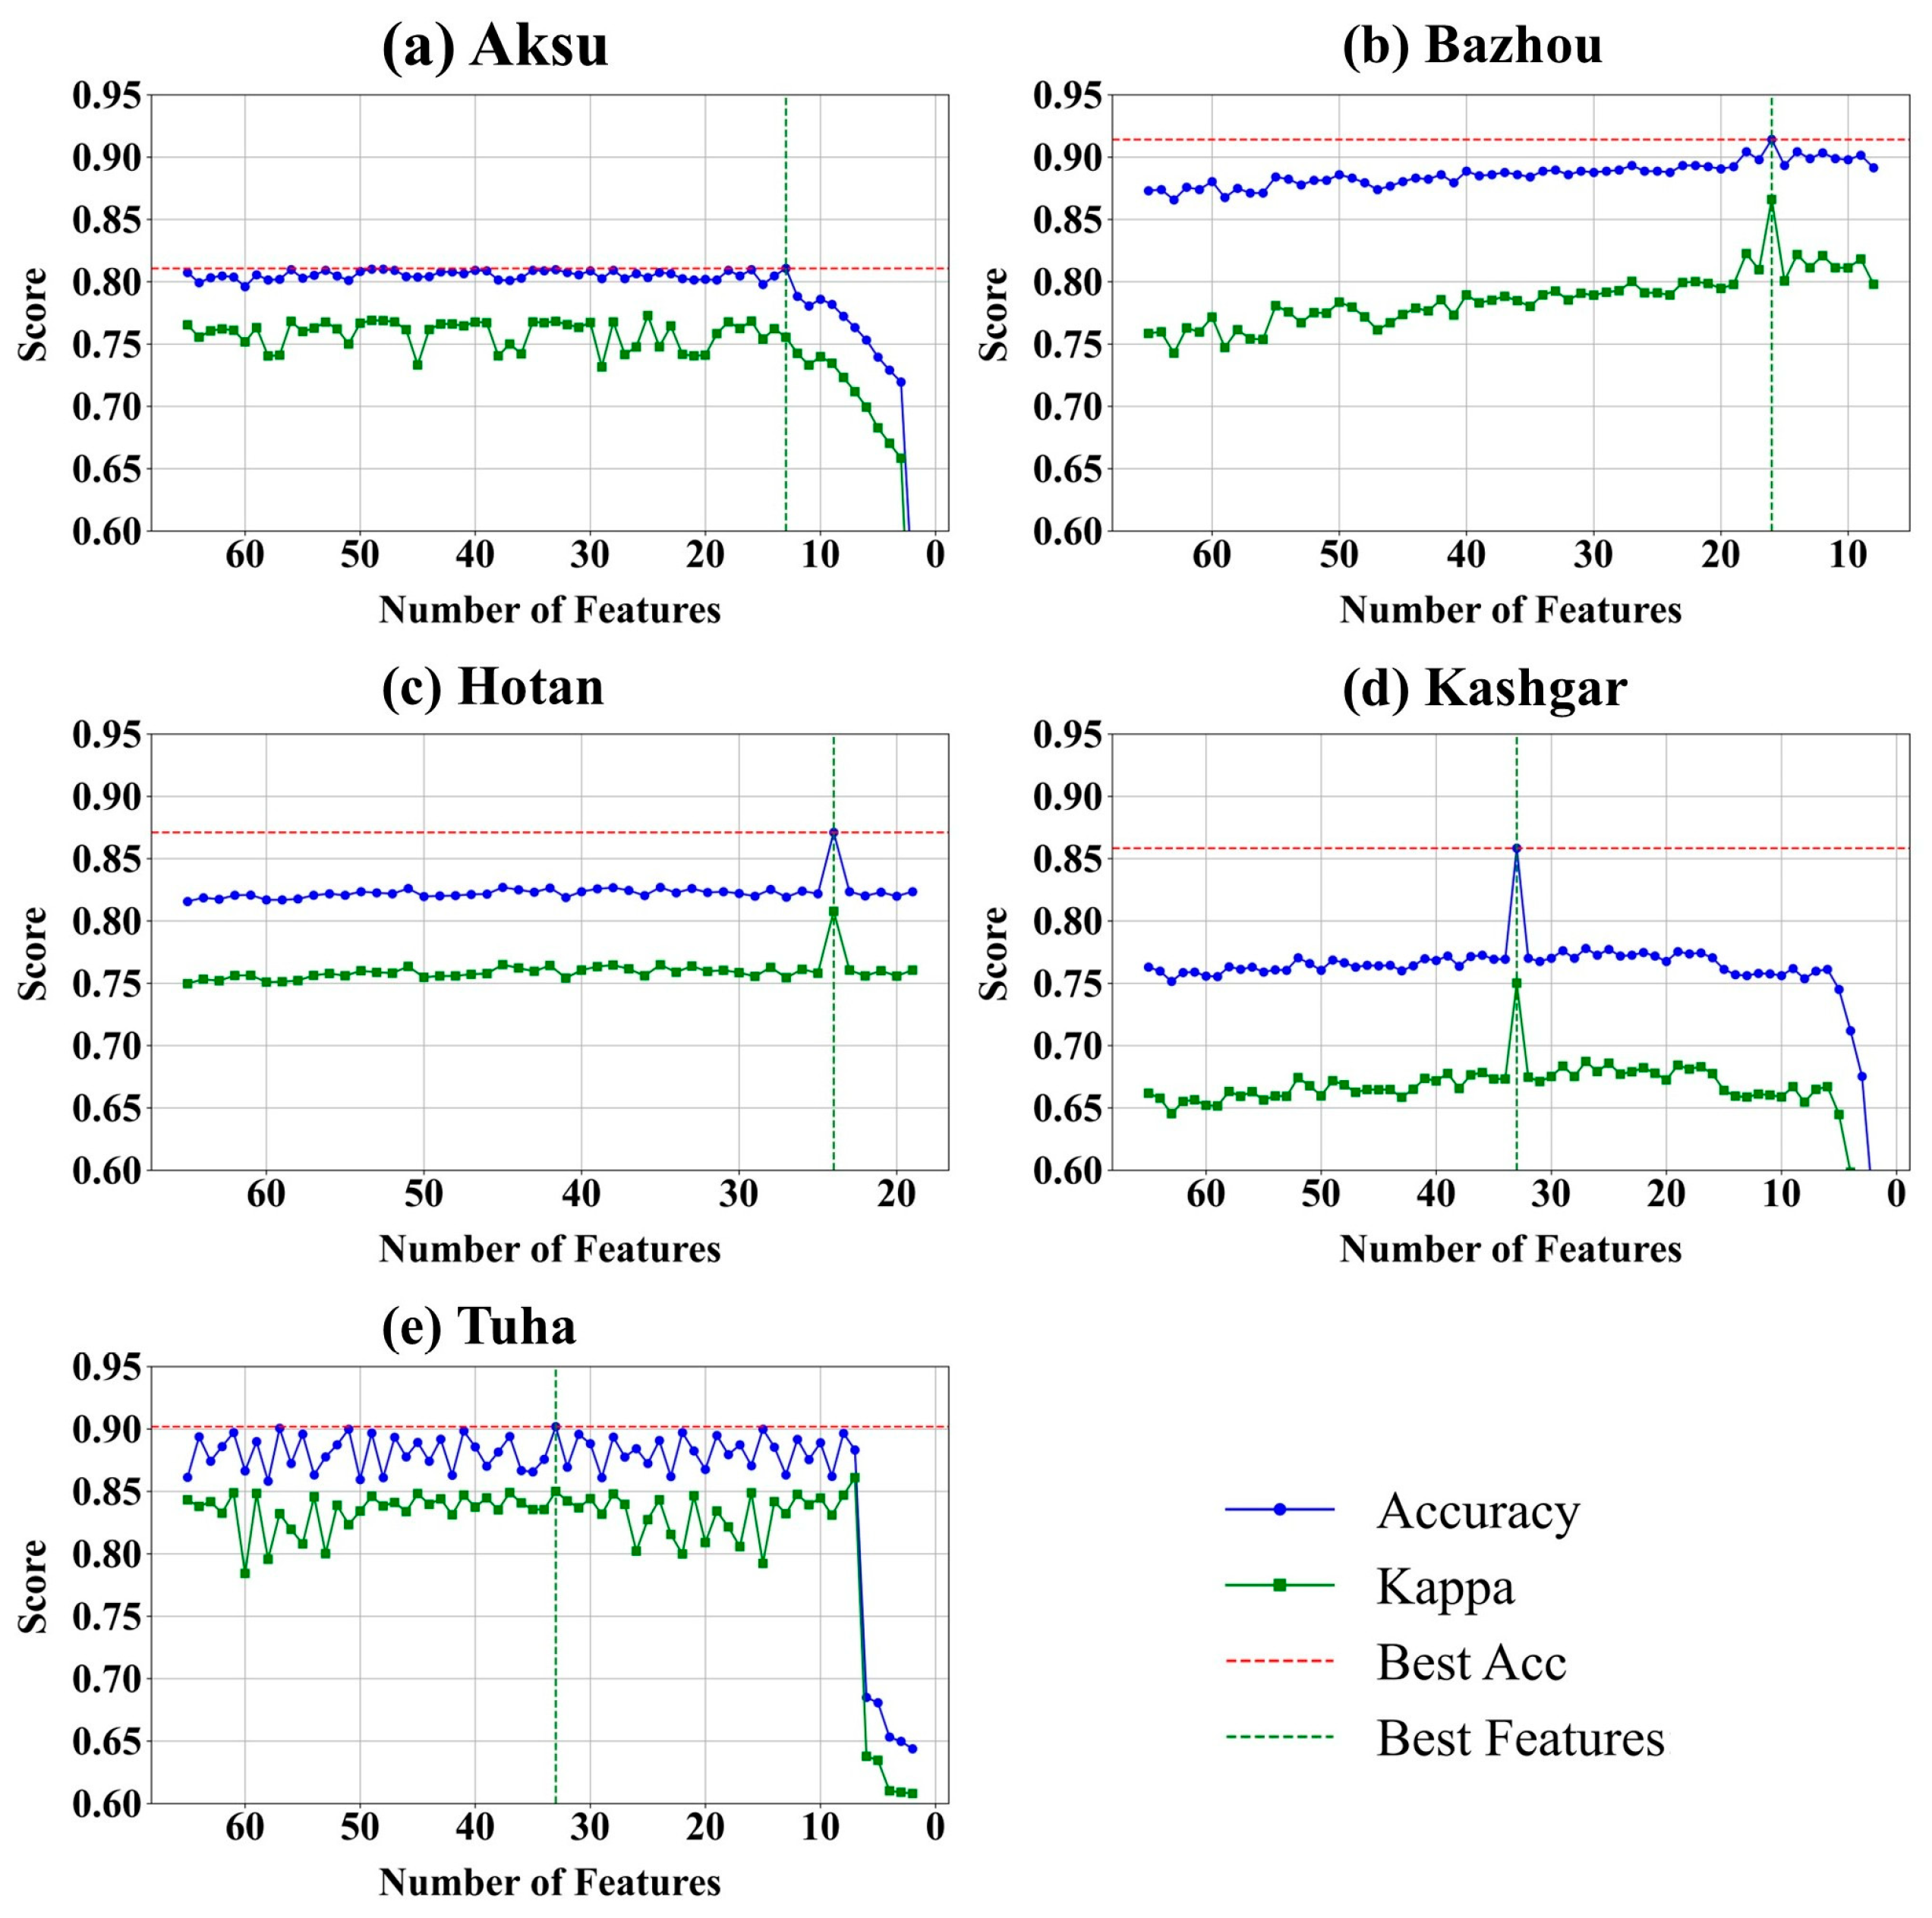
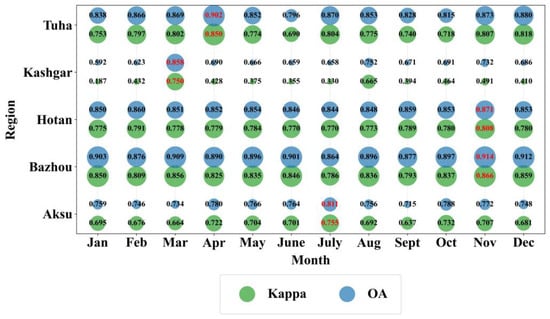
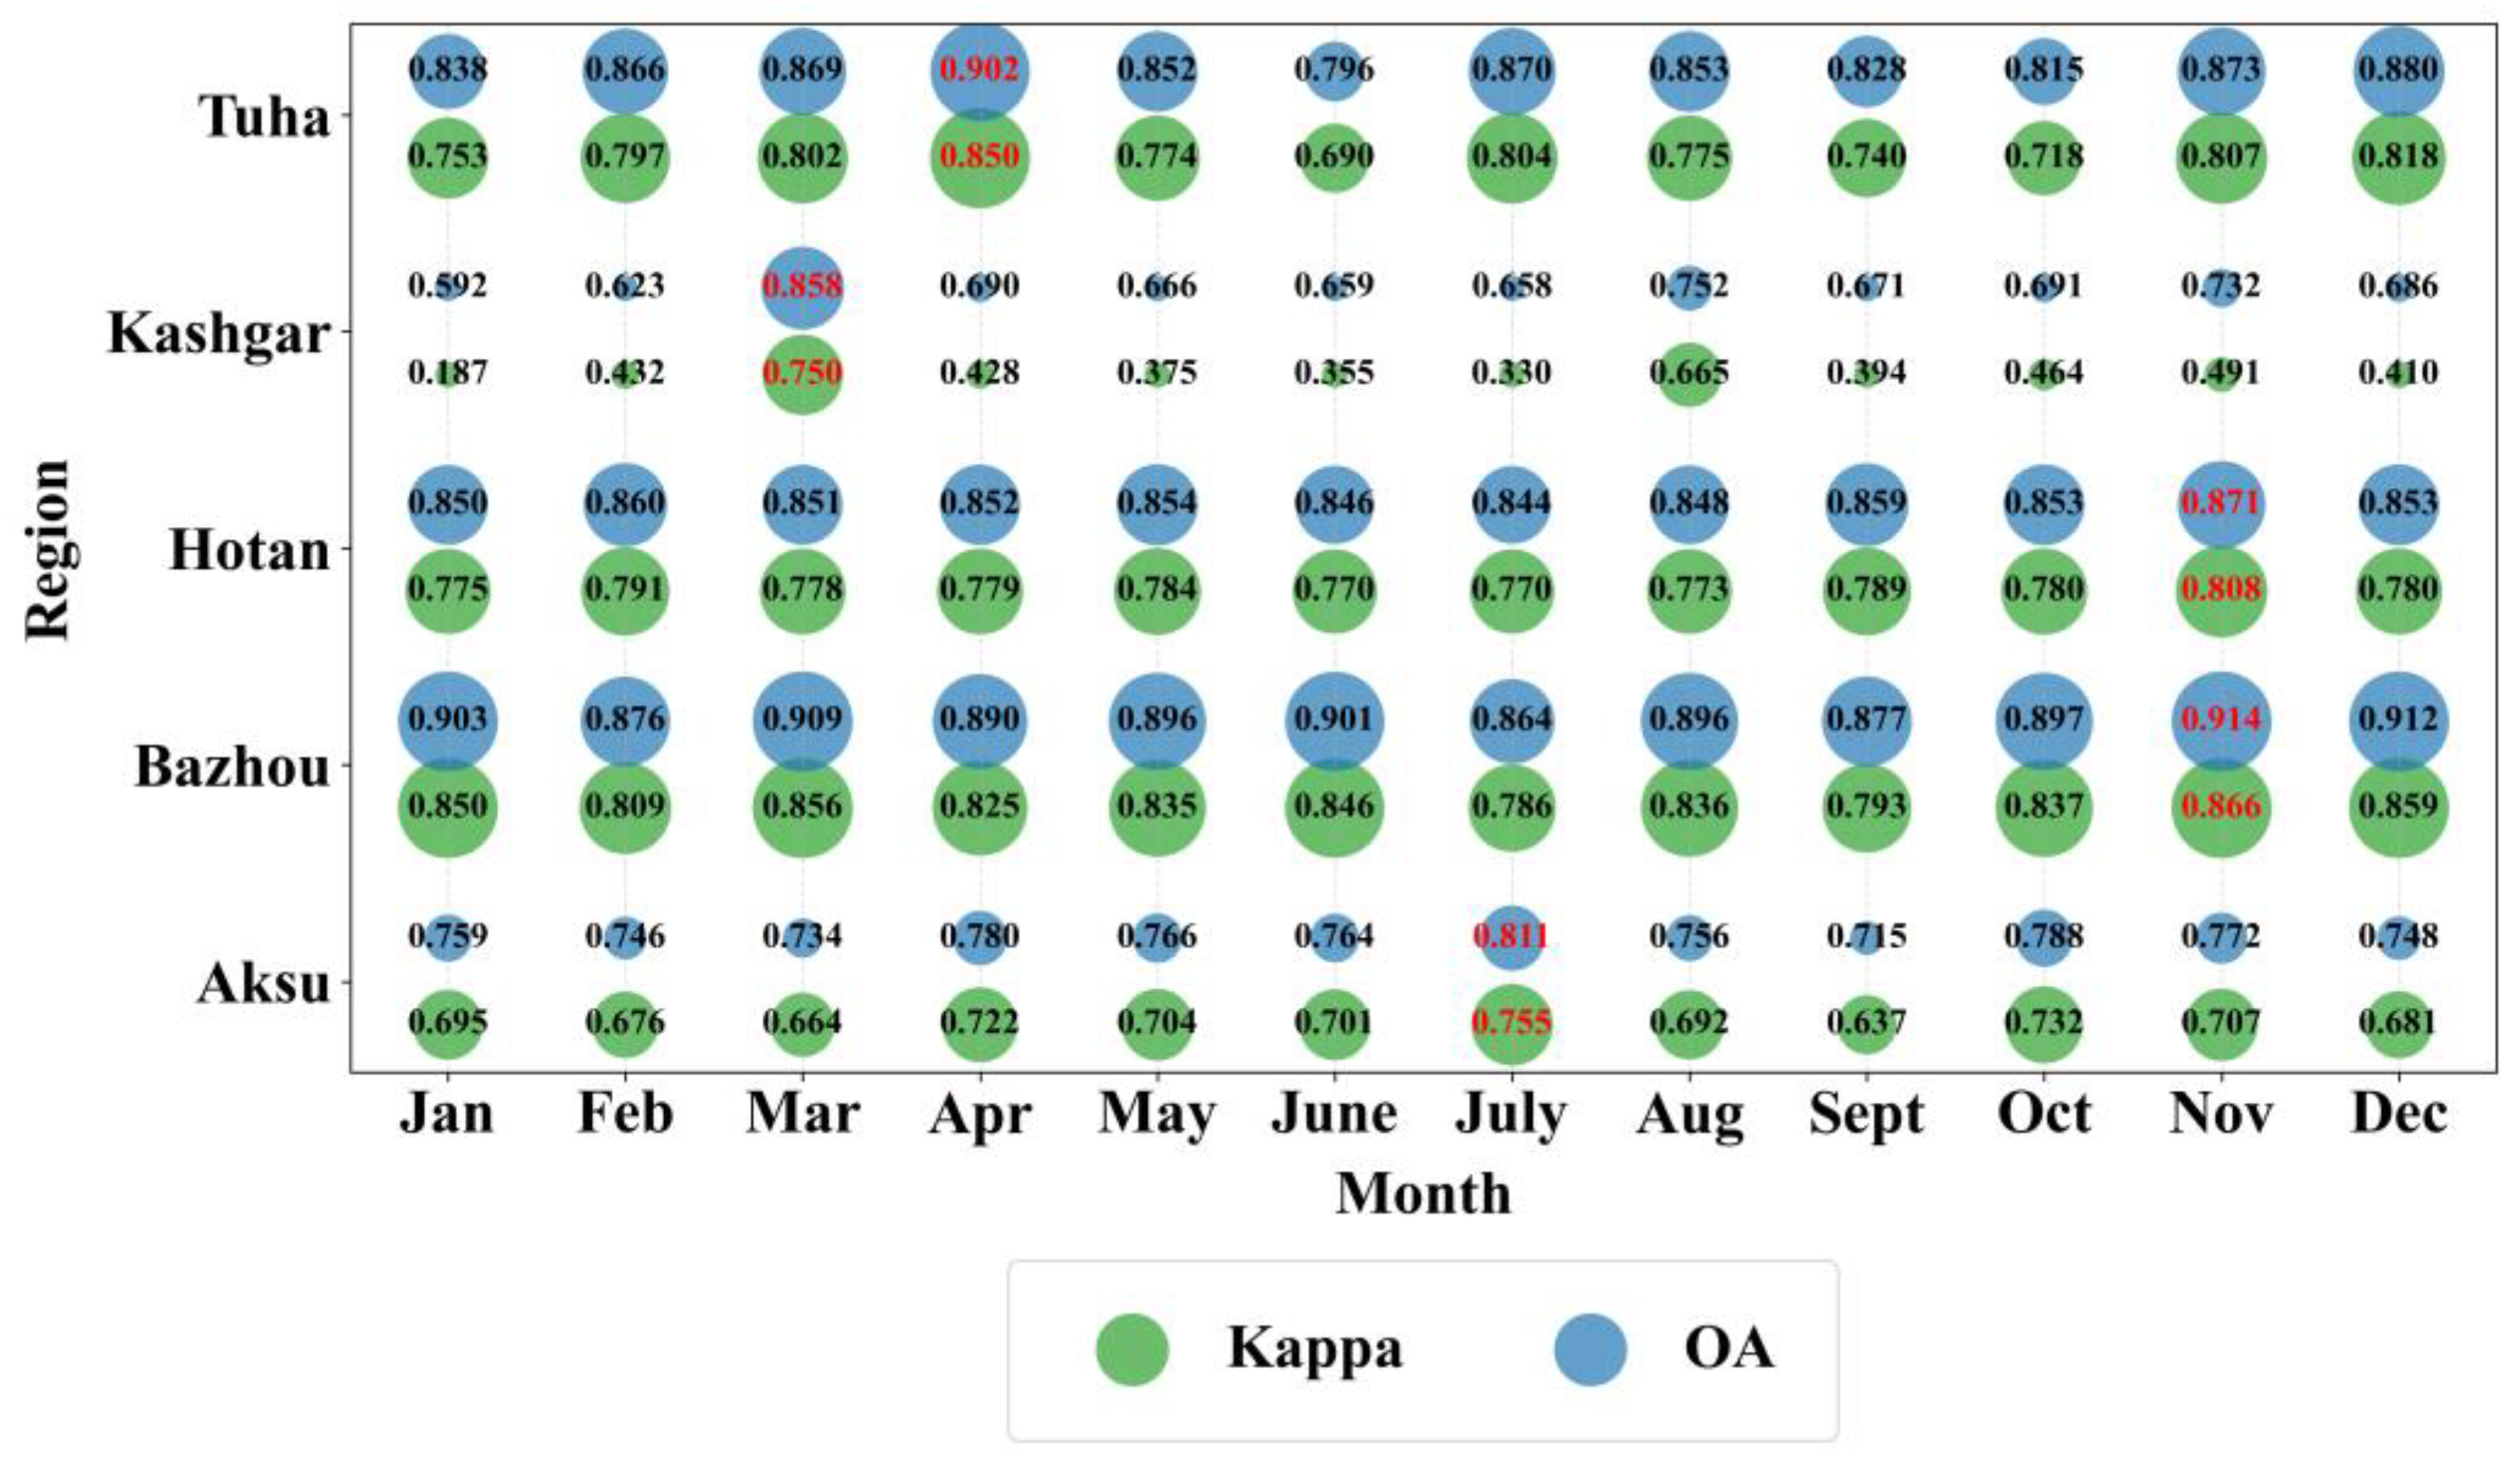
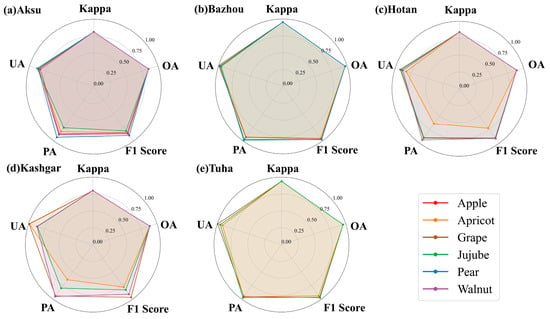
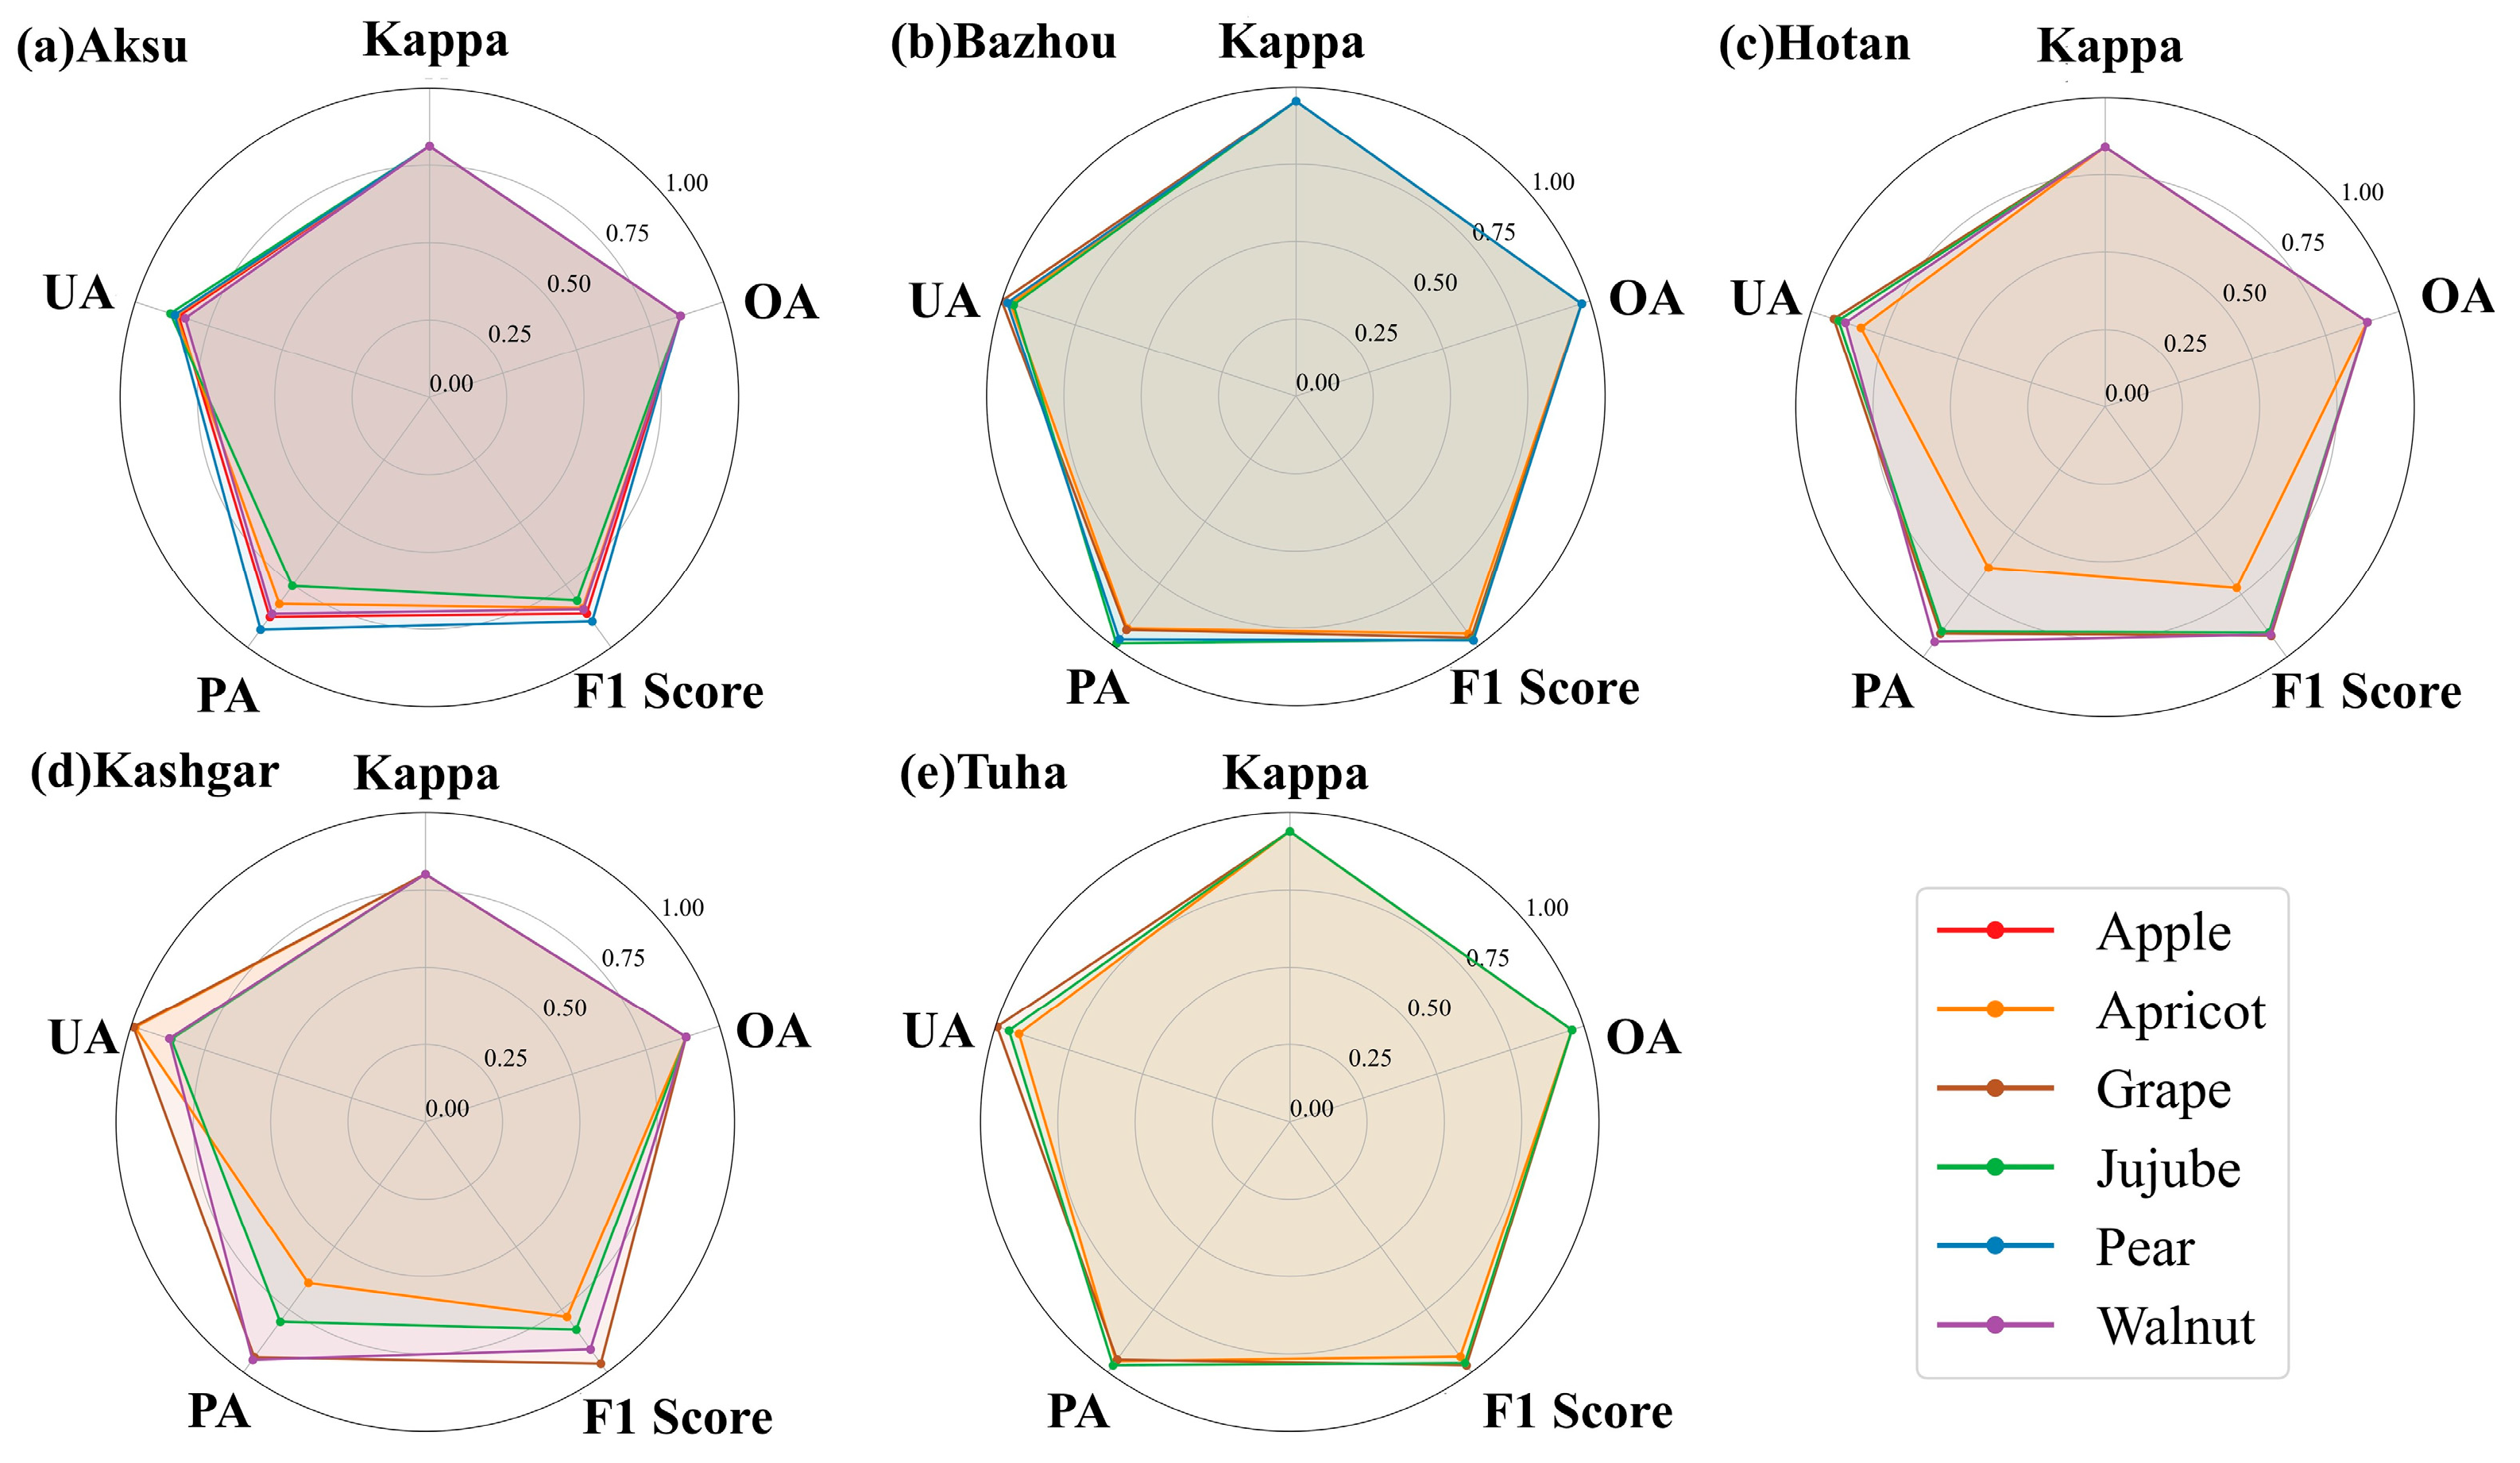
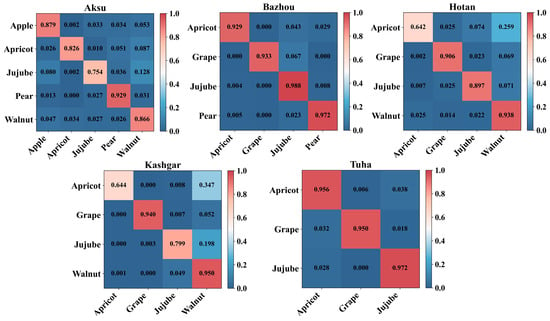
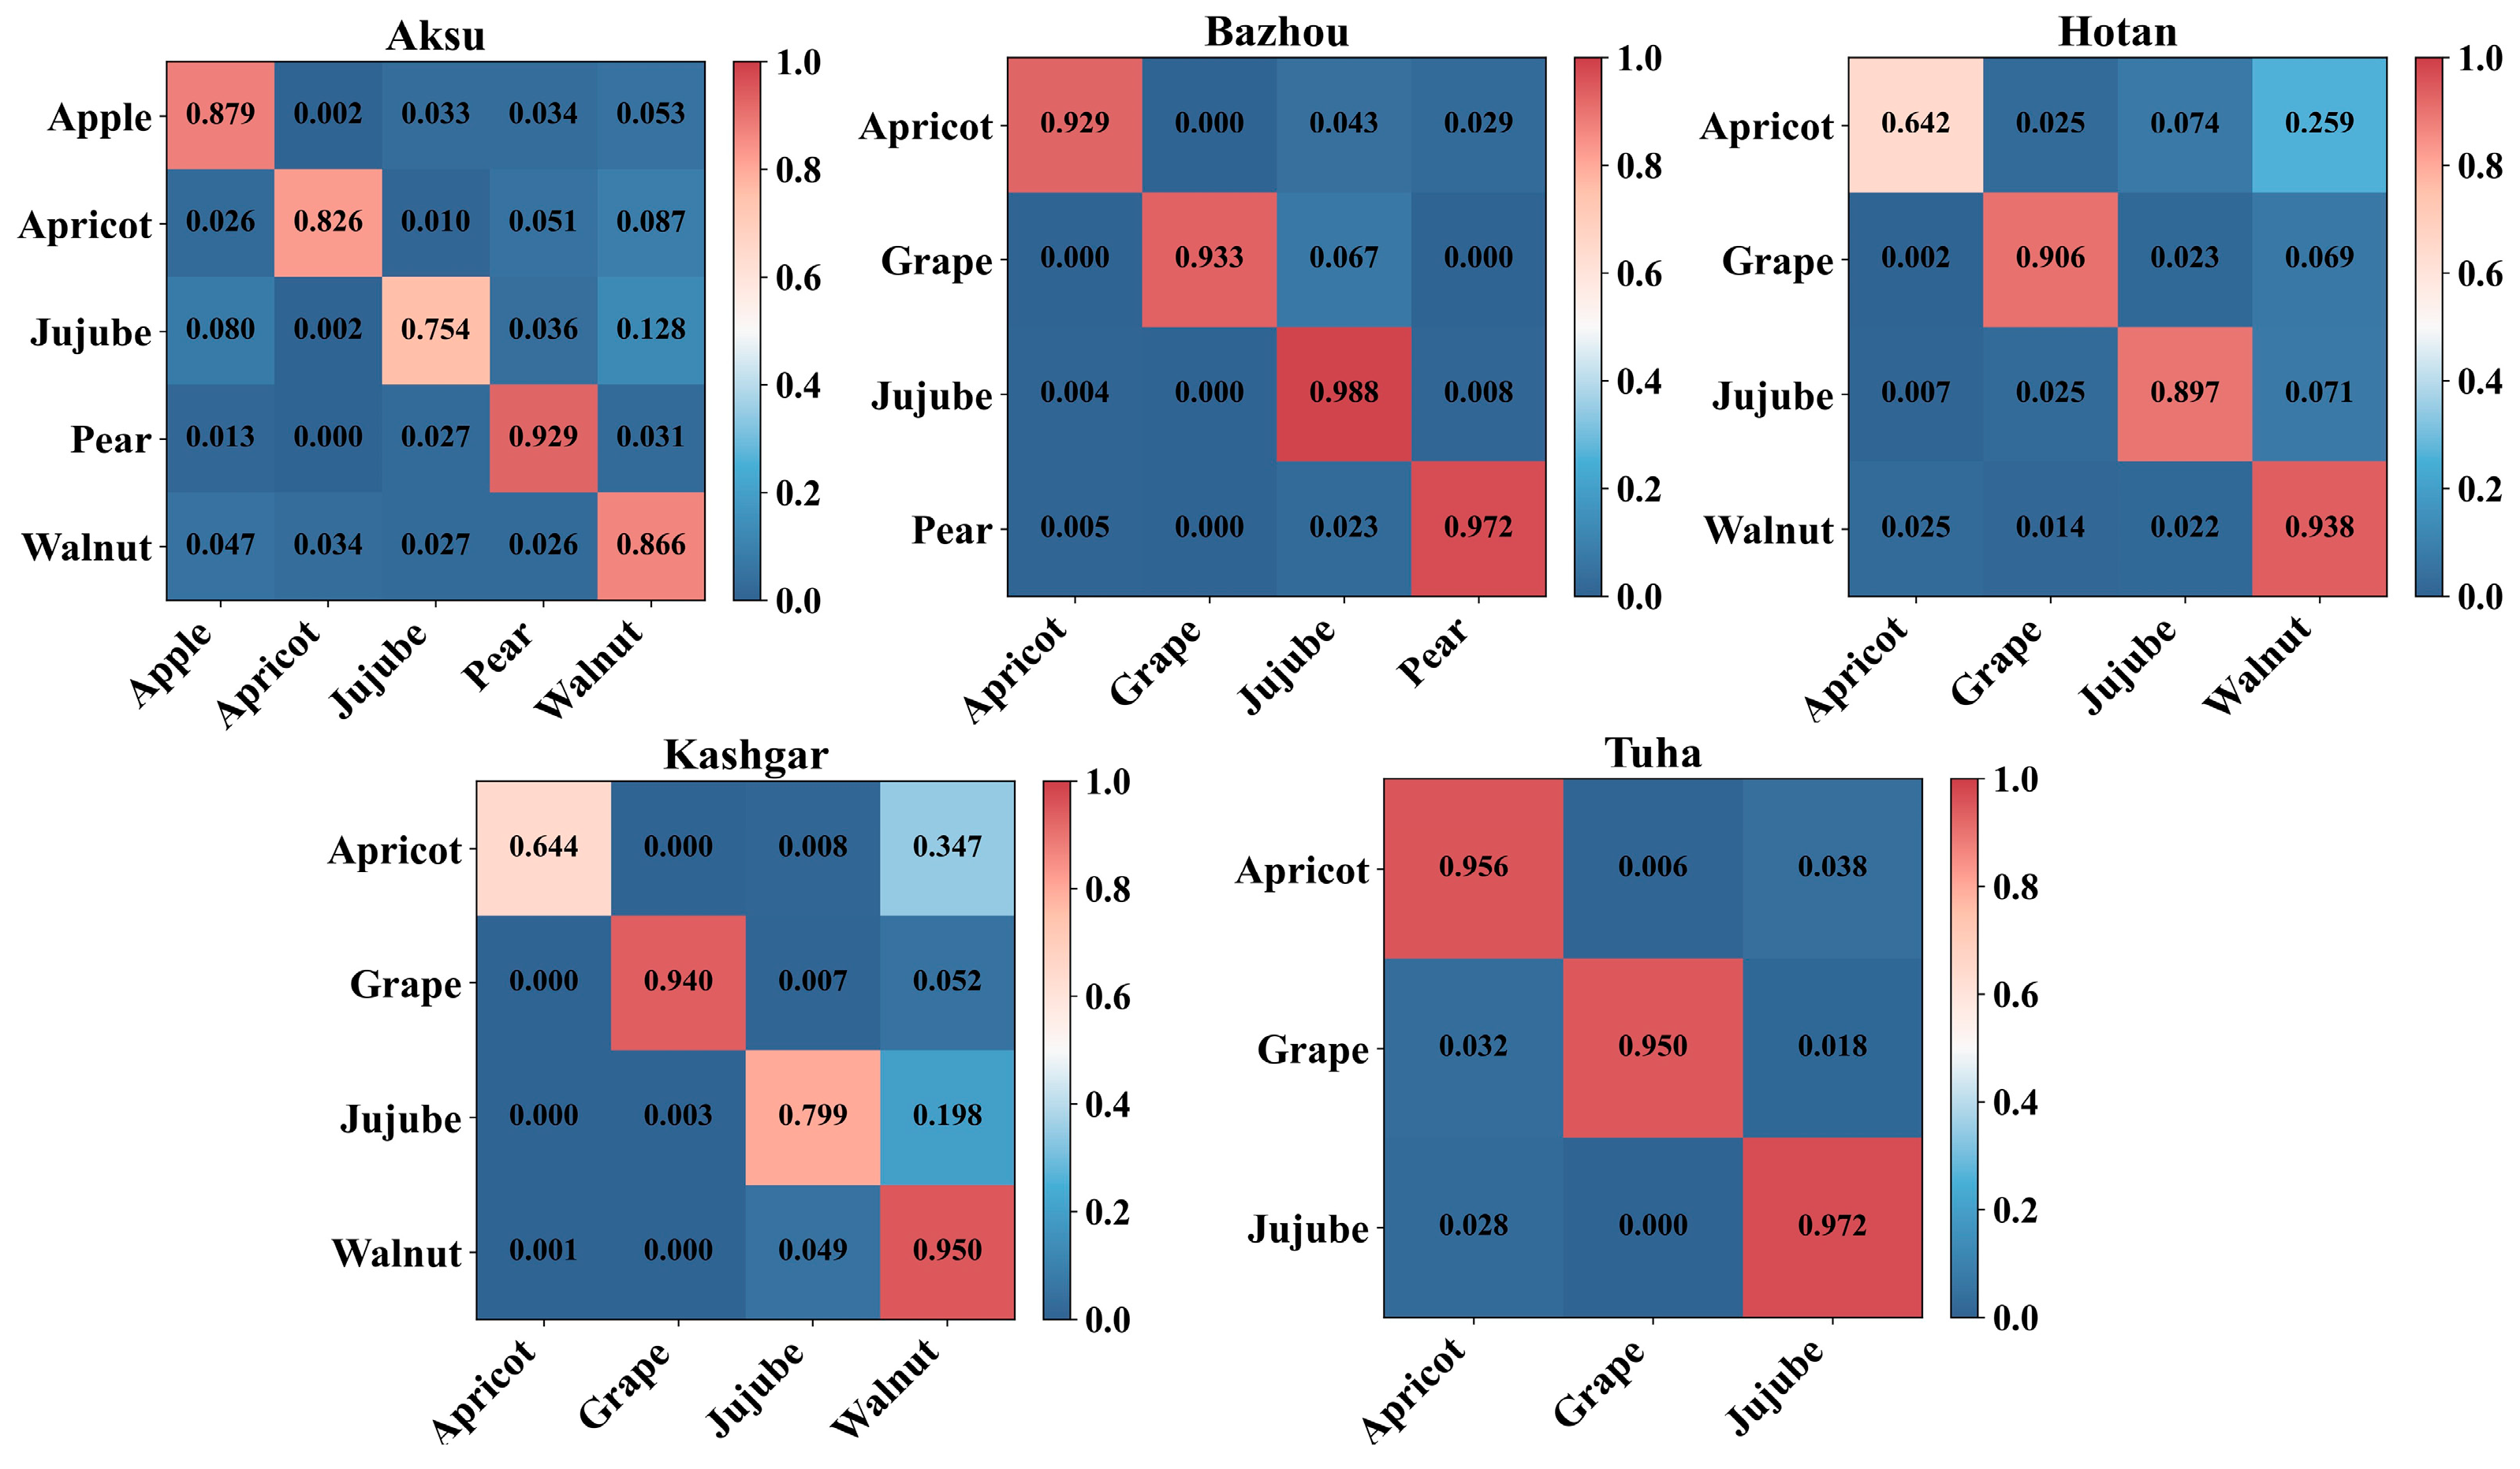
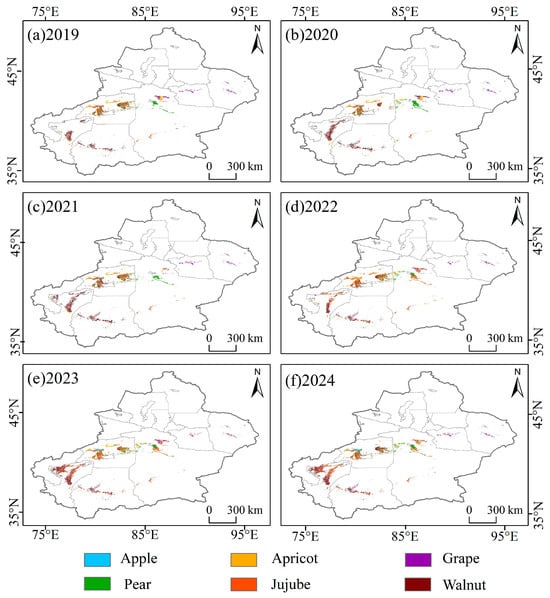
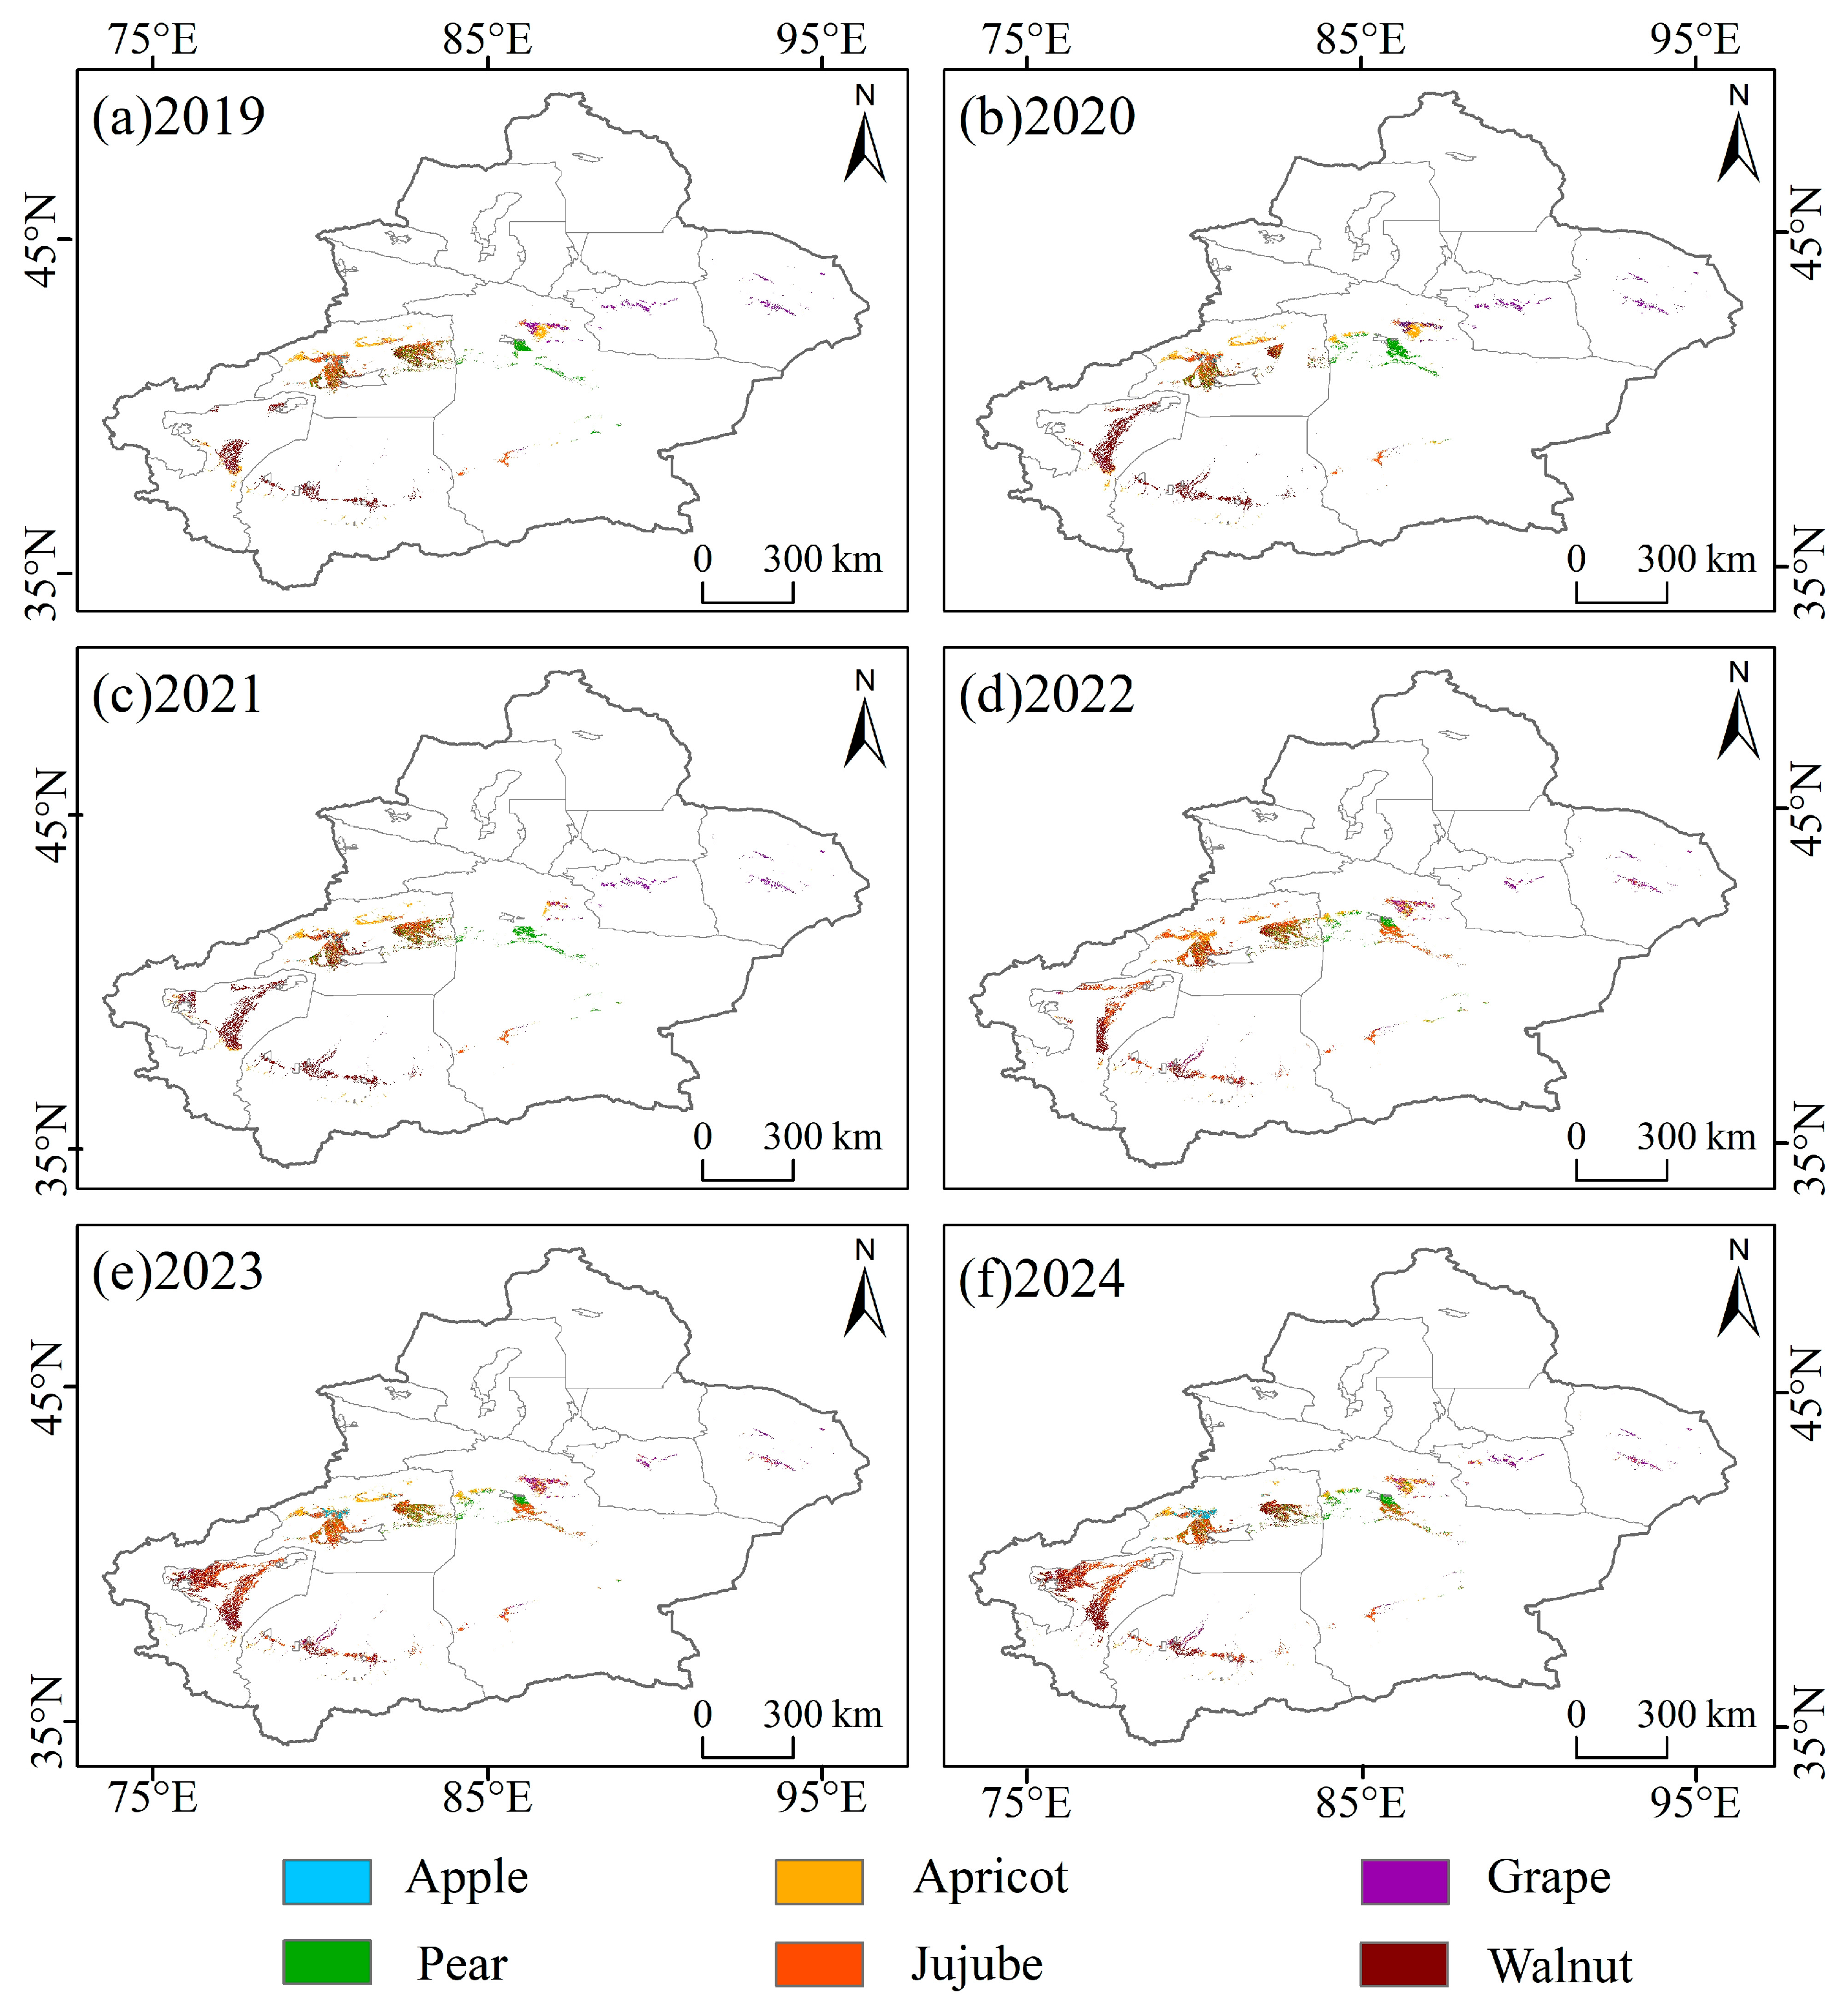
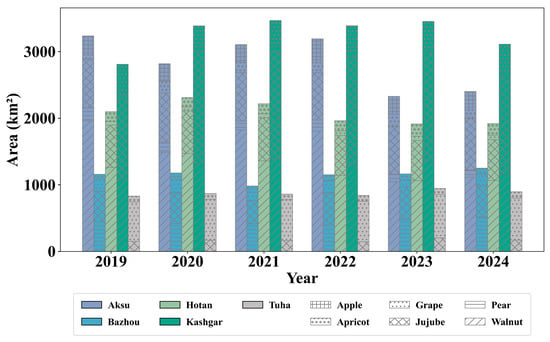
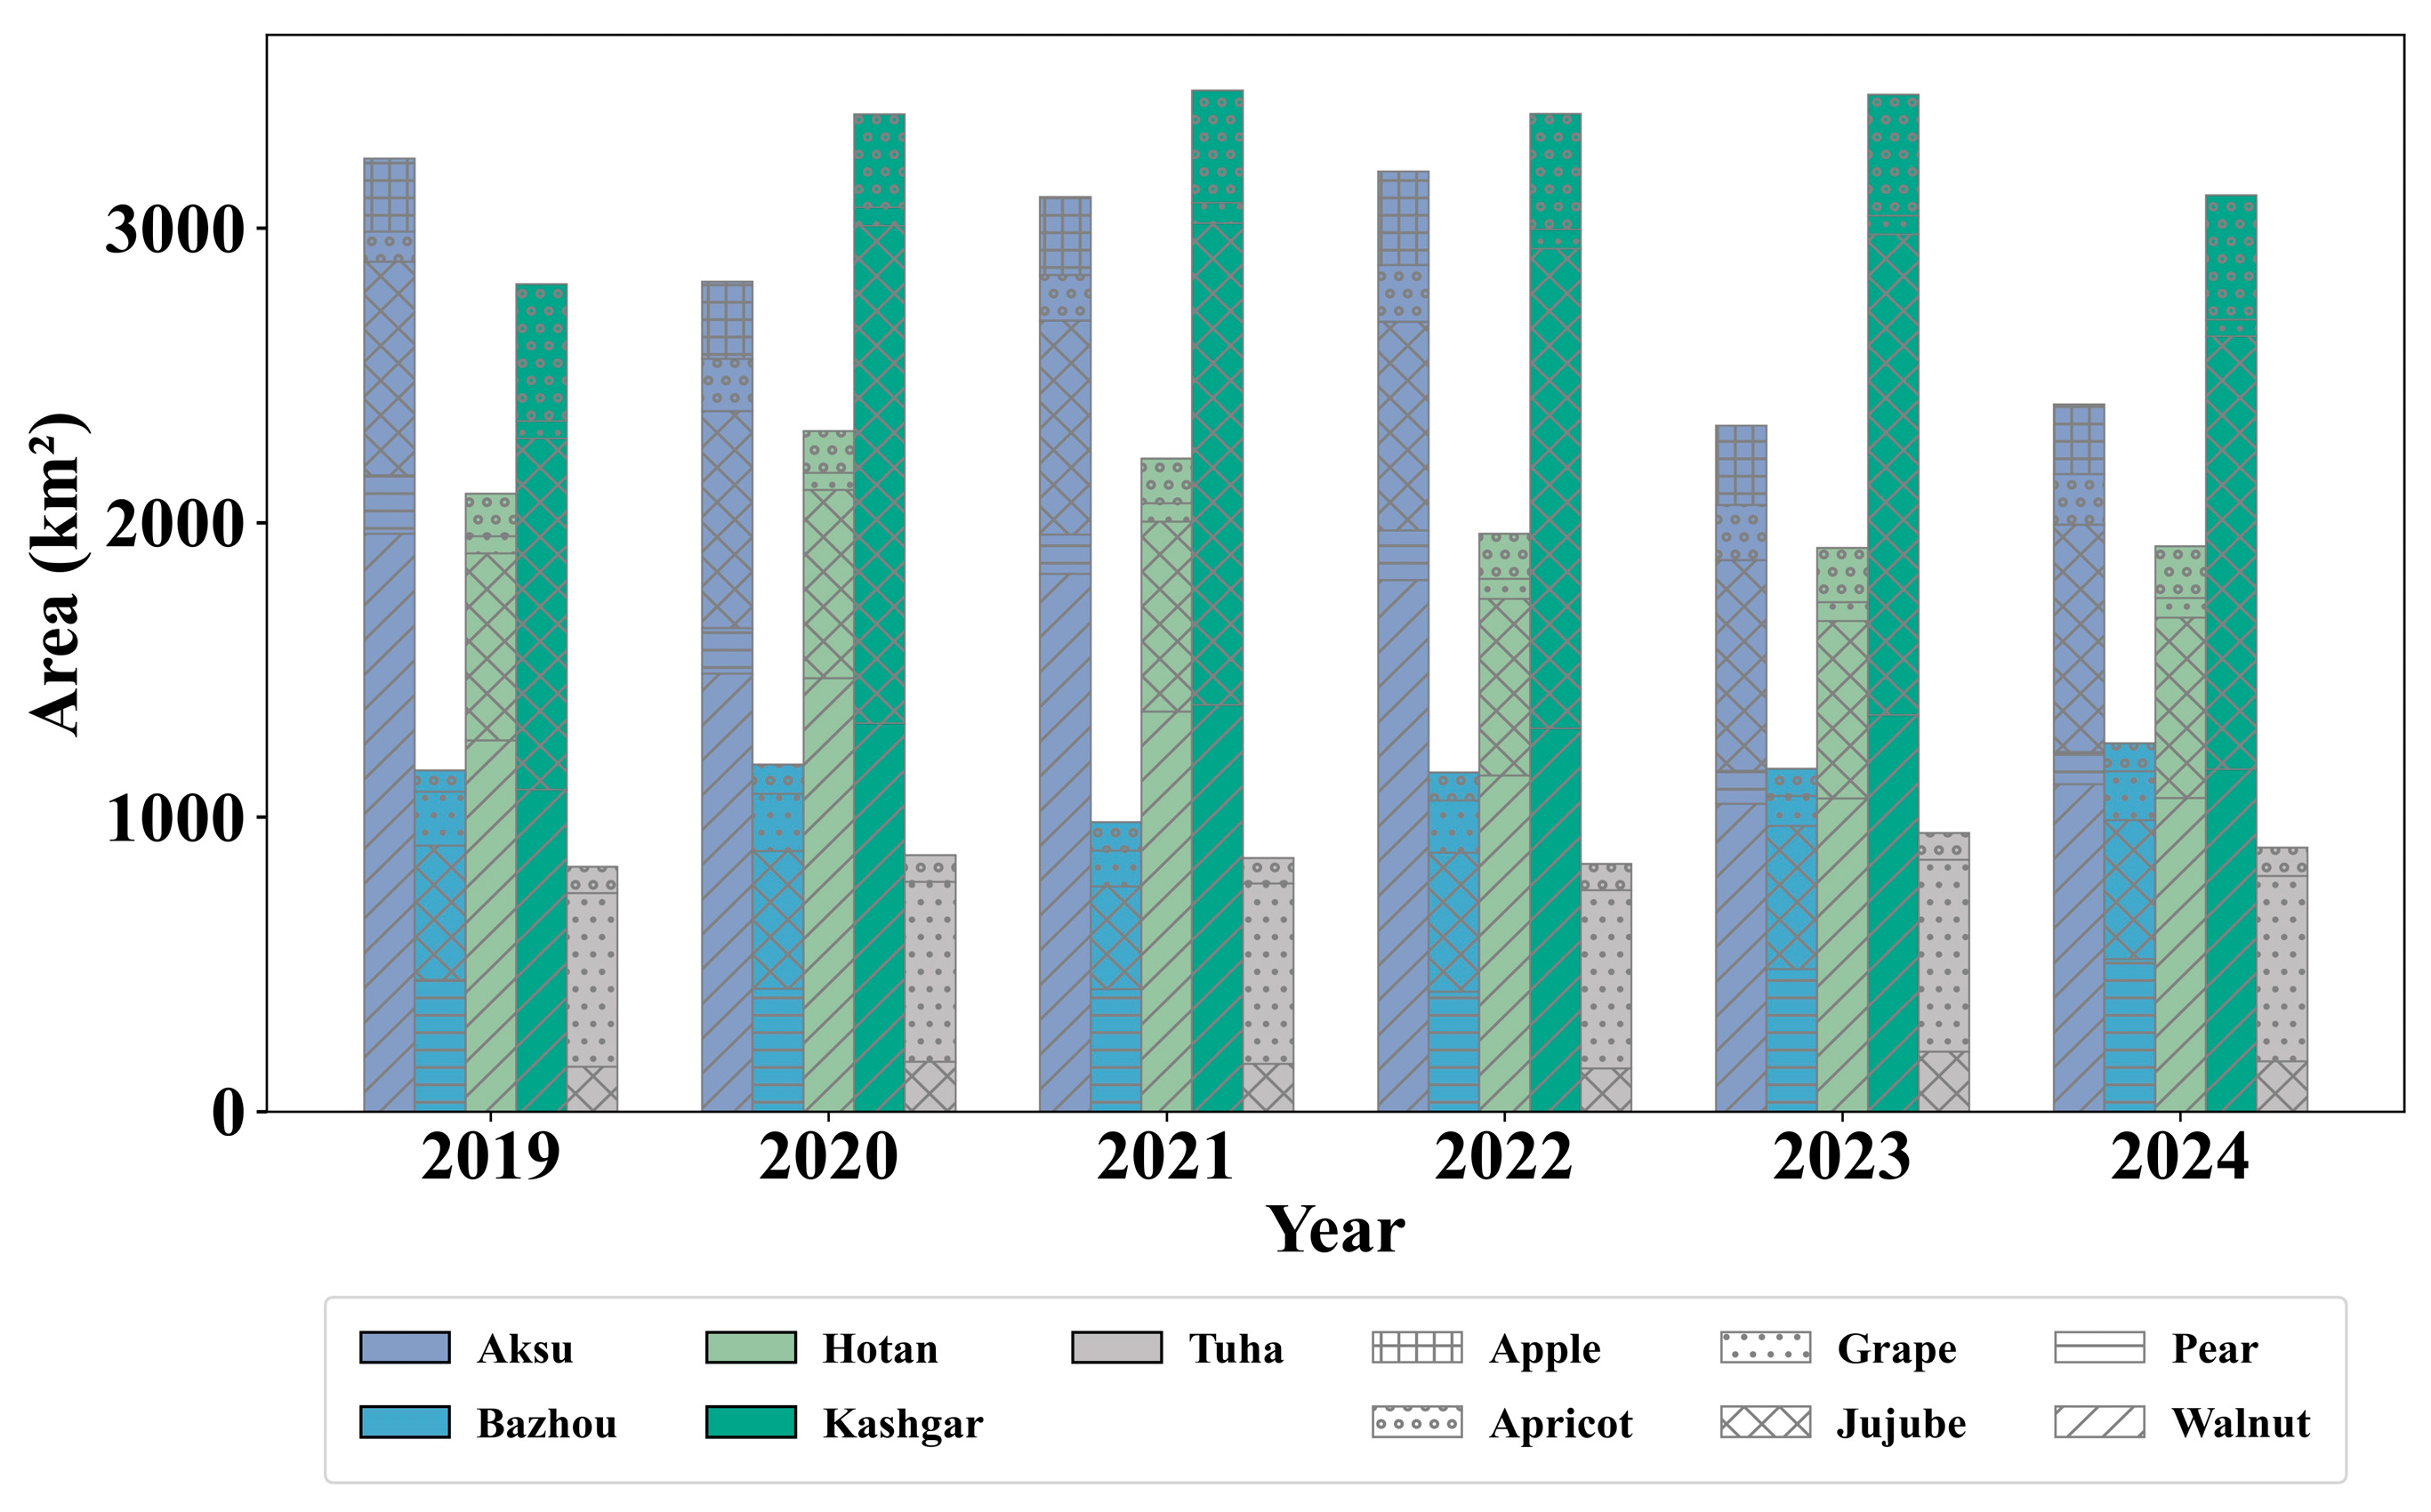
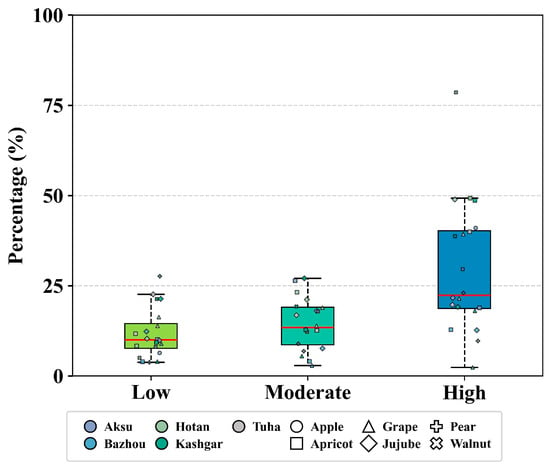
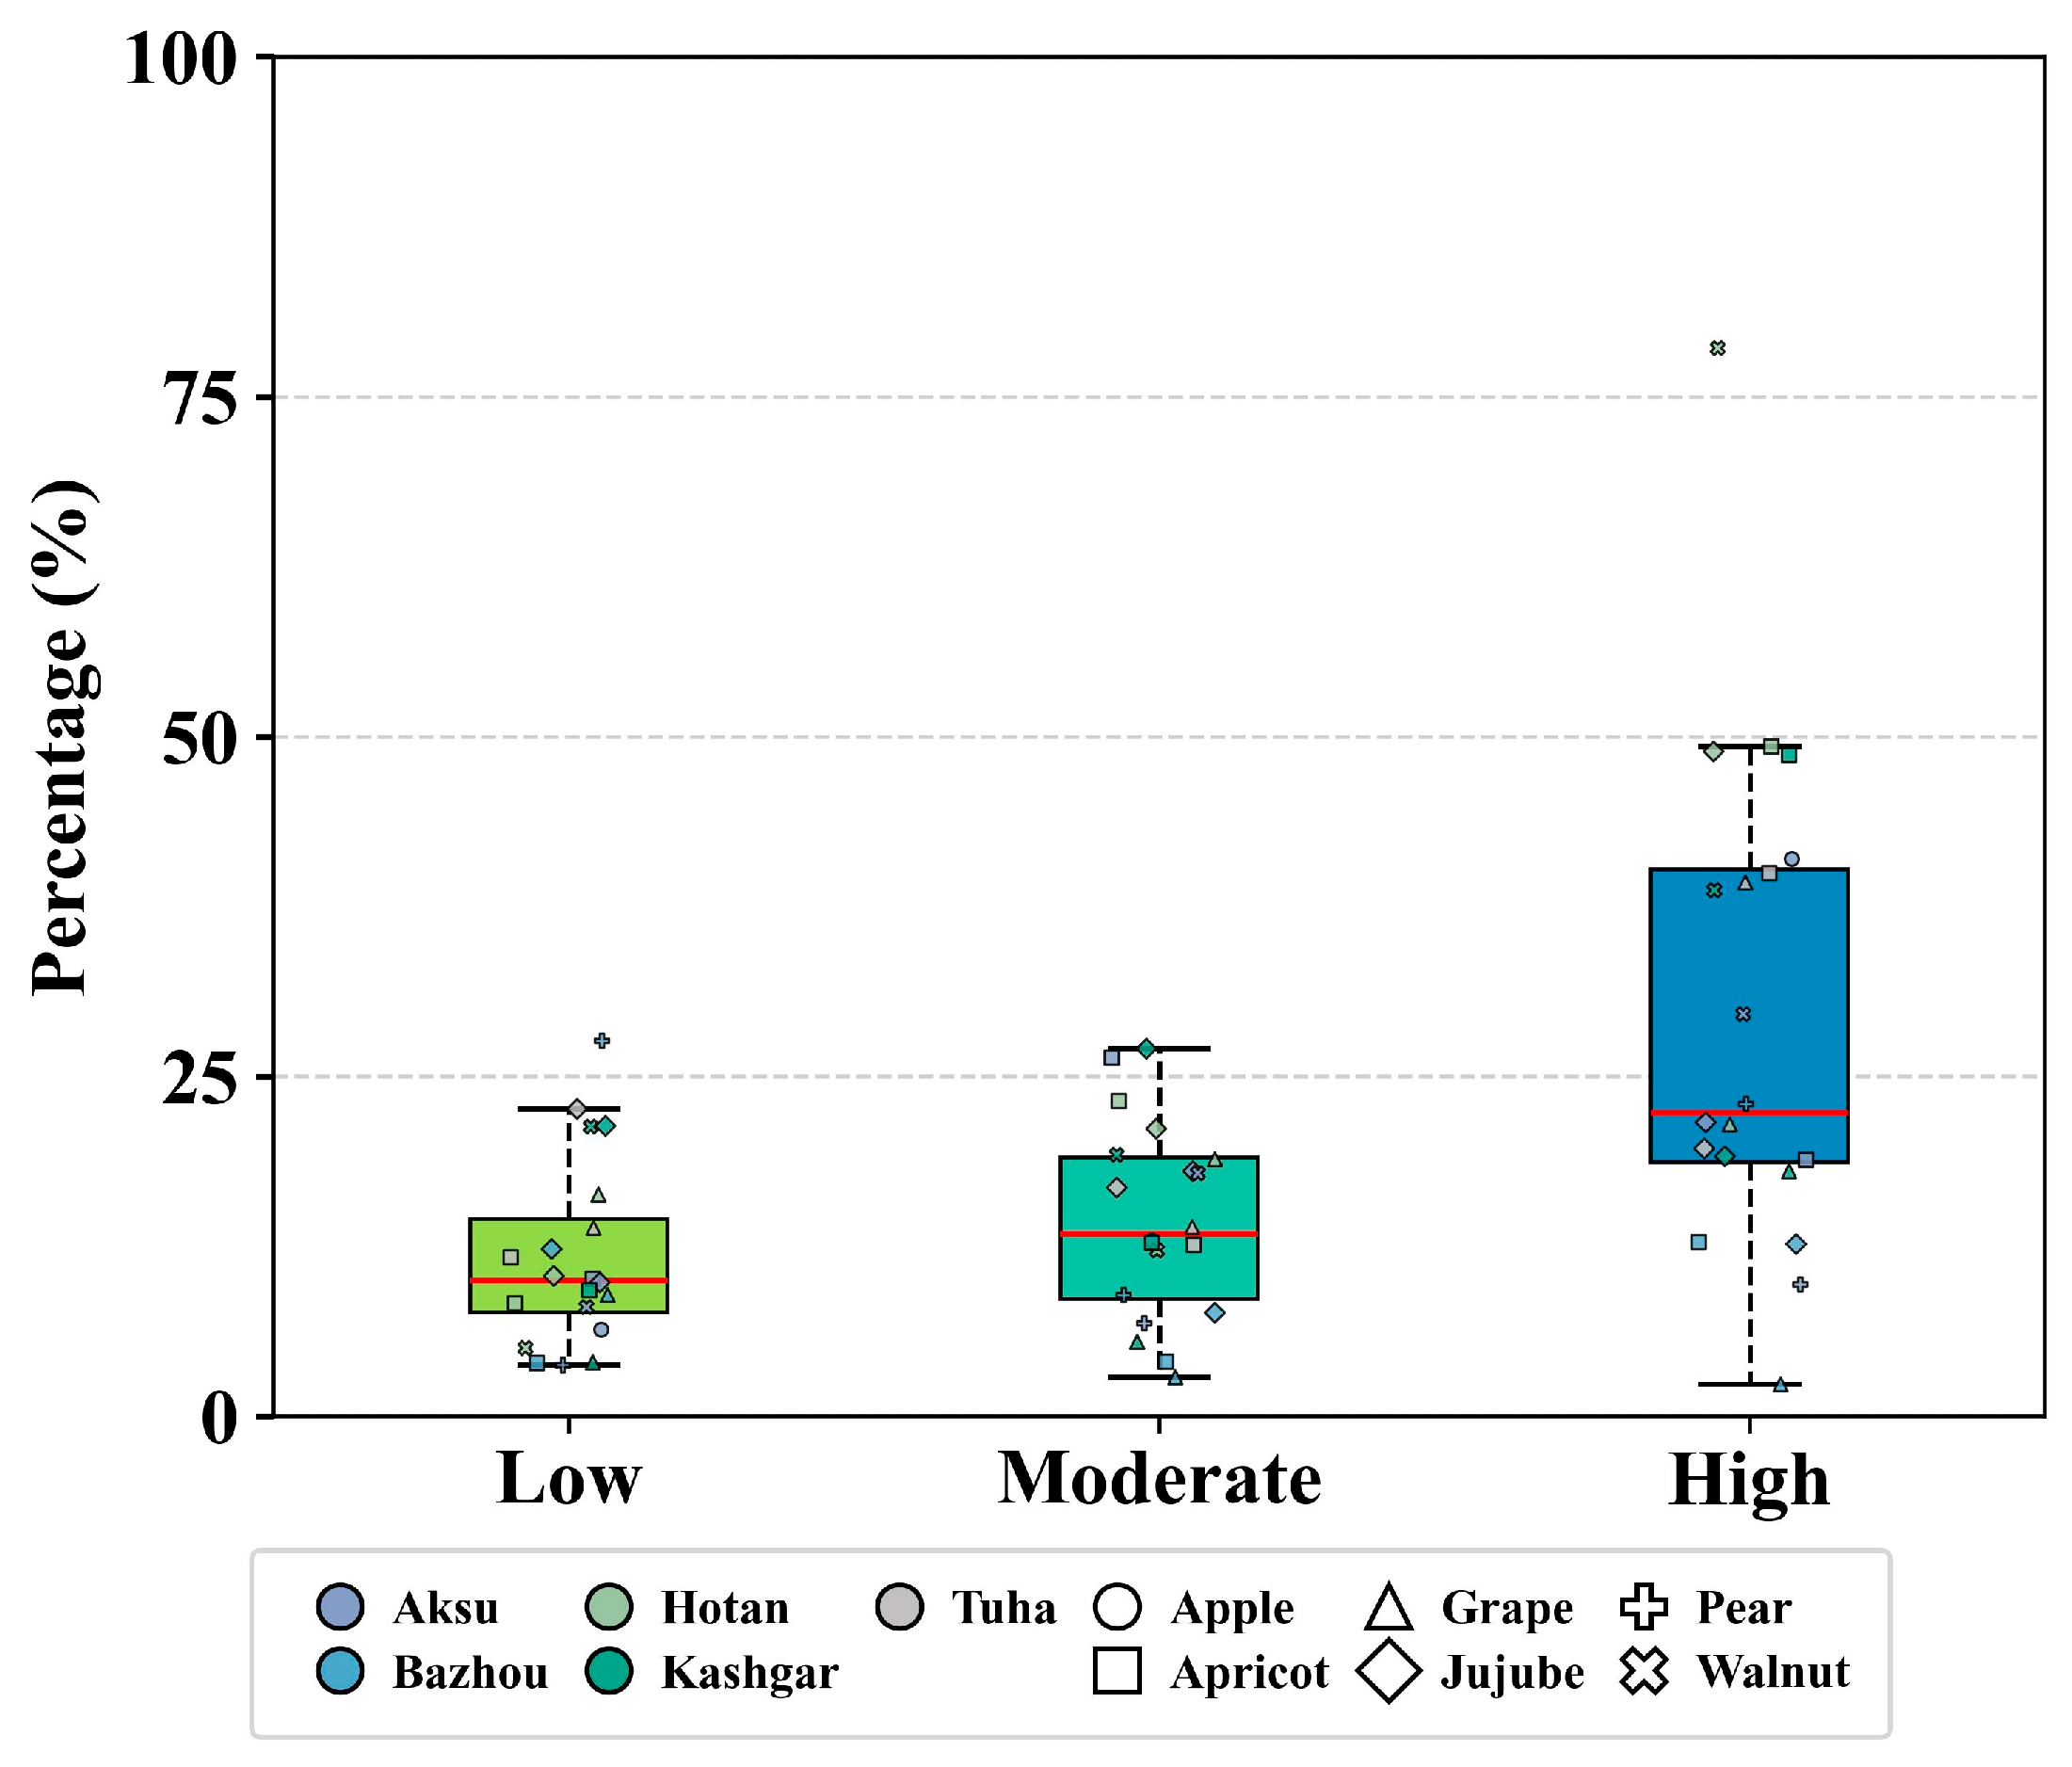

Disclaimer/Publisher’s Note: The statements, opinions and data contained in all publications are solely those of the individual author(s) and contributor(s) and not of MDPI and/or the editor(s). MDPI and/or the editor(s) disclaim responsibility for any injury to people or property resulting from any ideas, methods, instructions or products referred to in the content. |
© 2026 by the authors. Licensee MDPI, Basel, Switzerland. This article is an open access article distributed under the terms and conditions of the Creative Commons Attribution (CC BY) license.