


Abstract
Cunninghamia lanceolata var. Luotian is a valuable variant of Chinese fir characterized by a weeping branch architecture, a narrow crown, and excellent natural pruning compared with Cunninghamia lanceolata. The weeping branch phenotype is a typical characteristic of Cunninghamia lanceolata var. Luotian; however, the molecular mechanisms potentially associated with this phenotype remain unclear. To investigate the gene expression characteristics associated with this phenotype, terminal buds and basal parts of one-, three-, and six-year-old lateral branches from C. lanceolata var. Luotian and C. lanceolata with comparable growth status were sampled for de novo transcriptome sequencing using the Illumina high-throughput platform. A total of 59,109 unigenes were obtained from transcriptome sequencing. The Q30 values of all samples were above 93.76%, with an average unigene length of 1175 bp and an N50 of 2293 bp. The mapping rates ranged from 68.11% to 79.25%, with an average of 75.65%. Comparative transcriptomic analysis revealed substantial differences in gene expression between C. lanceolata var. Luotian and C. lanceolata, with the largest number of DEGs detected in the terminal buds of three-year-old lateral branches. Differences in DEG numbers were also observed among comparisons involving different branch ages and tissue positions. KEGG enrichment analysis identified phenylpropanoid biosynthesis, plant hormone signal transduction, and MAPK signaling pathway–plant among the top-ranked pathways. Based on the analysis of the top 50 DEGs, several candidate genes, including TRINITY_DN19150_c0_g1, TRINITY_DN27401_c0_g1, and TRINITY_DN14240_c0_g1, were identified as potentially associated with lateral branch development. These findings suggest that signal transduction and secondary metabolism may be associated with the weeping branch phenotype of C. lanceolata var. Luotian. This study provides preliminary transcriptomic evidence and candidate gene resources for further investigation of the weeping branch phenotype, although the specific regulatory roles of these pathways and genes remain to be experimentally validated.
1. Introduction
Cunninghamia lanceolata var. Luotian is a unique elite natural variant of Chinese fir discovered in Luotian County, Hubei Province, China, in the 1970s. It is characterized by a narrow pyramidal crown and weeping lateral branches in trees older than 2–3 years, with branch angles of approximately 150° relative to the main stem. The basal diameter of 6–7-year-old lateral branches is only 1–2 cm, and these branches usually fall off during autumn and winter, resulting in knot-free timber [1]. Compared with C. lanceolata, the lateral branch drooping trait is one of its most distinctive phenotypic characteristics. To date, studies on C. lanceolata var. Luotian remain limited and have mainly focused on wood properties [2], biological characteristics [3], photosynthetic physiology and morphological characteristics [1], and genetic diversity [4]. However, studies on the lateral branch drooping trait are very limited.
Based on the anatomical structure of the junction between the basal part of the lateral branch and the main stem, Xiong [5] reported that, from the third year onward, the secondary growth of the cambium beneath the branch trace was significantly reduced, whereas the secondary xylem of the stem continued normal growth. As time progressed, a cavity gradually formed beneath the lateral branch, weakening the mechanical support provided by the main stem. When the lateral branch reached 6–7 years of age and the gravitational force caused by its drooping exceeded the bearing capacity of the attachment point, breakage readily occurred at the junction. In addition, the formation of the cavity beneath the branch trace disrupted the continuity of the vascular tissues between the lateral branch and the main stem, thereby hindering the longitudinal transport of water, mineral nutrients, and organic nutrients. This process may be closely related to lateral branch drooping and abscission. Yang et al. [6] compared the anatomical structures of the terminal buds of the lateral branches between C. lanceolata var. Luotian and C. lanceolata and found that the bud axis of C. lanceolata var. Luotian was longer and wider than that of C. lanceolata, with a greater number of young leaves attached to the bud axis. The shoot apical meristem was also more active, showing obvious apical dominance. In addition, the cells of C. lanceolata var. Luotian were more closely arranged, more regular in shape, and mostly rectangular, and the volume of individual cells was larger than that of C. lanceolata cells. These characteristics increased compression among cells, weakened the supporting force between the lateral branch and the main stem, and finally caused lateral branch drooping under the action of gravity. This study preliminarily revealed the relationship between the morphological structure of the terminal bud and lateral branch drooping. Xu et al. [7] analyzed the crown structural characteristics and found that the oldest living lateral branches of C. lanceolata and common Chinese fir were 5–6 years and 8–11 years old, respectively. Moreover, the age of living lateral branches in C. lanceolata var. Luotian did not change with tree age, whereas that of common Chinese fir increased with tree age. This difference in the age structure of lateral branches is unique to C. lanceolata var. Luotian and may be one of the key factors responsible for its unique crown architecture. In addition, the basal diameter and length of one-year-old first-order lateral branches increased rapidly, particularly the basal diameter, which could widen the branch angle and cause lateral branch drooping. This drooping further inhibited the normal growth and transport function of the phloem, eventually leading to the death of old branches.
In recent years, increasing attention has been paid to the molecular mechanisms underlying the regulation of branch angles and crown architecture in plants. Previous studies have demonstrated that branch growth orientation is closely associated with gravitropic responses, auxin transport, and related signaling processes. Several genes involved in the regulation of branch angles and plant architecture, including LAZY1, TAC1, and WEEP, have been identified. Among them, LAZY1 plays an important role in shoot gravitropism and branch angle regulation. Li et al. [8] found that loss of the LA1 function significantly enhanced polar auxin transport (PAT), thereby altering the distribution of endogenous indole-3-acetic acid (IAA) in the stem, weakening gravitropic responses, and ultimately resulting in a spreading tiller phenotype in rice. In addition, Dardick et al. [9] found that silencing TAC1 in peach resulted in a pronounced shift toward vertical branch growth, producing a phenotype highly similar to that of pillar peach trees, with narrower branch spacing. Conversely, overexpression of PpeTAC1 in plum significantly increased branch angles, causing branches to extend more horizontally. These findings indicate a positive association between TAC1 expression levels and branch spreading. Hollender et al. [10] demonstrated that TAC1 and LAZY1 exert opposing effects on lateral shoot orientation in Arabidopsis thaliana, with TAC1 promoting outward shoot growth and LAZY1 promoting upward shoot growth through gravitropic responses and auxin transport. Furthermore, Hollender et al. [11] identified the WEEP gene, which is associated with the weeping phenotype in peach. This gene encodes a protein containing a sterile alpha motif (SAM) domain, and its loss of function results in downward branch growth and abnormal gravitropic responses. Collectively, these studies suggest that the regulation of branch growth orientation and weeping phenotypes involves gravitropic responses, auxin transport, and related molecular regulatory processes. However, these mechanisms have been primarily investigated in angiosperms, and whether they also apply to the weeping branch phenotype of the gymnosperm Cunninghamia lanceolata var. Luotian remains unclear.
At present, the molecular mechanism underlying the formation of the lateral branch drooping phenotype in C. lanceolata var. Luotian remains unclear. To elucidate this molecular mechanism, C. lanceolata var. Luotian and C. lanceolata were used as experimental materials. Based on high-throughput transcriptome sequencing technology, gene expression patterns at different branch ages and in different tissues were compared, metabolic pathways potentially associated with the formation of the weeping phenotype were explored, and candidate genes potentially related to this phenotype were identified. The results are expected to provide a basis for further investigating the molecular mechanisms underlying the formation of the weeping phenotype, as well as genetic resources for the genetic improvement and molecular breeding of Chinese fir.
2. Materials and Methods
2.1. Experimental Materials
In July 2023, three eight-year-old trees each of Cunninghamia lanceolata var. Luotian and C. lanceolata, exhibiting similar growth characteristics (approximately 5 m in height and 7 cm in diameter at breast height), were selected as source trees. All trees were planted in Luotian County, Huanggang City, Hubei Province, China, under similar site conditions. Healthy, undamaged lateral branches of similar size and different ages (1, 3, and 6 years) were selected as experimental materials. For each branch age, two to three lateral branches were collected from each source tree, and tissue samples (1–2 cm in length) were obtained from the terminal buds and basal parts of the lateral branches, with the xylem removed. Samples from the same source tree, branch age, and tissue position were pooled separately to form one biological replicate. Three biological replicates, each derived from a different source tree, were prepared for each combination of genotype, branch age, and tissue position. Notably, samples representing different branch ages and tissue positions within each genotype were collected from the same three source trees. A total of 36 samples were obtained, including the terminal buds (C1T) and basal parts (C1B) of one-year-old lateral branches, the terminal buds (C2T) and basal parts (C2B) of three-year-old lateral branches, and the terminal buds (C3T) and basal parts (C3B) of six-year-old lateral branches from C. lanceolata var. Luotian, as well as the corresponding samples from C. lanceolata: H1T, H1B, H2T, H2B, H3T, and H3B. All samples were immediately frozen in liquid nitrogen and stored at −80 °C until further analysis.
2.2. Experimental Methods
2.2.1. Transcriptome Sequencing and De Novo Assembly
Total RNA was extracted from each sample using QIAzol Lysis Reagent (QIAGEN GmbH, Hilden, Germany). RNA purity and concentration were assessed using a NanoDrop 2000 spectrophotometer (Thermo Fisher Scientific, Wilmington, DE, USA), while RNA integrity was evaluated using an Agilent 2100 Bioanalyzer (Agilent Technologies, Santa Clara, CA, USA)/LabChip GX system (Agilent Technologies, Santa Clara, CA, USA). Following quality assessment, mRNA was enriched using oligo(dT) magnetic beads, and sequencing libraries were prepared through fragmentation, double-stranded cDNA synthesis, end repair, A-tailing, adapter ligation, size selection, and PCR amplification. Library quality was assessed using Qubit 3.0 (Thermo Fisher Scientific, Eugene, OR, USA), Qsep400 (BiOptic Inc., New Taipei City, Taiwan), and qPCR. Qualified libraries were sequenced on the Illumina NovaSeq 6000 platform (Illumina, San Diego, CA, USA) using 150 bp paired-end sequencing (PE150) by Biomarker Technologies Corporation (Beijing, China). Raw reads were quality-filtered using Fastp v0.23.4. Adapter sequences and bases with Phred quality scores below 20 at the 3′ ends were removed. Reads containing bases with Phred quality scores below 10 after trimming, more than 10% ambiguous nucleotides (N), or fewer than 20 bp after trimming were discarded to obtain clean reads [12]. The clean reads were subsequently assembled de novo using Trinity v2.14.0. Briefly, sequencing reads were decomposed into short k-mers, which were extended into longer contigs. Contigs with overlapping sequences were then clustered into components, and transcript sequences were reconstructed using the de Bruijn graph algorithm and sequencing read information [13].
2.2.2. Functional Annotation of Unigenes
Unigene sequences were aligned against the NR (http://ftp.ncbi.nih.gov/blast/db/), Swiss-Prot (http://www.uniprot.org/), COG (http://www.ncbi.nlm.nih.gov/COG/), KOG (http://www.ncbi.nlm.nih.gov/COG/), eggNOG (https://eggnog5.embl.de/#/app/home), and KEGG (http://www.genome.jp/kegg/) databases using DIAMOND v2.0.4 in blastx mode, with an E-value threshold of 1 × 10⁻⁵, to obtain functional annotations for the unigenes [14]. These databases were accessed on 12 October 2023.
2.2.3. Gene Expression Analysis and Differentially Expressed Gene Selection
Gene expression abundance was quantified as FPKM (fragments per kilobase of transcript per million mapped fragments), which normalizes fragment counts by transcript length and sequencing depth to describe gene expression levels across samples. Principal component analysis (PCA) was performed based on FPKM expression data to evaluate overall gene expression variation among samples and the consistency of biological replicates. The first two principal components (PC1 and PC2) were used to visualize sample distribution.
Genes with FPKM values greater than 0 in all three biological replicates of a treatment group were considered expressed in that group. Venn diagrams were used to identify commonly and specifically expressed genes among treatment groups. Genes shared between the expressed gene sets of the compared groups were defined as commonly expressed genes, whereas genes present exclusively in one group’s expressed gene set were classified as specifically expressed genes.
Differential expression analysis was performed using DESeq2 v1.30.1 based on gene-level count data from individual samples. The experimental design included two genotypes (Cunninghamia lanceolata var. Luotian and C. lanceolata), three branch ages (1, 3, and 6 years), and two tissue positions (terminal bud and basal part of the lateral branch), comprising 12 treatment groups with three independent biological replicates per group. Pairwise differential expression analyses were conducted between genotypes at the same branch age and tissue position, between tissue positions within the same genotype and branch age, and between branch ages within the same genotype and tissue position. Genes with a fold change ≥ 1.5 and a p-value < 0.05 were identified as differentially expressed genes (DEGs). Fold change (FC) represents the ratio of gene expression levels between two comparison groups.
Following differential expression analysis, the top 50 DEGs were selected separately from four sets of comparisons: all comparisons, comparisons between different genotypes, comparisons between different tissue positions, and comparisons between different branch ages. First, DEGs within each individual comparison were ranked in descending order of |log2FC|, and the 50 highest-ranked genes were retained. Subsequently, within each comparison set, the frequency of occurrence of each gene across the individual top 50 DEG lists was calculated, and genes were ranked in descending order of frequency. For genes with the same frequency, the sum of their |log2FC| values across the lists in which they appeared was used as a secondary ranking criterion. Finally, the 50 highest-ranked DEGs from each of the four comparison sets were selected for subsequent expression pattern and functional annotation analyses. Candidate genes potentially associated with the weeping phenotype were further identified based on their expression characteristics and functional annotations.
2.2.4. Functional Enrichment Analysis of Differentially Expressed Genes
The Gene Ontology (GO) database (http://geneontology.org/m, accessed on 12 October 2023) was used to classify genes into three categories: biological process (BP), cellular component (CC), and molecular function (MF). GO enrichment analysis of DEGs was performed using the topGO R package (v2.58.0) based on the Kolmogorov–Smirnov test. The Kyoto Encyclopedia of Genes and Genomes (KEGG) database (https://www.genome.jp/kegg/, accessed on 12 October 2023) was used to classify genes according to the pathways or functions in which they participate. KEGG pathway enrichment analysis of DEGs was performed using KOBAS v3.0. The hypergeometric test was used to identify pathways overrepresented among DEGs relative to the background gene set, and q-values were used to assess statistical significance. Pathways with q-values < 0.05 were considered statistically significantly enriched. The enrichment results were visualized using the clusterProfiler R package (v4.4.4), and the top 20 pathways with the lowest q-values were displayed.
2.3. Accession Number
The sequence reads from transcriptome sequencing have been deposited in the NCBI Sequence Read Archive under accession number PRJNA1522979.
3. Results
3.1. Transcriptome Sequencing and De Novo Assembly
The number of clean reads obtained from each sample ranged from 19,795,231 to 26,108,511 (Table 1). The GC content ranged from 43.41% to 45.37%, while the percentages of Q20 and Q30 bases exceeded 97.74% and 93.76%, respectively, in all samples. The mapping rates of clean reads back to the assembled unigenes ranged from 68.11% to 79.25%, with an average mapping rate of 75.65%. A total of 98,030 transcripts and 59,109 unigenes were obtained through de novo assembly (Table S1). The N50 length of the transcripts was 3664 bp, with an average length of 1481 bp. Among the transcripts, 22,503 (22.96%) were longer than 2000 bp, while 40,184 (40.99%) ranged from 300 to 500 bp. The N50 length of the unigenes was 2293 bp, with an average length of 1175.13 bp. Among the unigenes, 9446 (15.98%) were longer than 2000 bp, while 28,507 (48.23%) ranged from 300 to 500 bp.
Table 1.
Summary statistics of sequencing data.
3.2. Statistics of Unigene Annotation
Among the 59,109 unigenes, 42,633 (72.13%) were successfully annotated in at least one public database (Table S2). Specifically, 12,731 (29.86%), 31,717 (74.40%), 24,254 (56.89%), 20,028 (46.98%), 31,331 (73.49%), 22,654 (53.14%), 34,904 (81.87%), 28,746 (67.43%), and 39,679 (93.07%) unigenes were annotated in the COG, GO, KEGG, KOG, Pfam, Swiss-Prot, TrEMBL, eggNOG, and NR databases, respectively.
3.3. Principal Component Analysis and Correlation Analysis
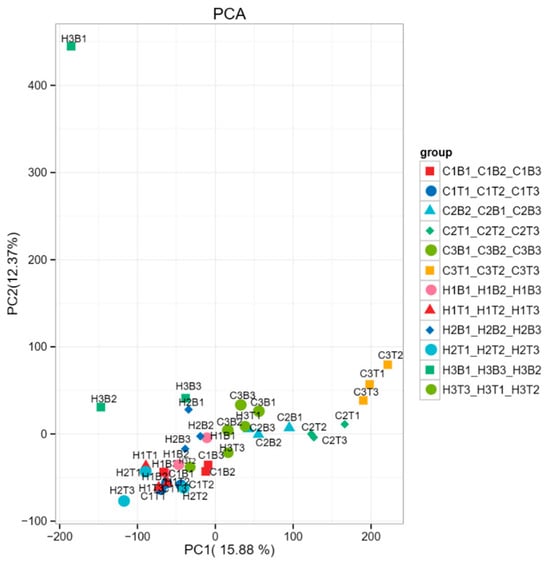
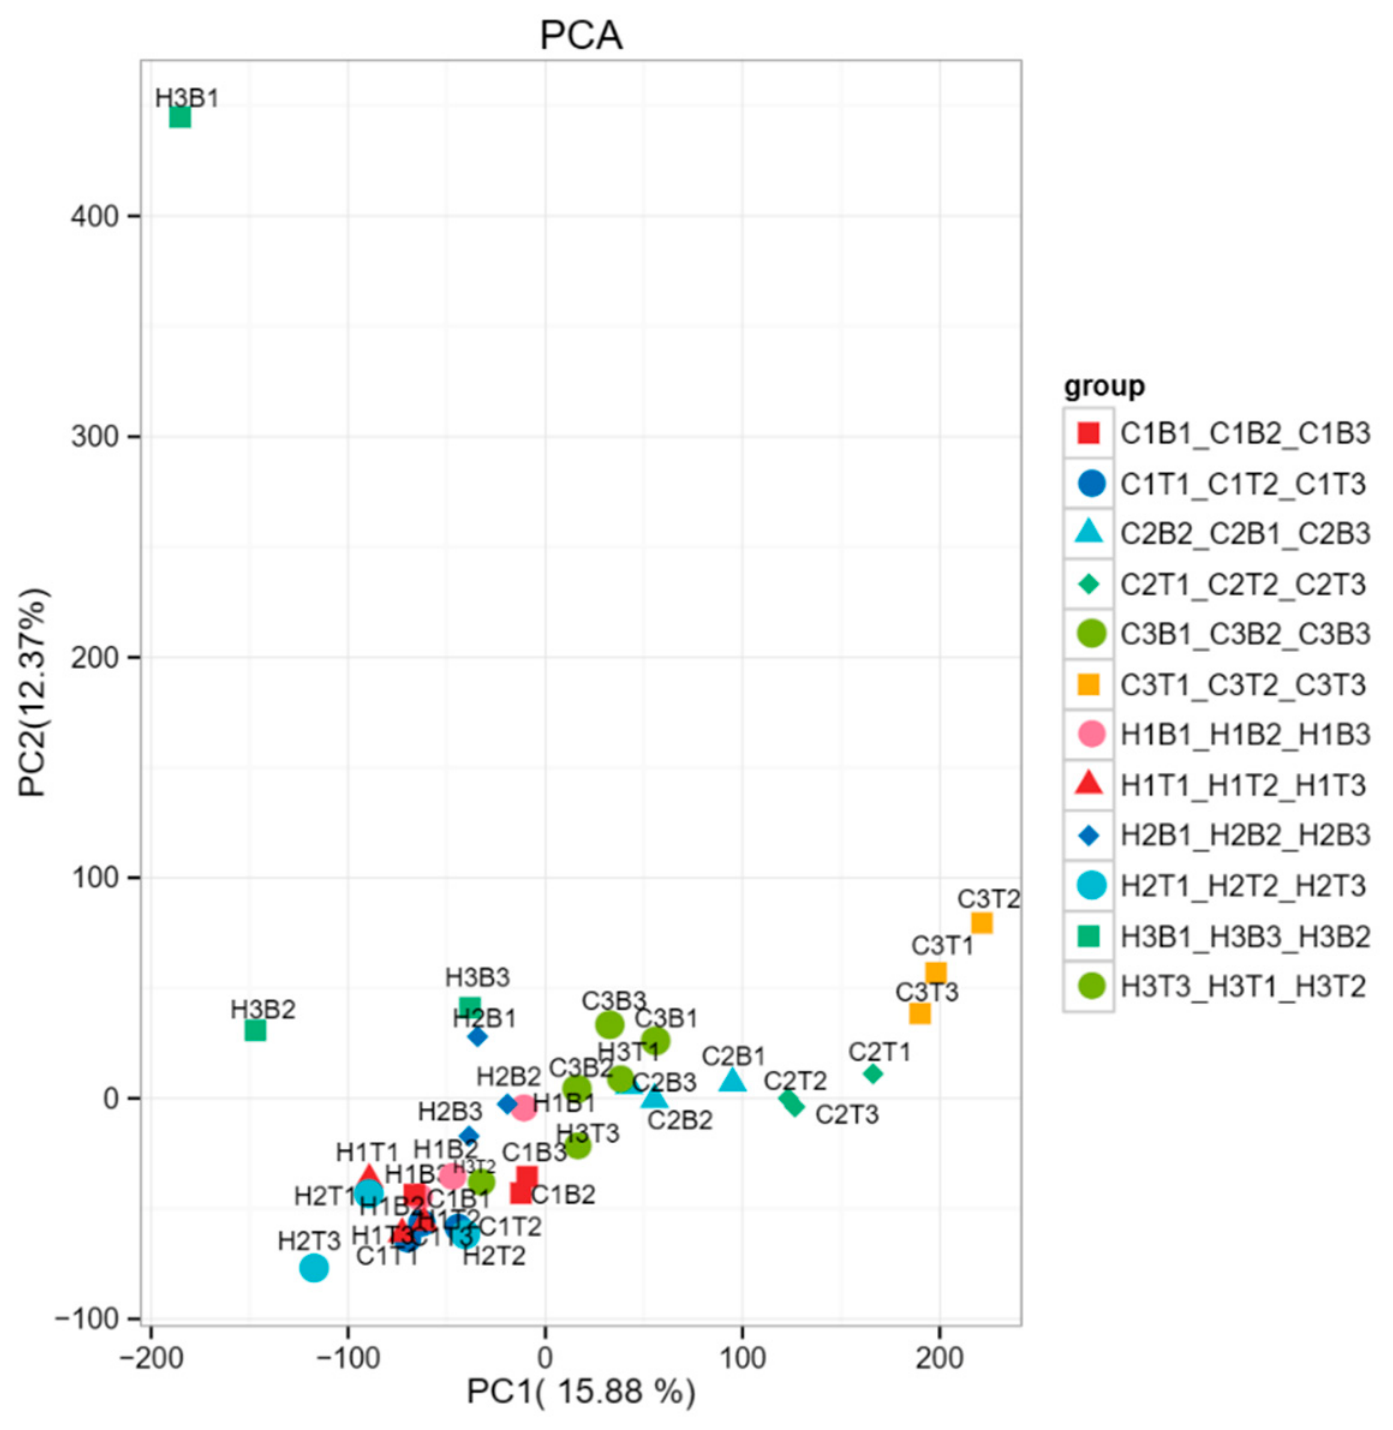
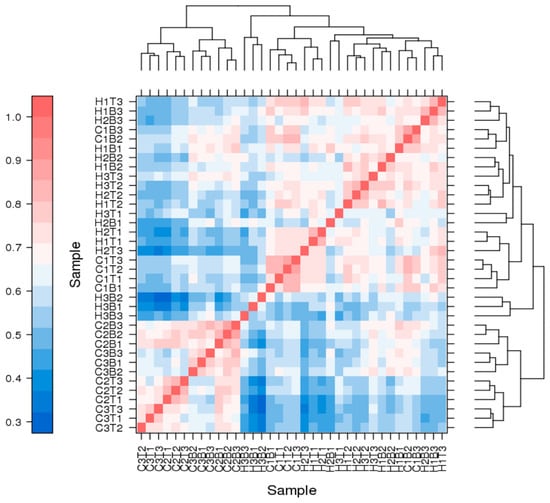
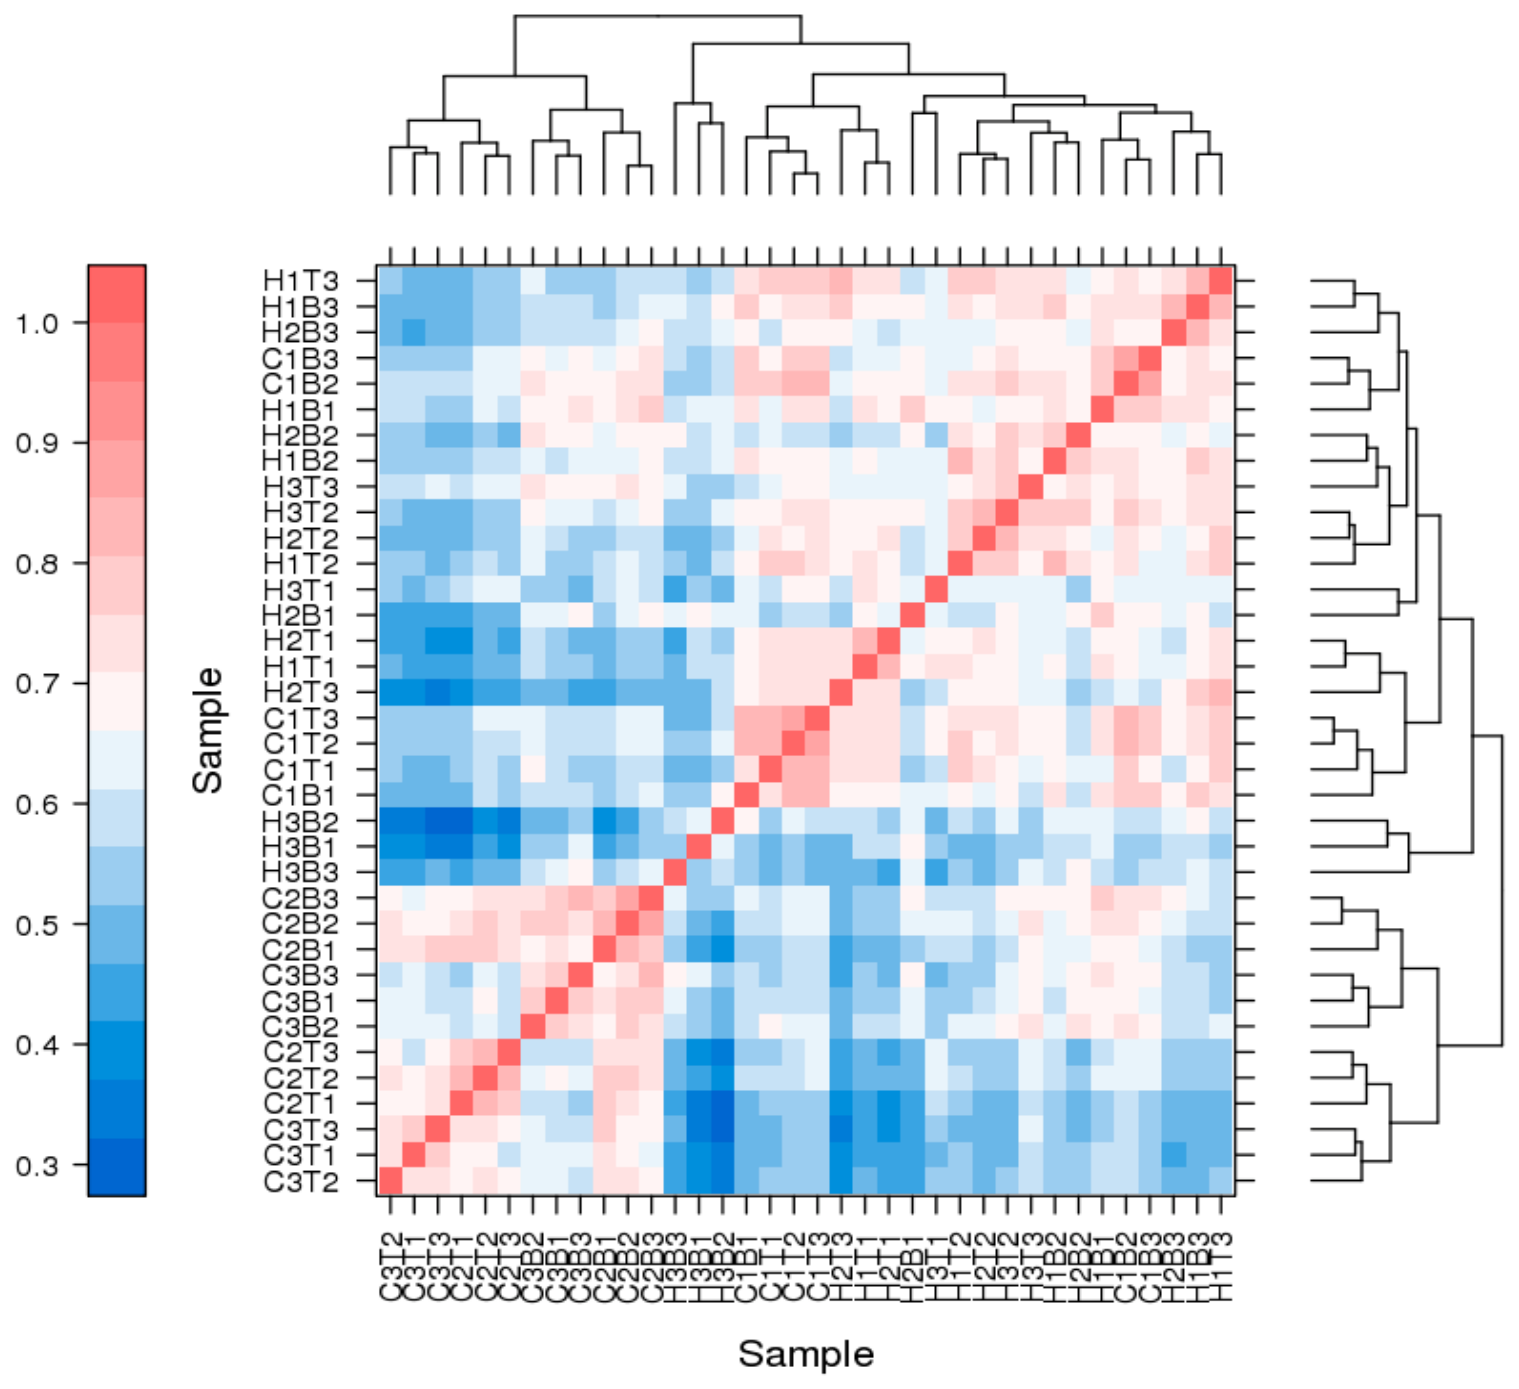
PCA showed that the first two principal components (PC1 and PC2) together explained 28.25% of the total variation, with PC1 accounting for 15.88% and PC2 accounting for 12.37% (Figure 1). Overall, the three biological replicates within most treatment groups clustered closely together, with samples primarily separated along PC1, indicating generally good reproducibility. However, the H3B group exhibited relatively greater within-group dispersion compared with most other treatment groups, with H3B1 showing a pronounced deviation from the other two biological replicates (H3B2 and H3B3) along PC2. Sequencing quality assessment showed that H3B1 contained 25,844,263 clean reads, with a Q30 value of 94.05% and a GC content of 45.37%, all of which were within the ranges observed across the samples in this study (Table 1), indicating no obvious abnormalities in sequencing quality. Pairwise sample correlation analysis showed that the three biological replicates within most treatment groups exhibited relatively high correlations in their gene expression patterns and clustered in the same branches in the correlation heatmap, whereas samples from different genotypes, tissue positions, and branch ages displayed distinct clustering patterns (Figure 2). The results of the PCA and correlation analyses were generally consistent. Notably, despite its deviation in the PCA, H3B1 remained clustered in the same branch as H3B2 and H3B3 in the correlation heatmap, suggesting that the three biological replicates retained some similarity in their overall gene expression patterns.
Figure 1.
Principal component analysis (PCA) of all RNA sequencing samples. Note: C: Cunninghamia lanceolata var. Luotian; H: Cunninghamia lanceolata; T: terminal bud of lateral branch; B: basal part of lateral branch; 1: one-year-old lateral branch; 2: three-year-old lateral branch; 3: six-year-old lateral branch. The last digit of the sample name represents the replicate group.
Figure 2.
Heatmap of pairwise sample correlation based on gene expression levels. Note: C: Cunninghamia lanceolata var. Luotian; H: Cunninghamia lanceolata; T: terminal bud of lateral branch; B: basal part of lateral branch; 1: one-year-old lateral branch; 2: three-year-old lateral branch; 3: six-year-old lateral branch. The last digit of the sample name represents the replicate group.
3.4. Gene Expression Analysis Among Different Samples
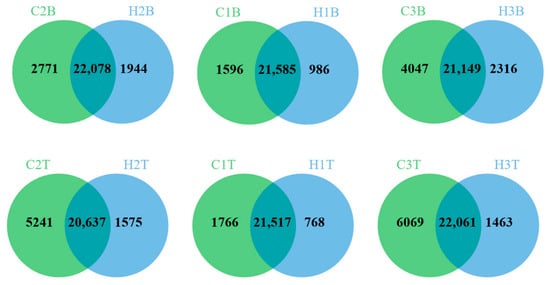
A large number of specifically expressed genes were detected among different samples. For the same tissue (terminal bud or basal part of the lateral branch) at the same branch age (1, 3, or 6 years), the number of specifically expressed genes in C. lanceolata var. Luotian was higher than that in C. lanceolata (Figure 3). The largest difference was observed in C3T_vs_H3T, in which C. lanceolata var. Luotian contained 4606 more specifically expressed genes than C. lanceolata. In contrast, the smallest difference was detected in C1B_vs_H1B, with only 610 additional specifically expressed genes in C. lanceolata var. Luotian. For different tissues of the same branch age within C. lanceolata var. Luotian, the number of specifically expressed genes in the terminal bud was higher than that in the basal part of the lateral branch. Moreover, the difference increased with branch age. The differences in the numbers of specifically expressed genes between the terminal bud and the basal part of the lateral branch were 102, 1029, and 2934 in C1B_vs_C1T, C2B_vs_C2T, and C3B_vs_C3T, respectively (Figure S1). In C. lanceolata, only the terminal bud of six-year-old lateral branches contained slightly more specifically expressed genes than the basal part, whereas the basal part contained more specifically expressed genes than the terminal bud in one- and three-year-old lateral branches. The differences in the numbers of specifically expressed genes in H1B_vs_H1T, H2B_vs_H2T, and H3B_vs_H3T were 286, 1810, and 59, respectively, and no age-dependent increasing trend was observed. For the same tissue at different branch ages within each genotype, the number of specifically expressed genes in the basal part of the lateral branch increased progressively with branch age in both C. lanceolata var. Luotian and C. lanceolata. However, the number of specifically expressed genes in the terminal bud was lowest in the third year (C2T and H2T) and the highest in the sixth year (C3T and H3T), without showing a continuous age-dependent increase (Figure S2).
Figure 3.
Venn diagram of all genes between different tree genotypes. Note: C: Cunninghamia lanceolata var. Luotian; H: Cunninghamia lanceolata; T: terminal bud of lateral branch; B: basal part of lateral branch; 1: one-year-old lateral branch; 2: three-year-old lateral branch; 3: six-year-old lateral branch.
3.5. Analysis of Differentially Expressed Genes Among Different Samples
3.5.1. Comparison of the Numbers of Differentially Expressed Genes
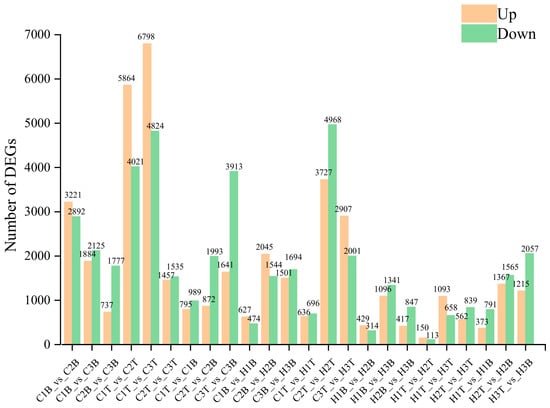
The numbers of DEGs detected in pairwise comparisons varied with branch age, tissue position, and genotype (Figure 4). In comparisons between the two genotypes at the same branch age and tissue position, C2T_vs_H2T showed the largest number of DEGs, with 8695 genes, including 3727 upregulated and 4968 downregulated genes. In contrast, C1B_vs_H1B showed the smallest number, with 1101 DEGs, including 627 upregulated and 474 downregulated genes. In comparisons between different tissues at the same branch age within each genotype, the numbers of DEGs varied across branch ages. The largest numbers were detected in six-year-old lateral branches, with 5554 DEGs (1641 upregulated and 3913 downregulated) in C3T_vs_C3B and 3272 DEGs (1215 upregulated and 2057 downregulated) in H3T_vs_H3B.In comparisons between different branch ages at the same tissue position within each genotype, the numbers of DEGs also varied between terminal buds and basal parts of lateral branches. In C. lanceolata var. Luotian, comparisons involving terminal buds generally yielded more DEGs than those involving basal parts. Among the terminal bud comparisons, C1T_vs_C3T showed the largest number of DEGs, with 11,613 (6789 upregulated and 4824 downregulated), whereas C1B_vs_C2B showed the largest number among the basal part comparisons, with 6113 DEGs (3221 upregulated and 2892 downregulated). In C. lanceolata, the numbers of DEGs in the terminal bud and the basal part comparisons were relatively similar. H1T_vs_H3T showed the largest number among the terminal bud comparisons, with 1751 DEGs (1093 upregulated and 658 downregulated), whereas H1B_vs_H3B showed the largest number among the basal part comparisons, with 2437 DEGs (1096 upregulated and 1341 downregulated). Overall, the numbers of DEGs differed between the two genotypes in corresponding comparisons.
Figure 4.
Numbers of differentially expressed genes. Note: C: Cunninghamia lanceolata var. Luotian; H: Cunninghamia lanceolata; T: terminal bud of lateral branch; B: basal part of lateral branch; 1: one-year-old lateral branch; 2: three-year-old lateral branch; 3: six-year-old lateral branch.
3.5.2. Analysis of the Top 50 Differentially Expressed Genes Among Different Samples
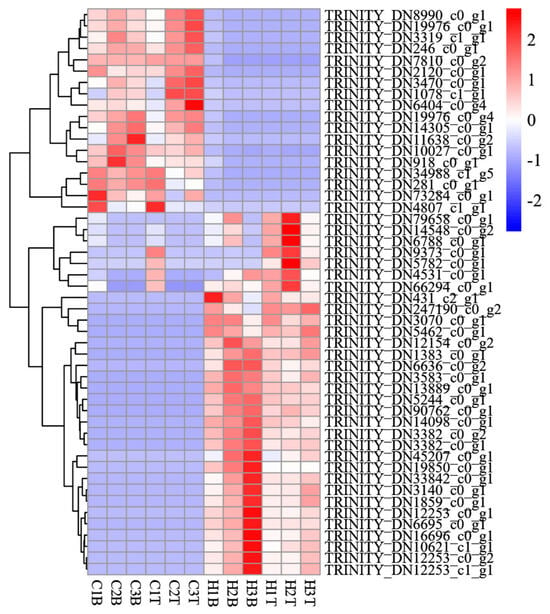
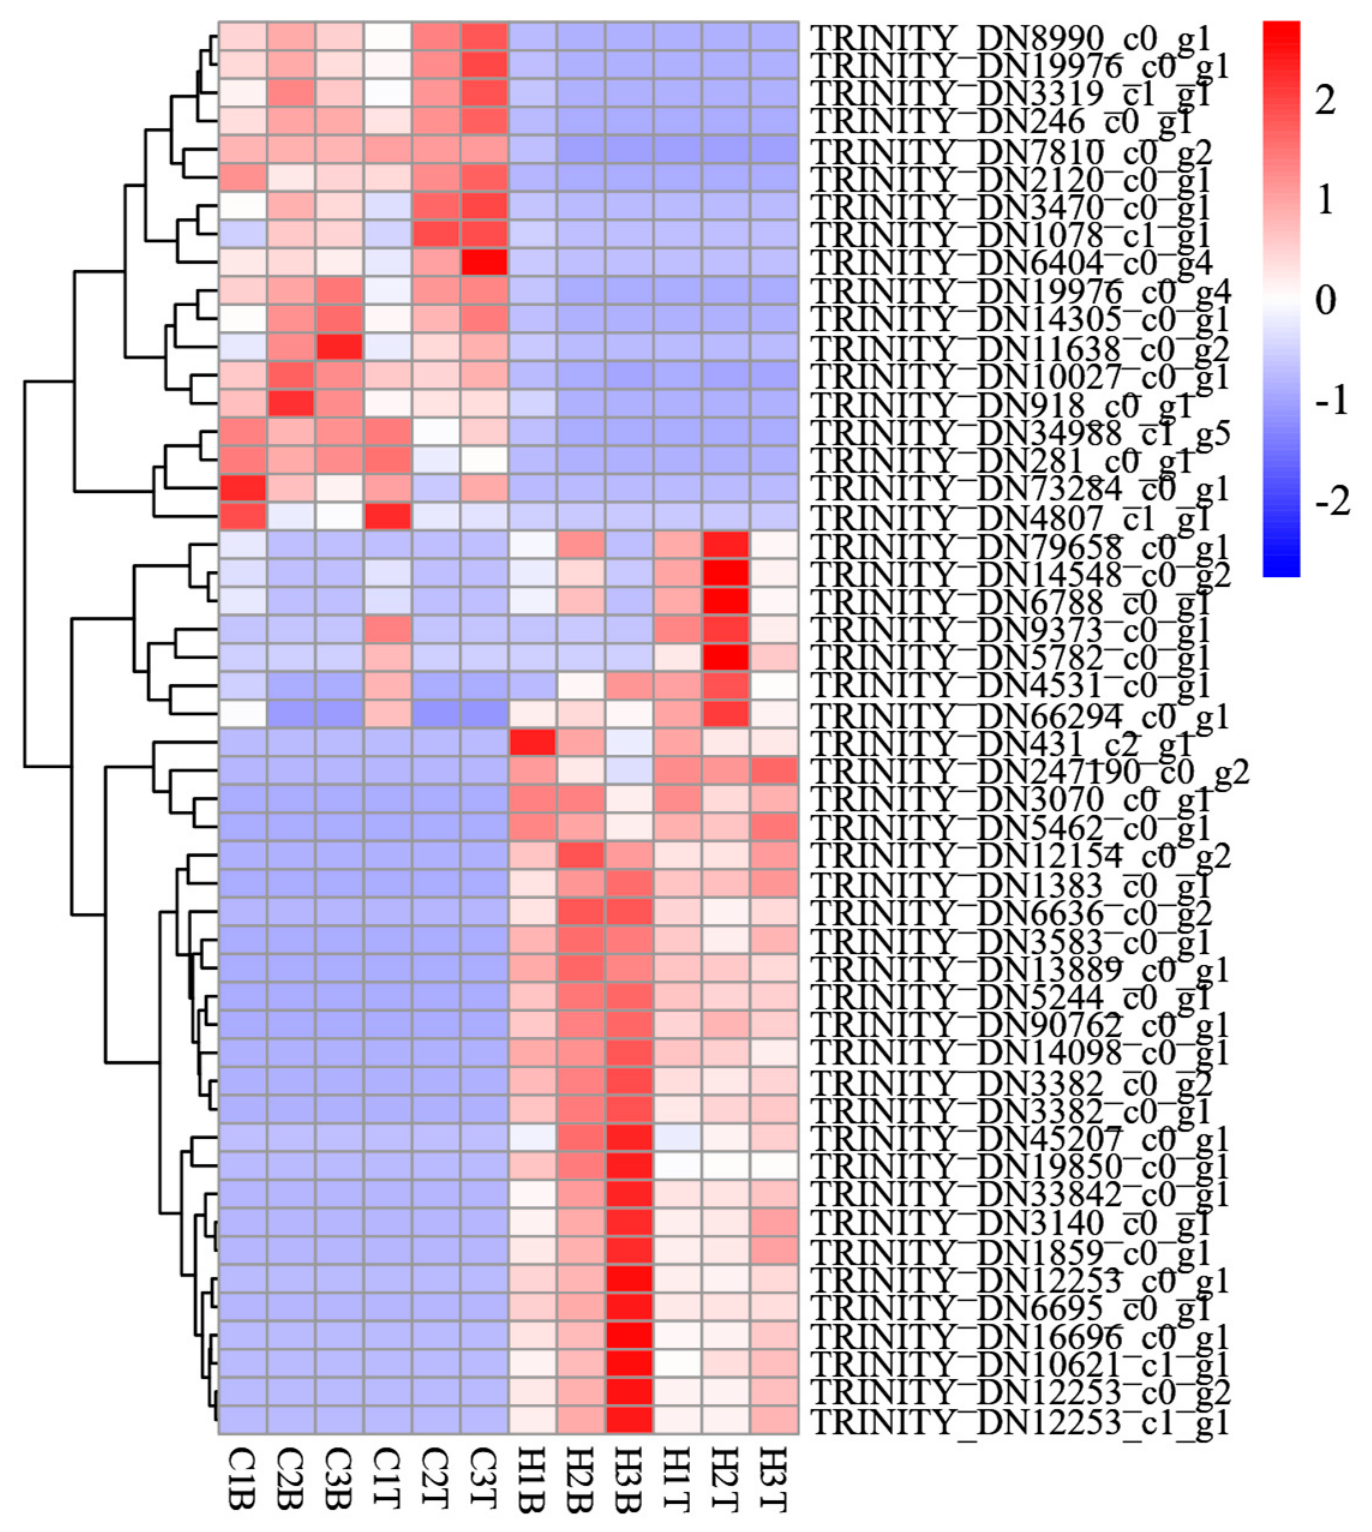
For comparisons between the two genotypes at the same branch age and in the same tissue (C1T_vs_H1T, C2T_vs_H2T, C3T_vs_H3T, C1B_vs_H1B, C2B_vs_H2B, and C3B_vs_H3B), the expression patterns of the top 50 DEGs differed markedly between C. lanceolata var. Luotian and C. lanceolata (Figure 5). Among these genes, 18 were consistently more highly expressed in C. lanceolata var. Luotian, whereas 25 showed consistently higher expression in C. lanceolata, and the remaining 7 genes exhibited no obvious expression pattern. In C. lanceolata var. Luotian, the expression levels of TRINITY_DN11638_c0_g2, TRINITY_DN14305_c0_g1, and TRINITY_DN19976_c0_g4 showed an apparent increasing trend across the examined branch ages in both the terminal bud and the basal part of the lateral branch. TRINITY_DN2120_c0_g1 showed an apparent increasing expression trend across branch ages in the basal part but an apparent decreasing trend in the terminal bud. In contrast, TRINITY_DN1078_c1_g1, TRINITY_DN19976_c0_g1, TRINITY_DN246_c0_g1, TRINITY_DN3470_c0_g1, TRINITY_DN6404_c0_g4, and TRINITY_DN8990_c0_g1 displayed an apparent increasing expression trend across the examined branch ages only in the terminal bud, whereas no obvious trend was observed in the basal part. In C. lanceolata, the expression levels of 14 genes, including TRINITY_DN10621_c1_g1, TRINITY_DN6695_c0_g1, TRINITY_DN16696_c0_g1, and TRINITY_DN3140_c0_g1, showed an apparent progressive increase across the examined branch ages in the basal part of the lateral branch. Among the top 50 DEGs, only five genes were functionally annotated. TRINITY_DN10621_c1_g1 and TRINITY_DN6695_c0_g1 were annotated as sucrose synthase (K00695) and were involved in starch and sucrose metabolism. TRINITY_DN16696_c0_g1 and TRINITY_DN246_c0_g1 were associated with plant–pathogen interaction, whereas TRINITY_DN3140_c0_g1 participated in protein processing in the endoplasmic reticulum.
Figure 5.
Heatmap of the top 50 differentially expressed genes between different tree genotypes. Note: C: Cunninghamia lanceolata var. Luotian; H: Cunninghamia lanceolata; T: terminal bud of lateral branch; B: basal part of lateral branch; 1: one-year-old lateral branch; 2: three-year-old lateral branch; 3: six-year-old lateral branch.
For comparisons between different tissues at the same branch age within each genotype (C1T_vs_C1B, C2T_vs_C2B, C3T_vs_C3B, H1T_vs_H1B, H2T_vs_H2B, and H3T_vs_H3B), genes exhibiting distinct expression patterns were mainly detected in the terminal buds of both genotypes (Figure S3). A total of 13 genes were consistently more highly expressed in C. lanceolata var. Luotian, whereas 9 genes showed higher expression in C. lanceolata, and the remaining 28 genes displayed no clear expression pattern. In C. lanceolata var. Luotian, only TRINITY_DN4633_c0_g1 showed an apparent increasing expression trend across the examined branch ages in the terminal bud. In C. lanceolata, TRINITY_DN16900_c0_g1, TRINITY_DN358600_c0_g1, and TRINITY_DN8872_c1_g1 showed an apparent increasing expression trend across branch ages in the terminal bud, whereas TRINITY_DN2188_c0_g4 and TRINITY_DN76635_c0_g1 exhibited an apparent decreasing trend. In addition, the expression of TRINITY_DN2389_c0_g2 appeared to decrease across the examined branch ages in the basal part of the lateral branch. Functional annotation indicated that these genes were associated with terpenoid backbone biosynthesis, cutin, suberine and wax biosynthesis, glycolysis/gluconeogenesis, ascorbate and aldarate metabolism, and fatty acid degradation.
For comparisons between different branch ages within the same tissue (C1B_vs_C2B, C1B_vs_C3B, C2B_vs_C3B, C1T_vs_C2T, C1T_vs_C3T, C2T_vs_C3T, H1B_vs_H2B, H1B_vs_H3B, H2B_vs_H3B, H1T_vs_H2T, H1T_vs_H3T, and H2T_vs_H3T), the expression patterns of the top 50 DEGs also differed substantially between the two genotypes (Figure S4). A total of 15 genes were consistently more highly expressed in C. lanceolata var. Luotian, whereas 19 genes showed higher expression in C. lanceolata, and 16 genes exhibited no obvious expression pattern. Eight genes, namely TRINITY_DN15871_c0_g1, TRINITY_DN1737_c1_g1, TRINITY_DN21574_c1_g1, TRINITY_DN2299_c0_g1, TRINITY_DN23892_c0_g1, TRINITY_DN30164_c0_g1, TRINITY_DN4046_c0_g1, and TRINITY_DN4633_c0_g1, showed an apparent increasing expression trend across the examined branch ages in the terminal bud of C. lanceolata var. Luotian. Among them, TRINITY_DN15871_c0_g1, TRINITY_DN1737_c1_g1, TRINITY_DN21574_c1_g1, and TRINITY_DN4046_c0_g1 also showed an apparent increasing expression trend across branch ages in the basal part of C. lanceolata. Functional annotation revealed that these genes were associated with glycolysis/gluconeogenesis, fatty acid degradation, tyrosine metabolism, arginine biosynthesis, alanine, aspartate and glutamate metabolism, glyoxylate and dicarboxylate metabolism, and cutin, suberine and wax biosynthesis.
3.6. GO Enrichment Analysis of Differentially Expressed Genes Among Different Samples
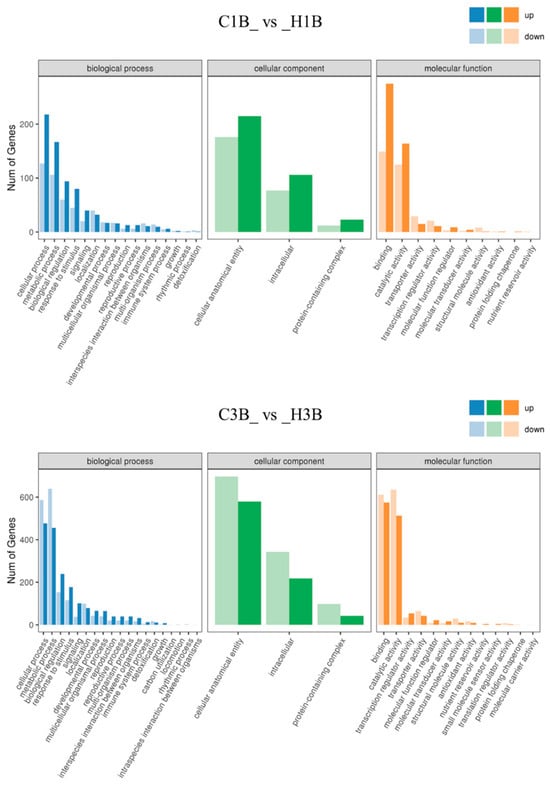
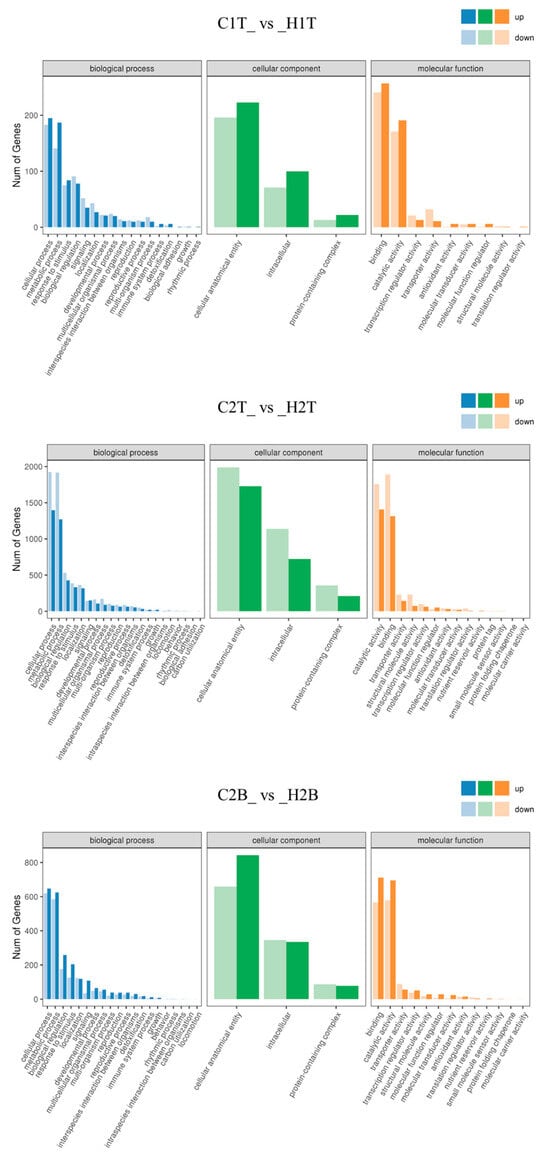
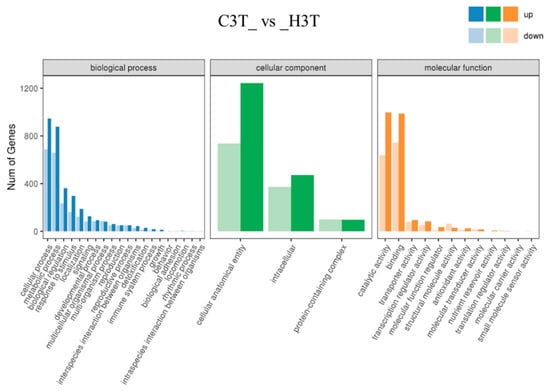
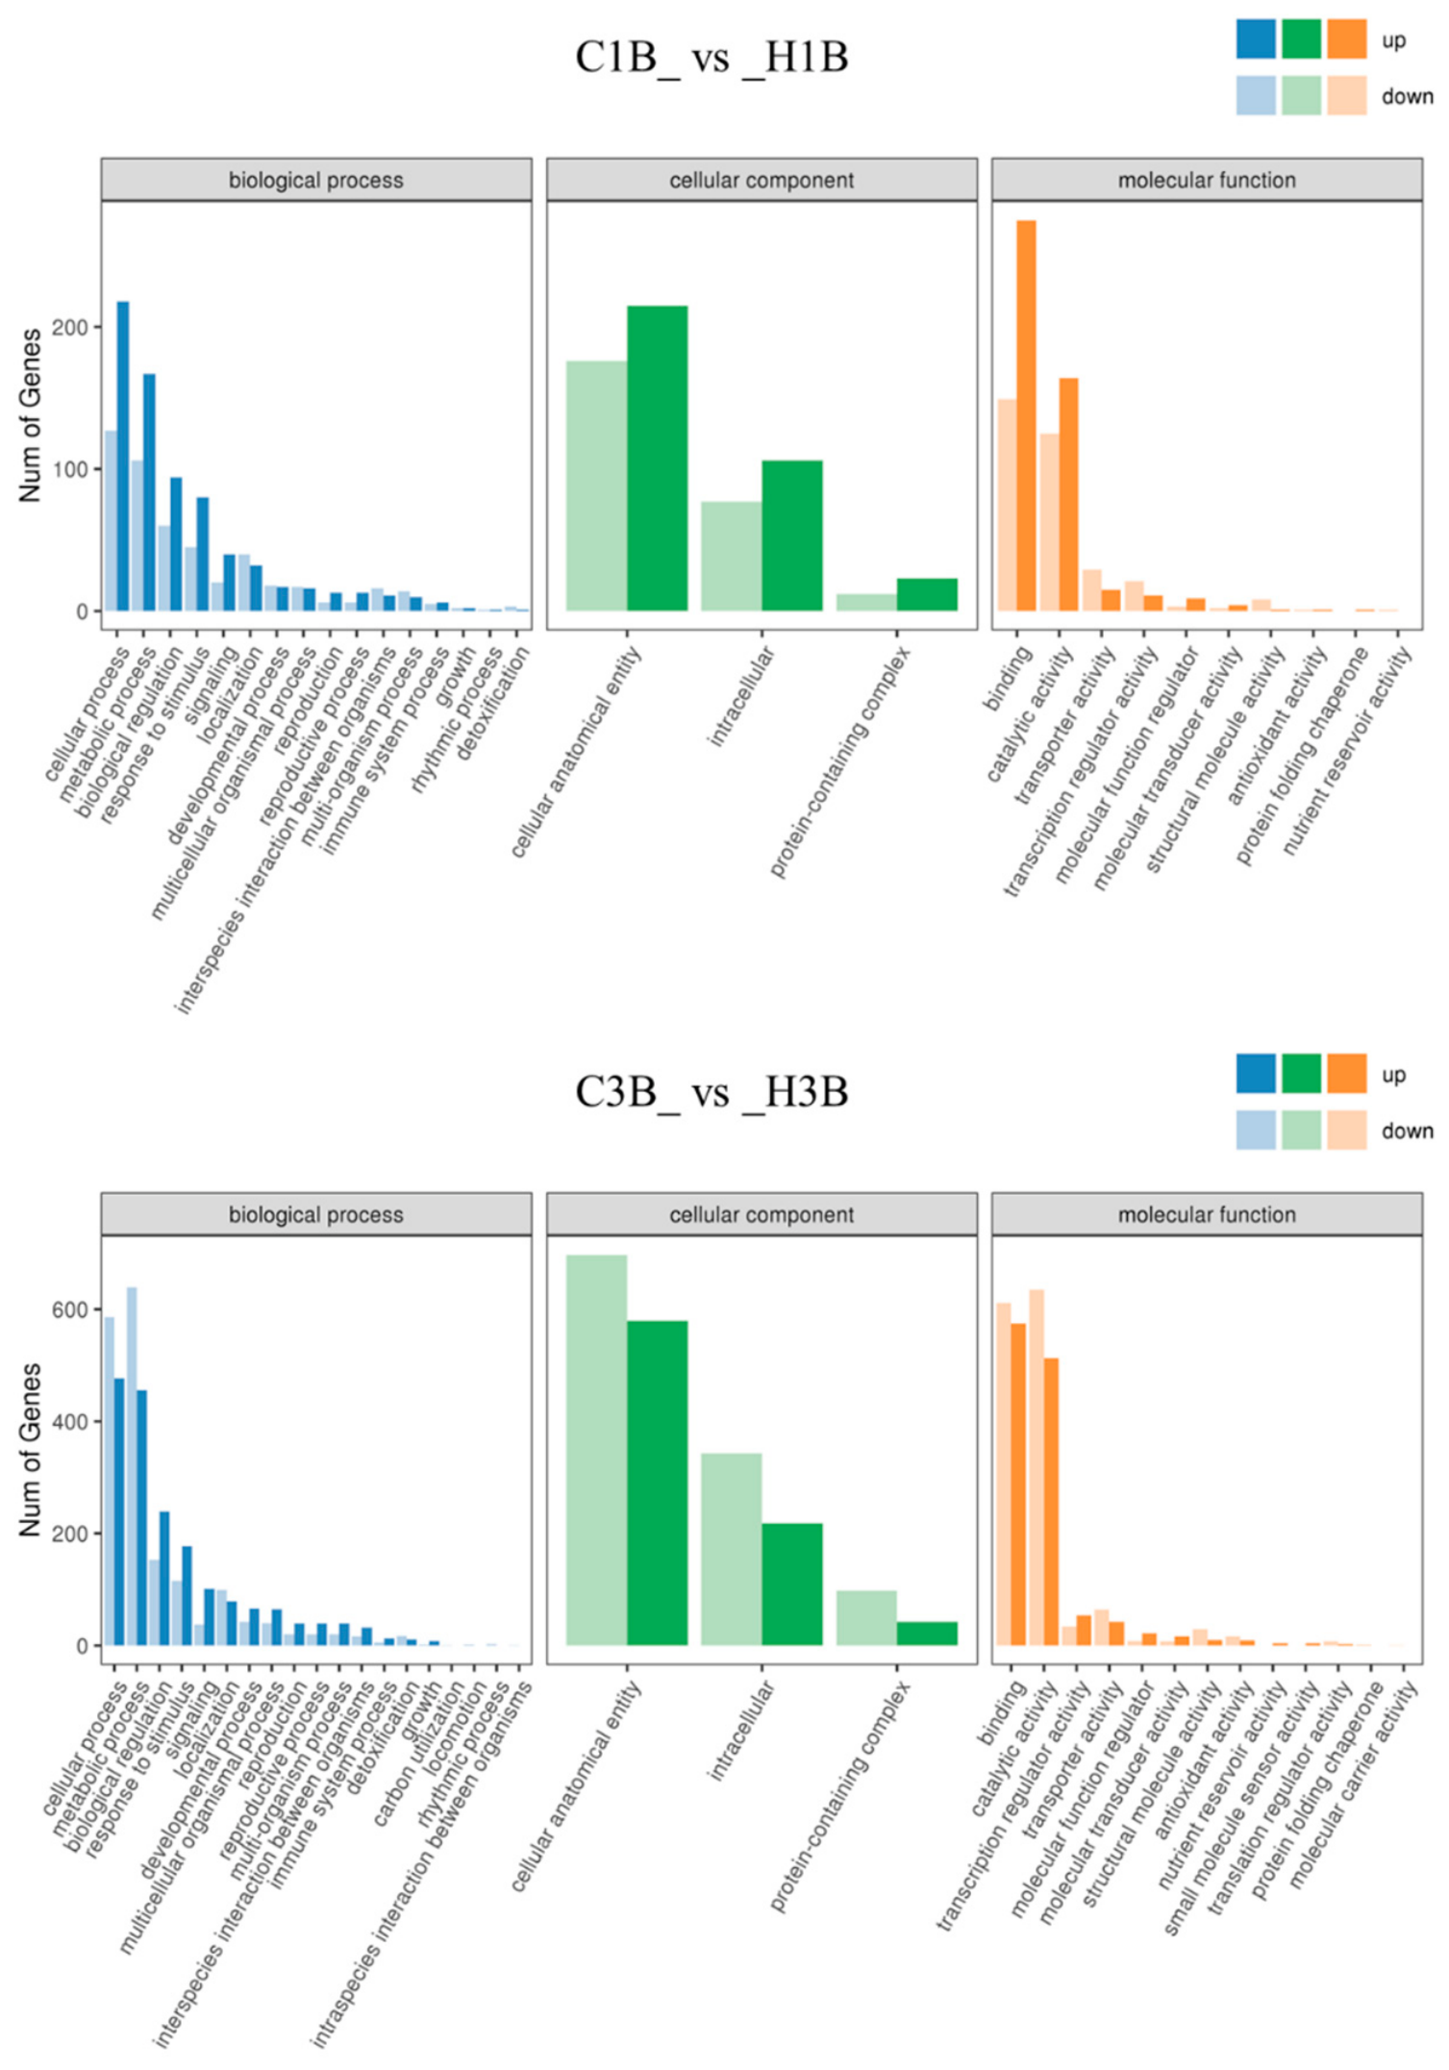
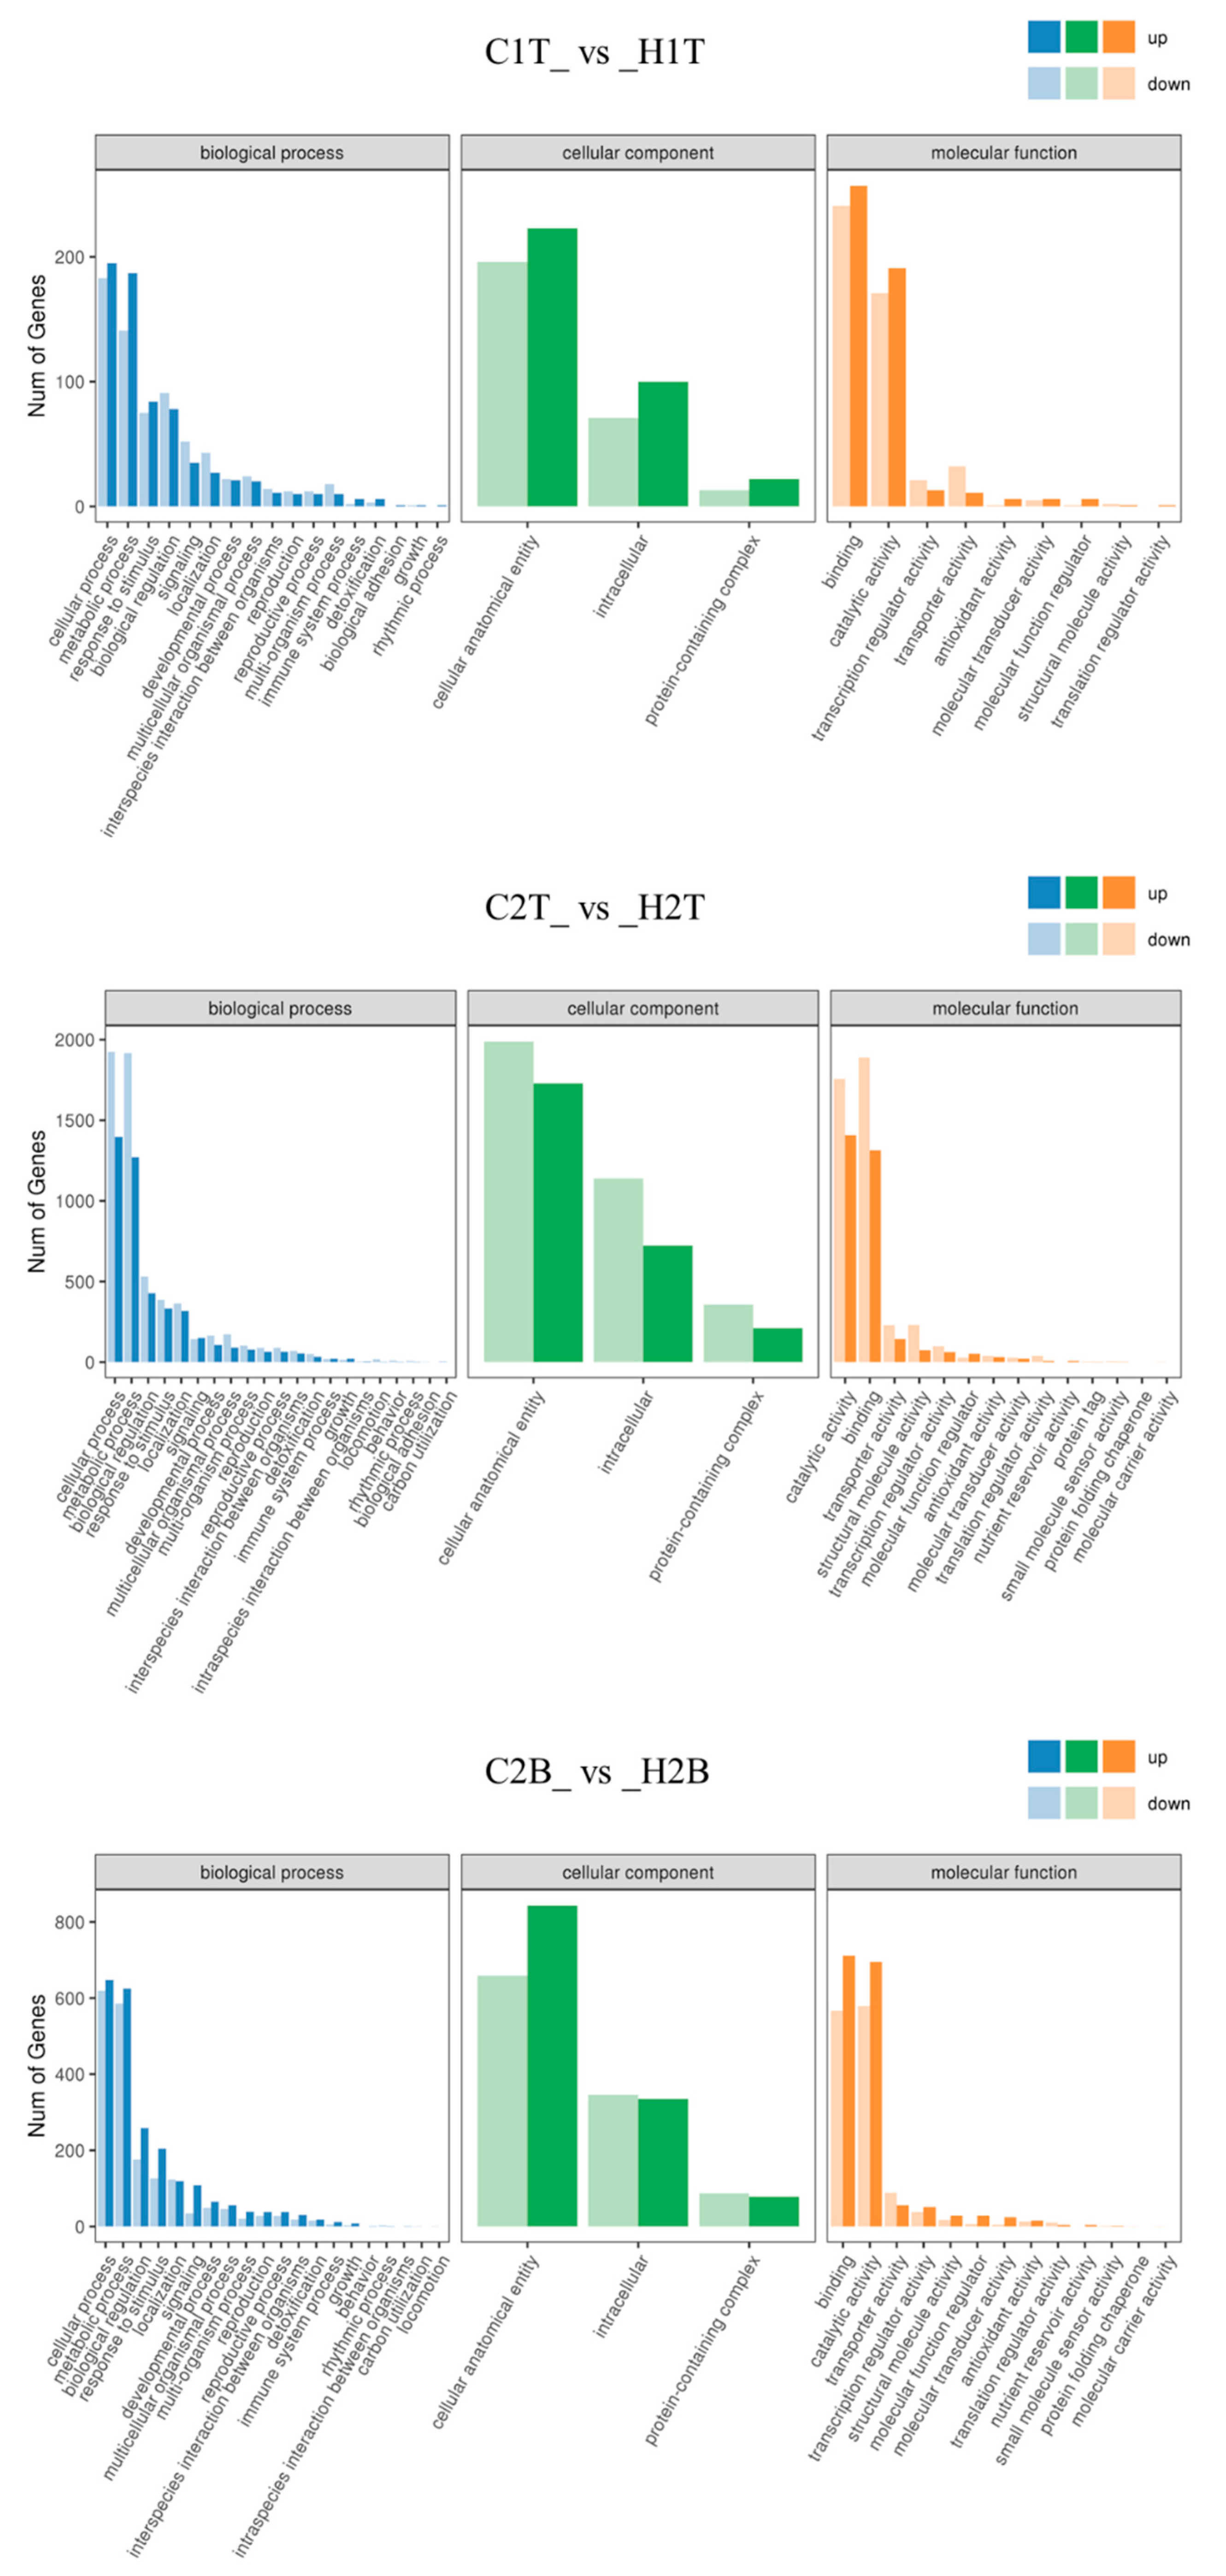
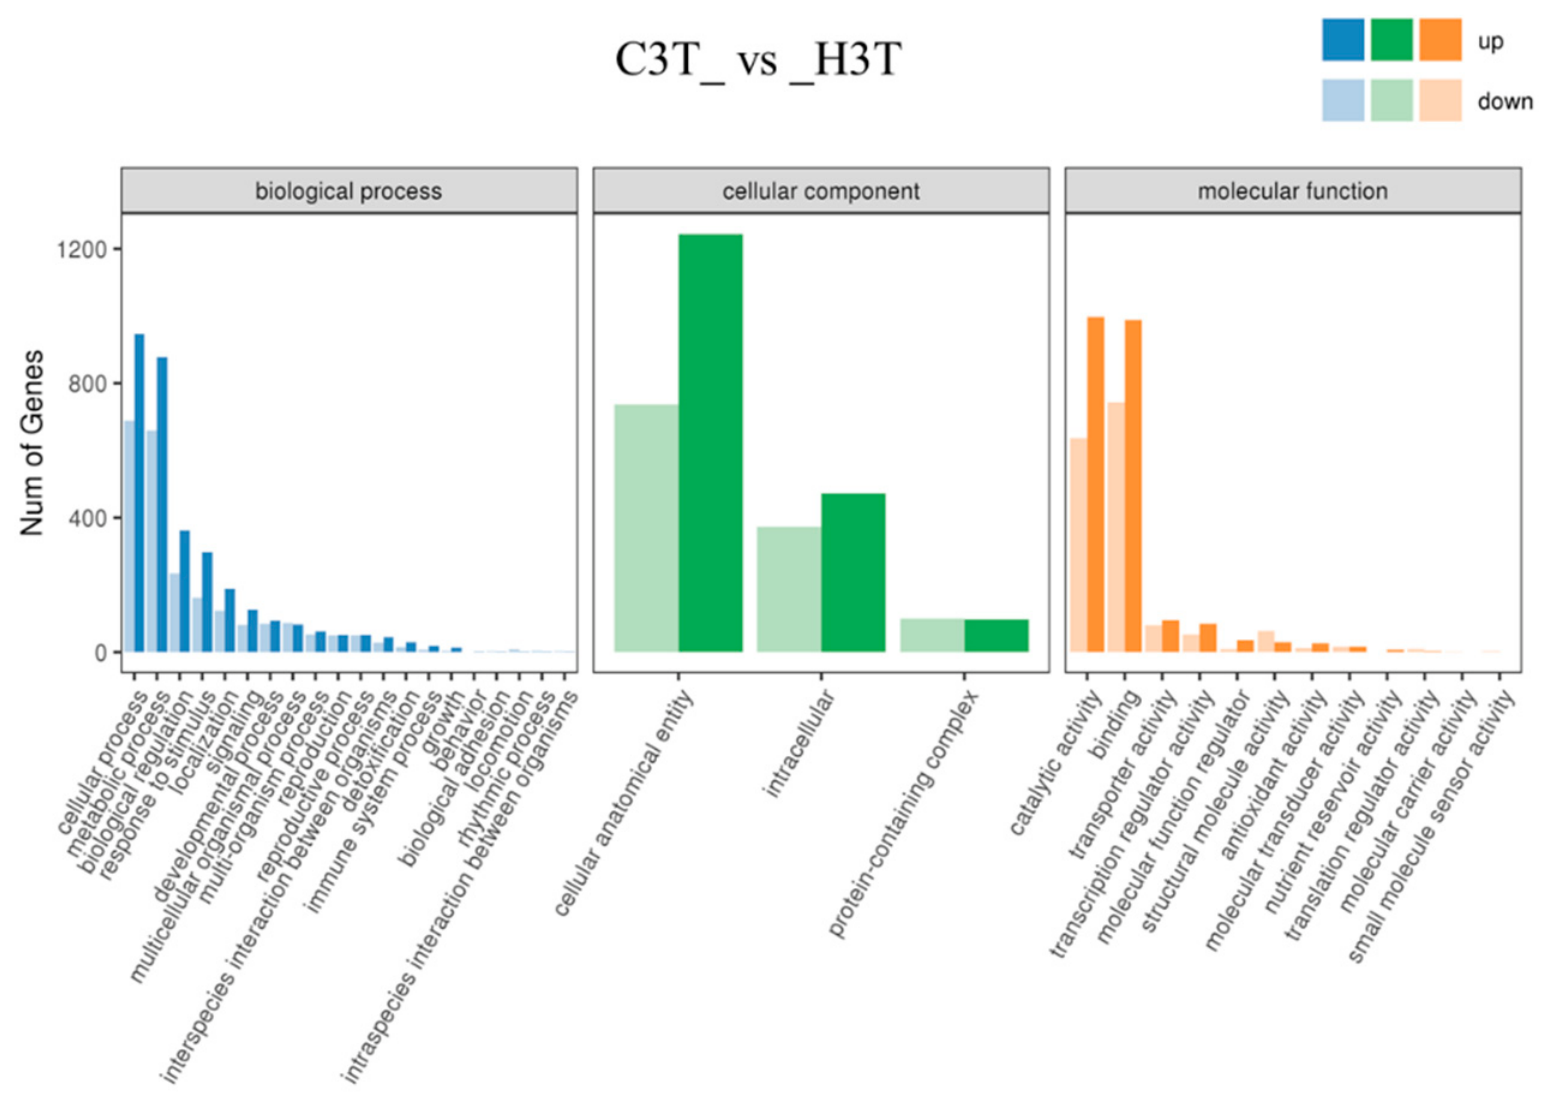
The DEGs among all samples showed similar functional classifications across the three GO categories: biological process (BP), cellular component (CC), and molecular function (MF) (Figure 6; Figures S5 and S6). In the biological process category, the DEGs were mainly enriched in cellular processes and metabolic processes. In the cellular component category, they were mainly enriched in cellular anatomical entities, whereas in the molecular function category, they were mainly enriched in binding and catalytic activity.
Figure 6.
GO functional classification of differentially expressed genes between different tree genotypes. Note: C: Cunninghamia lanceolata var. Luotian; H: Cunninghamia lanceolata; T: terminal bud of lateral branch; B: basal part of lateral branch; 1: one-year-old lateral branch; 2: three-year-old lateral branch; 3: six-year-old lateral branch.
3.7. KEGG Enrichment Analysis of Differentially Expressed Genes Among Different Samples
3.7.1. KEGG Enrichment Analysis of Differentially Expressed Genes Between the Two Genotypes
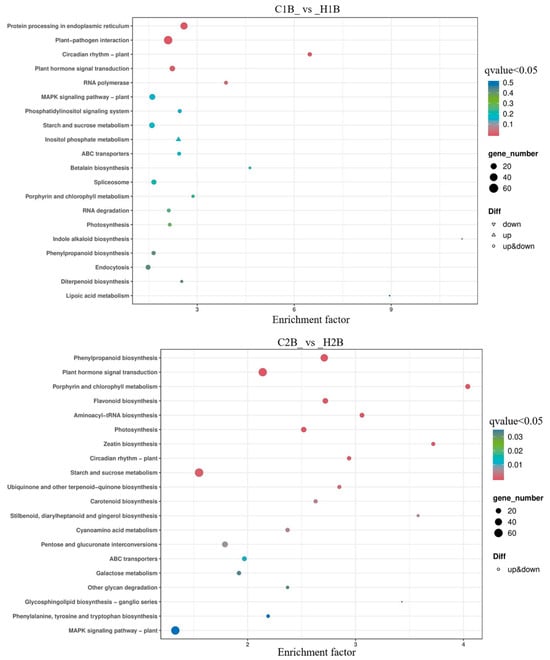
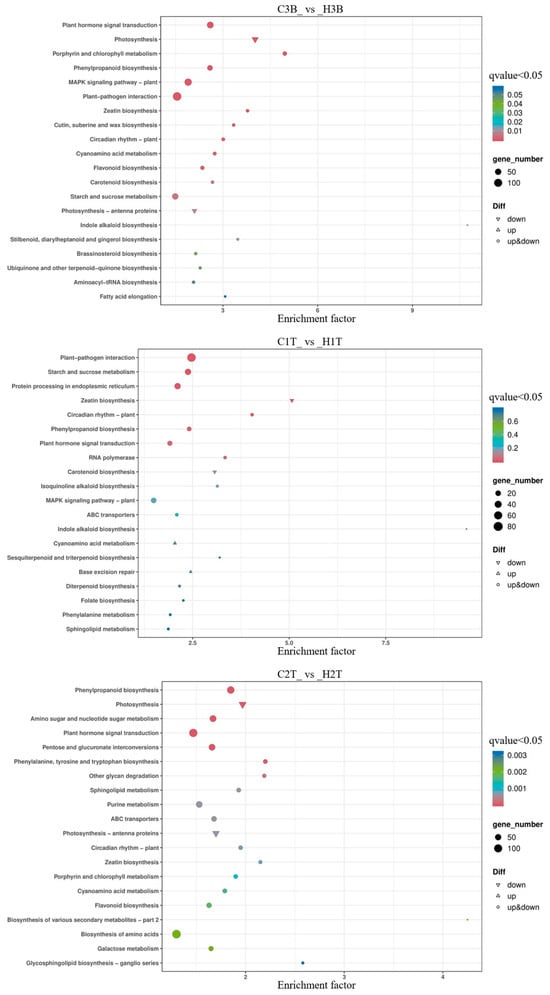
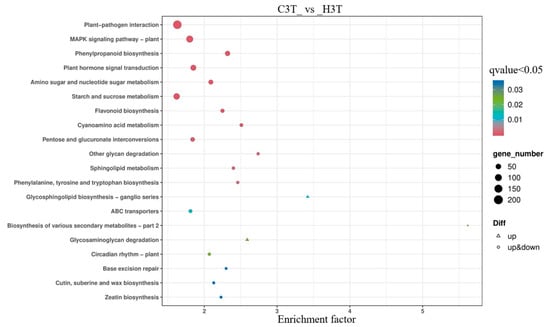
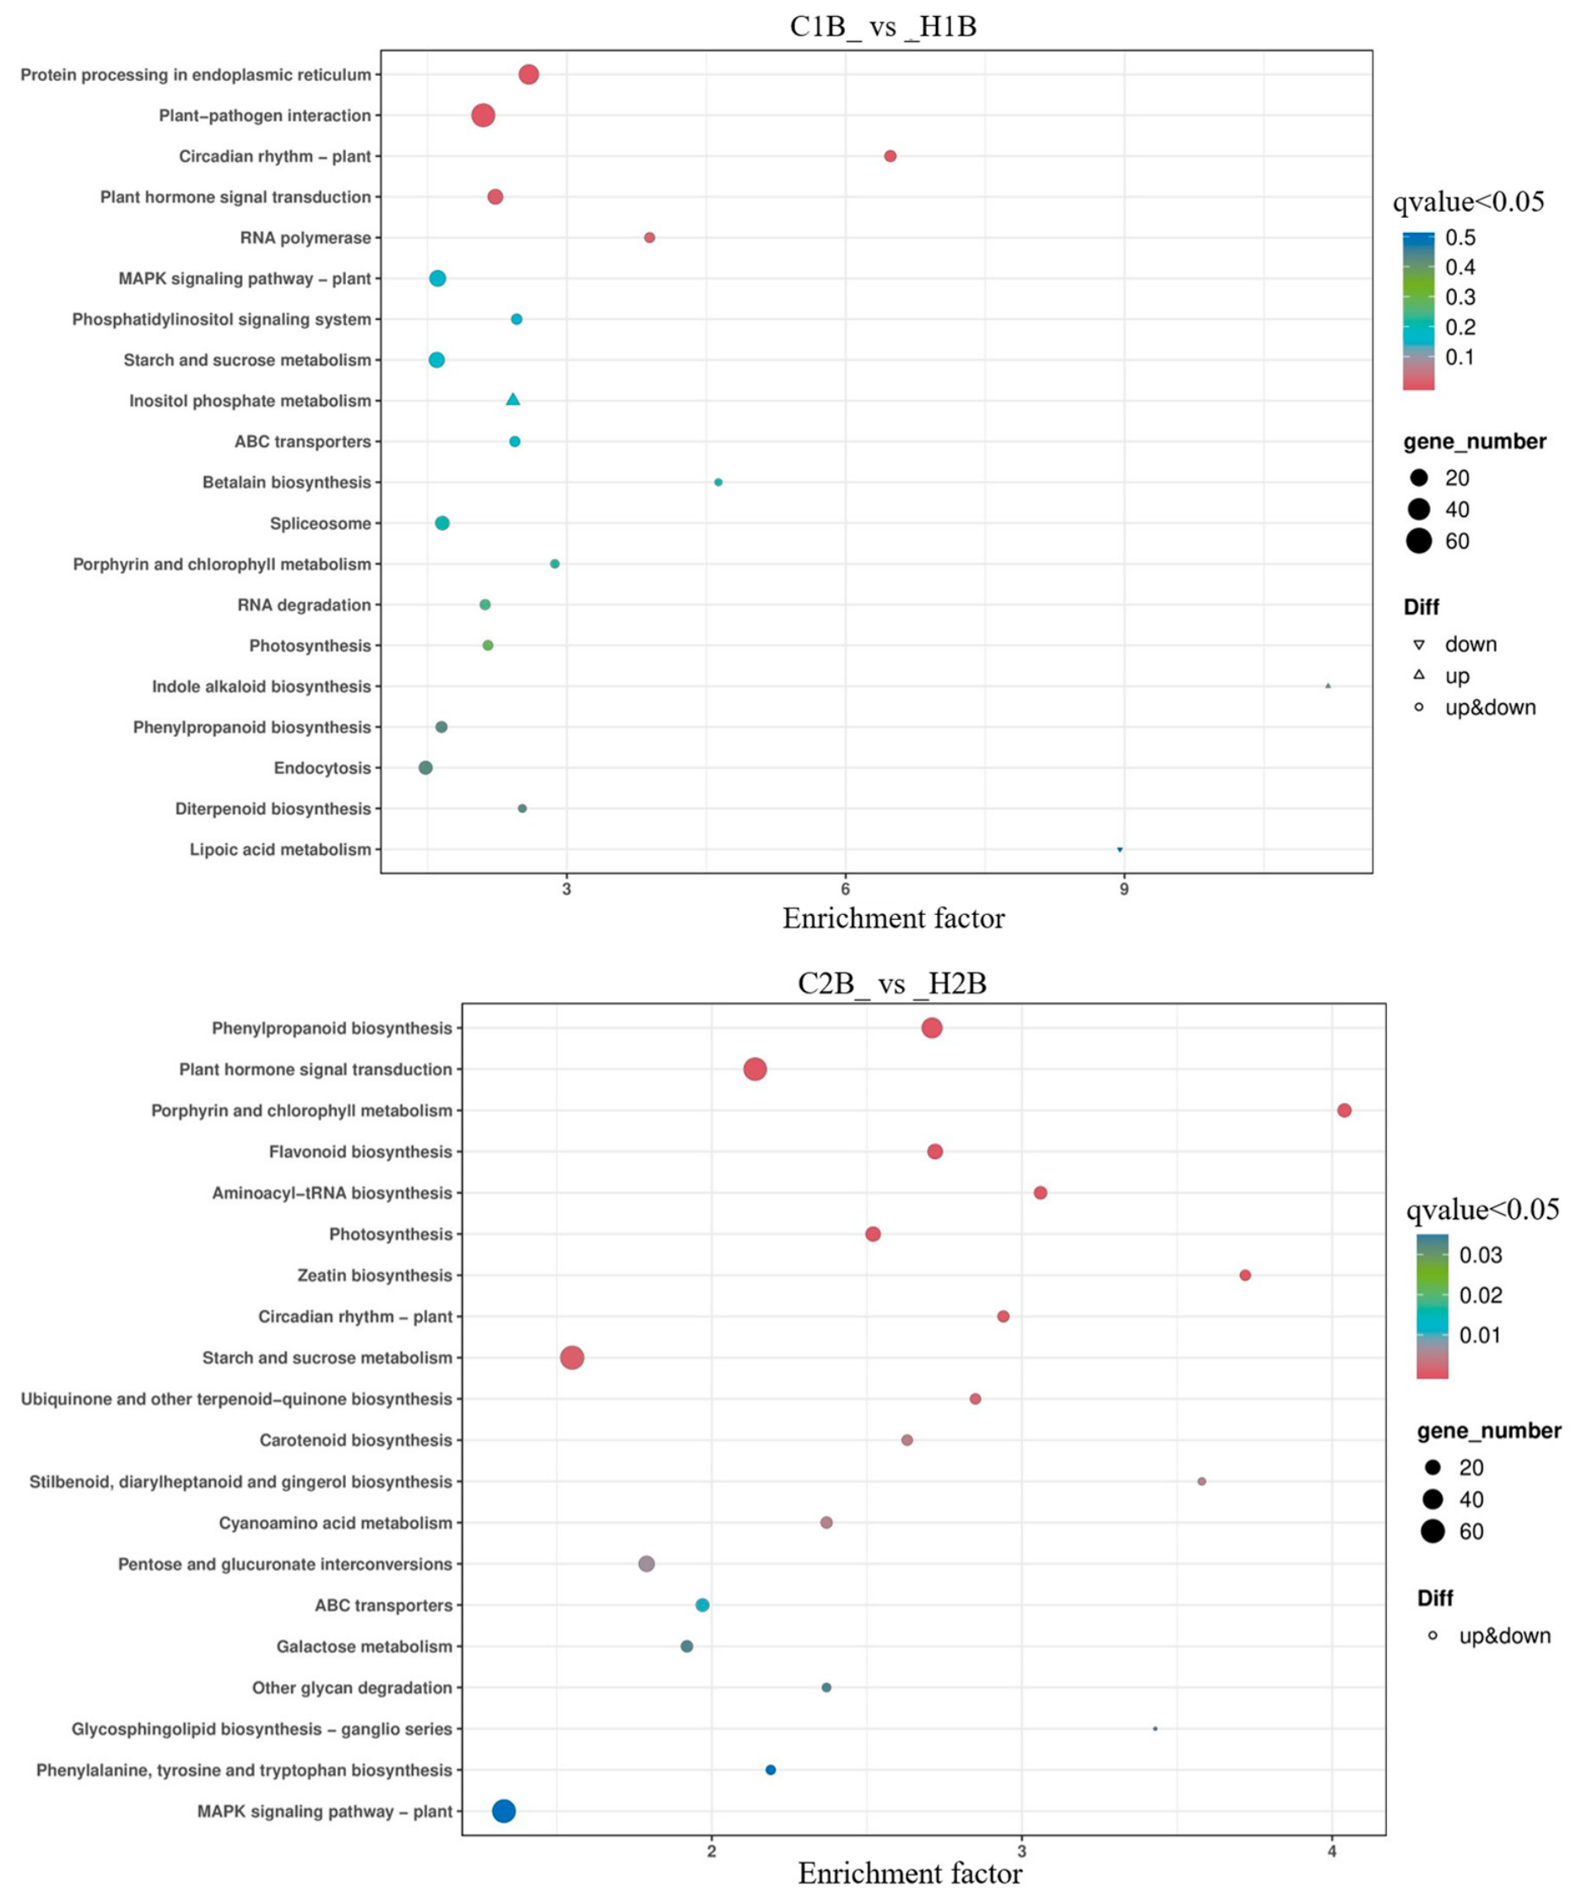
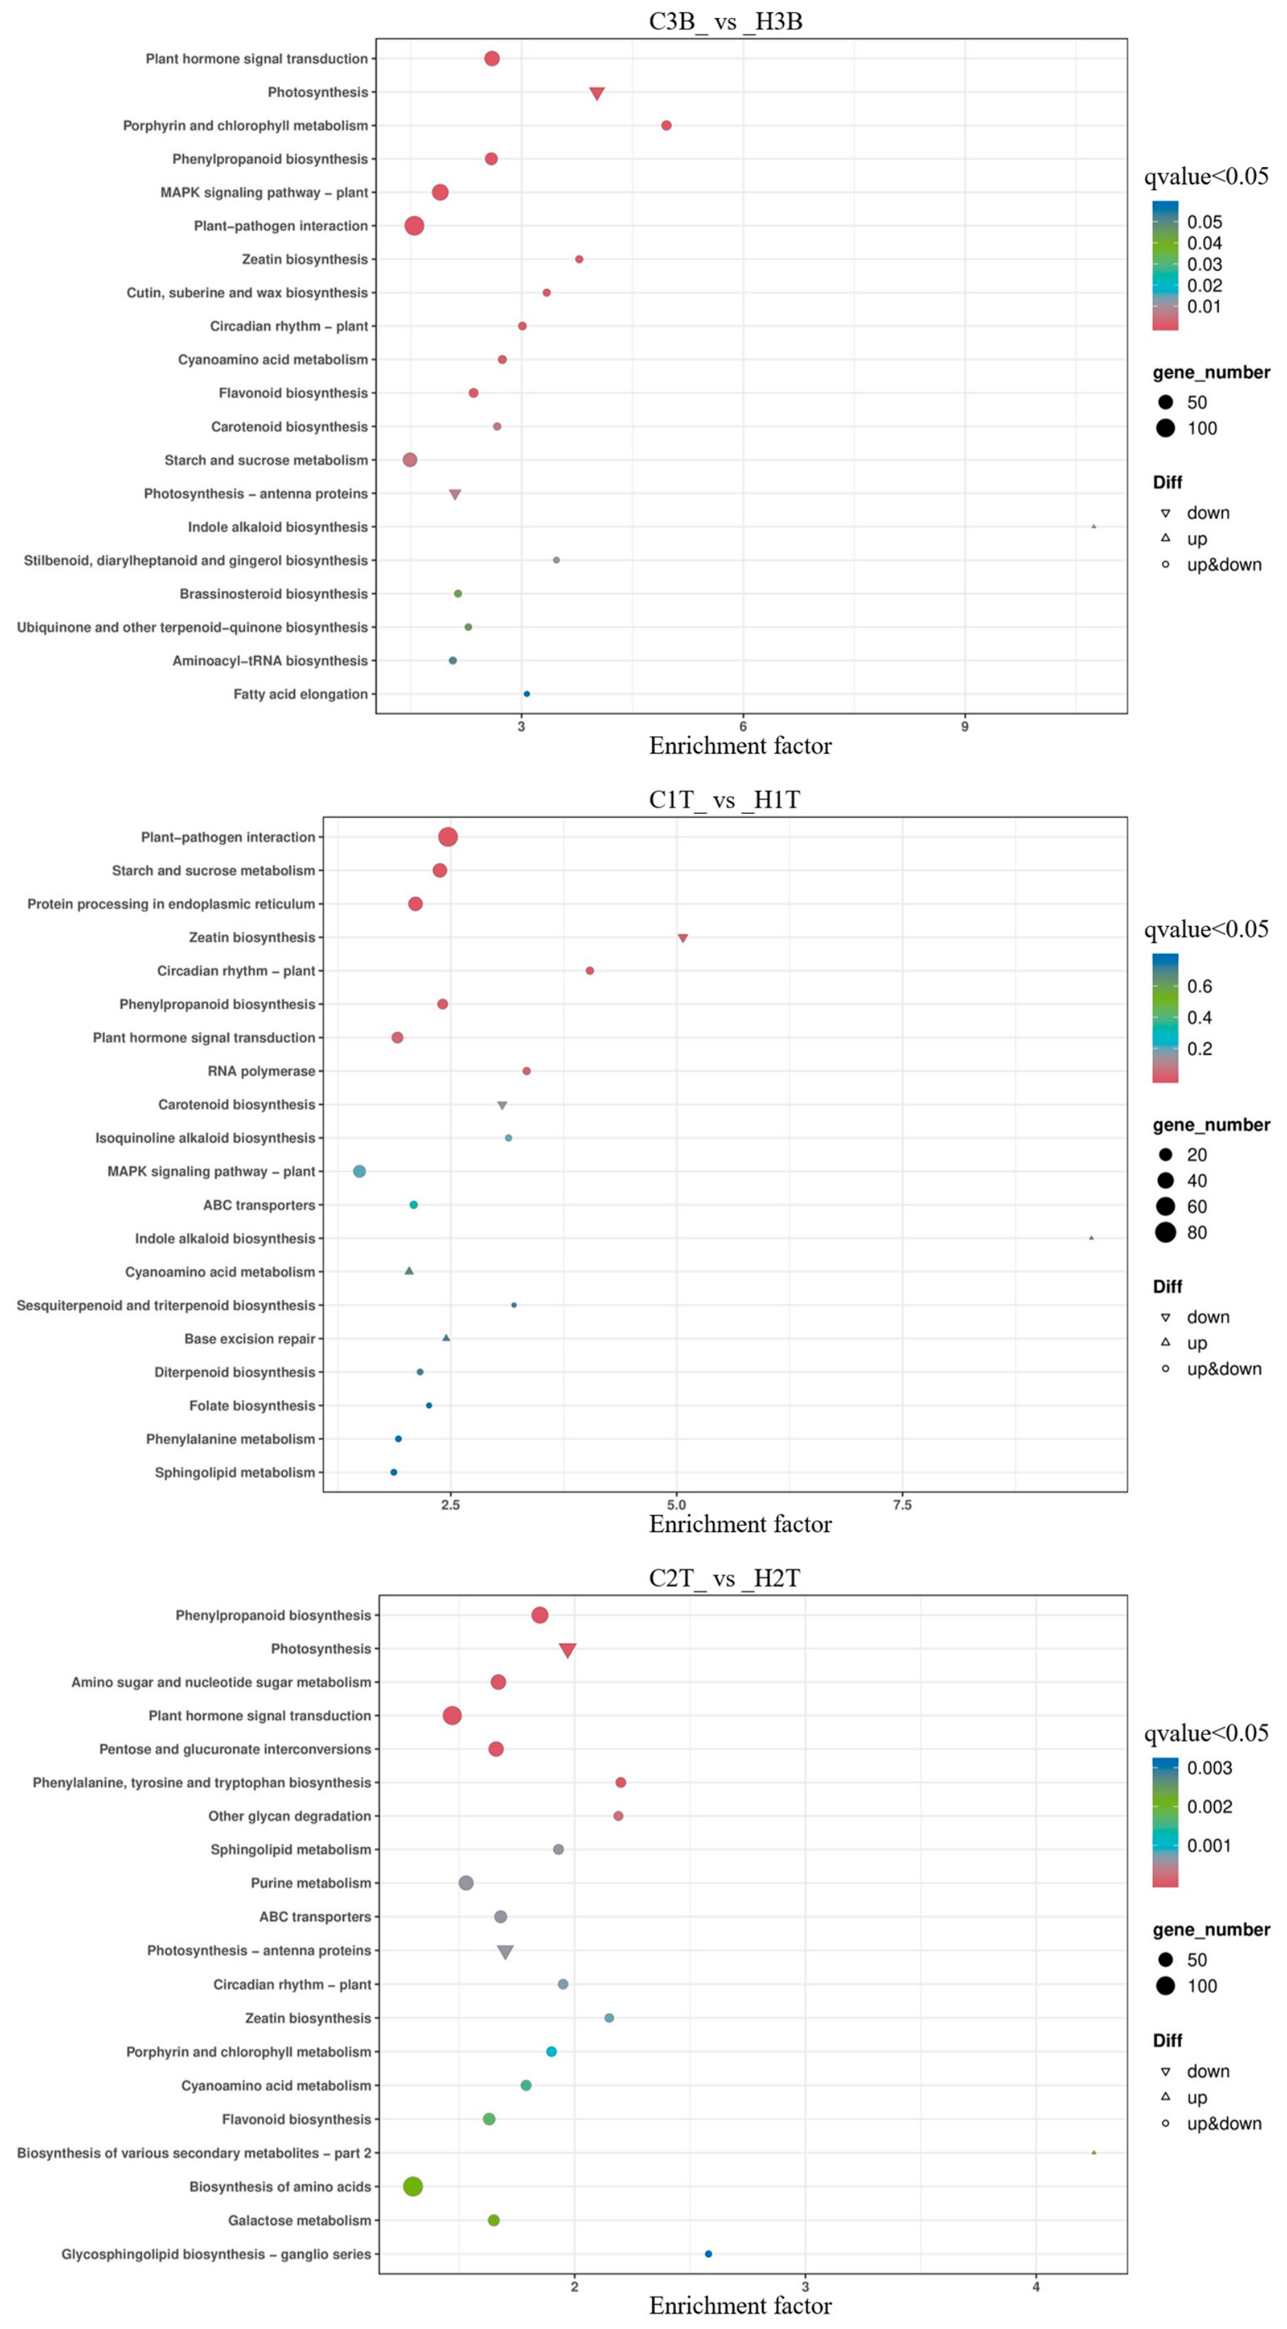
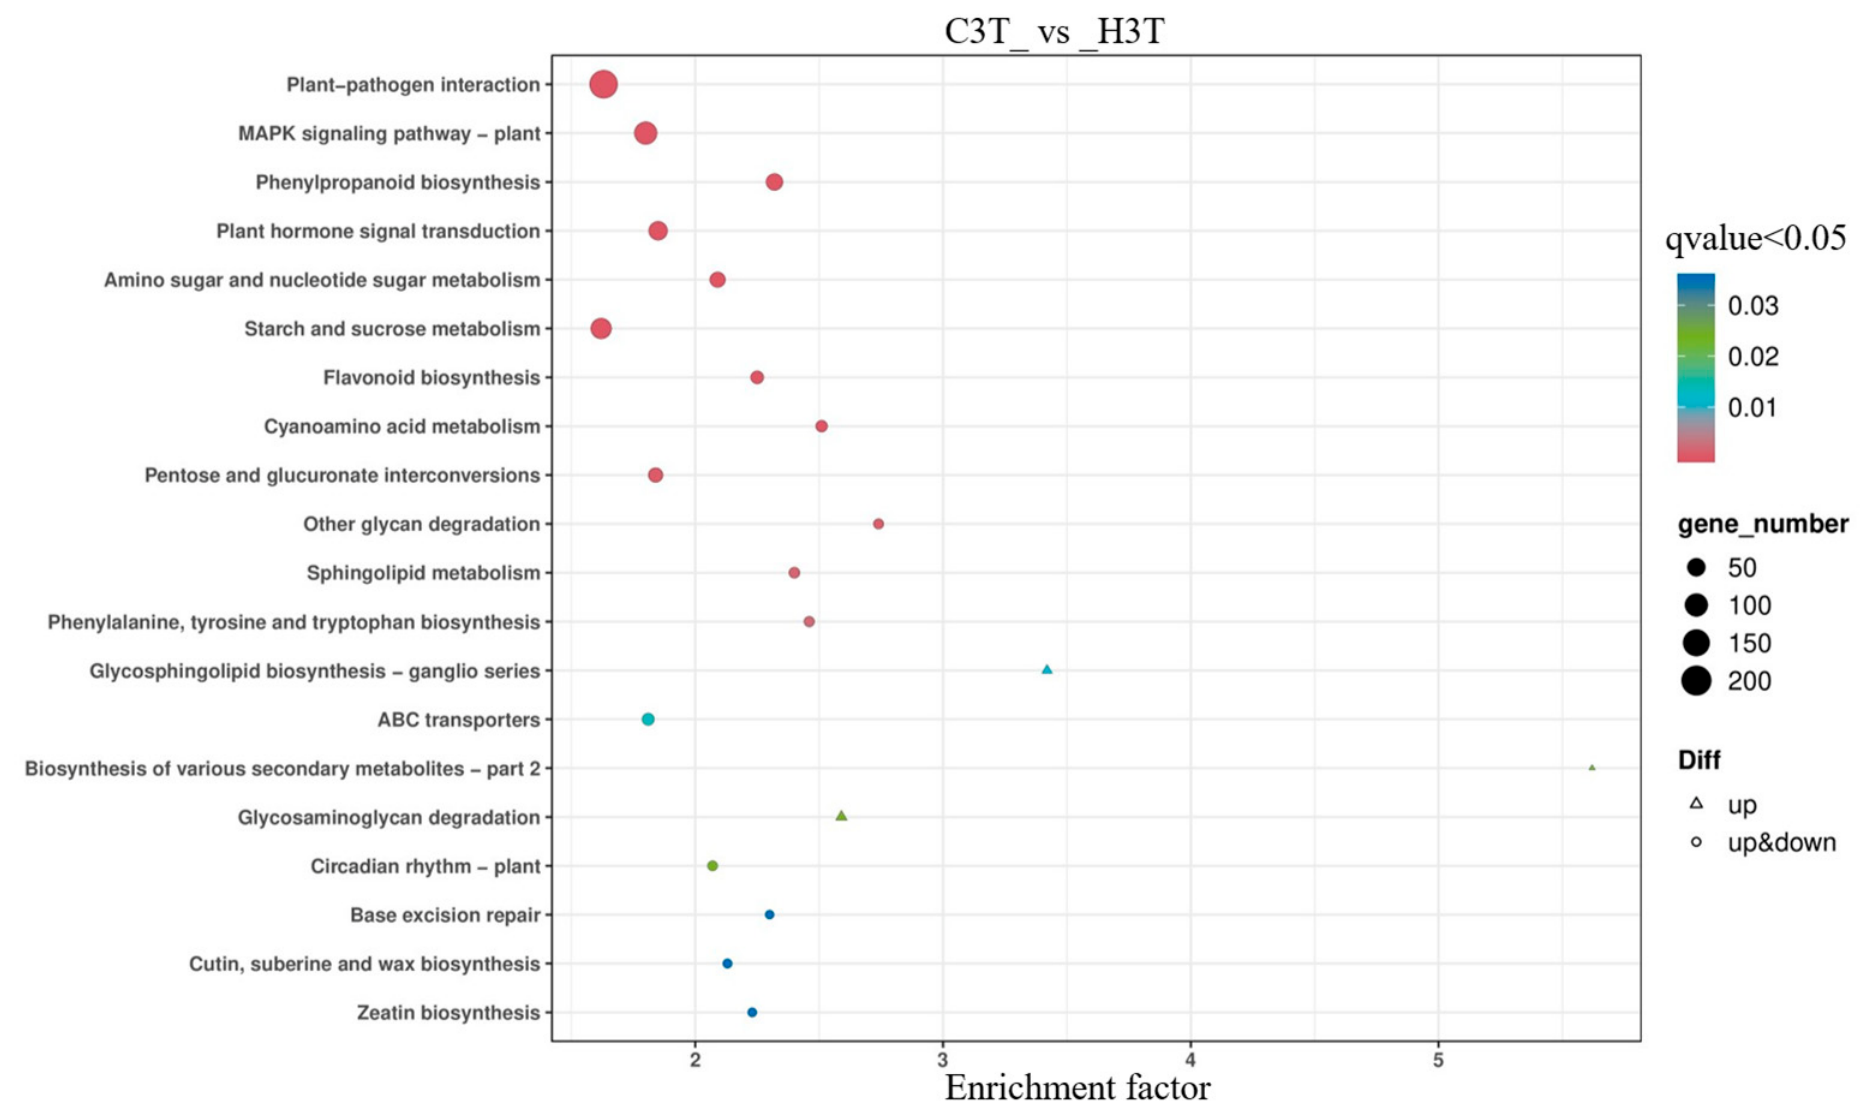
For comparisons between the two genotypes at the same branch age and tissue position, KEGG enrichment analysis of DEGs identified top-ranked pathways primarily associated with metabolic regulation and signal transduction (Figure 7). In the basal parts of lateral branches, the three highest-ranked pathways in C1B_vs_H1B were protein processing in the endoplasmic reticulum, plant–pathogen interaction, and circadian rhythm–plant. In contrast, phenylpropanoid biosynthesis, plant hormone signal transduction, and porphyrin and chlorophyll metabolism ranked highest in C2B_vs_H2B, whereas plant hormone signal transduction, photosynthesis, and porphyrin and chlorophyll metabolism occupied the top three positions in C3B_vs_H3B. In the terminal buds, plant–pathogen interaction, starch and sucrose metabolism, and protein processing in the endoplasmic reticulum were the three highest-ranked pathways in C1T_vs_H1T. For C2T_vs_H2T, the corresponding pathways were phenylpropanoid biosynthesis, photosynthesis, and amino sugar and nucleotide sugar metabolism. For C3T_vs_H3T, the three highest-ranked pathways were plant–pathogen interaction, MAPK signaling pathway–plant, and phenylpropanoid biosynthesis. Overall, phenylpropanoid biosynthesis and plant hormone signal transduction consistently appeared among the top-ranked pathways in multiple comparisons between the two genotypes, although not all of these pathways reached statistical significance.
Figure 7.
KEGG pathway enrichment of differentially expressed genes between different tree genotypes. Note: C: Cunninghamia lanceolata var. Luotian; H: Cunninghamia lanceolata; T: terminal bud of lateral branch; B: basal part of lateral branch; 1: one-year-old lateral branch; 2: three-year-old lateral branch; 3: six-year-old lateral branch.
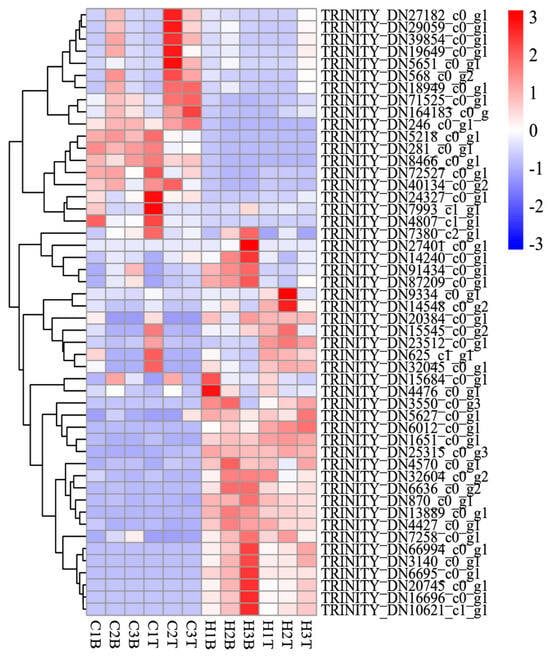
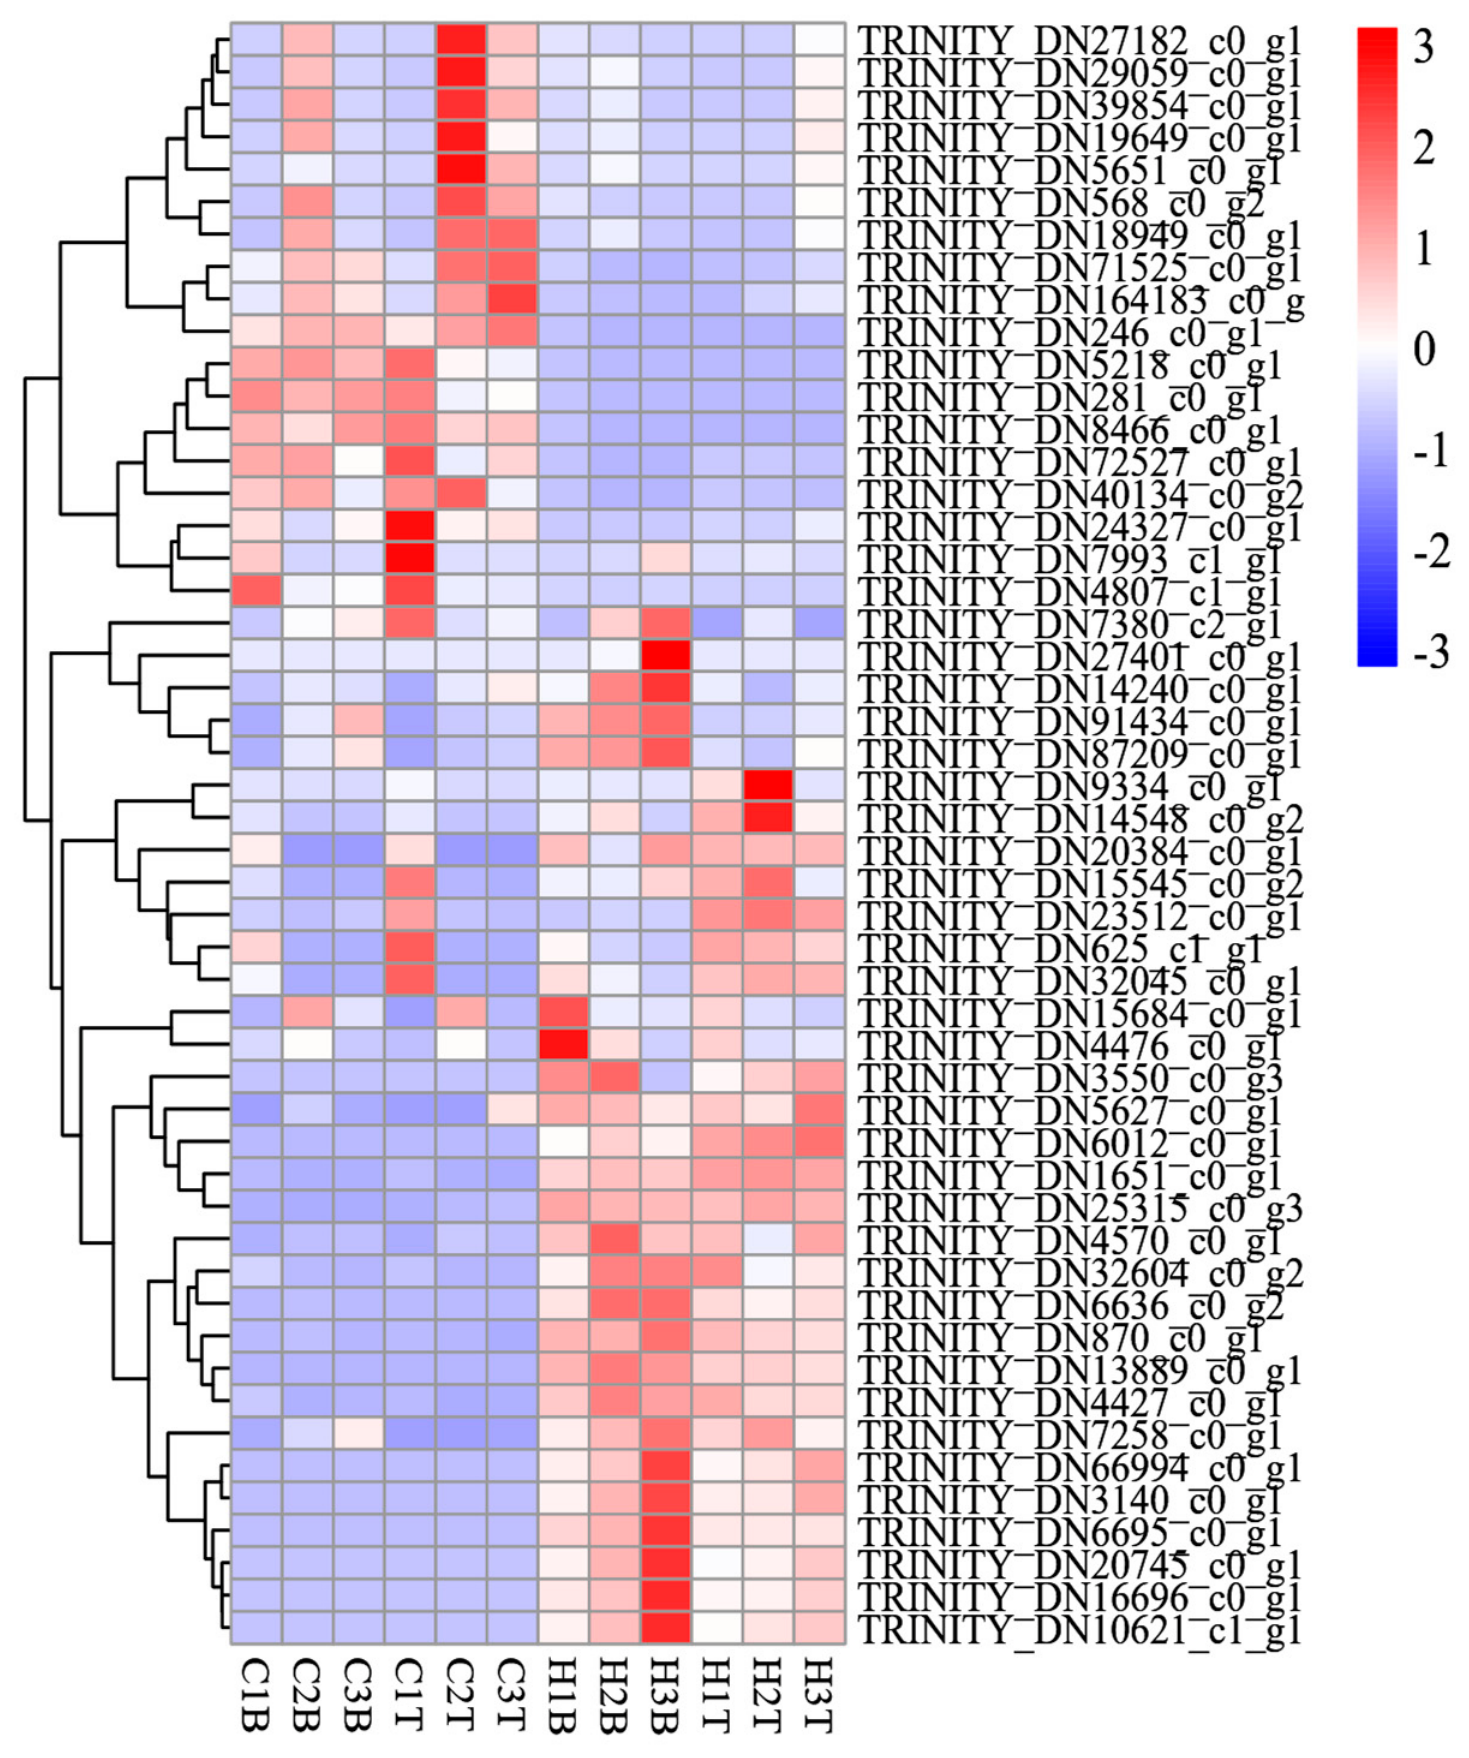
To identify candidate genes potentially associated with the formation of the weeping phenotype, the expression levels of the top 50 DEGs with KEGG annotations were analyzed across different samples. DEGs showing distinct expression patterns were mainly found in C. lanceolata (Figure 8). In the basal part of the lateral branch of C. lanceolata, the expression levels of TRINITY_DN10621_c1_g1, TRINITY_DN6695_c0_g1, TRINITY_DN14240_c0_g1, and TRINITY_DN27401_c0_g1 showed an apparent increasing trend across the examined branch ages and were associated with starch and sucrose metabolism, cyanoamino acid metabolism, and phenylpropanoid biosynthesis, respectively. In the terminal bud of C. lanceolata, the expression levels of TRINITY_DN3550_c0_g3 and TRINITY_DN6012_c0_g1 showed an apparent increasing trend across the examined branch ages, and these genes were annotated as being associated with inositol phosphate metabolism, the phosphatidylinositol signaling system, and endocytosis. In the terminal bud of C. lanceolata var. Luotian, the expression levels of TRINITY_DN164183_c0_g1 and TRINITY_DN246_c0_g1 showed an apparent increasing trend across the examined branch ages and were associated with zeatin biosynthesis and plant–pathogen interaction, respectively.
Figure 8.
Heatmap of the top 50 KEGG-enriched differentially expressed genes between different tree genotypes. Note: C: Cunninghamia lanceolata var. Luotian; H: Cunninghamia lanceolata; T: terminal bud of lateral branch; B: basal part of lateral branch; 1: one-year-old lateral branch; 2: three-year-old lateral branch; 3: six-year-old lateral branch.
3.7.2. KEGG Enrichment Analysis of Differentially Expressed Genes Between Different Tissues
For comparisons between different tissues at the same branch age within each genotype, KEGG enrichment analysis of DEGs identified top-ranked pathways primarily associated with secondary metabolism, photosynthesis, and signal transduction (Figure S7). In C. lanceolata var. Luotian, phenylpropanoid biosynthesis, flavonoid biosynthesis, and plant hormone signal transduction were among the top-ranked pathways in one-year-old lateral branches (C1T_vs_C1B), whereas photosynthesis, phenylpropanoid biosynthesis, and cutin, suberine and wax biosynthesis ranked highest in three-year-old branches (C2T_vs_C2B). In contrast, the six-year-old comparison (C3T_vs_C3B) was characterized by photosynthesis, photosynthesis-antenna proteins, ABC transporters, and MAPK signaling pathway–plant among its top-ranked pathways. In C. lanceolata, the top-ranked pathways in one-year-old branches (H1T_vs_H1B) included phenylpropanoid biosynthesis; flavonoid biosynthesis; and stilbenoid, diarylheptanoid, and gingerol biosynthesis. For three-year-old branches (H2T_vs_H2B), plant hormone signal transduction, sphingolipid metabolism, glycosphingolipid biosynthesis–ganglio series, and phenylpropanoid biosynthesis were among the leading pathways, while porphyrin and chlorophyll metabolism, photosynthesis, and plant hormone signal transduction ranked highest in six-year-old branches (H3T_vs_H3B). Overall, pathways related to secondary metabolism, particularly phenylpropanoid biosynthesis, together with plant hormone signal transduction, frequently appeared among the top-ranked KEGG pathways across tissue comparisons, suggesting that differences in gene expression between tissues involve multiple metabolic and signaling processes.
To further investigate tissue-specific expression patterns, the expression levels of the top 50 DEGs with KEGG annotations identified from comparisons between different tissue positions were analyzed. DEGs showing obvious expression patterns were mainly found in the terminal bud of C. lanceolata var. Luotian and in the terminal bud and basal part of C. lanceolata (Figure S8). In C. lanceolata var. Luotian, apparent expression trends across the examined branch ages were observed only in the terminal bud. The expression levels of TRINITY_DN19150_c0_g1 and TRINITY_DN4633_c0_g1 showed an apparent increasing trend across the examined branch ages and were associated with amino sugar and nucleotide sugar metabolism, MAPK signaling pathway–plant, and cutin, suberine and wax biosynthesis. The expression levels of TRINITY_DN1082_c0_g1, TRINITY_DN347102_c0_g1, TRINITY_DN35387_c0_g1, and TRINITY_DN39832_c0_g1 showed an apparent decreasing trend across the examined branch ages and were mainly associated with terpenoid backbone biosynthesis, diterpenoid biosynthesis, and cutin, suberine and wax biosynthesis. In C. lanceolata, the expression levels of TRINITY_DN1084_c0_g1, TRINITY_DN39832_c0_g1, TRINITY_DN67753_c0_g1, and TRINITY_DN92855_c0_g1 showed an apparent increasing trend across the examined branch ages in the terminal bud and were involved in glycerolipid metabolism, phenylpropanoid biosynthesis, and ribosome pathways. In addition, the expression level of TRINITY_DN1381_c0_g1 showed an apparent increasing trend across the examined branch ages in the basal part of the lateral branch and was associated with cutin, suberine and wax biosynthesis.
3.7.3. KEGG Enrichment Analysis of Differentially Expressed Genes Between Different Branch Ages
For comparisons among different branch ages within the same tissue of each genotype, KEGG enrichment analysis of DEGs identified top-ranked pathways primarily associated with signal transduction, secondary metabolism, photosynthesis, and energy metabolism (Figure S9). In the basal parts of lateral branches of C. lanceolata var. Luotian, plant hormone signal transduction, amino sugar and nucleotide sugar metabolism, and brassinosteroid biosynthesis were among the top-ranked pathways in C1B_vs_C2B, whereas plant hormone signal transduction, phenylpropanoid biosynthesis, and pentose and glucuronate interconversions ranked highest in C1B_vs_C3B. In contrast, C2B_vs_C3B was characterized by photosynthesis, photosynthesis-antenna proteins, and carbon metabolism among its leading pathways. In the terminal buds, the top-ranked pathways in C1T_vs_C2T included photosynthesis, plant hormone signal transduction, and phenylpropanoid biosynthesis. For C1T_vs_C3T, plant hormone signal transduction, ABC transporters, and photosynthesis occupied the leading positions, while ribosome, glycolysis/gluconeogenesis, and MAPK signaling pathway–plant were among the highest-ranked pathways in C2T_vs_C3T. In the basal parts of lateral branches of C. lanceolata, carotenoid biosynthesis, flavonoid biosynthesis, and protein processing in the endoplasmic reticulum were among the top-ranked pathways in H1B_vs_H2B, whereas plant hormone signal transduction, porphyrin and chlorophyll metabolism, and photosynthesis ranked highest in H1B_vs_H3B. The H2B_vs_H3B comparison showed photosynthesis, porphyrin and chlorophyll metabolism, and photosynthesis-antenna proteins among its leading pathways. In the terminal buds, plant hormone signal transduction, cutin, suberine and wax biosynthesis, and sulfur metabolism were among the top-ranked pathways in H1T_vs_H2T. In comparison, photosynthesis, galactose metabolism, and phenylpropanoid biosynthesis occupied the leading positions in H1T_vs_H3T, whereas biosynthesis of amino acids, cysteine and methionine metabolism, and arginine biosynthesis were among the highest-ranked pathways in H2T_vs_H3T.
To explore gene expression patterns associated with branch development, the expression levels of the top 50 DEGs with KEGG annotations identified from comparisons among different branch ages were analyzed. In the analysis of DEGs identified from comparisons among different branch ages, distinct expression patterns were observed in the terminal bud of C. lanceolata var. Luotian and in both the terminal bud and basal part of C. lanceolata (Figure S10). In C. lanceolata var. Luotian, the expression levels of 12 genes, including TRINITY_DN10566_c0_g1, TRINITY_DN10679_c0_g2, TRINITY_DN11043_c0_g1, and TRINITY_DN15871_c0_g1, showed an apparent increasing trend across the examined branch ages in the terminal bud. These genes were mainly associated with glycolysis/gluconeogenesis, pyruvate metabolism, carbon metabolism, fatty acid metabolism, biosynthesis of unsaturated fatty acids, and cutin, suberine and wax biosynthesis. In C. lanceolata, the expression levels of the same 12 genes showed an apparent increasing trend across the examined branch ages in the basal part of the lateral branch, and their KEGG annotations were mainly associated with glycolysis/gluconeogenesis, pyruvate metabolism, carbon metabolism, and tryptophan metabolism. In addition, the expression level of TRINITY_DN145089_c0_g2 showed an apparent increasing trend across the examined branch ages in the terminal bud and was associated with protein processing in the endoplasmic reticulum, whereas TRINITY_DN13009_c1_g1 showed an apparent decreasing trend across the examined branch ages in the terminal bud and was associated with steroid biosynthesis.
4. Discussion
4.1. Transcriptome Quality and Assembly Reliability
Illumina high-throughput sequencing is suitable for transcriptome studies in species without a reference genome. Sequencing quality is commonly evaluated using the Q30 value, with values above 80% generally indicating high sequencing reliability, whereas the N50 value reflects assembly quality, with larger N50 values indicating longer assembled sequences and better assembly performance [15]. In this study, a total of 59,109 unigenes were assembled from all samples, with Q30 values exceeding 93.76%, an average unigene length of 1175 bp, and an N50 of 2293 bp. In addition, the mapping rates of clean reads back to the assembled unigenes ranged from 68.11% to 79.25%, with an average of 75.65%, indicating that a substantial proportion of sequencing reads could be aligned to the assembled sequences. These metrics indicate high sequencing accuracy and provide information on assembly contiguity. However, assembly statistics such as N50 and average unigene length primarily describe the length distribution of assembled sequences and do not fully assess transcriptome assembly completeness or accuracy. Therefore, additional assessments, such as BUSCO analysis, are needed to provide a more comprehensive evaluation of assembly quality.
Notably, although the overall sequencing quality was high, the H3B group, representing the basal part of six-year-old lateral branches of C. lanceolata, exhibited relatively greater within-group dispersion in the PCA, with H3B1 showing the most pronounced deviation. This variation may be associated with biological differences among individual source trees and developmental heterogeneity in the basal part of lateral branches. As branch age increases, the basal part undergoes continuous secondary growth, and differences in tissue developmental status and cellular composition among individuals may contribute to variation in gene expression patterns. Minor differences in sampling positions may also contribute to this variation. Although H3B1 showed no obvious sequencing quality abnormalities and remained clustered with the other biological replicates in the correlation heatmap, the specific cause of its deviation could not be conclusively determined, and technical factors cannot be completely excluded. Given that within-group variability may influence dispersion estimation and DEG detection, the potential influence of this sample on DEG identification has not yet been evaluated through sensitivity analysis. Nevertheless, differential expression results involving the H3B group should be interpreted with caution. Further investigations combining more detailed anatomical observations and additional statistical analyses are needed to clarify the sources of expression variability in this group and evaluate their potential effects on differential expression results.
4.2. Global Expression Profiles of DEGs and Their Association with the Weeping Phenotype
Pairwise differential expression analysis revealed substantial variation in the numbers of DEGs across comparisons involving different genotypes, tissue positions, and branch ages. In comparisons between the two genotypes at the same branch age and tissue position, the largest number of DEGs was detected in C2T_vs_H2T (8695), whereas the smallest number was observed in C1B_vs_H1B (1101). These results indicate that the extent of gene expression differences between the two genotypes varied depending on branch age and tissue position. Within-genotype comparisons also revealed differences in DEG numbers between tissue positions and among branch ages. Notably, the six-year-old lateral branches showed the largest numbers of DEGs in comparisons between terminal buds and basal parts in both genotypes. However, these differences in DEG numbers do not necessarily reflect differences in overall transcriptional activity between genotypes or tissues. Previous studies have shown that branch angle and weeping growth habit are closely associated with hormonal distribution and signaling in the shoot apex [16]. Moreover, Yang et al. reported that, compared with C. lanceolata, C. lanceolata var. Luotian possesses a more active shoot apical meristem and exhibits stronger apical dominance [6]. Consistent with these findings, our transcriptome data demonstrated more pronounced transcriptional differences in the terminal buds of lateral branches in C. lanceolata var. Luotian, suggesting that the terminal bud remains highly active during branch development and may play an important role in regulating branch growth orientation and the formation of the weeping branch phenotype. In addition, relatively few DEGs were detected during the early stage of branch development, whereas substantially more DEGs were identified during the later developmental stage. This observation is consistent with the transcriptome analysis of developing xylem at different developmental stages of Chinese fir reported by Zhang et al., who found that the number of DEGs increased markedly with plant development [17]. Anatomical observations by Xiong [5] further showed that longitudinal growth of lateral branches in C. lanceolata var. Luotian was significantly reduced after the third year, and radial growth almost ceased by the fourth year, whereas lateral branch growth in C. lanceolata remained relatively stable. Collectively, the weeping branch phenotype is likely the result of coordinated changes in a series of regulatory factors across multiple developmental stages and tissues.
GO functional classification revealed that the distribution patterns of DEGs were generally consistent among comparisons involving different genotypes, tissues, and branch ages. DEGs were predominantly assigned to the three GO categories—biological process, cellular component, and molecular function—with the major functional terms including cellular process, metabolic process, cellular anatomical entity, binding, and catalytic activity. These functional categories cover basic biological processes, including cellular activities, material metabolism, cellular structural composition, and molecular interactions, and constitute the common functional framework during lateral branch development [18].
Comprehensive analysis of the KEGG enrichment results across all comparison groups showed that the DEGs between C. lanceolata var. Luotian and C. lanceolata were predominantly enriched in signal transduction pathways, represented by plant hormone signal transduction and MAPK signaling pathway–plant, as well as secondary metabolic pathways centered on phenylpropanoid biosynthesis.
4.3. Potential Roles of Hormone Signaling and MAPK Pathway in Regulating the Weeping Phenotype
Plant hormone signal transduction and MAPK signaling pathway–plant were consistently enriched in multiple key comparison groups and exhibited distinct enrichment patterns among different branch ages and tissues. Specifically, plant hormone signal transduction was predominantly enriched in comparisons between the two genotypes and between different tissues, whereas MAPK signaling pathway–plant was more frequently enriched in comparison groups involving C. lanceolata var. Luotian. Plant hormone signal transduction plays essential roles in regulating organ growth, tissue differentiation, and growth orientation in plants. The intensity and responsiveness of hormone signaling often vary with tissue type and developmental stage, making this pathway one of the major upstream regulators of branch growth patterns [19]. The repeated enrichment of this pathway under multiple comparison conditions may therefore reflect the distinct regulatory requirements for growth-related signals among different branch ages and tissues. Anatomical studies of the terminal bud of C. lanceolata var. Luotian by Yang et al. [6] demonstrated a markedly elongated bud axis, an increased number of young leaves, and enhanced shoot apical meristem activity compared with C. lanceolata. Regarding the hormonal regulation of weeping traits, Shen et al. [20] reported that in Prunus persica var. pendula, gibberellin (GA) content progressively increased from the base to the apex in upright-type branches. In weeping-type branches, GA content was higher on the upper side than on the lower side, and the GA3 concentration at the apex significantly exceeded that in upright-type branches. This asymmetric GA distribution may cause the apical growth rate of weeping branches to outpace secondary xylem development, thereby rendering the branches structurally incapable of supporting their own weight and ultimately resulting in a weeping habit [20]. In Lagerstroemia indica, transcriptomic analysis identified GA biosynthesis and signal transduction as critical pathways involved in weeping phenotype formation; exogenous GA3 application rescued the weeping phenotype, whereas silencing LfiGRAS1, a negative regulator of GA signaling, attenuated gravitropic growth of newly developed shoots [21]. Additionally, comparative transcriptome profiling of crape myrtle accessions with contrasting branching architectures revealed that GA biosynthesis and signaling, starch and sucrose metabolism, and the MAPK signaling pathway are closely associated with the regulation of branching architecture in response to gravitropic stimuli [22]. Collectively, these findings support a relatively conserved role of GA signaling in modulating weeping traits across diverse woody species. In the present study, the frequent identification of plant hormone signal transduction among the top-ranked pathways across multiple comparisons, together with previous anatomical observations of active terminal bud development in C. lanceolata var. Luotian, suggests that hormone-related regulatory processes may be associated with lateral branch development. However, the present transcriptomic data do not directly demonstrate changes in hormone concentrations or signaling activity. Therefore, the potential involvement of GA and other phytohormones in regulating branch growth orientation remains a hypothesis requiring further experimental investigation. These characteristics are generally associated with the coordinated regulation of phytohormones, including auxin, gibberellin, and cytokinin. In addition, Huang et al. reported that, in Chinese fir, cytokinin content was significantly negatively correlated with lateral branch angle, whereas auxin content showed a significant positive correlation with branch angle [23].
As a highly conserved signaling module in plants, the MAPK signaling pathway–plant integrates environmental and endogenous developmental signals and transduces these cues into transcriptional regulation associated with cell division, cell differentiation, and cell wall-related processes, thereby coordinating downstream gene regulatory networks [24]. In Arabidopsis thaliana, the MKK7-MPK6 cascade, a module within the MAPK signaling pathway, phosphorylates PIN1 at Ser337, thereby modulating polar auxin transport and consequently regulating shoot branch number and hypocotyl gravitropism [25]. This finding provides direct molecular evidence that the MAPK signaling pathway participates in establishing shoot architecture by modulating auxin distribution. The identification of this pathway among the top-ranked pathways in several comparisons suggests that MAPK-related signaling may be involved in the regulation of lateral branch development. However, pathway enrichment and gene annotation alone cannot establish its specific regulatory role in branch architecture or the weeping phenotype. This conclusion is further supported by the KEGG annotation of the top 50 DEGs. TRINITY_DN19150_c0_g1, annotated as K20547 (basic endochitinase B, EC:3.2.1.14), was assigned to the MAPK signaling pathway–plant. This gene showed an apparent increasing expression trend across the examined branch ages in the terminal buds of C. lanceolata var. Luotian, whereas its expression remained relatively low in other tissues. Previous studies have indicated that plant chitinases are primarily involved in pathogen defense and stress responses [26]. However, the functional annotation of TRINITY_DN19150_c0_g1 and its assignment to the MAPK signaling pathway do not provide sufficient evidence for a direct regulatory role in branch architecture or the weeping phenotype. Therefore, the observed expression pattern may reflect biological responses in the terminal buds of C. lanceolata var. Luotian, but the specific function of this gene and its potential relationship with the weeping phenotype remain to be experimentally validated.
4.4. Possible Contribution of Phenylpropanoid Metabolism to Weeping Branch Formation
Phenylpropanoid biosynthesis was consistently enriched across multiple comparison groups. Phenylpropanoids represent an important class of plant secondary metabolites, including lignin, flavonoids, anthocyanins, and tannins, and participate in a wide range of physiological processes. Previous studies have demonstrated that phenylpropanoid-derived compounds contribute not only to plant defense against biotic and abiotic stresses but also to cell wall formation, disease resistance, ultraviolet protection, and signal transduction [27,28]. As the major end product of the phenylpropanoid pathway, lignin is widely deposited in secondary cell walls and plays a crucial role in reinforcing cell wall strength and maintaining structural integrity [29]. Alterations in lignin content or composition have been shown to modify its physicochemical properties, thereby weakening fiber strength and ultimately affecting plant growth and mechanical performance [30]. Previous anatomical studies suggested that the weeping branch phenotype of C. lanceolata var. Luotian is associated with reduced mechanical support between the main stem and lateral branches [6]. This hypothesis has been further corroborated by studies on weeping phenotypes in other woody plant species. In P. persica var. pendula, lignin content in upright-type branches was significantly higher than that in weeping-type branches, and within weeping-type branches, lignin content was greater in the upper portion than in the lower portion, indicating that the mechanical tissues of weeping peach provide weaker structural support for branch integrity [20]. In sorghum, alterations in the metabolic flux of key phenylpropanoid pathway intermediates, such as coniferyl alcohol, directly affected lignin biosynthesis efficiency and thereby modulated leaf angle [31]. Collectively, these cross-species findings support a conserved paradigm in which the phenylpropanoid pathway modulates organ angle and structural support through the regulation of lignin biosynthesis. In this study, the repeated enrichment of phenylpropanoid biosynthesis across multiple key comparison groups provides transcriptomic evidence supporting this hypothesis. Among the genes involved in phenylpropanoid biosynthesis, TRINITY_DN27401_c0_g1 and TRINITY_DN14240_c0_g1 showed progressively increasing expression with branch age in the basal part of the lateral branch of C. lanceolata, whereas both genes were expressed at relatively low levels in the terminal bud and the basal part of the lateral branch of C. lanceolata var. Luotian across different branch ages. TRINITY_DN27401_c0_g1 was annotated as K00430, corresponding to peroxidase (EC 1.11.1.7), whereas TRINITY_DN14240_c0_g1 was annotated as K01188, corresponding to β-glucosidase (EC 3.2.1.21). During lignin biosynthesis, monolignols are oxidized by peroxidases to generate free radicals, which subsequently undergo oxidative coupling with the growing lignin polymer [29]. Consistently, Warinowski et al. demonstrated that peroxidases contribute to lignin biosynthesis in Norway spruce [32]. In addition, β-glucosidase plays an important role in the formation of lignification intermediates by catalyzing the hydrolysis of monolignol glucosides, thereby releasing cinnamyl alcohols that subsequently participate in lignin polymerization [33]. In the present study, TRINITY_DN27401_c0_g1 and TRINITY_DN14240_c0_g1, annotated as peroxidase and β-glucosidase, respectively, exhibited relatively low expression levels in C. lanceolata var. Luotian compared with C. lanceolata across the examined tissues and branch ages. Given the reported involvement of peroxidases and β-glucosidases in lignin biosynthesis, this may indicate potential differences in the regulation of phenylpropanoid-related processes between the two genotypes. However, the expression patterns of these two genes alone cannot establish differences in overall phenylpropanoid pathway activity, lignin accumulation, or cell wall mechanical properties. Therefore, their potential relevance to the weeping branch phenotype remains speculative and requires further investigation through gene functional validation and direct measurements of lignin content and branch mechanical properties.
Based on the expression patterns and functional annotations of the DEGs, particular attention was given to candidate genes exhibiting distinct expression patterns among genotypes, tissue positions, or branch ages and annotated with functions related to plant growth and development, signal transduction, or secondary metabolism. These genes may provide useful clues for understanding the molecular processes associated with lateral branch development. Among the top 50 DEGs, several candidate genes were further identified based on their differential expression characteristics, expression trends, and functional annotations. Specifically, TRINITY_DN19150_c0_g1, annotated as basic endochitinase B and assigned to the MAPK signaling pathway–plant, showed an apparent increasing expression trend with branch age in the terminal buds of C. lanceolata var. Luotian. In addition, TRINITY_DN27401_c0_g1 and TRINITY_DN14240_c0_g1, annotated as peroxidase and β-glucosidase, respectively, exhibited increasing expression trends with branch age in the basal parts of lateral branches of C. lanceolata. Given the reported involvement of hormone-related signaling processes in the regulation of plant growth and branch orientation, as well as the roles of peroxidases and β-glucosidases in lignin biosynthesis, these pathways and genes may be potential targets for investigating the molecular basis of lateral branch development and the weeping phenotype. However, the observed expression patterns and functional annotations do not establish direct regulatory relationships between these genes, the associated pathways, and the weeping phenotype. Their specific biological functions and potential contributions to branch development require further experimental validation.
In this study, comparative transcriptomic analyses of C. lanceolata var. Luotian and C. lanceolata across different branch ages and tissue positions identified DEGs and potential regulatory pathways that may be associated with the weeping phenotype. However, the observed expression differences between the two genotypes may reflect both genetic background and branch developmental variation and cannot be directly attributed to the weeping phenotype. Second, DEG identification was based on unadjusted p-values without multiple-testing correction, which may increase the risk of false-positive findings. Further evaluation using multiple-testing correction methods, such as the Benjamini–Hochberg procedure, is therefore warranted. Third, samples from different branch ages and tissue positions were collected from the same mother trees, but the original pairwise comparisons did not account for potential correlations among samples from the same tree, which may have influenced the statistical results. Fourth, the proposed involvement of plant hormone signal transduction, the MAPK signaling pathway, and phenylpropanoid metabolism was primarily inferred from transcriptomic data and functional annotations, without independent gene expression validation, measurements of hormone and lignin contents, or functional validation of candidate genes. Finally, the branch–stem junction was not specifically sampled, and xylem was removed from the basal samples, limiting direct assessment of the relationships between the identified molecular processes, branch anatomy, and mechanical properties. Future studies should incorporate multiple-testing correction, statistical analyses accounting for tree-level effects, functional validation of candidate genes, and measurements of hormone concentrations, lignin content, and branch mechanical properties to further elucidate the potential molecular basis of the weeping phenotype.
5. Conclusions
Based on comparative transcriptomic analyses of C. lanceolata var. Luotian and C. lanceolata across different tissue positions and branch ages, this study identified differentially expressed genes and potential biological pathways associated with differences in gene expression between the two genotypes. The results indicated that pathways related to signal transduction, secondary metabolism, and energy metabolism may be involved in lateral branch development, with their expression patterns varying across tissue positions and branch ages. Furthermore, several candidate genes potentially involved in lateral branch development were identified based on their expression patterns and functional annotations. These findings provide preliminary transcriptomic evidence and candidate gene resources for further investigating the molecular basis of lateral branch development and its potential relationship with the weeping branch phenotype. However, the extent to which these expression differences are specifically associated with the weeping phenotype remains unclear, and the potential regulatory roles of the identified pathways and candidate genes require further statistical evaluation and experimental validation.
Supplementary Materials
The following supporting information can be downloaded at: https://www.mdpi.com/article/10.3390/f17111333/s1, Figure S1: Venn diagram of all genes between different tissues. Figure S2. Venn diagram of all genes between different branch ages. Figure S3. Heat map of top 50 differentially expressed genes between different tissues. Figure S4. Heat map of top 50 differentially expressed genes between different branch ages. Figure S5. GO functional classification of differentially expressed genes between different tissues. Figure S6. GO functional classification of differentially expressed genes between different branch ages. Figure S7. KEGG pathway enrichment of differentially expressed genes between different tissues. Figure S8. Heat map of top 50 KEGG-enriched differentially expressed genes between different tissues. Figure S9. KEGG pathway enrichment of differentially expressed genes between different branch ages. Figure S10. Heat map of top 50 KEGG-enriched differentially expressed genes between different branch ages. Table S1. Length distribution of the Transcript and Unigenes. Table S2. Unigene function annotation statistics.
Author Contributions
C.D. and Y.Z. contributed equally to this work. C.D. and Y.Z. performed the experiments and wrote the original draft. Y.X. and H.Y. analyzed the data. Y.C. and A.D. contributed to data curation and validation. K.D. and A.D. designed the study, supervised the research, and revised the manuscript. All authors have read and agreed to the published version of the manuscript.
Funding
This study was funded by the project “Breeding of High-Yield, High-Quality and High-Efficiency New Varieties of Chinese Fir” under the National Key Research and Development Program of China during the 14th Five-Year Plan period (Grant No. 2022YFD2200201).
Data Availability Statement
The original contributions presented in this study are included in the article/Supplementary Material. The raw RNA-seq data generated in this study have been deposited in the NCBI Sequence Read Archive (SRA) under BioProject accession number PRJNA1522979. The assembled unigene sequences (Data S1), gene expression matrix (Supplementary Data S2), and differentially expressed gene lists (Supplementary Data S3) are provided as supplementary datasets accompanying this article. Further inquiries can be directed to the corresponding author.
Conflicts of Interest
The authors declare no conflict of interest.
References
- Huang, G.; Du, C.; Ma, L.; Xu, X.; Yan, S.; Xu, Y. Analysis of photosynthetic physiological and morphological characteristics of cunninghamia lanceolata ‘luotian’in different age lateral branches. J. For. Environ. 2015, 35, 236–242. [Google Scholar] [CrossRef]
- Xu, D.; Xu, Y.; Yuan, H.; Wu, Y.; Li, M.; Wu, P.; Ma, X. Comparative study on knot characteristics and physical and mechanical properties of chinese fir wood of different strains and ages. J. Cent. South Univ. For. Technol. 2025, 45, 194–202. [Google Scholar] [CrossRef]
- Xu, Y.; Tang, W.; Hu, X.; Zhang, P. Study on biological characteristics of cunninghamia laceolata (lamb.) Hk. cv. luotian—A superior variation of cunninghamia laceolata. Plant Sci. J. 2005, 06, 577–582. [Google Scholar]
- Song, C.; Xu, Y.; Hu, X.; Guan, L. A study on RAPD identification and genetic diversity of weeping fir germplasm resources. J. Huazhong Agric. Univ. 2004, 02, 256–260. [Google Scholar] [CrossRef]
- Xiong, L. A preliminary study on the natural drooping and shedding characteristics of lateral branches in luotian weeping fir. Hubei For. Sci. Technol. 1984, 02, 8–12. [Google Scholar]
- Yang, X.; Cheng, C.; Peng, Y.; Xiang, J.; Li, S.; Xu, Y.; Huang, G. Comparative anatomical observation on terminal bud of cunninghamia laceolata (lamb.) Hk. Cv. Luotian and cunninghamia laceolata. Mol. Plant Breed. 2018, 16, 7827–7833. [Google Scholar] [CrossRef]
- Xu, Y.; Du, C.; Huang, G.; Li, Z.; Xu, X.; Zheng, J.; Wu, C. Morphological characteristics of tree crowns of cunninghamia lanceolata var. Luotian. J. Res. 2020, 31, 837–856. [Google Scholar] [CrossRef] [Scilit]
- Li, P.; Wang, Y.; Qian, Q.; Fu, Z.; Wang, M.; Zeng, D.; Li, B.; Wang, X.; Li, J. LAZY1 controls rice shoot gravitropism through regulating polar auxin transport. Cell Res. 2007, 17, 402–410. [Google Scholar] [CrossRef] [Scilit] [PubMed]
- Dardick, C.; Callahan, A.; Horn, R.; Ruiz, K.B.; Zhebentyayeva, T.; Hollender, C.; Whitaker, M.; Abbott, A.; Scorza, R. PpeTAC1 promotes the horizontal growth of branches in peach trees and is a member of a functionally conserved gene family found in diverse plants species. Plant J. 2013, 75, 618–630. [Google Scholar] [CrossRef] [Scilit] [PubMed]
- Hollender, C.A.; Hill, J.L.; Waite, J.; Dardick, C. Opposing influences of TAC1 and LAZY1 on lateral shoot orientation in arabidopsis. Sci. Rep. 2020, 10, 6051. [Google Scholar] [CrossRef] [Scilit] [PubMed]
- Hollender, C.A.; Pascal, T.; Tabb, A.; Hadiarto, T.; Srinivasan, C.; Wang, W.; Liu, Z.; Scorza, R.; Dardick, C. Loss of a highly conserved sterile alpha motif domain gene (WEEP) results in pendulous branch growth in peach trees. Proc. Natl. Acad. Sci. USA 2018, 115, E4690–E4699. [Google Scholar] [CrossRef] [Scilit] [PubMed]
- Chen, S.; Zhou, Y.; Chen, Y.; Gu, J. Fastp: An ultra-fast all-in-one FASTQ preprocessor. Bioinformatics 2018, 34, i884–i890. [Google Scholar] [CrossRef] [Scilit] [PubMed]
- Grabherr, M.G.; Haas, B.J.; Yassour, M.; Levin, J.Z.; Thompson, D.A.; Amit, I.; Adiconis, X.; Fan, L.; Raychowdhury, R.; Zeng, Q.; et al. Full-length transcriptome assembly from RNA-seq data without a reference genome. Nat. Biotechnol. 2011, 29, 644–652. [Google Scholar] [CrossRef] [Scilit] [PubMed]
- Buchfink, B.; Reuter, K.; Drost, H. Sensitive protein alignments at tree-of-life scale using DIAMOND. Nat. Methods 2021, 18, 366–368. [Google Scholar] [CrossRef] [Scilit] [PubMed]
- Xu, Y.; Zhou, W.; Zhou, Y.; Wu, J.; Zhou, X. Transcriptome and comparative gene expression analysis of sogatella furcifera (horvath) in response to southern rice black-streaked dwarf virus. PLoS ONE 2012, 7, e36238. [Google Scholar] [CrossRef] [Scilit] [PubMed]
- Hollender, C.A.; Dardick, C. Molecular basis of angiosperm tree architecture. New Phytol. 2015, 206, 541–556. [Google Scholar] [CrossRef] [Scilit] [PubMed]
- Zhang, Y.; Han, X.; Sang, J.; He, X.; Liu, M.; Qiao, G.; Zhuo, R.; He, G.; Hu, J. Transcriptome analysis of immature xylem in the chinese fir at different developmental phases. PeerJ 2016, 4, e2097. [Google Scholar] [CrossRef] [Scilit] [PubMed]
- Ni, J.; Zhao, M.; Chen, M.; Pan, B.; Tao, Y.; Xu, Z. Comparative transcriptome analysis of axillary buds in response to the shoot branching regulators gibberellin a3 and 6-benzyladenine in jatropha curcas. Sci. Rep. 2017, 7, 11417. [Google Scholar] [CrossRef] [Scilit] [PubMed]
- Li, X.; Feng, C.; Su, R.; Song, P.; Peng, X.; Zhou, J.; Li, Y.; Deng, Q. Transcriptomics and hormone-targeted metabolomics reveal the mechanisms underlying special branching in loquat. Agronomy 2026, 16, 37. [Google Scholar] [CrossRef] [Scilit]
- Shen, X.; Li, Y.; Kang, L.; Zou, Y.; Shu, H. Relation sh ip between morphology and hormones dur ing weeping peach (prunus persica var. Pendula) shoot development. Acta Horiticult. Sin. 2008, 3, 395–402. [Google Scholar] [CrossRef]
- Li, S.; Zheng, T.; Zhuo, X.; Li, Z.; Li, L.; Li, P.; Qiu, L.; Pan, H.; Wang, J.; Cheng, T.; et al. Transcriptome profiles reveal that gibberellin-related genes regulate weeping traits in crape myrtle. Hortic. Res. 2020, 7, 54. [Google Scholar] [CrossRef] [Scilit] [PubMed]
- Wei, H.; Chen, J.; Lu, Z.; Zhang, X.; Feng, Y.; Liu, G.; Lian, B.; Chen, Y.; Zhong, F.; Yu, C.; et al. Transcriptome analysis reveals critical genes and pathways of regulating the branching architecture of lagerstroemia indica in response to gravity signal. Sci. Hortic. 2024, 331, 113163. [Google Scholar] [CrossRef] [Scilit]
- Huang, L.; Jiang, Y.; Fan, F.; Li, M.; Wu, P.; Ma, X. Developmental characteristics of the lateral branches of chinese fir and their correlation with endogenous hormones. J. For. Environ. 2022, 42, 561–568. [Google Scholar] [CrossRef]
- Sun, T.; Zhang, Y. MAP kinase cascades in plant development and immune signaling. EMBO Rep. 2022, 23, EMBR202153817. [Google Scholar] [CrossRef] [Scilit] [PubMed]
- Jia, W.; Li, B.; Li, S.; Liang, Y.; Wu, X.; Ma, M.; Wang, J.; Gao, J.; Cai, Y.; Zhang, Y.; et al. Mitogen-activated protein kinase cascade MKK7-MPK6 plays important roles in plant development and regulates shoot branching by phosphorylating PIN1 in arabidopsis. PLoS Biol. 2016, 14, e1002550. [Google Scholar] [CrossRef] [Scilit] [PubMed]
- Vaghela, B.; Vashi, R.; Rajput, K.; Joshi, R. Plant chitinases and their role in plant defense: A comprehensive review. Enzym. Microb. Technol. 2022, 159, 110055. [Google Scholar] [CrossRef] [Scilit] [PubMed]
- Dong, N.; Lin, H. Contribution of phenylpropanoid metabolism to plant development and plant-environment interactions. J. Integr. Plant Biol. 2021, 63, 180–209. [Google Scholar] [CrossRef] [Scilit] [PubMed]
- Vanholme, R.; Demedts, B.; Morreel, K.; Ralph, J.; Boerjan, W. Lignin biosynthesis and structure. Plant Physiol. 2010, 153, 895–905. [Google Scholar] [CrossRef] [Scilit] [PubMed]
- Pratyusha, D.S.; Sarada, D.V.L. MYB transcription factors—Master regulators of phenylpropanoid biosynthesis and diverse developmental and stress responses. Plant Cell Rep. 2022, 41, 2245–2260. [Google Scholar] [CrossRef] [Scilit] [PubMed]
- Vanholme, R.; De Meester, B.; Ralph, J.; Boerjan, W. Lignin biosynthesis and its integration into metabolism. Curr. Opin. Biotechnol. 2019, 56, 230–239. [Google Scholar] [CrossRef] [Scilit] [PubMed]
- Li, J.; Wang, Y.; Zhao, Y.; Zhang, Y.; Qu, K.; Zhu, Z.; Wang, C.; Li, Z.; Cong, L.; Gang, S.; et al. Combined transcriptomic and metabolomic analysis of phenylpropanoid biosynthesis in the mechanism of leaf angle formation in sorghum. Front. Plant Sci. 2025, 16, 1665475. [Google Scholar] [CrossRef] [Scilit] [PubMed]
- Warinowski, T.; Koutaniemi, S.; Kärkönen, A.; Sundberg, I.; Toikka, M.M.; Simola, L.K.; Kilpeläinen, I.; Teeri, T.H. Peroxidases bound to the growing lignin polymer produce natural like extracellular lignin in a cell culture of norway spruce. Front. Plant Sci. 2016, 7, 1523. [Google Scholar] [CrossRef] [Scilit] [PubMed]
- Wang, H.; Zhang, Y.; Zeng, X.; Peng, F.; Mazoor, M.A.; Zhang, Y.; Zhao, Y.; Han, W.; Lu, J.; Cao, Y.; et al. Analysis of the β-glucosidase family reveals genes involved in the lignification of stone cells in chinese white pear (pyrus bretschneideri rehd.). Front. Plant Sci. 2022, 13, 852001. [Google Scholar] [CrossRef] [Scilit] [PubMed]

Disclaimer/Publisher’s Note: The statements, opinions and data contained in all publications are solely those of the individual author(s) and contributor(s) and not of MDPI and/or the editor(s). MDPI and/or the editor(s) disclaim responsibility for any injury to people or property resulting from any ideas, methods, instructions or products referred to in the content. |
© 2026 by the authors. Licensee MDPI, Basel, Switzerland. This article is an open access article distributed under the terms and conditions of the Creative Commons Attribution (CC BY) license.