


Abstract
Peatland fires in Southeast Asia are strongly influenced by hydrological conditions, yet most studies rely on low-temporal-resolution data, limiting the capture of rapid hydrological dynamics. This study analyzes high-frequency hydrological dynamics in relation to fire occurrence in protected peatlands of Central Sumatra. Real-time monitoring using 12 IoT sensors recorded groundwater level (GWL), soil moisture (SM), and soil temperature (ST). Results show substantial spatial variation, with GWL (−144.30 to 9.00 cm), SM (14.52% to 94.82%), and ST (23.01 to 33.93 °C). Linear mixed-effects models (LMMs) and first-order autoregressive (AR (1)) temporal correlation showed significant associations of GWL with SM (β = 0.460, p < 0.001) and ST (β = −0.516, p < 0.001). GWL decreased by 13.73 cm (−0.54 cm day−1) during the pre-fire period and by a further 6.34 cm (−0.47 cm day−1) during the fire period (27 August 2024–9 September 2024), when the descriptive mean GWL reached −89.43 cm. Post-fire, GWL increased by 41.99 cm (0.82 cm day−1), while SM increased and ST decreased, coinciding with reduced hotspot activity. The fire period was identified using SIPONGI hotspots and SIPP fire records and suppression. These findings show temporal associations between hydrological dynamics and fire occurrence, supporting high-frequency IoT monitoring of peatland hydrology.
1. Introduction
Peatland fires have increased significantly since the 20th century, with the tropical peatlands of Southeast Asia, particularly Indonesia and Malaysia, being the most affected regions [1,2,3]. Fires are mainly caused by human activities such as deforestation, peat drainage [4], and land conversion [5]. Peat fires can alter ecosystem dynamics and carbon storage, with fire occurrence and burn severity affecting post-fire above-ground carbon stocks [6]. Recurrent burning can also contribute to long-term peatland degradation, carbon loss, and biodiversity decline, while fire frequency and severity influence vegetation recovery [7]. The extreme fire events in Indonesia in 2015 burned more than 2.6 million hectares of land and emitted approximately 1.1 Gt CO2 [8], equivalent to the annual emissions of major industrial countries. This condition is further exacerbated by the increasing frequency and intensity of fires during the dry season, which is closely related to the El Niño Southern Oscillation (ENSO) phenomenon, known to significantly increase drought anomalies and fire risk in tropical regions [9,10,11,12,13].
The hydrological dynamics of peatlands play a crucial role in maintaining moisture conditions and reducing fire risk [14,15], driven by interactions among groundwater levels (GWL), soil moisture (SM), soil temperature (ST), and rainfall. A drop in the GWL below the critical threshold of −40 cm has been associated with increased fire risk due to increased aeration and dryness in the peat surface layer [16,17,18]. Moreover, SM influences peat fuel flammability, with moisture thresholds varying among peat types [19], particularly in shallow peat layers [20,21]. Soil temperature also exhibits a strong relationship with soil moisture, with a negative correlation indicating that higher temperatures are associated with reduced moisture [22]. Rainfall is a major factor in the peat wetting process; an increase in the number of rainless days significantly accelerates peat drying and increases fire risk [23,24].
The relationship between hydrological factors and fires has been widely studied; however, most research still relies on low-resolution monthly and annual data [25,26,27] and thus cannot capture the fluctuating hydrological dynamics that respond rapidly to environmental changes on a daily to sub-daily scale. Peatland hydrology dynamics are highly responsive to environmental changes, with high variations in GWL that can fluctuate more than 20–50 cm over a short period (daily to weekly) depending on rainfall and drainage [28]. The GWL critical threshold of −40 cm has been widely used as the limit for increased fire risk, while fire events generally occur when GWL drops deeper to below −60 cm, highlighting the importance of high temporal resolution in detecting critical phases before fires [29,30]. The high diversity of peatland landscapes, both in vegetation and small-scale landforms, causes variations in water conditions within the same area, with differences in GWL between micro-landforms reaching more than 30 cm at a single point [31], including in Peat Swamp Forests, resulting in different responses to drought and fire across various locations. Protected peat forest areas still face a high risk of fire due to hydrological changes and external pressures, even though they are naturally water-saturated [32]. One approach that has been developed to address the limitations of such data resolution is the use of Internet of Things (IoT) sensors with high temporal resolution (30–60 min), which can continuously record hydrological dynamics; however, the utilization of this data in peat fire studies is still relatively limited compared to satellite-based approaches [25,33,34].
The central Sumatra peat swamp forest areas, particularly relatively intact tropical peat landscapes, have not been extensively studied in direct relation to fire occurrences, as most studies have focused more on degraded peat and areas that have undergone land-use changes [35]. In fact, peat protected areas have unique hydrology that can provide insight into the natural thresholds of peat systems in relation to fire disturbances, especially since shallow GWL conditions serve an essential role in mitigating fire risk [18]. The Londerang Peat Protected Forest in Jambi Province is one of the tropical peat landscapes spanning 12,500 ha [36] that have significant ecological functions as a hydrological protection area and carbon reservoir, with peat depths of up to 4 m. Although it is designated as a protected area, pressure on the Londerang ecosystem persists both because of historical drainage in its surroundings and increased fire occurrences during dry years, such as 2015 and 2019 [36], with indications of increased hotspots during El Niño periods. These conditions make Londerang a highly representative location for studying micro-hydrological dynamics and their relationship with fire occurrences at the local scale.
Several studies have examined the relationship between peatland hydrology and fire occurrence, but understanding of short-term hydrological variability during fire events remains limited. Existing studies have examined individual hydrological variables or their relationships with fire occurrence, while studies integrating groundwater level (GWL), soil moisture (SM), and soil temperature (ST) within a unified hydrological analytical framework remain limited [24,26,33,37,38]. Many studies also rely on monthly or annual observations [39,40], which provide limited information on rapid changes in peatland hydrological conditions. Therefore, high-frequency observations are needed to characterize temporal changes in hydrological conditions during different phases of fire events.
This research gap is particularly evident in protected tropical peatland ecosystems, where local-scale hydrological variability during fire events remains insufficiently documented. Continuous sensor-based monitoring combined with fire-event analysis can provide more detailed observations of changes in GWL, SM, and ST at shorter time scales. This study addresses this gap by combining hourly IoT-based hydrological monitoring with fire-event analysis.
This study aims to analyze the characteristics of high-frequency hydrological dynamics of GWL, SM, and ST during the 2024 fire-event period in the Londerang Peat Protected Forest, Central Sumatra. The study analyzes relationships among the hydrological parameters and compares their conditions across the pre-fire, fire, and post-fire phases. The study also examines the temporal correspondence between hydrological changes and the validated fire period at daily to sub-daily time scales. The results provide observational evidence of local-scale hydrological variability associated with fire occurrence in a protected tropical peatland landscape.
2. Materials and Methods
2.1. Research Study Area
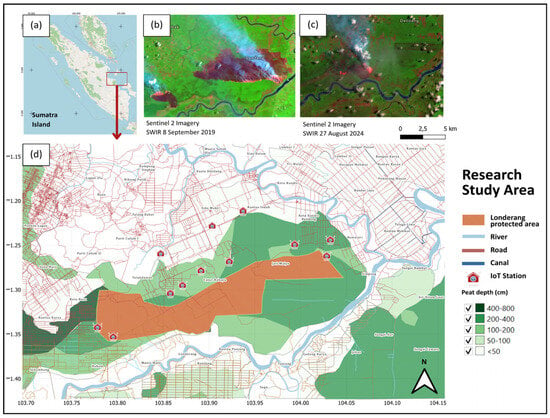
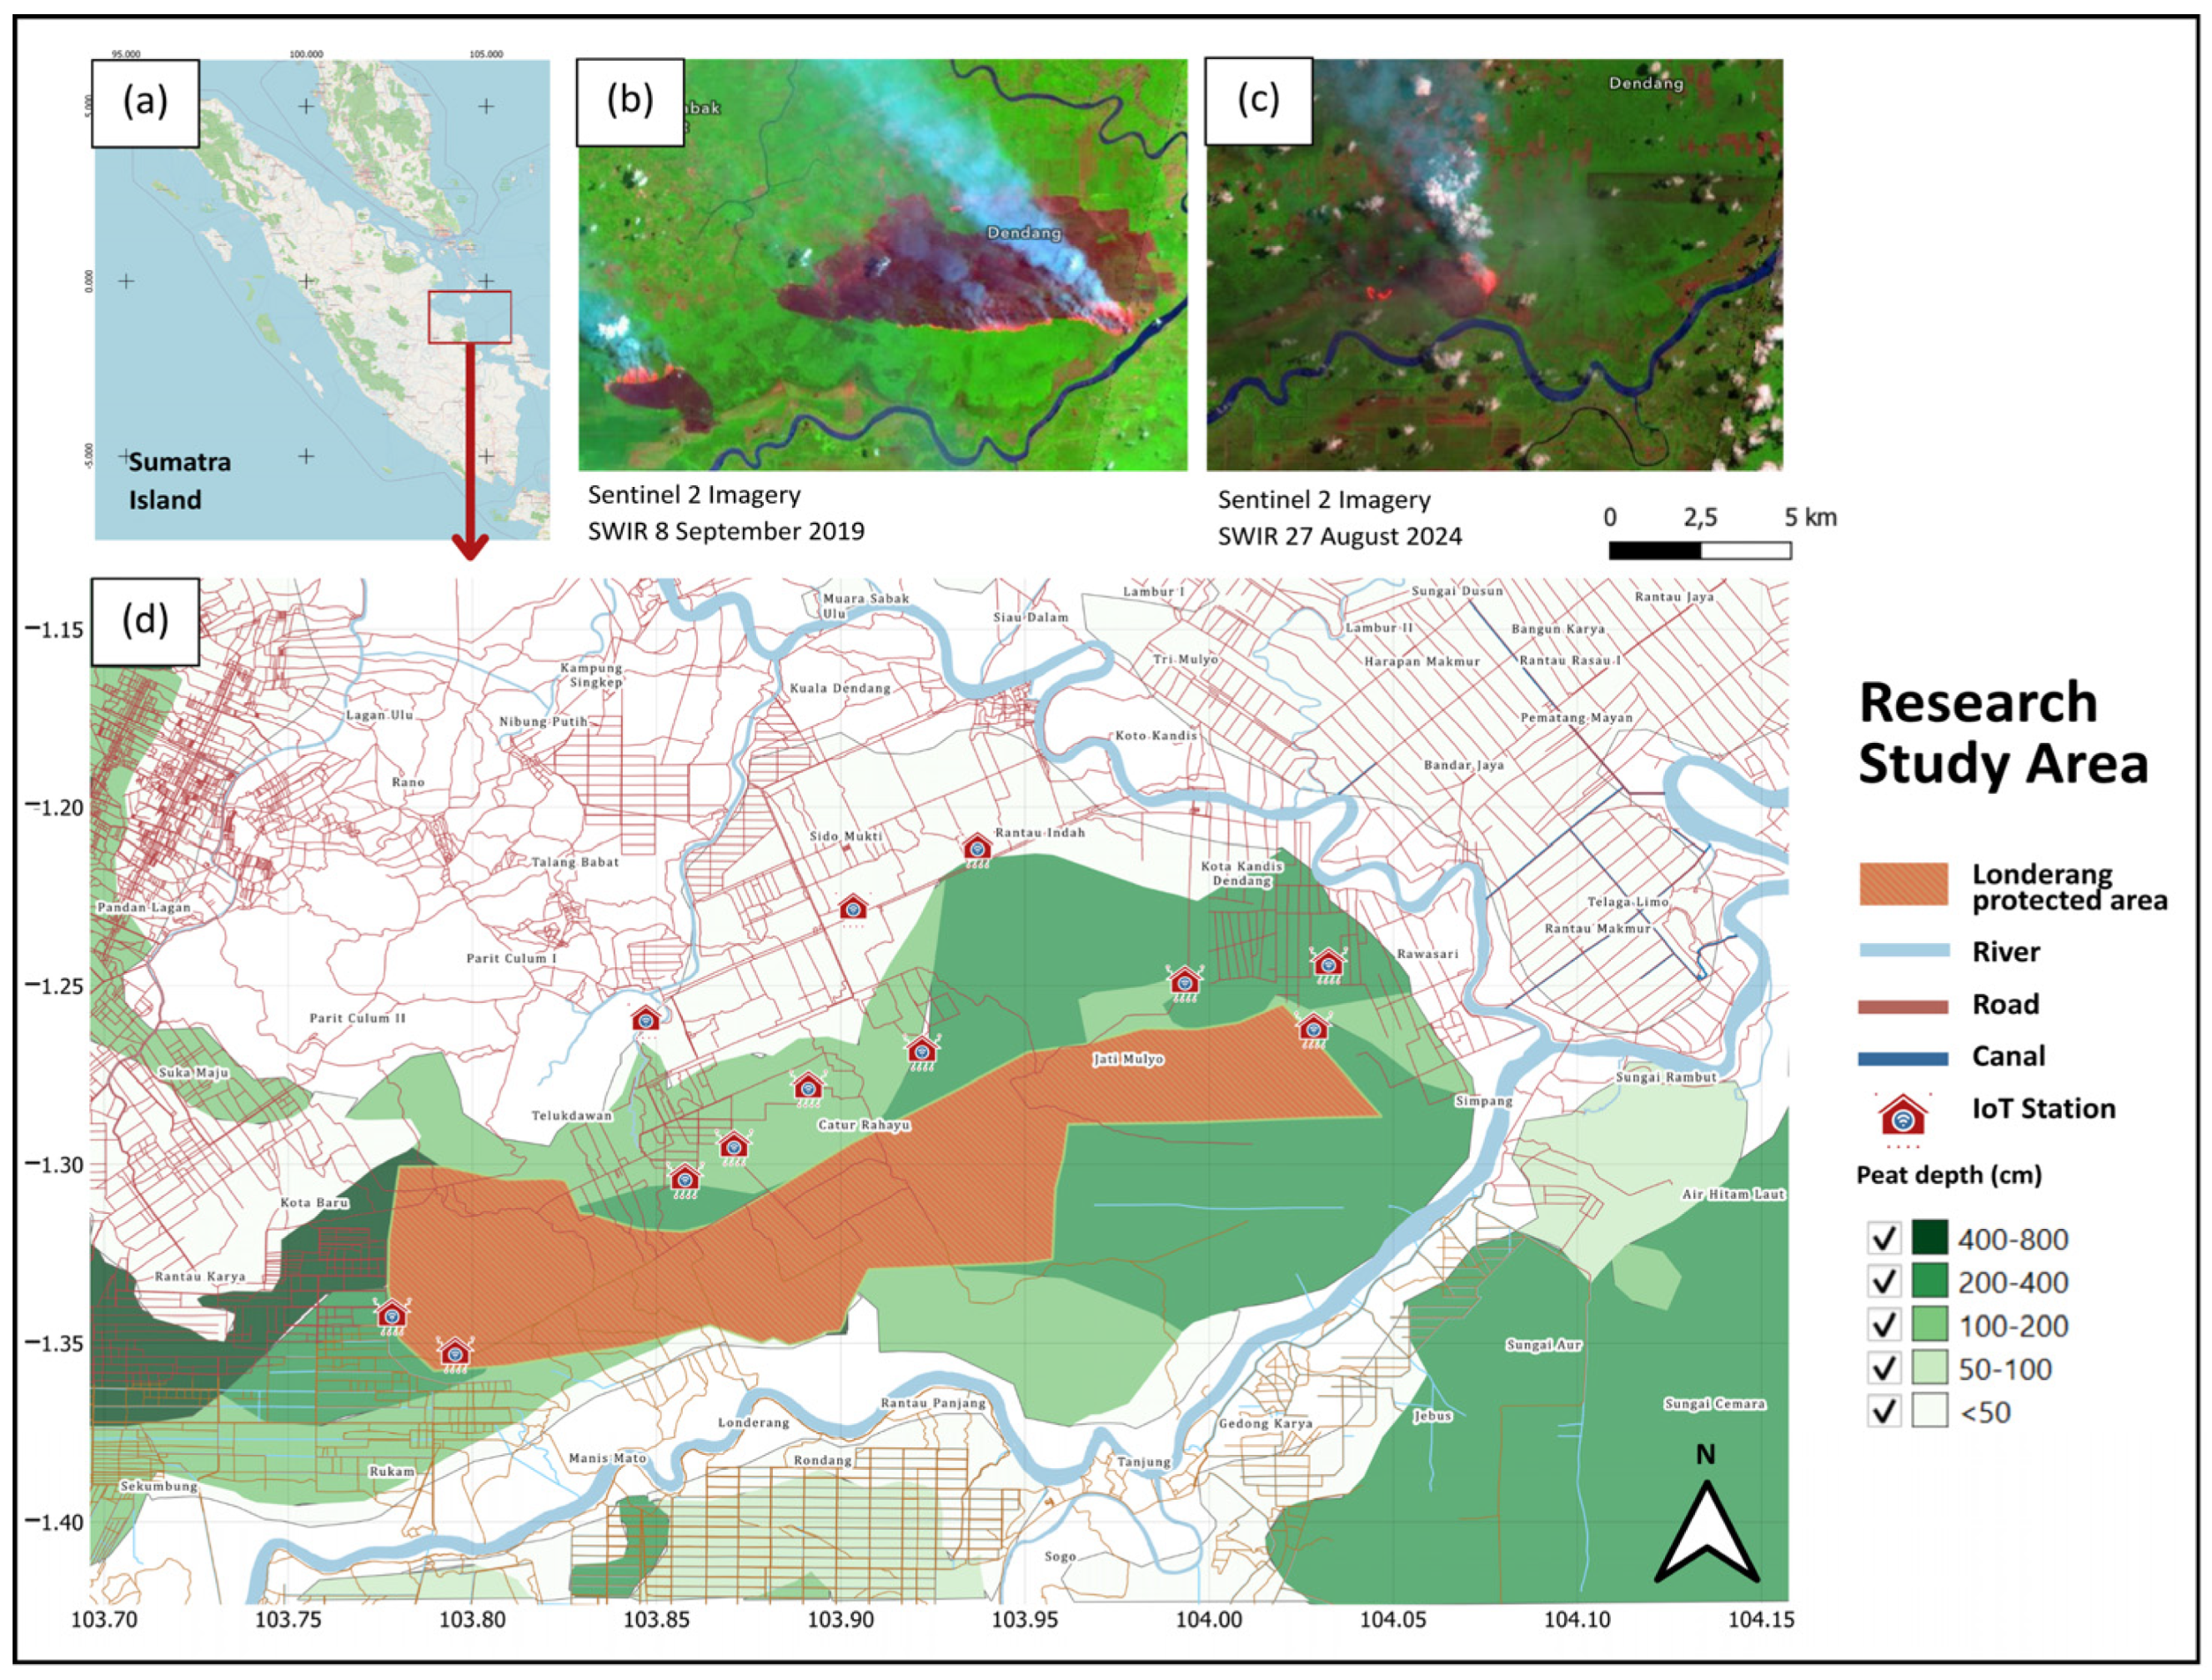
The research was conducted in a tropical peat swamp forest landscape in Central Sumatra, which is highly vulnerable to forest and land fires. Londerang Peat Swamp Forest is the largest peat forest in Jambi province, covering 12,500 hectares. Londerang suffered severe damage from the 2015 fires, which destroyed 90% of the vegetation and caused ecosystem degradation. The area burned again in 2019 (Figure 1), damaging most of the vegetation [36]. Efforts to revegetate have involved planting 164,000 endemic plants, such as jelutung, pulai rawa, and gelam, on 2.8% of the total land area. The hydrological conditions are classified as vulnerable due to the low GWL < −40 cm below the surface [37].
Figure 1.
Map of the study area and spatio-temporal visualization of forest fire occurrences: (a) Map of the Sumatra region. (b) Spatial distribution of major fires in 2019. (c) Locations of fires with the highest intensity in 2024. (d) Administrative boundaries of the study area along with the distribution of Internet of Things (IoT) sensor stations.
Internet of Things (IoT) monitoring stations are deployed in locations with varying land-cover characteristics (Figure 1). The Ri and Jm1 stations are situated in areas adjacent to road access, while the Cr1 station exhibits similar characteristics. The Rs station is located near a major river stream, whereas the Cr2 and Cr3 stations are situated around canal channels. Within the conservation area, the R1 and R2 stations are in the revegetation area of the Londerang Peat Forest Reserve (HLG), with peat depth characteristics categorized as moderate. Meanwhile, the Jm2, Kk1, and Kk2 stations are located directly adjacent to protected forests.
2.2. Data Collection
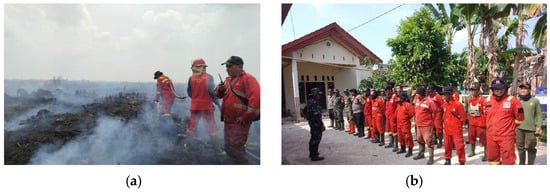
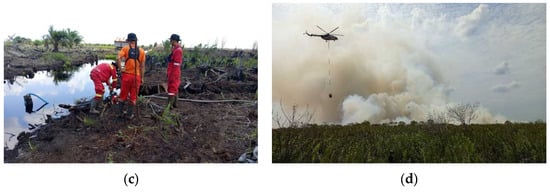
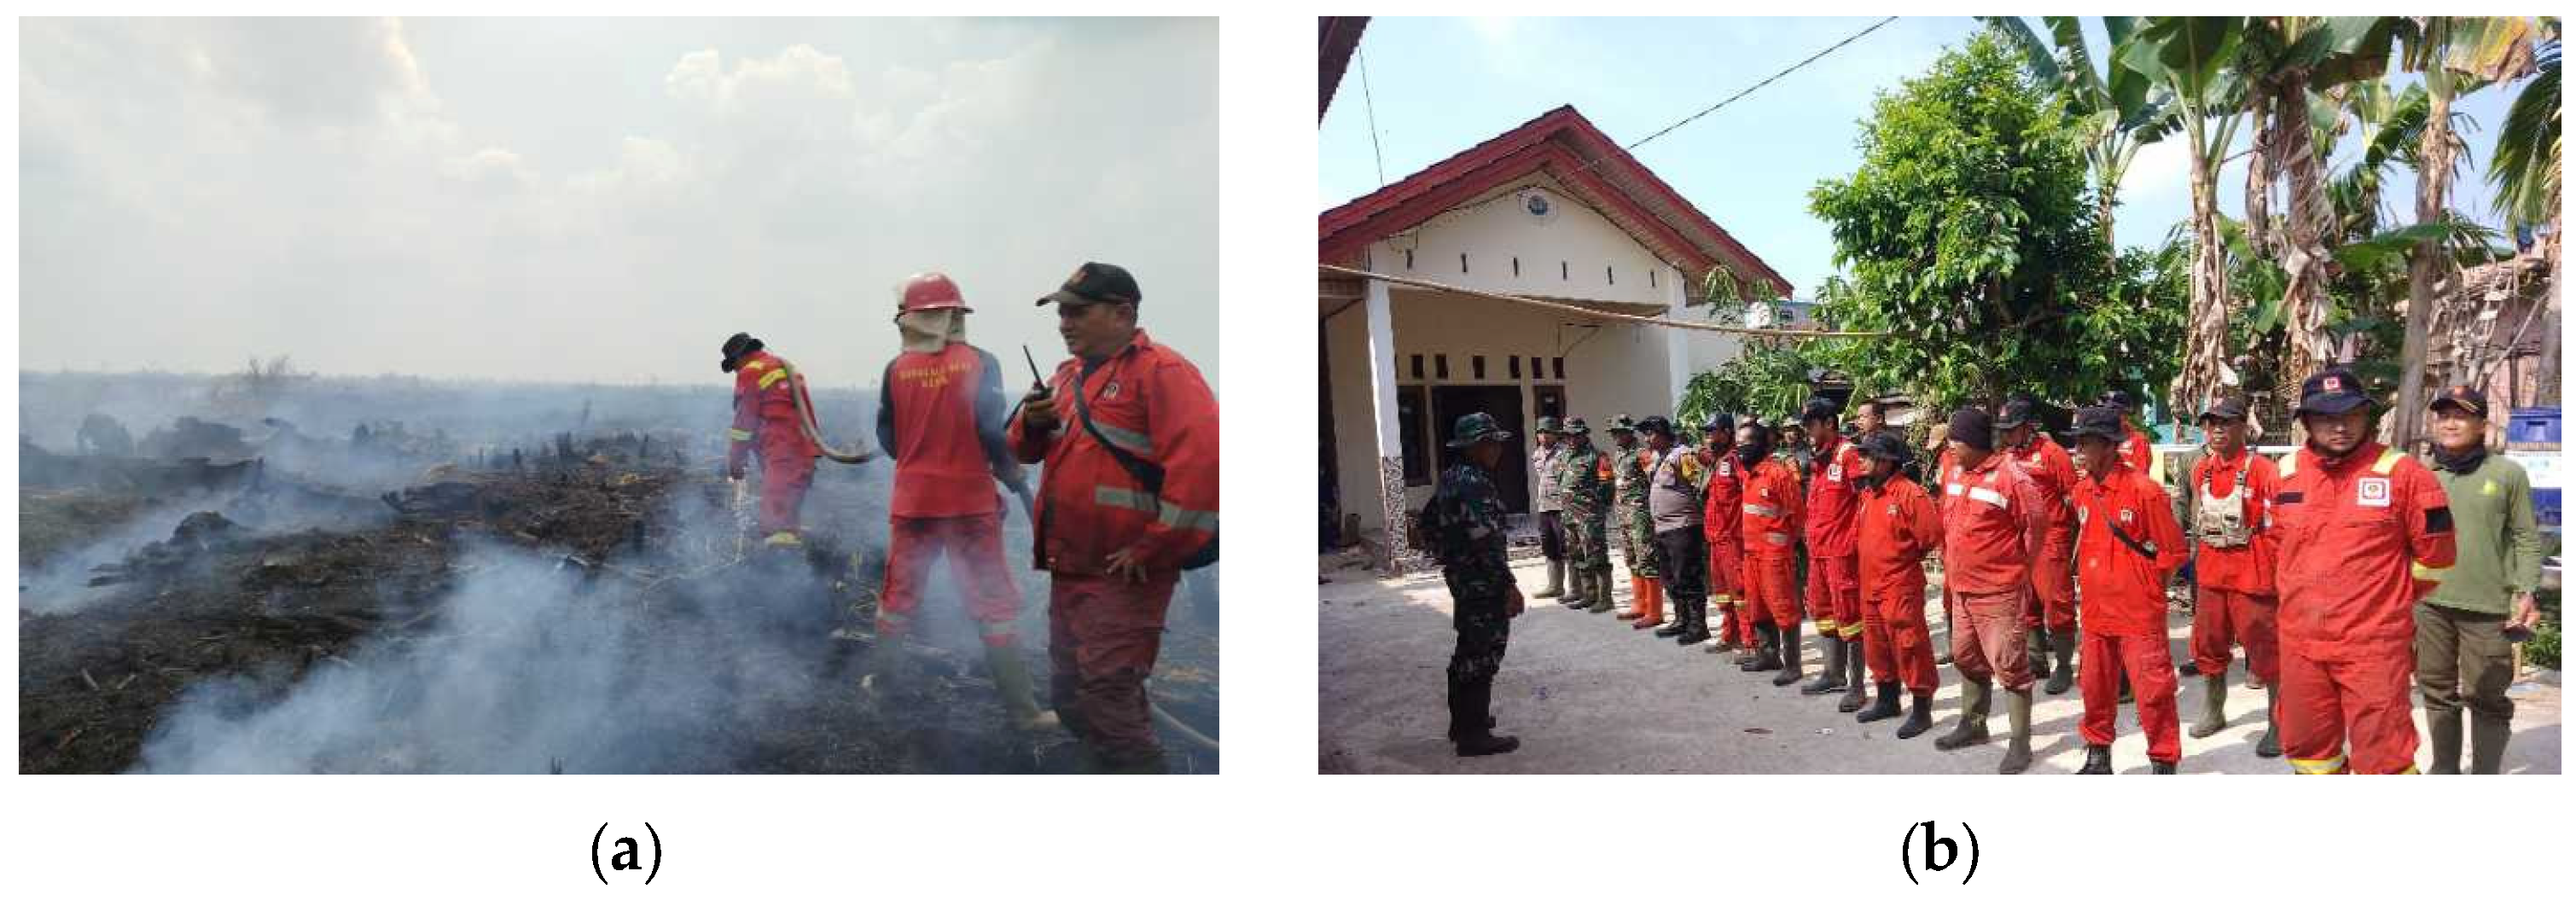
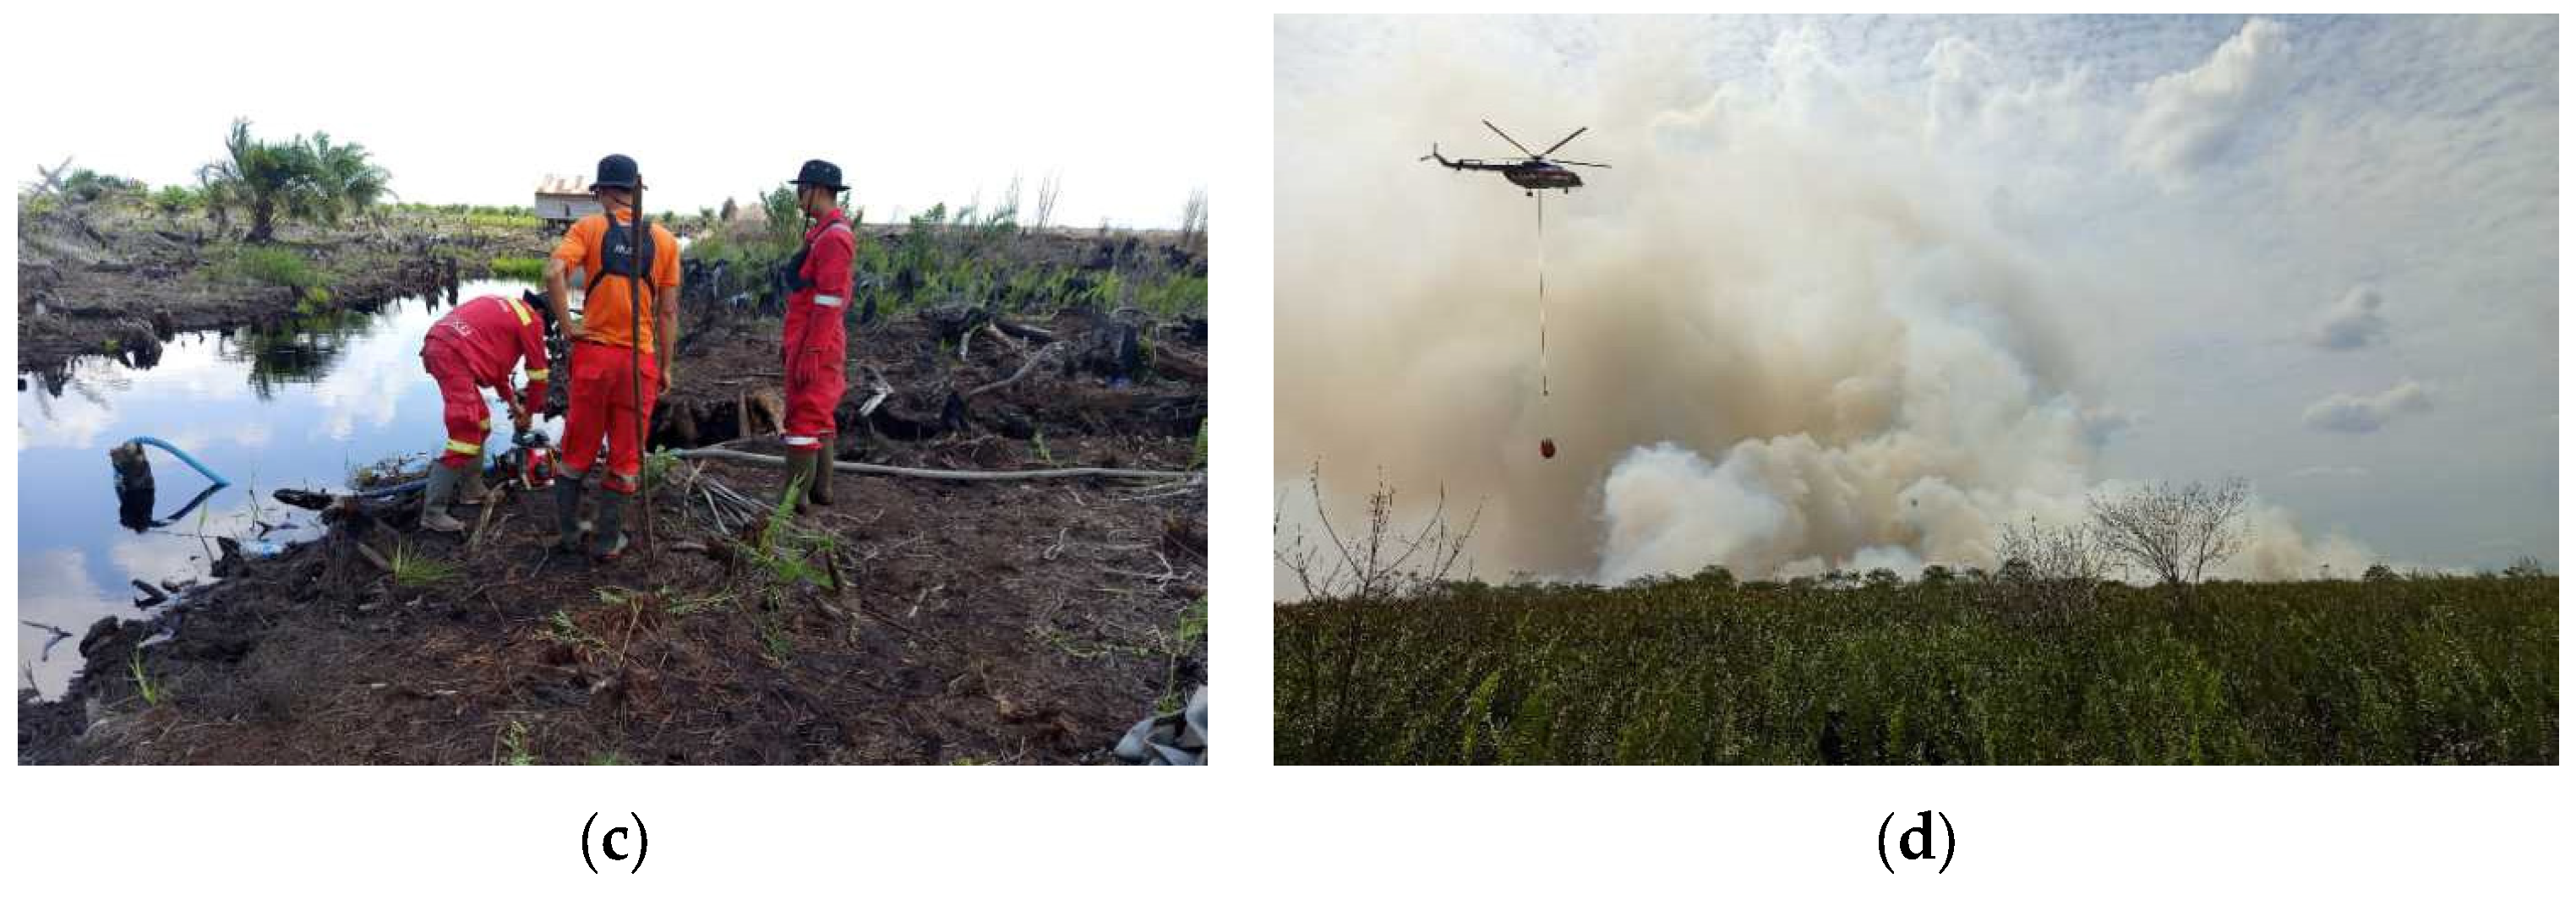
Hydrological and fire data were collected in 2024. Groundwater level (GWL) was continuously monitored throughout January-December 2024 to characterize annual groundwater-level dynamics, whereas soil moisture (SM) and soil temperature (ST) data used in the present analysis covered the 1 August 2024 to 31 October 2024 fire-event period. The sensors recorded groundwater level, soil moisture, soil temperature, electrical conductivity, and rainfall at hourly intervals. In this study, the hydrological analysis focused on GWL, SM, and ST. Fire occurrence was analyzed for the August-October 2024 period, with the major fire event in the Londerang area occurring from 27 August to 9 September 2024, based on NASA FIRMS, SiPongi, and SIPP Karhutla records (Figure 2).
Figure 2.
Documentation of Peat Forest Fire Extinguishing in Londerang Protected Forest (Source: SIPP Karhutla) includes (a) integrated briefing on extinguishing plans, (b) preparing water sources for firefighting, (c) ground firefighting with Manggala Agni personnel, fire-aware community members, and related agencies, and (d) firefighting with water.
The data were used as indicators of forest and land fire activity during the hydrological monitoring period. Hotspot data were downloaded in Excel spreadsheet format (.xlsx) from the official SiPongi KLHK website (https://sipongi.gakkum.kehutanan.go.id/ (accessed on 12 July 2026)), while supporting spatial data were obtained in CSV coordinate format from the NASA FIRMS platform (https://firms.modaps.eosdis.nasa.gov/ (accessed on 12 July 2026)).
2.3. Data Analysis
Data analysis began with descriptive statistics. Data normality and homogeneity of variance were assessed using the Shapiro–Wilk and Levene tests, respectively (Appendix A, Table A1 and Table A2). These tests were used to characterize the distributional properties and variance patterns of the station-level data. Because observations were recorded hourly and repeatedly at the same stations, linear mixed-effects models (LMMs) were used to account for repeated measurements and temporal autocorrelation. Station was specified as a random intercept, with an AR(1) correlation structure to account for temporal dependence between successive observations. Associations among GWL, SM, and ST were evaluated using LMMs. Differences among the pre-fire (1–26 August 2024), fire (27 August to 9 September 2024), and post-fire (10 September to 31 October 2024) phases were assessed using LMMs, with estimated marginal means (EMMs), 95% confidence intervals, F-statistics, and p-values. Spearman correlation was used to screen associations among hydrological variables, followed by linear regression to quantify linear relationships using R2, F-statistics, and p-values. Hotspot data were analyzed descriptively to assess their temporal correspondence with hydrological conditions. The fire phase was defined using high-confidence SiPongi hotspot detections (confidence level ≥80%) within the Londerang Peat Protected Forest boundary and was cross-checked with SIPP records of fire occurrence and suppression activities. All statistical analyses were performed in R using RStudio version 4.6.1, and spatial analyses were conducted in QGIS version 4.2.
2.4. Internet of Things Sensors
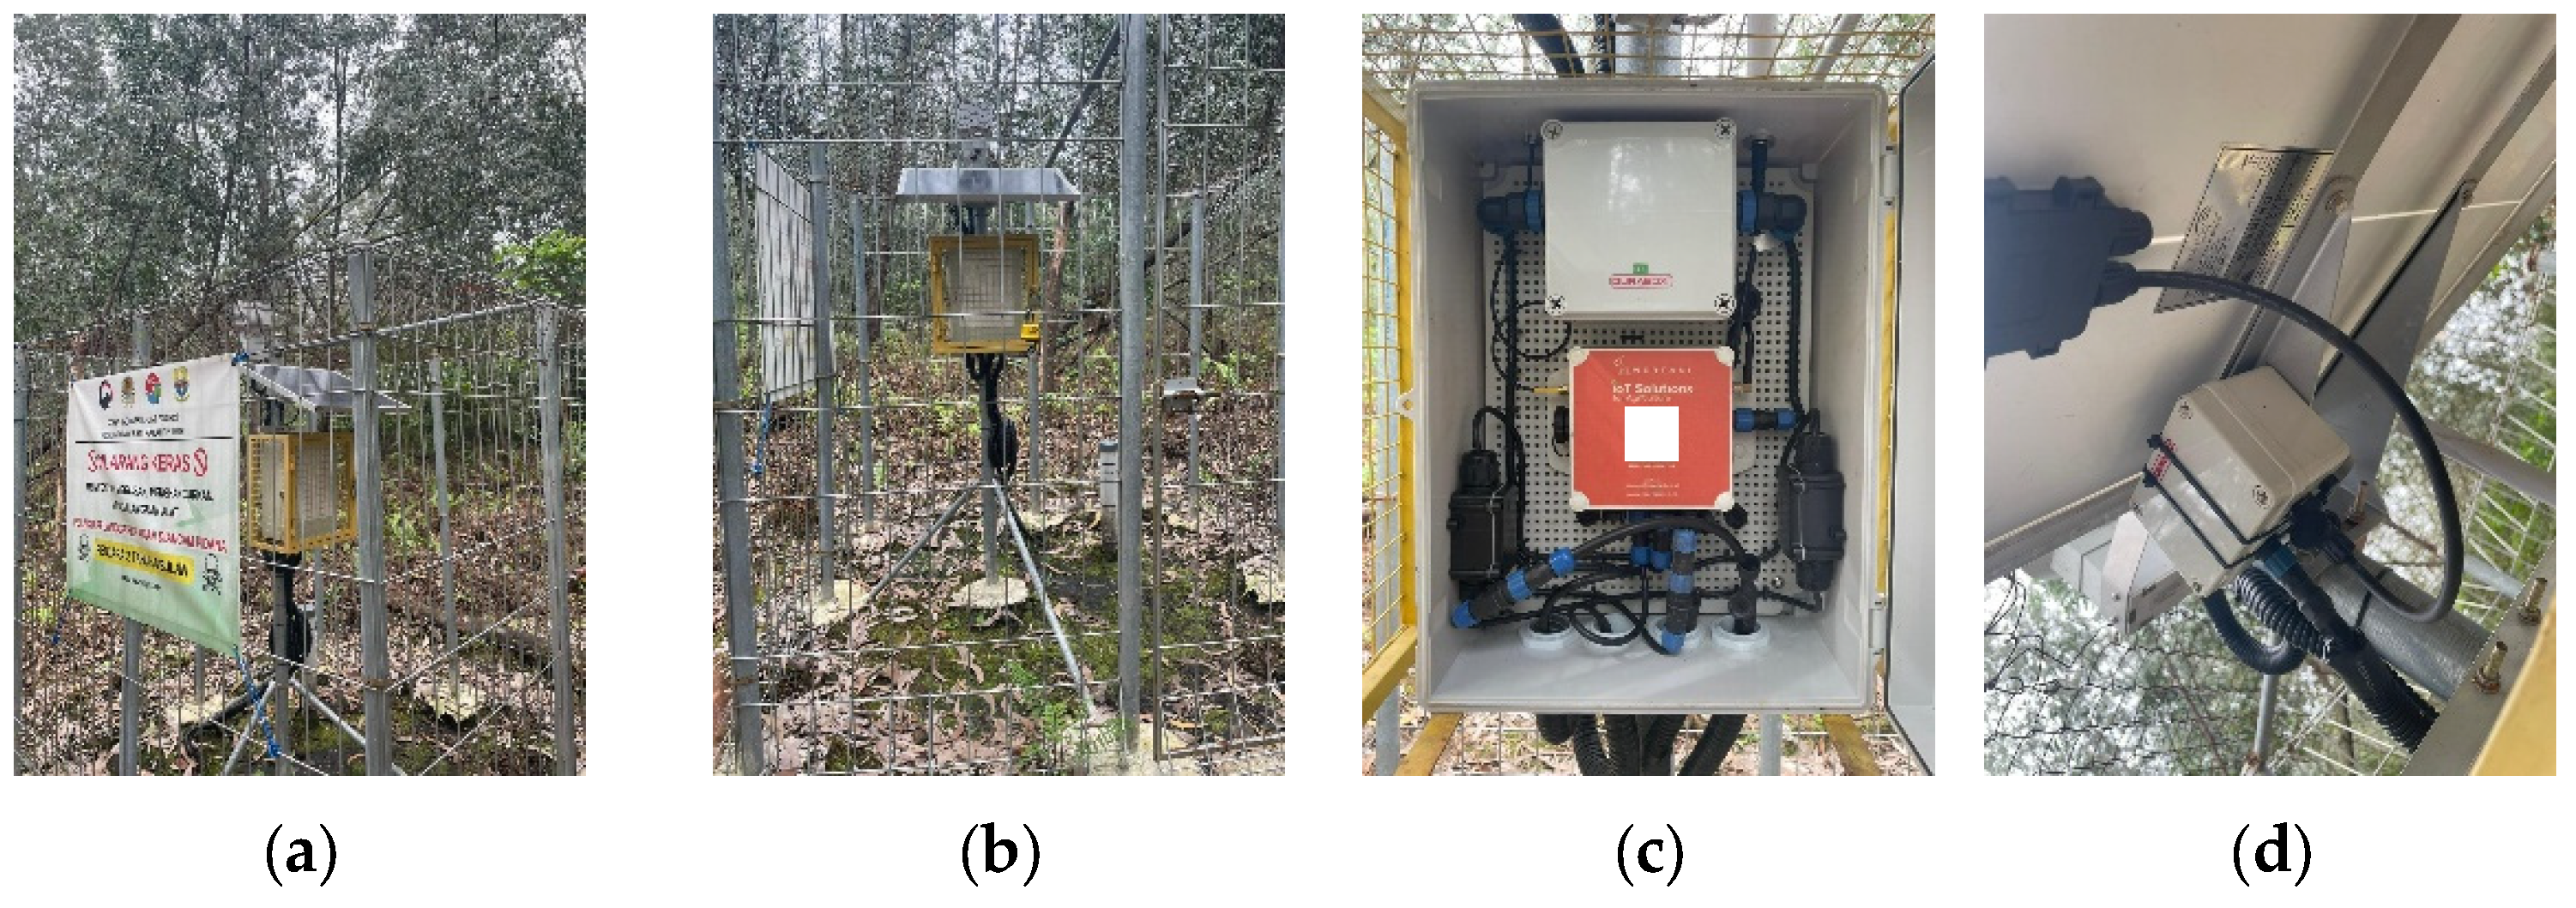
The Internet of Things (IoT) system for hydrological monitoring in the Londerang Peat Protected Forest (Rukam, Teluk Dawan, Rawa Sari, Jati Mulyo, Catur Rahayu, Koto Kandis, and Rantau Indah) was developed as part of a collaborative peat restoration project between the Korea Indonesia Forest Corporation (KIFC), Jakarta, Indonesia, and the Directorate of Peat Ecosystem Damage Control (PKEG), East Jakarta, Indonesia, Ministry of Forestry, in 2024, which is now under the Ministry of Environment. There are 12 IoT stations distributed throughout the Londerang Peat Protected Forest, with Rukam Station selected as the field verification point due to its high accessibility and proximity to the road network (Figure 3).
Figure 3.
Documentation of the IoT device during ground-check at Rukam Station: (a) front view; (b) side view; (c) internal machine components of the IoT device; and (d) external connection between the machine and the sensors.
The IoT monitoring system comprised 12 field-based stations installed under the Korea–Indonesia Joint Project for Restoration of Burnt Peatland in Jambi in Londerang Peat Protected Forest. The field monitoring system used MERTANI equipment and consisted of a groundwater level sensor and data logger, a 3-in-1 soil sensor measuring soil moisture, soil temperature, and electrical conductivity, and a spoon-type rainfall sensor. The stations used LTE/GPRS communication for data transmission, an IoT database for data management, and a 50-Wp solar panel for battery power supply. The system provided web-based real-time monitoring of field measurements. The groundwater-level sensor was installed in a piezometer. The manufacturer specifies a measurement range of 0–20 m H2O, typical accuracy of ≤±0.5% full scale, and long-term stability of 0.1% full scale ±0.05% for its corresponding submersible groundwater-monitoring configuration. The manufacturer specifies soil-moisture measurement ranges of 0–100%, with an accuracy of 5%, respectively, and a soil-temperature measurement range of −40 to 80 °C with an accuracy of ±0.5 °C for its 3-in-1 soil sensor. The available project documentation does not specify the commercial model numbers or exact installation depths of the field-installed sensors. Hourly groundwater level (GWL), soil moisture (SM), and soil temperature (ST) observations from the 12 stations were used in the present analysis, whereas soil electrical conductivity and rainfall measurements were recorded but excluded from the statistical analyses. The station locations are presented in Figure 3.
2.5. Hotspots in Forest and Land Fires
A hotspot is a satellite-detected thermal anomaly that generally indicates an active fire or other heat source. Hotspot observations in this study were obtained from the SiPongi system based on MODIS and VIIRS active-fire detections and cross-checked using NASA FIRMS data, MODIS Collection 6.1, and Suomi-NPP VIIRS Collection 2. MODIS provides approximately 1 km spatial resolution, whereas VIIRS provides approximately 375 m spatial resolution, and active-fire detections are identified using thermal-anomaly and contextual algorithms. Hotspot observations with a confidence level of ≥80% located within the Londerang Peat Protected Forest boundary were retained for analysis. Exact duplicate records with identical acquisition date, acquisition time, latitude, and longitude were counted once, whereas repeated detections at different acquisition times were retained as observations of fire activity and were not interpreted as independent fire events. Sentinel-2 Level-2A imagery acquired on 8 September 2019 and 27 August 2024, with 10–20 m spatial resolution, was used to identify burned areas and assess their spatial correspondence with high-confidence hotspot detections. The 8 September 2019 image provided a pre-event reference for the previously burned landscape, whereas the 27 August 2024 image provided spatial evidence during the 2024 fire period. Fire occurrence was further cross-checked with SIPP records of reported fire occurrence and suppression activities. Hotspot observations characterized the temporal and spatial distribution of fire activity, while Sentinel-2 imagery and SIPP records provided complementary evidence of the occurrence and spatial extent of the 2024 fire period.
2.6. Tropical Peat Hydrology
Groundwater level (GWL), soil moisture (SM), and soil temperature (ST) were used as hydrological indicators of peatland conditions [14,29]. GWL was expressed relative to the peat surface, with negative values indicating groundwater below the surface. The −40 cm level was used as a regulatory and literature-based reference for GWL conditions [24,26], based on Government Regulation No. 71/2014 as amended by Government Regulation No. 57/2016 and previous studies. GWL observations were classified according to their position relative to this reference level. SM was used to characterize peat moisture conditions relevant to peat fuel flammability [15,21], whereas ST was used to characterize peat thermal conditions associated with drying and hydrological variability.
3. Results
3.1. Peat Groundwater Level Dynamics in Determining Initial Fire Disaster Mitigation
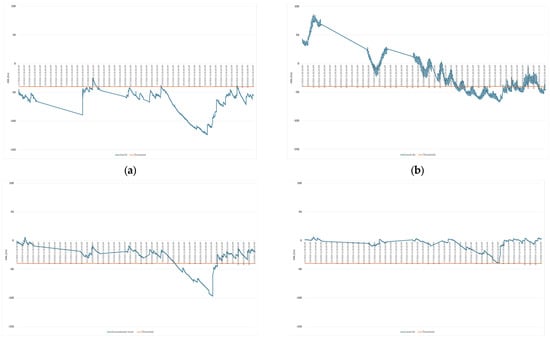
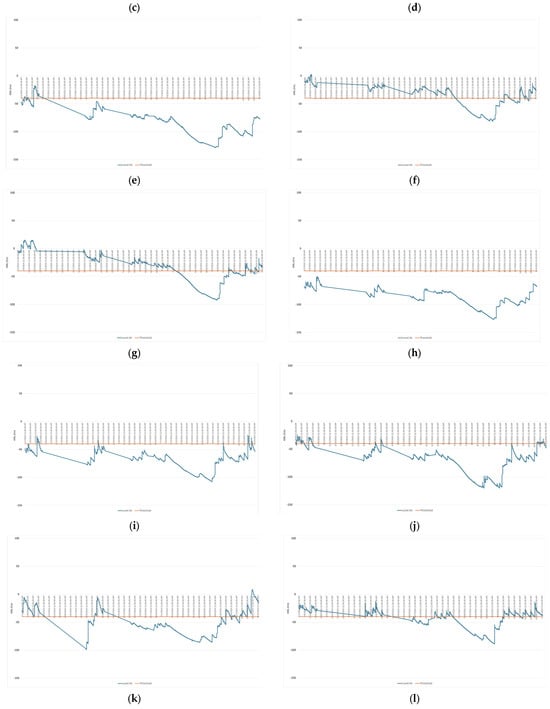
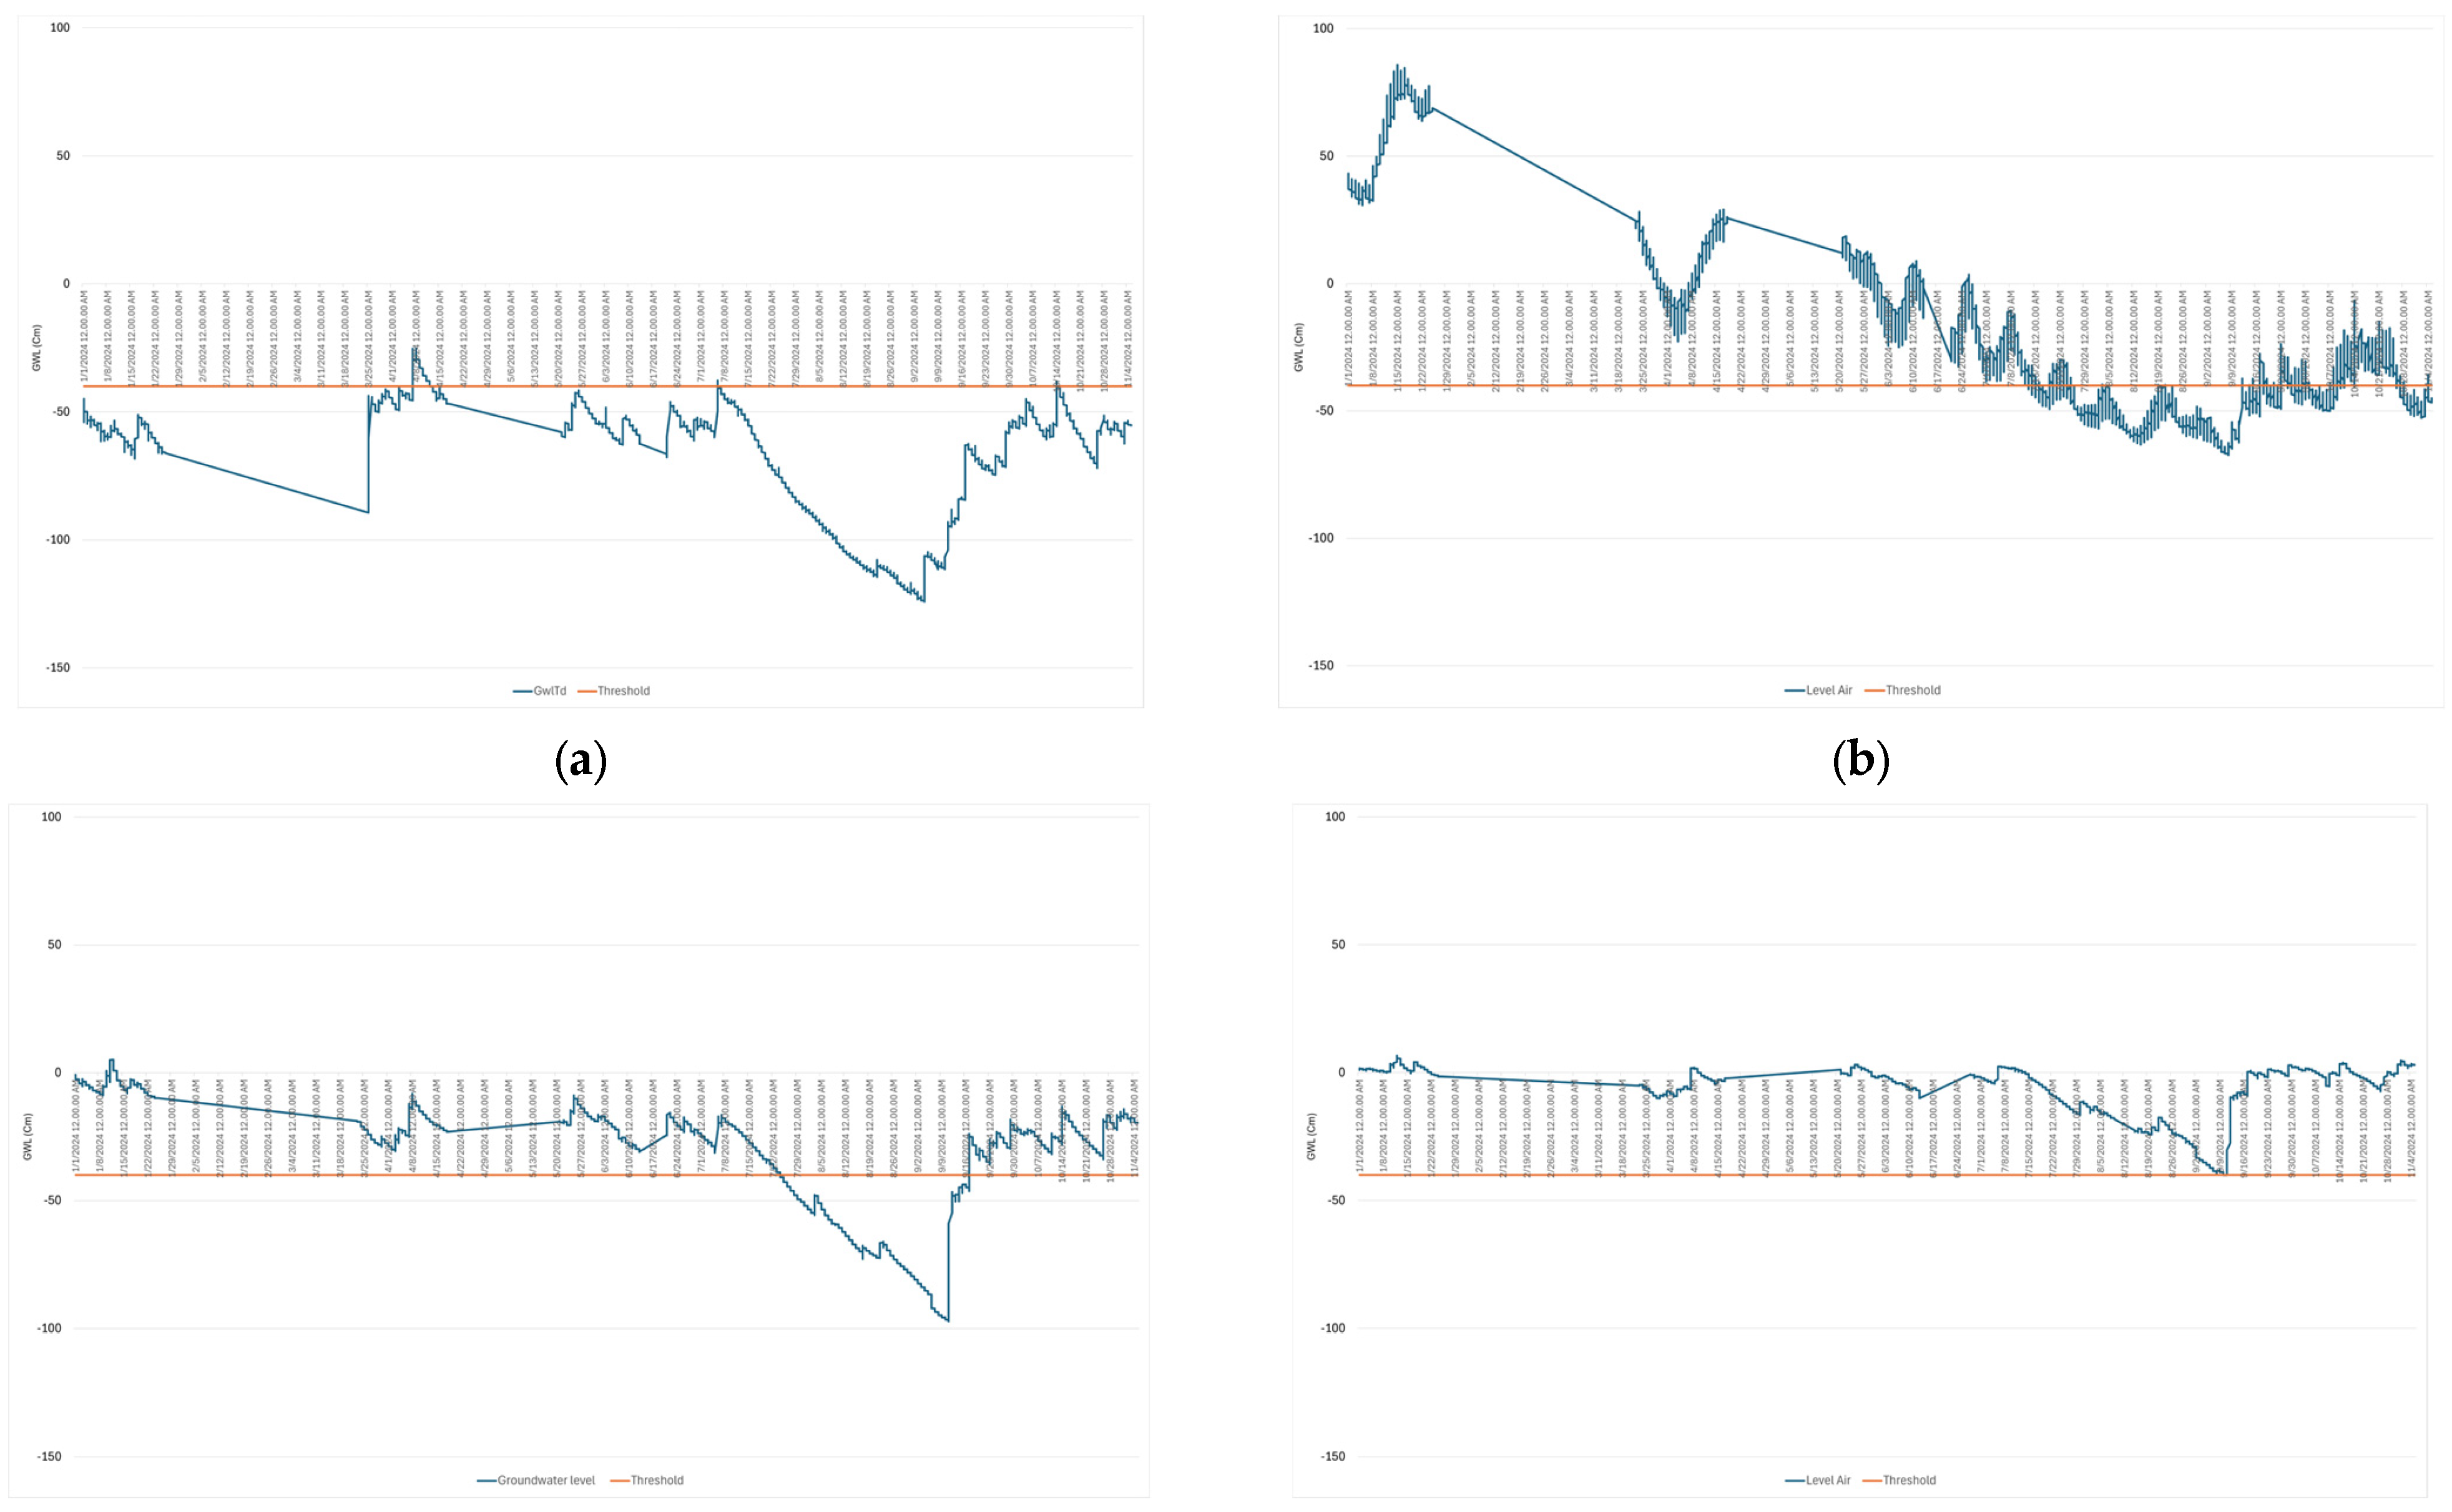
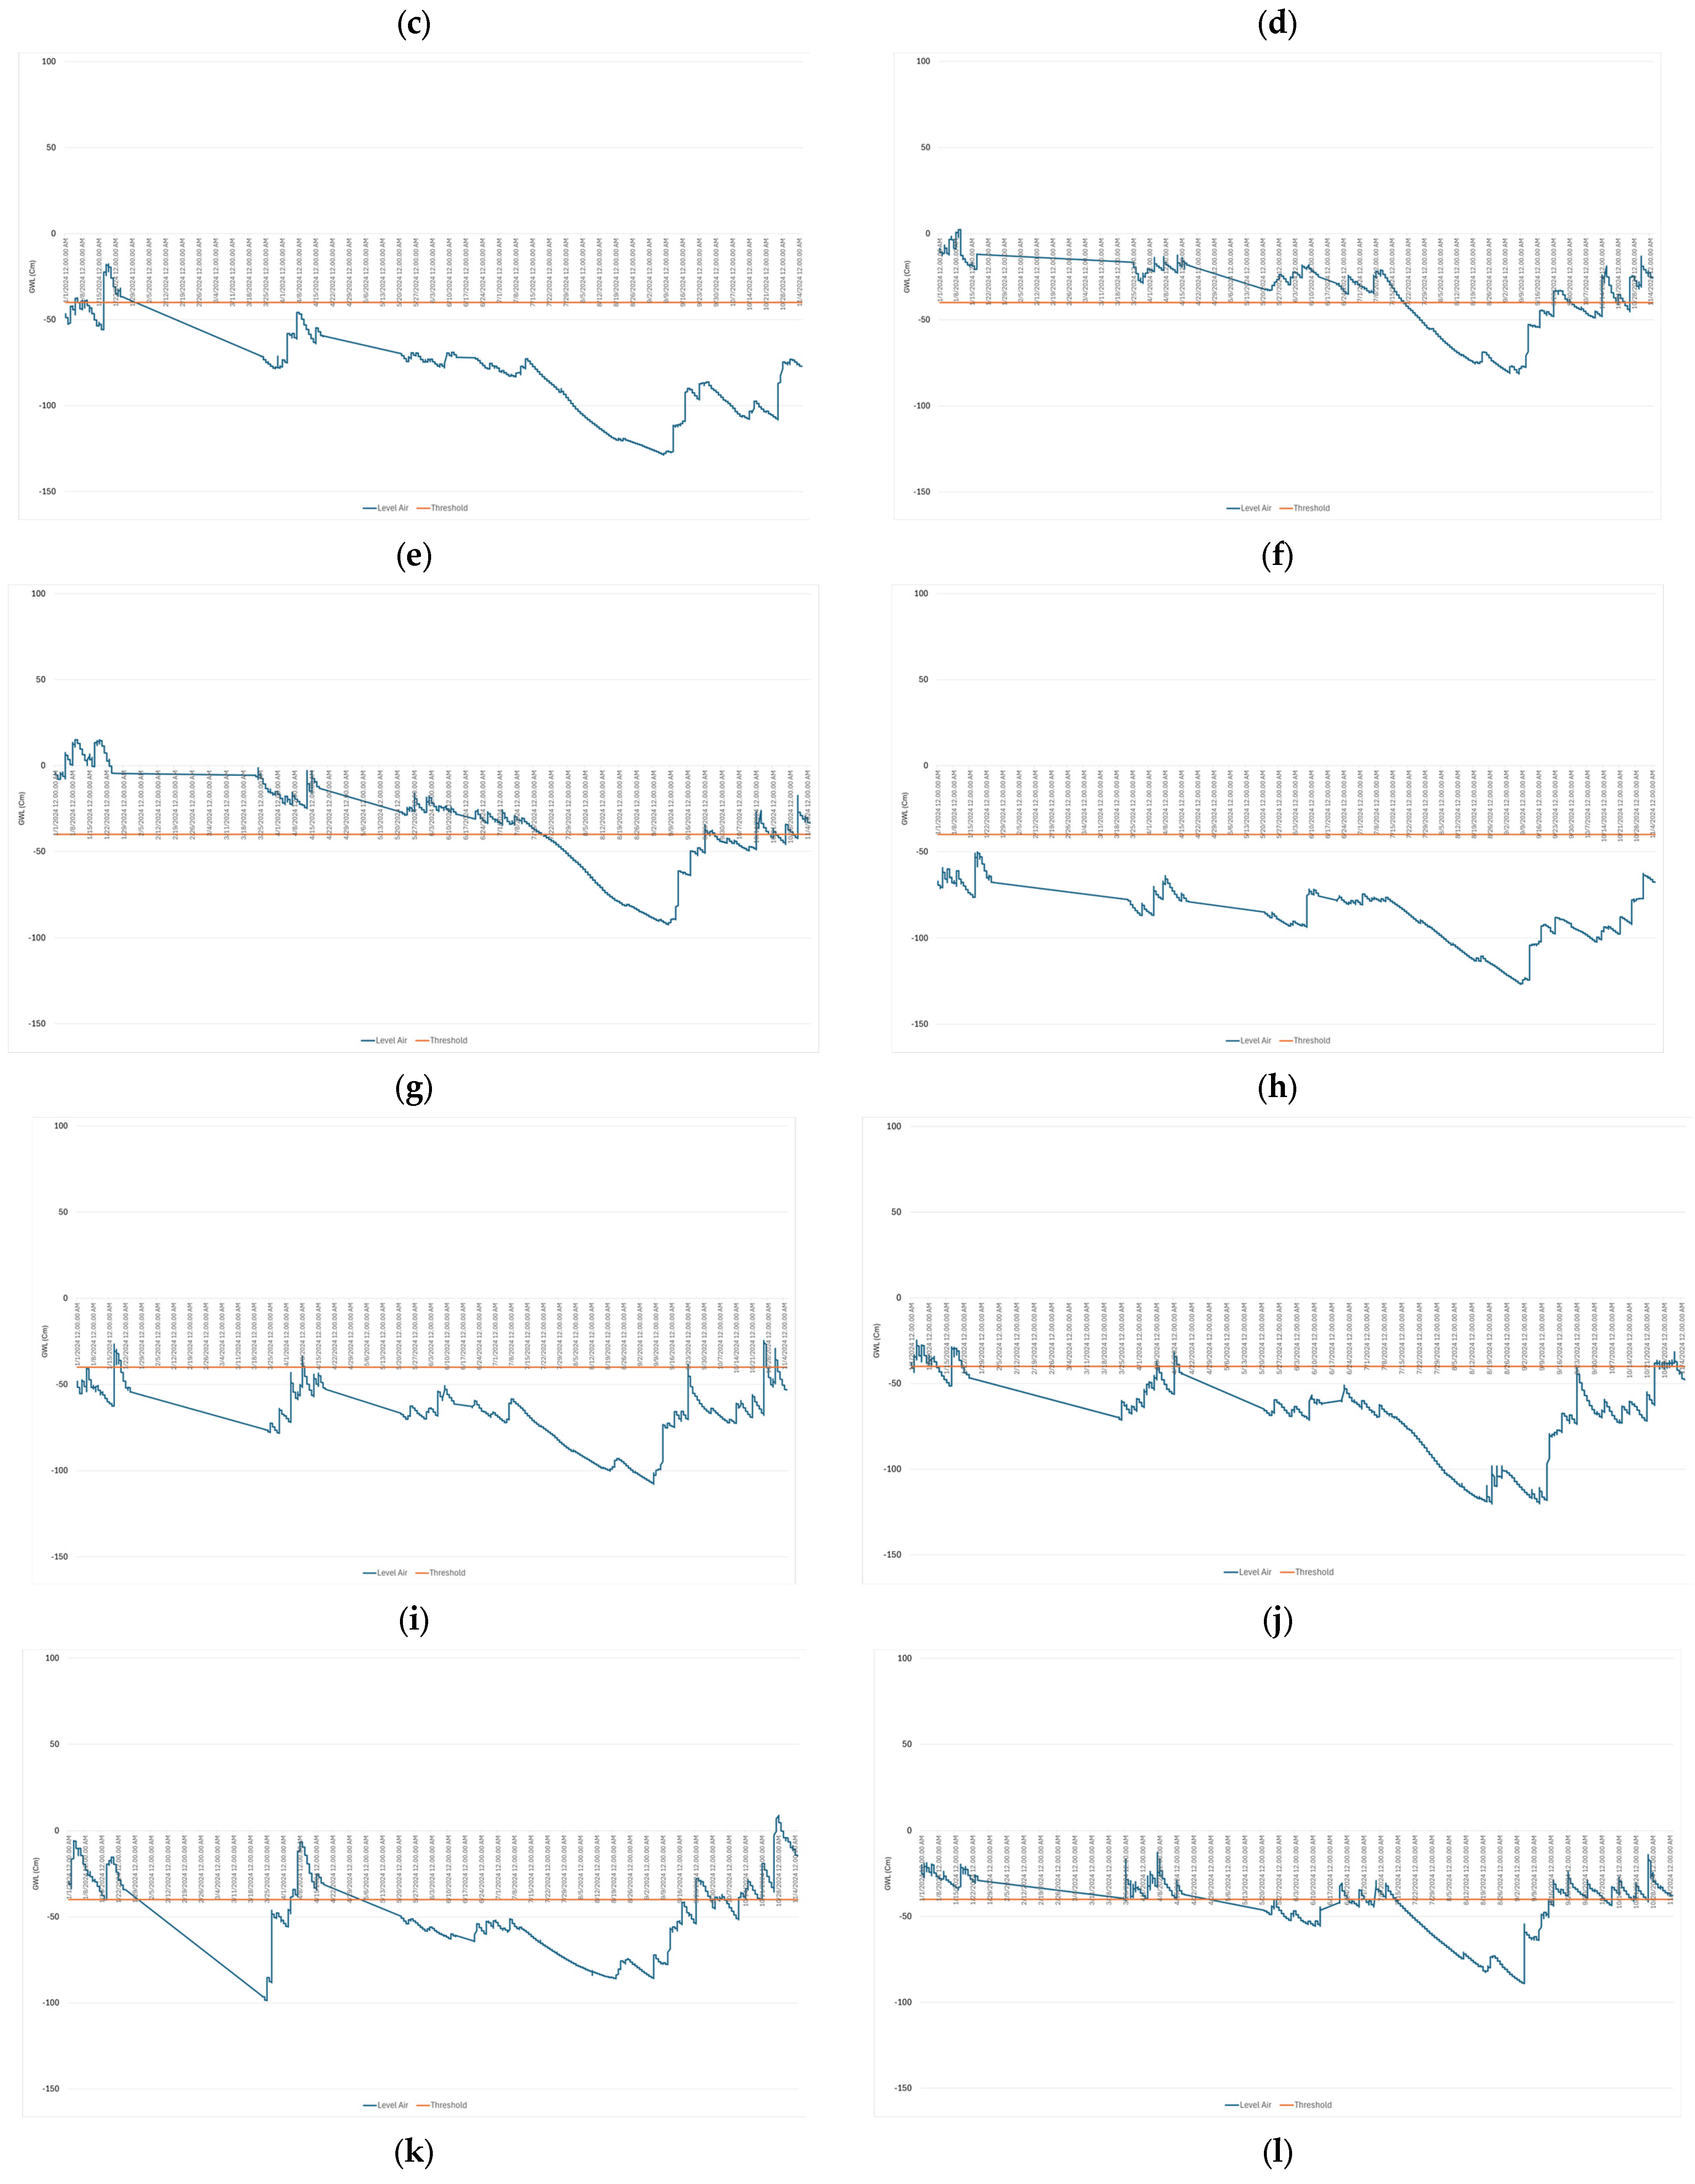
The hourly groundwater-level (GWL) time series from 12 monitoring stations were analyzed over January-December 2024 to characterize annual groundwater-level dynamics. GWL generally declined from the beginning of the year until shortly before the 2024 fire period in the Londerang Peat Protected Forest (Figure 4). For the fire-period analysis, hourly GWL, SM, and ST observations from 1 August 2024 to 31 October 2024 were divided into three phases: pre-fire (1–26 August 2024), fire (27 August 2024–9 September 2024), and post-fire (10 September 2024–31 October 2024).
Figure 4.
Annual groundwater-level dynamics from 1 January to 30 December 2024, showing the seasonal pattern and groundwater-level decline preceding the 2024 fire event. (a): Teluk dawan; (b): Rawa sari; (c): Rukam 01; (d): Rukam 02; (e): Rantau indah; (f): Koto kandis 01; (g): Koto kandis 02; (h): Jatimulyo 01; (i): Jatimulyo 02; (j): Catur rahayu 01; (k): Catur rahayu 02; (l): Catur rahayu 03.
The period from the 1st to the 4th week of January shows high groundwater level values according to the natural conditions of each station, but they have begun to decline. Some stations are still above the critical threshold of −40 cm, such as Rs, R1, R2, Kk1, Kk2, Cr1, Cr2, and Cr3. However, at stations Td, Ri, Jm1, and Jm2, the water levels have been below the initial critical threshold since the beginning of the year. The initial decline was identified starting from the 2nd week of January, with a gradually decreasing trend without full recovery to the initial water level values. The period from February to March shows a consistent decrease across all stations. Groundwater levels dropped from −40 cm to −70 cm, and up to −90 cm by the end of March. Most stations exceeded the critical threshold of −40 cm during the period from the 3rd week of February to the 1st week of March, except for R1, R2, Kk1, Kk2, and Cr3, which remained above the critical threshold until just before entering August. These conditions mark the early phase of hydrological vulnerability to wildfires.
The period from April through June showed fluctuations due to the rainy season. Some stations experienced temporary increases in range to −30 cm to −40 cm. The GWL values generally ranged from −50 cm to −80 cm. Stations with disrupted hydrological conditions showed deeper values, ranging from −70 cm to −100 cm. The period from July through early August showed the most significant decline. GWL values reached −90 cm to −120 cm at most stations, representing the minimum values. The rate of decline increased compared to the previous period. These conditions indicate intensive peat drying prior to the fires. Spatial comparisons show that stations with better land cover conditions maintained the GWL within the range of −20 cm to −60 cm and exhibited more stable fluctuations. Stations with degraded conditions showed deeper GWL values, ranging from −80 cm to −120 cm, and a slower response to GWL recovery.
3.2. Hydrological Dynamics of Peatlands Based on IoT Data
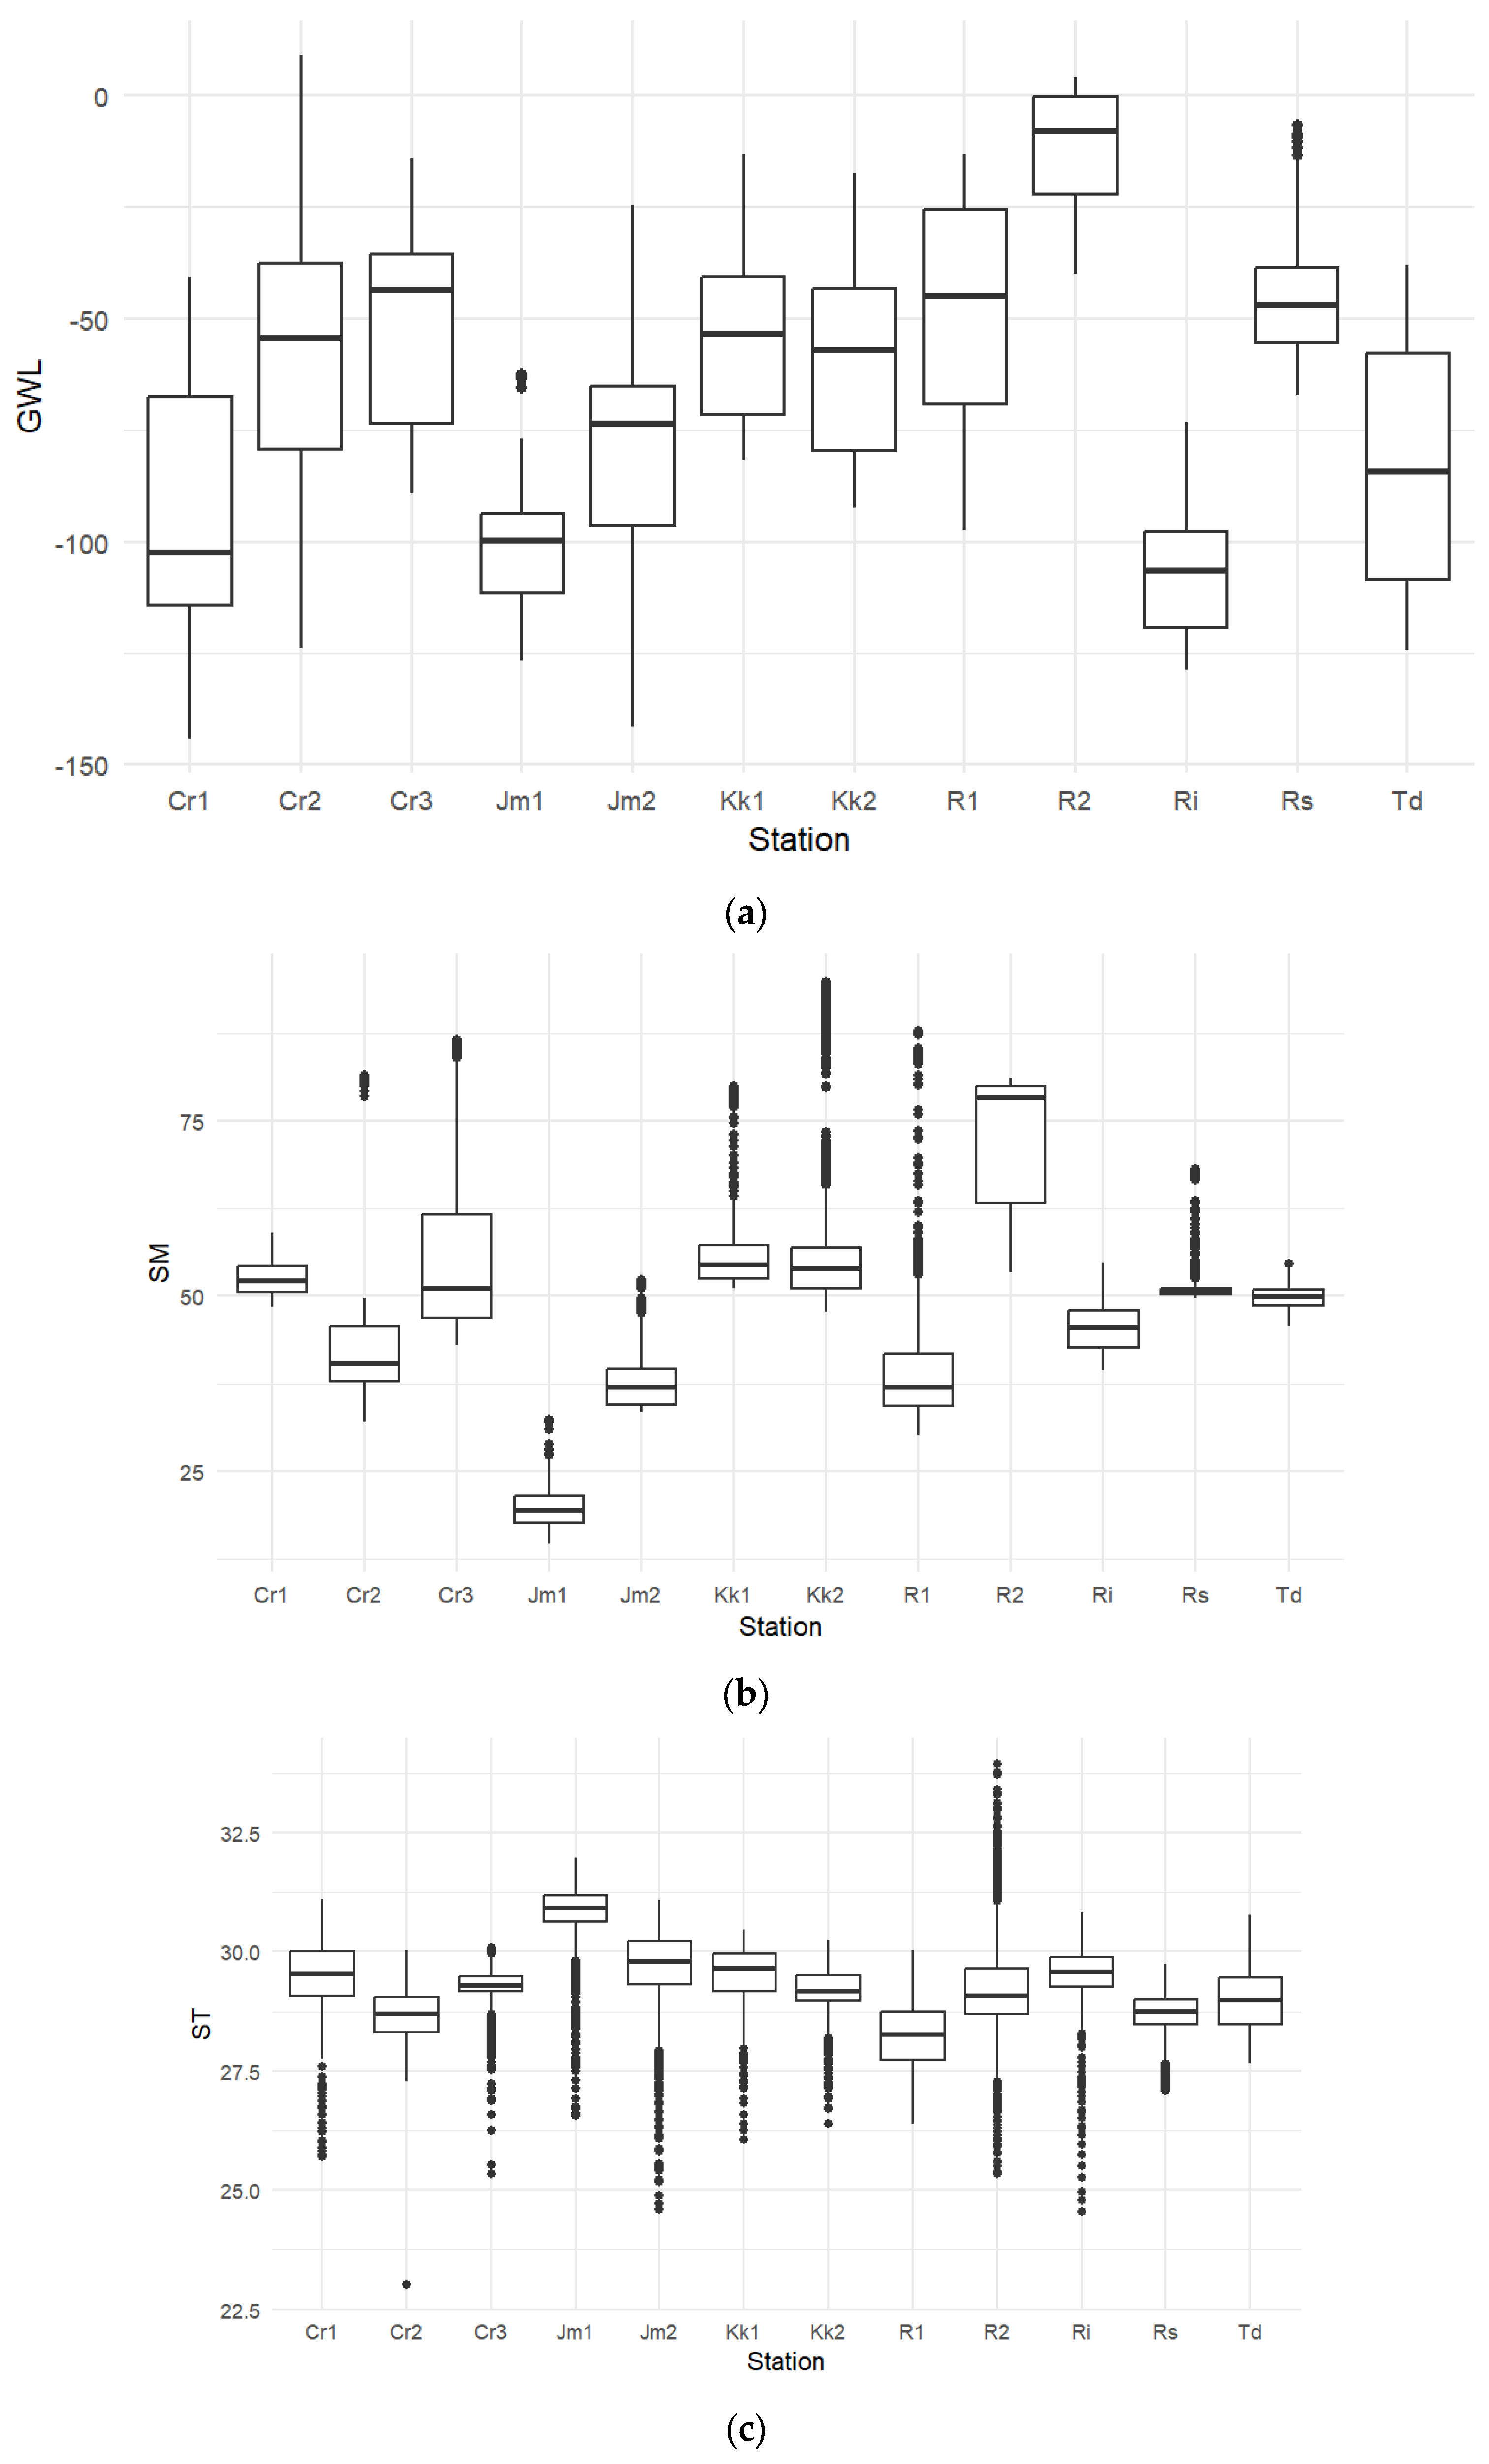
Peatland groundwater levels (GWL) across the 12 IoT stations exhibited pronounced spatial heterogeneity during the observation period, with absolute values ranging from −144.30 to 9.00 cm (Table 1). Station-level means of GWL varied from severe sub-surface drawdown at station Ri (−106.74 ± 13.70 cm, IQR = 21.52 cm) to near-surface conditions at station R2 (−11.92 ± 12.85 cm, IQR = 21.80 cm). Absolute temporal dispersion was most significant at station Td (IQR = 50.70 cm) and station Cr1 (IQR = 46.71 cm), highlighting distinct micro-hydrological regimes across the protected peatland landscape.
Table 1.
Summary statistics and non-parametric dispersion (IQR) of groundwater level (GWL), soil moisture (SM), and soil temperature (ST) across 12 monitoring stations.
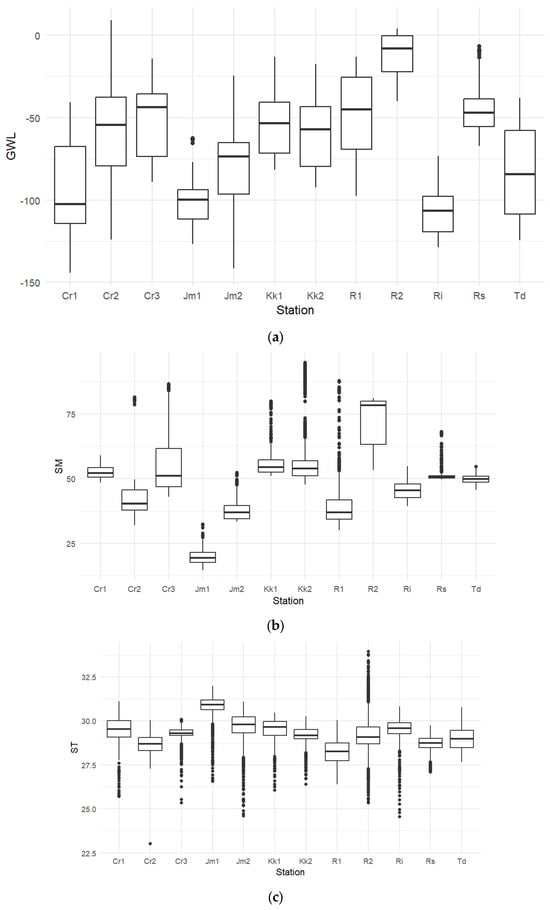
Data from Teluk Dawan (Td) showed GWL values of −124.20 to −38.10 cm, with a mean of −83.17 ± 25.13 cm, while Rawa Sari (Rs) ranged from −67.30 to −6.60 cm, with a mean of −45.89 ± 11.76 cm (IQR = 16.70 cm). Rukam 01 (R1) and Rukam 02 (R2) showed contrasting conditions, with mean GWLs of −47.63 ± 24.19 cm (IQR = 43.50 cm) and −11.92 ± 12.85 cm (IQR = 21.80 cm), respectively. SM ranged from 14.52% to 94.82%, with the lowest mean at Jm1 (19.53 ± 2.73%; IQR = 3.87%) and the highest at R2 (72.90 ± 9.40%; IQR = 16.79%). SM variability was highest at R2 and Cr3 and lowest at Rs. ST ranged from 23.01 to 33.93 °C, with mean values of 28.25 ± 0.70 °C at R1 and 30.83 ± 0.66 °C at Jm1. ST showed low variability across stations (SD < 1.10 °C; IQR = 0.31–0.99 °C), indicating relatively stable thermal conditions. These spatial differences are shown in Figure 5.
Figure 5.
Distribution of groundwater levels, soil moisture, and soil temperature at 12 monitoring stations: (a) Groundwater level; (b) Soil Moisture; (c) Soil Temperature. Note: GWL: Groundwater level; SM: Soil moisture; ST: Soil temperature; Td: Teluk dawan; Rs: Rawa sari; R1: Rukam 01; R2: Rukam 02; Ri: Rantau indah; Kk1: Koto kandis 01; Kk2: Koto kandis 02; Jm1: Jatimulyo 01; Jm2: Jatimulyo 02; Cr1: Catur rahayu 01; Cr2: Catur rahayu 02; Cr3: Catur rahayu 03.
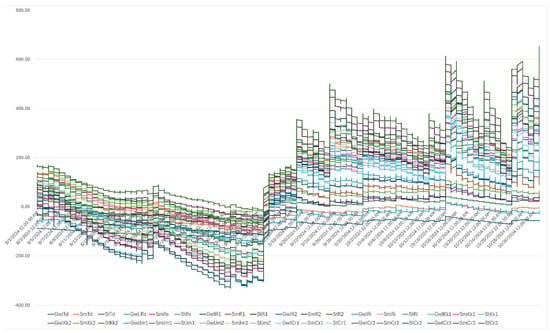
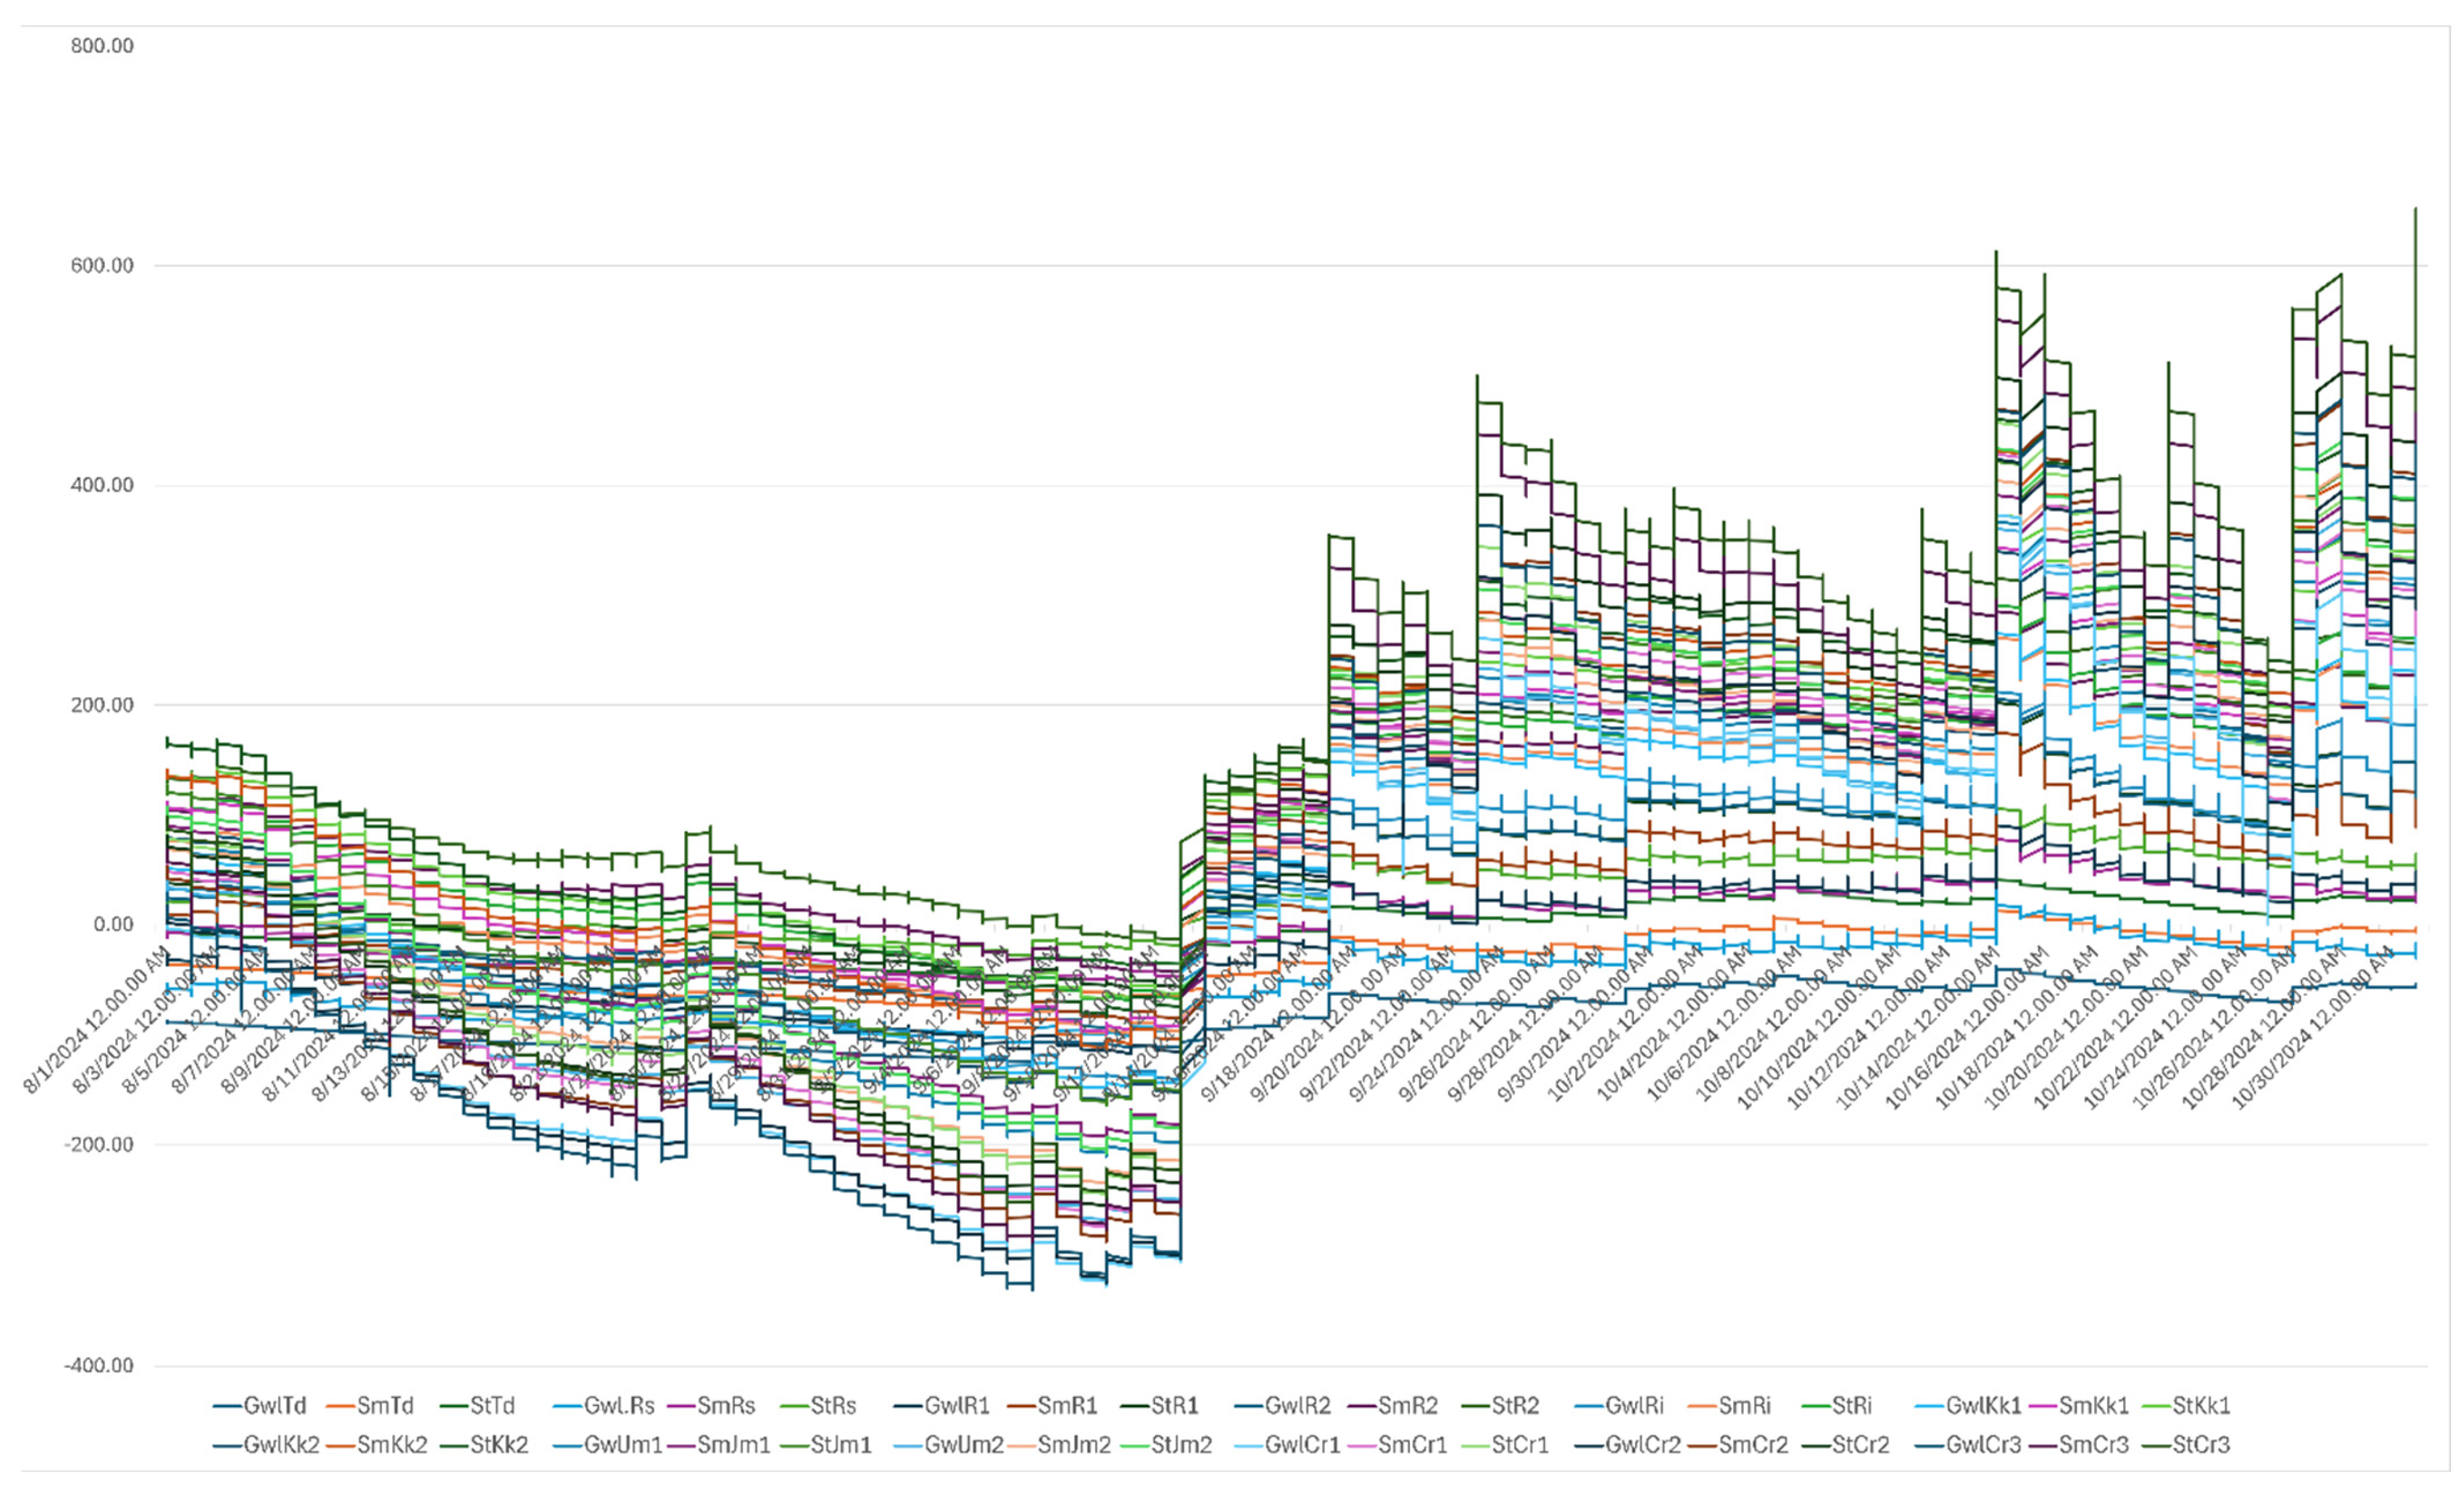
The results of this study are consistent with previous studies showing that the groundwater level depth in tropical peatlands exhibits high spatial variability due to differences in topography, drainage, and hydrological connectivity [14]. GWL ranges as deep as <−100 cm at some stations indicate peat conditions experiencing intensive drainage or drying, which in previous studies have been associated with a significant increase in fire risk [41]. Relatively shallow GWL values at stations such as R2 reflect more saturated and stable hydrological conditions, which help reduce vulnerability to drying. High soil moisture variability (>20%) is also consistent with previous studies indicating that peat soil moisture is highly responsive to fluctuations in groundwater levels and rainfall and serves as a direct indicator of dry fuel availability [38,42]. Conversely, the low variability in soil temperature (<5%) reinforces the finding that this parameter serves as a supporting factor modulating the drying process, rather than as the primary determinant of fire risk [15]. These high-frequency hydrological micro-dynamics across the 12 monitoring stations are illustrated in Figure 6, showing temporal variations in groundwater level (GWL), soil moisture (SM), and soil temperature (ST) from August to October 2024.
Figure 6.
High-frequency hydrological micro-dynamics across 12 IoT stations. Note: GWL: Groundwater level; SM: Soil moisture; ST: Soil temperature; Td: Teluk dawan; Rs: Rawa sari; R1: Rukam 01; R2: Rukam 02; Ri: Rantau indah; Kk1: Koto kandis 01; Kk2: Koto kandis 02; Jm1: Jatimulyo 01; Jm2: Jatimulyo 02; Cr1: Catur rahayu 01; Cr2: Catur rahayu 02; Cr3: Catur rahayu 03, illustrating groundwater level (GWL), soil moisture (SM), and soil temperature (ST) from August to October 2024. Due to the high temporal resolution and the overlapping multi-station time series, this figure emphasizes overall temporal patterns rather than the readability of individual stations. A consistent pattern is observed across all stations, characterized by a pronounced decline in GWL prior to the peak fire period (late August to early September), followed by a gradual recovery during the post-fire phase. Variations among stations reflect site-specific hydrological conditions; however, they exhibit similar temporal trajectories.
Following the descriptive analysis, the Shapiro–Wilk test (Appendix Table A1) showed non-normal distributions for all 36 station-level variables (p < 1 × 10⁻⁷ to p < 1 × 10−62), with W = 0.484–0.993. Levene’s test (Appendix Table A2) indicated heterogeneous variances among stations for GWL, SM, and ST (p < 0.001; F = 597.36, 392.52, and 210.87, respectively). These tests characterized the distribution and variance properties and were not used to select nonparametric tests because the hourly observations involved repeated measurements and temporal dependence.
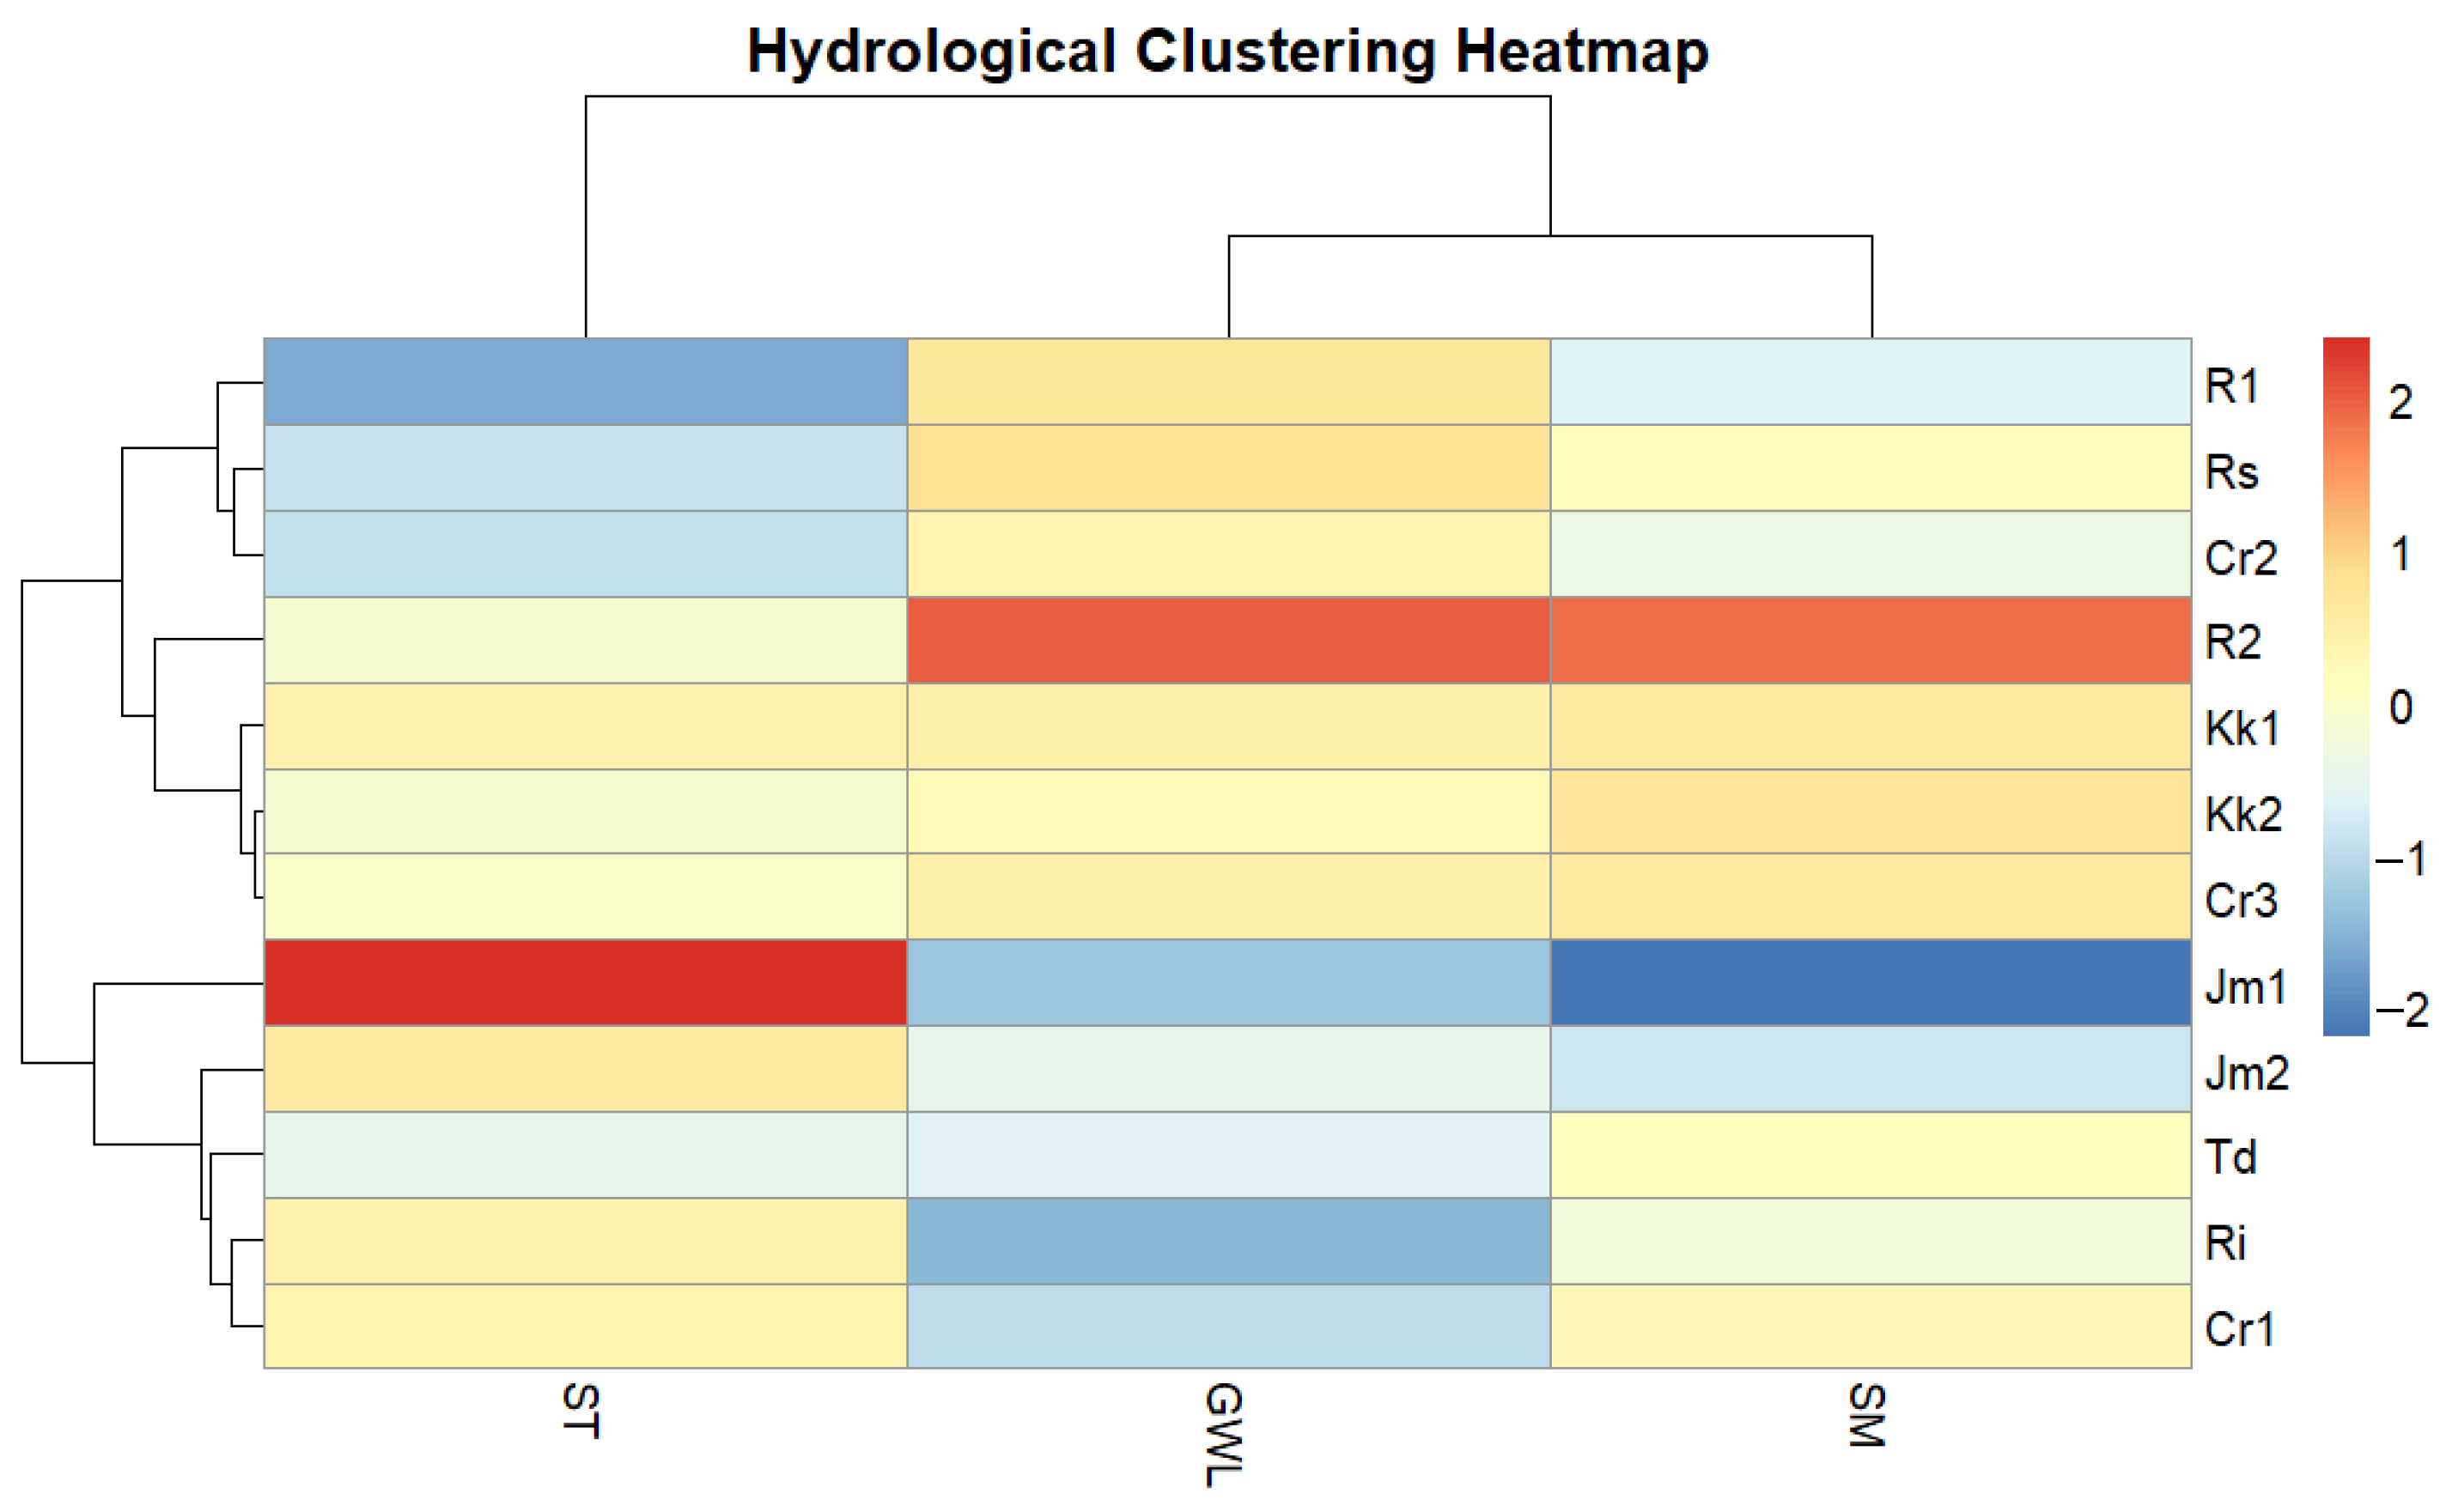
Hierarchical cluster analysis using Ward’s method and Euclidean distance was then applied to characterize station similarities based on GWL, SM, and ST [43]. The heatmap (Figure 7) identified three groups: Cr1, Ri, Jm2, and Td with intermediate hydrological conditions; R1, Rs, Cr2, R2, Kk1, Kk2, and Cr3 with generally higher SM and shallower GWL; and Jm1 with lower SM, deeper GWL, and higher ST. The clustering described spatial similarity among stations rather than statistical differences between groups.
Figure 7.
Heatmap of hydrological station clusters based on GWL, SM, and ST parameters.
To account for temporal autocorrelation and repeated observations across monitoring stations, a linear mixed-effects model (LMM) was fitted, with the full statistical results summarized in Table 2.
Table 2.
Results of the linear mixed-effects model (LMM) with an AR (1) temporal autocorrelation structure predicting groundwater levels (GWL) from soil moisture (SM) and soil temperature (ST) among IoT monitoring stations.
The results showed that both soil moisture (SM) and soil temperature (ST) were significantly associated with groundwater levels (p < 0.001). Groundwater levels increased with increasing soil moisture (β = 0.460), whereas higher soil temperature was associated with lower groundwater levels (β = −0.516). To evaluate differences among the predefined fire-related phases while accounting for repeated measurements and temporal autocorrelation, separate linear mixed-effects models were fitted for GWL, SM, and ST, with monitoring station included as a random intercept and an AR(1) correlation structure. Phase had a significant effect on GWL (F2,26,482 = 247.93, p < 0.001), SM (F2,26,482 = 292.04, p < 0.001), and ST (F2,26,482 = 597.13, p < 0.001). Estimated marginal means showed that GWL was −77.6 cm (95% CI: −95.0 to −60.2) during the pre-fire phase, −75.0 cm (95% CI: −92.4 to −57.6) during the fire phase, and −57.5 cm (95% CI: −74.9 to −40.2) during the post-fire phase. Holm-adjusted pairwise comparisons indicated significant differences among all phases, including pre-fire versus fire (Δ = −2.66 cm, p = 0.006), pre-fire versus post-fire (Δ = −20.08 cm, p < 0.001), and fire versus post-fire (Δ = −17.42 cm, p < 0.001). For SM, the estimated marginal means were 45.6% (95% CI: 37.2–54.0), 43.6% (95% CI: 35.2–52.0), and 51.5% (95% CI: 43.2–59.9) for the pre-fire, fire, and post-fire phases, respectively. All pairwise comparisons were significant after Holm adjustment (p < 0.001). ST showed estimated marginal means of 29.4 °C (95% CI: 28.9–29.8), 29.7 °C (95% CI: 29.3–30.1), and 29.1 °C (95% CI: 28.7–29.6) for the pre-fire, fire, and post-fire phases, respectively, with all pairwise comparisons also significant after Holm adjustment (p < 0.001).
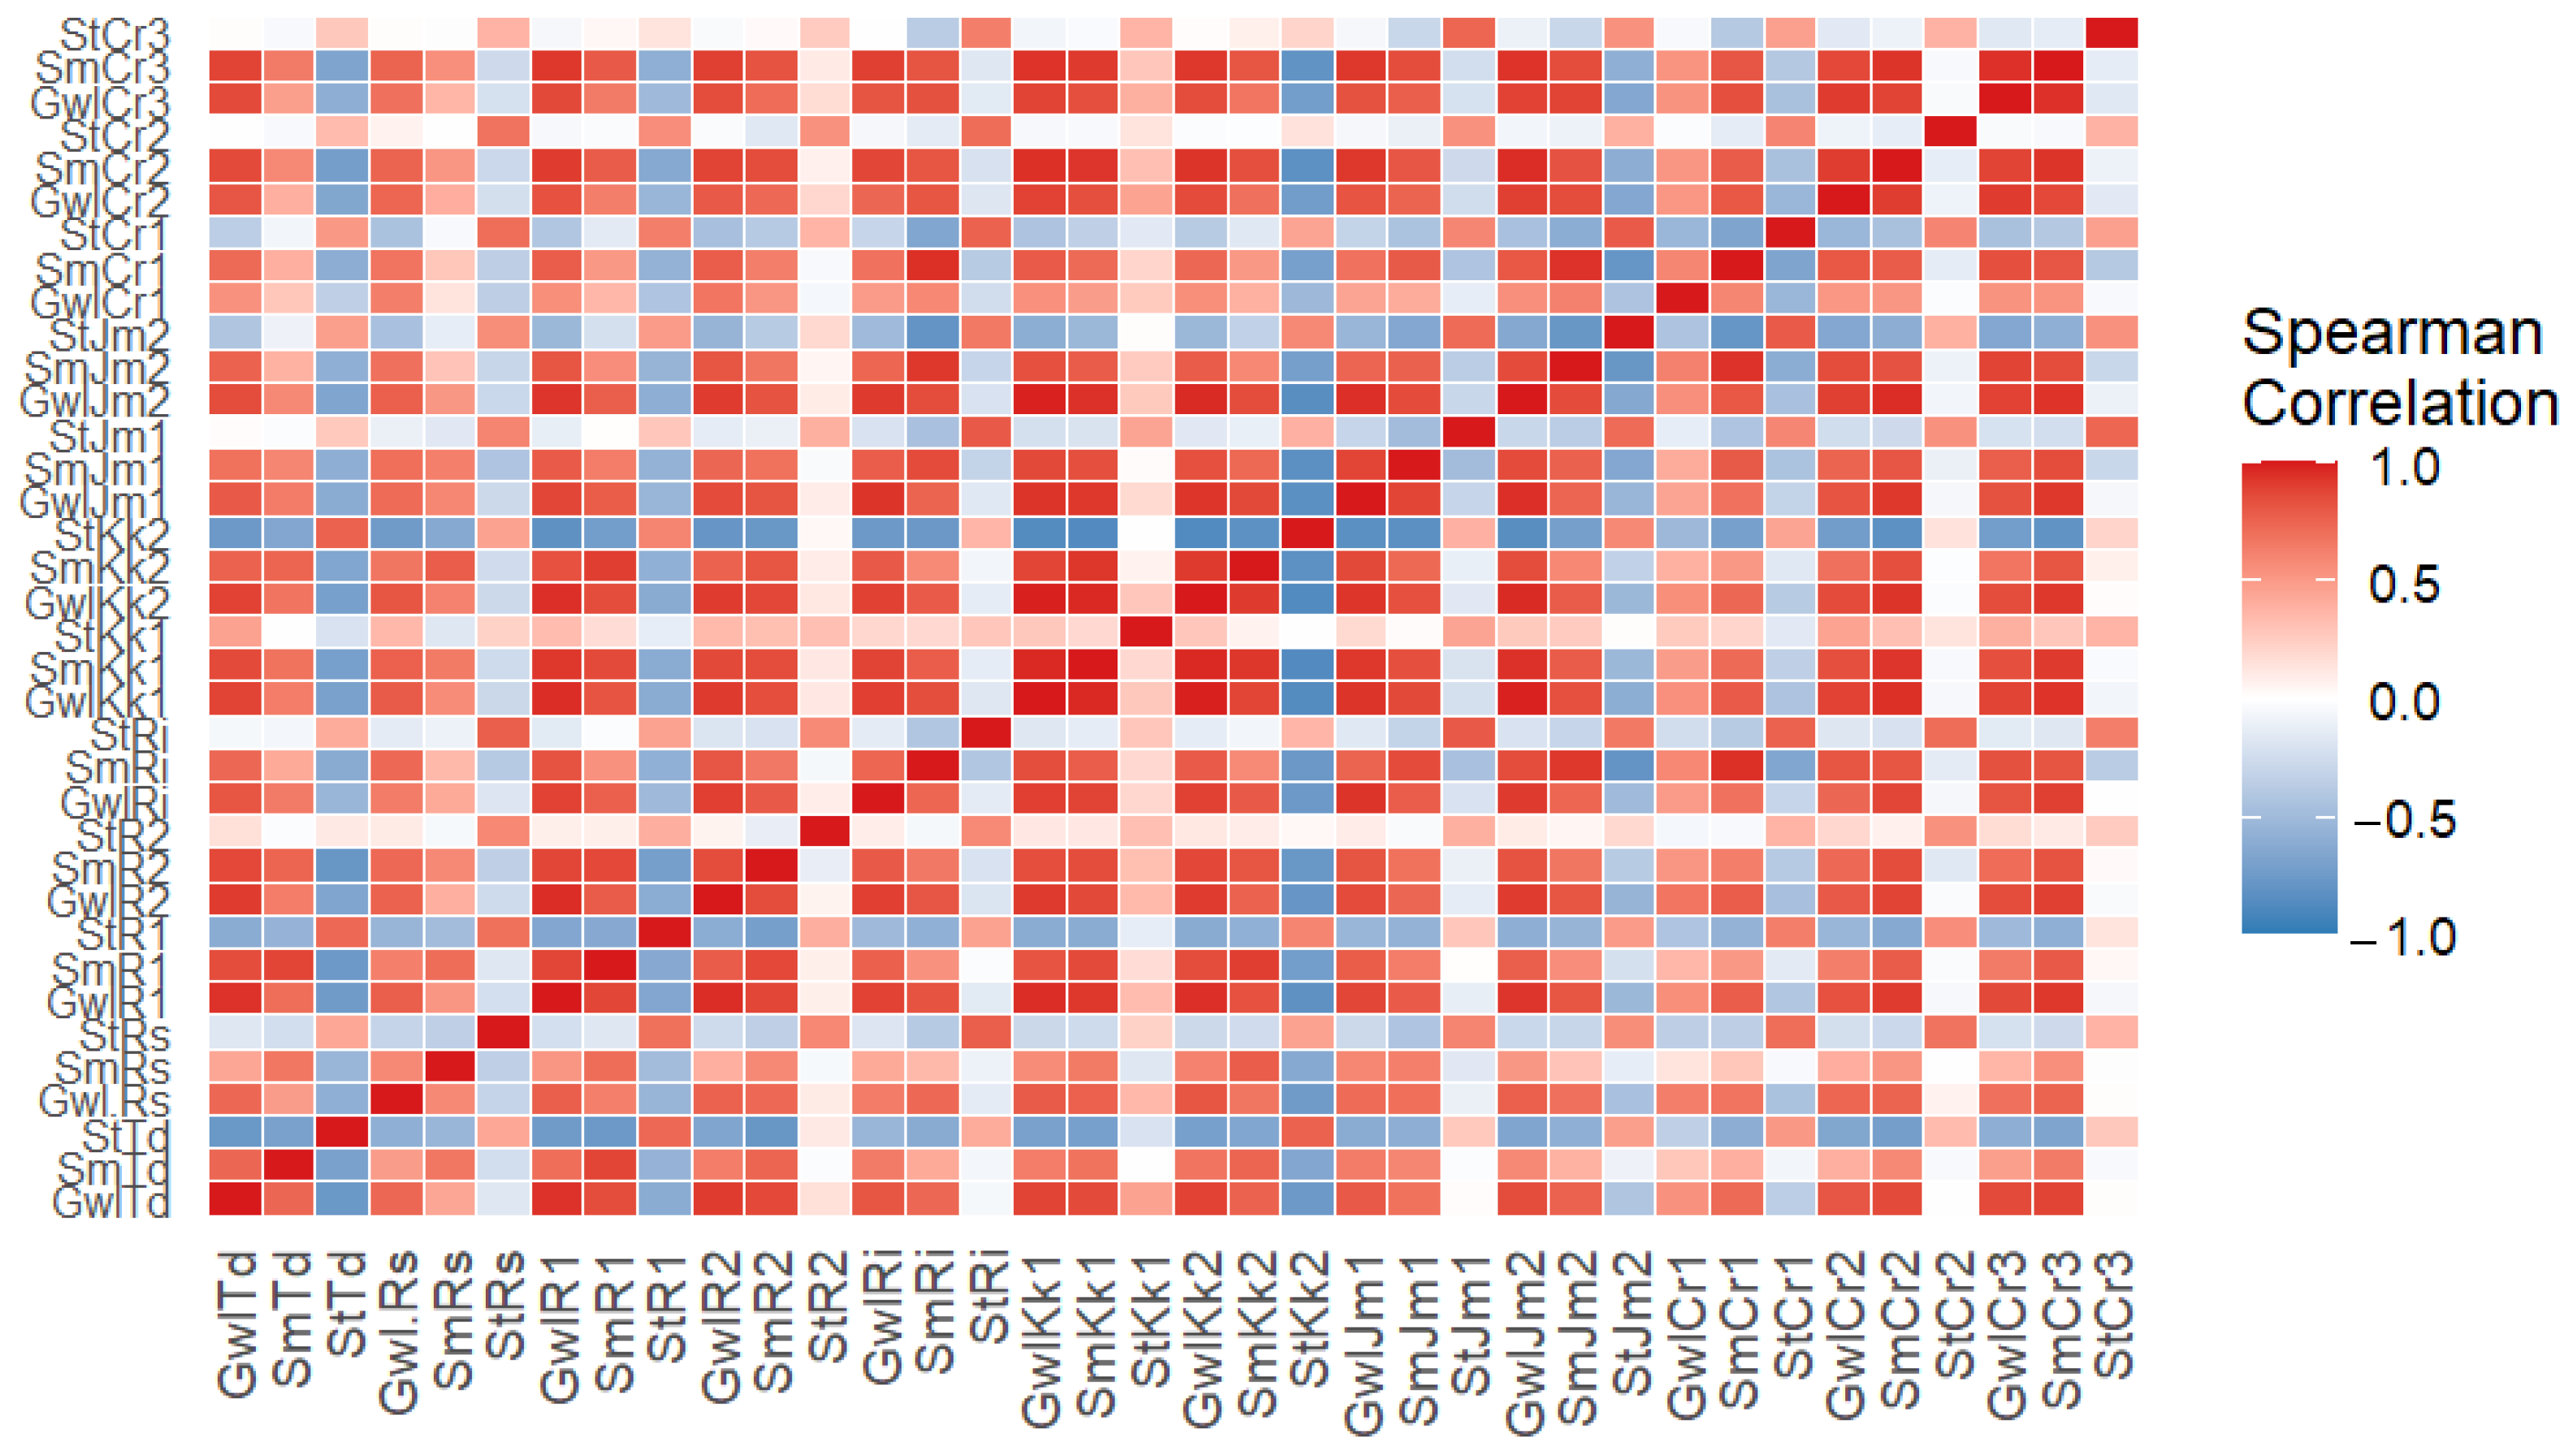
Next, a correlation analysis was conducted using Spearman’s method, which reveals nonparametric relationships among variables. The correlation results indicate that most relationships among the parameters are moderate to strong (|ρ| > 0.4 to > 0.7) (Figure 8).
Figure 8.
Results of Spearman correlation test of groundwater level, soil moisture, and soil temperature parameters on data from 12 IoT stations. Note: GWL: Groundwater level; SM: Soil moisture; ST: Soil temperature; Td: Teluk dawan; Rs: Rawa sari; R1: Rukam 01; R2: Rukam 02; Ri: Rantau indah; Kk1: Koto kandis 01; Kk2: Koto kandis 02; Jm1: Jatimulyo 01; Jm2: Jatimulyo 02; Cr1: Catur rahayu 01; Cr2: Catur rahayu 02; Cr3: Catur rahayu 03.
Spearman correlation coefficients ranged from −0.816 to 0.984, indicating strong positive and negative relationships among the hydrological variables. GWL showed strong correlations among stations, indicating similar groundwater dynamics across locations [38]. SM also showed strong inter-station correlations, suggesting relatively homogeneous moisture conditions, consistent with previous studies reporting ρ = 0.65–0.90 and indicating greater regional than local influence when ρ > 0.85. SM and ST generally showed negative correlations (ρ = −0.65 to −0.78), indicating that wetter conditions were associated with lower soil temperatures. Some variable pairs showed weak or negligible correlations (|ρ| < 0.20). Overall, GWL and SM were strongly positively correlated (ρ = 0.73–0.98), whereas SM and ST were negatively correlated, consistent with the role of water availability in regulating peat thermal conditions.
3.3. Number and Distribution of Hotspots and Rainfall
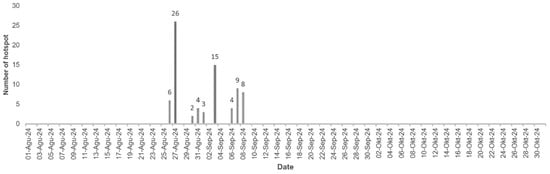
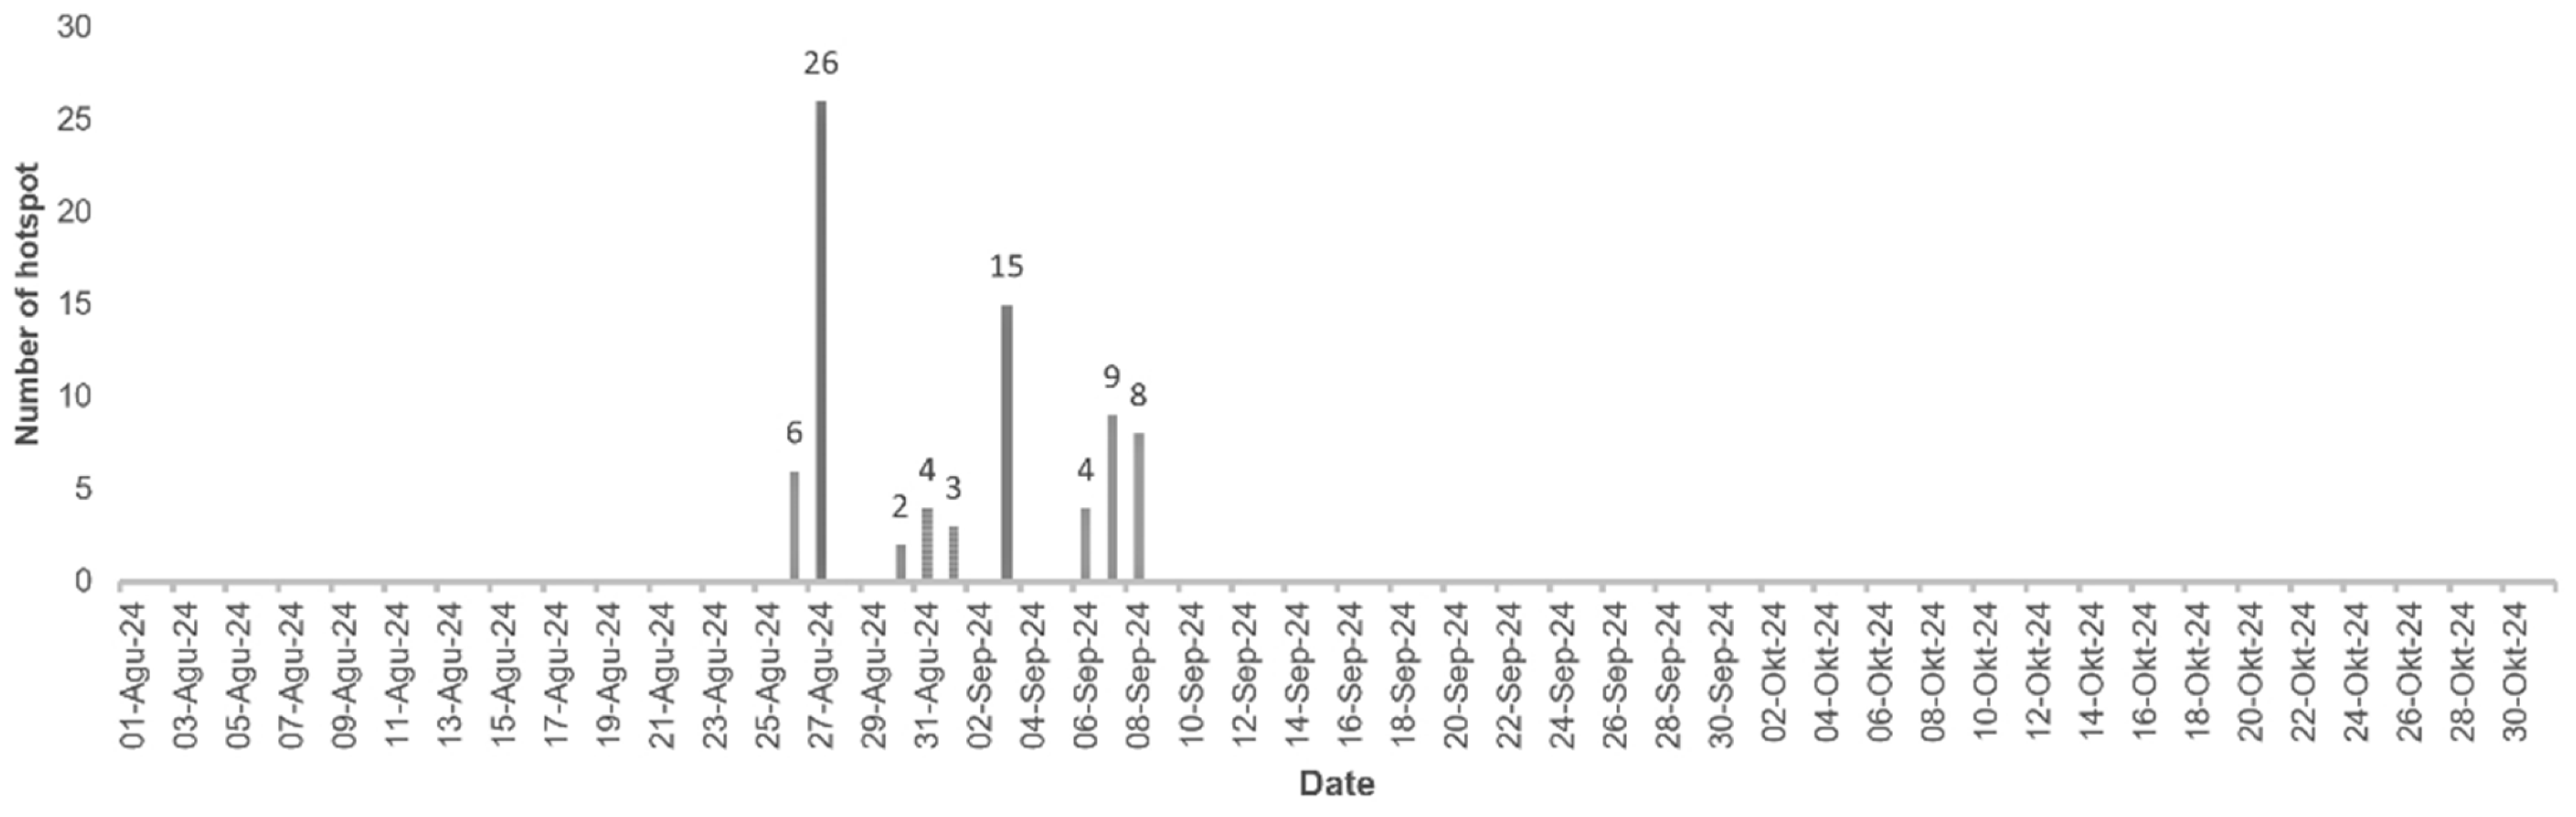
The number of hotspots detected during the observation period in 2024 (August–October) reached approximately 77 hotspots, with an uneven temporal distribution and concentrated during certain periods. Specifically, more than 90% of the hotspots (±71 points) occurred between 27 August and 9 September 2024, indicating a critical fire phase in the peat hydrology system (Figure 9).
Figure 9.
Temporal distribution of hotspots August–October 2024.
The quantitative distribution of rainfall across the twelve monitoring stations during the distinct fire event phases is summarized in Table 3, showing substantial spatial and temporal variability in rainfall across all monitoring stations throughout the 2024 fire episode. Precipitation was severely restricted during the pre-fire and fire phases, with stations such as Ri and Kk02 recording near-zero totals (12.2 mm and 2.4 mm overall, respectively), reflecting prolonged dry conditions that induced hydrological drawdown.
Table 3.
Summary of accumulated daily rainfall (mm) across 12 IoT stations during different fire event phases in 2024.
Conversely, the post-fire phase recorded substantially higher accumulated rainfall than the pre-fire and fire phases, with high daily means and maximum daily rainfall, particularly at station CR02, which recorded a maximum daily rainfall of 206.2 mm and a total accumulated rainfall of 963.2 mm over the 92-day observation period. Overall, accumulated rainfall varied widely among stations, ranging from 2.4 mm at RI to 963.2 mm at CR02, with CR01 also exceeding 800 mm (809.4 mm). The increased rainfall during the post-fire phase coincided with the subsequent regional groundwater-level recovery.
The temporal distribution of groundwater levels showed similar patterns across stations but differed in magnitude. All stations exhibited groundwater-level declines during the period preceding and during the major fire phase in the Londerang Peat Protected Forest. Initial groundwater-level declines were observed before the fire on 14, 20, and 22 August 2024, followed by further declines during the major fire phase. The largest groundwater-level declines across the 12 stations occurred on 5, 7, 8, and 11 September 2024. The groundwater-level dynamics at the 12 IoT stations are presented in Table 4.
Table 4.
Groundwater level declined in values before, during, and after the major Londerang Fire.
Based on Figure 9, in the phase before the major fire in the Londerang Peat Protection Forest (1–26 August 2024), the number of detected hotspots was still very low, namely fewer than 10 points, with occurrences being 6 hotspots on 25 August 2024, and no significant accumulation on previous days. This condition indicates that although groundwater levels (GWLs) have declined, the hydrological system remains in a semi-stable state and has not yet triggered a large-scale fire. The low number of hotspots (<10 points) suggests that the critical peat drought threshold has not yet been fully surpassed. During the major fire phase in HLG Londerang (27 August–9 September 2024), there was a very significant surge in hotspots, peaking at 26 on 27 August 2024, the highest value during the observation period. In addition, increases were observed on the following days: 15 hotspots on 4 September 2024; 9 hotspots on 6 September 2024; and 8 hotspots on 7 September 2024. The accumulation of hotspots during this period exceeded 71 points, clearly indicating an active fire period. This surge occurred simultaneously with extreme hydrological conditions, with the groundwater level (GWL) reaching its annual lowest point (deeper than −50 cm up to nearly −100 cm at several stations).
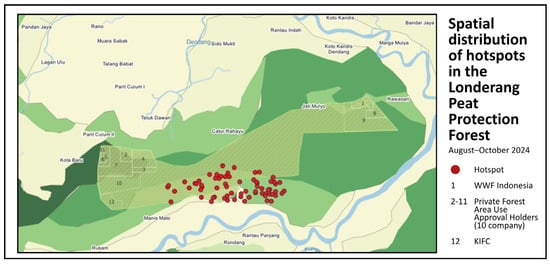
The drastic increase in hotspots (>20 points/day) coincided with groundwater levels below the −40 cm critical threshold, indicating drier peatland conditions associated with increased fire occurrence. In the post-fire phase (10 September–31 October 2024), the number of hotspots dropped sharply to nearly 0, with no significant spikes as observed in the previous phase. This decline coincided with a renewed rise in groundwater levels and the onset of the early rainy season in October. These conditions indicate a recovery of the hydrological system, in which the increase in GWL contributes to a reduction in fire risk. The hotspot dynamics in 2024 showed a very strong pattern in response to changes in peat hydrology microdynamics, where the gradual GWL decline phase (pre-fire) was followed by a critical threshold phase (fire peak with up to 26 hotspots/day) and then a recovery phase (0 hotspots). Spatially, the hotspots were scattered in the middle of the Londerang peat swamp forest area as presented in Figure 10.
Figure 10.
Spatial distribution of hotspots in the Londerang Peat Protection Forest (August–October 2024).
3.4. Hydrological and Fire Dynamics
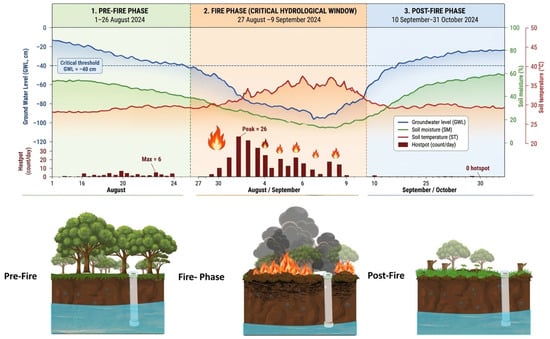
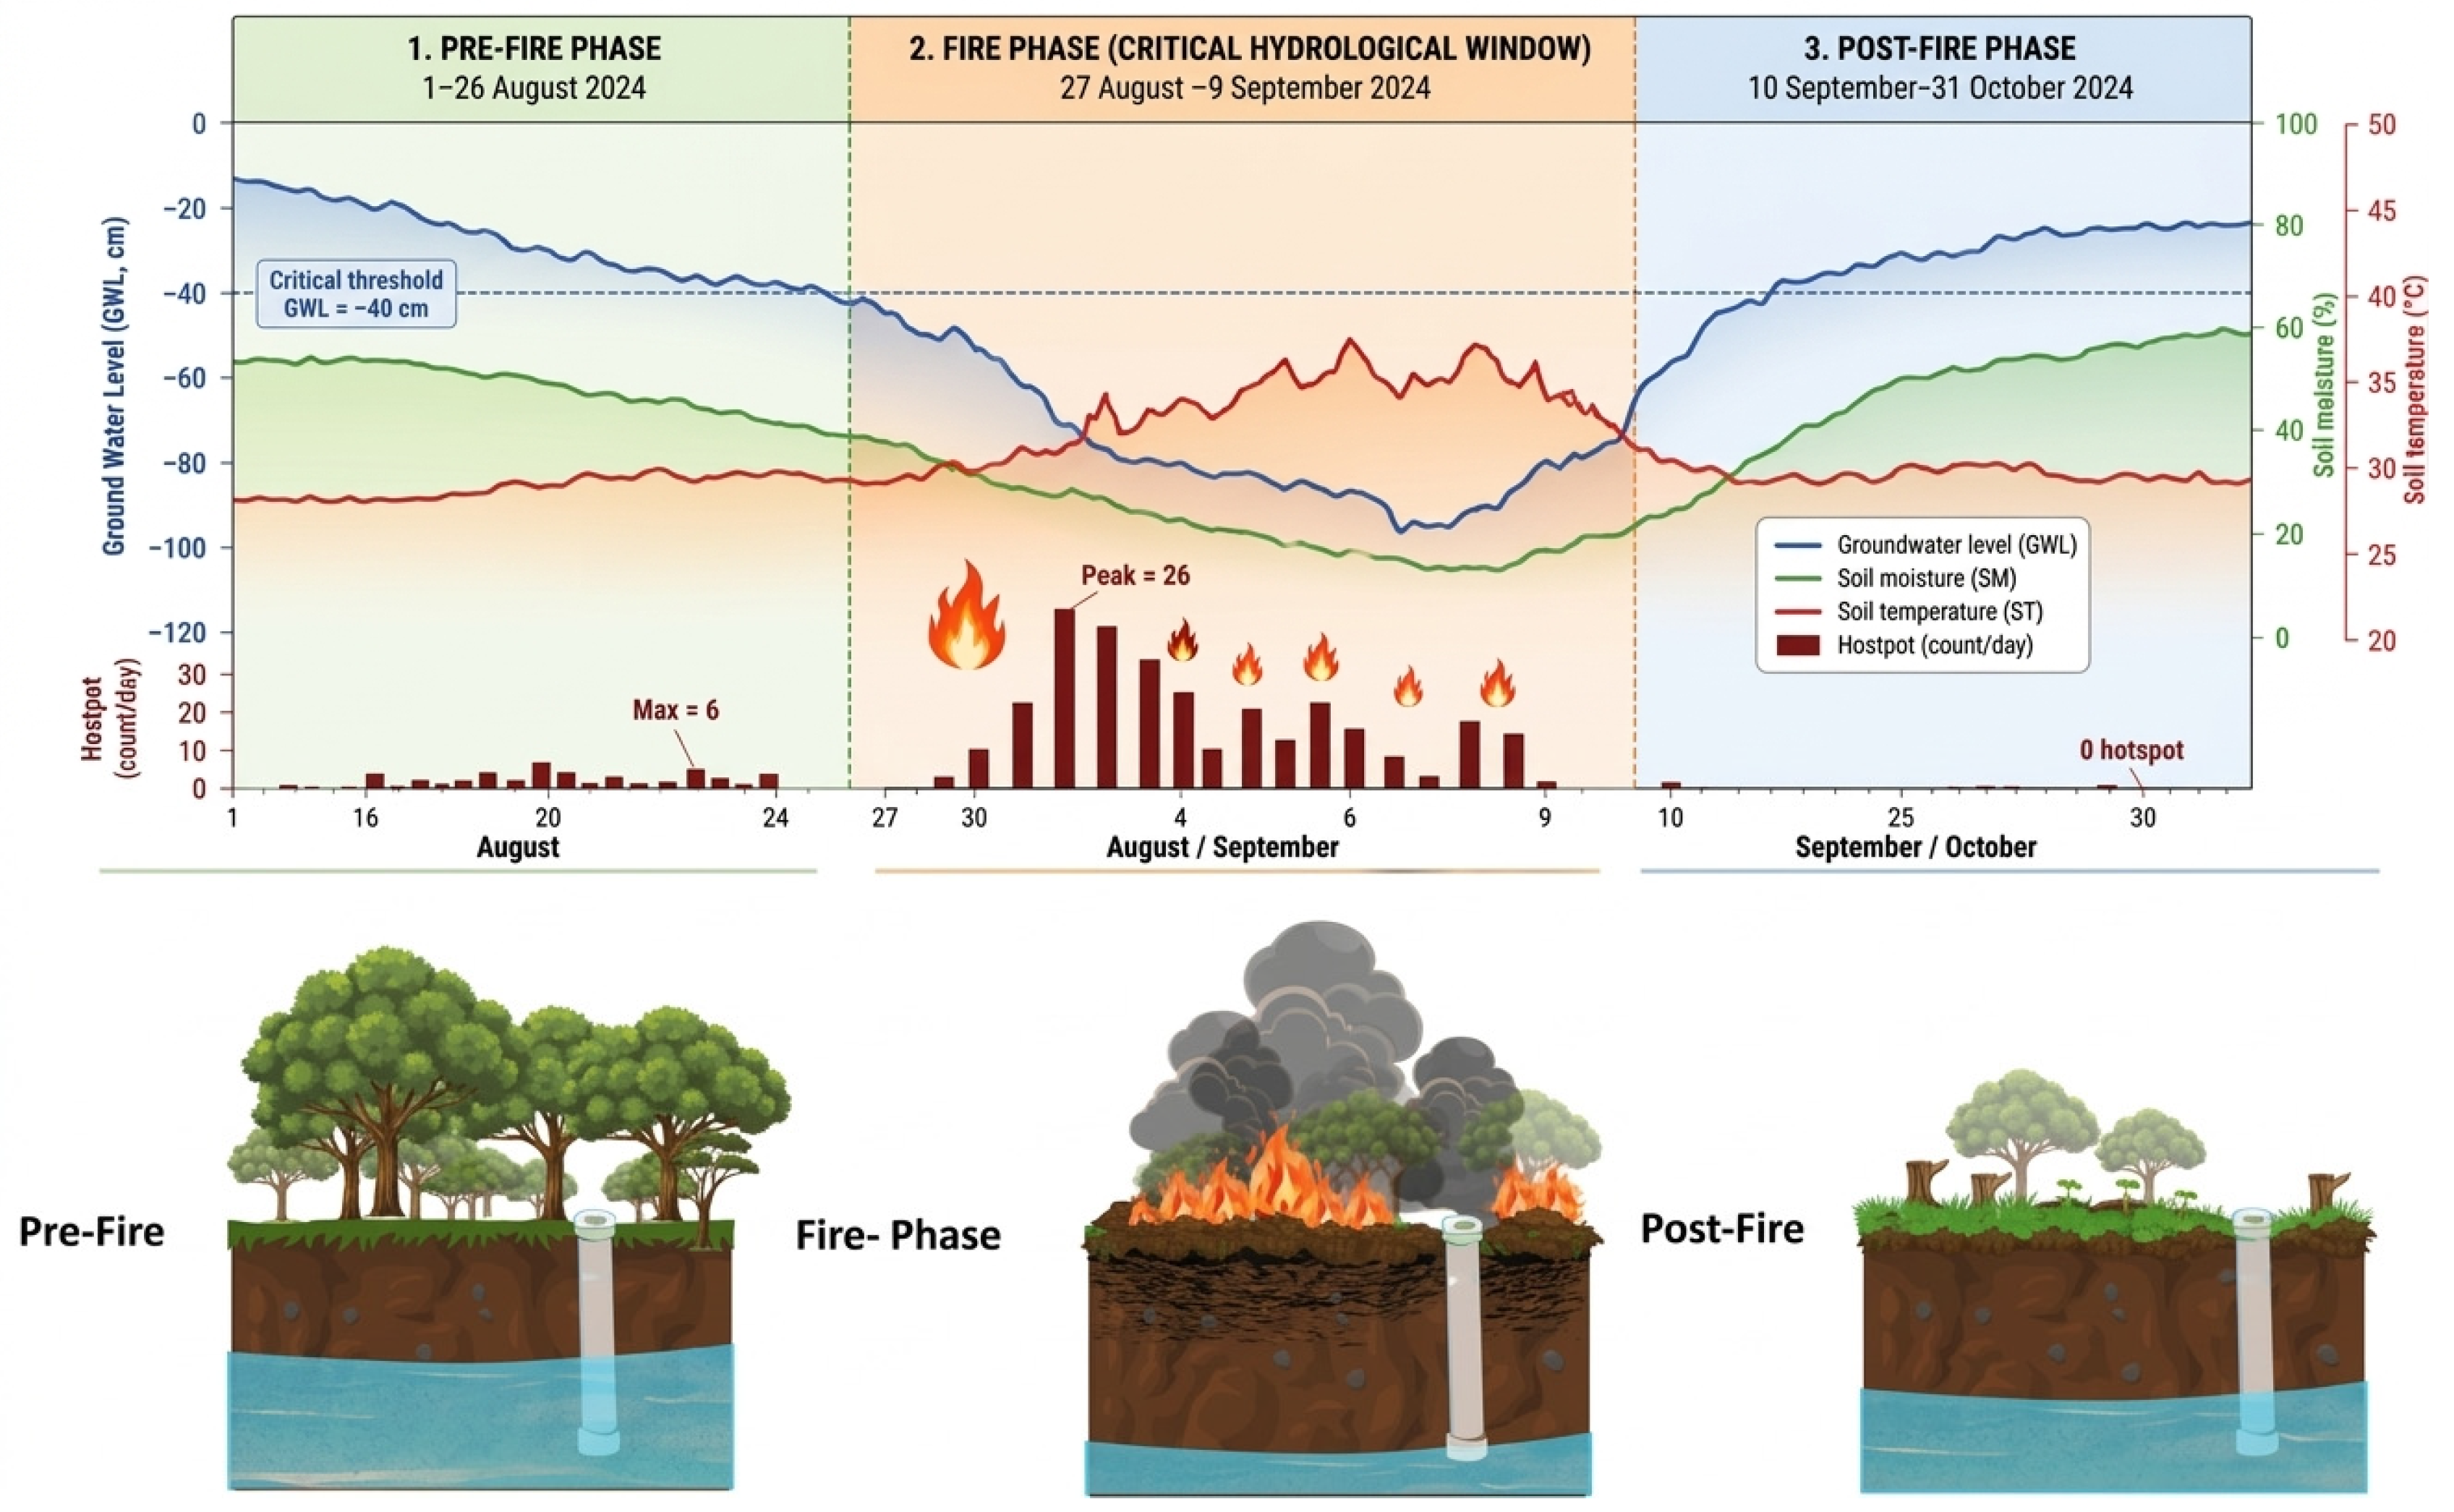
The fire phase was identified from SIPONGI hotspot observations filtered at a confidence level of ≥80%, corresponding to the high-confidence category, and subsequently validated against SIPP records documenting fire occurrence and ongoing suppression activities during the same period. Based on this combined evidence, 27 August–9 September 2024 was defined as the fire phase. More than 90% of the recorded hotspot detections occurred during this period, while substantially fewer detections were recorded before and after it. The hydrological observations were subsequently examined to characterize the conditions across the pre-fire, fire, and post-fire phases (Figure 11).
Figure 11.
Peat hydrological microdynamics in relation to the validated fire phase and hotspot detections.
The monitoring data showed substantial spatial variation in GWL among stations, with mean values ranging from −11.92 cm at R2 to −106.74 cm at Ri; Jm1 also showed a deep mean GWL of −101.86 cm. The −40 cm groundwater-level threshold was used as an established regulatory and literature-based reference, consistent with Government Regulation No. 57 of 2016, amending Government Regulation No. 71 of 2014, and supported by previous studies rather than derived from this study. The proportions of observations below −40 cm were 91.59% during the pre-fire phase, 91.67% during the fire phase, and 63.05% during the post-fire phase. Figure 11. Peat hydrological microdynamics in relation to the validated fire phase and hotspot detections.
3.4.1. Pre-Fire Phase: Gradual Groundwater-Level Decline (1–26 August 2024)
During the pre-fire phase, GWL decreased over time, with a mean start-to-end change of −13.73 cm across stations and an average rate of −0.54 cm day−1. Hotspot detections remained limited, with fewer than 10 detections on most days and a maximum of six detections on 25 August 2024. These observations indicate progressively deeper groundwater conditions before the onset of the validated fire phase. However, this temporal pattern does not by itself establish a causal relationship between GWL decline and subsequent fire occurrence.
3.4.2. Fire Phase: Deep Groundwater Conditions and Increased Hotspot Activity (27 August 2024–9 September 2024)
During the validated fire phase, the descriptive mean GWL was −89.43 cm, representing the deepest mean groundwater level among the three phases. The mean start-to-end change was −6.34 cm, corresponding to an average rate of −0.47 cm day−1. The LMM also indicated significant differences among phases for GWL, SM, and ST (p < 0.001). Estimated marginal means during the fire phase were −75.0 cm for GWL, 43.6% for SM, and 29.7 °C for ST. More than 90% of the recorded hotspot detections occurred during this phase, with the highest daily count of 26 detections on 27 August 2024 and additional concentrations on 4, 6, and 7 September. Thus, the validated fire phase coincided with deeper groundwater conditions, lower soil moisture, and higher soil temperature relative to the post-fire phase. These results demonstrate temporal correspondence between hydrological conditions and fire-related activity, rather than a quantified fire-response relationship.
3.4.3. Post-Fire Phase: Groundwater-Level Recovery (10 September 2024–31 October 2024)
Following the validated fire phase, GWL increased substantially, with a mean start-to-end change of +41.99 cm and an average rate of +0.82 cm day−1. Estimated marginal mean SM increased to 51.5%, whereas ST decreased to 29.1 °C. Hotspot detections also declined substantially after the fire phase. The concurrent recovery in GWL and increase in SM, together with reduced hotspot activity, indicate a temporal correspondence between hydrological recovery and reduced fire-related activity during the monitoring period. However, the observational design does not allow the effects of hydrology to be separated from rainfall, fire suppression, or other environmental factors. Overall, the three phases exhibited distinct hydrological patterns. The pre-fire phase was characterized by a gradual decline in GWL, the validated fire phase by deeper groundwater conditions and concentrated hotspot activity, and the post-fire phase by substantial groundwater recovery and reduced hotspot activity. These findings demonstrate a temporal association between peatland hydrological dynamics and the observed fire period, but they do not establish a universal hydrological threshold or quantify fire probability.
4. Discussion
4.1. Role of Hydrological Dynamics in Fire Occurrence
Micro-hydrological variability in tropical peatlands exhibits short-term fluctuations that can be difficult to capture using daily or lower-frequency observations. In this study, the hourly IoT observations captured temporal changes in groundwater level (GWL), soil moisture (SM), and soil temperature (ST) across the monitoring stations. The high temporal resolution therefore provided a more detailed description of hydrological conditions before, during, and after the validated fire phase. The results showed that GWL, SM, and ST varied significantly among the pre-fire, fire, and post-fire phases. During the fire phase, the descriptive mean GWL reached −89.43 cm, while the estimated marginal means were 43.6% for SM and 29.7 °C for ST. GWL also decreased by 6.34 cm during the fire phase, corresponding to an average rate of −0.47 cm day−1. These conditions coincided temporally with the concentration of high-confidence hotspot detections and the fire occurrence validated using SIPP records. Previous studies have similarly demonstrated the importance of groundwater conditions in determining peatland fire susceptibility, particularly when groundwater levels fall below approximately 40 cm from the peat surface [14,40,41]. The post-fire phase showed a contrasting hydrological pattern, with GWL increasing by 41.99 cm and SM increasing to an estimated marginal mean of 51.5%, while ST decreased to 29.1 °C. These changes coincided with a substantial reduction in hotspot detections. The temporal correspondence observed in this study supports the importance of high-frequency hydrological observations for characterizing changing peatland conditions around fire periods. However, these observations do not establish that hydrological changes alone caused the fire occurrence or determine the probability of fire under specific hydrological conditions.
4.2. Importance of Restoration in Restoring Post-Fire Hydrological Conditions
Results indicate that Rukam 01 (R1) and Rukam 02 (R2) exhibit relatively shallow groundwater levels and comparatively higher soil moisture than several other monitoring stations. The average GWL at R2 was −11.92 ± 12.85 cm, the shallowest among all stations, while R1 showed an average of −47.63 ± 24.19 cm. In contrast, Ri and Teluk Dawan (Td) exhibited deeper mean GWLs of −106.74 ± 13.70 cm and −83.17 ± 25.13 cm, respectively. These differences indicate substantial spatial variation in hydrological conditions among monitoring stations. The R2 condition was also accompanied by relatively high SM (72.90 ± 9.40%), compared with Jm1 (19.53 ± 2.73%). Higher SM variability at R1 (SD = 10.15%, IQR = 7.42%) compared to R2 (SD = 9.40%, IQR = 16.79%) reflects greater spatial and temporal variability in soil moisture, despite the higher average moisture at R2. Soil temperature remained relatively similar among stations, generally within 28–31 °C, with SD < 1.10 °C. These results indicate that spatial differences in groundwater and soil moisture were more pronounced than those in soil temperature during the monitoring period.
The hydrological conditions observed at R1 and R2 may be consistent with areas where restoration and vegetation management have contributed to maintaining hydrological function; however, the present study did not employ a before-after or treatment-control design to quantify the specific effects of KIFC revegetation. Therefore, the observed differences among stations cannot be attributed solely to restoration interventions. Previous studies have shown that peatland restoration, particularly rewetting and associated vegetation recovery, can improve groundwater conditions and contribute to the recovery of peatland hydrological functions [43]. Restoration success should therefore be evaluated not only from vegetation recovery but also from the recovery and maintenance of peatland hydrological function. Integration of restoration activities with IoT-based hydrological monitoring can provide continuous information for evaluating changes in groundwater and soil moisture conditions and for supporting adaptive peatland management.
4.3. High-Resolution IoT Observation and Implications for Peatland Management
High temporal resolution is a key factor in understanding dynamic hydrological conditions in peatlands. The IoT observations in this study captured substantial spatial and temporal variation in GWL, SM, and ST that would be difficult to characterize using monthly or annual observations. GWL ranged from −144.30 to 9.00 cm across the monitoring stations, while mean station values ranged from −106.74 ± 13.70 cm at Ri to −11.92 ± 12.85 cm at R2. These differences demonstrate that peatland hydrological conditions can vary substantially over relatively short spatial distances. Soil moisture dynamics also varied considerably among stations, with observed values ranging from 14.52% to 94.82%. The LMM showed a significant positive association between SM and GWL (β = 0.460, p < 0.001), whereas ST showed a significant negative association with GWL (β = −0.516, p < 0.001). These relationships indicate that changes in groundwater and soil moisture occurred concurrently during the monitoring period. Soil temperature showed comparatively smaller spatial variability than GWL and SM, although significant phase differences were detected.
High-resolution observations also enabled the identification of distinct pre-fire, fire, and post-fire hydrological phases. The pre-fire phase showed a mean GWL decline of 13.73 cm, followed by a further decline of 6.34 cm during the validated fire phase. In contrast, GWL increased by 41.99 cm during the post-fire phase. These changes occurred concurrently with changes in SM, ST, and hotspot activity, providing a more detailed temporal description of hydrological conditions surrounding the fire period. Continuous IoT-based monitoring can therefore provide useful information for detecting rapid hydrological changes and supporting Peatland management. However, the present study does not establish operational fire-warning thresholds or quantify fire probability. The observed relationships should consequently be interpreted as hydrological indicators associated with the monitored fire period rather than as validated predictive thresholds. Integration of continuous hydrological observations with satellite hotspot information and field-based fire validation may provide a useful framework for future peatland monitoring and early-warning development.
Several limitations should be considered. The three-month monitoring period (August–October 2024) and 12 monitoring stations may not represent annual or wider landscape-scale hydrological dynamics. Hotspots were not treated as independent fire events; the fire phase was identified using high-confidence SIPONGI detections and supported by SIPP records of fire occurrence and suppression. The observational design also does not allow the effects of hydrology to be separated from rainfall, fire suppression, vegetation condition, and other factors. Although repeated measurements and temporal autocorrelation were accounted for using mixed-effects models with an AR (1) structure, the analysis was not designed to estimate fire probability or causal thresholds. Differences among stations, including R1 and R2, also cannot be attributed solely to restoration or revegetation. Longer-term monitoring with broader spatial coverage and independent fire-response data is needed to further assess hydrological controls on peatland fire dynamics.
5. Conclusions
This study demonstrates that groundwater-level (GWL) dynamics were associated with hydrological changes during the 2024 fire event in the Londerang Peat Protected Forest. GWL ranged from −144.30 to 9.00 cm, with station means ranging from −106.74 ± 13.70 cm (Ri) to −11.92 ± 12.85 cm (R2), reflecting substantial spatial heterogeneity. Most stations exhibited GWL below the −40 cm critical groundwater-level threshold. Soil moisture (SM) ranged from 14.52% to 94.82%, while soil temperature (ST) remained relatively stable (23.01–33.93 °C). GWL declined by 13.73 cm (−0.54 cm day−1) during the pre-fire phase and by a further 6.34 cm (−0.47 cm day−1) during the validated fire phase, when the descriptive mean GWL reached −89.43 cm and high-confidence hotspot detections were concentrated. The post-fire phase showed hydrological recovery, with GWL increasing by 41.99 cm (0.82 cm day−1) and SM increasing to an estimated marginal mean of 51.5%, coinciding with reduced hotspot detections. These results indicate temporal correspondence between hydrological dynamics and the validated fire period but do not establish causal relationships or specific fire-risk thresholds. High-resolution IoT monitoring captured sub-daily variations in GWL, SM, and ST, providing detailed characterization of hydrological conditions around the fire period. Longer-term monitoring, broader spatial coverage, and independent fire-response data are needed to further evaluate the relationship between peatland hydrology and fire occurrence.
Author Contributions
Conceptualization, L.S. and R.M.W.; methodology, R.M.W., I.S.S., and I.N.S.J.; software and formal analysis, R.M.W. and I.S.S.; validation, L.S., I.S.S., and I.N.S.J.; investigation, R.M.W., A.S., F.K., and R.; resources, L.S., A.S., and M.A.; data curation, R.M.W. and I.S.S.; writing—original draft, R.M.W.; writing—review and editing, L.S., I.S.S., I.N.S.J., and A.S.; visualization, R.M.W.; supervision, project administration, and funding acquisition, L.S. All authors have read and agreed to the published version of the manuscript.
Funding
This research was funded by the Ministry of Education, Culture, Research, and Technology of the Republic of Indonesia through the Directorate of Research, Technology, and Community Service (DRTPM) under the PMDSU Program, grant number 18876/IT3.D10/PT.01.03/P/B/2026, and the Partenariat Hubert Curien (PHC) Nusantara, grant number 18735/IT3.D10/PT.01.03/P/B/2026.
Data Availability Statement
Hotspot data are publicly available from NASA FIRMS (accessed on May 2026) and supplemented by SIPONGI. Sentinel-2 imagery was obtained from the Copernicus Open Access Hub. Fire suppression data were sourced from the SIPP Karhutla system of the Ministry of Forestry. IoT-based hydrological data are not publicly available and were accessed under restricted permission from the Peat Ecosystem Control Center (PKEG), Ministry of Environment and Forestry (2024), and the Korea-Indonesia Forest Cooperation Center (KIFC). Data are available from the corresponding author upon reasonable request and with permission from the respective institutions.
Acknowledgments
The authors gratefully acknowledge the support of the Korea–Indonesia Forest Cooperation (KIFC) in providing the IoT monitoring equipment used in this study and facilitating data acquisition through the Directorate of Peat Ecosystem Damage Control (PKEG), Ministry of Environment and Forestry of the Republic of Indonesia. We also acknowledge Forest Fire Management Agency Sumatera Region, Manggala Agni DAOPS Jambi City and Manggala Agni DAOPS Bukit Tempurung for their support during data acquisition and field checks.
Conflicts of Interest
The authors declare no conflicts of interest.
Abbreviations
The following abbreviations are used in this manuscript:
| AR(1) | First-Order Autoregressive |
| ENSO | El Niño–Southern Oscillation |
| GWL | Groundwater level |
| IoT | Internet of Things |
| IQR | Interquartile Range |
| LMMs | Linear Mixed Models |
| MODIS | Moderate Resolution Imaging Spectroradiometer |
| NASA FIRMS | NASA Fire Information for Resource Management System |
| VIIRS | Visible Infrared Imaging Radiometer Suite |
| SM | Soil moisture |
| ST | Soil temperature |
Appendix A
Table A1.
Shapiro–Wilk Normality Test Results for GWL, SM, ST Data from 12 IoT Stations.
Table A2.
Results of Levene’s Test for Homogeneity of GWL, SM, ST Data at 12 IoT Stations.
References
- Goldammer, J.G. History of Equatorial Vegetation Fires and Fire Research in Southeast Asia Before the 1997–98 Episode: A Reconstruction of Creeping Environmental Changes. Mitig. Adapt. Strateg. Glob. Change 2007, 12, 13–32. [Google Scholar] [CrossRef] [Scilit]
- Syaufina, L. Forest and Land Fires in Indonesia: Assessment and Mitigation. In Integrating Disaster Science and Management: Global Case Studies in Mitigation and Recovery; Elsevier: Amsterdam, The Netherlands, 2018; pp. 109–121. [Google Scholar]
- Wang, Y.; Feldpausch, T.R.; Swindles, G.T.; Moss, P.; McGowan, H.A.; Sim, T.G.; Morris, P.J.; Benfield, A.; Courtney-Mustaphi, C.; Wahl, D.; et al. Unprecedented Burning in Tropical Peatlands During the 20th Century Compared to the Previous Two Millennia. Glob. Change Biol. 2026, 32, e70717. [Google Scholar] [CrossRef] [Scilit]
- Salmayenti, R.; Baird, A.J.; Holden, J.; Spracklen, D.V. Drainage Density and Land Cover Interact to Affect Fire Occurrence in Indonesian Peatlands. Environ. Res. Lett. 2025, 20, 054036. [Google Scholar] [CrossRef] [Scilit]
- Miettinen, J.; Wang, J.; Hooijer, A.; Liew, S. Peatland Conversion and Degradation Processes in Insular Southeast Asia: A Case Study in Jambi, Indonesia. Land Degrad. Dev. 2013, 24, 334–341. [Google Scholar] [CrossRef] [Scilit]
- Cahyaningtyas, A.U.; Setiawan, Y.; Putra, E.I.; Tonoto, P. Effects of Peatland Fires on Above-Ground Carbon Stocks in Kepulauan Meranti Regency, Riau Province. J. Manaj. Hutan Trop. 2024, 30, 336–347. [Google Scholar] [CrossRef] [Scilit]
- Setiawan, Y.; Kustiyo, K.; Hudjimartsu, S.A.; Handayani, M.A.; Jamil, A.; Putra, E.I. Spatio-Temporal Detection of Vegetation Change and Recovery in Fire-Affected Peatlands of Sumatra, Indonesia. J. Pengelolaan Sumberd. Alam Lingkung. 2025, 15, 1032–1050. [Google Scholar] [CrossRef] [Scilit]
- Budiningsih, K.; Nurfatriani, F.; Salminah, M.; Ulya, N.A.; Nurlia, A.; Setiabudi, I.M.; Mendham, D.S. Forest Management Units’ Performance in Forest Fire Management Implementation in Central Kalimantan and South Sumatra. Forests 2022, 13, 894. [Google Scholar] [CrossRef] [Scilit]
- Hu, Y.; Yue, X.; Tian, C. Impacts of El Niño–Southern Oscillation on Global Fire PM2.5 During 2000–2023. Atmos. Ocean. Sci. Lett. 2025, 18, 100597. [Google Scholar] [CrossRef] [Scilit]
- Prasetyo, L.B.; Setiawan, Y.; Condro, A.A.; Kustiyo, K.; Putra, E.I.; Hayati, N.; Wijayanto, A.K.; Ramadhi, A.; Murdiyarso, D. Assessing Sumatran Peat Vulnerability to Fire under Various Condition of ENSO Phases Using Machine Learning Approaches. Forests 2022, 13, 828. [Google Scholar] [CrossRef] [Scilit]
- Chen, C.C.; Lin, H.W.; Yu, J.Y.; Lo, M.H. The 2015 Borneo Fires: What Have We Learned from the 1997 and 2006 El Niños? Environ. Res. Lett. 2016, 11, 104003. [Google Scholar] [CrossRef] [Scilit]
- Susilo, G.E.; Yamamoto, K.; Imai, T. Modeling Groundwater Level Fluctuation in the Tropical Peatland Areas Under the Effect of El Nino. Procedia Environ. Sci. 2013, 17, 119–128. [Google Scholar] [CrossRef] [Scilit]
- Nurhayati, A.D.; Satriawan, H.; Putri, C.S. Forest Fire Dynamics Over a Decade in Mappi District, South Papua: Hotspot Trends and Burned Areas Estimation Using MODIS Data. J. Pengelolaan Sumberd. Alam Dan Lingkung. 2025, 15, 519–530. [Google Scholar] [CrossRef] [Scilit]
- Kartiwa, B.; Adi, S.H.; Sosiawan, H.; Marwanto, S.; Maswar; Suratman; Bastoni; Ekadinata, A.; Widiyono, W.; Agus, F. Peat Hydrological Properties and Vulnerability to Fire Risk. Fire 2026, 9, 24. [Google Scholar] [CrossRef] [Scilit]
- Kartiwa, B.; Adi, S.H.; Sosiawan, H.; Heryani, N.; Rejekiningrum, P.; Dariah, A.; Maswar; Suratman; Lenin, I.; Widiyono, W. Water Level and Soil Moisture Monitoring for Peatland Fire Risk Indicator. In Proceedings of the IOP Conference Series: Earth and Environmental Science; Institute of Physics: London, UK, 2023; Volume 1201. [Google Scholar]
- Silviana, S.H.; Saharjo, B.H.; Sutikno, S. Effect of Wildfires on Tropical Peatland Vegetation in Meranti Islands District, Riau Province, Indonesia. Biodiversitas 2019, 20, 3056–3062. [Google Scholar] [CrossRef] [Scilit]
- Silviana, S.H.; Saharjo, B.H.; Sutikno, S. Fire Risk Analysis Based on Groundwater Level in Rewetting Peatland, Sungaitohor Village, Kepulauan Meranti District, Riau Province. In Proceedings of the IOP Conference Series: Materials Science and Engineering; Institute of Physics Publishing: Bristol, UK, 2020; Volume 796. [Google Scholar]
- Taufik, M.; Veldhuizen, A.A.; Wösten, J.H.M.; van Lanen, H.A.J. Exploration of the Importance of Physical Properties of Indonesian Peatlands to Assess Critical Groundwater Table Depths, Associated Drought and Fire Hazard. Geoderma 2019, 347, 160–169. [Google Scholar] [CrossRef] [Scilit]
- Cui, W.; Hu, Y.; Rein, G. Experimental Study of the Ignition Conditions for Self-Sustained Smouldering in Peat. Proc. Combust. Inst. 2023, 39, 4125–4133. [Google Scholar] [CrossRef] [Scilit]
- Wilkinson, S.L.; Moore, P.A.; Flannigan, M.D.; Wotton, B.M.; Waddington, J.M. Did Enhanced Afforestation Cause High Severity Peat Burn in the Fort McMurray Horse River Wildfire? Environ. Res. Lett. 2018, 13, 014018. [Google Scholar] [CrossRef] [Scilit]
- Malik, M.S.; Shukla, J.P.; Mishra, S. Effect of Groundwater Level on Soil Moisture, Soil Temperature and Surface Temperature. J. Indian Soc. Remote Sens. 2021, 49, 2143–2161. [Google Scholar] [CrossRef] [Scilit]
- Zhang, Z.; Chen, X.; Pan, Z.; Zhao, P.; Zhang, J.; Jiang, K.; Wang, J.; Han, G.; Song, Y.; Huang, N.; et al. Quantitative Estimation of the Effects of Soil Moisture on Temperature Using a Soil Water and Heat Coupling Model. Agriculture 2022, 12, 1371. [Google Scholar] [CrossRef] [Scilit]
- Hafni, D.A.F.; Putra, E.I.; Harahap, A.A.N.; Saharjo, B.H.; Graham, L.; Nurhayati, A.D.; Cochrane, M.A. Peat Fire Risk Assessment in Central Kalimantan, Indonesia Using the Standardized Precipitation Index (SPI). In Proceedings of the IOP Conference Series: Earth and Environmental Science; IOP Publishing Ltd.: Bristol, UK, 2022; Volume 959. [Google Scholar]
- Putra, E.I.; Hafni, D.A.F.; Harahap, A.A.N.; Cochrane, M.A.; Saharjo, B.H. Assessing Rainfall Pattern, Groundwater Level, and Peat Hydraulic Conductivity for Effective Peat Prevention Measure. In Proceedings of the IOP Conference Series: Earth and Environmental Science; Institute of Physics Publishing: Bristol, UK, 2019; Volume 284. [Google Scholar]
- Li, L.; Sali, A.; Noordin, N.K.; Ismail, A.; Hashim, F.; Rasid, M.F.A.; Hanafi, M.; Razali, S.M.; Aziz, N.A.; Sukaesih Sitanggang, I.; et al. Modeling of Evaporation Rate for Peatland Fire Prevention Using Internet of Things (IoT) System. Fire 2023, 6, 272. [Google Scholar] [CrossRef] [Scilit]
- Hikouei, I.S.; Eshleman, K.N.; Saharjo, B.H.; Graham, L.L.B.; Applegate, G.; Cochrane, M.A. Using Machine Learning Algorithms to Predict Groundwater Levels in Indonesian Tropical Peatlands. Sci. Total Environ. 2022, 857, 159701. [Google Scholar] [CrossRef] [Scilit]
- Kettridge, N.; Turetsky, M.R.; Sherwood, J.H.; Thompson, D.K.; Miller, C.A.; Benscoter, B.W.; Flannigan, M.D.; Wotton, B.M.; Waddington, J.M. Moderate Drop in Water Table Increases Peatland Vulnerability to Post-Fire Regime Shift. Sci. Rep. 2015, 5, 8063. [Google Scholar] [CrossRef] [Scilit]
- Hirano, T.; Kusin, K.; Limin, S.; Osaki, M. Carbon Dioxide Emissions through Oxidative Peat Decomposition on a Burnt Tropical Peatland. Glob. Change Biol. 2014, 20, 555–565. [Google Scholar] [CrossRef] [Scilit]
- Taufik, M.; Setiawan, B.I.; Van Lanen, H.A.J. Increased Fire Hazard in Human-Modified Wetlands in Southeast Asia. Ambio 2019, 48, 363–373. [Google Scholar] [CrossRef] [Scilit]
- Dadap, N.C.; Cobb, A.R.; Hoyt, A.M.; Harvey, C.F.; Feldman, A.F.; Im, E.S.; Konings, A.G. Climate Change-Induced Peatland Drying in Southeast Asia. Environ. Res. Lett. 2022, 17, 074026. [Google Scholar] [CrossRef] [Scilit]
- Ritzema, H.; Limin, S.; Kusin, K.; Jauhiainen, J.; Wösten, H. Canal Blocking Strategies for Hydrological Restoration of Degraded Tropical Peatlands in Central Kalimantan, Indonesia. CATENA 2014, 114, 11–20. [Google Scholar] [CrossRef] [Scilit]
- Hoscilo, A.; Page, S.E.; Tansey, K.J.; Rieley, J.O. Effect of Repeated Fires on Land-Cover Change on Peatland in Southern Central Kalimantan, Indonesia, from 1973 to 2005. Int. J. Wildland Fire 2011, 20, 578–588. [Google Scholar] [CrossRef] [Scilit]
- Li, L. A Comprehensive Survey of Fire Weather Index (FWI) Systems and IoT Applications in Peatland Fire Management. IEEE Access 2025, 13, 33579–33599. [Google Scholar] [CrossRef] [Scilit]
- Liew, J.T.; Sali, A.; Noordin, N.K.; Mohd. Ali, B.; Hashim, F.; Mashohor, S.; Saleh, N.L.; Ouzrout, Y.; Sekhari, A. Sustainable Peatland Management with IoT and Data Analytics. In Proceedings of the IFIP Advances in Information and Communication Technology; Springer Science and Business Media Deutschland GmbH: Berlin/Heidelberg, Germany, 2021; Volume 629, pp. 549–557. [Google Scholar]
- Miettinen, J.; Shi, C.; Liew, S.C. Land Cover Distribution in the Peatlands of Peninsular Malaysia, Sumatra and Borneo in 2015 with Changes since 1990. Glob. Ecol. Conserv. 2016, 6, 67–78. [Google Scholar] [CrossRef] [Scilit]
- Umi Kalsum, S.; Saragih, G.M.; Munir, M. Spatial Based Mapping of Londerang Peatprotected Revegetation. In Proceedings of the IOP Conference Series: Earth and Environmental Science; IOP Publishing Ltd.: Bristol, UK, 2022; Volume 999. [Google Scholar]
- Putra, E.I.; Ramadhi, A.; Shadiqin, M.F.; Saad, A.; Setianto, E.; Nurhayati, A.D.; Saharjo, B.H.; Cochrane, M.A. Assessing the Severity of Forest Fire in Sungai Buluh Protected Peat Forest, Jambi. In Proceedings of the IOP Conference Series: Earth and Environmental Science; IOP Publishing Ltd.: Bristol, UK, 2022; Volume 959. [Google Scholar]
- Irfan, M.; Satya, O.C.; Arsali; Ariani, M.; Sulaiman, A.; Iskandar, I. What Is the Rate of Groundwater Level Decline on Peatlands in South Sumatera during the 2019 Extreme Dry Season? In Proceedings of the Journal of Physics: Conference Series; IOP Publishing Ltd.: Bristol, UK, 2021; Volume 1816. [Google Scholar]
- Suhaili, W.S.; Yusop, Y.; Wan, A.T. Opportunities in Using Visual IOT in the Mitigation for Peatland Area. In Proceedings of the IOP Conference Series: Earth and Environmental Science; Institute of Physics Publishing: Bristol, UK, 2020; Volume 479. [Google Scholar]
- Essa, S.; Petra, R.; Uddin, M.R.; Suhaili, W.S.H.; Ilmi, N.I. IoT-Based Environmental Monitoring System for Brunei Peat Swamp Forest. In Proceedings of the 2020 International Conference on Computer Science and Its Application in Agriculture, ICOSICA 2020; Institute of Electrical and Electronics Engineers Inc.: New York, NY, USA, 2020. [Google Scholar]
- Ismail, I.; Haghighi, A.T.; Marttila, H.; Kurniawan, U.; Karyanto, O.; Kløve, B. Water Table Variations on Different Land Use Units in a Drained Tropical Peatland Island of Indonesia. Hydrol. Res. 2021, 52, 1372–1388. [Google Scholar] [CrossRef] [Scilit]
- Qalbi, A.H.; Tarigan, S.D.; Barus, B.; Sudadi, U. Long-Term Effects of Fire and Logging on Groundwater Table and Soil Moisture in Acacia Plantation Peatlands. J. Degraded Min. Lands Manag. 2026, 13, 10359–10368. [Google Scholar] [CrossRef] [Scilit]
- Kassambara, A. Multivariate Analysis I: Practical Guide to Cluster Analysis in R: Unsupervised Machine Learning; STHDA: Marseille, France, 2017; Available online: https://books.google.com/books/about/Practical_Guide_to_Cluster_Analysis_in_R.html?id=plEyDwAAQBAJ (accessed on 12 July 2026).

Disclaimer/Publisher’s Note: The statements, opinions and data contained in all publications are solely those of the individual author(s) and contributor(s) and not of MDPI and/or the editor(s). MDPI and/or the editor(s) disclaim responsibility for any injury to people or property resulting from any ideas, methods, instructions or products referred to in the content. |
© 2026 by the authors. Licensee MDPI, Basel, Switzerland. This article is an open access article distributed under the terms and conditions of the Creative Commons Attribution (CC BY) license.