


Abstract
Although heterogeneity among non-wood forest product (NWFP) collectors is well established, less is known about how collectors’ expected benefits from association can be translated into operational support profiles. This study aims to operationalize NWFP collectors’ expected benefits from association into support-priority groups and to assess whether these groups differ in collectors’ stated willingness to participate in establishing an association, with implications for planning institutional support in Serbia. Data were collected through a 2022 survey of 639 NWFP-collecting households, of which 465 households with complete service-item data and at least one named service formed the primary analytical sample. Ten services were grouped into three indices (administrative, information and education, and market and infrastructure) and classified using a complete 27-rule framework implemented through fuzzy inference. The framework generated low (14.8%), medium (54.4%), and high (30.8%) support-priority groups. The medium support-priority group was characterized by a mixed pattern of expected benefits, while the high support-priority group reflected stronger expectations across complementary support domains. Stated willingness to participate in establishing an association, which was not used to construct the classification, was reported by 68.2% of the low, 73.0% of the medium, and 90.7% of the high support-priority group. The overall association was statistically significant (χ2(2) = 19.03, p = 7.38 × 10⁻⁵; Cramer’s V = 0.21), with higher adjusted odds of stated willingness in the high group than in either other group, whereas the low–medium contrast was not statistically significant. In a sensitivity analysis (N = 615), assigning 150 households with no recorded service selections to Low under a zero-score assumption reduced willingness in that group to 25.6%. Fuzzy and crisp implementations classified all 80 possible input profiles identically; the rule-based groups were not more strongly associated with willingness than alternative classifications. These findings show how expected association benefits can be translated into interpretable model-generated groups that may serve as exploratory input for planning differentiated association-based institutional support in Serbia.
1. Introduction
Non-wood forest products (NWFPs) contribute to rural livelihoods, food security, health care, and local economies by providing income, reducing household expenditure, diversifying livelihoods, and serving as a safety net during economic shocks, particularly where access to formal employment, credit, and public services is limited [1,2,3,4]. However, sustainable development of the sector depends not only on resource availability but also on institutional arrangements that regulate access, facilitate market participation and value addition, and enable cooperation among collectors and other value-chain actors [5,6,7,8].
NWFP collection serves multiple and often overlapping purposes, including household consumption, medicine, cultural practices, informal exchange, recreation, and commercial sale [3,7,9]. Household NWFP use and market participation are therefore not mutually exclusive. Evidence from different contexts, such as Ghana, Iran, and Czechia, shows that the same products may circulate through self-provisioning, gifting, local exchange, and formal or informal markets, with much of their value remaining outside official economic statistics [10,11,12]. Collectors’ decisions consequently reflect both economic and non-economic motivations.
1.1. NWFP Collectors and Expected Benefits of Association
NWFP collectors differ in livelihood dependence, market orientation, resource access, and socio-economic characteristics [7,13,14,15]. Collection may complement other livelihood activities (such as farming, livestock production, forestry, or wage employment), while access to infrastructure, capital, and market contacts influences opportunities for commercialization [4,10,16]. Collection also reflects social and cultural practices, knowledge, and perceptions of resource access and fairness Participation and market engagement also vary with gender, age, experience, knowledge, and other socio-economic characteristics [10,15,17], while NWFP collection may be embedded in customary land use, cultural identity, health care, and intergenerational knowledge [9,14,17,18,19,20].
These differences may shape the benefits collectors expect from associations. Subsistence-oriented households may emphasize secure resource access and livelihood stability, whereas commercially oriented collectors may value market information, reliable buyers, joint processing, and stronger bargaining power. Social and cultural benefits may also influence expectations [2,21,22,23,24]. Market uncertainty and transaction costs provide additional reasons for considering collective arrangements [10,13,15,22,24,25].
1.2. Collective Organization
Collective organization through associations, cooperatives, and producer groups may help NWFP collectors address fragmented supply, weak bargaining power, limited market access, and inadequate access to services. Such organizations can coordinate collection and marketing; facilitate access to information, training, infrastructure, and funding; and represent collectors’ interests [8,26,27,28,29]. However, mistrust, weak leadership, unequal distribution of benefits, and limited member engagement may constrain collective action [21,30].
Collective action theory highlights both the costs and incentives of cooperation [31] and the institutional arrangements necessary to sustain it [5,6]. Accordingly, expected benefits may influence interest in collective organization, but they do not guarantee participation or the realization of those benefits. Studies of producer organizations link participation to anticipated market, informational, administrative, and social benefits [8,32,33]. Evidence from NWFP producer groups further indicates that the outcomes of collective marketing depend on product characteristics and market conditions [21].
In Serbia, collective organization also could be considered in light of the historical legacy of cooperatives, whose development was shaped by institutional changes during the socialist period and the subsequent post-socialist transition [34,35]. While this legacy may provide relevant context for understanding trust in collective organizations, its implications for NWFP collectors’ willingness to participate in associations have not been directly established.
Expected association benefits and stated willingness to participate are conceptually distinct: willingness may also depend on trust, previous organizational experience, and perceived fairness [5,8,31]. In this study, expected benefits refer to collectors’ ex ante perceptions of services an association could provide, rather than benefits already realized through membership. Following the survey instrument, we distinguish three domains: administrative support, information and education support, and market and infrastructure support [8,25,28]. Stated willingness to participate in establishing an association is examined separately.
Although previous research has highlighted the importance of stakeholder preferences for policy instruments [36], limited attention has been given to combining NWFP collectors’ expectations across different association-support functions into interpretable profiles and examining their relationship with separately measured stated willingness to participate in establishing an association.
Fuzzy approaches offer a way to represent overlapping stakeholder perceptions through interpretable analytical frameworks. Schiavon et al. [37], for example, used fuzzy logic to elicit stakeholders’ needs and perceptions of barriers and facilitators of green infrastructure implementation in agriculture. Although methodologically distinct, their study illustrates the relevance of fuzzy approaches for structuring perception-based information. In the present study, a fuzzy rule-based framework is used to classify combinations of expected association benefits, with the resulting groups examined in relation to stated willingness and their robustness assessed through sensitivity analysis.
1.3. Institutional Context of NWFP Collection in Serbia
NWFP collection provides supplementary income for rural households in Serbia, although institutional cooperation among collectors remains limited [38]. The main products collected include wild mushrooms (particularly porcini and chanterelles), forest berries and fruits (such as bilberries, blackberries, and rosehips), medicinal and aromatic plants, and truffles [39]. Previous research estimates that 11%–20% of Serbian households collect NWFPs [40].
Available data also indicate the sector’s economic importance. Approximately 20,000 tonnes of wild mushrooms were recorded as collected in Serbia during 2016–2021, while their reported value for 2017–2021 was approximately EUR 15.7 million [39]. However, these figures do not represent the total NWFP market, as collection and consumption are not fully captured by official statistics [40,41].
Earlier research on NWFP value chains in Southeastern Europe, including Serbia, identified structural constraints related to fragmented supply, limited market transparency, and the weak bargaining power of individual collectors [38]. These constraints are relevant to collective organization, as associations and other forms of cooperation can facilitate product aggregation, market access, and coordination among value chain actors.
Formal collective organization remains limited. Documented examples of NWFP-related associations include mycological societies in Novi Sad and Kragujevac and medicinal-plant associations in Valjevo and Sokobanja [39]. These organizations primarily focus on education, conservation, and knowledge exchange rather than collective marketing. A comprehensive national count of associations specifically representing NWFP collectors is not available in the reviewed sources. Together with limited processing, certification, and organized marketing, this constrains opportunities for coordinated sector development [42]. Evidence on collectors’ expected association benefits and their willingness to participate in establishing an association therefore remains important for designing differentiated institutional support.
1.4. Research Aim, Hypothesis and Contribution
Against this background, this study aims to operationalize NWFP collectors’ expected benefits of association into support-priority groups and to assess whether these groups differ in households’ stated willingness to participate in establishing a collectors’ association (hereafter, stated willingness), with implications for planning institutional support in Serbia. In this study, support priority is a model-derived ordering based exclusively on the pattern and intensity of households’ expected benefits from association-based institutional support. It does not represent socio-economic need, vulnerability, eligibility for public support, expected policy effectiveness, or the likelihood that a household will join an association. The classification is intended to inform the planning of differentiated association-based support, not to determine eligibility for, or allocation of, public resources. Accordingly, the study first operationalizes expected association benefits through three complementary support domains corresponding to the survey instrument and uses a fuzzy rule-based decision-support framework to assign households to support-priority groups according to the intensity and configuration of these expected benefits. A secondary objective is to assess the robustness of the resulting classification and its association with stated willingness under alternative model specifications.
The study addresses the following hypothesis:
H1.
Households’ stated willingness increases across model-generated support-priority groups.
The present study builds on two earlier publications using data from the same 2022 household survey [43,44]. Nedeljković et al. [44] descriptively examined ten expected association services among 288 households in Šumadija and Western Serbia, while the study [43] applied a fuzzy model to three administrative-support items using 477 households from both surveyed regions. The present study extends this research by integrating all ten services into three conceptually defined support domains and using an interpretable, complete 27-rule framework to classify households according to the intensity and configuration of their expected association benefits. It further examines the relationship between the resulting support-priority groups and separately measured stated willingness to participate in establishing an association, assesses classification robustness, and compares the framework with alternative approaches. The main contribution therefore lies in the multidimensional and transparent representation of expected-benefit configurations and the systematic evaluation of the resulting classification, with potential relevance for association support planning in Serbia.
2. Methods
2.1. Study Area and Household Survey
This study used data from a household survey conducted in Serbia in 2022 as part of the international project “In-depth Study on the Use of Non-Wood Forest Products (NWFPs) in Selected Western Balkan Countries”, coordinated by the Regional Center for Forestry and Rural Development (REFORD) and supported by the Food and Agriculture Organization of the United Nations (FAO). Door-to-door surveys were conducted in April and May 2022 with households engaged in NWFP collection in selected municipalities in two statistical regions: Šumadija and Western Serbia (288 households in 14 municipalities/50 villages) and Southern and Eastern Serbia (351 households in 12 municipalities/33 villages). Municipalities were selected based on the presence of enterprises that purchase, process, and market NWFPs. Within these municipalities, collecting households were identified through these enterprises and through personal contacts. Further households were reached by referral from those already surveyed. This approach was used because no register of NWFP collectors exists. The sample is therefore not a probability sample. Because no record of contacted and non-responding households was kept, a response rate could not be calculated. One member of each visited household completed the survey on behalf of the household. The respondent was a household member directly involved in NWFP collection and knowledgeable about the household’s activities related to NWFPs. Because the questionnaire focused on household-level NWFP collection, marketing, and expected association support, the reported responses were analyzed at the household level. Before participation, respondents were informed about the purpose of the study, that participation was voluntary and anonymous, that the information provided would be treated confidentially, and that individual responses could not be linked to respondents. Verbal consent to participate was obtained before the survey. No formal ethics committee approval or exemption was obtained for the original survey. The present study is a secondary analysis of anonymized data collected within the REFORD project and involved no re-contact with respondents or use of directly identifying personal information.
The questionnaire comprised 51 items organized into six thematic sections covering household characteristics, NWFP collection and marketing practices, and cooperation with and expectations regarding collectors’ associations. The sampling procedure and the questionnaire are described in more detail in [43,44]. In the present study, the survey data were reanalyzed to develop and evaluate a fuzzy rule-based decision-support framework for translating households’ expected benefits from NWFP collectors’ associations into support-priority groups.
The original survey included 639 households engaged in the collection of NWFPs. The inputs to the classification were derived from a multiple-response question on the services that respondents expected from an NWFP collectors’ association (ten listed services; Section 2.2). The primary analytical sample comprised 465 households that named at least one of the listed services and for which all ten service items were recorded. The remaining 174 households were not included. Of these, 150 had no recorded selections for any of the ten listed services. A further 12 had partly recorded service data from which the indices could still be calculated from the available items. Another 12 had partly recorded data from which the indices could not be calculated. Among the 150 households with no recorded service selections, 124 (82.7%) explicitly stated that they would not join a collectors’ association under any conditions. The service question did not include a “none” option, so these cases cannot formally be distinguished from item non-response; however, the question immediately followed the question on conditions for membership, in which these 124 households selected the option of not joining under any conditions. These 150 households were excluded as a separate response-pattern group and were not included through imputation. Included and non-included households were compared on observed characteristics (Supplementary Table S1). After Holm correction, the two groups differed in region (61.9% vs. 36.2% from Southern and Eastern Serbia; Cramer’s V = 0.23) and age (median 52 vs. 58 years). They also differed in cooperation with other collectors, awareness of collectors’ associations, and stated willingness (Section 2.5). No differences were detected for gender, residence status, education, employment, household income, household size, or forest ownership. The analytical sample is selective, and the original sampling procedure was non-probabilistic. The findings therefore describe the analyzed households and should not be interpreted as representative estimates for Serbian NWFP collectors, including those who would name at least one listed service. The 477 households for which the indices can be calculated with the available-item procedure are retained only for a sample-definition sensitivity analysis. For this procedure, each domain index was calculated as the mean of its recorded items, provided that at least one item was recorded in every domain.
Statistical analyses were performed using R statistical software (version 4.4.2, 31 October 2024) [45]. The fuzzy rule-based system was implemented in R using custom functions for membership evaluation, rule activation, output aggregation, and weighted-average defuzzification. The code and both rule bases are provided in the Supplementary Materials.
2.2. Construction of the Input Dimensions
Three input dimensions representing the main domains of institutional support provided through collectors’ associations were constructed from the FAO household questionnaire. The indices were derived from the questionnaire item “Which services do you expect from an NWFP collectors’ association?”, for which respondents could select more than one service from a list of ten, with no maximum number specified; the list contained no “do not know” option. The questionnaire items included in each input dimension are presented in Table 1.
Table 1.
Construction of the input dimensions and corresponding questionnaire items.
The three input dimensions were derived by grouping conceptually related questionnaire items describing the main types of institutional support that collectors’ associations could provide. This grouping was based on the content of the FAO household questionnaire and reflects three broad domains of expected association support: administrative; information and education; and market and infrastructure support. These domains are consistent with the broader literature on community forestry and NWFP development, which emphasizes that successful producer organizations depend not only on supportive institutional arrangements and administrative coordination, but also on access to information and training, as well as market opportunities and infrastructure that facilitate commercialization [19,28,46,47].
Each questionnaire item was coded as a binary variable (1 = named; 0 = not named). A value of 0 indicates that a listed service was not named and should not be interpreted as evidence that the household had no expectation of that service. For each dimension, a composite index was calculated as the arithmetic mean of the corresponding binary indicators. The index therefore represents the share of the listed services within that domain that the household named and ranges from 0 to 1. All indicators within each dimension were assigned equal weights because there was no empirical or policy-based basis for differential weighting. Higher values indicate a larger share of the listed services named within the respective domain. In this study, expectation intensity refers to this share of named services. Because each index was calculated from three or four binary items, its observed values were discrete rather than continuously distributed.
The questionnaire items within each dimension represent complementary forms of institutional support rather than interchangeable manifestations of a single latent construct. The indices were therefore treated as formative composites, with the services defining the respective support domain. Internal consistency was not used as a criterion for retaining or removing items.
For descriptive purposes, KR-20 coefficients (equivalent to Cronbach’s alpha for binary items [48]) were 0.808 for administrative support, 0.697 for information and education support, and 0.600 for market and infrastructure support. The three composite indices were moderately correlated: Spearman’s ρ was 0.557 between administrative and information and education support, 0.461 between administrative and market and infrastructure support, and 0.405 between information and education and market and infrastructure support.
The resulting composite indices served as the input variables for the fuzzy rule-based decision-support framework described in Section 2.3.
2.3. Fuzzy Rule-Based Decision-Support Framework
A fuzzy rule-based decision-support framework was developed to classify households into support-priority groups according to the pattern and intensity of the benefits they expected collectors’ associations to provide. Support priority, as defined in Section 1.4, is a model-derived ordering based exclusively on these expected benefits. Decision-support approaches based on multi-criteria reasoning are increasingly applied in forest management to support transparent evaluation of complex ecological, economic, and social considerations [49].
The framework was designed to provide a transparent and interpretable mapping from the three input dimensions to support-priority levels through linguistic IF–THEN rules rather than to optimize predictive performance. The fuzzy inference process consisted of fuzzification of the input variables, evaluation of the rule base, aggregation of rule activation levels, and computation of the final support-priority score [50,51]. The framework was implemented as a singleton-output fuzzy rule-based system. Its antecedent evaluation follows Mamdani-style fuzzy reasoning, while the consequent representation and output computation are described in Section 2.3.2.
The framework incorporated three composite indices as input variables: administrative support, information and education support, and market and infrastructure support. The output was a numerical support-priority score ranging from 0.20 to 0.80, with higher values corresponding to higher support-priority levels as defined by the rule base (Section 2.3.2). The resulting scores were used to classify households into Low, Medium, and High support-priority groups. The overall workflow is presented in Figure 1.
Figure 1.
Overall workflow of the proposed fuzzy rule-based decision-support framework: (A) data and input construction; (B) fuzzy rule-based classification; (C) model evaluation.
2.3.1. Fuzzification of the Input Variables
The three composite indices served as the input variables of the fuzzy rule-based system. Each variable was represented by three linguistic terms (Low, Medium, and High) using two shoulder membership functions and one triangular membership function defined over the 0–1 range of the composite indices (Figure 2).
Figure 2.
Input membership functions used for fuzzification of the three institutional support dimensions.
The membership-function parameters were specified by the authors to provide a transparent and interpretable reference partition and were not empirically optimized [51,52]. The Low, Medium, and High linguistic terms were defined by the parameters Low (0.0, 0.0, 0.4), Medium (0.2, 0.5, 0.8), and High (0.6, 1.0, 1.0). The same reference partition was applied to all three input dimensions.
Because the indices were constructed from binary items, only a limited set of input values was attainable. The three-item administrative support and information and education support indices could take the values 0, 0.33, 0.67, and 1.00, whereas the four-item market and infrastructure support index could take the values 0, 0.25, 0.50, 0.75, and 1.00. Based on the highest membership degree, the attainable values were predominantly associated with the linguistic terms as follows: for the three-item domains, zero named services corresponded to Low, one or two to Medium, and three to High; for the four-item domain, zero or one named service corresponded to Low, two to Medium, and three or four to High. Thus, one named service is predominantly associated with Medium in the three-item domains but with Low in the four-item domain. The corresponding membership degrees for all attainable input values are reported in Supplementary Table S2.
The sensitivity of the classification to alternative membership-function specifications, including a domain-specific partition, was examined separately as described in Section 2.6.
2.3.2. Rule Base and Fuzzy Inference
The reference rule base was designed to provide complete and transparent coverage of the input space. Given the three linguistic terms (Low, Medium, and High) defined for each of the three input dimensions, all 3 × 3 × 3 = 27 possible combinations were included in the rule base, so that at least one rule is activated for every possible input profile. The rule consequents were specified by the authors based on the substantive interpretation of the three support domains and their combinations. At the level of the rule table, the rule base follows a monotonicity principle: raising the level of any one input dimension while keeping the other two unchanged never lowers the resulting support-priority level. This exhaustive structure avoids gaps in the rule base and makes the model’s decision logic transparent and traceable.
The relative roles of the three support domains in mixed input combinations were specified according to their substantive functions within collective organization. Market and infrastructure support was treated as directly related to the economic and operational functions of collectors’ associations, including access to market information, joint selling and processing, and infrastructure that facilitates collection and commercialization. Information and education support was treated as a complementary capacity-building function, supporting knowledge exchange, training, and informed participation. Administrative support was interpreted primarily as an enabling function, facilitating compliance with regulations, access to collection licenses, and access to subsidies or grants. Accordingly, a High level in a single domain was not considered sufficient for High support priority when the other two dimensions were Low. High priority was instead assigned to combinations indicating strong expectations across complementary support functions. This logic reflects the interpretation of support priority as the intensity and configuration of expected association benefits, rather than the importance of any single support domain in isolation.
The rule base can be summarized using three conditions:
- High support priority is assigned when:
- –
- market and infrastructure support is High, and at least one of the other two dimensions is Medium or High;
- –
- information and education support is High, and market and infrastructure support is Medium or High; or
- –
- both administrative support and information and education support are High.
- These combinations represent strong expectations spanning at least two complementary support functions.
- Low support priority is assigned when both information and education support and market and infrastructure support are Low, while administrative support is not High, representing a comparatively limited configuration of expected association benefits.
- Medium support priority is assigned to all remaining combinations of the three dimensions, reflecting meaningful but more selective or less comprehensive expectations of association support.
Thus, the rule base does not assign fixed numerical weights to the three domains; instead, it distinguishes configurations according to the breadth and complementarity of the support functions that collectors expect an association to provide. The complete rule table is provided in Appendix A.
Figure 3 presents pairwise decision surfaces of the fuzzy rule-based system under the 27-rule reference specification. Each panel shows the continuous support-priority score obtained by varying two composite indices while fixing the third at 0.50. The surfaces illustrate how the rule base and the membership functions jointly determine the score across the 0–1 input range. They are shown over the continuous range for illustration. The observed inputs are restricted to the attainable values listed in Section 2.3.1.
Figure 3.
Pairwise decision surfaces of the fuzzy rule-based system under the 27-rule reference specification. Dashed contours indicate the classification thresholds of 0.35 and 0.65.
No formal expert-elicitation procedure was conducted to specify the membership functions and the rule base. The activation level of each rule was determined using the minimum t-norm as the logical AND operator. The minimum t-norm assigns each rule the membership degree of its least satisfied antecedent [50,52]. Rule activations leading to the same output support-priority level were aggregated using the maximum operator. The three output levels (Low, Medium, and High) were represented by singleton values located at 0.20, 0.50, and 0.80, respectively. These values are equally spaced on the 0–1 scale. The final support-priority score was obtained by weighted-average defuzzification of the aggregated singleton outputs:
where µk denotes the aggregated activation of output level k, and ck denotes the corresponding singleton value (0.20, 0.50, or 0.80).
The resulting implementation is a singleton-output fuzzy rule-based system. Singleton consequents and weighted-average defuzzification are also characteristic of zero-order Takagi–Sugeno systems [51]. The present system differs from a conventional zero-order Takagi–Sugeno formulation in that the firing strengths of rules with the same output level are first aggregated using the maximum operator. The final output is then computed as a weighted average over the three aggregated output levels, rather than directly over the individual rules.
The classification thresholds of 0.35 and 0.65 corresponded to the midpoints between the adjacent singleton values. Support-priority scores below 0.35 were classified as Low, scores from 0.35 to below 0.65 as Medium, and scores of 0.65 or higher as High. Thus, a score exactly at either threshold was assigned to the higher support-priority group.
The behavior of the reference specification was checked for all 80 possible input profiles. A profile with equal or higher values on all three indices was never assigned to a lower support-priority group than a profile with lower values. The continuous score was not perfectly monotonic. Of the 1420 pairs of profiles in which one profile had equal or higher values on all three indices, 16 (1.13%) showed a small score reversal, with a maximum decrease of 0.0105 on the 0–1 scale. These reversals did not change group assignment.
2.4. Classification and Exploratory Profiling of Support-Priority Groups
Following the classification of households into three support-priority groups, exploratory profiling was performed using twelve socio-economic and NWFP-related characteristics. The characteristics captured both basic household attributes and engagement in NWFP collection and marketing. Associations between the support-priority groups and each characteristic were examined using the chi-square (χ2) test. Fisher’s exact test with a simulated p-value was used when the smallest expected cell frequency was below 5. Cramer’s V was calculated as an effect-size measure. The p-values were adjusted for the twelve tests using the Holm procedure. The number of valid observations is reported for each characteristic because some questions, notably those on NWFP sales, were not answered by all households. Education was grouped into three levels because the highest category contained only one household. For the perceived importance of NWFP income and the collection-license item, values outside their respective response scales were treated as missing. For descriptive analyses of the most frequent configurations, each input dimension was assigned to the linguistic term with the highest membership degree under the reference membership functions (Section 2.3.1).
2.5. Relationship with Stated Willingness to Participate in Establishing an Association
Stated willingness was measured with the questionnaire item “If there is no NWFP collectors’ association in your surroundings, would you be willing to take part in establishing one?” (yes/no). The item was not used in constructing the framework. It records a stated intention under a hypothetical condition and not observed participation. Analyses involving this item were restricted to the 443 households in the primary sample with a valid response. Of the 22 households with missing responses to this item, 11 were current association members, nine were non-members, and two had missing membership status. Of the 12 current association members in the primary sample, only one provided a valid response to the willingness item.
The association between the support-priority groups and stated willingness was assessed using the chi-square (χ2) test of independence. Cramer’s V was reported as an effect-size measure with a 95% bootstrap confidence interval based on 2000 household-level resamples. Because the groups are ordered, the Cochran–Armitage test for trend [53] was also applied. Confidence intervals for the group percentages were calculated using the Wilson method.
A logistic regression model was used to examine whether the association remained after adjustment for region, age, gender, household income, education, and forest ownership. The model was estimated for non-members with a valid response and complete covariate data (N = 441). Odds ratios with 95% confidence intervals are reported for the three pairwise contrasts between the support-priority groups. The p-values for these contrasts were adjusted using the Holm procedure. The overall contribution of the support-priority groups was assessed with a likelihood-ratio test.
The association was also examined separately within each of the two regions (Supplementary Table S5). The association was interpreted as convergent evidence based on stated willingness. It was not treated as behavioral or independent external validation.
2.6. Sensitivity Analysis
The sensitivity analysis assessed the robustness of the classification and of its association with stated willingness under alternative model specifications. Fourteen scenarios were compared with the reference specification (Supplementary Table S6). Each scenario changed one element of the model and kept the others unchanged.
Five scenarios changed the input membership functions. Two applied an alternative partition to all three indices: Partition A, with Low (0, 0, 0.35), Medium (0.15, 0.5, 0.85), and High (0.65, 1, 1), and Partition B, with Low (0, 0, 0.45), Medium (0.25, 0.5, 0.75), and High (0.55, 1, 1). Two used an asymmetric Medium set with the peak moved to 0.4 or to 0.6, while retaining its endpoints at 0.2 and 0.8 and leaving the Low and High sets unchanged. One used a domain-specific partition for the four-item market and infrastructure support index, with Low (0, 0, 0.3), Medium (0.1, 0.5, 0.9), and High (0.7, 1, 1). Under this partition, one, two, or three named services are predominantly associated with Medium. One scenario replaced the minimum t-norm with the product t-norm. Two scenarios changed the classification thresholds to 0.30/0.70 and to 0.40/0.60. Two scenarios changed the singleton values to 0.10/0.50/0.90 and to 0.25/0.50/0.75, with the thresholds at the corresponding midpoints. One scenario used centroid defuzzification with triangular output sets.
Two scenarios concerned the rule base. The first used the initial 12-rule base, from which the complete rule base was developed by assigning an output level to each of the remaining 15 combinations (Supplementary Table S3). Because the 12-rule base does not cover all 27 combinations, a household for which no rule was activated received a fallback score of 0.20 and was classified as Low. The second scenario repeated the 12-rule analysis without these fallback households. The complete 27-rule base was not selected or adjusted to strengthen the association with stated willingness.
One scenario applied the reference specification to the 477 households for which the indices were calculated using the available-item procedure (Section 2.1). Under the reference specification, none of the 80 possible input profiles produces a score equal to a threshold. Such scores occur under Partition A and under the 12-rule base. In these scenarios, the classification depends on the rule that assigns a score at a threshold to the higher group.
For each scenario, the classification results were compared with those of the reference classification using the percentage of households assigned to the same group, the quadratic-weighted kappa coefficient, and the adjusted Rand index. The association with stated willingness was described by the percentage of willing households in each group, the chi-square (χ2) test, Cramer’s V, and the Cochran–Armitage test for trend.
2.7. Comparison with Alternative Classifications
The rule-based classification was compared with alternative ways of grouping the same households. The first alternative was the crisp application of the rule base, in which each index was assigned to its predominant linguistic term and the corresponding rule was applied directly. The second was a simple-average index, calculated as the mean of the three composite indices. It was classified into three groups in two ways: with the thresholds 0.35 and 0.65, and with thresholds chosen to match the group sizes of the rule-based classification as closely as possible. The third and fourth alternatives were k-means clustering and a latent class model, both applied to the ten binary service items, each with three groups. Three groups were used for comparability with the three-group rule-based classification; the number of latent classes was therefore not selected by the Bayesian information criterion (BIC). K-means clustering used 50 random starts. Latent class models were estimated with the poLCA package [54], using ten random starts and assigning households to the class with the highest posterior membership probability. In addition, stated willingness was regressed directly on the three composite indices in a logistic regression model without grouping.
The classification-based comparisons were conducted for the complete 27-rule base and the initial 12-rule base. For each classification, its association with stated willingness was described by Cramer’s V. Model fit and discrimination were additionally described using the Akaike information criterion (AIC) and the area under the receiver operating characteristic curve (AUC) from logistic regression models of stated willingness on the respective classification, both calculated on the analyzed sample. The direct logistic model based on the three composite indices was evaluated using AIC and AUC without creating groups. Differences in Cramer’s V between classification methods were assessed with 95% bootstrap confidence intervals based on 2000 household-level resamples. The classifications and thresholds were held fixed across resamples. The intervals therefore do not reflect the uncertainty associated with re-estimating the clusters, latent classes, or matched thresholds. Results are reported in Supplementary Table S8.
3. Results
3.1. Distribution of Expected Benefits Across Institutional Support Dimensions
Descriptive statistics were used to summarize the three institutional support dimensions (Table 2). Higher values indicate a larger share of the listed services named within the respective domain.
Table 2.
Descriptive statistics of the institutional support dimensions (N = 465).
Market and infrastructure support had the highest mean value (0.499), followed by information and education support (0.427), whereas administrative support had the lowest mean (0.371). On average, households named the largest share of the listed services in the market and infrastructure domain. All three indices covered the full 0–1 range.
3.2. Distribution of Support-Priority Groups
The reference specification classified households into three support-priority groups using the thresholds described in Section 2.3.2. The resulting distribution is presented in Table 3.
Table 3.
Distribution of households across support-priority groups (N = 465).
The Medium support-priority group comprised 253 households (54.4%), followed by the High group (143 households, 30.8%) and the Low group (69 households, 14.8%). All households activated at least one rule under the reference specification, so no fallback assignment was required.
3.3. Institutional Support Patterns Across Support-Priority Groups
The mean values of the three composite indices were examined for each support-priority group (Table 4).
Table 4.
Mean values of the institutional support dimensions by support-priority group (N = 465).
Households in the Low group named few services (median one). None of them named an information and education service, and none named more than one market and infrastructure service. Households in the Medium group had selective or mixed expectations (median three services). Their mean values were intermediate for information and education support (0.337) and market and infrastructure support (0.367) and low for administrative support (0.186). High levels were rare in this group: no more than 7.5% of its households had a High level in any single domain. The group included 13 different combinations of input levels. Households in the High group had broad expectations (median ten services) and high mean values in all three domains. Market and infrastructure support was High for 96.5% of these households, and all three domains were High for 60.8%. These differences follow from the rule base and describe the composition of the groups. The group means are shown in Figure 4.
Figure 4.
Institutional support patterns across support-priority groups.
3.4. Support-Priority Groups and Stated Willingness
Stated willingness was examined across the support-priority groups for the 443 households with a valid response (Table 5).
Table 5.
Stated willingness by support-priority group (N = 443).
Stated willingness was 68.2% in the Low group, 73.0% in the Medium group, and 90.7% in the High group. The association was statistically significant, and so was the test for trend (Table 5). The percentages in the Low and Medium groups were similar, whereas the High group had a substantially higher percentage. Excluding the one current association member with a valid response left the percentages practically unchanged (68.2%, 72.9%, and 90.7%). The group percentages are shown in Figure 5.
Figure 5.
Stated willingness by support-priority group. Error bars represent 95% Wilson confidence intervals.
Differences between the support-priority groups remained evident after adjustment for region, age, gender, household income, education, and forest ownership (Table 6). The adjusted odds of stated willingness were higher in the High group than in the Low group and then in the Medium group. No difference was detected between the Medium and Low groups. The unadjusted odds ratios were almost identical to the adjusted ones. Accounting for clustering of households within municipalities (Rao–Scott test; mixed-effects logistic model with a random municipality intercept) did not change these conclusions: the association remained significant (Rao–Scott p = 0.026), and the adjusted odds of stated willingness remained higher in the High group than in the Low (OR = 4.19, 95% CI 1.29–13.64) and Medium groups (OR = 3.75, 95% CI 1.40–10.07), with no difference detected between the Medium and Low groups (OR = 1.12, 95% CI 0.46–2.70).
Table 6.
Odds ratios for stated willingness between support-priority groups (N = 441).
In both regions, stated willingness was highest in the High support-priority group. The distinction between the Low and Medium groups was less consistent, including virtually identical percentages in Šumadija and Western Serbia (58.6% and 57.7%, respectively; Supplementary Table S5).
H1 was partly supported: stated willingness differed across the support-priority groups and showed a significant overall trend, but the increase was concentrated between the Medium and High groups, whereas no difference was detected between the Low and Medium groups. Because the willingness item was not used in constructing the classification, this association provides convergent evidence based on stated willingness. It does not constitute behavioral or independent external validation.
3.5. Exploratory Characteristics of Support-Priority Groups
The support-priority groups were compared to twelve socio-economic and NWFP-related characteristics (Table 7).
Table 7.
Associations between the support-priority groups and selected socio-economic and NWFP-related characteristics.
After Holm correction, the support-priority groups were associated with membership in collectors’ associations, the main market for selling NWFPs, cooperation with other collectors, employment status, and education level. Cramer’s V for these five associations ranged from 0.144 to 0.215. Current association members were found almost only in the High group (7.7%, compared with 0.4% in the Medium group and none in the Low group). Cooperation with other collectors was reported by 50.7% of households in the Low group, 62.3% in the Medium group, and 76.9% in the High group. A local company was the main market in all three groups (72.4%, 42.8%, and 61.3%), and the Medium group more often named another market (26.3%). The High group included more households employed in the private sector (25.2%) and fewer pensioners (13.3%) than the other two groups. Primary or lower education was less common in the High group (15.4%) than in the Low (30.4%) and Medium (32.8%) groups. No association was detected for the remaining seven characteristics after Holm correction.
3.6. Most Frequently Observed Configurations
The most frequently observed combinations of input levels across the three institutional support dimensions were examined. Table 8 summarizes the five most frequent configurations.
Table 8.
Most frequently observed configurations of input levels (N = 465).
Twenty-four configurations were observed. The five most frequent accounted for 267 households (57.4%). The most common configuration had High levels in all three dimensions (n = 87). The remaining four configurations contained only Low and Medium input levels: three belonged to the Medium support-priority group, whereas the configuration with Low levels in all three dimensions (n = 41) belonged to the Low group.
3.7. Results of the Sensitivity Analysis
Nine of the fourteen sensitivity scenarios produced classifications identical to the reference classification for the primary sample: Partition B, the product t-norm, both alternative pairs of thresholds, both alternative sets of singleton values, centroid defuzzification, and both asymmetric Medium sets (Supplementary Table S6).
The classification changed under Partition A and under the domain-specific partition for the market and infrastructure support index. Agreement with the reference classification was 87.3% (weighted kappa = 0.825) and 77.8% (weighted kappa = 0.664), respectively. In both scenarios, the Low group was reduced to 17 households. Stated willingness remained highest in the High group (89.7% and 88.4%), and the association remained statistically significant (Cramer’s V = 0.229 and 0.190).
Under the initial 12-rule base, 83.4% of households were assigned to the same group as under the reference specification (weighted kappa = 0.802; adjusted Rand index = 0.590). The association with stated willingness was numerically stronger under the 12-rule base (Cramer’s V = 0.286) than under the reference specification (0.207). The difference was 0.078 (95% bootstrap CI 0.008–0.151). The complete rule base therefore did not strengthen this association.
Under the 12-rule base, 43 households (9.2%) activated no rule and were classified as Low through the fallback score. Under the complete rule base, 2 of these households were classified as Low, 37 as Medium, and 4 as High (Supplementary Table S7). When the fallback households were excluded from the 12-rule analysis, agreement with the reference classification was 91.5% and Cramer’s V was 0.246.
When the reference specification was applied to the 477 households of the available-item sample, the groups comprised 75, 259, and 143 households, and Cramer’s V was 0.196.
In additional analysis, the 150 households with no recorded service selections were added to the primary sample with all three indices set to zero (N = 615). All of them were classified as Low, which reduced stated willingness in the Low group from 68.2% to 25.6%, while the Medium and High groups were unchanged. The association with stated willingness became stronger (Cramer’s V = 0.541), largely because these households expressed neither expected benefits nor willingness to participate.
In all fourteen scenarios, stated willingness was highest in the High group (88.4%–91.7%), and the association remained statistically significant. This consistency partly reflects the fact that nine scenarios reproduced the reference classification; it therefore rests mainly on the five scenarios that changed the classification. The classification of the Low and Medium groups was more sensitive to changes in the membership-function partition and the rule base.
3.8. Results of the Comparison with Alternative Classifications
Under the complete rule base, the fuzzy and crisp applications of the rules produced identical group assignments for all 80 possible input profiles, and therefore for all households (Supplementary Table S8).
Cramer’s V for the association with stated willingness was 0.207 for the rule-based classification, 0.201 for the simple-average index with the thresholds 0.35 and 0.65, 0.171 for the simple-average index with matched group sizes, 0.241 for k-means clustering, and 0.185 for the latent class model. None of the four bootstrap confidence intervals for the difference in Cramer’s V between the rule-based classification and these alternatives excluded zero.
The logistic regression of stated willingness on the three composite indices had a lower AIC (443.1) and a higher AUC (0.689) than the model based on the rule-based groups (457.8 and 0.622). In this regression, an association with stated willingness was detected only for the market and infrastructure support index (OR = 8.22, 95% CI 3.40–19.86, for a one-unit increase in the index, i.e., across its full 0–1 range). The odds ratios for the administrative support index and the information and education support index were 1.93 (95% CI 0.89–4.17) and 0.72 (95% CI 0.34–1.54), respectively.
These comparisons provide no evidence that the rule-based classification is more strongly associated with stated willingness than the alternative approaches.
4. Discussion
This study operationalizes collectors’ expected association benefits and uses them to classify households into model-generated support-priority groups. These groups capture differences in the intensity and configuration of expected administrative, information and education, and market and infrastructure benefits, providing an interpretable framework for examining how different configurations of expected benefits relate to stated willingness. In this way, the study moves beyond describing known differences among collectors by examining whether expectation-based classification can provide a useful diagnostic framework for exploring differentiated approaches to association-based support.
4.1. Support-Priority Groups and Configurations of Expected Association Benefits
The model-generated support-priority groups differed in both the intensity and configuration of expected association benefits. The Low support-priority group was characterized by relatively low expectations across all three dimensions, whereas the High support-priority group showed relatively high expectations across these dimensions. The Medium support-priority group exhibited a mixed profile, with lower expectations of administrative support and intermediate expectations of information and education support and market and infrastructure support. With respect to stated willingness, however, the evidence supports two levels rather than three: willingness was higher in the High group than in the Low and Medium groups, whereas no difference was detected between the Low and Medium groups (Section 3.4).
Heterogeneity among NWFP collectors in livelihood dependence, commercial orientation, product specialization, access rights, skills, capital, and institutional relationships is already well established [7,13,14,15]. The specific contribution of the present analysis is to show how variation in expected association benefits can be represented through model-generated configurations. The pattern observed in the Medium support-priority group shows that stronger expectations in some support domains may coexist with weaker expectations in others, a pattern that would be obscured by treating expected support as a single undifferentiated construct. Comparative European research provides a useful context for interpreting these configurations, showing that the economic potential and institutional requirements of NWFP activities vary according to the product, region, tenure regime, management system, and stakeholder profile [55]. Evidence from China further indicates that the relevance of training, subsidies, property-rights arrangements, and local institutions may differ across NWFP types and producer groups, making uniform interventions less effective [56]. Together, these studies support the substantive plausibility of domain-specific expectations, while the present study extends this literature by translating such expectations into an explicit, model-based classification.
The model-generated support-priority groups therefore reflect different configurations of expected benefits rather than differing only in their overall level. This is particularly evident when comparing the Low and Medium groups. Their expectations of administrative support were similar, whereas the Medium group had higher expectations of information and education support and market and infrastructure support. This pattern reinforces the value of treating expected association benefits as multidimensional rather than reducing them to a single continuum.
4.2. The Role of Market and Infrastructure Support
Among the three domains of expected association benefits, market and infrastructure support had the highest mean index value (0.499), followed by information and education support (0.427) and administrative support (0.371) (Table 2). This indicates that, on average, households named a larger proportion of the listed services in the market and infrastructure domain than in the other two domains. The finding is consistent with recurrent constraints identified in NWFP commercialization studies. Individual collectors often sell small and irregular quantities, operate across dispersed territories, lack information about prices and buyers, and depend on intermediaries for transport and market access [1,13].
The relevance of market and infrastructure support is further illustrated by the direct logistic regression reported in Section 3.8. When the three indices were included simultaneously, only the market and infrastructure index showed a statistically significant association with stated willingness to participate in establishing an association (OR = 8.22, 95% CI: 3.40–19.86, for a one-unit increase across the full 0–1 index range). This result supports an association between market and infrastructure expectations and stated willingness within the fitted model, but does not establish statistically significant differences between the associations of the three domains. The regression and the rule-based classification also address different questions. The regression estimates the association of each index with stated willingness while holding the other two constant, whereas the rule base was specified a priori, without reference to stated willingness, to describe configurations of expected benefits across all three domains. The non-significant odds ratios for the administrative support index and the information and education support index therefore indicate that these domains added little to the association with stated willingness once market and infrastructure expectations were considered; they do not imply that these domains are irrelevant for describing households’ expected benefits. In addition, the analysis is observational and does not establish a causal relationship. Moreover, direct regression was included as a benchmark for comparing analytical approaches rather than as a basis for determining the relative effectiveness of different forms of institutional support.
Previous research highlights the importance of value-chain organization, market coordination, and relationships between collectors and downstream actors in NWFP commercialization [27,28,47]. Collective organization may help address market-access constraints by aggregating supply, coordinating quality, facilitating negotiations with buyers, and potentially reducing transaction costs [8,21]. Evidence from Finland similarly indicates that small NWFP operators may face barriers related to equipment, market information, and the quantities required by established buyers [57]. Innovation networks may also facilitate cooperation among collectors, processors, businesses, researchers, and public institutions, potentially improving coordination and market access [58].
Nevertheless, collective marketing does not automatically improve collectors’ bargaining power or their share of added value. Such outcomes also depend on market structures, access to information, and relationships with downstream actors [21,28]. Network-based approaches to NWFP marketing and European innovation cases illustrate opportunities for coordinated marketing, cooperation among value-chain actors, product development, and improved market access [47,59]. These examples indicate potential functions of collective organization rather than services whose expected benefits were directly measured in the present survey.
4.3. High Support Priority Is Associated with the Highest Stated Willingness
Households in the High support-priority group expected associations to provide benefits across administrative, information and education, and market and infrastructure support. This configuration is consistent with evidence that NWFP development often requires coordinated support across regulation, knowledge, technology, finance, processing, marketing, and resource governance rather than isolated interventions [57,59]. Innovation networks similarly bring together collectors, producers, processors, researchers, public authorities, and businesses to address multiple constraints simultaneously [58]. Households in this group also reported the highest stated willingness to participate in establishing an association. Because stated willingness was not used in constructing the framework, its association with the model-generated groups provides convergent evidence that the classification captures differences that are also reflected in households’ stated willingness. Associations may provide regulatory and funding assistance, technical knowledge, shared equipment, harvesting coordination, and stronger negotiation with buyers and public authorities [8,28,60].
This result is consistent with collective-action theory, in which participation becomes more likely when anticipated benefits are sufficient relative to the costs of cooperation [5,31]. Research on producer organizations likewise identifies market access, bargaining power, information, training and knowledge exchange as relevant to participation, while NWFP studies emphasize trust, legitimacy, local knowledge, stakeholder inclusion, and organizational credibility [8,32,33,61,62].
This association should not, however, be interpreted causally. The analysis does not demonstrate that stronger expectations produce stated willingness to participate in establishing an association or that association membership would necessarily deliver the expected services. Both variables reflect respondents’ stated perceptions at one point in time. The present findings therefore show that the model-generated groups are associated with a conceptually related, separately measured indicator of stated willingness; they do not constitute independent external validation.
4.4. Low Support Priority and Stated Willingness to Participate
Although the Low support-priority group had low mean expected benefits across all three dimensions, 68.2% of households with valid responses in this group expressed willingness to participate in establishing an association. However, this finding applies only to the primary analytical sample. In additional sensitivity analysis, assigning the 150 households with no recorded service selections to the Low group reduced stated willingness to 25.6% (Section 3.7). This substantial difference demonstrates that the observed relationship between Low support priority and stated willingness is sensitive to the treatment of households without recorded service selections.
These findings highlight the importance of distinguishing expected association benefits from stated willingness. Although limited expectations do not necessarily indicate unwillingness to participate, the primary-sample estimate of 68.2% should not be generalized to households with no recorded service selections. Several interpretations are possible but cannot be distinguished with the available data. Expectations may reflect incomplete information about organizational functions, trust in potential leaders and members, perceptions of fairness, previous organizational experience, or confidence that promised benefits will be delivered [5,30]. Weak leadership and limited member engagement may also reduce the credibility of formal organizations [29,63], while collectors may rely on informal networks and intermediaries rather than associations [15]. These explanations remain interpretive rather than empirical conclusions from the present study. The Low support-priority classification should therefore not be interpreted as a direct measure of households’ willingness or unwillingness to participate in establishing an association. Information provision, consultation, demonstration activities, and opportunities for gradual participation could be explored to better understand whether limited expressed expectations reflect low demand, insufficient knowledge, weak institutional trust, or needs not captured by the questionnaire. However, the effectiveness of such approaches cannot be established from the present findings.
4.5. Exploratory Associations Between Household Characteristics and Support-Priority Groups
Exploratory associations between the support-priority groups and selected socio-economic and NWFP-related characteristics remained significant for five of the 12 examined characteristics after correction for multiple testing: membership in collectors’ associations, the main market for selling NWFPs, cooperation with other collectors, employment status, and education level. No statistically significant association was detected after correction for perceived importance of NWFP income, price determination, household income, collection license, gender, forest ownership, or the presence of a permanent buyer. The observed associations were modest in magnitude (Cramer’s V = 0.144–0.215) and should be interpreted as exploratory rather than as evidence of causal relationships.
Previous European research has documented heterogeneity among NWFP collectors, including differences in harvesting activities, specialization, and the role of collection in household livelihoods [40,41]. Other studies have examined how socioeconomic characteristics and commercialization patterns relate to collectors’ activities and market participation [4,15,16]. Although these findings provide useful context, they do not imply that the same characteristics distinguish support-priority groups across different products and regions.
The association with the main market for selling NWFPs may reflect differences in households’ relationships with buyers and intermediaries, access to market information, transaction costs, and opportunities for coordinated marketing [21,29,47,57]. However, the present analysis does not establish which market mechanisms account for the observed association. Existing association membership may likewise be related to familiarity with organizational services, although the cross-sectional design cannot establish whether membership shaped expectations or households with particular expectations were more likely to become members. Research on mushroom governance in Catalonia illustrates how relationships among collectors, communities, and decision-makers may influence information exchange, participation in governance, and perceptions of organizational arrangements [61].
The absence of statistically significant associations with gender and forest ownership after correction is also relevant. These characteristics did not significantly distinguish the support-priority groups in this sample, although previous studies have documented gender-related differences in forest product collection in other contexts [17]. This highlights the context-specific nature of NWFP participation and cautions against directly transferring assumptions between products, regions, or countries.
4.6. Potential Applications for Differentiated Institutional Support Planning
The findings suggest that the model-generated configurations of expected association benefits could serve as exploratory diagnostic input for differentiated institutional support planning. By distinguishing combinations of expectations across administrative, information and education, and market and infrastructure domains, the framework may help identify topics for further consultation with collectors. However, these configurations should not be interpreted as fixed groups requiring predetermined interventions. Their potential application depends on product-specific, regional, institutional, and socio-economic conditions [55,56], as well as the circumstances of different NWFP-related actors [62].
Any consideration of differentiated support should involve collectors in identifying relevant organizational objectives and services, rather than relying exclusively on model-generated classifications. Previous research emphasizes the importance of stakeholder participation in organizational decision-making and benefit distribution [28,63,64], while Başkent et al. [60] highlight the need to integrate technical, economic, and social dimensions of NWFP management. Accordingly, the framework could inform participatory discussions about expected association services, but it does not establish which interventions would be needed or effective. Moreover, model-generated support priority should not be equated with socio-economic need, vulnerability, or eligibility for public support.
Comparisons with alternative approaches did not demonstrate a stronger association with stated willingness for the rule-based classification (Section 3.8). Furthermore, the fuzzy and crisp applications of the complete rule base produced identical classifications for all attainable input profiles, indicating no additional classification benefit from fuzzification itself in this study. Its potential value therefore lies in the explicit and interpretable representation of expected-benefit configurations, rather than superior statistical performance. In this respect, the framework may complement participatory assessments, expert judgement, and other socio-economic and policy criteria when exploring institutional support options [49,55].
4.7. Policy Implications and Institutional Applicability in Serbia
In Serbia, NWFP collection is governed by forestry, nature conservation, and environmental regulations, including requirements concerning the commercial collection and trade of wild species [38,42]. These regulatory mechanisms primarily address resource use and conservation, while the available evidence does not establish the existence of a dedicated, systematically documented support framework for NWFP collectors’ associations. Information on the extent to which collecting households benefit from existing support measures is also limited.
Previous European research has identified both the integration of NWFPs into sectoral innovation policies and targeted support through rural development institutions as potential approaches [65]. In Serbia, the proposed framework could be explored as a supplementary diagnostic tool when assessing potential adaptations of existing forestry and rural development support instruments or when considering future initiatives for collectors’ collective organization. Any such application would require an assessment of existing programs and institutional responsibilities, consultation with collectors and relevant institutions, and pilot testing before the framework could inform specific support decisions.
4.8. Limitations and Future Research
Several limitations should be considered. First, the study used a non-probability sample from selected municipalities in two regions of Serbia. Households were reached through NWFP-purchasing enterprises, personal contacts, and referrals, and the findings should therefore not be generalized to all NWFP-collecting households in Serbia. Although the primary analyses did not account for clustering within municipalities, a sensitivity analysis addressing this dependence supported the same substantive conclusions, with wider confidence intervals (Section 3.4); the other reported tests and bootstrap intervals do not account for this dependence. Second, the primary analysis included households that named at least one of the listed services and for which all ten service items were recorded. Comparisons with non-included households indicated differences in several observed characteristics, which should be considered when interpreting the findings. Most households with no recorded service selections stated that they would not join an association under any conditions; their exclusion therefore probably led to an overestimation of stated willingness in the Low group and to an underestimation of the association between the support-priority groups and stated willingness (Section 3.7). Third, expected association benefits were measured using binary multiple-response items and summarized as equally weighted formative indices. Not naming a listed service does not necessarily imply the absence of an expectation regarding that service, and more differentiated response scales could capture the intensity of expectations more precisely.
Fourth, stated willingness was hypothetical and was measured in the same questionnaire as expected association benefits. Its association with the model-generated groups should therefore be interpreted as convergent evidence rather than independent external validation, and it does not demonstrate either causality or actual future participation. Shared response tendencies, including a tendency to select many services and answer affirmatively to the willingness question, could contribute to the observed association and could not be separated from substantive relationships using the available data. Missing willingness responses were also unevenly distributed across the groups. In addition, the membership functions and rule base were specified by the authors rather than derived through formal expert elicitation. Although alternative specifications were examined in the sensitivity analyses, independent validation would provide a stronger assessment of the framework’s robustness and transferability. The benchmark AIC and AUC values describe fit and discrimination within the analyzed sample and should not be interpreted as evidence of predictive performance in new households. Finally, the framework classifies patterns of expected association benefits; it does not measure household vulnerability, eligibility for support, or the effectiveness of particular policy interventions. If the framework were subsequently used in resource-allocation decisions, the possibility of strategic responding would need to be considered. Information on whether households had previously received public support was not available.
These limitations constrain how the proposed classification can be interpreted for policy purposes. The non-probability sampling approach and the selection of households with complete service-response data limit the representativeness of the identified groups, while the author-defined model specifications affect how expected benefits are translated into support-priority categories. Moreover, the cross-sectional data provide no evidence that specific institutional interventions would improve participation or deliver the expected benefits. Accordingly, the framework should be regarded as an exploratory diagnostic and planning tool rather than a validated basis for assigning interventions or allocating resources. Its potential institutional use would require independent validation, participatory assessment of collectors’ needs, and pilot evaluation of proposed support measures.
Future research could use graded response scales and examine additional factors such as participation costs, trust, leadership, fairness, and previous organizational experience. Longitudinal studies could assess whether stated expectations and willingness are followed by association formation, continued participation, and actual use of organizational services. Qualitative interviews and focus groups could further clarify how households form expectations about association services. Independent validation across different regions, products, and institutional settings would also help establish the transferability of the proposed framework.
5. Conclusions
This study developed and evaluated an interpretable rule-based classification framework to operationalize NWFP collectors’ expected association benefits in Serbia. By integrating ten expected services into the three institutional support dimensions (administrative, information and education, and market and infrastructure), the framework generated three model-based support-priority groups reflecting different patterns of expected benefits.
The Low group reported limited expected benefits across all three dimensions, whereas the High group expressed consistently high expectations. The Medium group showed a mixed pattern, with low administrative-support expectations and intermediate expectations in the other two domains. H1 was partly supported: stated willingness to participate in establishing an association was significantly higher in the High group than in the Low and Medium groups, between which no statistically significant difference was detected. An additional sample-definition sensitivity analysis also showed that assigning households with no recorded service selections to the Low group under an explicit zero-score assumption substantially reduced the proportion expressing stated willingness in that group.
The complete 27-rule framework was implemented using fuzzy inference, but its crisp application produced identical group assignments for all 80 possible input profiles. Moreover, comparisons with alternative approaches did not demonstrate a stronger association with stated willingness for the rule-based classification. These findings indicate that the framework’s contribution lies primarily in the explicit and interpretable representation of expected-benefit configurations, rather than in additional classification benefits from fuzzification. The direct logistic regression further showed that only the market and infrastructure support index was statistically significantly associated with stated willingness after accounting for the other two indices. This finding does not invalidate the inclusion of administrative and information and education support in the rule-based framework, as the classification was designed to represent multidimensional expectations rather than optimize their association with stated willingness. The two approaches therefore address related but conceptually different questions.
From a policy perspective, the framework could be explored as an initial diagnostic tool to consider how association-based support could respond to different patterns of expected benefits across administrative, information and education, and market and infrastructure services. Public forestry administrations, rural-development agencies, and collector organizations could use the identified configurations as topics for consultation when considering association-development programmes, extension activities, or shared services. However, the classification should inform rather than automate decisions. Any practical application would require participatory assessment and pilot evaluation, together with local consultation, expert judgement, and socio-economic and territorial criteria. Periodic reassessment would also be necessary to account for changes in market conditions, regulations, organizational experience, and collectors’ expectations.
The principal contribution of this study is an operational framework for translating multidimensional expected association benefits into interpretable model-generated groups, assessing their association with separately measured stated willingness, and evaluating the robustness of the resulting classification. The framework thereby provides a transparent analytical basis for exploring how collectors’ expressed expectations may inform association-based support planning in Serbia.
Supplementary Materials
The following supporting information can be downloaded at https://www.mdpi.com/article/10.3390/f17111269/s1, Table S1a. Sample flow from the 639 surveyed households to the primary analytical sample; Table S1b. Comparison of included (n = 465) and non-included (n = 174) households; Table S2. Membership degrees of the attainable index values under the reference membership functions; Table S3. Initial 12-rule base used in the sensitivity analysis; Table S4. Logistic regression of stated willingness on support-priority group and covariates (non-members, N = 441); Table S5. Stated willingness by support-priority group within each region. Table S6a. Sensitivity analysis: classification under the alternative scenarios; Table S6b. Sensitivity analysis: stated willingness under the alternative scenarios; Table S7a. Households assigned the fallback score under the initial 12-rule base, by input configuration and by group under the complete rule base; Table S7b. Cross-classification of households under the initial 12-rule base and the complete 27-rule base (N = 465); Table S8a. Association with stated willingness for the rule-based classification and alternative approaches; Table S8b. Differences in Cramer’s V between classifications, with 95% bootstrap confidence intervals; Table S9. Stated willingness by input configuration. Code S1. R code implementing the fuzzy rule-based system and the reported analyses.
Author Contributions
Conceptualization, Đ.D., N.J. and Ž.I.; Methodology, Đ.D. and M.P.; Formal analysis, Đ.D. and M.P.; Investigation, N.J.; Writing—original draft, Đ.D., N.J. and Ž.I.; Writing—review and editing, Đ.D., N.J., Ž.I. and N.D.; Visualization, Đ.D.; Supervision, N.D. and M.P. All authors have read and agreed to the published version of the manuscript.
Funding
This research was conducted as part of the FAO-funded project “In-depth study on the use of non-wood forest products (NWFPs) in selected Western Balkan countries,” implemented by the Regional Centre for Forestry and Rural Development (REFORD) in North Macedonia, Serbia, and Albania. The authors gratefully acknowledge the financial support provided by the Food and Agriculture Organization of the United Nations (FAO). Research was partially supported by the Ministry of Science, Technological Development and Innovation of the Republic of Serbia, based on the Agreement on the financing of scientific research work of SRO in 2026 [grant agreement No. 451-03-34/2026-03/200169 from 5 February 2026].
Institutional Review Board Statement
The original household survey was conducted in 2022 within the FAO-supported REFORD project, and no formal ethics committee approval or exemption was obtained. The present study involved a secondary analysis of anonymized survey data, without additional contact with respondents or access to directly identifying personal information.
Informed Consent Statement
Before the original household interviews, respondents were informed about the purpose of the survey, the voluntary and anonymous nature of participation, and the confidential treatment of responses. Verbal informed consent was obtained before participation. The present secondary analysis involved no additional participant contact.
Data Availability Statement
Restrictions apply to the availability of these data. The dataset used in this study was obtained from the Food and Agriculture Organization of the United Nations (FAO), which is the source and copyright owner of the data. The authors were authorized by FAO to use the dataset for the purposes of this research and publication; however, they do not own the underlying data. Requests for access to the dataset should be directed to the authors and are subject to permission from FAO. The R code implementing the fuzzy rule-based system and the reported analyses, including both rule bases, is provided in the Supplementary Materials (Code S1). The code does not contain the survey data.
Acknowledgments
We are thankful to all the interviewees who agreed to participate in this study and support the data collection process.
Conflicts of Interest
The authors declare no conflicts of interest. The funders had no role in the design of the study; in the collection, analyses, or interpretation of data; in the writing of the manuscript; or in the decision to publish the results.
Appendix A
Table A1.
Complete 27-rule reference specification of the fuzzy rule-based decision-support framework, with the number of households for each combination of input levels (N = 465).
References
- Neumann, R.P.; Hirsch, E. Commercialisation of Non-Timber Forest Products: Review and Analysis of Research; Center for International Forestry Research (CIFOR): Bogor, Indonesia, 2000. [Google Scholar]
- Shackleton, C.; Shackleton, S. The Importance of Non-Timber Forest Products in Rural Livelihood Security and as Safety Nets: A Review of Evidence from South Africa. S. Afr. J. Sci. 2004, 100, 658–664. [Google Scholar]
- Shackleton, S.; Shackleton, C.; Shanley, P. (Eds.) Non-Timber Forest Products in the Global Context, 1st ed.; Springer: Berlin/Heidelberg, Germany, 2011; ISBN 978-3-642-26755-0. [Google Scholar]
- Angelsen, A.; Jagger, P.; Babigumira, R.; Belcher, B.; Hogarth, N.J.; Bauch, S.; Börner, J.; Smith-Hall, C.; Wunder, S. Environmental Income and Rural Livelihoods: A Global-Comparative Analysis. World Dev. 2014, 64, S12–S28. [Google Scholar] [CrossRef] [Scilit] [PubMed]
- Ostrom, E. Governing the Commons: The Evolution of Institutions for Collective Action; Cambridge University Press: Cambridge, UK, 1990. [Google Scholar]
- Agrawal, A. Common Property Institutions and Sustainable Governance of Resources. World Dev. 2001, 29, 1649–1672. [Google Scholar] [CrossRef] [Scilit]
- Belcher, B.; Ruíz-Pérez, M.; Achdiawan, R. Global Patterns and Trends in the Use and Management of Commercial NTFPs: Implications for Livelihoods and Conservation. World Dev. 2005, 33, 1435–1452. [Google Scholar] [CrossRef] [Scilit]
- Markelova, H.; Meinzen-Dick, R.; Hellin, J.; Dohrn, S. Collective Action for Smallholder Market Access. Food Policy 2009, 34, 1–7. [Google Scholar] [CrossRef] [Scilit]
- Cunningham, A.B. Applied Ethnobotany: People, Wild Plant Use and Conservation; Earthscan: London, UK, 2001. [Google Scholar]
- Ghanbari, S.; Weiss, G.; Liu, J.; Eastin, I.; Fathizadeh, O.; Moradi, G. Potentials and Opportunities of Wild Edible Forest Fruits for Rural Household’s Economy in Arasbaran, Iran. Forests 2022, 13, 453. [Google Scholar] [CrossRef] [Scilit]
- Asamoah, O.; Danquah, J.A.; Bamwesigye, D.; Boakye, E.A.; Appiah, M.; Pappinen, A. Perception of Locals on Multiple Contributions of NTFPs to the Livelihoods of Forest Fringe Communities in Ghana. Forests 2024, 15, 861. [Google Scholar] [CrossRef] [Scilit]
- Riedl, M.; Němec, M.; Jarský, V.; Sloup, R. Supply, Trade and Consumption of Major Forest Foods in Czechia: Mushrooms, Forest Fruits and Game Meat. Forests 2026, 17, 802. [Google Scholar] [CrossRef] [Scilit]
- Marshall, E.S.; Schreckenberg, K.; Newton, A.C. (Eds.) Commercialization of Non-Timber Forest Products: Factors Influencing Success; Lessons Learned from Mexico and Bolivia and Policy Implications for Decision-Makers; UNEP-WCMC Biodiversity Series; UNEP World Conservation Monitoring Centre: Cambridge, UK, 2006; ISBN 978-92-807-2677-0. [Google Scholar]
- Chamberlain, J.; Small, C.; Baumflek, M. Sustainable Forest Management for Nontimber Products. Sustainability 2019, 11, 2670. [Google Scholar] [CrossRef] [Scilit]
- Górriz-Mifsud, E.; Ballesteros, M.R.; Descalzo, E.F.; Miravet, A.; Ortega, L.O.; Quiroga, R.; Rodríguez-García, A.; Sánchez-González, M. Commercial Harvesters of Non-Wood Forest Products in Spain: An Exploratory Profiling. Forests 2026, 17, 587. [Google Scholar] [CrossRef] [Scilit]
- Vedeld, P.; Angelsen, A.; Bojö, J.; Sjaastad, E.; Kobugabe Berg, G. Forest Environmental Incomes and the Rural Poor. For. Policy Econ. 2007, 9, 869–879. [Google Scholar] [CrossRef] [Scilit]
- Sunderland, T.; Achdiawan, R.; Angelsen, A.; Babigumira, R.; Ickowitz, A.; Paumgarten, F.; Reyes-García, V.; Shively, G. Challenging Perceptions about Men, Women, and Forest Product Use: A Global Comparative Study. World Dev. 2014, 64, S56–S66. [Google Scholar] [CrossRef] [Scilit]
- Berkes, F. Sacred Ecology: Traditional Ecological Knowledge and Resource Management; Taylor & Francis: Philadelphia, PA, USA, 1999; ISBN 978-1-56032-694-6. [Google Scholar]
- Šišák, L.; Riedl, M.; Dudík, R. Non-Market Non-Timber Forest Products in the Czech Republic—Their Socio-Economic Effects and Trends in Forest Land Use. Land Use Policy 2016, 50, 390–398. [Google Scholar] [CrossRef] [Scilit]
- Brooks, J.S. The Buddha Mushroom: Conservation Behavior and the Development of Institutions in Bhutan. Ecol. Econ. 2010, 69, 779–795. [Google Scholar] [CrossRef] [Scilit]
- Foundjem Tita, D.; D’Haese, M.; Degrande, A.; Tchoundjeu, Z.; Van Damme, P. Farmers’ Satisfaction with Group Market Arrangements as a Measure of Group Market Performance: A Transaction Cost Analysis of Non Timber Forest Products’ Producer Groups in Cameroon. For. Policy Econ. 2011, 13, 545–553. [Google Scholar] [CrossRef] [Scilit]
- Pattanayak, S.K.; Sills, E.O. Do Tropical Forests Provide Natural Insurance? The Microeconomics of Non-Timber Forest Product Collection in the Brazilian Amazon. Land Econ. 2001, 77, 595–612. [Google Scholar] [CrossRef] [Scilit]
- Serra, R.; Rodrigues, E.; García-Barrios, R. Mushrooming Communities: A Field Guide to Mycology in the Community Forests of Portugal. Sustainability 2017, 9, 924. [Google Scholar] [CrossRef] [Scilit]
- Newton, P.; Miller, D.C.; Byenkya, M.A.A.; Agrawal, A. Who Are Forest-Dependent People? A Taxonomy to Aid Livelihood and Land Use Decision-Making in Forested Regions. Land Use Policy 2016, 57, 388–395. [Google Scholar] [CrossRef] [Scilit]
- Gurung, T.; Giri, A.; Nath, A.J.; Shukla, G.; Chakravarty, S. Assessment of Minimum Support Price for Economically Relevant Non-Timber Forest Products of Buxa Tiger Reserve in Foothills of Eastern Himalaya, India. Resources 2025, 14, 88. [Google Scholar] [CrossRef] [Scilit]
- Aransyah, M.F.; Fourqoniah, F.; Sanjaya, A.; Bhahesti, A. Non-Timber Forest Products and Ecotourism: A Bibliometric Review of Scopus-Indexed Literature. BioProducts Bus. 2026, 11, 47–68. [Google Scholar]
- Mishra, B. Exploring Value Chains of Non-Timber Forest Products for Rural Livelihoods and Forest Sustainability. J. Rural. Dev. 2026, 44, 344–366. [Google Scholar] [CrossRef] [Scilit]
- Nakanyete, N.F.; Matengu, K.K.; Diez, J.R. Community Enterprises for Fair Partnerships in Non-Timber Forest Product Value Chains? The Case of San Communities in Northern Namibia. Geoforum 2025, 160, 104237. [Google Scholar] [CrossRef] [Scilit]
- Castañeda Salazar, E.; Guáqueta-Solórzano, V.-E.; Ortíz-Guerrero, C.E. Amazonian Fruits as Emerging Value Networks: Insights from Guaviare, Colombia. Agriculture 2026, 16, 85. [Google Scholar] [CrossRef] [Scilit]
- Poteete, A.R.; Ostrom, E. Heterogeneity, Group Size and Collective Action: The Role of Institutions in Forest Management. Dev. Change 2004, 35, 435–461. [Google Scholar] [CrossRef] [Scilit]
- Olson, M. The Logic of Collective Action: Public Goods and the Theory of Groups; Harvard Economic Studies; Harvard University Press: Cambridge, MA, USA, 1965; ISBN 978-0-674-53750-7. [Google Scholar]
- Hellin, J.; Lundy, M.; Meijer, M. Farmer Organization, Collective Action and Market Access in Meso-America. Food Policy 2009, 34, 16–22. [Google Scholar] [CrossRef] [Scilit]
- Fischer, E.; Qaim, M. Linking Smallholders to Markets: Determinants and Impacts of Farmer Collective Action in Kenya. World Dev. 2012, 40, 1255–1268. [Google Scholar] [CrossRef] [Scilit]
- Chroneos Krasavac, B.; Petković, G. Zadruge u Srbiji-Razvoj i Aktuelna Pitanja. Econ. Agric. 2015, 62, 723–735. [Google Scholar]
- Zakić, V.; Nikolić, M. Finansijska Podrška Države Zadrugama u Srbiji. Škola Biznisa 2018, 1, 158–174. [Google Scholar]
- Ohmura, T.; Creutzburg, L. Guarding the For(Es)t: Sustainable Economy Conflicts and Stakeholder Preference of Policy Instruments. For. Policy Econ. 2021, 131, 102553. [Google Scholar] [CrossRef] [Scilit]
- Schiavon, E.; Taramelli, A.; Tornato, A. Modelling Stakeholder Perceptions to Assess Green Infrastructures Potential in Agriculture through Fuzzy Logic: A Tool for Participatory Governance. Environ. Dev. 2021, 40, 100671. [Google Scholar] [CrossRef] [Scilit]
- Nedeljković, J.; Nonić, D. Comprehensive Insights into Non-Wood Forest Products: A Regional Exploration and In-Depth Analysis in Selected Western Balkan Countries; Food and Agriculture Organization of the United Nations (FAO): Rome, Italy, 2026; Manuscript submitted for publication. [Google Scholar]
- Košanin, A. Organizacija Sakupljanja i Saradnja Sakupljača Nedrvnih Šumskih Proizvoda u Regionu Šumadije i Zapadne Srbije. Bachelor’s Thesis, University of Belgrade-Faculty of Forestry, Belgrade, Serbia, 2026. [Google Scholar]
- Lovrić, M.; Da Re, R.; Vidale, E.; Prokofieva, I.; Wong, J.; Pettenella, D.; Verkerk, P.J.; Mavsar, R. Non-Wood Forest Products in Europe—A Quantitative Overview. For. Policy Econ. 2020, 116, 102175. [Google Scholar] [CrossRef] [Scilit]
- Lovrić, M.; Da Re, R.; Vidale, E.; Prokofieva, I.; Wong, J.; Pettenella, D.; Verkerk, P.J.; Mavsar, R. Collection and Consumption of Non-Wood Forest Products in Europe. For. Int. J. For. Res. 2021, 94, 757–770. [Google Scholar] [CrossRef] [Scilit]
- Nedeljković, J.; Nonić, D.; Ranković, N.; Nonić, M. Održivo Sakupljanje Nedrvnih Šumskih Proizvoda: Karakteristike i Stavovi Sakupljača Na Području Kopaonika i Beljanice. Šumarstvo 2015, 67, 135–150. [Google Scholar]
- Đukić, D.; Nedeljković, J. Udruživanje Sakupljača Nedrvnih Šumskih Proizvoda u Srbiji: Procena Očekivanih Koristi Primenom Fazi Logike. Glas. Šumarskog Fakul. 2025, 132, 45–64. [Google Scholar] [CrossRef] [Scilit]
- Nedeljković, J.; Košanin, A.; Nonić, D. Mogućnosti Saradnje i Udruživanja Sakupljača Nedrvnih Šumskih Proizvoda u Regionu Šumadije i Zapadne Srbije. Glas. Šumarskog Fakul. 2024, 130, 81–92. [Google Scholar] [CrossRef] [Scilit]
- R Core Team. R: A Language and Environment for Statistical Computing; R Foundation for Statistical Computing: Vienna, Austria, 2024. [Google Scholar]
- Pacheco, P.; Paudel, N.S. Communities and Forest Markets: Assessing the Benefits from Diverse Forms of Engagement. In Forests for People: Community Rights and Forest Tenure Reform; Larson, A.M., Barry, D., Dahal, G., Colfer, C.J.P., Eds.; Earthscan: London, UK, 2010; pp. 160–179. [Google Scholar]
- Secco, L.; Pettenella, D.; Maso, D. ‘Net-System’ Models Versus Traditional Models in NWFP Marketing: The Case of Mushrooms. Small-Scale For. 2009, 8, 349–365. [Google Scholar] [CrossRef] [Scilit]
- Cronbach, L.J. Coefficient Alpha and the Internal Structure of Tests. Psychometrika 1951, 16, 297–334. [Google Scholar] [CrossRef] [Scilit]
- Kpadé, C.P.; Tamini, L.D.; Pepin, S.; Khasa, D.P.; Abbas, Y.; Lamhamedi, M.S. Evaluating Multi-Criteria Decision-Making Methods for Sustainable Management of Forest Ecosystems: A Systematic Review. Forests 2024, 15, 1728. [Google Scholar] [CrossRef] [Scilit]
- Mamdani, E.H.; Assilian, S. An Experiment in Linguistic Synthesis with a Fuzzy Logic Controller. Int. J. Man-Mach. Stud. 1975, 7, 1–13. [Google Scholar] [CrossRef] [Scilit]
- Mendel, J.M. Explainable Uncertain Rule-Based Fuzzy System, 3rd ed.; Springer: Cham, Switzerland, 2024; ISBN 978-3-031-35377-2. [Google Scholar]
- Ross, T.J. Fuzzy Logic with Engineering Applications, 3rd ed.; John Wiley: Chichester, UK, 2010; ISBN 978-0-470-74376-8. [Google Scholar]
- Armitage, P. Tests for Linear Trends in Proportions and Frequencies. Biometrics 1955, 11, 375. [Google Scholar] [CrossRef] [Scilit]
- Linzer, D.A.; Lewis, J.B. poLCA: An R Package for Polytomous Variable Latent Class Analysis. J. Stat. Softw. 2011, 42, 1–29. [Google Scholar] [CrossRef] [Scilit]
- Huber, P.; Kurttila, M.; Hujala, T.; Wolfslehner, B.; Sanchez-Gonzalez, M.; Pasalodos-Tato, M.; de-Miguel, S.; Bonet, J.A.; Marques, M.; Borges, J.G.; et al. Expert-Based Assessment of the Potential of Non-Wood Forest Products to Diversify Forest Bioeconomy in Six European Regions. Forests 2023, 14, 420. [Google Scholar] [CrossRef] [Scilit]
- Xie, C.; Jia, Y.; Yang, J.; Zhao, B.; Zhang, Y.; Wu, C. Multidimensional Drivers of Green Production in Non-Timber Forest Products: A Cross-Validation of Econometrics and Machine Learning. Forests 2026, 17, 875. [Google Scholar] [CrossRef] [Scilit]
- Muttilainen, H.; Vilko, J. Heterogenising Forestry Value Production—Drivers and Barriers of Entering the Non-Wood Forest Products Sector. Curr. Res. Environ. Sustain. 2022, 4, 100141. [Google Scholar] [CrossRef] [Scilit]
- Mutke, S.; Bonet, J.A.; Calado, N.; Calvo-Sïmon, J.; Taghoutï, İ.; Redondo, C.; Martïnez De Arano, İ. Innovation Networks on Mediterranean Non Wood Forest Products. J. Innov. Sci. Eng. (JISE) 2019, 3, 1–10. [Google Scholar] [CrossRef] [Scilit]
- Weiss, G.; Ludvig, A.; Živojinović, I. Embracing the Non-Wood Forest Products Potential for Bioeconomy—Analysis of Innovation Cases across Europe. Land 2023, 12, 305. [Google Scholar] [CrossRef] [Scilit]
- Baskent, E.Z.; Borges, J.G.; Pettenella, D.M.; Wei, Y. Sustainable Management and Governance of Non-Wood Forest Products: Unlocking Their Potential. Forests 2024, 15, 1769. [Google Scholar] [CrossRef] [Scilit]
- Gorriz-Mifsud, E.; Secco, L.; Da Re, R.; Pisani, E.; Bonet, J.A. Cognitive Social Capital and Local Forest Governance: Community Ethnomycology Grounding a Mushroom Picking Permit Design. For. Syst. 2023, 32, e001. [Google Scholar] [CrossRef] [Scilit]
- Hamunen, K.; Kurttila, M.; Miina, J.; Peltola, R.; Tikkanen, J. Sustainability of Nordic Non-Timber Forest Product-Related Businesses—A Case Study on Bilberry. For. Policy Econ. 2019, 109, 102002. [Google Scholar] [CrossRef] [Scilit]
- Mala, W.A.; Tieguhong, J.C.; Ndoye, O.; Grouwels, S.; Betti, J.L. Collective Action and Promotion of Forest Based Associations on Non-Wood Forest Products in Cameroon. Dev. Pract. 2012, 22, 1122–1134. [Google Scholar] [CrossRef] [Scilit]
- Tucker, C.M.; Agrawal, A.; Fischer, B.C. The International Forestry Resources and Institutions Research Program: An Elinor Ostrom Creation. Transnatl. Corp. Rev. 2010, 2, 37–41. [Google Scholar] [CrossRef] [Scilit]
- Amici, A.; Beljan, K.; Coletta, A.; Corradini, G.; Danila, I.C.; Da Re, R.; Ludvig, A.; Marčeta, D.; Nedeljković, J.; Nichiforel, L.; et al. Economics, Marketing and Policies of NWFP. In Non-Wood Forest Products in Europe: Ecology and Management of Mushrooms, Tree Products, Understory Plants and Animal Products; Vacik, H., Hale, M., Spiecker, H., Pettenella, D., Tomé, M., Eds.; BoD: Norderstedt, Germany, 2020; pp. 125–209. ISBN 978-3-7494-7546-9. [Google Scholar]
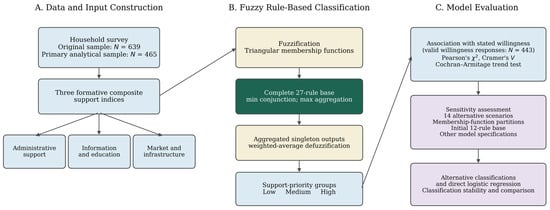
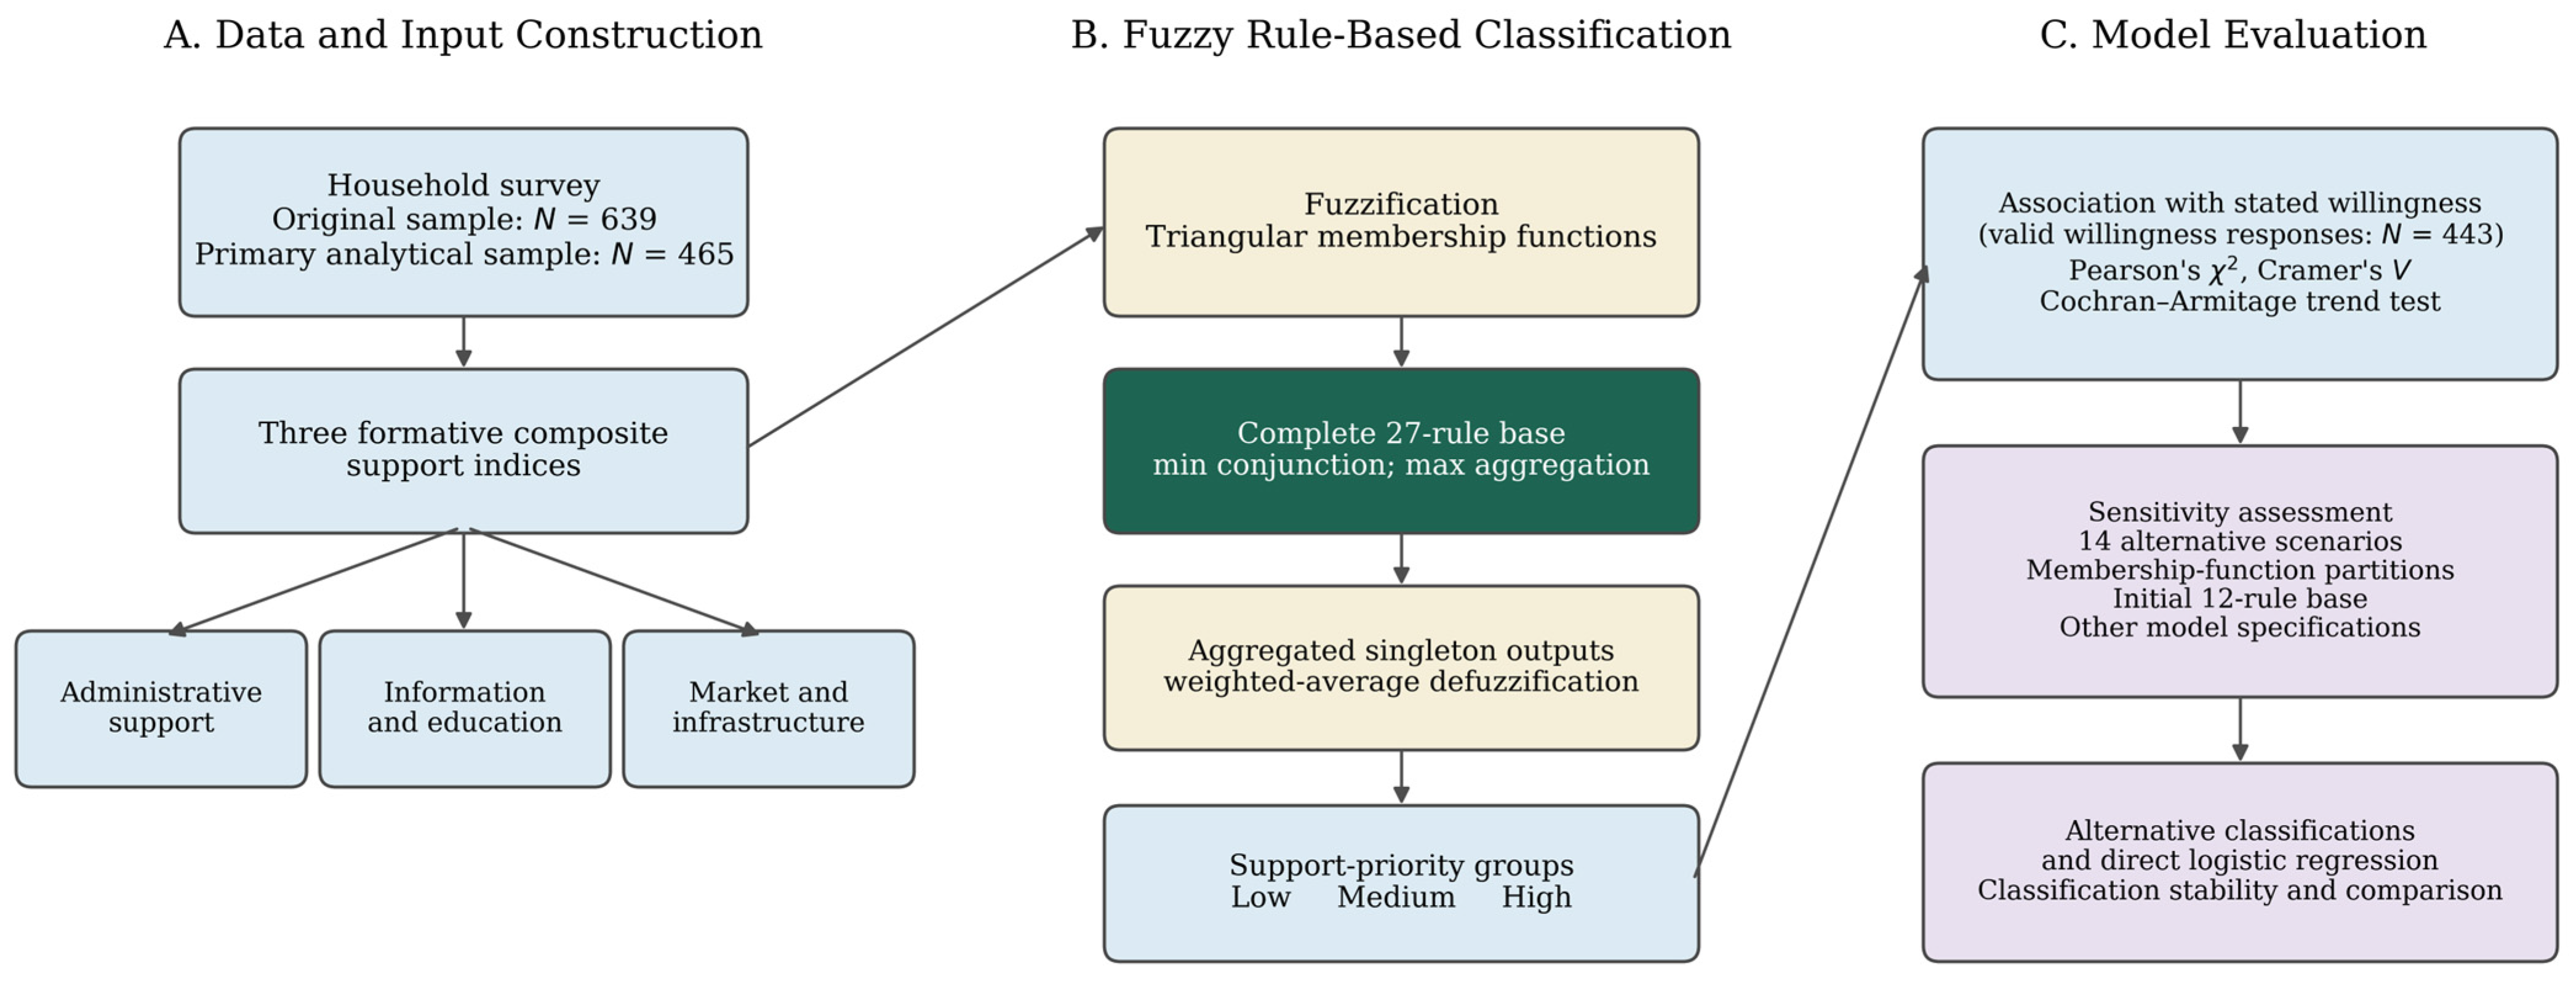
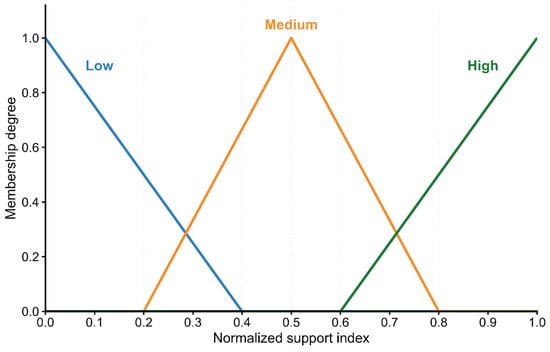
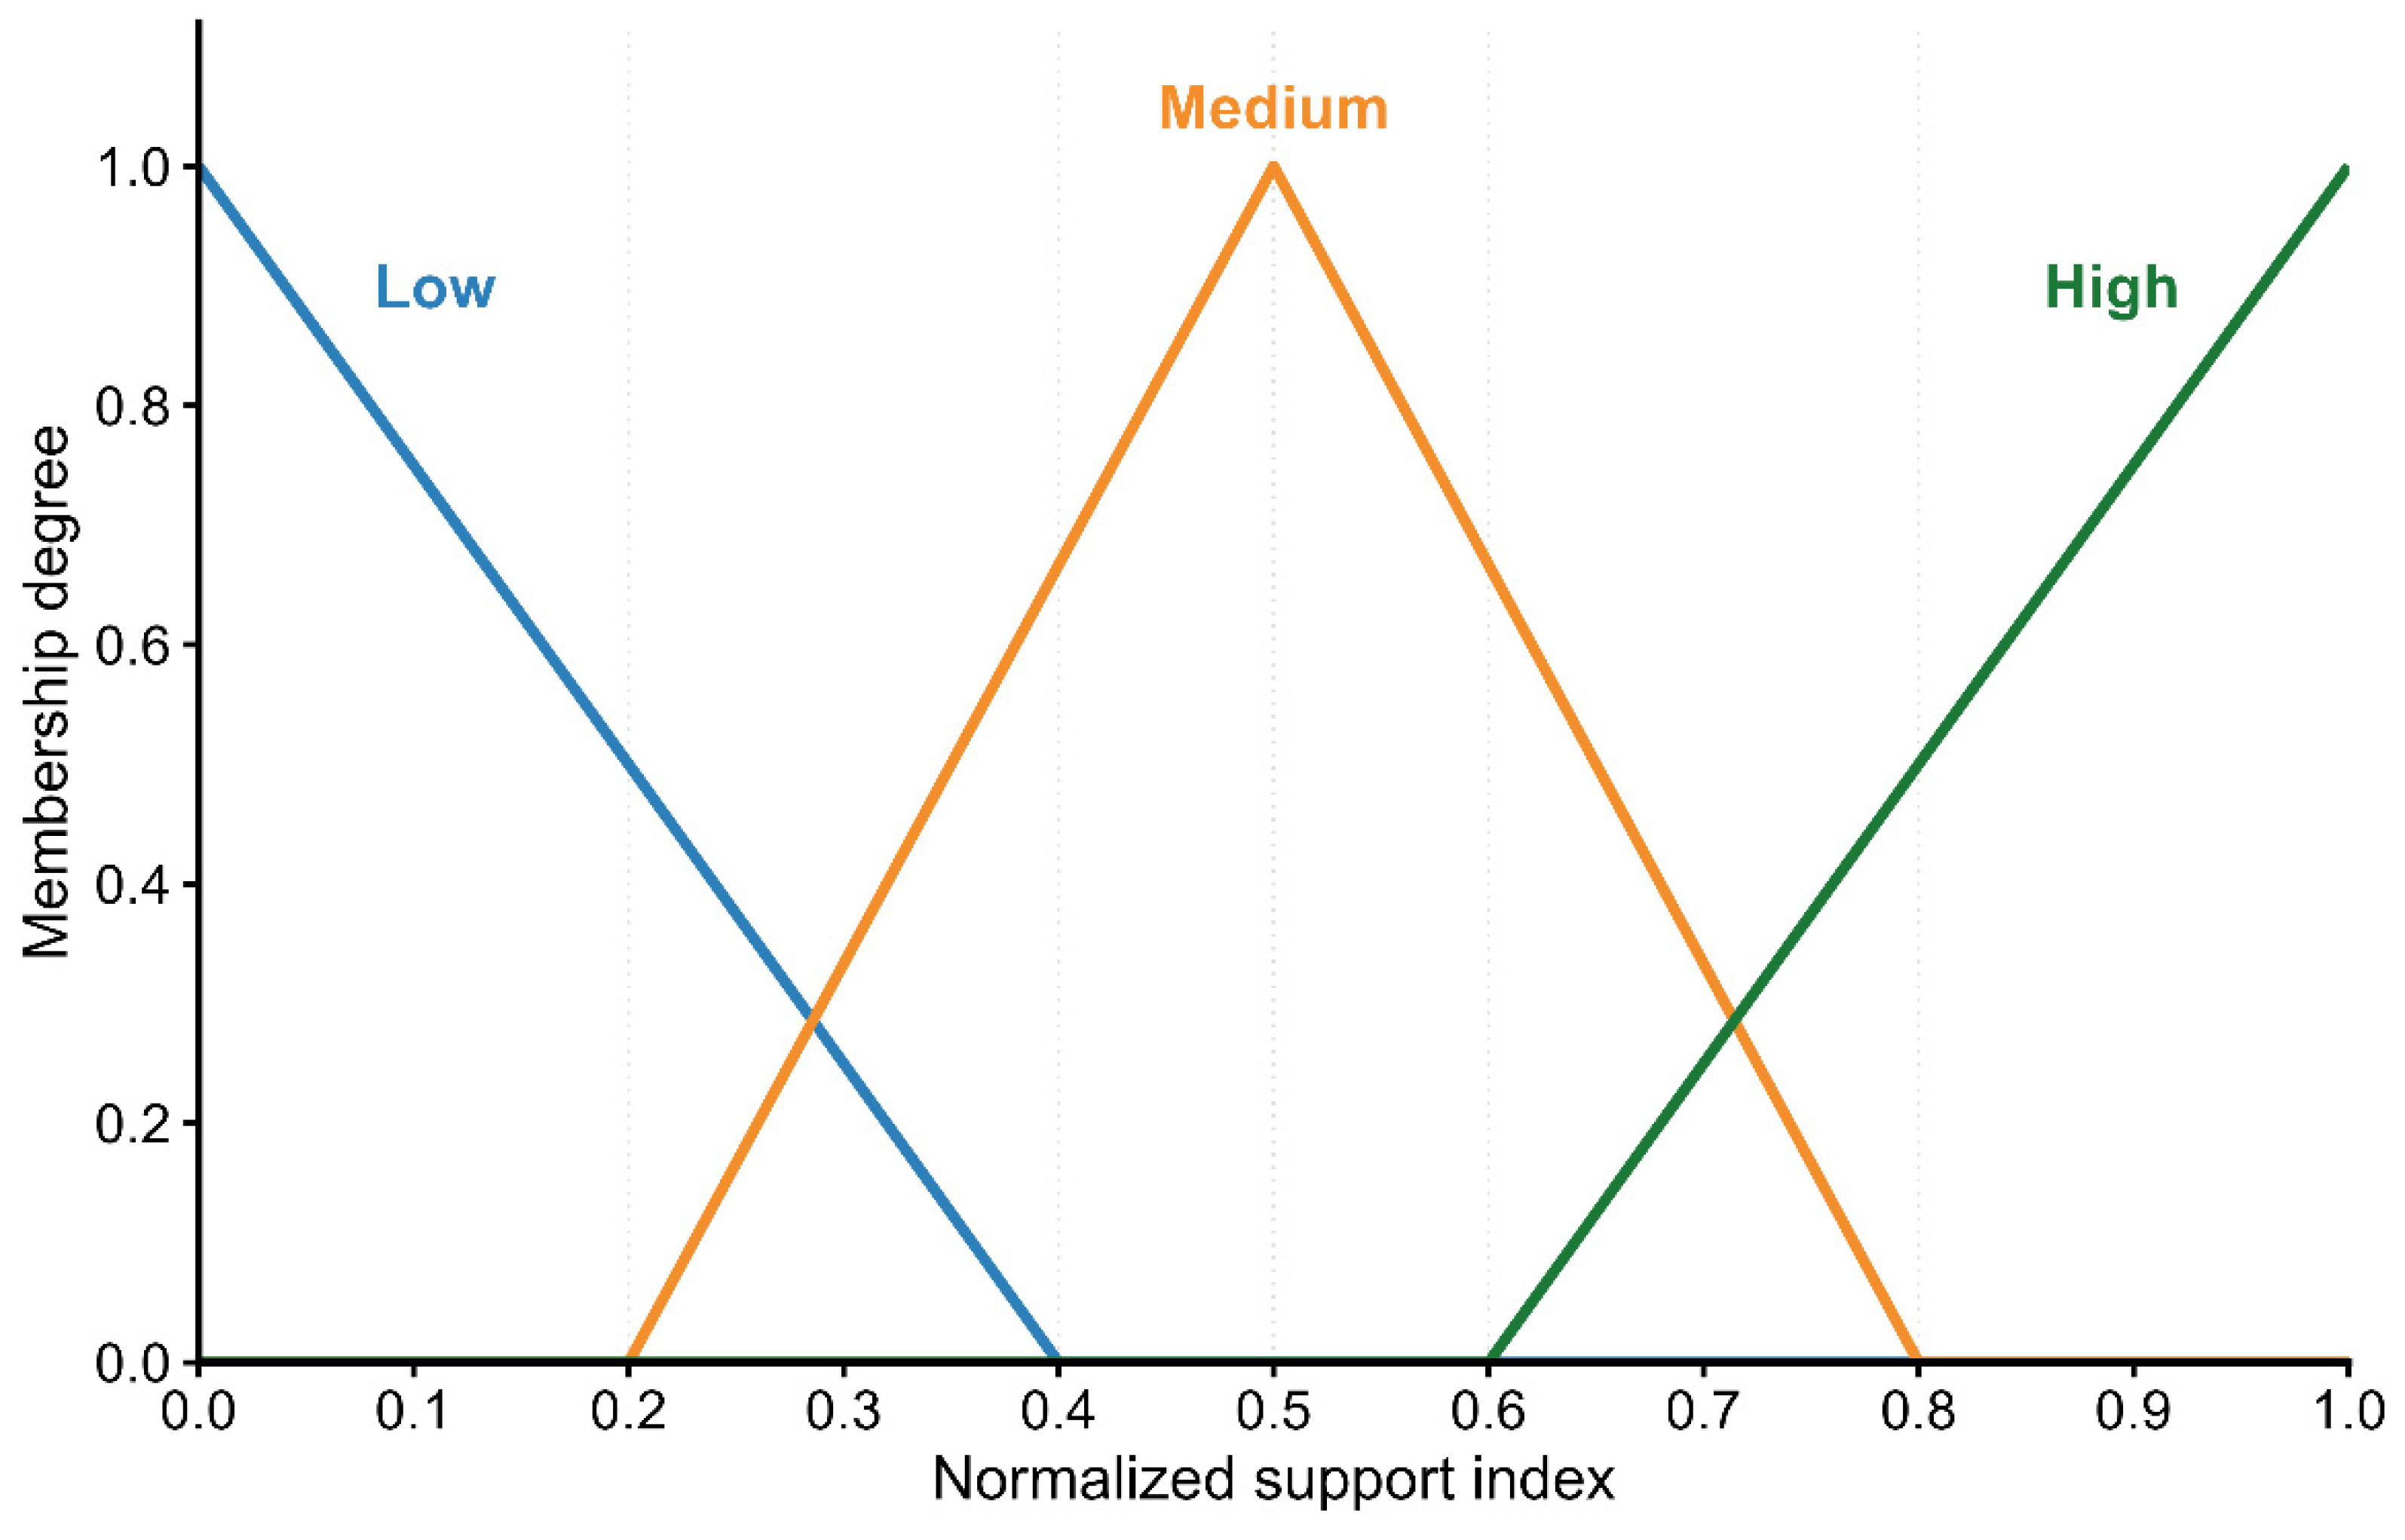
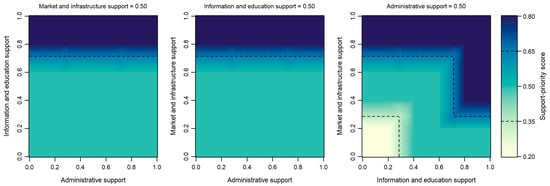
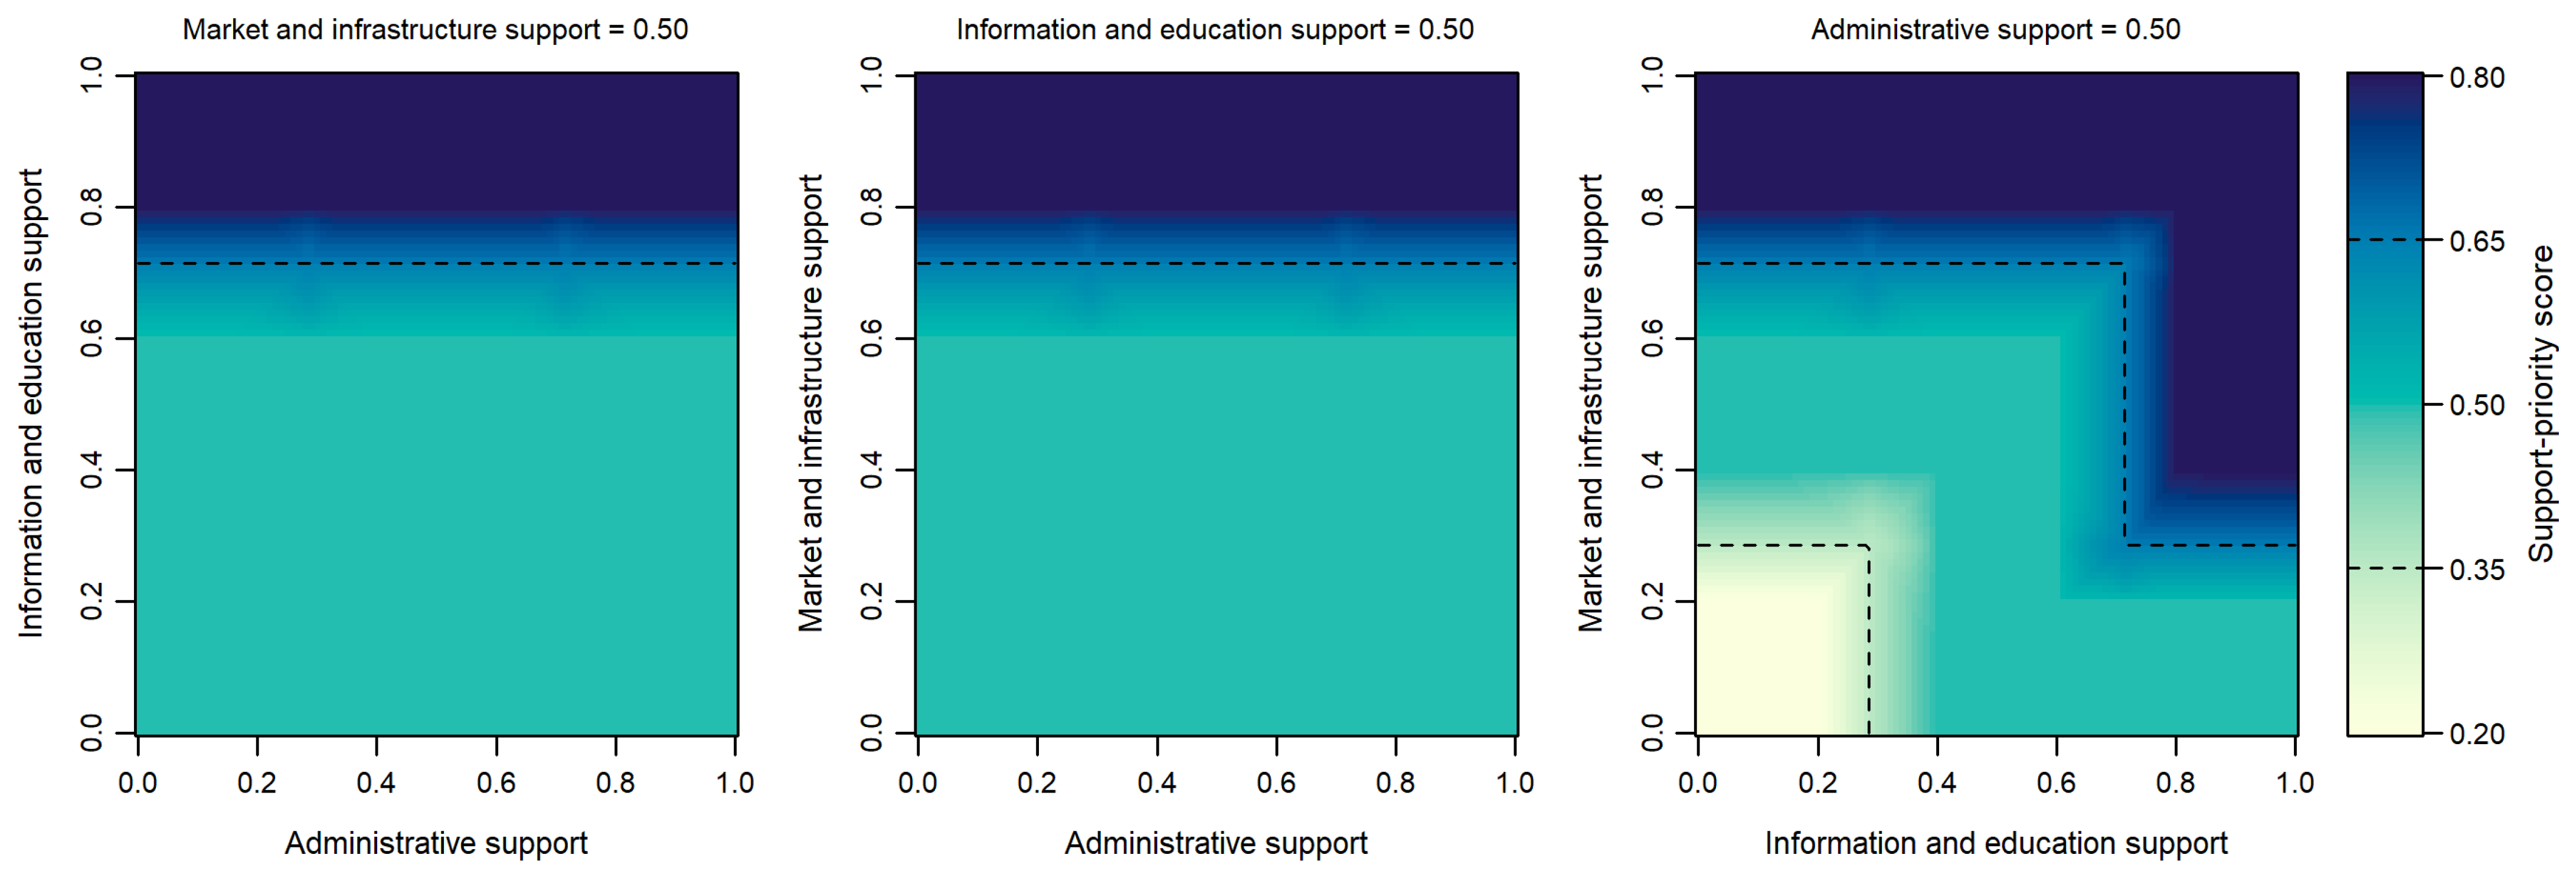
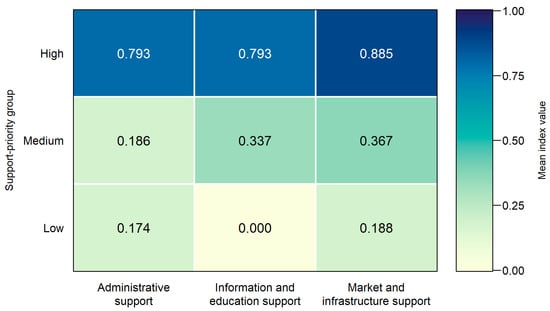
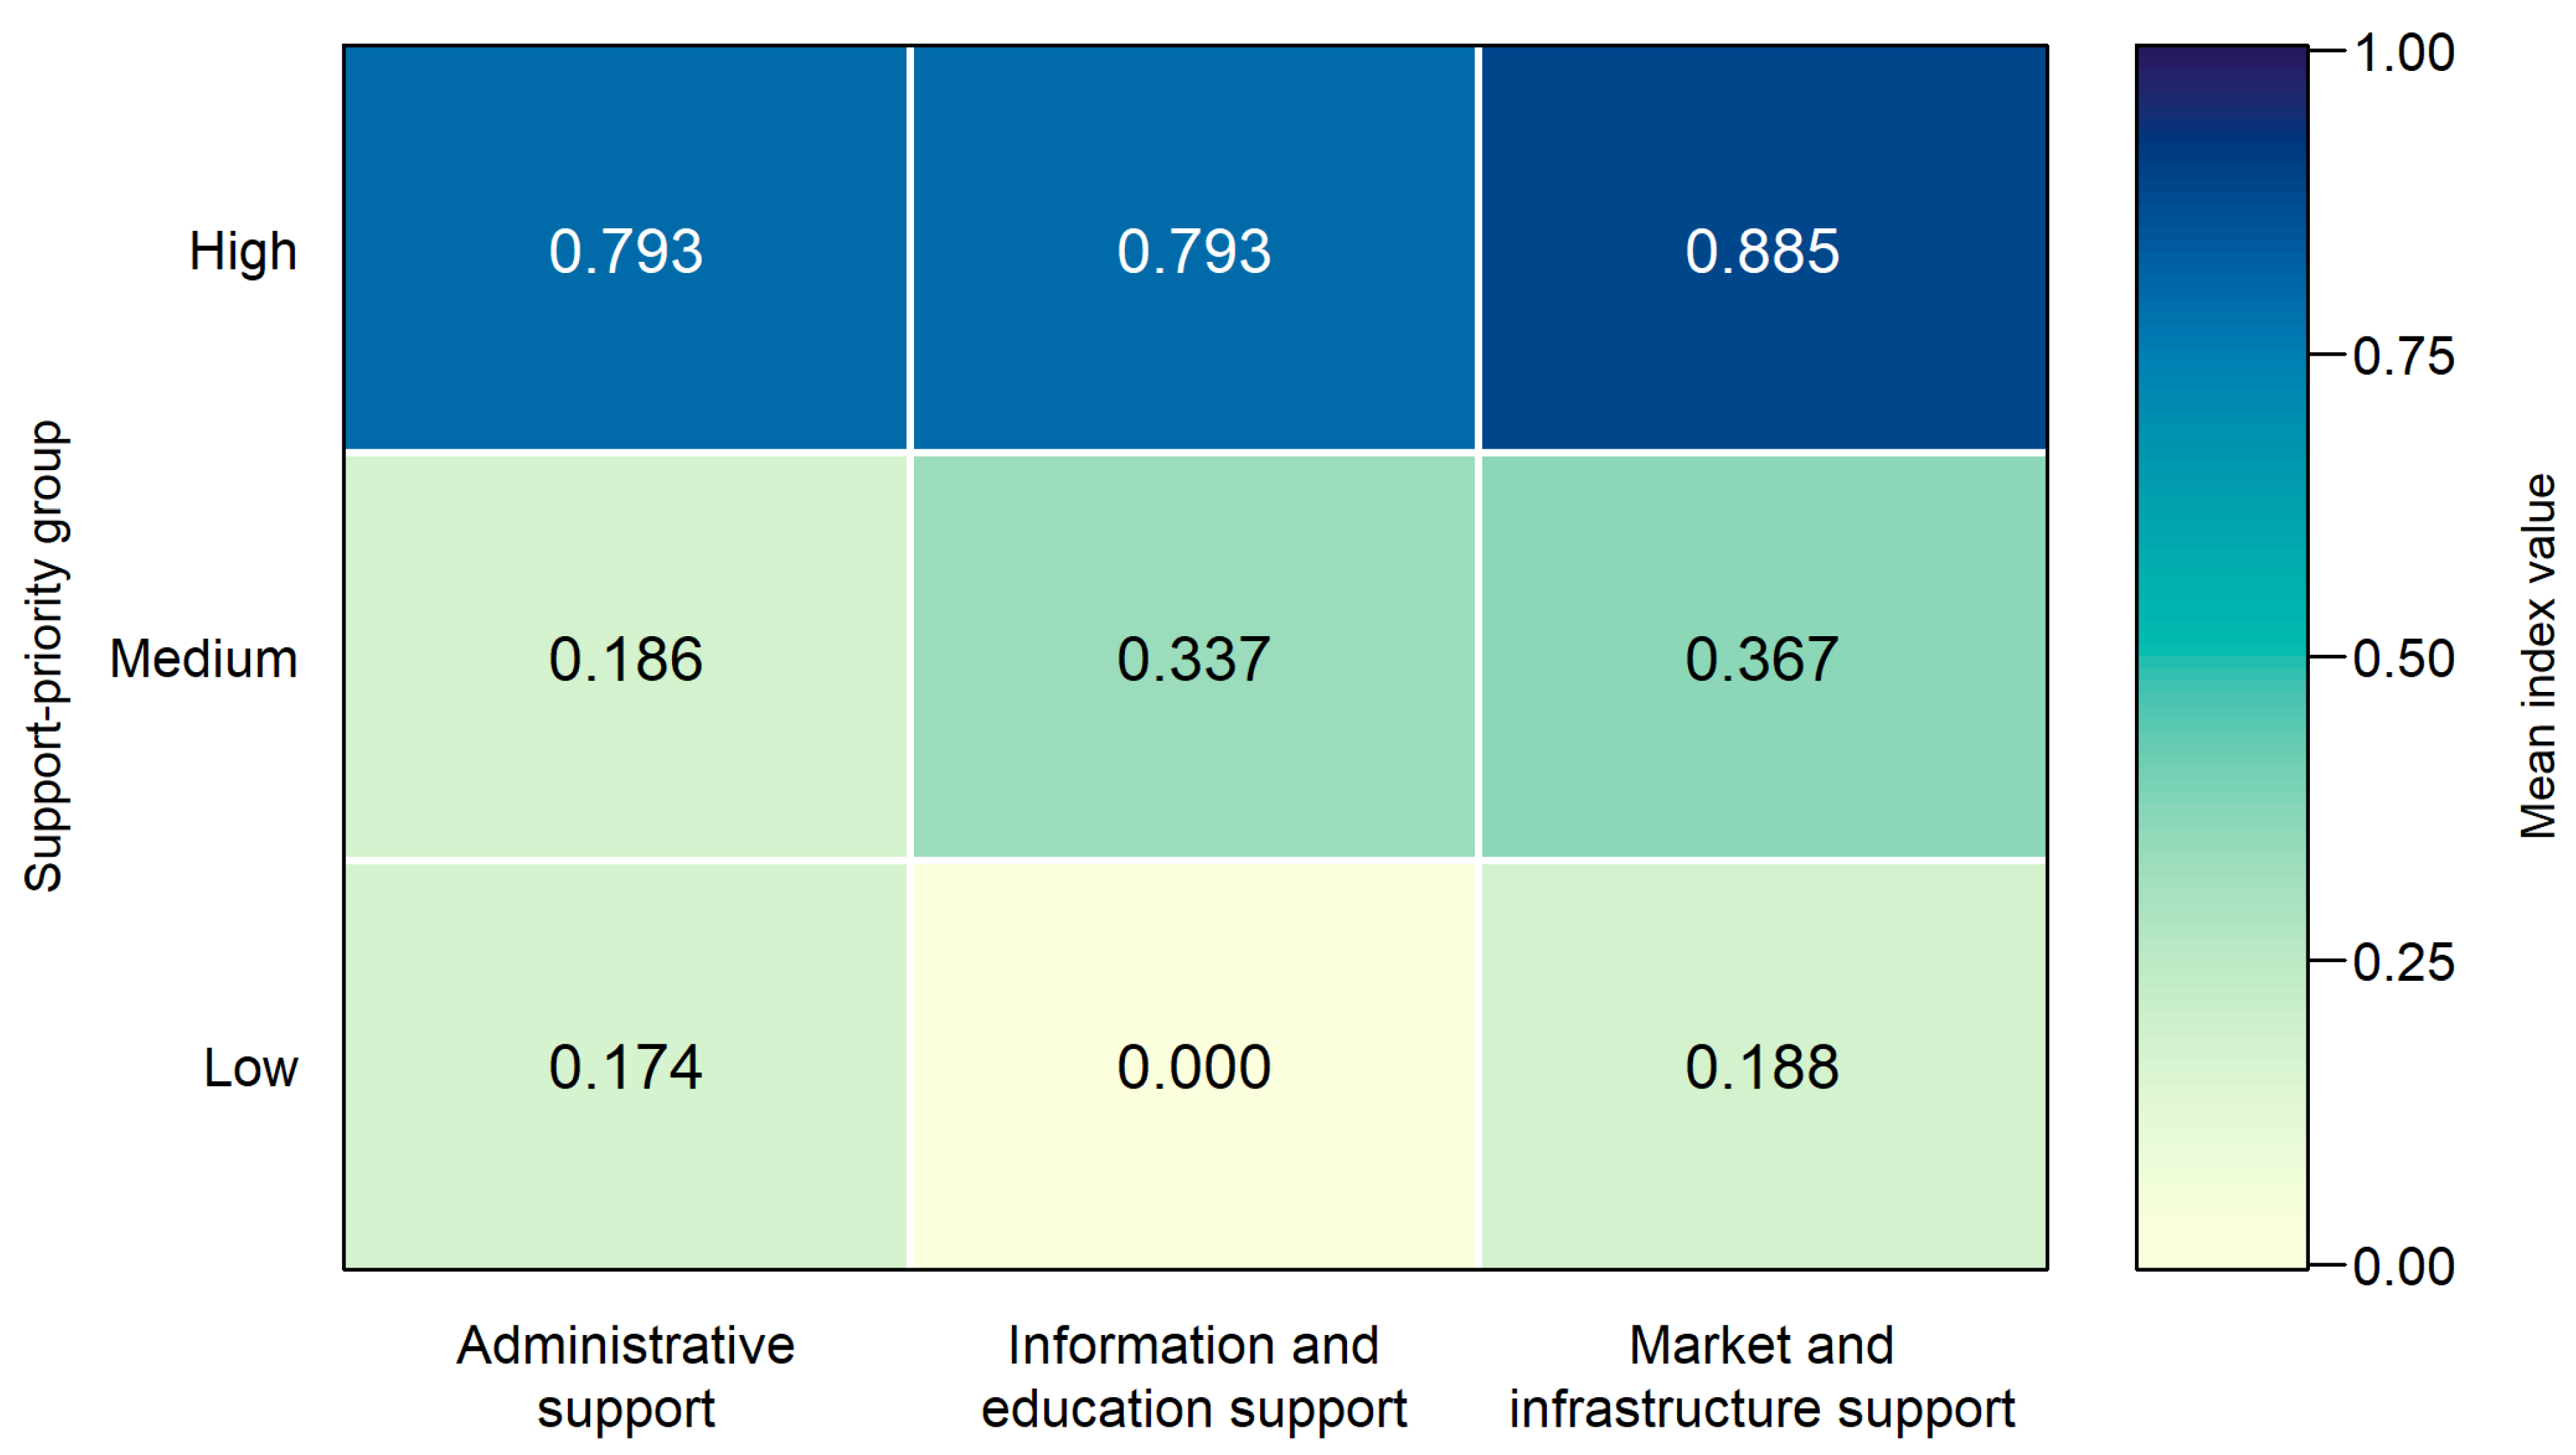
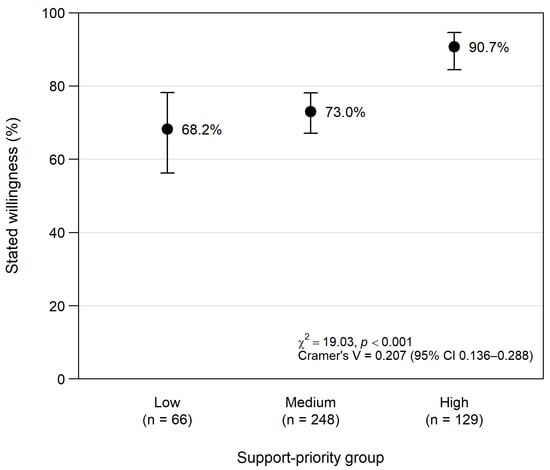
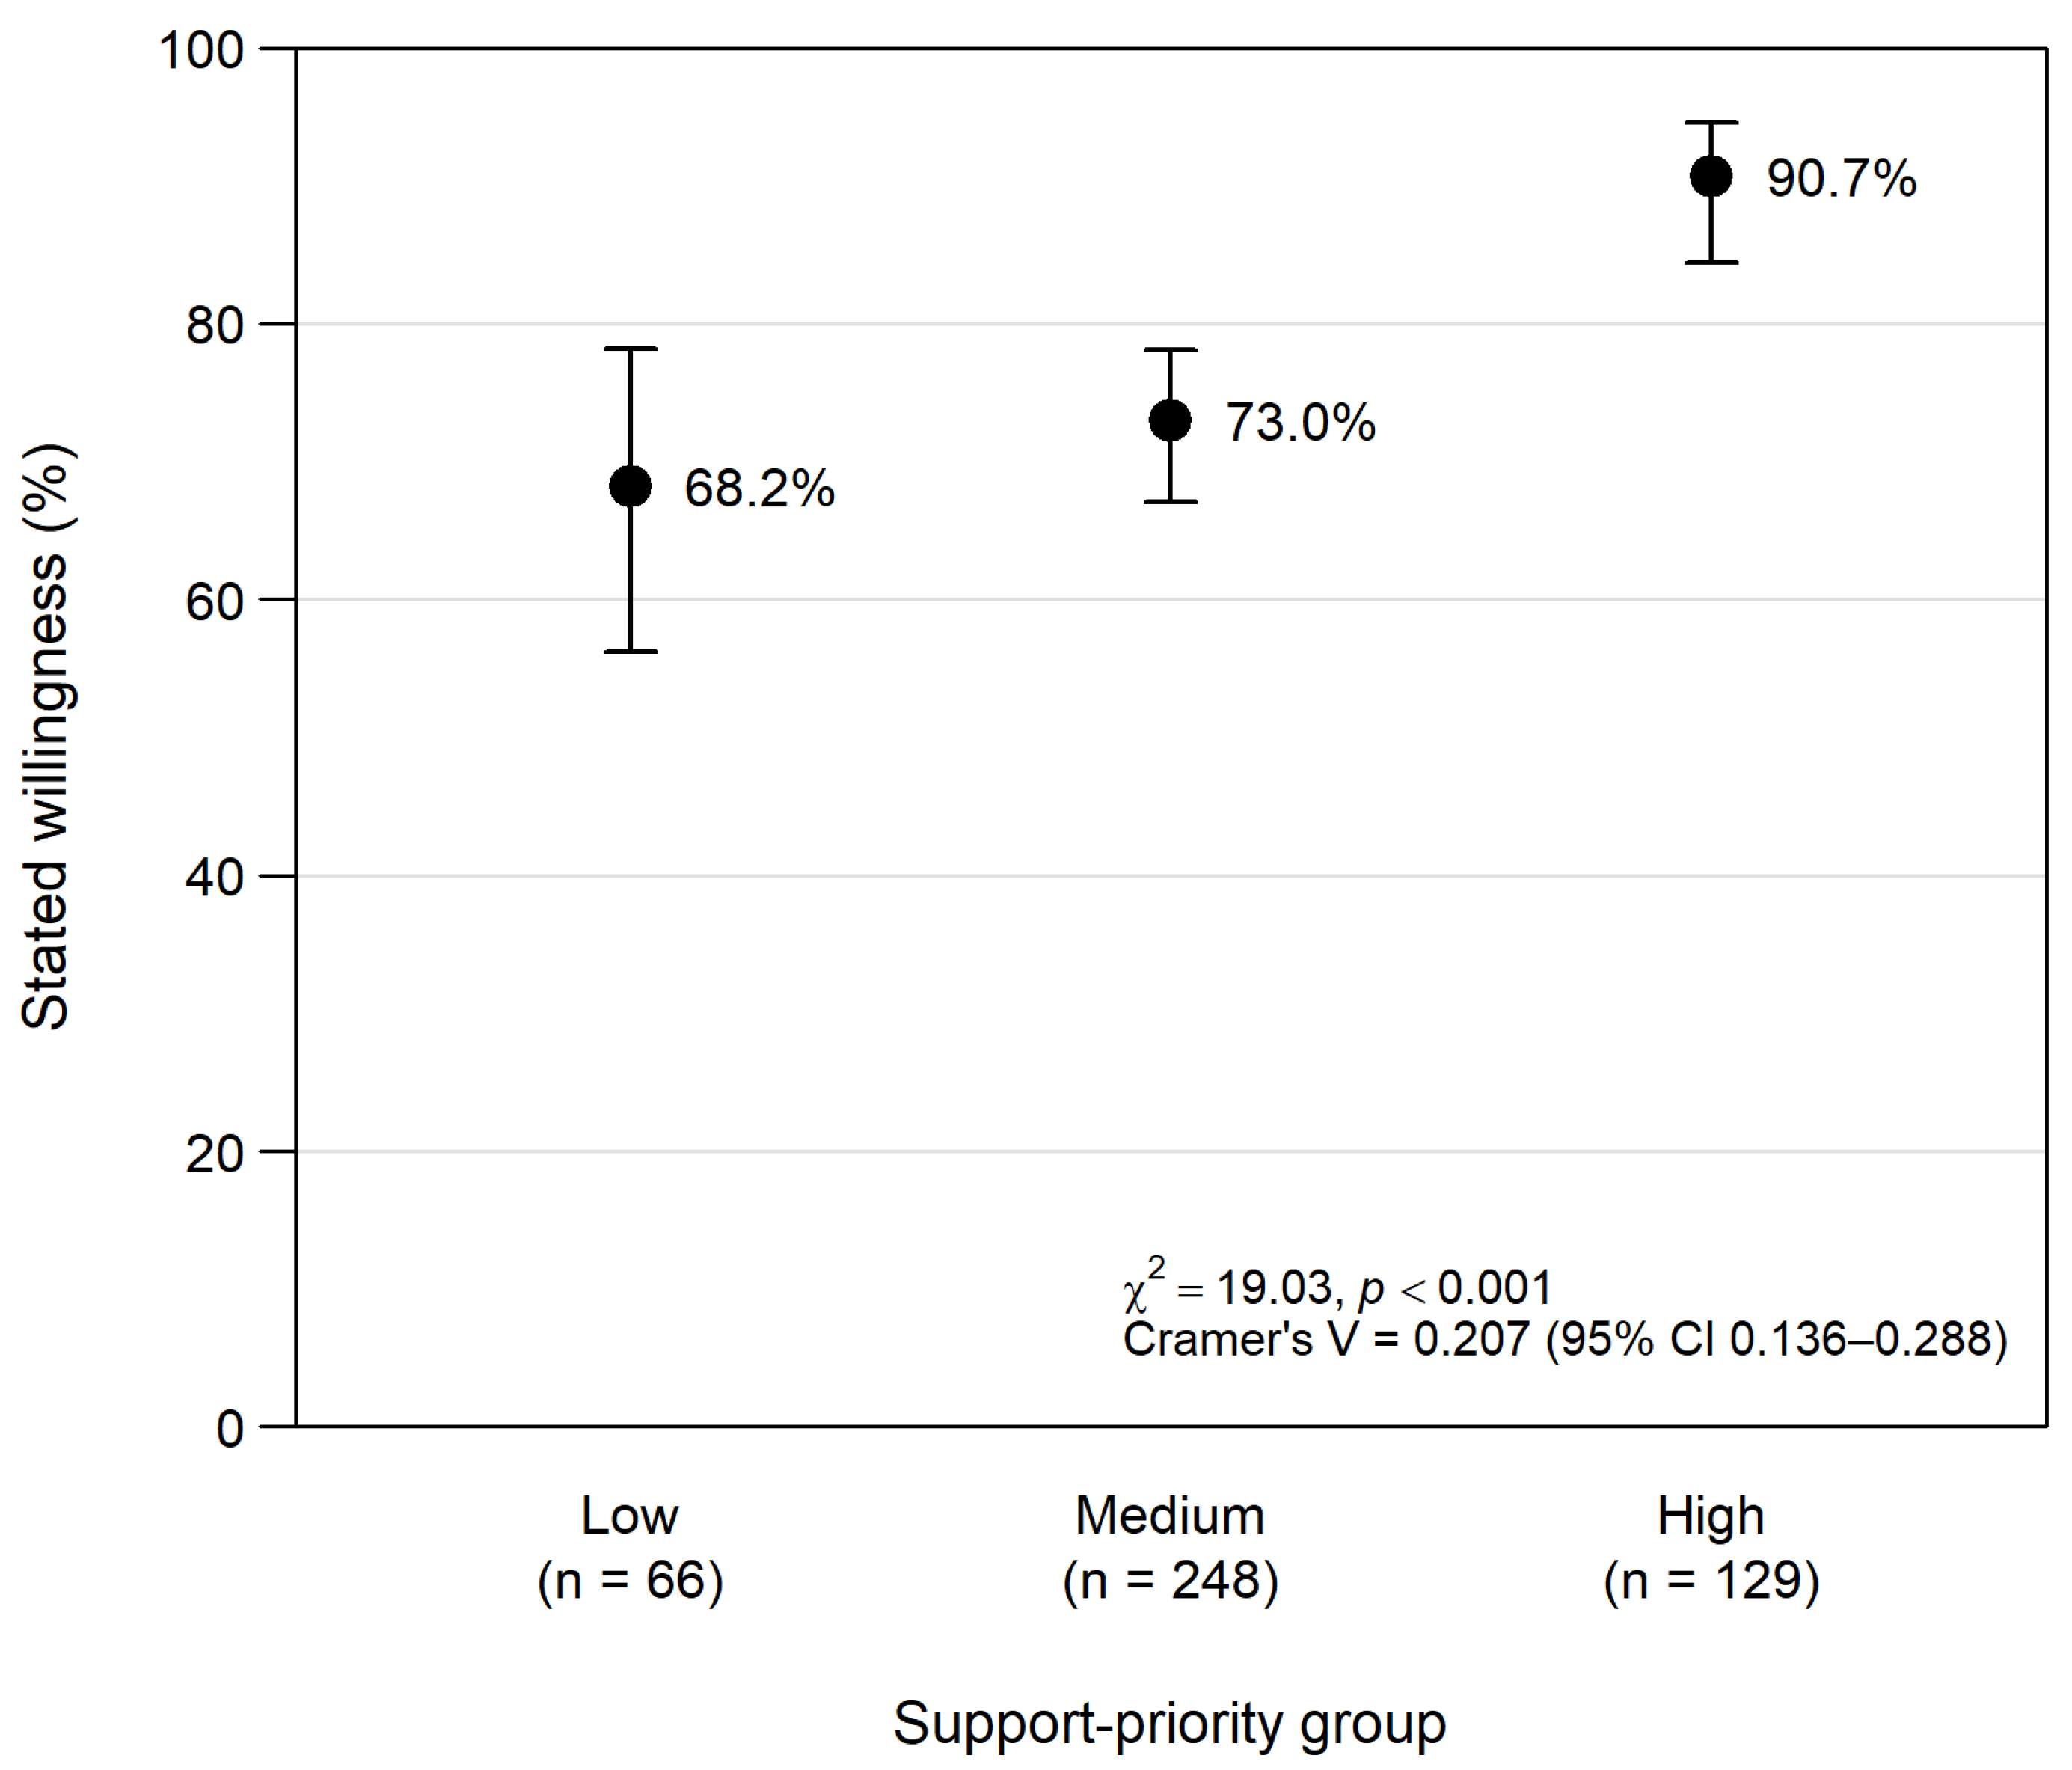

Disclaimer/Publisher’s Note: The statements, opinions and data contained in all publications are solely those of the individual author(s) and contributor(s) and not of MDPI and/or the editor(s). MDPI and/or the editor(s) disclaim responsibility for any injury to people or property resulting from any ideas, methods, instructions or products referred to in the content. |
© 2026 by the authors. Licensee MDPI, Basel, Switzerland. This article is an open access article distributed under the terms and conditions of the Creative Commons Attribution (CC BY) license.