


Abstract
Forest productivity varies interannually in association with climate variability, but the strength and direction of these associations differ across hydroclimatic settings. Here, we examined how growing-season temperature and climatic water-balance anomalies covaried with forest net primary productivity (NPP) across persistent forests in Northeast China. Using harmonized 1 km data spanning 1985–2024, we applied pixel-wise correlations and a two-predictor association model to detrended and standardized time series, alongside original-unit sensitivity analyses. Climatic-water-balance associations exhibited a distinct hydroclimatic ordering: median water-balance–NPP correlations shifted from in humid forests to in semi-arid forests, with positive associations becoming progressively more prevalent toward drier forest margins. Temperature associations likewise shifted toward less positive or more negative values along the same gradient, although this pattern showed lower stability across analytical definitions. The water-balance ordering remained robust across alternative preprocessing choices and screening rules. Across all hydroclimatic zones, pixel-wise models showed modest explanatory power, with zonal median ranging from to . Overall, the direction and relative prominence of synchronous temperature and climatic-water-balance associations with NPP showed a consistent zonal ordering along the regional hydroclimatic gradient, indicating that spatially aggregated averages can obscure contrasting local climate–productivity patterns while the observed relationships remain descriptive rather than causal.
1. Introduction
Forests account for a substantial portion of the terrestrial carbon sink, yet the persistence of this sink depends in part on how forest productivity varies with interannual climate conditions [1]. Net primary productivity (NPP)—the difference between gross primary productivity and autotrophic respiration—varies from year to year, while drought and heat have also been shown to reduce forest carbon uptake at the ecosystem level [2]. This sensitivity, however, is far from uniform across space. Recent studies show marked geographical variation in forest climate vulnerability, with productivity trends and carbon-sink stability differing across contrasting environmental conditions [3,4,5]. Similar climatic anomalies may therefore be associated with contrasting productivity patterns depending on the local hydroclimatic baseline, forest structure, and ecological setting. An anomaly associated with higher productivity in one region may show little relationship, or even an opposite association, elsewhere. While regional averages offer a convenient summary, they can obscure these contrasting local climate–productivity associations across heterogeneous forest landscapes.
Hydroclimatic context is central to interpreting these spatial variations. In cooler, energy-limited forests, warmer growing seasons may coincide with more favorable thermal conditions for growth; toward drier environments, however, the same warming can accompany greater atmospheric evaporative demand, weakening or even reversing its positive association with productivity [6,7,8,9]. Studies along forest gradients show that drought sensitivity varies with baseline precipitation and is locally shaped by soil and stand conditions [10]. At the species level, drought responses can also differ because stomatal regulation, hydraulic safety, rooting strategies, and carbon allocation influence how trees avoid or tolerate water deficit [11,12]. In drier settings, such strategies may moderate drought exposure, but productivity can still decline when prolonged water stress exceeds hydraulic or carbon constraints. Water-related constraints are inherently multidimensional, with vegetation sensitivity to soil moisture and atmospheric dryness differing markedly across climatic settings [13,14]. While such metrics are not strictly interchangeable with the climatic water balance examined here, they reinforce the broader expectation that moisture sensitivity depends on regional hydroclimatic background. Consistent with this view, ecosystem carbon-uptake sensitivity to soil-moisture stress shifts systematically across aridity gradients [15], while drought–NPP relationships differ among climatic zones at broader spatial scales [16] and regional studies in Northeast China report contrasting vegetation responses to rainfall anomalies [17]. Temperature- and moisture-related associations can thus differ in both magnitude and sign across hydroclimatic settings, depending on local environmental context rather than following a single universal threshold across forests.
Despite growing evidence for context-dependent forest climate sensitivity, many previous assessments have focused on long-term productivity trends, individual climatic constraints, drought events, or broad regional attribution rather than the joint spatial organization of temperature- and moisture-related associations [3,18]. In Northeast China, regional studies have documented pronounced spatial variation in forest NPP dynamics and their climatic correlates [19,20,21], while China-wide analyses likewise show strong climatic modulation of forest NPP [22]. Drought sensitivity and rainfall responses differ markedly among vegetation types and along regional moisture gradients [17,23]. Although these studies document substantial hydroclimatic heterogeneity [24,25], an unresolved question remains: do the direction and relative prominence of temperature and climatic water-balance associations with forest productivity reorganize systematically from humid to semi-arid settings? Integrated spatial evidence on this two-dimensional association structure remains limited, particularly at the pixel scale, where opposing local relationships can be obscured by regional aggregation.
Stretching from humid eastern mountain ranges to comparatively dry western forest margins, the forest ecosystems of Northeast China span a pronounced hydroclimatic gradient [17,26]. Regional studies have documented associations between forest productivity and spatial variation in temperature and moisture conditions across these landscapes [17,27], making the region a suitable setting for evaluating climate sensitivity across contrasting climatic backgrounds without collapsing localized patterns into a single regional average. To make interannual variations comparable across pixels with different climatic and productivity baselines, we converted growing-season temperature, climatic water balance, and NPP into standardized anomalies relative to their local historical distributions. These standardized metrics represent local relative departures rather than equivalent absolute exposure across the region. We then applied a pixel-wise two-predictor model to estimate the association of each climate predictor conditional on the other while retaining fine-scale spatial variability. This joint statistical structure has precedents in combined stress index approaches used in agricultural research [28,29]; however, we retain only the two-dimensional statistical architecture and do not transfer crop-specific physiological assumptions or empirical thresholds to forest NPP.
To address these gaps, we evaluated how associations between growing-season climate (temperature and climatic water balance) and forest NPP varied across the hydroclimatic gradient of Northeast China over the period 1985–2024. Specifically, our objectives were to (i) characterize the spatial distribution and direction of pixel-level temperature–productivity and water-balance–productivity associations; (ii) quantify the conditional association and relative prominence of each climate dimension within a joint two-predictor model; and (iii) assess whether these dual-climate relationships reorganize systematically across humid, semi-humid, and semi-arid forest zones. Given the regional hydroclimatic setting, we hypothesized that climatic water-balance associations would become increasingly positive toward drier forest margins, whereas temperature associations would tend to become less positive or more negative toward drier settings.
2. Materials and Methods
2.1. Study Area and Analytical Domain
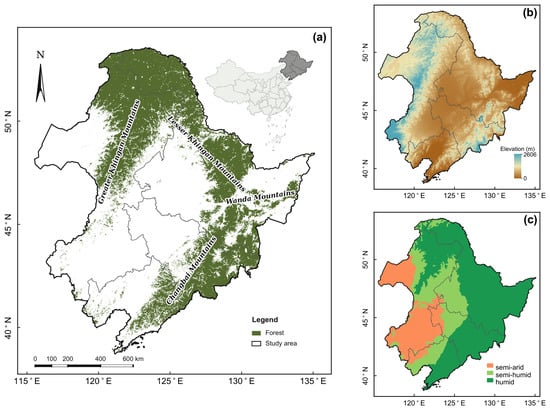
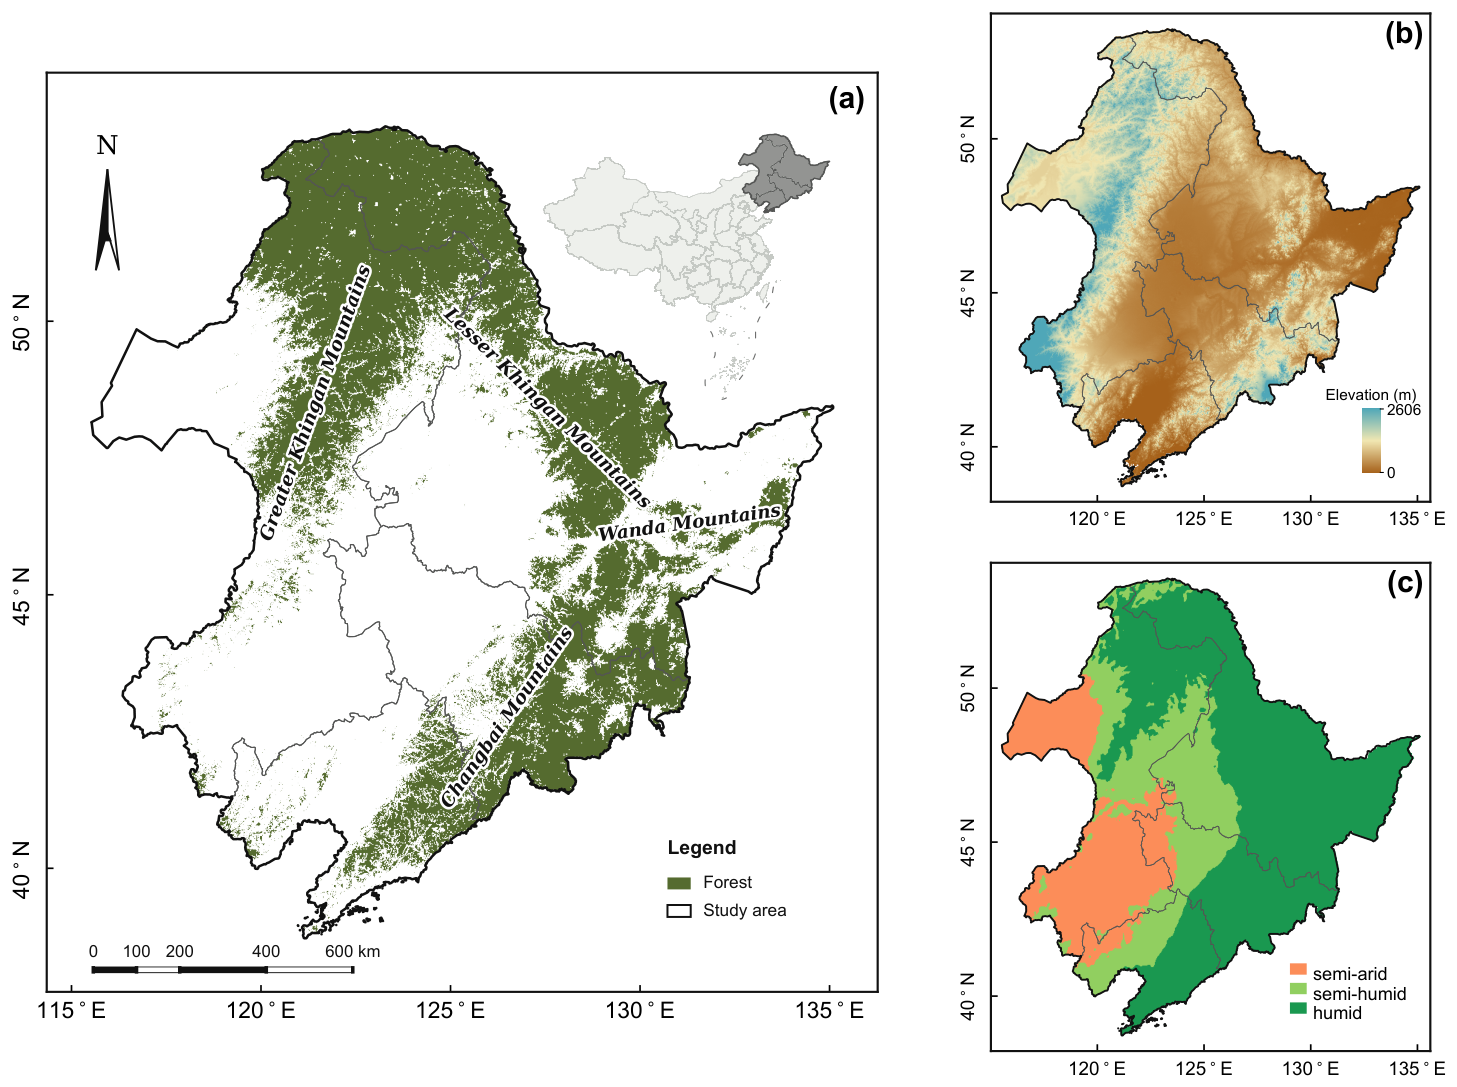
Spanning approximately km2 across Northeast China ( N– N, E– E), the study region encompasses four major mountain ranges: the Greater Khingan, Lesser Khingan, Wanda, and Changbai Mountains (Figure 1). Influenced by the East Asian monsoon, hydroclimatic conditions generally become wetter from the western and northwestern forest margins toward the eastern and southeastern mountain regions [17,26]. Across the analytical forest domain, mean annual precipitation for 1985–2024 ranged from 288 to 1053 mm, while mean annual temperature ranged from to 11.5 °C.
Figure 1.
Study area and analytical domain in Northeast China: (a) final analytical forest domain and major mountain systems; (b) elevation; and (c) hydroclimatic zones (semi-arid, semi-humid, and humid).
The analytical domain was restricted to persistent forest pixels with valid climate and harmonized NPP records after data-completeness and NPP plausibility screening. To compare climate–productivity associations across contrasting baseline environments, we stratified the final forest domain into three hydroclimatic zones: semi-arid, semi-humid, and humid.
2.2. Data Sources and Preprocessing
2.2.1. Climate Data
Monthly precipitation (PRE), mean air temperature (TMP), and potential evapotranspiration (PET) data for 1985–2024 at approximately 1 km spatial resolution were obtained from the National Tibetan Plateau/Third Pole Environment Data Center (TPDC). The PRE and TMP products were generated by downscaling CRU TS data using high-resolution WorldClim climatology [30], while PET was derived using the Hargreaves formulation within a national gridded framework [31,32]. All climate products were clipped to the study boundary and aligned to the common 1 km analysis grid. The growing season was defined as May–September (MJJAS), consistent with regional phenological evidence showing that forest NPP accumulation in Northeast China is concentrated primarily within this period [33]. Over MJJAS, PRE and PET were summed and TMP was averaged, and growing-season climatic water balance was calculated as precipitation minus potential evapotranspiration ().
2.2.2. NPP Data and Temporal Harmonization
Historical monthly NPP for 1985–2015 was obtained at 1 km resolution from a Carnegie–Ames–Stanford Approach (CASA) dataset covering terrestrial ecosystems in China north of 18° N [34]. The source dataset was previously evaluated against published field-based NPP estimates and independent model estimates across major vegetation types [34]. To extend the record through 2024, MODIS MOD17A3HGF annual NPP and MOD17A2HGF 8-day GPP products were used for 2001–2024 [35,36,37,38]. MOD17 productivity products have also undergone site- and biome-level evaluation against ground-based NPP and flux-based GPP estimates [39,40].
Because MOD17A3HGF provides annual NPP, annual values were temporally allocated according to the corresponding monthly fraction of annual GPP:
where denotes the monthly GPP total for pixel i, year y, and month m. This GPP fraction was used only as a temporal allocation proxy for deriving seasonal NPP totals and does not imply physiological equivalence between the intra-annual dynamics of GPP and NPP. This temporal allocation therefore remains an additional source of uncertainty because seasonal NPP dynamics need not vary proportionally with GPP. The final harmonized composite record was not independently validated against forest-inventory or biometric observations in this study; prior validation of the individual source products should therefore not be interpreted as validation of the merged 1985–2024 record. The subsequent climate–productivity analyses used one aggregated growing-season NPP value per pixel per year rather than monthly NPP observations. The MODIS-derived NPP record was spatially aligned with the historical CASA record on the common 1 km grid.
The two products were harmonized over their 2001–2015 overlap period at the level of mean growing-season NPP. After aggregating monthly values to growing-season NPP, a pixel-specific scaling factor was calculated as
where the overbar denotes the overlap-period mean and GS denotes the growing season. Valid scaling factors were applied to MODIS-derived monthly NPP for 2016–2024, yielding a composite record comprising historical CASA NPP for 1985–2015 and harmonized MODIS-derived NPP for 2016–2024. This scaling aligns the overlap-period mean magnitude of the two products but is not intended to force their interannual variability or trends to coincide. Growing-season totals from the composite record were subsequently used to construct the standardized NPP index (SNPI).
Cross-product behavior during 2001–2015 was examined at both monthly and annual growing-season scales. Monthly temporal correspondence was characterized using pixel-wise between CASA and raw MODIS-derived NPP for May–September, while annual interannual correspondence was evaluated from paired growing-season totals both before and after linear detrending. Differences in interannual variability amplitude were additionally summarized using the ratio of the MODIS-derived to CASA standard deviations. Temporal continuity across the 2015–2016 source transition was further examined using the forest-domain mean growing-season NPP series. These analyses diagnose cross-product consistency and temporal continuity of the composite record and do not constitute a new independent validation of absolute NPP. These diagnostics do not establish that the composite 1985–2024 NPP record is homogeneous across the CASA–MODIS transition, and the 2015–2016 comparison is descriptive rather than a formal structural-break test. Finally, to test whether the principal hydroclimatic association patterns depended on MODIS-based temporal allocation or cross-product harmonization, the core climate–NPP correlation analysis was repeated using the CASA record alone for 1985–2015.
2.2.3. Persistent Forest Domain and Hydroclimatic Zonation
Persistent forest pixels were identified using the 30 m China Land Cover Dataset (CLCD) for 1990, 2000, 2010, and 2020 [41]. For each reference year, the fraction of constituent 30 m cells classified as forest was calculated within each 1 km analysis cell. A cell was considered forest when this fraction was at least 60%, providing a conservative majority criterion for retaining forest-dominated 1 km cells and reducing mixed-land-cover influence. Comparable 60% forest-cover criteria have been used to identify forest-dominated or contiguous forest pixels in coarse-resolution analyses [42,43].
To emphasize long-term forest persistence while limiting sensitivity to an isolated classification inconsistency at a single reference date, we further required the 60% forest criterion to be met in at least three of the four reference years (persistence fraction ). This temporal-supermajority criterion follows the broader use of multi-temporal majority or modal land-cover information to reduce artificial interannual classification variability [42]. Thus, the two thresholds serve distinct purposes: the 60% criterion controls spatial forest dominance within 1 km cells, whereas the 3-of-4 criterion controls temporal persistence across reference dates.
The resulting persistent-forest mask was intersected with the valid climate and harmonized NPP domains, after which pixels failing data-completeness or NPP plausibility screening were excluded to define the final analytical domain.
2.3. Analytical Methods
2.3.1. Standardization and Detrending of Climate and NPP Indices
Growing-season temperature, climatic water balance, and cumulative NPP were transformed into the pixel-specific standardized temperature index (STI), Standardized Precipitation Evapotranspiration Index (SPEI), and standardized NPP index (SNPI), respectively. For climatic water balance, we used a seasonal nonparametric Standardized Precipitation Evapotranspiration Index (hereafter, nonparametric SPEI) based on . Whereas the original SPEI formulation fits the accumulated climatic water-balance series to a three-parameter log-logistic distribution [44], nonparametric implementations estimate cumulative probabilities directly from empirical ranks and thereby avoid assuming a parametric distribution [45]. Here, empirical probabilities were estimated using the Gringorten plotting position and transformed to standard normal scores [46]:
where is the standardized anomaly for pixel i in year t, is the ascending rank among valid years, is the number of valid observations, and is the inverse cumulative distribution function of the standard normal distribution. Because the transformation was performed independently at each pixel, the resulting indices represent local anomalies relative to each pixel’s historical distribution rather than equivalent absolute magnitudes across space.
For temporal-trend analyses, the original growing-season series were standardized directly to obtain STI, SPEI, and SNPI. For correlation and two-predictor analyses, temperature, climatic water balance, and NPP were first linearly detrended at each pixel, after which the residuals were standardized using the same procedure to obtain , , and .
2.3.2. Trend and Correlation Analyses
To provide temporal context for the association analyses, trends in the non-detrended STI, SPEI, and SNPI series were evaluated over 1985–2024. Domain-wide and zonal time series were calculated as area-weighted means across analytical forest pixels, with 5-year centered moving averages used only to visualize multi-year variability. Pixel-wise trends were quantified using Sen’s slope estimator and expressed in standardized units per decade [47], with nominal significance assessed using the nonparametric Mann–Kendall test () [48].
Pixel-wise Pearson correlations were calculated between the detrended anomaly pairs – and –. Correlation distributions and proportions of nominally significant () positive and negative associations were summarized within each hydroclimatic zone using unweighted pixel statistics. Because many spatially autocorrelated pixel-wise tests were conducted, nominal significance was interpreted as a descriptive local screen rather than as field-wide statistical evidence [49].
2.3.3. Pixel-Wise Two-Predictor Conditional Association Model
To examine the joint associations of temperature and climatic water balance with productivity, detrended NPP anomalies () were modeled against temperature () and climatic water-balance () anomalies at each pixel using a two-predictor linear regression. The statistical structure was informed by the dual-climate architecture used in previous CSI/CSIm climate–response studies [28,29], without adopting crop-specific thresholds or physiological interpretations:
where and represent the conditional associations of temperature and climatic water balance with NPP at pixel i, is the intercept, and is the residual. The model was interpreted as a diagnostic of synchronous conditional associations rather than as a mechanistic, causal, or predictive model.
Model explanatory strength was summarized using pixel-wise , while the full-model F-test p value () was used only as a nominal descriptive screen for the classification described below. Additional model-fit and collinearity diagnostics are provided in the Supplementary Materials.
2.3.4. Classification of Dominant Association Classes
Predictor-specific partial coefficients of determination were used to compare the relative prominence of temperature and climatic water balance within each pixel:
where is the coefficient t statistic and is the residual degrees of freedom. Partial represents predictor-specific conditional explanatory strength and is not an additive decomposition of the full-model . Here, “dominant” denotes only the predictor with the larger partial within the two-predictor model and does not imply ecological control.
Pixels with were classified as Nominally non-significant. For pixels with , STI was assigned as dominant when ; otherwise, SPEI was assigned as dominant. The sign of the corresponding coefficient defined four association classes: Temperature (), Temperature (), Moisture balance (), and Moisture balance (). Zonal proportions were summarized across all valid model pixels, including the Nominally non-significant category, and separately within the subset passing the nominal model screen.
Sensitivity of the classification to spatial weighting, significance thresholds, near-tied predictor prominence, and rank-based standardization was evaluated in the Supplementary Materials. As a sensitivity analysis, the core pixel-wise climate–NPP correlations were repeated using June–August (JJA) as a narrower common core-season window while retaining the same data-processing and standardization framework.
2.4. Use of Generative Artificial Intelligence Tools
During manuscript preparation and revision, ChatGPT (GPT-5.6 Sol, OpenAI) and Codex (GPT-5.6 Sol, OpenAI) were used for language editing and for assistance with code refactoring and technical quality-control workflows. Their use was limited to improving textual clarity and assisting with the organization, refactoring, and checking of analysis and visualization code. These tools were not used to generate the source data or to replace the authors’ scientific interpretation of the results. All AI-assisted text and code outputs were reviewed, verified, and revised by the authors before inclusion in the manuscript or analytical workflow. The authors take full responsibility for the scientific content, analyses, and conclusions presented in this study.
3. Results
3.1. Spatiotemporal Patterns of Climate and Productivity Indicators
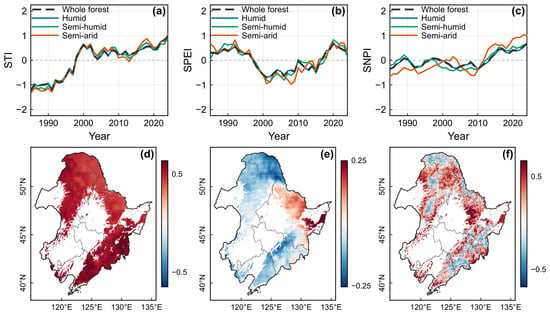
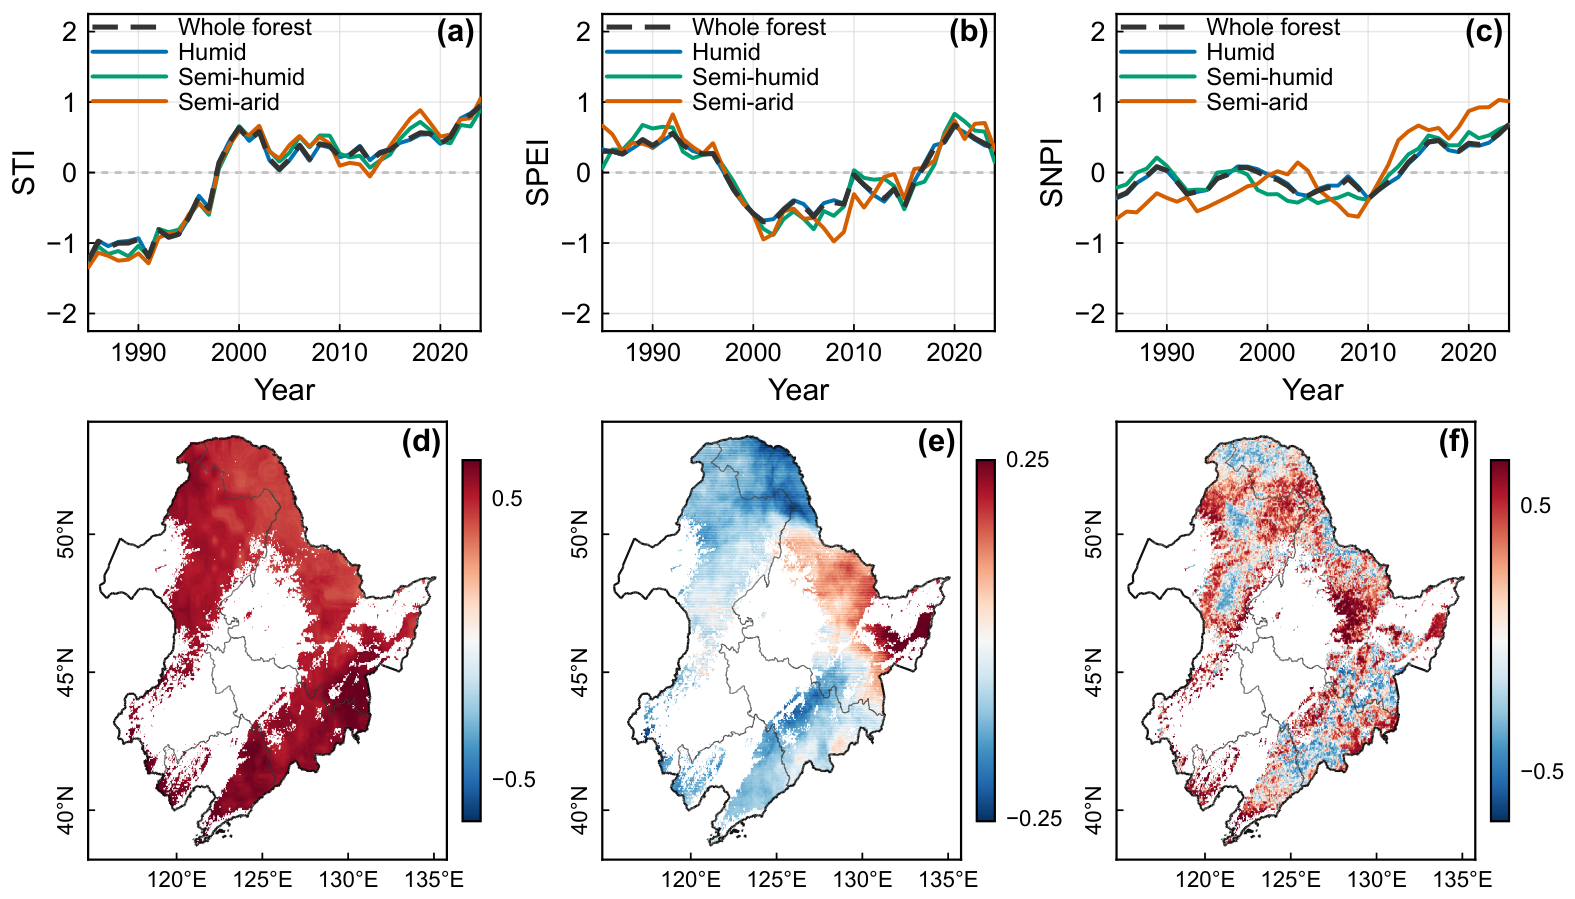
To establish the temporal context for interannual climate–productivity relationships, we evaluated the non-detrended standardized indices over 1985–2024 (Figure 2). The 5-year centered moving average of domain-wide STI shifted from predominantly negative anomalies early in the record to predominantly positive anomalies in later years (Figure 2a). Zonal median Sen’s slopes for STI were positive across all three hydroclimatic zones, reaching , , and standardized units decade−1 in humid, semi-humid, and semi-arid forests, respectively. All valid pixels in the three zones showed nominally significant positive STI trends (). In contrast, SPEI exhibited substantial multi-year variability without a consistent monotonic trend over the study period (Figure 2b). SNPI also tended toward more positive anomalies in later years (Figure 2c), with median slopes of , , and standardized units decade−1 in humid, semi-humid, and semi-arid forests, respectively. The largest median SNPI slope occurred in the semi-arid zone, which represented the smallest portion of the analytical forest domain.
Figure 2.
Spatiotemporal patterns of growing-season temperature, climatic water balance, and forest productivity anomalies during 1985–2024: (a–c) 5-year centered moving averages of area-weighted STI, SPEI, and SNPI across the entire forest domain and three hydroclimatic zones; and (d–f) corresponding spatial distributions of pixel-wise Sen’s slopes (standardized units decade−1).
Spatially, positive STI trends occurred across nearly the entire forest domain, including extensive areas of the Greater Khingan and Changbai forest belts (Figure 2d). SPEI trends were spatially heterogeneous, with negative slopes across much of the western and northern forest domain and positive slopes in parts of the eastern and southeastern forests (Figure 2e). SNPI trends showed substantial spatial heterogeneity, with positive and negative slopes interspersed across the study area (Figure 2f). Positive SNPI trends occurred in parts of both the western and eastern forest belts, whereas negative trends were more localized. Thus, positive zonal median SNPI trends coexisted with substantial within-zone variation in both trend direction and magnitude.
3.2. Spatial and Hydroclimatic Contrasts in Climate–Productivity Associations
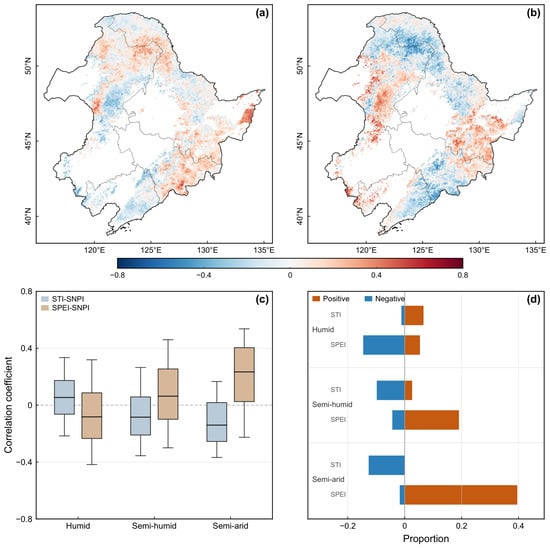
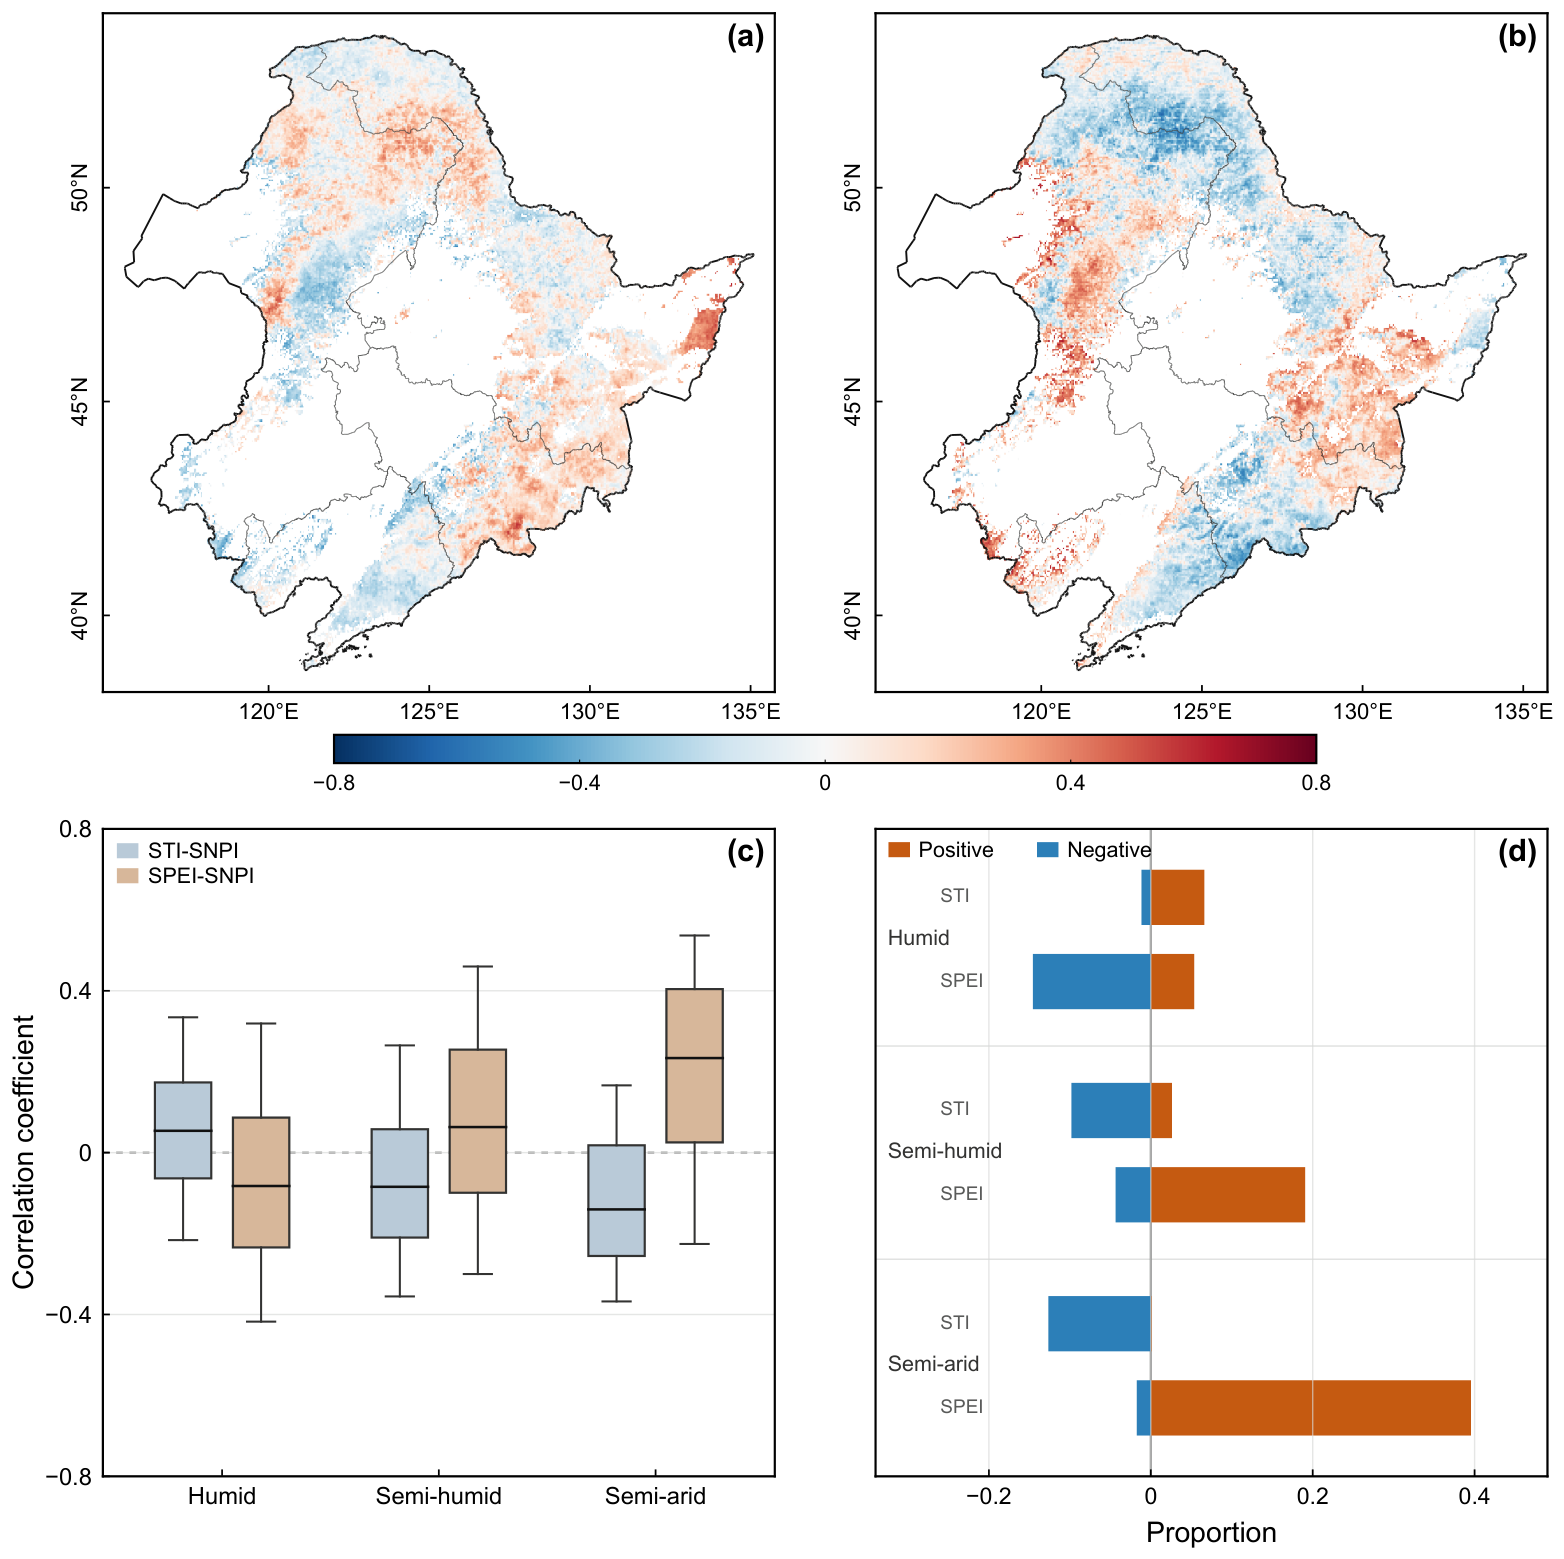
Pixel-wise correlation analyses between detrended climate and productivity anomalies revealed pronounced zonal shifts along the regional hydroclimatic gradient (Figure 3). Specifically, median – correlations shifted from weakly positive in humid forests () to progressively more negative values in semi-humid () and semi-arid forests (). Conversely, median – correlations increased consistently across the gradient, rising from in humid forests to in semi-humid forests and reaching in semi-arid forests. Despite these distinct shifts in zonal medians, the underlying correlation distributions exhibited substantial overlap across hydroclimatic zones (Figure 3c).
Figure 3.
Pixel-wise Pearson correlations between detrended growing-season climate and forest productivity anomalies: (a) –; (b) –; (c) correlation distributions across hydroclimatic zones; and (d) unweighted proportions of all valid pixels with positive or negative correlations passing the nominal screen.
Correlations passing the nominal screen showed a corresponding hydroclimatic pattern (Figure 3d). The proportion of all valid pixels with positive – correlations passing this screen increased from in humid forests to in semi-humid forests and in semi-arid forests. The corresponding proportions with negative – correlations were , , and , respectively. These screened proportions describe local spatial prevalence rather than field-wide statistical evidence.
Spatially, negative temperature–productivity correlations occurred more frequently across parts of the western forest domain (Figure 3a). Positive climatic-water-balance–productivity correlations were also prominent across parts of the western transition zone and eastern forests, whereas negative correlations were more widely distributed across the northern forest domain, with localized clusters in the southeast (Figure 3b). Taken together, these continuous spatial patterns and zonal summaries show that bivariate climate–productivity associations shifted along the hydroclimatic gradient, with climatic-water-balance associations becoming increasingly positive and temperature associations becoming less positive or more negative toward drier forest environments.
3.3. Spatial Variation in Two-Predictor Model Explanatory Strength
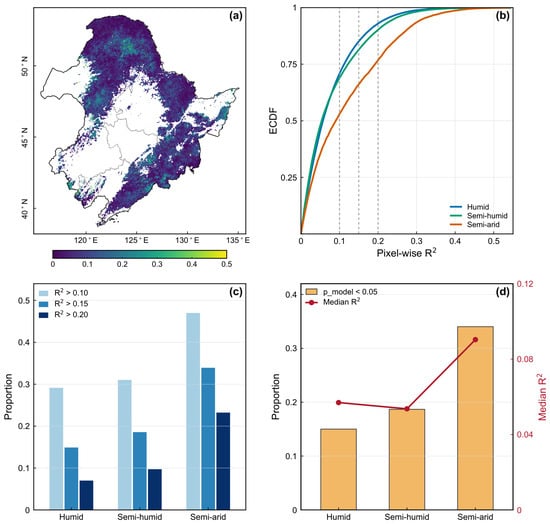
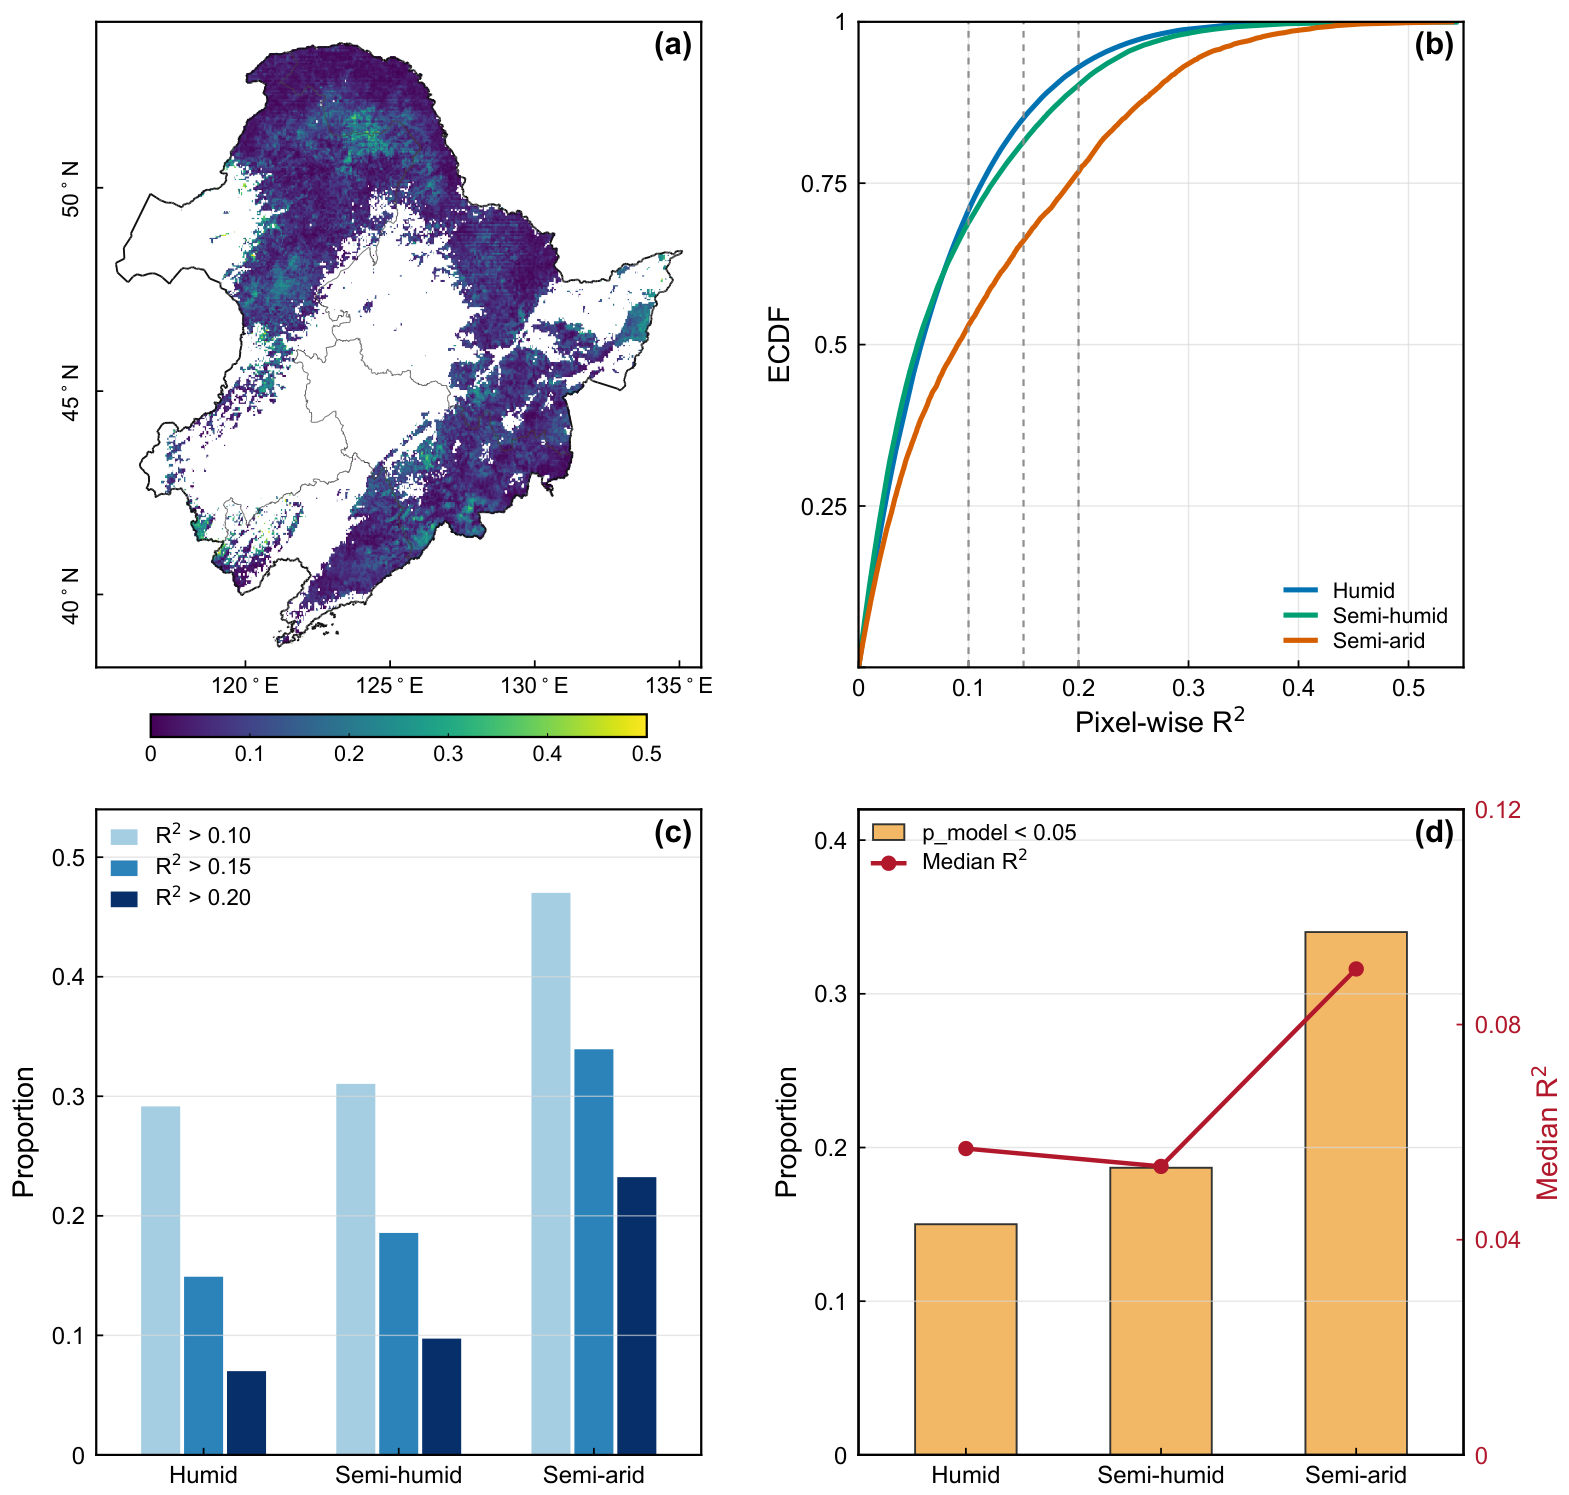
The pixel-wise two-predictor association model showed generally modest and spatially heterogeneous explanatory strength across the forest domain (Figure 4a). Low coefficients of determination () predominated across much of the study domain, particularly in humid forests, whereas locally higher values occurred in parts of the western forest transition zone and in scattered areas elsewhere. These higher- areas were spatially discontinuous, indicating that temperature and climatic water-balance anomalies jointly accounted for only a limited fraction of interannual variability across much of the forest domain.
Figure 4.
Explanatory strength of the pixel-wise two-predictor association model: (a) spatial distribution of model ; (b) empirical cumulative distribution functions (ECDFs) of across hydroclimatic zones; (c) unweighted proportions of valid model pixels with , , and ; and (d) unweighted proportions passing the nominal screen and zonal median . In (b), the dashed gray vertical lines indicate thresholds of , , and .
Although zonal distributions overlapped substantially, the cumulative distribution for semi-arid forests was shifted toward higher values relative to the humid and semi-humid zones (Figure 4b). Zonal median values were , , and in humid, semi-humid, and semi-arid forests, respectively. Across all evaluated thresholds, the proportion of pixels exceeding the specified level was consistently highest in the semi-arid zone (Figure 4c); for example, of valid semi-arid model pixels had , compared with in humid and in semi-humid forests. The proportion of models passing the nominal screen likewise increased toward the drier end of the hydroclimatic gradient, from in humid forests to in semi-humid forests and in semi-arid forests (Figure 4d). Nevertheless, zonal median remained below across all three hydroclimatic zones, indicating that the two-predictor model explained only a modest fraction of pixel-scale interannual NPP variability.
3.4. Hydroclimatic Variation in Dominant Association Classes
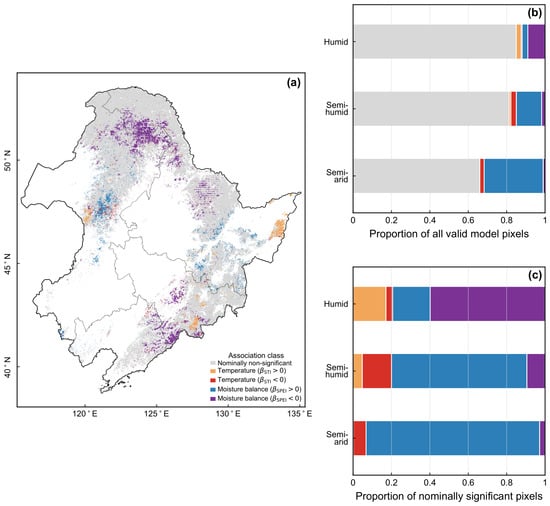
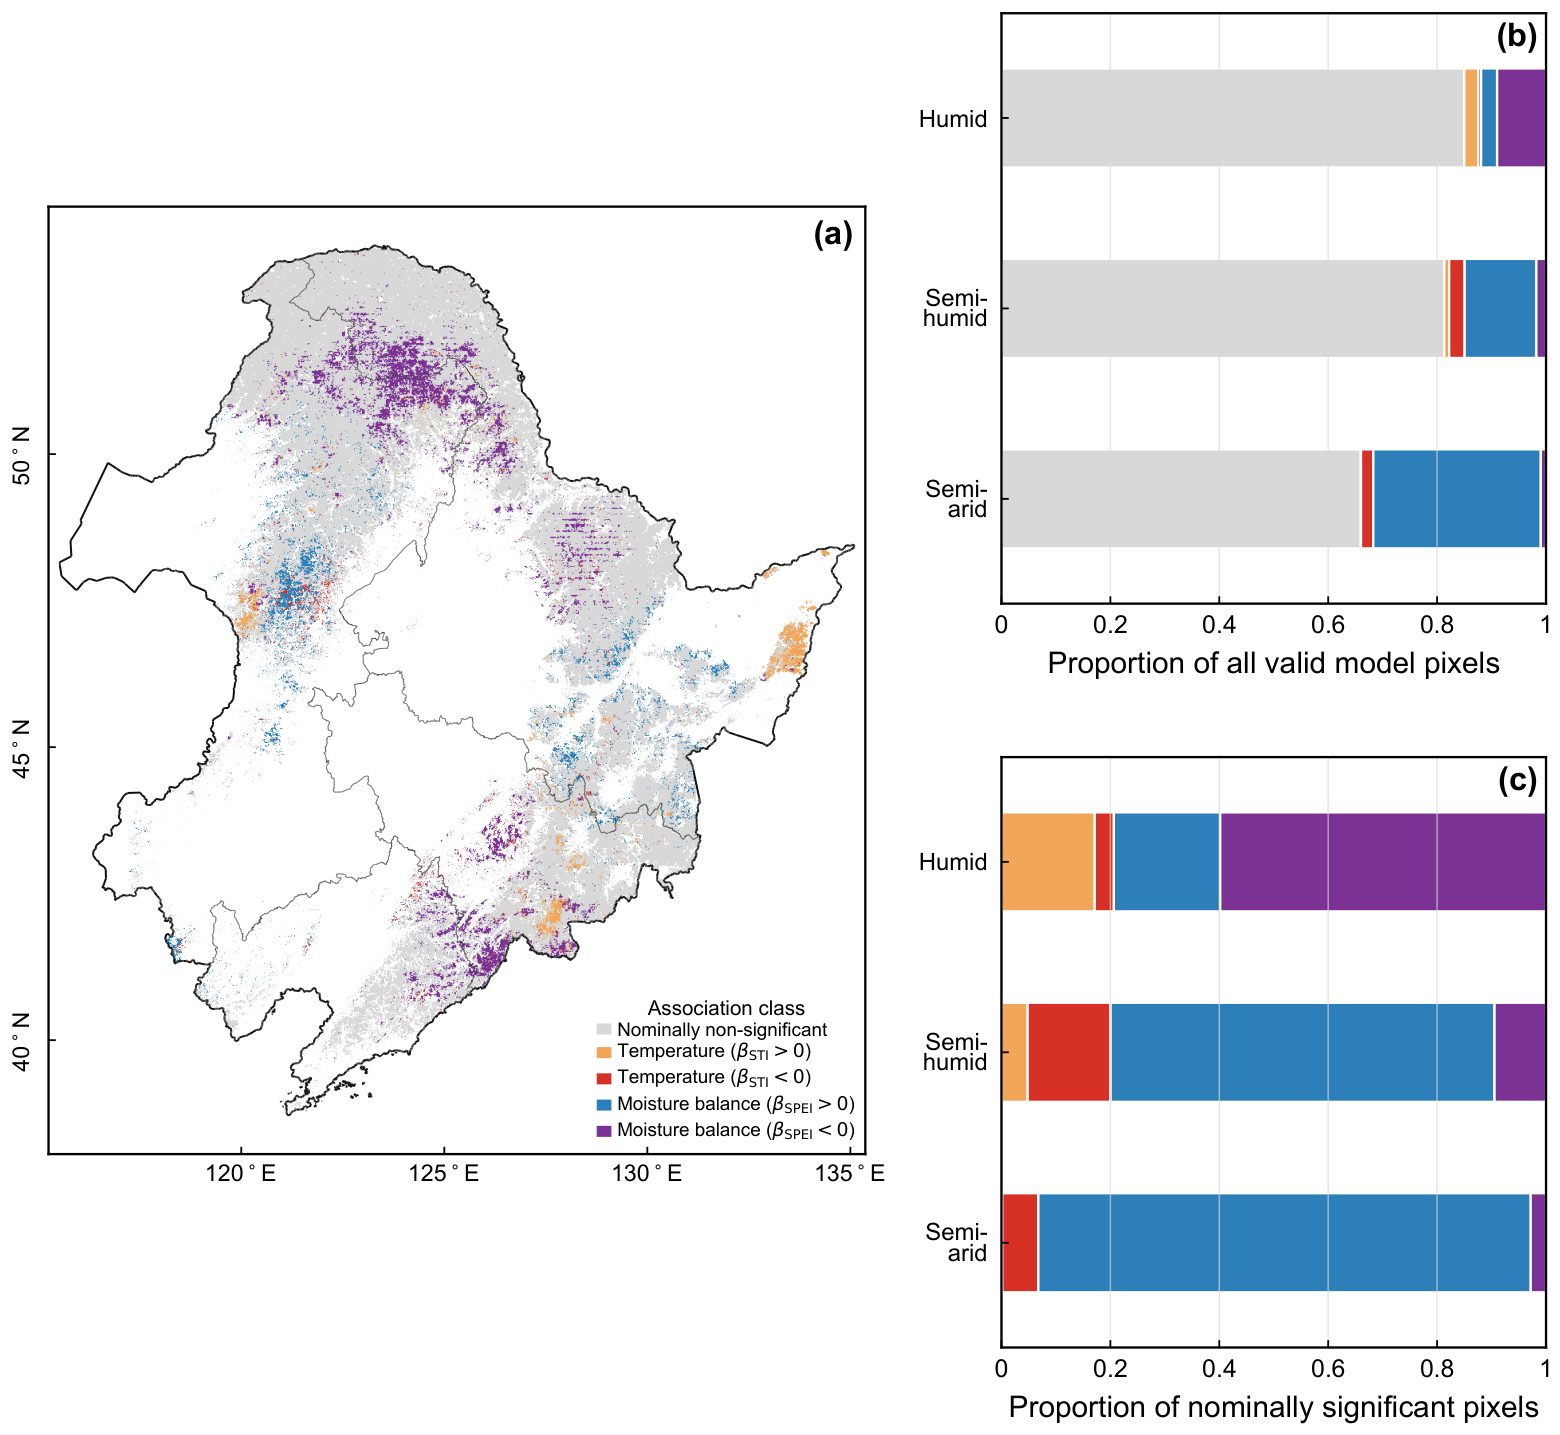
The spatial distribution of dominant association classes showed pronounced heterogeneity across the forest domain (Figure 5a). Nominally non-significant pixels were widespread, whereas the four signed association classes occurred mainly in spatially discontinuous clusters. Moisture balance () occurred more frequently across parts of the western and northwestern forest transition zones, whereas Moisture balance () was more prominent in humid northern and southeastern forests. Temperature () occurred locally along parts of the western transition zone, while Temperature () appeared in scattered areas elsewhere.
Figure 5.
Dominant association classes across hydroclimatic zones: (a) spatial distribution; (b) unweighted proportions among all valid model pixels; and (c) proportions among pixels passing the nominal screen. The colors in (b,c) denote the same association classes as those shown in the legend of (a).
Across all valid model pixels, the Nominally non-significant category accounted for , , and of humid, semi-humid, and semi-arid forests, respectively (Figure 5b). Although this remained the largest category in every hydroclimatic zone, its proportion declined toward drier settings. Over the same hydroclimatic gradient, the proportion classified as Moisture balance () increased from in humid forests to in semi-humid forests and in semi-arid forests.
Within the subset passing the nominal model screen (), the dominant association structure differed markedly among hydroclimatic zones (Figure 5c). Moisture balance () was the largest class in humid forests, accounting for of screened pixels. In contrast, Moisture balance () was the largest class in semi-humid () and semi-arid forests (). Temperature-related classes accounted for smaller proportions: Temperature () represented of screened humid pixels, whereas Temperature () reached in semi-humid forests. These nominally screened class proportions are descriptive and should not be interpreted as field-wide statistical significance under spatial autocorrelation and multiple testing. Together, these patterns show a consistent zonal ordering in the estimated direction and relative prominence of climate–productivity associations, with positive climatic-water-balance associations becoming increasingly prevalent toward drier forest environments. Given the modest model explanatory power, this ordering should be interpreted as a spatial pattern in estimated associations rather than evidence of strong or causal climate control.
Under the tested alternative model-screening and spatial-weighting procedures, the identity of the largest zonal association class remained unchanged, although exact class proportions varied among sensitivity definitions. Additional sensitivity analyses of significance thresholds, near-tied predictor prominence, spatial weighting, and rank-based standardization are reported in the Supplementary Materials.
3.5. Sensitivity to NPP Harmonization and Growing-Season Definition
Cross-product correspondence was substantially weaker at the annual than at the monthly growing-season scale. During 2001–2015, the area-weighted median of pixel-wise annual between CASA and raw MODIS-derived MJJAS NPP was 0.061 (IQR: 0.015–0.155), decreasing to 0.044 (IQR: 0.010–0.124) after linear detrending. The 2015–2016 source transition corresponded to a change in forest-domain mean growing-season NPP, with its absolute magnitude falling at the 56.41st percentile of adjacent-year changes over 1985–2024 (Supplementary Figures S2 and S3 and Table S8).
Despite this limited interannual cross-product correspondence, the principal hydroclimatic ordering was reproduced when the core correlations were recalculated using CASA NPP alone for 1985–2015, without the MODIS-based extension or cross-product harmonization. The same ordering was also retained when June–August was used as a narrower common core-season window. Temperature–NPP associations became less positive or more negative from humid toward semi-arid forests, whereas climatic-water-balance–NPP associations became progressively more positive under both sensitivity analyses (Supplementary Figure S4 and Table S8).
4. Discussion
Growing-season climate–productivity associations across Northeast China varied systematically with regional hydroclimatic background while retaining pronounced spatial heterogeneity at the pixel scale. The clearest zonal gradient involved climatic water balance: associations were progressively more positive from humid toward semi-arid forests. Temperature–productivity associations also tended to become less positive or more negative toward drier environments, although this tendency showed greater spatial variability and was less consistent across sensitivity analyses than the water-balance pattern. This broad spatial organization is consistent with previous evidence that forest productivity and climate responses vary markedly across environmental gradients in Northeast China rather than following a uniform regional pattern [20,21,50]. Similar spatial heterogeneity in tree-growth responses across temperate forests of Northeast Asia further highlights the importance of local climatic background when interpreting regional forest responses to climate variability [51]. Part of this within-zone heterogeneity may also reflect differences in species composition and drought-response strategies, including stomatal regulation, hydraulic safety, rooting behavior, and carbon allocation, which can alter how trees respond to similar hydroclimatic anomalies [11,12]. Our findings extend this perspective by showing that both the direction of bivariate relationships and the relative prominence of temperature and climatic-water-balance associations change along the regional hydroclimatic gradient. Under continued warming, increasing atmospheric evaporative demand may enhance the ecological importance of moisture limitation toward the drier forest margin, even though the historical climatic-water-balance trends observed here were spatially heterogeneous rather than uniformly drying [8,9].
These hydroclimatic contrasts must nevertheless be interpreted within the scope of the analysis. Most pixels did not pass the nominal screen, and the two-predictor model captured only a modest fraction of pixel-scale interannual variability. Moreover, the trend and association analyses represent different temporal dimensions. Long-term changes in the non-detrended series included widespread warming and positive zonal median SNPI trends, whereas the association analyses quantify synchronous year-to-year covariation after pixel-wise linear trends were removed. The coexistence of regional warming and increasing productivity therefore does not imply that concurrent warming caused the long-term increase in NPP.
4.1. Hydroclimatic Variation in Climatic-Water-Balance Associations
Climatic-water-balance associations were progressively more positive toward drier environments. From humid to semi-arid forests, both the median – correlation and the proportion of pixels classified as Moisture balance () increased systematically. This pattern indicates that positive local climatic-water-balance anomalies were more consistently associated with positive productivity anomalies toward the drier forest margin. Such spatial ordering is consistent with growing evidence that forest responses to water limitation depend on background aridity and the balance between energy and water availability [7,10,15]. Regional studies provide complementary support, showing that drought–NPP relationships, precipitation sensitivity, and drought-related water-use-efficiency responses vary across Northeast China [17,23,50,52]. Broader analyses similarly show that drought–NPP relationships differ among climatic zones and that ecosystem productivity responses to precipitation can be asymmetric at broad spatial scales [16,53]. Despite differences in response variables and water-stress metrics, these studies collectively support the broader interpretation that water-related vegetation responses vary systematically with local hydroclimatic context rather than being spatially uniform across the region. Moreover, the same hydroclimatic ordering was evident in both continuous correlations and conditional association classes, indicating that the broad water-balance pattern was not confined to a single statistical representation, although exact class proportions varied among sensitivity definitions.
These climatic-water-balance associations should not be interpreted as direct measurements of physiological water stress. The metric represents a climatic balance between precipitation input and potential evapotranspiration and is distinct from plant-available soil moisture, atmospheric vapor pressure deficit, or plant hydraulic status; vegetation responses to soil-moisture limitation and atmospheric dryness can themselves differ substantially [13,14,54]. This distinction is particularly relevant in humid forests, where water supply is less likely to be the dominant constraint during many growing seasons. Consequently, additional positive water-balance anomalies may confer limited productivity benefit and can coincide with cloud-related radiation limitation or wetter-soil drainage and aeration constraints, without implying that greater water availability generally suppresses forest productivity [55,56,57]. Fine-scale topography can further modify drainage, plant-available water, radiation exposure, and local thermal conditions, so neighboring forest stands exposed to similar regional climate anomalies may nevertheless experience different local hydroclimatic conditions [58]. The strong positive association in the semi-arid zone should also be interpreted in light of its smaller spatial representation. This zone contained 8378 forest pixels, compared with 108,180 in the semi-humid zone and 736,864 in the humid zone. Although the smaller pixel count does not negate the observed zonal ordering, which persisted across the tested sensitivity definitions, the exact semi-arid proportions should not be generalized directly to dry forests beyond the study domain.
4.2. Temperature Associations Across Contrasting Hydroclimatic Contexts
Temperature–productivity associations exhibited a subtle yet coherent hydroclimatic gradient. Median – correlations shifted from weakly positive in humid forests to negative in semi-humid and semi-arid forests, indicating that positive growing-season temperature anomalies were associated with progressively less favorable productivity anomalies toward drier forest margins. This context dependence is broadly consistent with shifts in the balance between energy and water constraints [59]. In cool, energy-limited systems, warmer conditions may relax thermal limitations, whereas in drier settings any potential benefit of additional warmth may diminish as higher temperatures coincide with greater atmospheric evaporative demand and vapor pressure deficit [8,9,54,60]. Forest studies spanning energy–water and precipitation gradients likewise show that tree-growth and productivity responses to climate vary with climatic background rather than following a uniform direction across sites [3,7,10]. Recent studies across Northeast Asia likewise show substantial spatial heterogeneity in vegetation and tree-growth responses to climatic conditions [51,61].
This temperature gradient was nevertheless less robust than the climatic-water-balance pattern. Correlation distributions overlapped substantially among hydroclimatic zones, positive and negative temperature associations coexisted within every zone, and the relative prominence of temperature did not change monotonically across all alternative classification and sensitivity definitions. A negative coefficient should therefore not be interpreted as direct evidence of physiological heat stress or as a physiological temperature threshold. Because represents a relative pixel-level temperature anomaly, temperature can covary with solar radiation, seasonal phenology, atmospheric demand, and other environmental conditions not explicitly represented in the two-predictor model. A negative coefficient thus indicates that warmer-than-usual growing seasons tended to coincide with lower-than-usual productivity after accounting statistically for climatic water balance; it does not identify the biophysical process responsible for that relationship. The observed temperature gradient is therefore best interpreted as a partially robust shift in the distribution of local climate–productivity associations rather than as a uniform negative effect of warming on forest productivity.
4.3. Spatial Heterogeneity and Limited Model Explanatory Strength
Pronounced within-zone heterogeneity and modest explanatory power indicate that hydroclimatic background provides a broad regional context without determining pixel-level responses. Median model remained below 0.10 across all three hydroclimatic zones, although higher values occurred more frequently in the semi-arid zone. Similar spatial heterogeneity characterizes forest productivity and climate sensitivity across Northeast China and other temperate forest regions, where local responses vary with vegetation characteristics, site conditions, and climatic background [3,20,21,22,62]. The coexistence of positive and negative coefficients within the same hydroclimatic zone further indicates that regional hydroclimate organizes broad association patterns without fully accounting for interannual productivity variability at individual pixels.
Several biophysical and ecological factors could contribute to the unexplained variance. Forest productivity responds to environmental and ecological conditions beyond the two predictors considered here, including solar radiation, atmospheric demand, soil moisture and groundwater availability, soil properties, stand age and structure, community composition, and disturbance history [63,64,65]. In addition, the use of a fixed growing-season window and 1 km spatial resolution may smooth finer-scale phenological dynamics and local environmental variation, while lagged or legacy responses may separate climatic anomalies from productivity responses in time [66,67,68,69]. These analytical and scale-related limitations could help explain why modest pixel-scale values can coexist with a regionally coherent zonal ordering of estimated climate–productivity associations. Accordingly, the model is most informative for identifying broad spatial contrasts in synchronous climate–productivity associations rather than for comprehensively explaining or predicting interannual NPP variability at individual pixels.
4.4. Robustness, Uncertainty, and Scope of Inference
Sensitivity analyses helped distinguish which dimensions of the observed hydroclimatic reorganization were most stable. The systematic shift toward more positive climatic-water-balance associations in drier forests persisted across alternative data preprocessing, model-screening thresholds, and spatial-weighting schemes, making this ordering the most robust feature of the analysis. The temperature pattern proved less stable: while associations generally shifted toward less positive or more negative values in drier settings, the magnitude and relative prominence of this tendency varied across analytical formulations. Similarly, the largest association class within each hydroclimatic zone remained consistent under the tested screening and weighting choices, whereas exact numerical proportions varied. Consequently, our interpretation prioritizes the direction and zonal ordering of these climate–productivity associations rather than specific percentages or pixel-level classifications.
Additional sensitivity analyses directly evaluated dependence on NPP harmonization and growing-season definition. Although CASA and raw MODIS-derived growing-season NPP showed limited interannual correspondence during their 2001–2015 overlap, the 2015–2016 domain-mean NPP change () fell near the middle of the distribution of absolute adjacent-year changes across the full record. More importantly, repeating the core climate–NPP analysis using the CASA record alone for 1985–2015 reproduced the same hydroclimatic ordering of both temperature–productivity and climatic-water-balance associations. The same zonal ordering was also retained when June–August was used as a narrower common core-season window. Together, these sensitivity analyses showed that the principal hydroclimatic ordering was retained both when the analysis was restricted to the CASA record and when JJA was used as a narrower common core-season window (Supplementary Figure S4 and Table S8). The composite NPP record should therefore be interpreted as a harmonized long-term productivity record rather than as a homogeneous single-product series. The relatively weak annual cross-product correspondence and the GPP-based temporal allocation remain sources of uncertainty for full-period interannual inference, even though the CASA-only sensitivity analysis retained the same broad hydroclimatic ordering.
Several methodological considerations further delimit the scope of inference. Because , , and were standardized relative to local historical distributions, identical standardized values do not represent identical absolute climatic or productivity departures across space. The analysis therefore compares local-relative interannual anomalies rather than common absolute exposure levels. Furthermore, pixel-wise significance tests were used only as nominal descriptive screens and should not be interpreted as field-wide evidence in a spatially correlated multiple-testing setting [49]. Most fundamentally, the detrended two-predictor model quantifies synchronous statistical associations; it cannot establish causality, identify physiological thresholds, or predict future NPP responses under changing climatic conditions. The central inference is therefore comparative and regional: the direction and relative prominence of temperature and climatic-water-balance associations vary systematically across the hydroclimatic gradient of Northeast China, with the climatic-water-balance pattern showing the greatest analytical stability.
5. Conclusions
Climate–productivity associations showed a consistent zonal ordering across Northeast China’s hydroclimatic gradient. The clearest and most robust pattern involved climatic water balance: associations were progressively more positive toward drier forest margins, while the largest zonal association class remained stable across the tested analytical definitions. Temperature associations showed a parallel tendency toward less positive or more negative values from humid to semi-arid forests, although this pattern exhibited greater spatial variability and lower analytical stability. The climatic-water-balance ordering was therefore more consistent than the temperature tendency, indicating that interannual climate–productivity associations differed systematically with hydroclimatic background rather than following a single regional relationship. The same zonal ordering was retained when the analysis was restricted to CASA NPP for 1985–2015 and when JJA was used as a narrower common core-season window.
This broad zonal ordering was more stable than exact class proportions or individual pixel classifications. Most forest pixels did not pass the nominal model screen, overall explanatory power remained modest, and association distributions overlapped substantially among hydroclimatic zones. Moreover, climatic water balance represents precipitation relative to potential evapotranspiration rather than direct plant-available soil moisture or plant water status, while the standardized anomalies describe local-relative departures rather than equivalent absolute exposures across the region. The results therefore characterize detrended, synchronous statistical associations rather than direct biophysical mechanisms or predictive relationships. Within these limits, the analysis shows that the direction and relative prominence of temperature and climatic-water-balance associations vary systematically with hydroclimatic background, and that regional-average summaries can obscure substantial local variation across Northeast China’s forests. From a forest-management perspective, these contrasts support hydroclimatically differentiated monitoring and risk assessment rather than assuming a uniform climate–productivity response across the region. In particular, water-balance variability warrants greater attention toward the drier forest margins, whereas responses in humid forests may depend more strongly on local site conditions, stand characteristics, and other environmental constraints. Such spatial differentiation can help identify where climate-related productivity monitoring should be prioritized under continued warming, without implying a deterministic response at individual forest stands.
Supplementary Materials
The following supporting information can be downloaded at https://www.mdpi.com/article/10.3390/f17101192/s1, Figure S1, Pixel-wise coefficient of determination () between CASA and raw MODIS-derived monthly NPP during May–September of the 2001–2015 overlap period (75 monthly paired observations per pixel); Figure S2, Forest-domain mean growing-season NPP for the harmonized composite 1985–2024 growing-season record; Figure S3, Annual MJJAS correspondence between CASA and raw MODIS-derived NPP during 2001–2015 ( annual pairs); Figure S4, Sensitivity of (a) temperature–NPP and (b) climatic-water-balance–NPP associations across hydroclimatic zones; Table S1, Analytical domain and hydroclimatic-zone definitions; Table S2, Zone-level trend summaries corresponding to Figure 2; Table S3, Zone-level climate–NPP correlation summaries corresponding to Figure 3; Table S4, Diagnostics and threshold summaries for the pixel-wise two-predictor association model; Table S5, Dominant association-class proportions for the pixel-wise two-predictor association model corresponding to Figure 5; Table S6, Nominal-threshold sensitivity of model screening and dominant zonal association classes; Table S7, Robustness of dominant association patterns under no-gate and original-unit analyses; and Table S8, Additional robustness diagnostics for NPP harmonization, source-product sensitivity, and seasonal-window sensitivity.
Author Contributions
Conceptualization, J.O. and W.W.; methodology, J.O. and W.W.; software, J.O.; formal analysis, J.O.; data curation, J.O.; visualization, J.O.; writing—original draft preparation, J.O.; writing—review and editing, J.O., H.L., Q.W., R.G. and W.W.; supervision, W.W.; project administration, W.W.; funding acquisition, W.W. All authors have read and agreed to the published version of the manuscript.
Funding
This research was funded by the National Natural Science Foundation of China, grant number 32271867.
Institutional Review Board Statement
Not applicable.
Informed Consent Statement
Not applicable.
Data Availability Statement
The source datasets used in this study are available from the repositories and data providers cited in Section 2. Derived analytical outputs and analysis code supporting the reported results are available from the corresponding author upon reasonable request.
Acknowledgments
The authors thank the faculty and students of the Department of Forest Management, Northeast Forestry University, for their assistance and support. During the preparation and revision of this manuscript, the authors used ChatGPT (GPT-5.6 Sol, OpenAI) and Codex (GPT-5.6 Sol, OpenAI) for language editing and assistance with code-related and technical workflows. A detailed description of their use is provided in Section 2. All AI-assisted outputs were reviewed and edited by the authors, who take full responsibility for the content of this publication.
Conflicts of Interest
The authors declare no conflicts of interest.
Abbreviations
The following abbreviations are used in this manuscript:
| AI | Aridity Index |
| CASA | Carnegie–Ames–Stanford Approach |
| CLCD | China Land Cover Dataset |
| GPP | Gross Primary Productivity |
| MAE | Mean Annual Potential Evapotranspiration |
| MAP | Mean Annual Precipitation |
| MODIS | Moderate Resolution Imaging Spectroradiometer |
| NPP | Net Primary Productivity |
| PET | Potential Evapotranspiration |
| PRE | Precipitation |
| SNPI | Standardized Net Primary Productivity Index |
| SPEI | Standardized Precipitation Evapotranspiration Index |
| STI | Standardized Temperature Index |
| TMP | Mean Air Temperature |
| TPDC | National Tibetan Plateau/Third Pole Environment Data Center |
References
- Pan, Y.; Birdsey, R.A.; Phillips, O.L.; Houghton, R.A.; Fang, J.; Kauppi, P.E.; Keith, H.; Kurz, W.A.; Ito, A.; Lewis, S.L.; et al. The Enduring World Forest Carbon Sink. Nature 2024, 631, 563–569, Correction in Nature 2024, 632, E7. https://doi.org/10.1038/s41586-024-07897-w. [Google Scholar] [CrossRef] [Scilit] [PubMed]
- Wolf, S.; Paul-Limoges, E. Drought and Heat Reduce Forest Carbon Uptake. Nat. Commun. 2023, 14, 6217. [Google Scholar] [CrossRef] [Scilit] [PubMed]
- Hogan, J.A.; Domke, G.M.; Zhu, K.; Johnson, D.J.; Lichstein, J.W. Climate Change Determines the Sign of Productivity Trends in US Forests. Proc. Natl. Acad. Sci. USA 2024, 121, e2311132121. [Google Scholar] [CrossRef] [Scilit] [PubMed]
- Forzieri, G.; Dakos, V.; McDowell, N.G.; Ramdane, A.; Cescatti, A. Emerging Signals of Declining Forest Resilience under Climate Change. Nature 2022, 608, 534–539. [Google Scholar] [CrossRef] [Scilit] [PubMed]
- Anderegg, W.R.L.; Trugman, A.T.; Badgley, G.; Anderson, C.M.; Bartuska, A.; Ciais, P.; Cullenward, D.; Field, C.B.; Freeman, J.; Goetz, S.J.; et al. Climate-Driven Risks to the Climate Mitigation Potential of Forests. Science 2020, 368, eaaz7005. [Google Scholar] [CrossRef] [Scilit] [PubMed]
- Denissen, J.M.C.; Teuling, A.J.; Pitman, A.J.; Koirala, S.; Migliavacca, M.; Li, W.; Reichstein, M.; Winkler, A.J.; Zhan, C.; Orth, R. Widespread Shift from Ecosystem Energy to Water Limitation with Climate Change. Nat. Clim. Change 2022, 12, 677–684, Correction in Nat. Clim. Change 2023, 13, 871. https://doi.org/10.1038/s41558-023-01729-x. [Google Scholar] [CrossRef] [Scilit]
- Dudney, J.; Latimer, A.M.; Van Mantgem, P.; Zald, H.; Willing, C.E.; Nesmith, J.C.B.; Cribbs, J.; Milano, E. The Energy–Water Limitation Threshold Explains Divergent Drought Responses in Tree Growth, Needle Length, and Stable Isotope Ratios. Glob. Change Biol. 2023, 29, 4368–4382. [Google Scholar] [CrossRef] [Scilit] [PubMed]
- Grossiord, C.; Buckley, T.N.; Cernusak, L.A.; Novick, K.A.; Poulter, B.; Siegwolf, R.T.W.; Sperry, J.S.; McDowell, N.G. Plant Responses to Rising Vapor Pressure Deficit. New Phytol. 2020, 226, 1550–1566. [Google Scholar] [CrossRef] [Scilit] [PubMed]
- Novick, K.A.; Ficklin, D.L.; Stoy, P.C.; Williams, C.A.; Bohrer, G.; Oishi, A.C.; Papuga, S.A.; Blanken, P.D.; Noormets, A.; Sulman, B.N.; et al. The Increasing Importance of Atmospheric Demand for Ecosystem Water and Carbon Fluxes. Nat. Clim. Change 2016, 6, 1023–1027. [Google Scholar] [CrossRef] [Scilit]
- Weigel, R.; Bat-Enerel, B.; Dulamsuren, C.; Muffler, L.; Weithmann, G.; Leuschner, C. Summer Drought Exposure, Stand Structure, and Soil Properties Jointly Control the Growth of European Beech along a Steep Precipitation Gradient in Northern Germany. Glob. Change Biol. 2023, 29, 763–779. [Google Scholar] [CrossRef] [Scilit] [PubMed]
- McDowell, N.; Pockman, W.T.; Allen, C.D.; Breshears, D.D.; Cobb, N.; Kolb, T.; Plaut, J.; Sperry, J.; West, A.; Williams, D.G.; et al. Mechanisms of Plant Survival and Mortality during Drought: Why Do Some Plants Survive While Others Succumb to Drought? New Phytol. 2008, 178, 719–739. [Google Scholar] [CrossRef] [Scilit] [PubMed]
- Adams, H.D.; Zeppel, M.J.B.; Anderegg, W.R.L.; Hartmann, H.; Landhäusser, S.M.; Tissue, D.T.; Huxman, T.E.; Hudson, P.J.; Franz, T.E.; Allen, C.D.; et al. A Multi-Species Synthesis of Physiological Mechanisms in Drought-Induced Tree Mortality. Nat. Ecol. Evol. 2017, 1, 1285–1291. [Google Scholar] [CrossRef] [Scilit] [PubMed]
- Liu, L.; Gudmundsson, L.; Hauser, M.; Qin, D.; Li, S.; Seneviratne, S.I. Soil Moisture Dominates Dryness Stress on Ecosystem Production Globally. Nat. Commun. 2020, 11, 4892. [Google Scholar] [CrossRef] [Scilit] [PubMed]
- Mirabel, A.; Girardin, M.P.; Metsaranta, J.; Way, D.; Reich, P.B. Increasing Atmospheric Dryness Reduces Boreal Forest Tree Growth. Nat. Commun. 2023, 14, 6901. [Google Scholar] [CrossRef] [Scilit] [PubMed]
- Mengoli, G.; Harrison, S.P.; Prentice, I.C. The Response of Carbon Uptake to Soil Moisture Stress: Adaptation to Climatic Aridity. Glob. Change Biol. 2025, 31, e70098. [Google Scholar] [CrossRef] [Scilit] [PubMed]
- Liu, Y.; Zhou, R.; Wen, Z.; Khalifa, M.; Zheng, C.; Ren, H.; Zhang, Z.; Wang, Z. Assessing the Impacts of Drought on Net Primary Productivity of Global Land Biomes in Different Climate Zones. Ecol. Indic. 2021, 130, 108146. [Google Scholar] [CrossRef] [Scilit]
- Zhao, H.; Jia, G.; Xu, X.; Zhang, A. Contrasting Responses of Vegetation Production to Rainfall Anomalies Across the Northeast China Transect. J. Geophys. Res. Biogeosci. 2022, 127, e2022JG006842. [Google Scholar] [CrossRef] [Scilit]
- Babst, F.; Bouriaud, O.; Poulter, B.; Trouet, V.; Girardin, M.P.; Frank, D.C. Twentieth Century Redistribution in Climatic Drivers of Global Tree Growth. Sci. Adv. 2019, 5, eaat4313. [Google Scholar] [CrossRef] [Scilit] [PubMed]
- Zhao, J.; Yan, X.; Guo, J.; Jia, G. Evaluating Spatial-Temporal Dynamics of Net Primary Productivity of Different Forest Types in Northeastern China Based on Improved FORCCHN. PLoS ONE 2012, 7, e48131. [Google Scholar] [CrossRef] [Scilit] [PubMed]
- Mao, D.; Wang, Z.; Wu, C.; Song, K.; Ren, C. Examining Forest Net Primary Productivity Dynamics and Driving Forces in Northeastern China during 1982–2010. Chin. Geogr. Sci. 2014, 24, 631–646. [Google Scholar] [CrossRef] [Scilit]
- Qiu, Y.; Zhao, X.; Fan, D.; Zheng, Z.; Zhang, Y.; Zhang, J. Monitoring Net Primary Productivity of Vegetation and Analyzing Its Drivers in Support of SDG Indicator 15.3.1: A Case Study of Northeast China. Remote Sens. 2024, 16, 2455. [Google Scholar] [CrossRef] [Scilit]
- Du, Z.; Liu, X.; Wu, Z.; Zhang, H.; Zhao, J. Responses of Forest Net Primary Productivity to Climatic Factors in China during 1982–2015. Plants 2022, 11, 2932. [Google Scholar] [CrossRef] [Scilit]
- Liu, D.; Yu, C.; Zhao, F. Response of the Water Use Efficiency of Natural Vegetation to Drought in Northeast China. J. Geogr. Sci. 2018, 28, 611–628. [Google Scholar] [CrossRef] [Scilit]
- Wang, X.Y.; Zhao, C.Y.; Jia, Q.Y. Impacts of Climate Change on Forest Ecosystems in Northeast China. Adv. Clim. Change Res. 2013, 4, 230–241. [Google Scholar] [CrossRef] [Scilit]
- Xu, Z.; Liu, D.; Zhao, L. Hydrothermal Conditions Modulate the Impact of Climate Extremes on Vegetation Growth in the Northern Hemisphere. Glob. Ecol. Biogeogr. 2024, 33, e13898. [Google Scholar] [CrossRef] [Scilit]
- Peng, J.; Dong, W.; Yuan, W.; Zhang, Y. Responses of Grassland and Forest to Temperature and Precipitation Changes in Northeast China. Adv. Atmos. Sci. 2012, 29, 1063–1077. [Google Scholar] [CrossRef] [Scilit]
- Ouyang, S.; Wang, X.; Wu, Y.; Sun, O.J. Contrasting Responses of Net Primary Productivity to Inter-Annual Variability and Changes of Climate among Three Forest Types in Northern China. J. Plant Ecol. 2014, 7, 309–320. [Google Scholar] [CrossRef] [Scilit]
- Ceglar, A.; Toreti, A.; Prodhomme, C.; Zampieri, M.; Turco, M.; Doblas-Reyes, F.J. Land-Surface Initialisation Improves Seasonal Climate Prediction Skill for Maize Yield Forecast. Sci. Rep. 2018, 8, 1322. [Google Scholar] [CrossRef] [Scilit] [PubMed]
- Simanjuntak, C.; Gaiser, T.; Ahrends, H.E.; Ceglar, A.; Singh, M.; Ewert, F.; Srivastava, A.K. Impact of Climate Extreme Events and Their Causality on Maize Yield in South Africa. Sci. Rep. 2023, 13, 12462. [Google Scholar] [CrossRef] [Scilit] [PubMed]
- Peng, S.; Ding, Y.; Liu, W.; Li, Z. 1 Km Monthly Temperature and Precipitation Dataset for China from 1901 to 2017. Earth Syst. Sci. Data 2019, 11, 1931–1946. [Google Scholar] [CrossRef] [Scilit]
- Hargreaves, G.H.; Samani, Z.A. Reference Crop Evapotranspiration from Temperature. Appl. Eng. Agric. 1985, 1, 96–99. [Google Scholar] [CrossRef] [Scilit]
- Ding, Y.; Peng, S. Spatiotemporal Change and Attribution of Potential Evapotranspiration over China from 1901 to 2100. Theor. Appl. Climatol. 2021, 145, 79–94. [Google Scholar] [CrossRef] [Scilit]
- Wang, C.; Jiang, Q.; Deng, X.; Lv, K.; Zhang, Z. Spatio-Temporal Evolution, Future Trend and Phenology Regularity of Net Primary Productivity of Forests in Northeast China. Remote Sens. 2020, 12, 3670. [Google Scholar] [CrossRef] [Scilit]
- Chen, P. Monthly NPP Dataset Covering China’s Terrestrial Ecosystems at North of 18°N (1985–2015). J. Glob. Change Data Discov. 2019, 3, 34–41. [Google Scholar] [CrossRef] [Scilit]
- Running, S.W.; Nemani, R.R.; Heinsch, F.A.; Zhao, M.; Reeves, M.; Hashimoto, H. A Continuous Satellite-Derived Measure of Global Terrestrial Primary Production. BioScience 2004, 54, 547–560. [Google Scholar] [CrossRef] [Scilit]
- Running, S.; Zhao, M. MODIS/Terra Net Primary Production Gap-Filled Yearly L4 Global 500m SIN Grid V061; NASA Land Processes Distributed Active Archive Center: Sioux Falls, SD, USA, 2021. [Google Scholar] [CrossRef]
- Running, S.; Zhao, M. MODIS/Terra Gross Primary Productivity Gap-Filled 8-Day L4 Global 500m SIN Grid V061; NASA Land Processes Distributed Active Archive Center: Sioux Falls, SD, USA, 2021. [Google Scholar] [CrossRef]
- Wang, L.; Zhu, H.; Lin, A.; Zou, L.; Qin, W.; Du, Q. Evaluation of the Latest MODIS GPP Products across Multiple Biomes Using Global Eddy Covariance Flux Data. Remote Sens. 2017, 9, 418. [Google Scholar] [CrossRef] [Scilit]
- Turner, D.P.; Ritts, W.D.; Cohen, W.B.; Maeirsperger, T.K.; Gower, S.T.; Kirschbaum, A.A.; Running, S.W.; Zhao, M.; Wofsy, S.C.; Dunn, A.L.; et al. Site-Level Evaluation of Satellite-Based Global Terrestrial Gross Primary Production and Net Primary Production Monitoring. Glob. Change Biol. 2005, 11, 666–684. [Google Scholar] [CrossRef] [Scilit]
- Turner, D.P.; Ritts, W.D.; Cohen, W.B.; Gower, S.T.; Running, S.W.; Zhao, M.; Costa, M.H.; Kirschbaum, A.A.; Ham, J.M.; Saleska, S.R.; et al. Evaluation of MODIS NPP and GPP Products across Multiple Biomes. Remote Sens. Environ. 2006, 102, 282–292. [Google Scholar] [CrossRef] [Scilit]
- Yang, J.; Huang, X. The 30 m Annual Land Cover Dataset and Its Dynamics in China from 1990 to 2019. Earth Syst. Sci. Data 2021, 13, 3907–3925. [Google Scholar] [CrossRef] [Scilit]
- Li, Y.; Sulla-Menashe, D.; Motesharrei, S.; Song, X.P.; Kalnay, E.; Ying, Q.; Li, S.; Ma, Z. Inconsistent Estimates of Forest Cover Change in China between 2000 and 2013 from Multiple Datasets: Differences in Parameters, Spatial Resolution, and Definitions. Sci. Rep. 2017, 7, 8748. [Google Scholar] [CrossRef] [Scilit] [PubMed]
- Crouzeilles, R.; Curran, M. Which Landscape Size Best Predicts the Influence of Forest Cover on Restoration Success? A Global Meta-Analysis on the Scale of Effect. J. Appl. Ecol. 2016, 53, 440–448. [Google Scholar] [CrossRef] [Scilit]
- Vicente-Serrano, S.M.; Beguería, S.; López-Moreno, J.I. A Multiscalar Drought Index Sensitive to Global Warming: The Standardized Precipitation Evapotranspiration Index. J. Clim. 2010, 23, 1696–1718. [Google Scholar] [CrossRef] [Scilit]
- Nguyen, L.; Ombadi, M. Characterizing Patterns of Drought Synchronicity in the Contiguous United States. Water Resour. Res. 2026, 62, e2025WR041240. [Google Scholar] [CrossRef] [Scilit]
- Gringorten, I.I. A Plotting Rule for Extreme Probability Paper. J. Geophys. Res. 1963, 68, 813–814. [Google Scholar] [CrossRef] [Scilit]
- Sen, P.K. Estimates of the Regression Coefficient Based on Kendall’s Tau. J. Am. Stat. Assoc. 1968, 63, 1379–1389. [Google Scholar] [CrossRef]
- Mann, H.B. Nonparametric Tests Against Trend. Econometrica 1945, 13, 245–259. [Google Scholar] [CrossRef] [Scilit]
- Wilks, D.S. “The Stippling Shows Statistically Significant Grid Points”: How Research Results Are Routinely Overstated and Overinterpreted, and What to Do about It. Bull. Am. Meteorol. Soc. 2016, 97, 2263–2273. [Google Scholar] [CrossRef] [Scilit]
- Sun, B.; Zhao, H.; Wang, X. Effects of Drought on Net Primary Productivity: Roles of Temperature, Drought Intensity, and Duration. Chin. Geogr. Sci. 2016, 26, 270–282. [Google Scholar] [CrossRef] [Scilit]
- Altmanová, N.; Fibich, P.; Doležal, J.; Bažant, V.; Černý, T.; Molina, J.G.A.; Enoki, T.; Hara, T.; Hoshizaki, K.; Ida, H.; et al. Spatial Heterogeneity of Tree-Growth Responses to Climate across Temperate Forests in Northeast Asia. Agric. For. Meteorol. 2025, 362, 110355. [Google Scholar] [CrossRef] [Scilit]
- Hai, Y.; Han, T.; Wang, Y.; Li, R.; Yang, Y.; Wen, Z.; Zheng, H. Quantifying the Impact of Precipitation Fluctuations on Forest Growth in Northeast China. Front. Plant Sci. 2025, 16, 1570005. [Google Scholar] [CrossRef] [Scilit] [PubMed]
- Dai, L.; Liang, M.; Chen, A.; Yang, G.; Jin, C.; Yuan, W.; Hu, Z. Increased Asymmetry of Ecosystem Productivity Responses to Precipitation in Recent Two Decades. Geophys. Res. Lett. 2025, 52, e2024GL113861. [Google Scholar] [CrossRef] [Scilit]
- Fu, Z.; Ciais, P.; Prentice, I.C.; Gentine, P.; Makowski, D.; Bastos, A.; Luo, X.; Green, J.K.; Stoy, P.C.; Yang, H.; et al. Atmospheric Dryness Reduces Photosynthesis along a Large Range of Soil Water Deficits. Nat. Commun. 2022, 13, 989. [Google Scholar] [CrossRef] [Scilit] [PubMed]
- Nemani, R.R.; Keeling, C.D.; Hashimoto, H.; Jolly, W.M.; Piper, S.C.; Tucker, C.J.; Myneni, R.B.; Running, S.W. Climate-Driven Increases in Global Terrestrial Net Primary Production from 1982 to 1999. Science 2003, 300, 1560–1563. [Google Scholar] [CrossRef] [Scilit] [PubMed]
- Graham, E.A.; Mulkey, S.S.; Kitajima, K.; Phillips, N.G.; Wright, S.J. Cloud Cover Limits Net CO2 Uptake and Growth of a Rainforest Tree during Tropical Rainy Seasons. Proc. Natl. Acad. Sci. USA 2003, 100, 572–576. [Google Scholar] [CrossRef] [Scilit] [PubMed]
- Schuur, E.A.G. Productivity and Global Climate Revisited: The Sensitivity of Tropical Forest Growth to Precipitation. Ecology 2003, 84, 1165–1170. [Google Scholar] [CrossRef] [Scilit]
- Adams, H.R.; Barnard, H.R.; Loomis, A.K. Topography Alters Tree Growth–Climate Relationships in a Semi-Arid Forested Catchment. Ecosphere 2014, 5, 148. [Google Scholar] [CrossRef] [Scilit]
- Miller, D.L.; Wolf, S.; Fisher, J.B.; Zaitchik, B.F.; Xiao, J.; Keenan, T.F. Increased Photosynthesis during Spring Drought in Energy-Limited Ecosystems. Nat. Commun. 2023, 14, 7828. [Google Scholar] [CrossRef] [Scilit] [PubMed]
- Yuan, W.; Zheng, Y.; Piao, S.; Ciais, P.; Lombardozzi, D.; Wang, Y.; Ryu, Y.; Chen, G.; Dong, W.; Hu, Z.; et al. Increased Atmospheric Vapor Pressure Deficit Reduces Global Vegetation Growth. Sci. Adv. 2019, 5, eaax1396. [Google Scholar] [CrossRef] [Scilit] [PubMed]
- Liu, D.; Zhang, J.; Zhao, L.; Zhao, S.; Cui, G. The Positive Impact of Extreme Heat on Vegetation Growth in Northeast Asia. Agric. For. Meteorol. 2024, 347, 109918. [Google Scholar] [CrossRef] [Scilit]
- Wu, M.M.; Liang, Y.; Taubert, F.; Huth, A.; Zhang, M.; Wang, X. Sensitivity of Forest Composition and Productivity to Climate Change in Mixed Broadleaved-Korean Pine Forest of Northeastern China. Ecol. Model. 2023, 483, 110434. [Google Scholar] [CrossRef] [Scilit]
- McDowell, N.G.; Allen, C.D.; Anderson-Teixeira, K.; Aukema, B.H.; Bond-Lamberty, B.; Chini, L.; Clark, J.S.; Dietze, M.; Grossiord, C.; Hanbury-Brown, A.; et al. Pervasive Shifts in Forest Dynamics in a Changing World. Science 2020, 368, eaaz9463. [Google Scholar] [CrossRef] [Scilit] [PubMed]
- Novick, K.A.; Ficklin, D.L.; Grossiord, C.; Konings, A.G.; Martínez-Vilalta, J.; Sadok, W.; Trugman, A.T.; Williams, A.P.; Wright, A.J.; Abatzoglou, J.T.; et al. The Impacts of Rising Vapour Pressure Deficit in Natural and Managed Ecosystems. Plant Cell Environ. 2024, 47, 3561–3589. [Google Scholar] [CrossRef] [Scilit] [PubMed]
- Martínez-García, E.; Nilsson, M.B.; Laudon, H.; Lundmark, T.; Fransson, J.E.S.; Wallerman, J.; Peichl, M. Drought Response of the Boreal Forest Carbon Sink Is Driven by Understorey–Tree Composition. Nat. Geosci. 2024, 17, 197–204. [Google Scholar] [CrossRef] [Scilit]
- Anderegg, W.R.L.; Schwalm, C.; Biondi, F.; Camarero, J.J.; Koch, G.; Litvak, M.; Ogle, K.; Shaw, J.D.; Shevliakova, E.; Williams, A.P.; et al. Pervasive Drought Legacies in Forest Ecosystems and Their Implications for Carbon Cycle Models. Science 2015, 349, 528–532. [Google Scholar] [CrossRef] [Scilit] [PubMed]
- Schwalm, C.R.; Anderegg, W.R.L.; Michalak, A.M.; Fisher, J.B.; Biondi, F.; Koch, G.; Litvak, M.; Ogle, K.; Shaw, J.D.; Wolf, A.; et al. Global Patterns of Drought Recovery. Nature 2017, 548, 202–205. [Google Scholar] [CrossRef] [Scilit] [PubMed]
- Wu, M.; Manzoni, S.; Vico, G.; Bastos, A.; De Vries, F.T.; Messori, G. Drought Legacy in Sub-Seasonal Vegetation State and Sensitivity to Climate Over the Northern Hemisphere. Geophys. Res. Lett. 2022, 49, e2022GL098700. [Google Scholar] [CrossRef] [Scilit]
- Luo, M.; Meng, F.; Sa, C.; Bao, Y.; Liu, T.; De Maeyer, P. Detecting Drought-Related Temporal Effects on Global Net Primary Productivity. Remote Sens. 2024, 16, 3787. [Google Scholar] [CrossRef] [Scilit]
Disclaimer/Publisher’s Note: The statements, opinions and data contained in all publications are solely those of the individual author(s) and contributor(s) and not of MDPI and/or the editor(s). MDPI and/or the editor(s) disclaim responsibility for any injury to people or property resulting from any ideas, methods, instructions or products referred to in the content. |
© 2026 by the authors. Licensee MDPI, Basel, Switzerland. This article is an open access article distributed under the terms and conditions of the Creative Commons Attribution (CC BY) license.