


Abstract
Urban greening is central to climate-responsive planning, but month-to-month variation in urban net primary productivity (UNPP) remains insufficiently resolved. We estimated monthly UNPP from the MOD17A2H Gpp band, a gross primary productivity (GPP) product, across Chengdu’s five central districts during 2013–2022 and examined its associations with the normalized difference vegetation index (NDVI), land surface temperature (LST), precipitation, and night-time light intensity. Ordinary least squares regression used 119 overlapping citywide monthly means from January 2013 to November 2022. The model explained 86.1% of UNPP variance (adjusted R2 = 0.856). LST showed the largest standardized association (β = 0.596), followed by NDVI (β = 0.286) and precipitation (β = 0.135); night-time light intensity was not significant (β = 0.017, p = 0.632). HC3-robust inference retained the NDVI and LST associations, whereas the precipitation association weakened. District summaries showed the largest stage-wise UNPP increase in Qingyang and the largest NDVI increase in Chenghua. Greener spatial patterns after 2018 coincided temporally with the Park City Initiative but do not establish a causal policy effect. These findings support temporally aligned monitoring while identifying the need for field-based species, management, and impervious surface data.
1. Introduction
1.1. Background
Urbanization reshapes ecosystem function through land conversion, thermal change, and hydrological disturbance. As vegetated land is replaced by built surfaces, energy exchange, water cycling, and vegetation productivity are altered [1]. In Chengdu, the Park City Initiative, introduced in 2018, has promoted the integration of ecological space with urban development. Because urban net primary productivity (UNPP) integrates vegetation carbon assimilation over space and time, it provides a useful indicator for examining ecological change in a rapidly developing urban landscape [2]. The present analysis evaluates temporal associations and does not treat coincident change as proof of a policy effect.
UNPP also varies strongly within the year. Seasonal phenology, short-term thermal fluctuations, water availability, and anthropogenic disturbance can shift vegetation productivity over monthly timescales, and these drivers commonly covary seasonally [3]. NDVI reflects canopy greenness and phenology; LST characterizes surface thermal conditions; precipitation influences soil-water availability; and VIIRS night-time light intensity can serve as an indirect proxy for urban activity [4].
Chengdu provides a useful setting for examining these relationships. Since the launch of the Park City Initiative, the city has become a prominent example of ecological urbanism in China [5]. Continued urban expansion nevertheless places pressure on ecological integrity. Its subtropical monsoon climate and rapidly transforming central districts make Chengdu a relevant case for evaluating monthly environmental correlates of urban vegetation productivity.
Resolving such dynamics requires finer temporal resolution than annual or seasonal summaries can provide. Monthly data can reveal short-term responses, lag effects, and nonlinear interactions that are obscured at coarser scales. This is especially important in urban systems, where ecological responses may be uneven in space and delayed in time. Monthly analysis therefore offers a practical balance between data availability and ecological interpretability.
Against this background, urban UNPP research requires indicators that are temporally sensitive enough to capture both intra-annual ecological variability and longer-term planning-related change.
1.2. Literature Review
Urbanization commonly reduces ecosystem productivity by replacing vegetated land with impervious surfaces, increasing surface temperatures, and fragmenting green space [6]. Evidence from the Beijing–Tianjin–Hebei region, the Yangtze River Delta, the Xiangjiang River Basin, and Beijing shows that urban expansion suppresses UNPP or related ecosystem services, although urban greening can offset part of this loss under some conditions [7,8,9,10]. Remote sensing has therefore become central to urban UNPP assessment [11]. MODIS GPP/NPP products are widely used because of their global consistency, but their coarse spatial resolution limits their suitability in heterogeneous urban settings [12]. Recent studies have also linked urban UNPP to temperature, precipitation, and anthropogenic activity, often represented by VIIRS night-time lights [13,14]. However, most of this work relies on annual or seasonal summaries and therefore cannot fully resolve short-term dynamics.
Multivariable modelling evaluates environmental and anthropogenic indicators jointly and can distinguish their partial associations with UNPP. Ordinary least squares (OLS) regression remains useful because its coefficients and diagnostics are directly interpretable [15]. Polynomial models provide a complementary exploratory description of curvature, but fitted curves alone do not identify ecological thresholds or causal mechanisms.
Taken together, the literature points to a need for high-temporal-resolution, intra-urban analysis that combines interpretable joint modelling with explicit assessment of nonlinear responses.
1.3. Research Gaps and Objectives
Two gaps motivate this study. First, annual or seasonal summaries can obscure intra-annual variability and short-lived environmental responses. Second, joint monthly associations among vegetation condition, temperature, precipitation, human activity, and urban productivity remain insufficiently documented. We therefore aimed to (i) describe representative annual vegetation spatial patterns and monthly UNPP dynamics across Chengdu’s five central districts during 2013–2022; (ii) compare district-level NDVI and UNPP descriptively; (iii) estimate multivariable linear associations of NDVI, LST, Climate Hazards Group InfraRed Precipitation with Station data (CHIRPS), and Visible Infrared Imaging Radiometer Suite (VIIRS) night-time lights with UNPP; and (iv) explore variable-specific nonlinear relationships without assigning causal thresholds.
2. Methodology
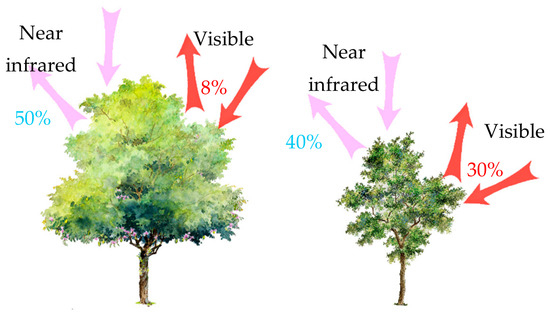
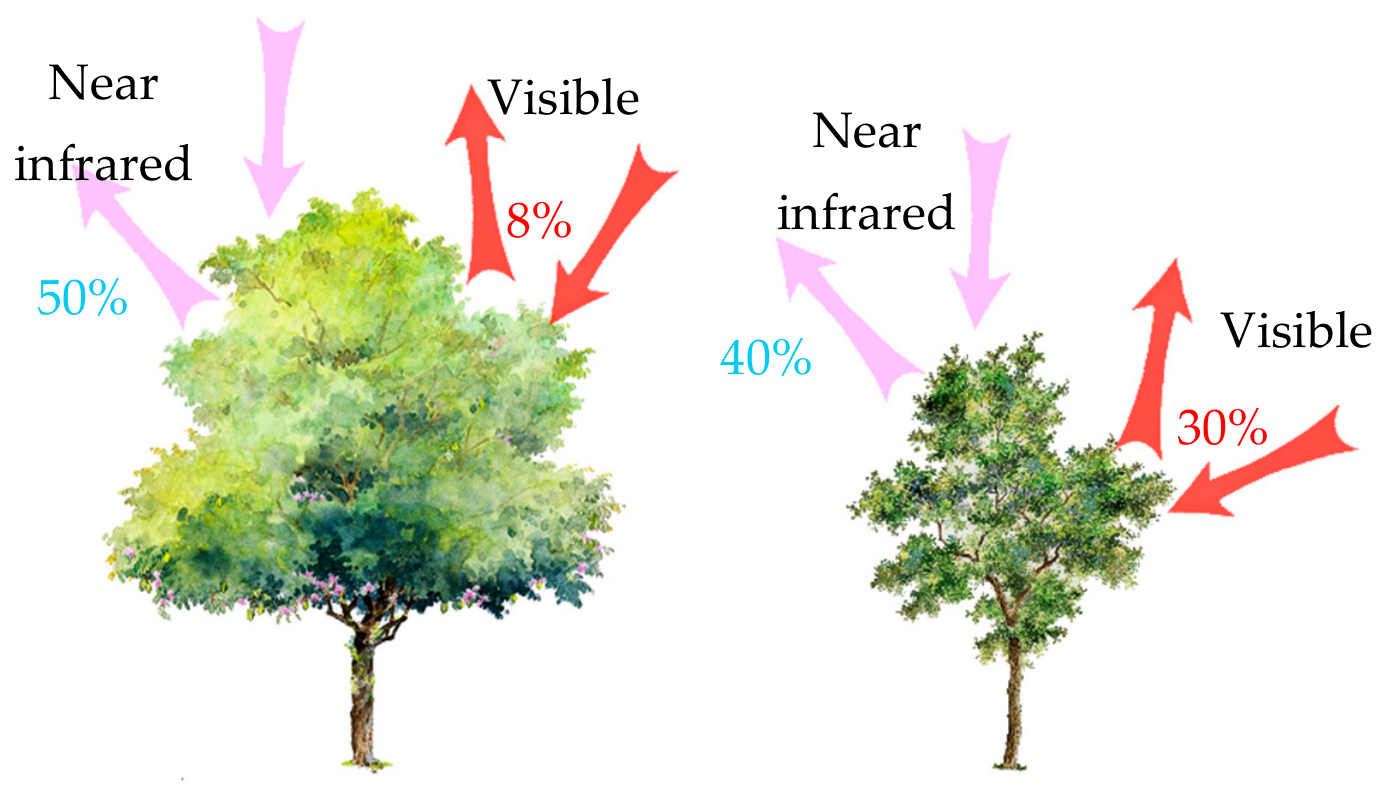
This study assessed UNPP using environmental and anthropogenic variables selected for ecological relevance and temporal coverage. Monthly NDVI represented vegetation greenness [16,17] LST represented surface thermal conditions [18,19], CHIRPS precipitation represented regional water availability [20], and VIIRS night-time light intensity represented urban activity [21]. UNPP was derived from the MOD17A2H Gpp band rather than from the official annual MODIS NPP product [22,23,24]. Figure 1 provides a schematic overview of the NDVI concept.
Figure 1.
Schematic illustration of NDVI in remote sensing imagery.
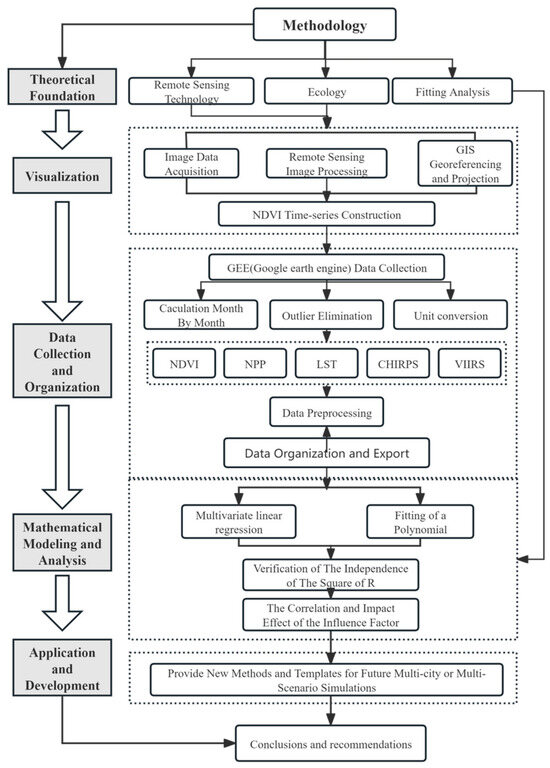
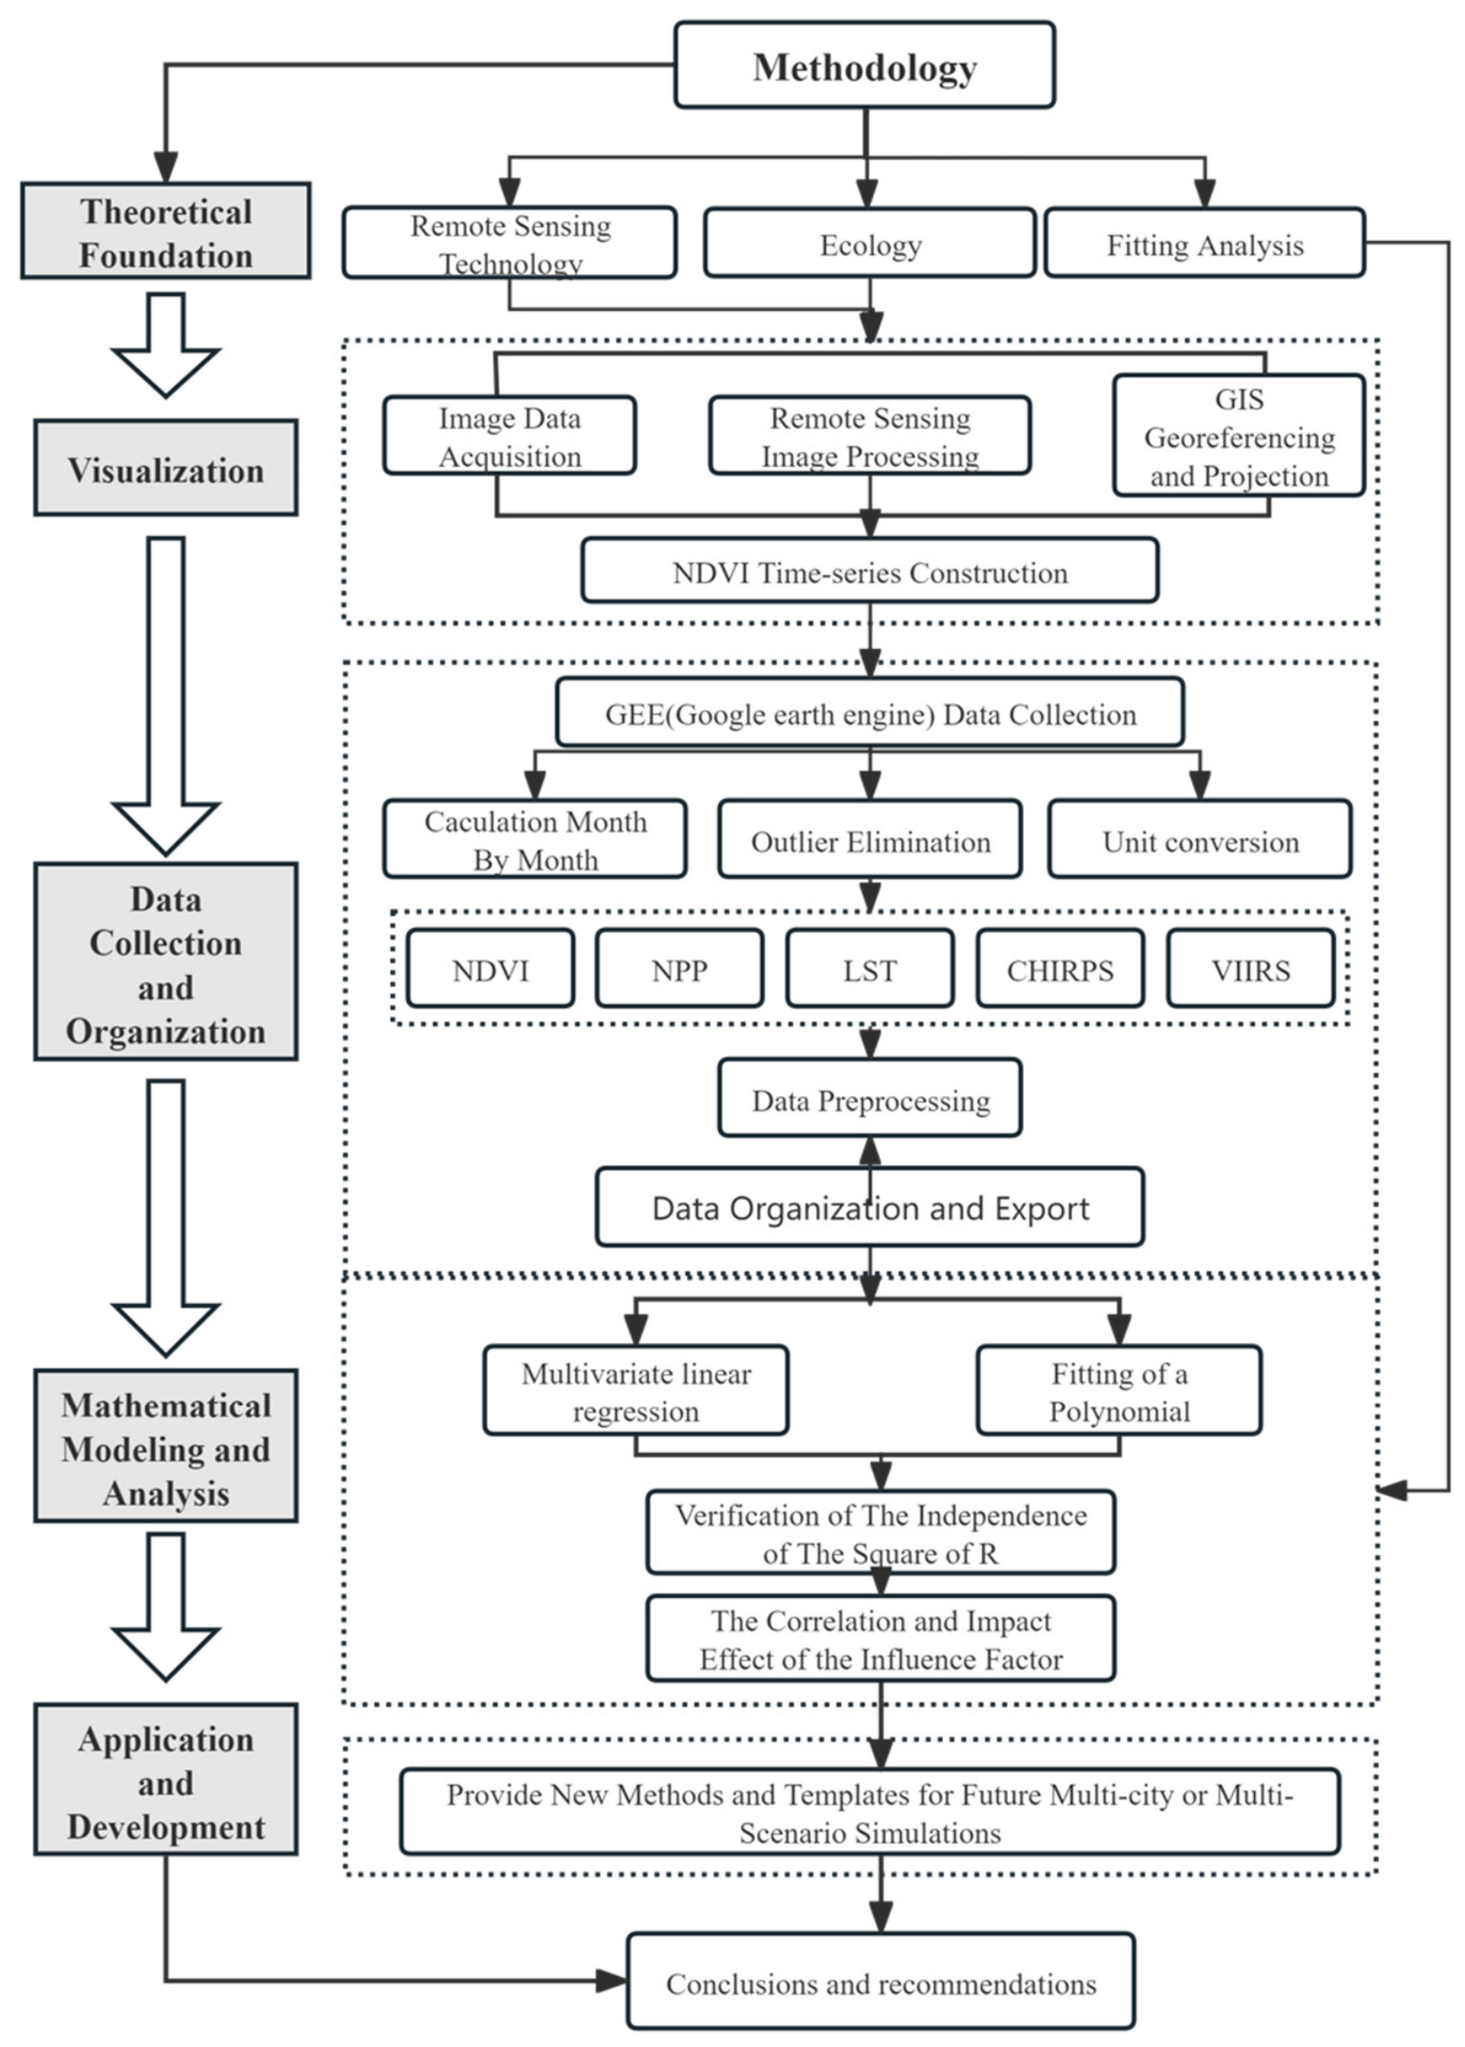
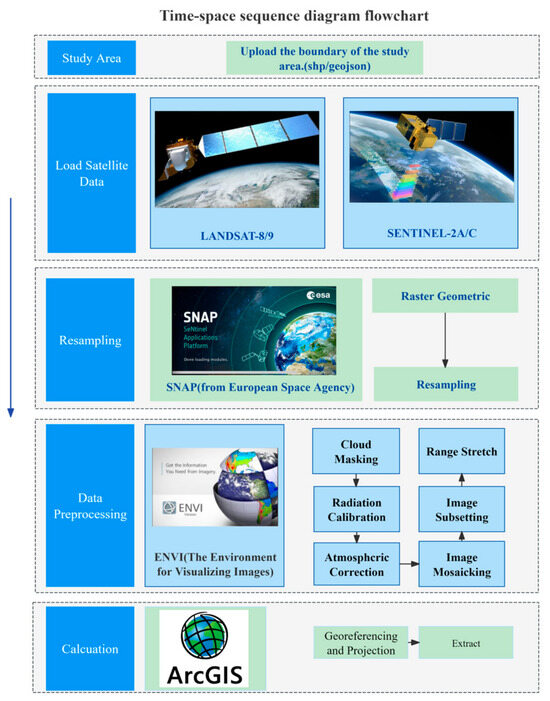
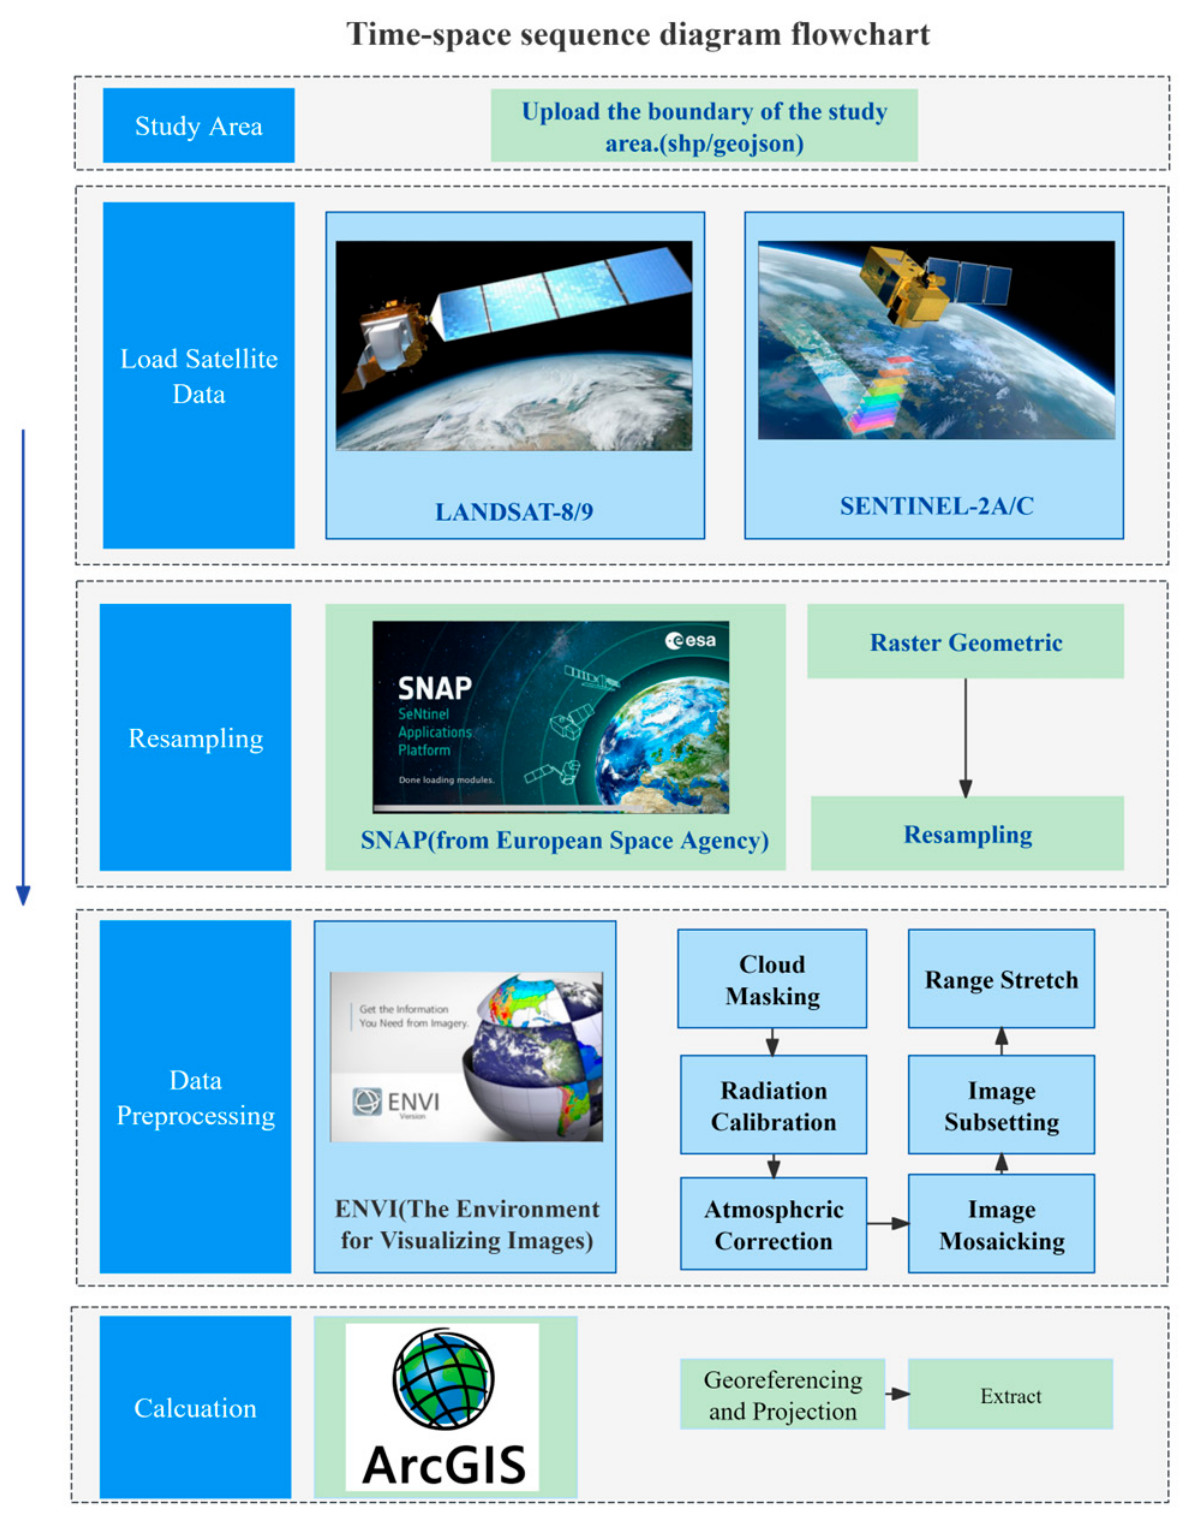
All datasets were aligned spatially and temporally before analysis. The formal analytical period was restricted to 2013–2022. Although valid records for January and February 2023 were available in some source datasets, cross-variable coverage for 2023 was incomplete. These records were retained only as reference data in the raw archive and were excluded from all formal annual comparisons, district summaries, polynomial fits, regression models, and figures. The valid LST series ended in November 2022; subsequent zero values were missing data placeholders rather than observations. Figure 2 summarizes the workflow.
Figure 2.
Study design and analytical workflow. The representative annual spatial maps were analytically separate from the monthly series used for district summaries and regressions.
UNPP responds to vegetation structure, thermal conditions, water availability, and anthropogenic disturbance. NDVI captured vegetation greenness and canopy density; LST represented surface thermal conditions; CHIRPS precipitation represented water availability; and VIIRS night-time lights represented urban activity. These indicators were treated as correlates rather than direct causal mechanisms.
2.1. NDVI Time Series Construction and Visualisation
The continuous monthly NDVI series was constructed from the MOD13Q1 16-day 250 m product for 2013–2022 [17]. Valid observations within each calendar month were summarized by district to preserve intra-annual variability, and the resulting series was left unsmoothed. Sentinel-2 MSI and Landsat 8/9 OLI imagery served a separate purpose: representative annual scenes were used only to map spatial NDVI patterns and were not used to calculate the monthly series or stage-wise changes [25,26]. Figure 3 summarizes the NDVI workflow.
Figure 3.
Workflow for NDVI time series construction and visualisation.
NDVI was derived from the two complementary remote sensing streams described above. The MOD13Q1 monthly series was not smoothed, while representative high-resolution scenes were preprocessed for spatial visualization.
2.1.1. Data Acquisition and Resampling
Representative Landsat 8/9 OLI and Sentinel-2 MSI scenes covering Chengdu’s five central districts were selected for annual spatial mapping. Scenes with less than 10% cloud cover were retained, where available; cloud and shadow contamination was removed using sensor-appropriate quality information.
Because Sentinel-2 bands are provided at 10, 20, and 60 m resolutions, all bands were resampled to a common 10 m grid. Atmospheric correction was performed in SNAP to generate Level-2A surface-reflectance products, whereas Landsat 8/9 scenes were used after standard band harmonization. The processed imagery was then exported in ENVI-standard (.hdr) or GeoTIFF format for further analysis.
2.1.2. Image Mosaicking and Clipping
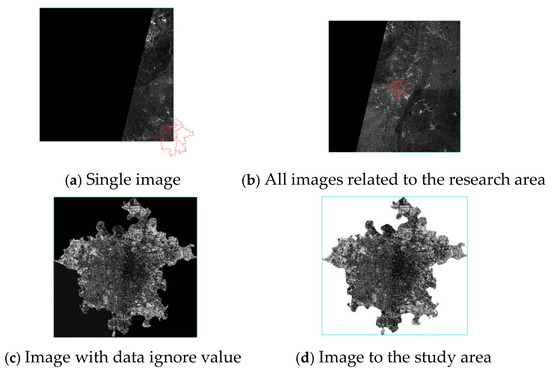
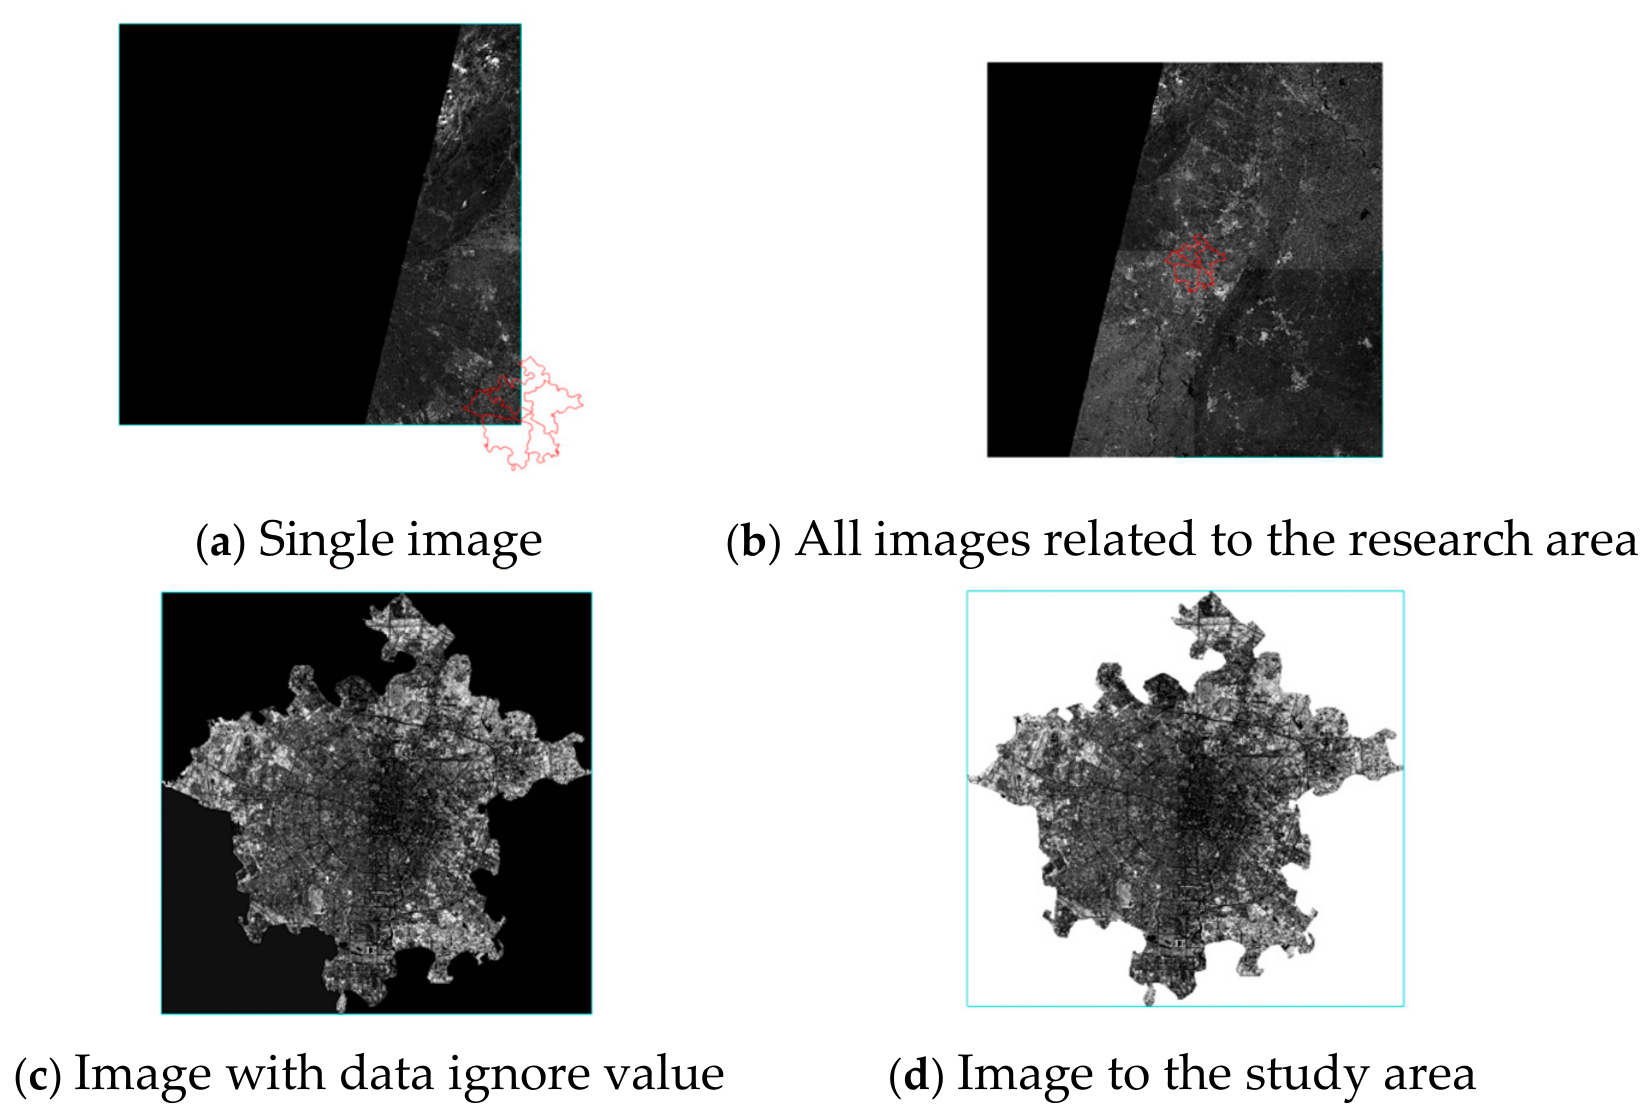
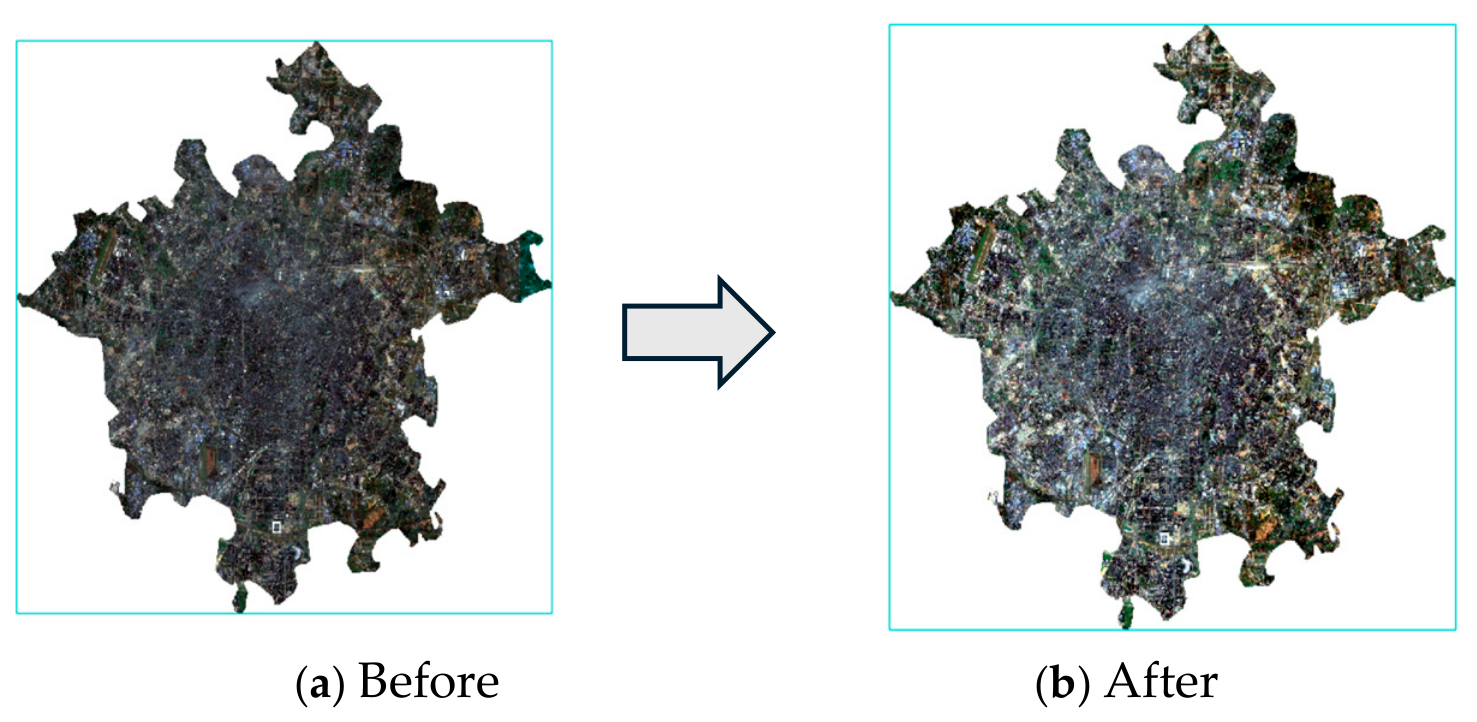
To ensure complete spatial coverage of the study area, the resampled satellite scenes were mosaicked in ENVI (Version 6.0) to generate composite images for Chengdu’s five central districts. The mosaics were then clipped to the administrative boundaries defined by the study-area shapefile, thereby removing extraneous regions and retaining only the target districts. Artifacts introduced during mosaicking and clipping were inspected and removed before further analysis, as shown in Figure 4.
Figure 4.
Image mosaicking and clipping workflow.
2.1.3. Radiometric Calibration and Atmospheric Correction
Radiometric calibration, atmospheric correction, cloud and shadow masking, mosaicking, clipping, sensor-specific band selection, and resampling were applied before calculating spatial NDVI. These representative scenes support visual comparison of spatial patterns but are not annual mean composites, shown in Figure 5.
Figure 5.
Study area after radiometric calibration and atmospheric correction.
2.1.4. NDVI Calculation and Time Series Construction
For the representative spatial maps, NDVI was calculated from red and near-infrared surface reflectance after sensor-specific preprocessing. For the continuous time series, district-level monthly means were obtained independently using MOD13Q1.
The MOD13Q1 monthly series and the representative annual high-resolution maps were kept analytically separate. The formal analyses used 2013–2022 only; valid January-February 2023 records available in some raw datasets were retained solely for reference.
This workflow produced a continuous district-level monthly NDVI series for descriptive and regression analyses, along with a separate set of representative annual spatial maps.
2.2. Multi-Source Remote Sensing Data Acquisition
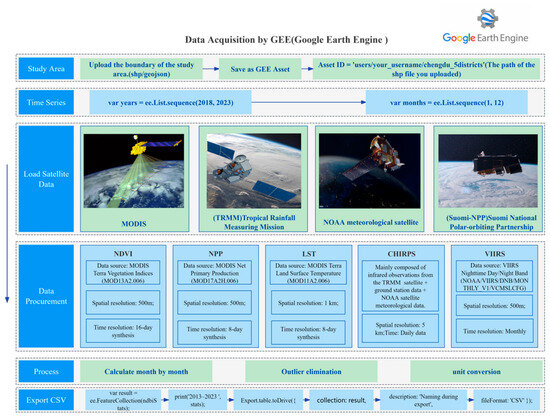
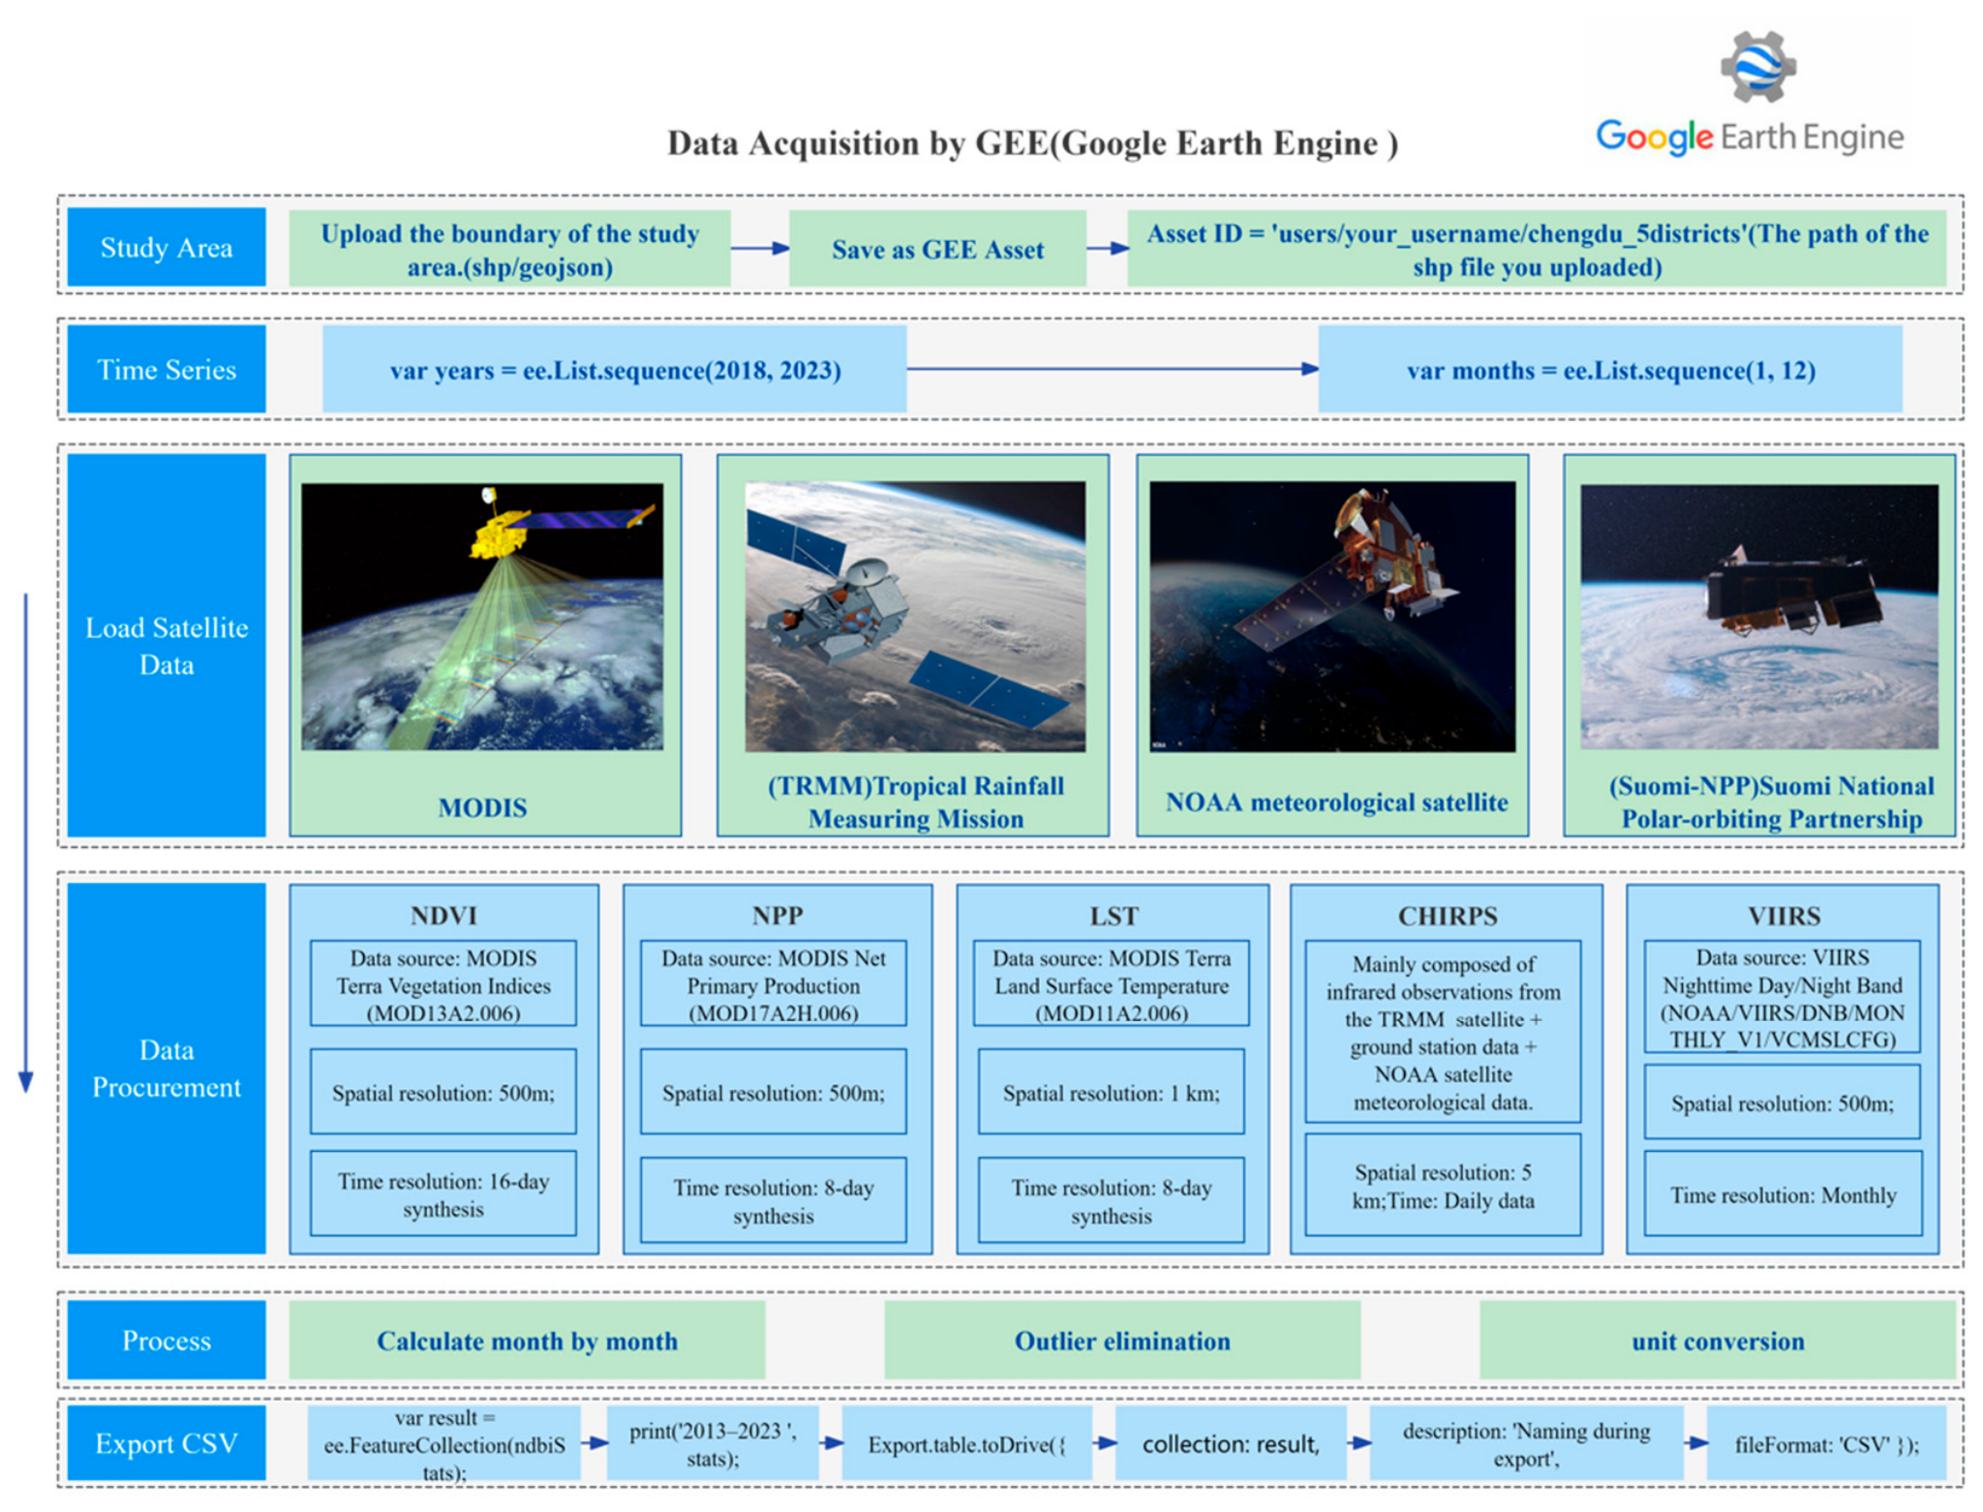
To analyse vegetation productivity and its drivers across Chengdu’s five core districts, we assembled a suite of remote sensing datasets in Google Earth Engine (GEE). These observations provided consistent long-term coverage for constructing high-frequency indicator series and for supporting subsequent regression analyses. The overall workflow is shown in Figure 6.
Figure 6.
Data sources and processing workflow. Sentinel-2 and Landsat imagery were used only for representative spatial NDVI mapping.
2.2.1. Factors and Indicator Rationale
The analysis incorporated five indicators: MOD13Q1 NDVI; GPP-derived UNPP; MOD11A2 LST; CHIRPS precipitation; and VIIRS night-time lights.
NDVI represented vegetation greenness. UNPP represented a GPP-derived estimate of urban vegetation productivity and potential carbon uptake, not net ecosystem production, net ecosystem exchange, or a complete urban carbon balance. LST described surface thermal conditions, CHIRPS quantified precipitation, and VIIRS night-time lights represented urban activity intensity.
2.2.2. Overview of Datasets
The MOD17A2H Gpp band was used as the source productivity variable [22,23,24]. Each valid 8-day Gpp value was multiplied by the product scale factor of 0.0001 to obtain kg C m−2 per 8-day period. Values were assigned to their acquisition calendar month and summed without cross-month weighting, converted to g C m−2, and multiplied by a fixed NPP/GPP ratio of 0.5. Thus, monthly UNPP = Σ(Gpp × 0.0001) × 1000 × 0.5, expressed as g C m−2 month−1. The 0.5 factor is an approximation: autotrophic respiration varies with vegetation type, phenology, and environment, and MODIS GPP carries parameter and input uncertainty [23,24]. The resulting UNPP should therefore be interpreted as a GPP-derived productivity and potential carbon-uptake estimate, not as official annual MODIS NPP or a complete urban carbon balance.
Multi-source remote sensing datasets were integrated for Chengdu’s five central districts over the formal 2013–2022 study period. Table 1 distinguishes the MOD13Q1 monthly series from the Sentinel-2/Landsat scenes used for representative spatial mapping and summarizes the analytical coverage [27,28].
Table 1.
Datasets used in the analysis.
These datasets were selected to capture the major biophysical and anthropogenic factors likely to influence urban carbon sinks while also providing the temporal continuity required to build a robust multi-year time series.
2.2.3. Data Extraction Workflow in GEE
All remote sensing processing was implemented in GEE to ensure computational efficiency, spatial consistency, and reproducibility. The workflow included spatial masking, temporal filtering, band selection and transformation, zonal statistical extraction, and batch export.
District boundaries were used as spatial masks. The formal temporal domain was 2013–2022; the regression overlap ended in November 2022 because December 2022 LST was unavailable.
Variables were derived from the corresponding collections: monthly NDVI from MOD13Q1; representative spatial NDVI maps from Sentinel-2 MSI and Landsat 8/9 OLI; GPP-derived UNPP from the MOD17A2H Gpp band; daytime LST from MOD11A2; precipitation from CHIRPS; and average radiance from monthly VIIRS day/night band composites.
District-level mean values were extracted for each monthly indicator. Native product resolutions were retained during extraction: 250 m for MOD13Q1 NDVI, 500 m for MOD17A2H Gpp and VIIRS, approximately 1 km for MOD11A2 LST, and approximately 5 km for CHIRPS precipitation.
The resulting values were exported from GEE to Google Drive in CSV format, with each record representing one district in a given month or year. These tables formed the basis for time series visualisation and multivariable regression.
2.2.4. Explanation of Key GEE Operations
Several core operations within Google Earth Engine underpinned the construction of the multi-year, multi-indicator datasets used in this study. Together, these steps ensured spatial precision, temporal consistency, and physical interpretability across all remote sensing products.
Spatial clipping and masking were used to constrain each image collection to the district boundaries. This ensured that pixel-based calculations, such as NDVI and LST transformations, were confined to the study area rather than influenced by adjacent land outside the target districts.
Temporal filtering produced the 2013–2022 analytical series. Valid January-February 2023 records in some source datasets were retained only in the raw archive and excluded from annual comparisons, district summaries, polynomial fits, regression models, and formal figures.
To enhance transparency and reproducibility, representative GEE code snippets for filtering, band selection, unit conversion, zonal statistics, and CSV export are provided in the Supplementary Materials. These procedures ensured that the derived time series data were robust, spatially aligned, temporally consistent, and directly comparable across indicators.
2.3. Statistical Analysis
Two complementary approaches were used. First, OLS multiple regression estimated the partial associations of NDVI, CHIRPS precipitation, LST, and VIIRS night-time lights with monthly UNPP. Second, separate cubic and quartic polynomial fits described exploratory bivariate curvature.
Model reporting included the coefficient of determination (R2), adjusted R2, F statistic, root mean square error (RMSE), coefficient standard errors, standardized beta coefficients, t statistics, p values, 95% confidence intervals, variance inflation factors (VIFs), and the Durbin–Watson statistic.
Each regression observation was the mean of the five central districts for a given month. Aligning all variables and excluding the missing December 2022 LST placeholder yielded 119 observations from January 2013 through November 2022.
2.3.1. Multiple Linear Regression
The OLS model was specified as follows:
UNPP = β0 + β1(NDVI) + β2(CHIRPS) + β3(LST) + β4(VIIRS)
The model was fitted to the original measurement scales in Origin 2023. Standardized beta coefficients were calculated separately to compare association strength across predictors; they were not the coefficients used in the reported prediction equation.
Multicollinearity was assessed using VIF. Residual autocorrelation was summarized with the Durbin–Watson statistic. The Breusch–Pagan test indicated heteroscedasticity, so HC3 heteroscedasticity-consistent standard errors were used as a sensitivity analysis. Statistical tests were two-sided.
2.3.2. Exploratory Polynomial Fitting
Separate third- and fourth-order polynomial models were fit for UNPP against NDVI, LST, CHIRPS precipitation, and VIIRS night-time lights using the same 119-month overlap. These models were used to describe bivariate curvature, not to estimate causal effects or confirm physiological thresholds.
Each independent variable was analysed separately using third-order and fourth-order polynomial models as exploratory, descriptive approximations of nonlinear trends. No out-of-sample validation was performed, so the fitted curves cannot confirm physiological thresholds, causal relationships, or protection against overfitting. Their R2 values were used only for descriptive comparison. The general form of the model is shown below:
UNPP = α0 + α1(X) + α2(X2) + α3(X3) + ... + αn(Xn)
Here, X denotes one predictor and n is 3 or 4. R2 values were compared descriptively. The small sample difference between polynomial orders and the seasonal structure of the series were considered when interpreting curve shape.
2.4. Study Area
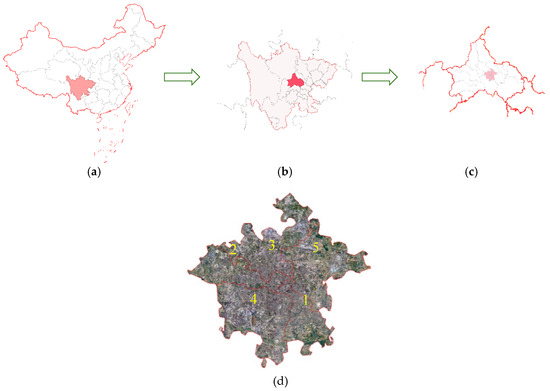
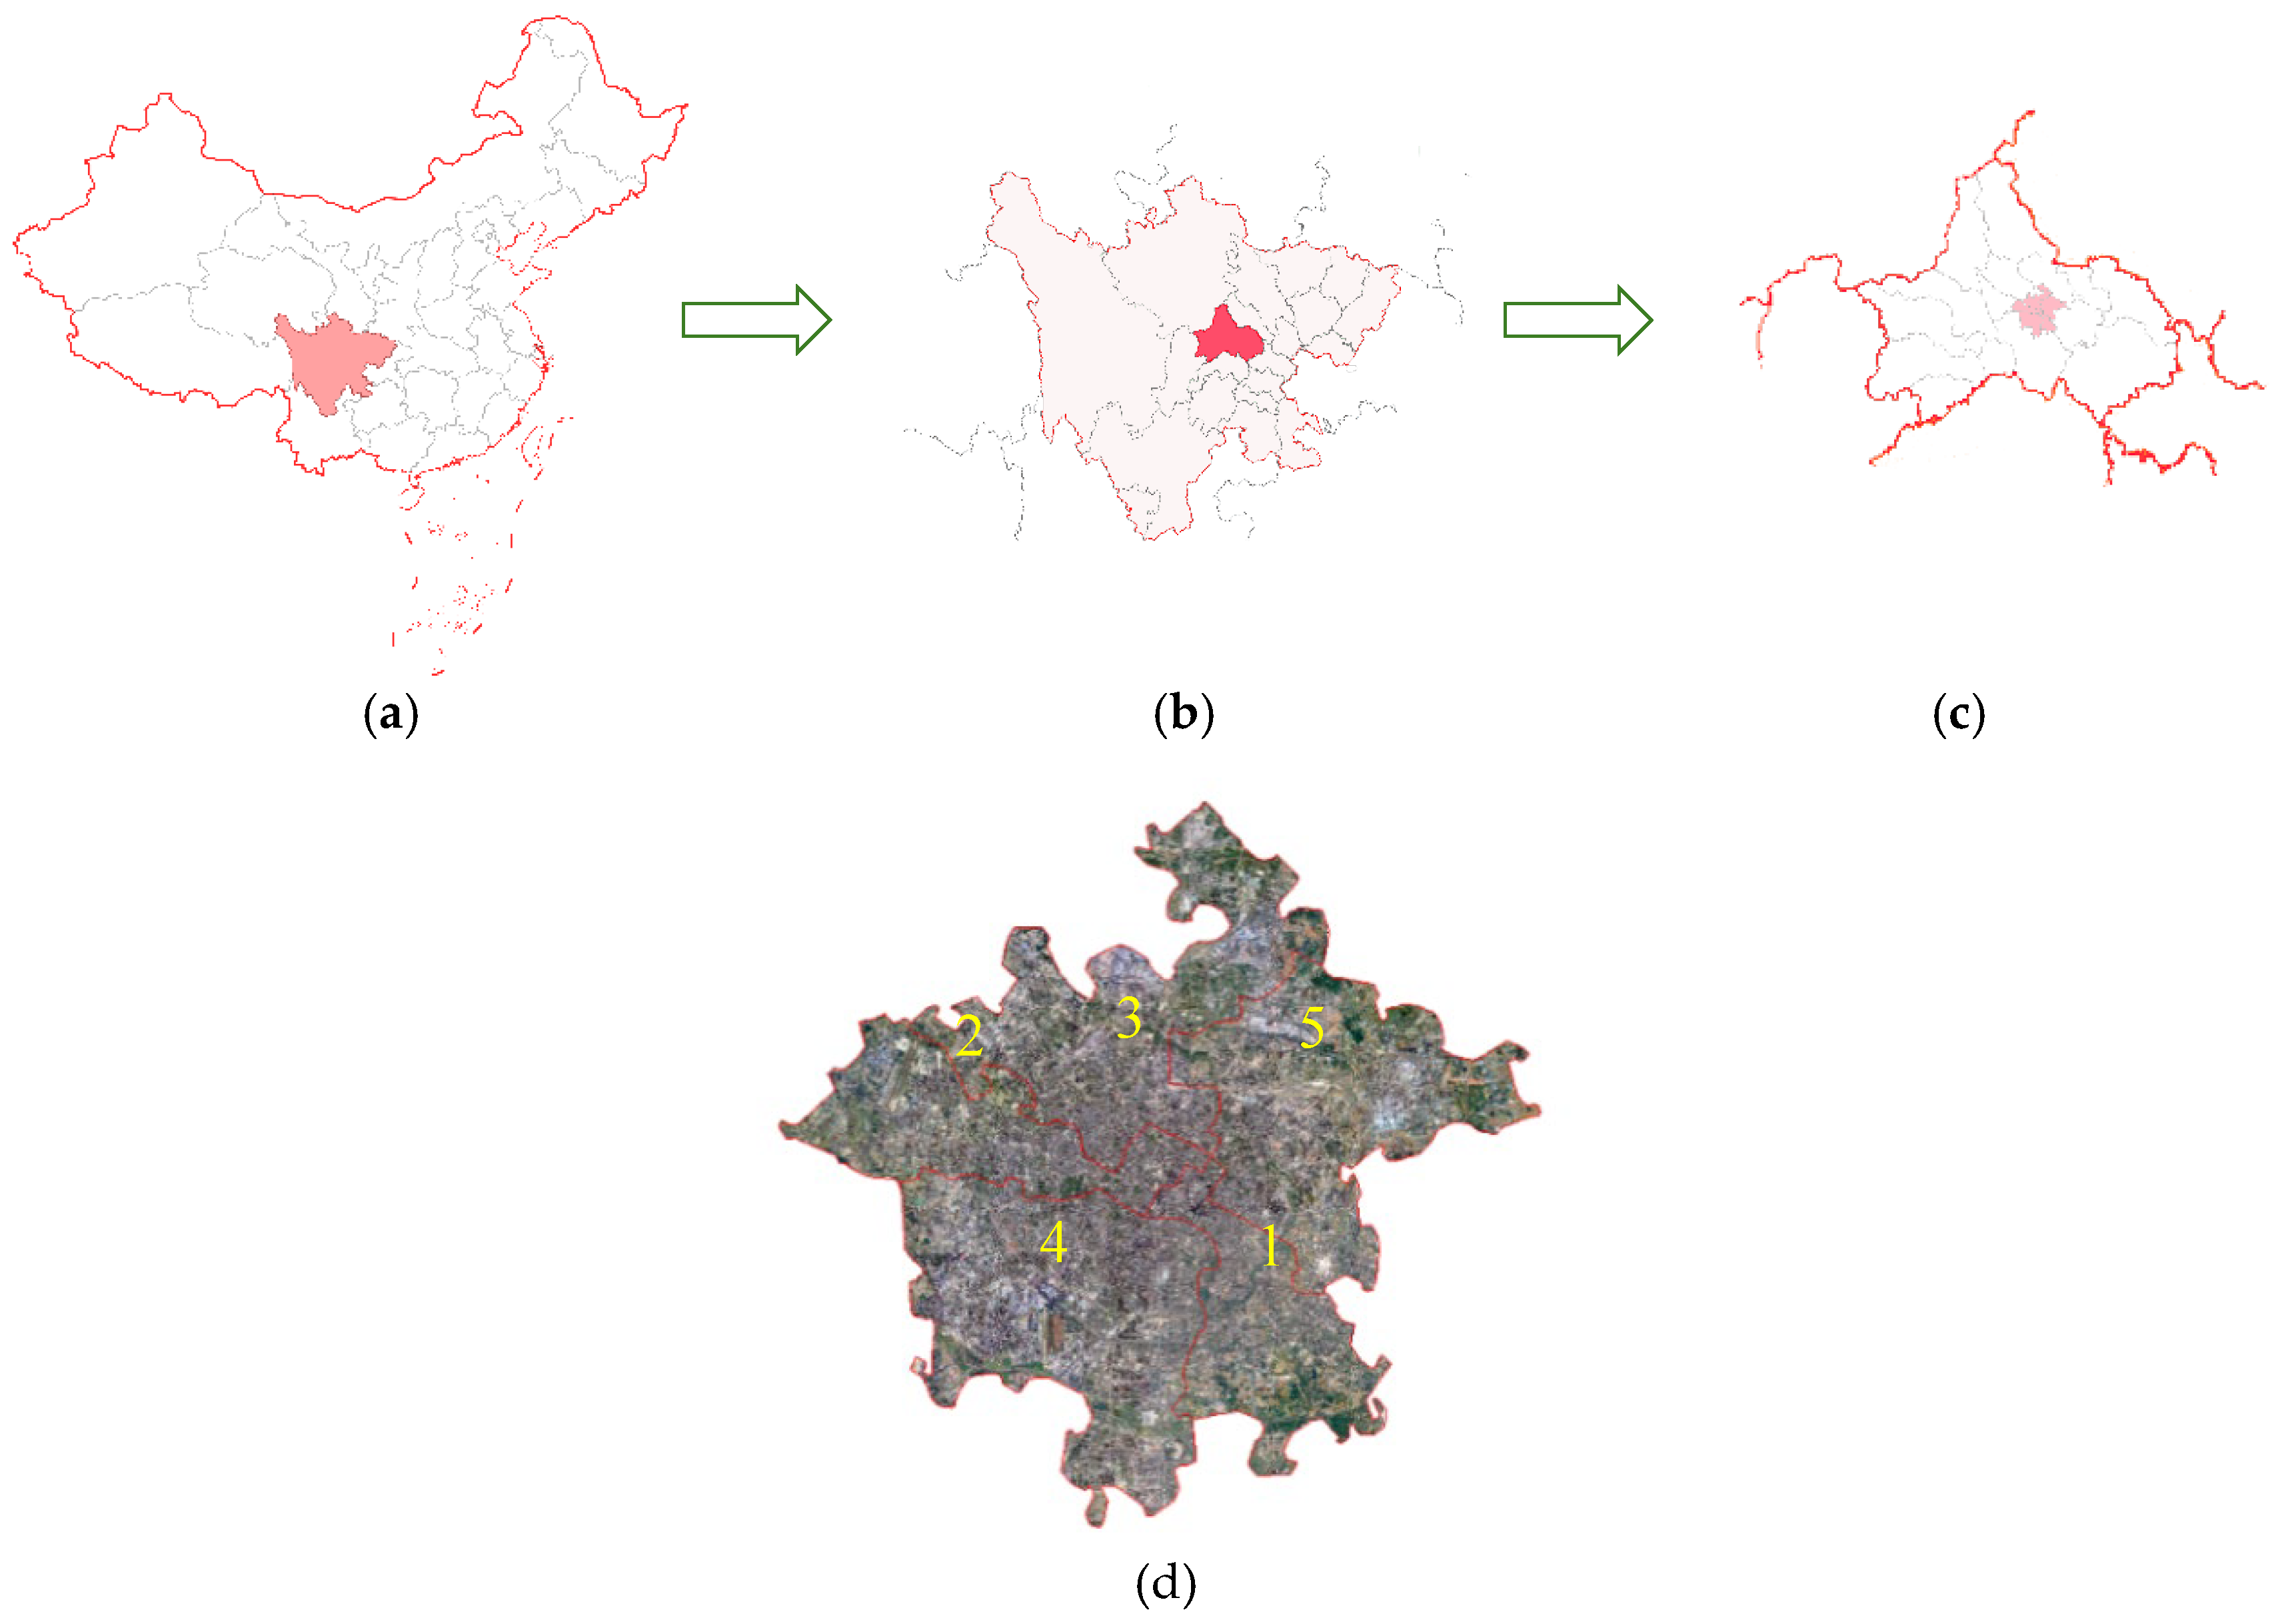
Chengdu was selected because of its rapid urbanization and ecological-planning agenda. The five central districts, Jinjiang, Qingyang, Jinniu, Wuhou, and Chenghua, represent densely developed areas undergoing substantial green-space change. The Park City Initiative provides policy context, but the observational design does not isolate its causal effect, shown in Figure 7.
Figure 7.
Study area at four nested scales: (a) China, (b) Sichuan Province, (c) Chengdu Municipality, and (d) the five central districts of Jinjiang (1), Qingyang (2), Jinniu (3), Wuhou (4) and Chenghua (5).
Chengdu is located in central Sichuan Province (102°54′–104°53′ E, 30°05′–31°26′ N) and covers approximately 12,121 km2. Plains dominate the municipality and account for 40.1% of its area. The city lies within the subtropical monsoon climate zone, with a mean annual temperature of 15.2–16.6 °C. The average temperature is 5.6 °C in January and 25.0–25.4 °C in July-August, annual precipitation ranges from 900 to 1300 mm, and total annual sunshine duration is 1042–1412 h [29].
Although Chengdu is widely described as a rapidly urbanizing megacity with ambitious ecological planning goals, the five central districts constitute its most intensively developed and environmentally pressured urban core. These districts contain the highest population densities, building intensities, and anthropogenic activity in the city, while also hosting major green spaces and ecological corridors. They therefore offer a sensitive and representative spatial unit for examining intra-annual UNPP dynamics under rapid urbanization.
3. Results
3.1. Annual NDVI Spatial Patterns
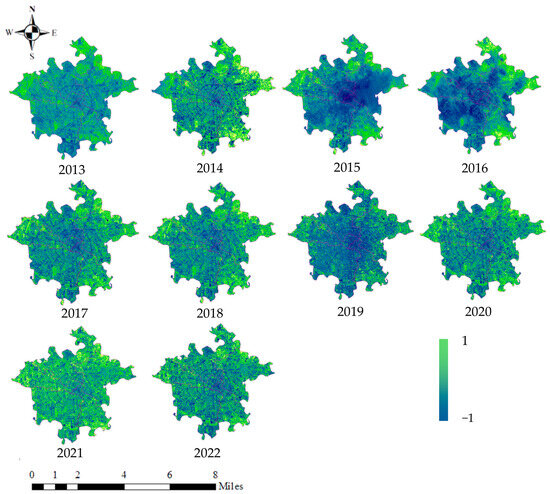
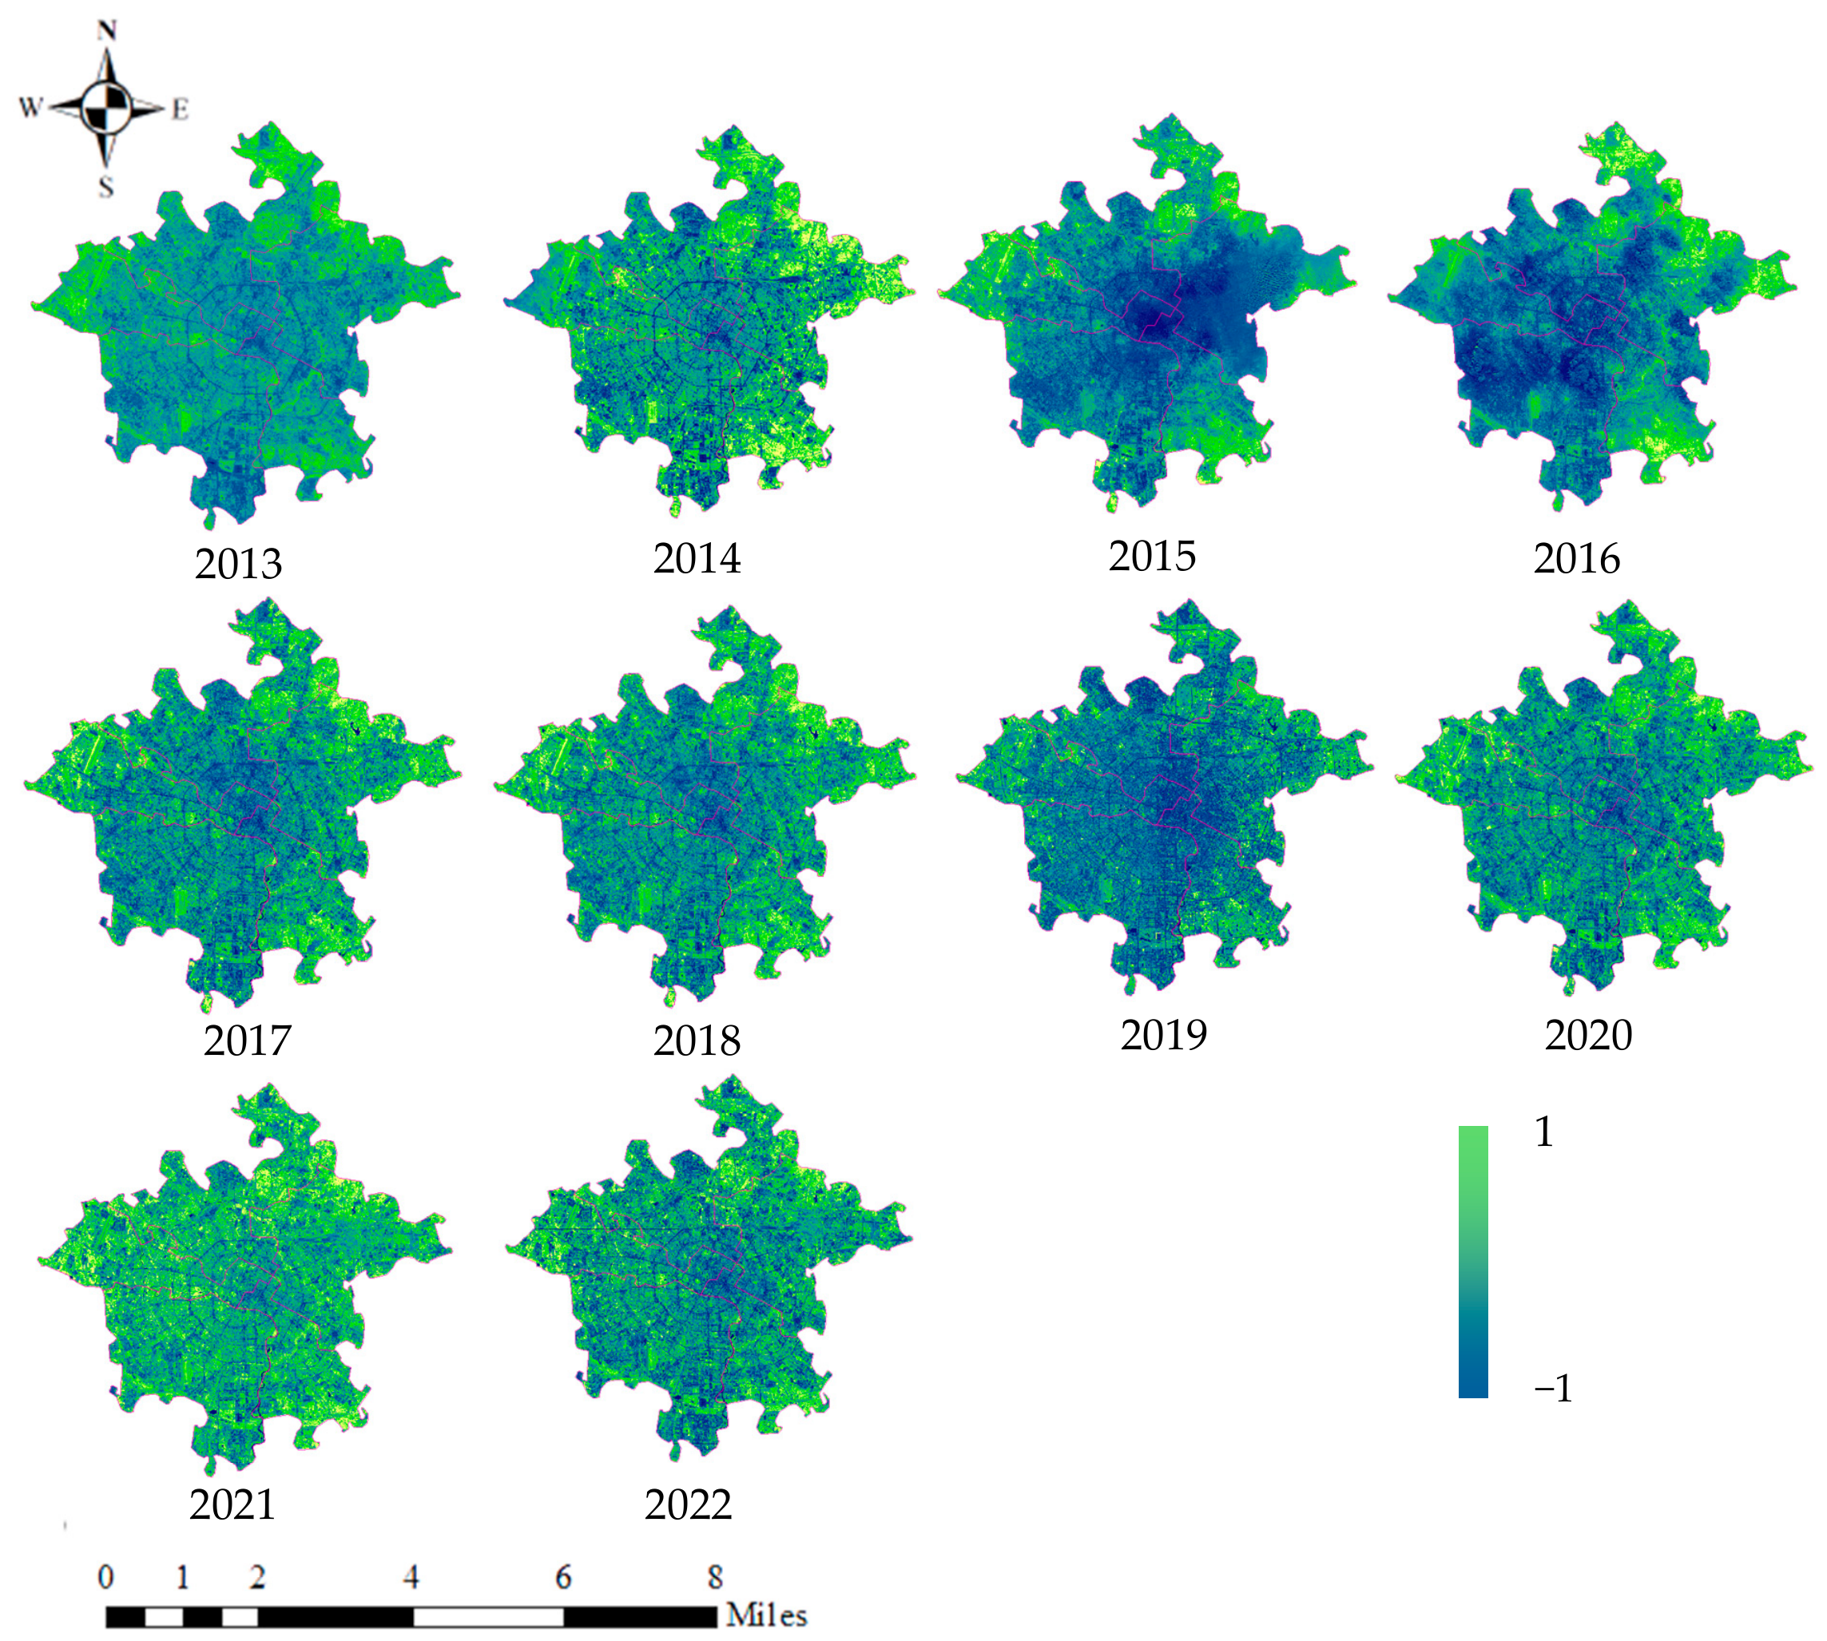
Figure 8 shows annual NDVI spatial patterns across Chengdu’s five central districts for the complete 2013–2022 period. Higher values indicate denser or more vigorous vegetation, whereas lower values correspond to built-up or sparsely vegetated surfaces.
Figure 8.
Annual NDVI spatial patterns across Chengdu’s five central districts, 2013–2022.
From 2013 to 2017, low-to-moderate NDVI remained prominent in dense commercial and residential areas. Greener and more spatially continuous patterns became more evident after 2018 along river corridors, in urban parks, and in peripheral residential zones. This temporal coincidence with the Park City Initiative is descriptive and should not be interpreted as a causal policy estimate.
The maps demonstrate marked spatial heterogeneity and motivate district-specific summaries rather than a single citywide trajectory.
3.2. Monthly Dynamics Analysis
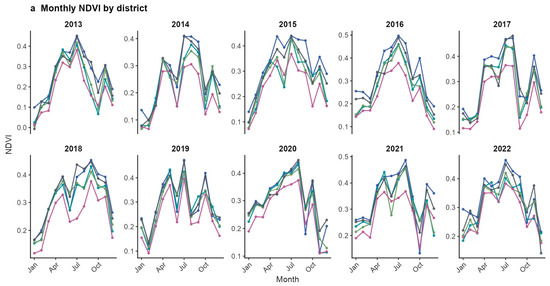
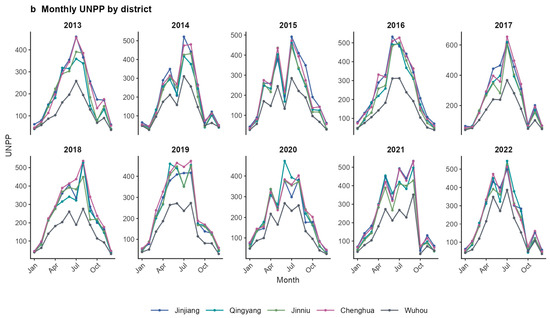
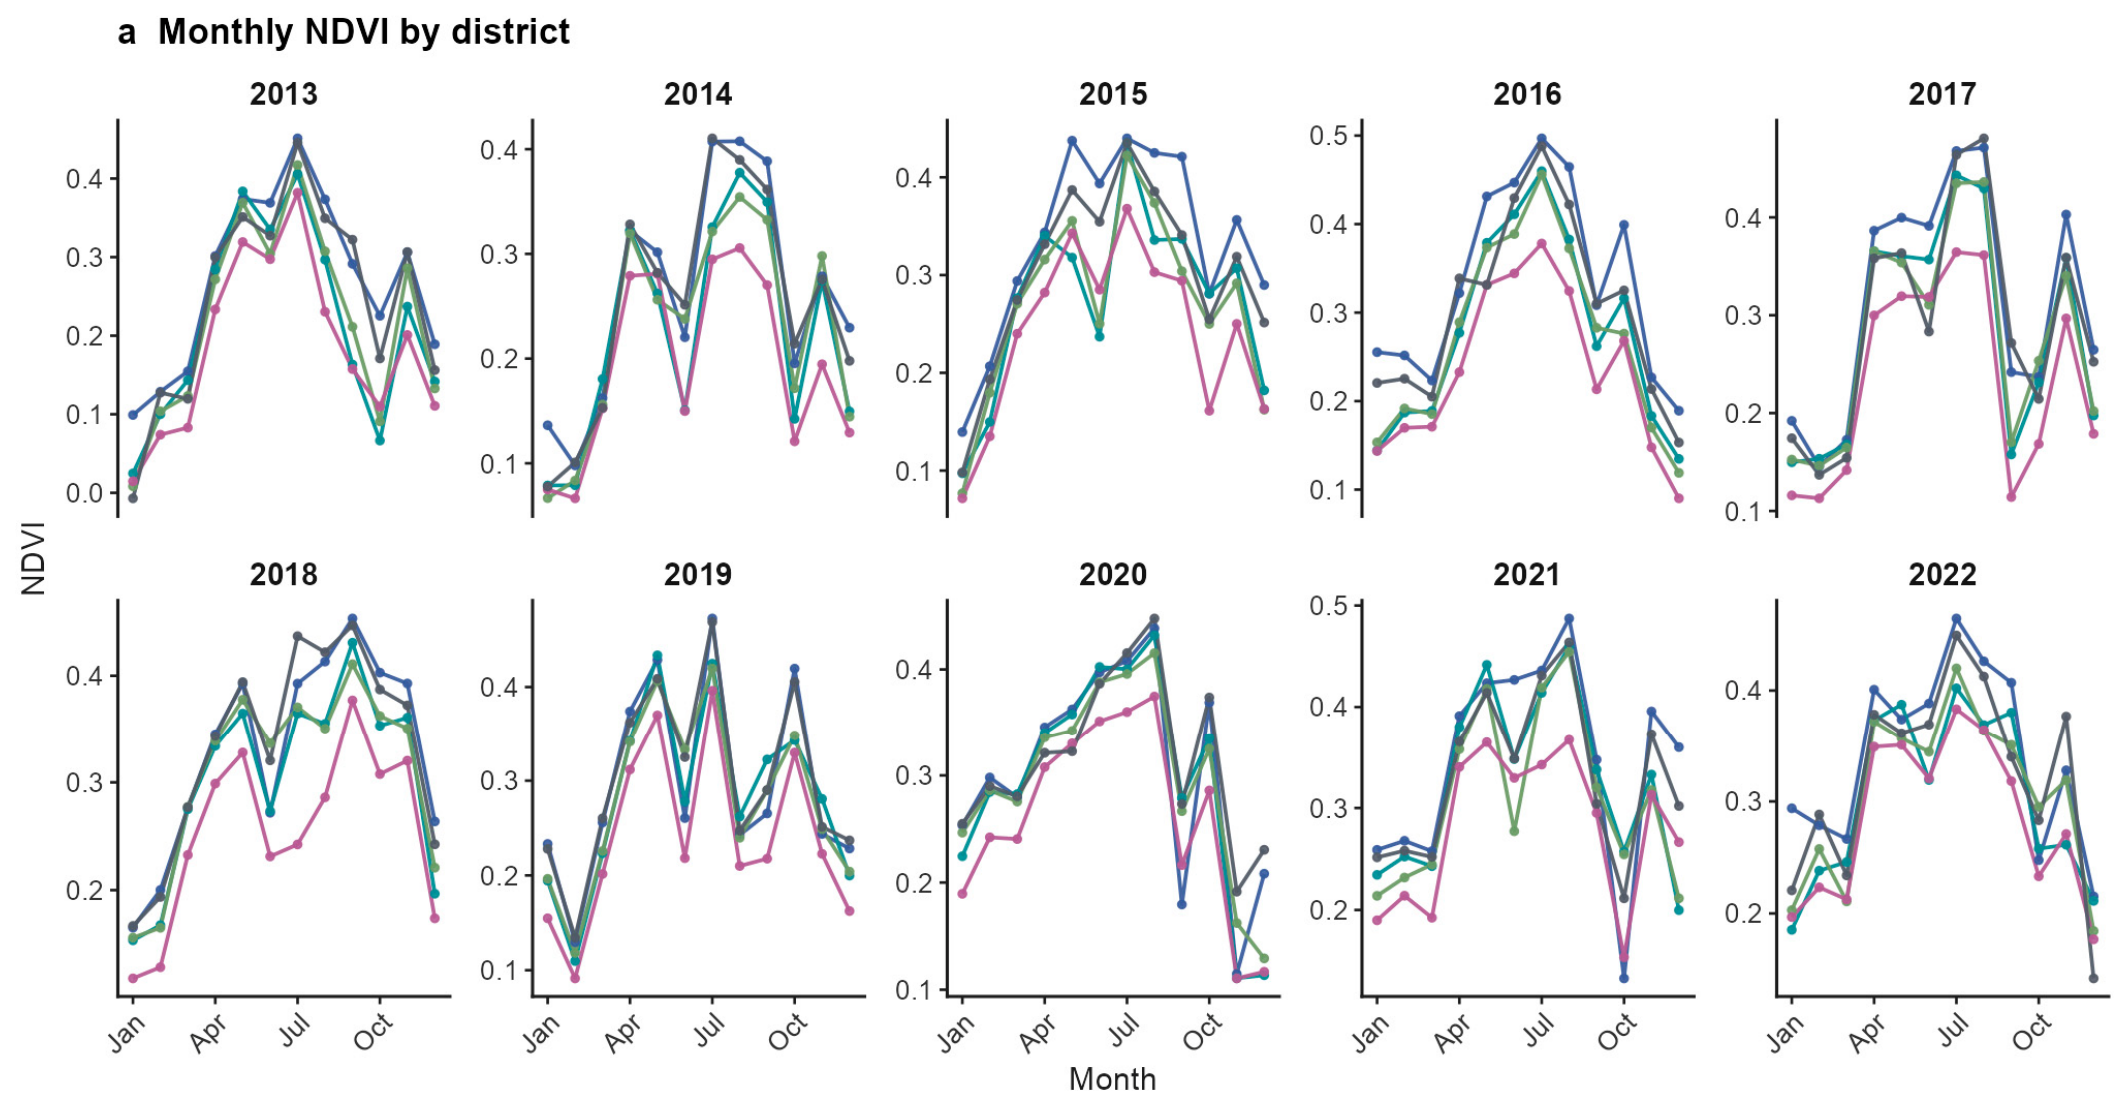
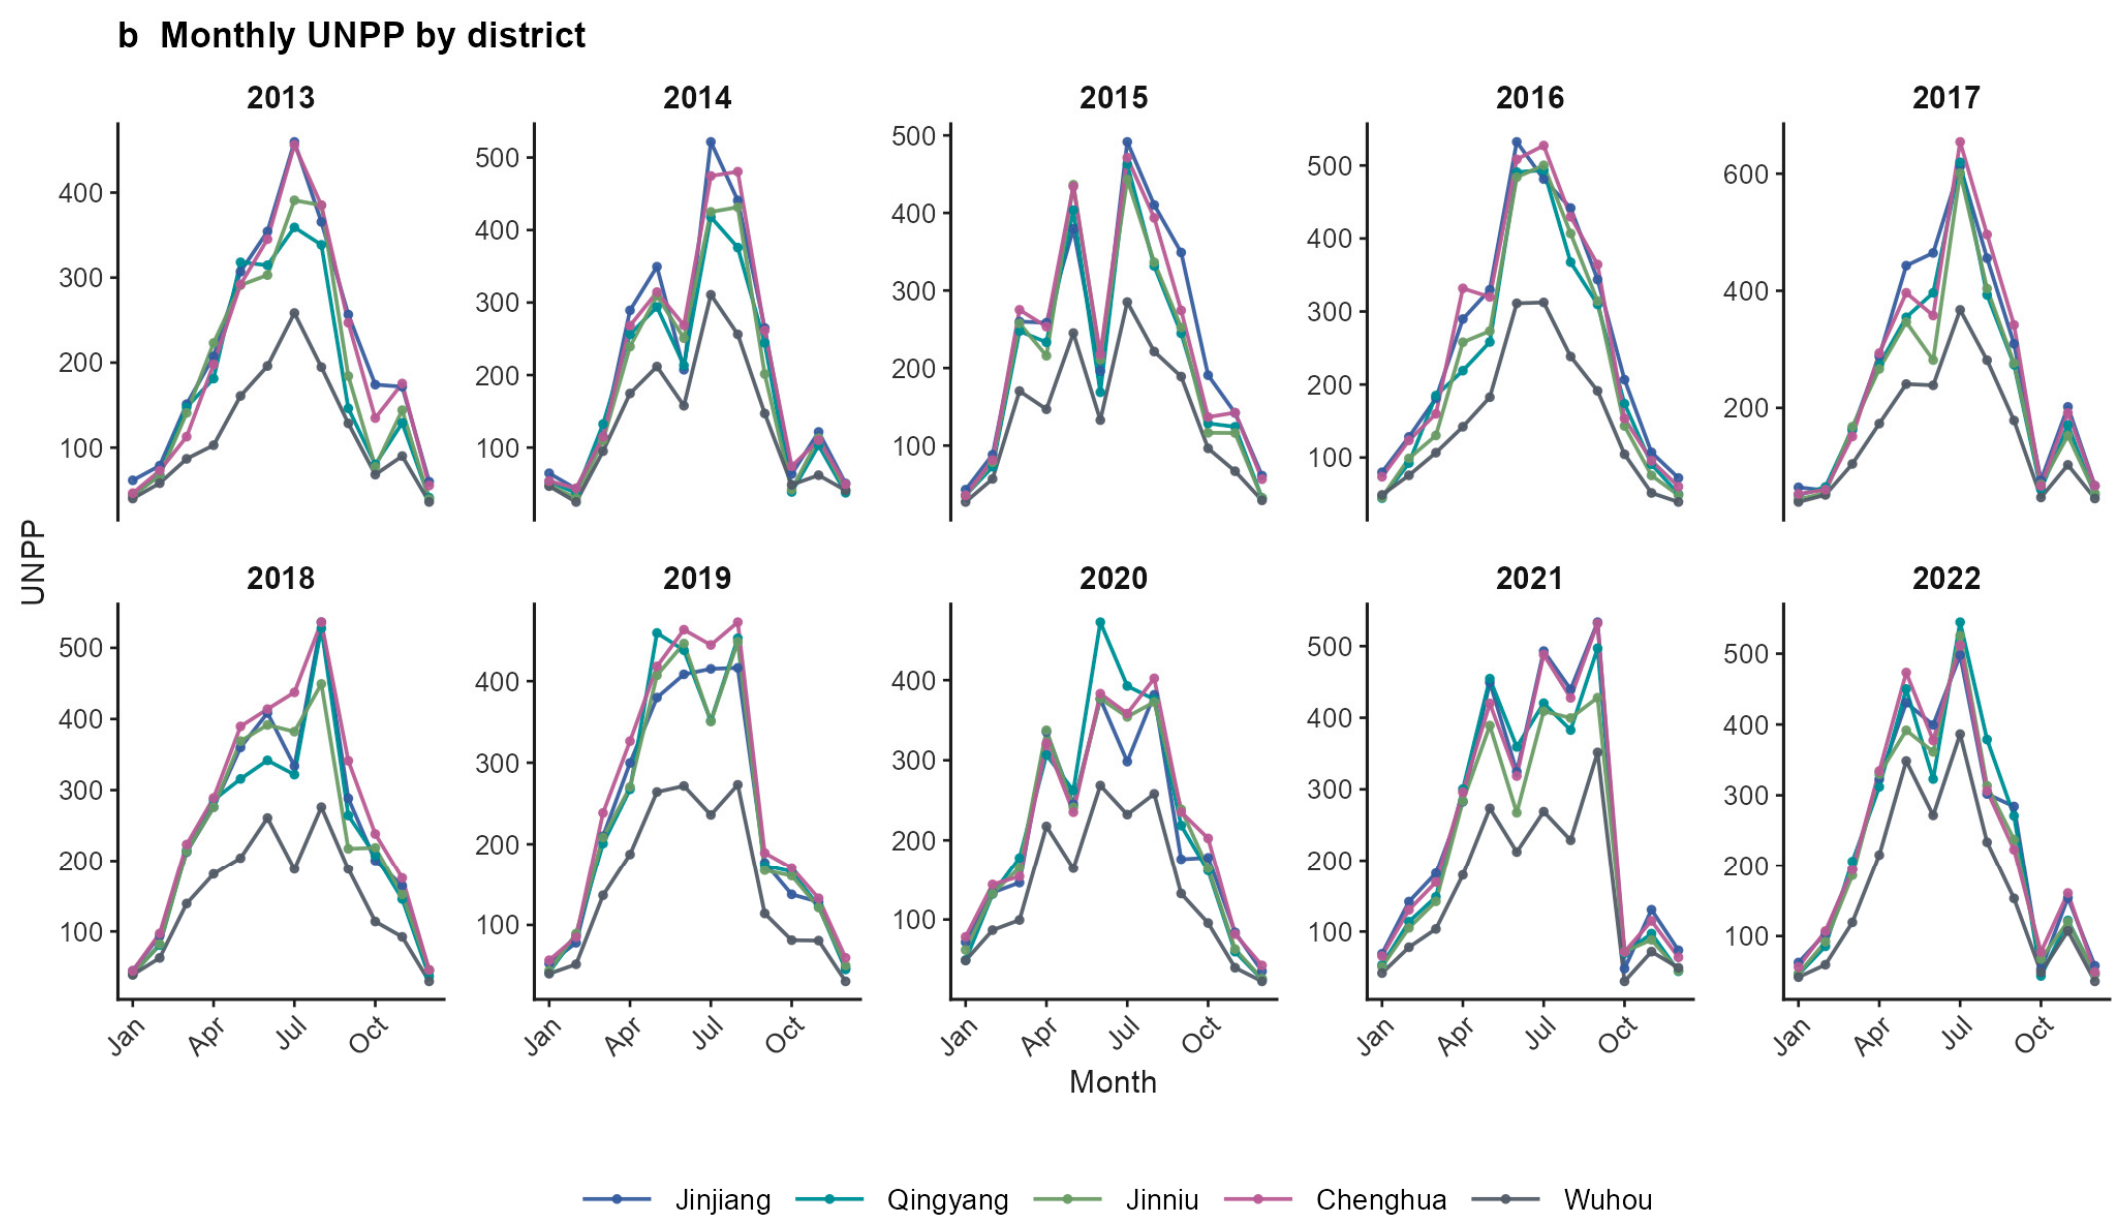
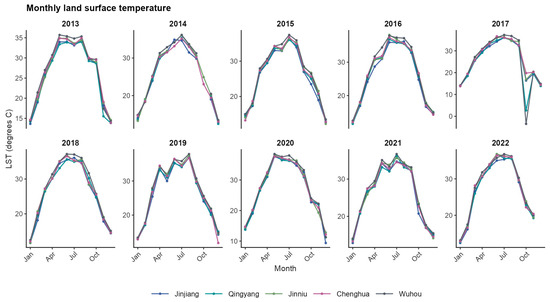
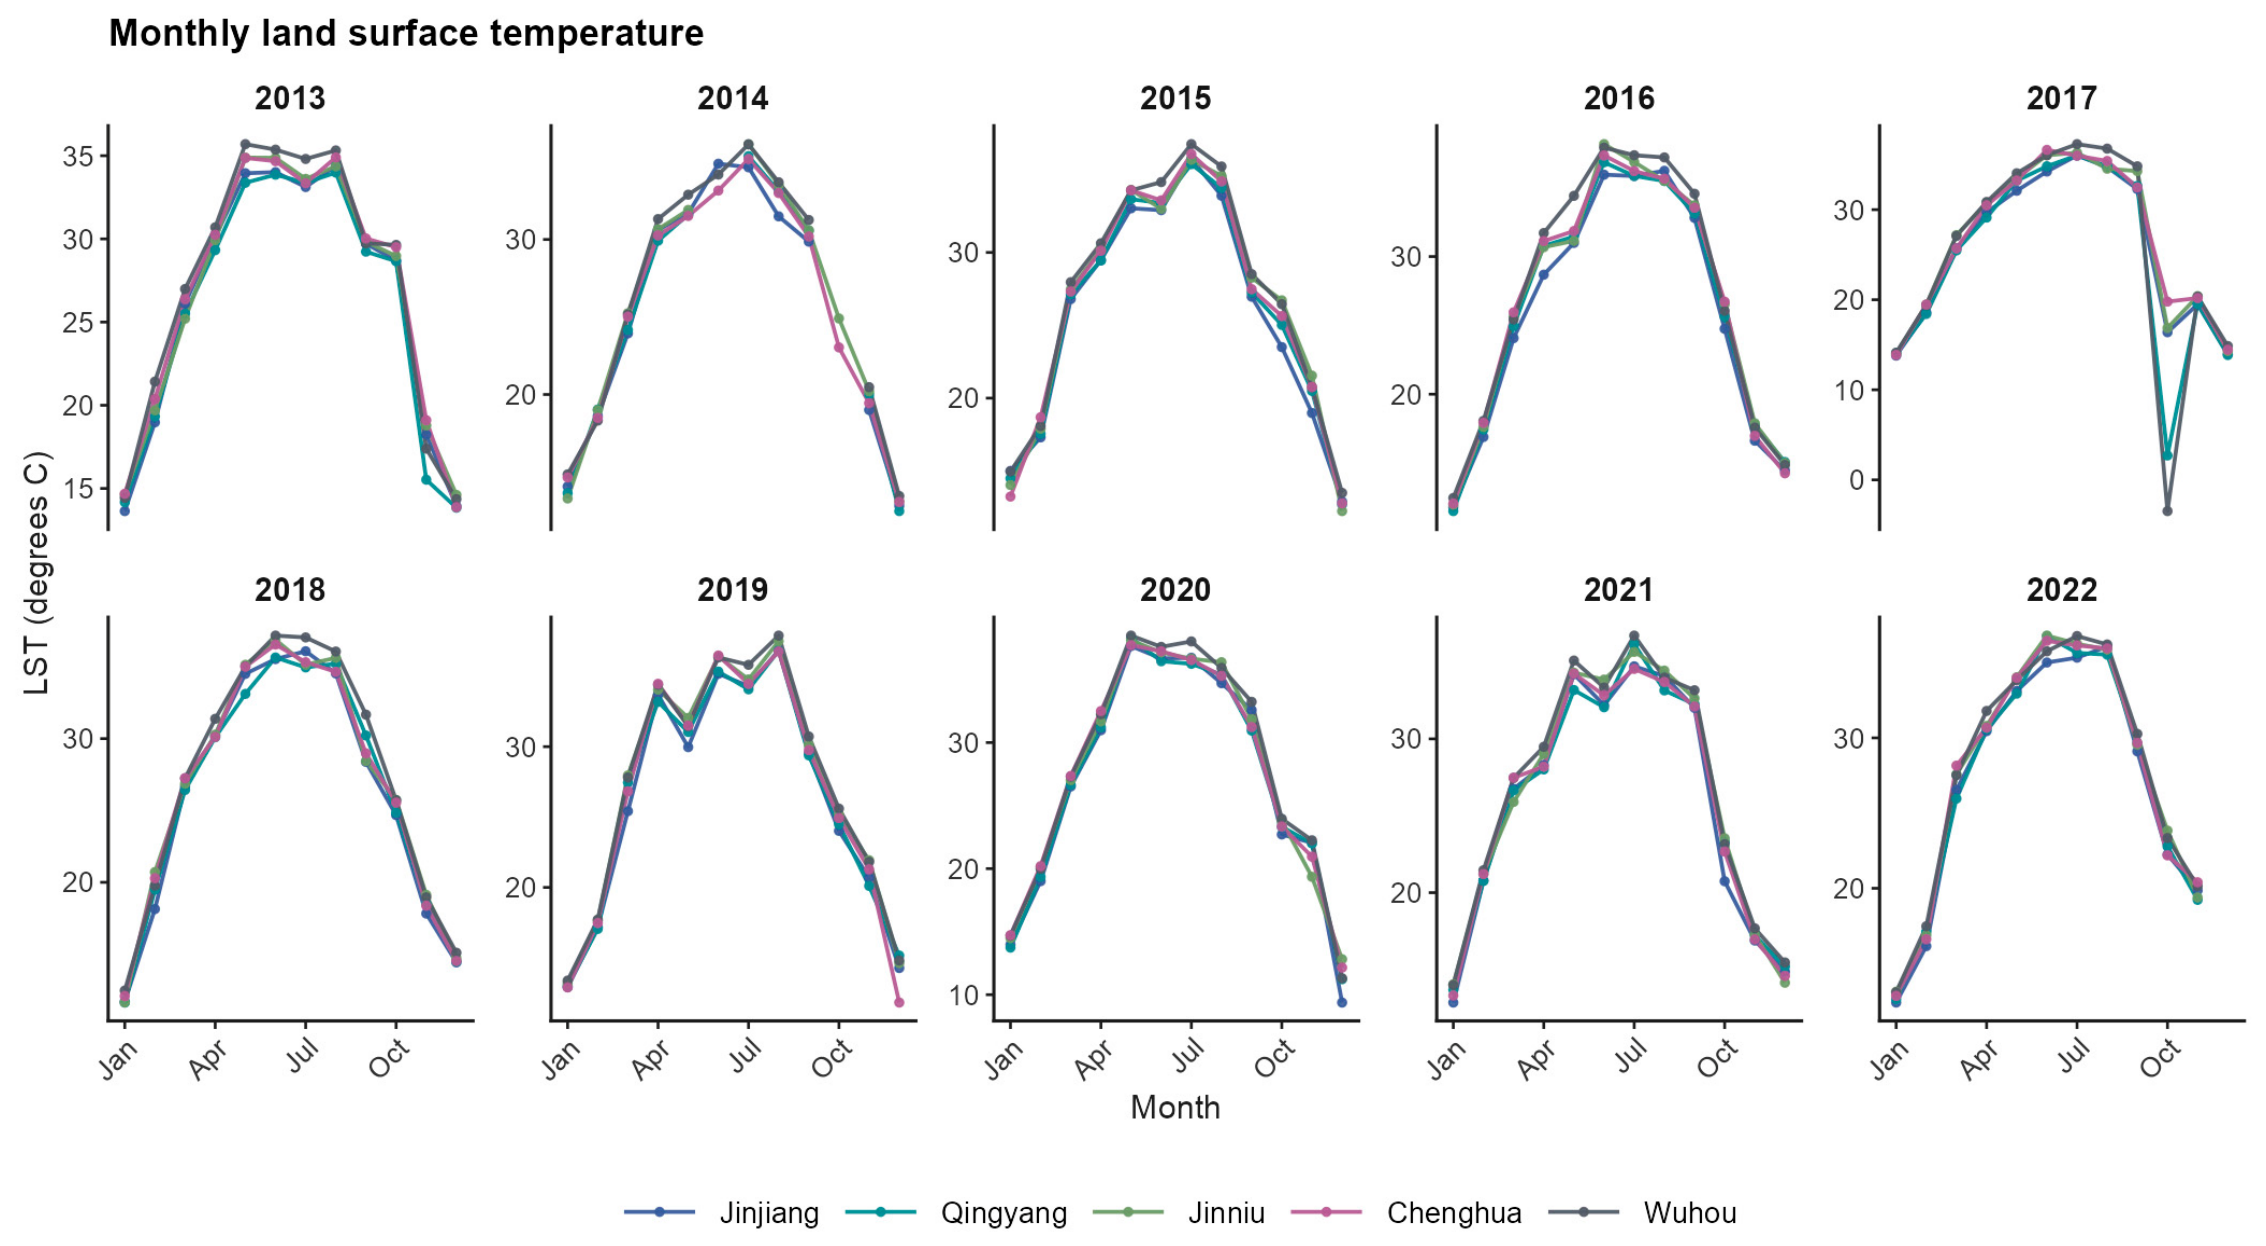
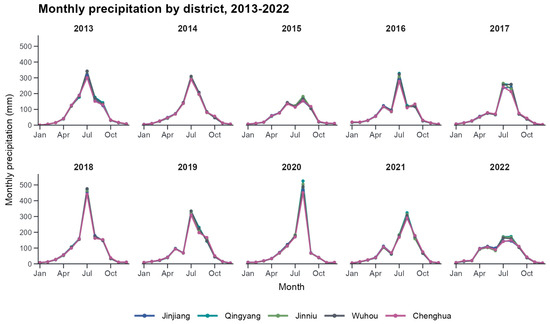
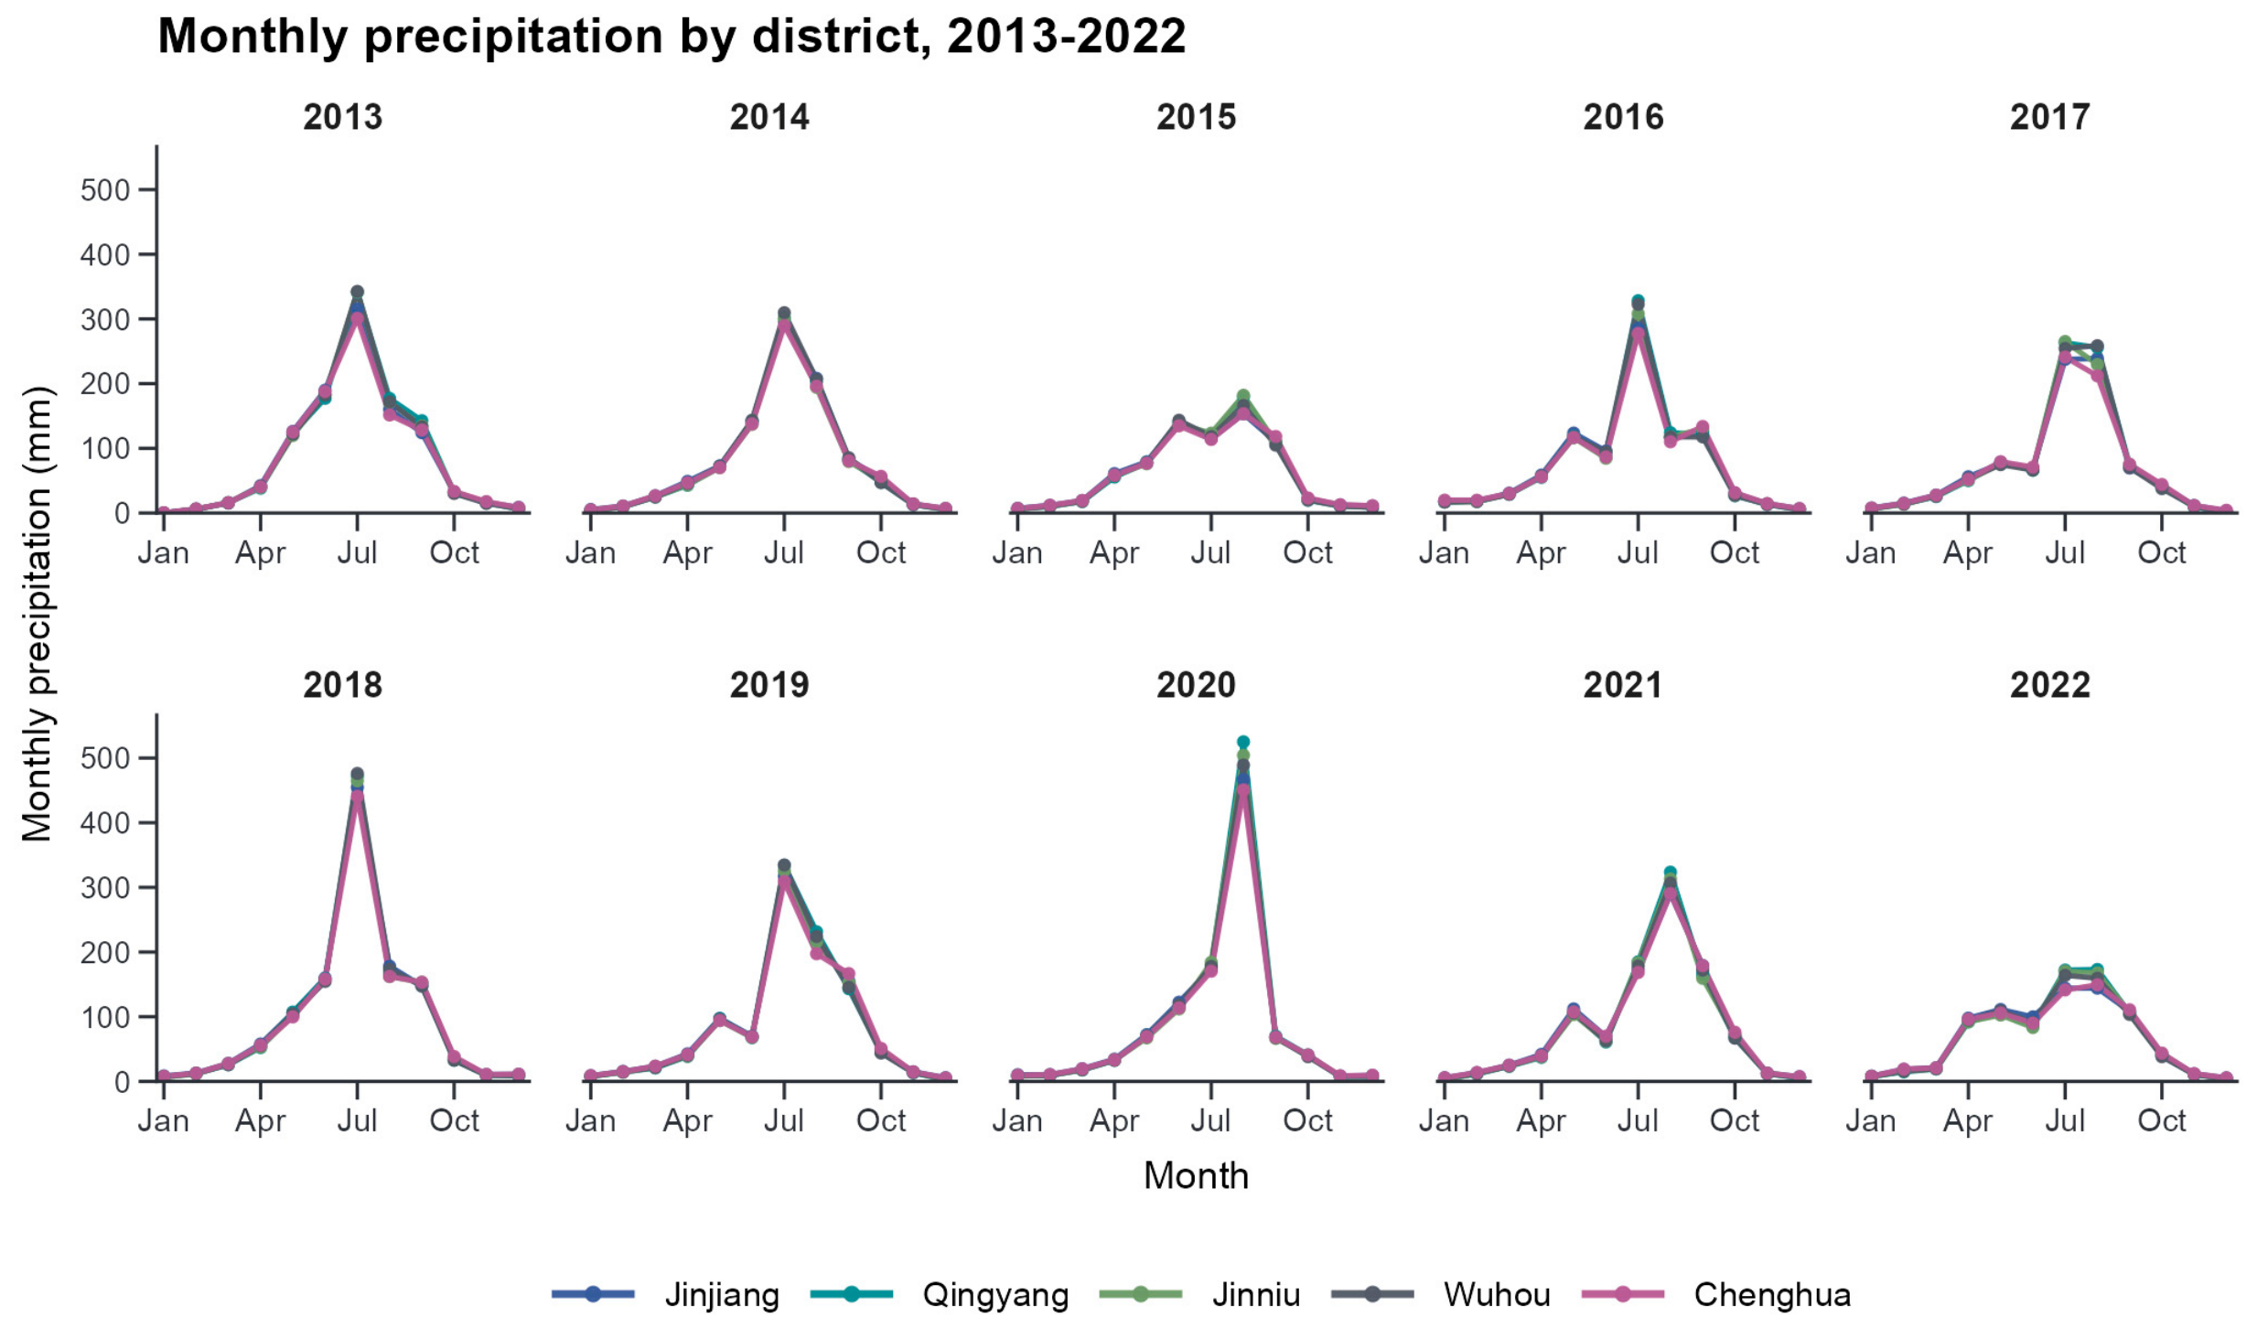
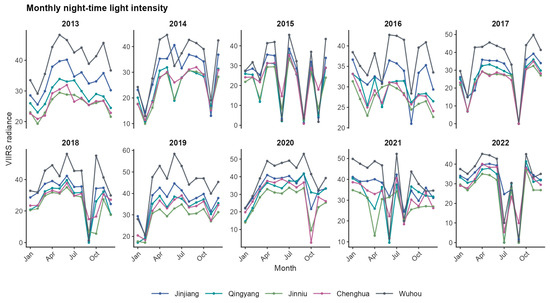
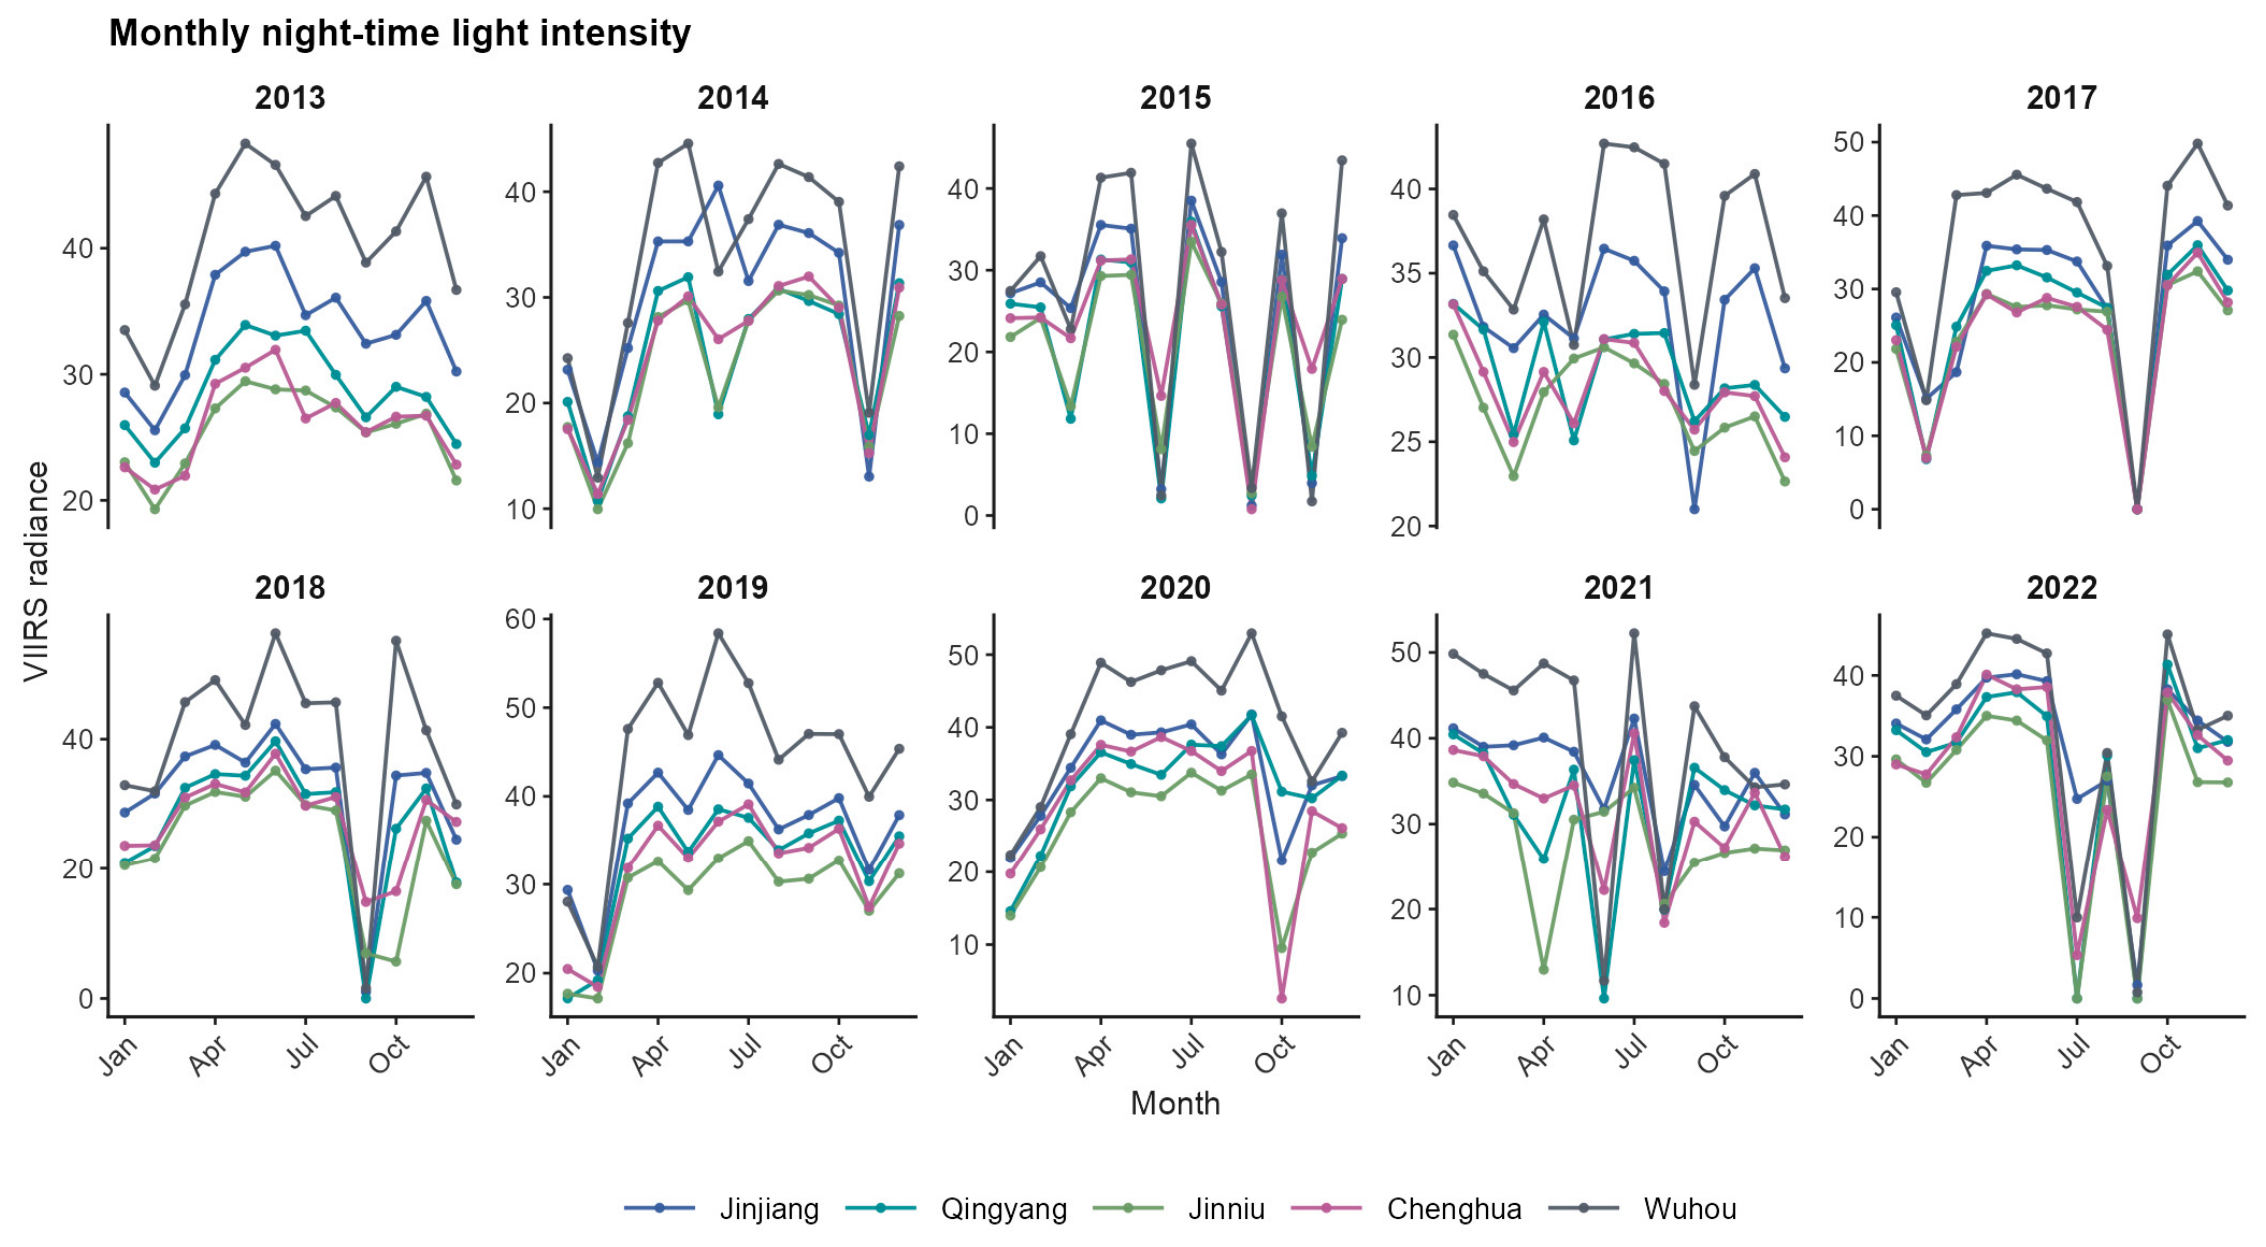
Figure 9, Figure 10, Figure 11 and Figure 12 show monthly variation in NDVI, UNPP, LST, CHIRPS precipitation, and VIIRS night-time light intensity during 2013–2022. Valid January–February 2023 records available in some source datasets were retained only in the raw archive and excluded from these figures and all statistical analyses.
Figure 9.
Monthly district-level dynamics of (a) NDVI and (b) UNPP, 2013–2022. Each line represents one central district.
Figure 10.
Monthly district-level LST dynamics, 2013–2022.
Figure 11.
Monthly district-level CHIRPS precipitation dynamics, 2013–2022.
Figure 12.
Monthly district-level VIIRS night-time light dynamics, 2013–2022.
NDVI and UNPP displayed pronounced seasonal cycles, generally increasing through the growing season and declining in winter. LST followed a strong seasonal pattern, while precipitation was concentrated in the wet season. VIIRS radiance varied among districts and months, but did not show a consistent relationship with UNPP.
Across 120 complete monthly observations per district, long-term means and stage-wise changes differed among the five districts (Table 2). Chenghua had the highest mean UNPP (241.5 g C m−2 month−1), closely followed by Jinjiang (238.8), whereas Wuhou had the lowest (145.5). Comparing 2013–2017 with 2018–2022, Qingyang showed the largest UNPP increase (+11.9%), while Chenghua showed the largest NDVI increase (+21.4%). Jinjiang’s mean UNPP decreased slightly (−1.7%) despite a 6.7% NDVI increase, illustrating that greenness and GPP-derived productivity did not change uniformly.
Table 2.
District-level UNPP and NDVI summaries for 2013–2022 (120 monthly observations per district). Changes compare the mean of 2013–2017 with the mean of 2018–2022.
The district differences and seasonal series provided the descriptive basis for the joint monthly regression.
3.3. Multivariable Regression Outcomes
An OLS model was fitted to 119 citywide monthly means from January 2013 to November 2022. The model was statistically significant, F (4,114) = 176.950, p < 0.001, and explained 86.1% of UNPP variance (R2 = 0.8613; adjusted R2 = 0.8564; RMSE = 50.875 g C m−2 month−1). Complete conventional and HC3-robust coefficient results are reported in Table 3.
Table 3.
Multivariable OLS associations with monthly UNPP and HC3-robust sensitivity analysis (n = 119).
LST had the largest standardized association with UNPP (β = 0.596, p < 0.001), followed by NDVI (β = 0.286, p < 0.001). CHIRPS precipitation had a smaller positive OLS association (β = 0.135, p = 0.007), and VIIRS was not significant (β = 0.017, p = 0.632). The unstandardized coefficient magnitudes are not directly comparable because the predictors use different units.
VIF values ranged from 1.061 to 2.464, providing no evidence of severe multicollinearity. The Durbin–Watson statistic was 2.094, which does not indicate marked first-order residual autocorrelation but does not rule out all temporal dependence. The Breusch–Pagan test indicated heteroscedasticity (p = 0.0029). Under HC3 robust standard errors, NDVI and LST remained significant, VIIRS remained non-significant, and the CHIRPS association weakened to p = 0.072. Precipitation is therefore interpreted as a positive but less robust correlate.
The fitted equation was UNPP = −186.835 + 405.186 (NDVI) + 0.197 (CHIRPS) + 9.911 (LST) + 0.264 (VIIRS). These coefficients summarize conditional associations within the observed monthly range and should not be interpreted as causal effects.
3.4. Polynomial Fitting and Nonlinearity Assessment
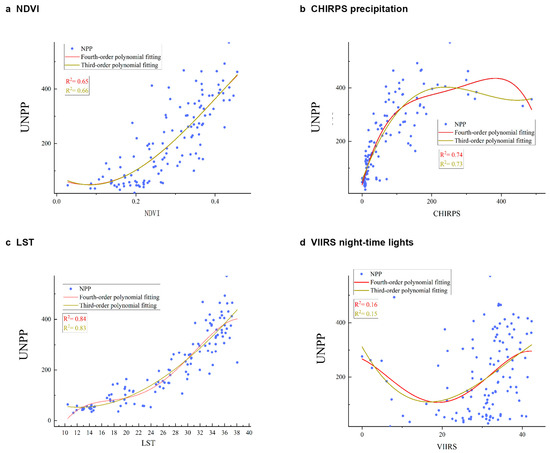
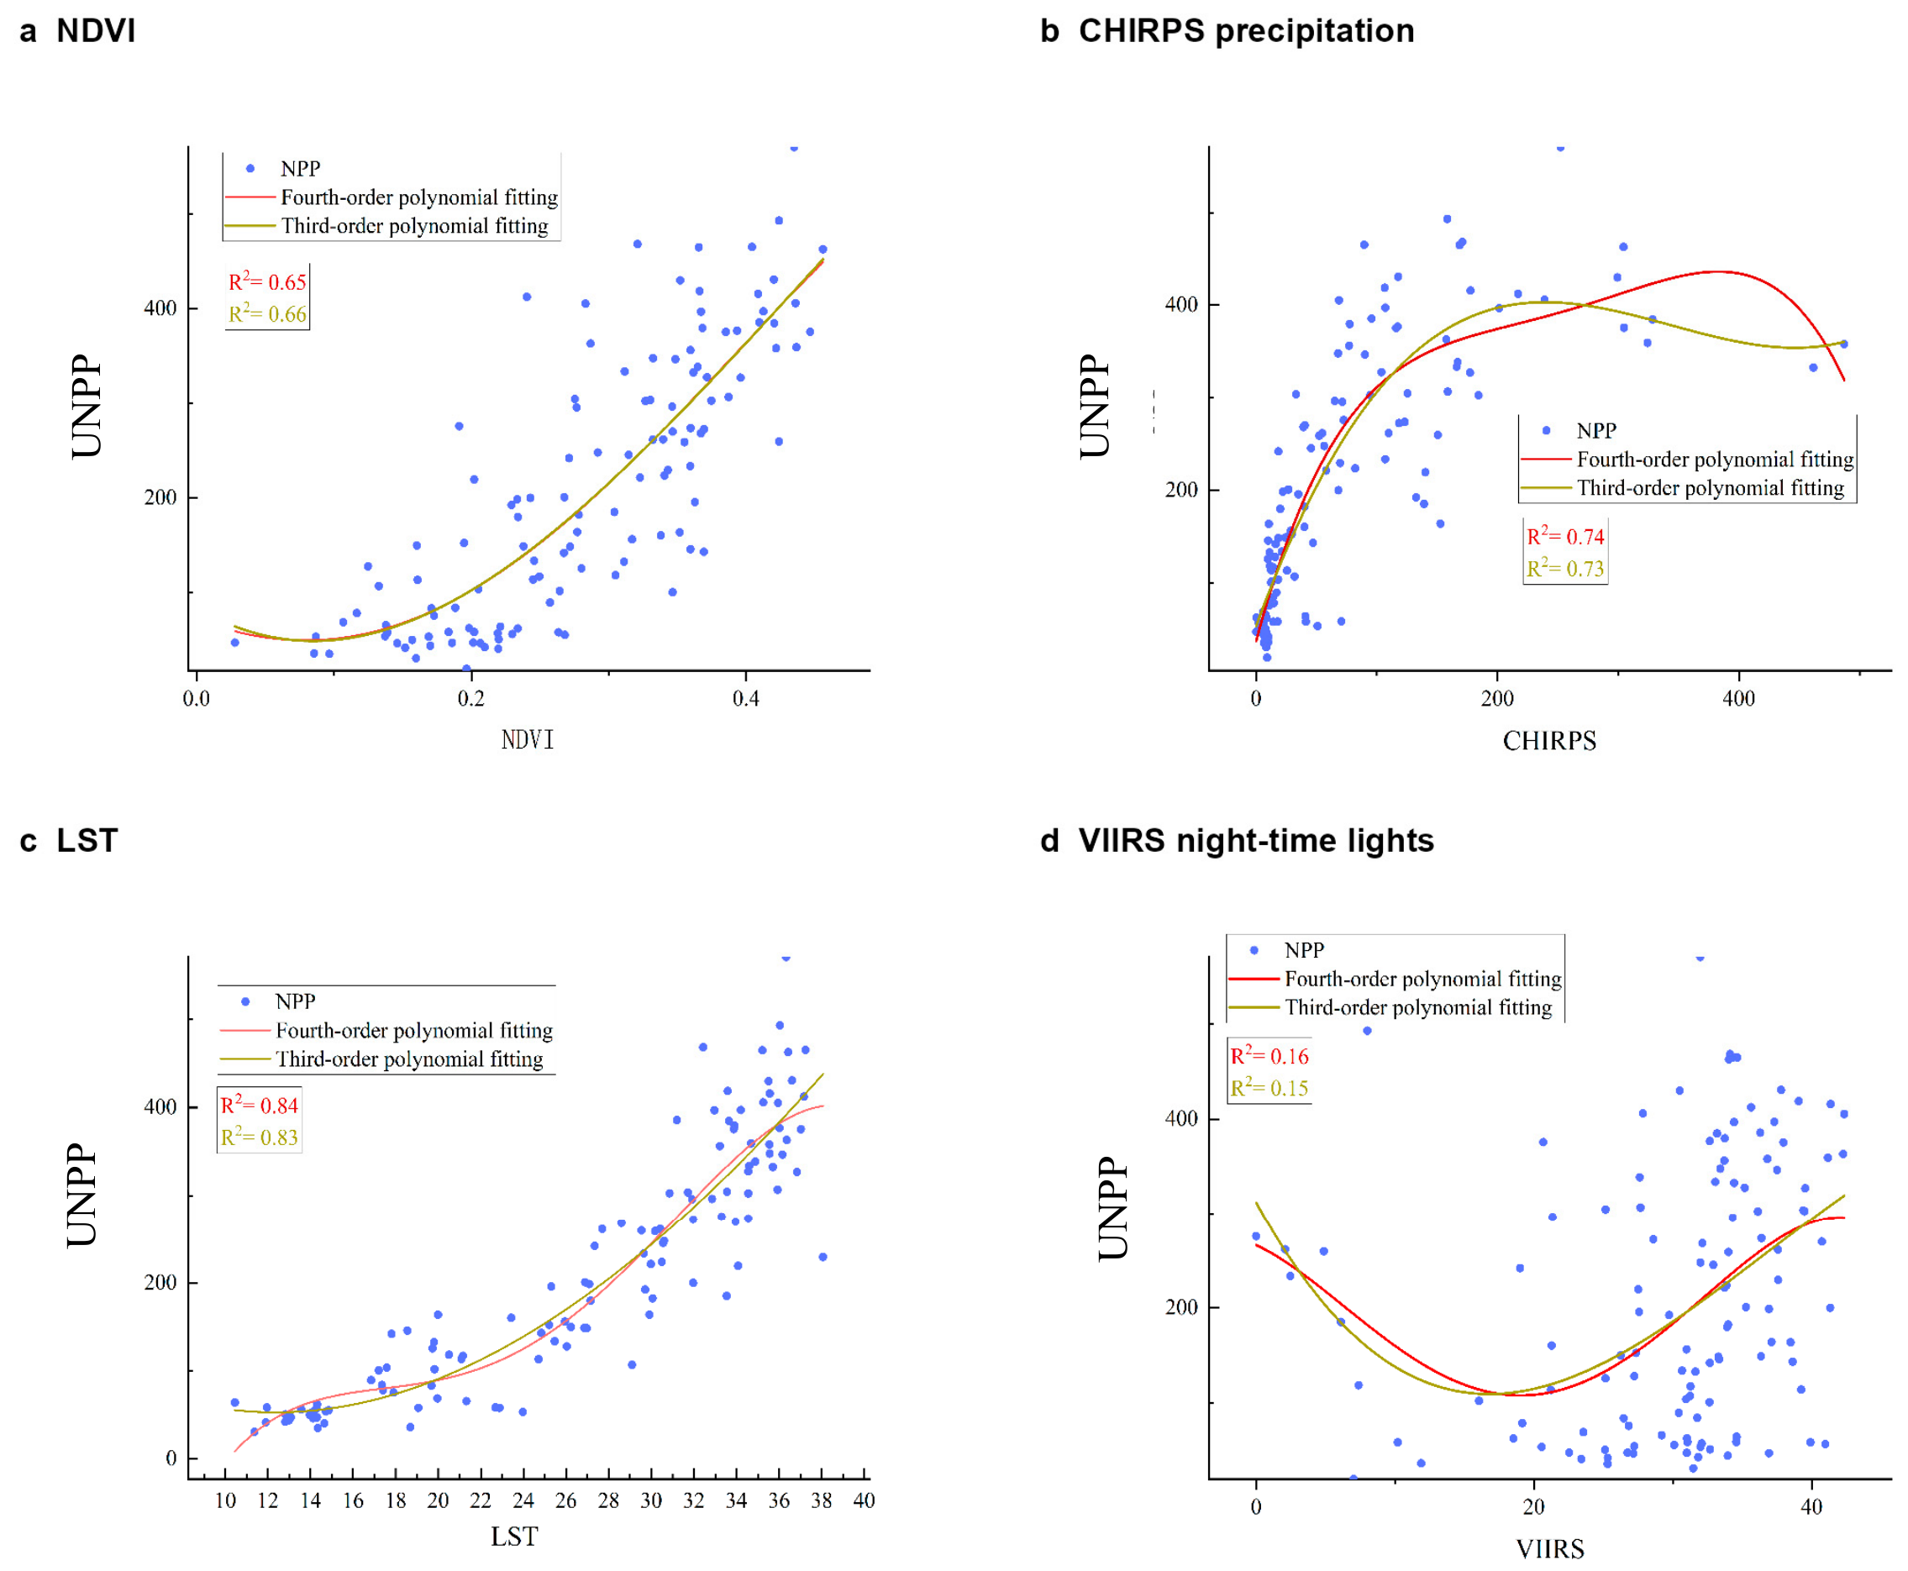
Separate cubic and quartic fits were used to explore bivariate curvature for the same 119-month overlap (Figure 13). These fits do not control jointly for the other variables and are descriptive rather than causal.
Figure 13.
Exploratory third- and fourth-order polynomial fits between GPP-derived UNPP and (a) NDVI, (b) CHIRPS precipitation, (c) LST, and (d) VIIRS night-time lights. Curves describe bivariate associations and do not establish causal or physiological thresholds.
The polynomial fits differed in explanatory strength across predictors.
For NDVI, R2 was 0.65 for the cubic model and 0.66 for the quartic model. The small difference indicates little gain from the additional term.
For CHIRPS precipitation, R2 was 0.74 for the cubic model and 0.73 for the quartic model. The curve shape is consistent with seasonal covariation but cannot by itself identify a hydrological threshold.
LST showed the strongest bivariate fit (R2 = 0.84 for the cubic model and 0.83 for the quartic model), which is consistent with the shared seasonal cycle of temperature and vegetation productivity.
VIIRS showed weak bivariate fits (R2 = 0.16 and 0.15), consistent with its non-significant coefficient in the multivariable model.
Overall, the small differences between cubic and quartic fits indicate limited benefit from added polynomial complexity. The observed curvature should be treated as exploratory because seasonality, shared data sources, and omitted local conditions can generate similar patterns.
4. Discussion
4.1. Methodological Contributions and Statistical Interpretation
The monthly integration of MOD13Q1 NDVI, MOD11A2 LST, CHIRPS precipitation, VIIRS night-time lights, and GPP-derived UNPP provided a temporally resolved view of urban vegetation productivity [11,12,13,14,17,22,23,24]. The exact analytical unit was one citywide monthly mean across five districts, giving n = 119 for the common January 2013–November 2022 period. The representative Sentinel-2/Landsat maps complement, but are analytically separate from, this monthly series.
The model explained 86.1% of UNPP variance. LST had the largest standardized association, followed by NDVI and CHIRPS; VIIRS was not significant. HC3 inference showed that the precipitation association was less stable than the NDVI and LST associations. These are conditional temporal associations, not causal effects. Comparing 2013–2017 with 2018–2022, Qingyang had the largest UNPP increase (+11.9%) and Chenghua had the largest NDVI increase (+21.4%); Jinjiang showed a slight UNPP decrease (−1.7%). Representative annual maps showed greener spatial patterns after 2018, temporally consistent with the Park City Initiative but insufficient to identify a policy effect.
The framework may be transferable to other cities when temporal overlap, scale compatibility, and model diagnostics are reported explicitly. Transferability does not imply that the same coefficients will apply elsewhere: local climate, vegetation composition, management intensity, and urban form can alter the observed relationships.
4.2. Ecological and Planning Implications
The positive NDVI association indicates that greener months generally coincided with greater GPP-derived UNPP, while the larger standardized LST coefficient reflects pronounced seasonal coupling between surface temperature and plant activity. It should not be read as a general warming benefit. Because urban vegetation is fragmented and intensively managed, its productivity and carbon uptake should not be equated with those of rural or natural forests of a comparable area [2,11,12]. The fixed 0.5 NPP/GPP conversion also introduces uncertainty because autotrophic respiration varies among vegetation types, seasons, and environments [23,24].
Percent impervious surface could represent land sealing, runoff generation, thermal exposure, and available planting space more directly than night-time lights [30]. It was not substituted post hoc because a temporally consistent monthly impervious surface series matching the 2013–2022 observations was unavailable. Future models should evaluate dynamic or appropriately matched impervious cover alongside direct management indicators. VIIRS should remain an indirect urban-activity proxy; its non-significant coefficient does not imply that human activity benefits UNPP.
Planting recommendations must remain within the resolution of the evidence. This study did not inventory species or estimate species-specific productivity, so it cannot identify the most productive plant species in Chengdu. Planning should prioritize site-adapted mixtures that match local soils, moisture, heat exposure, and maintenance capacity. Native species may be preferred when they meet ecological and functional objectives, whereas introduced species require assessment of ecological compatibility, maintenance demand, and invasion risk. Productivity, biodiversity, and resilience should be evaluated jointly rather than assuming that native status alone determines productivity.
4.3. Policy Implications of the Park City Initiative
The post-2018 spatial increase in greenness was temporally consistent with the Park City Initiative, but the observational design does not isolate the Initiative from climate variability, urban development, or other greening programs. This is a documented biophysical pattern rather than a causal policy evaluation. Work on 15 min multimodal park accessibility evaluates a complementary social–spatial dimension of the Initiative rather than vegetation productivity [31].
Official and institutional sources frame Chengdu’s Park City development as an integrated urban transformation rather than simply an increase in park area [32,33]. The present findings add a monthly ecological monitoring perspective, while Chen et al. emphasize localized, empirically evaluated nature-based solutions for green-space management [34]. These sources support monitoring and adaptive management but do not establish that the Initiative caused the observed UNPP changes.
District contrasts reinforce the need for place-specific intervention. Chenghua had the highest mean UNPP and the largest stage-wise NDVI increase, Qingyang had the largest stage-wise UNPP increase, and Wuhou had the lowest mean UNPP. Jinjiang combined the highest mean NDVI with a slight UNPP decrease between stages. These differences may reflect urban form, vegetation composition, soils, irrigation, and management and therefore should not be assigned to policy alone.
Green infrastructure also requires sustained personnel and funding. Monitoring should be paired with irrigation planning, soil care, pruning, replacement planting, invasive-species surveillance, and transparent performance indicators. Remote sensing can identify where field inspection is needed, but it cannot substitute for maintenance records or ecological surveys.
5. Conclusions and Recommendations
This study characterized monthly GPP-derived UNPP across Chengdu’s five central districts over the formal 2013–2022 period. The multivariable model used 119 citywide monthly observations from January 2013 to November 2022 and integrated MOD13Q1 NDVI, MOD11A2 LST, CHIRPS precipitation, and VIIRS night-time light intensity.
The model explained 86.1% of UNPP variance. LST had the largest standardized association, followed by NDVI and CHIRPS; VIIRS was not significant. VIF diagnostics did not indicate severe multicollinearity, whereas HC3 robust inference showed that the precipitation association was less stable than the NDVI and LST associations. Polynomial fits described exploratory curvature but did not establish causal thresholds. Annual NDVI patterns after 2018 were temporally consistent with the Park City Initiative, although causal attribution is not supported by the study design.
- Prioritize vegetation quality and continuity: Expand and maintain green infrastructure where low greenness and thermal exposure coincide, while tracking district-specific baselines.
- Integrate thermal and impervious surface planning: Combine canopy strategies with future measures of land sealing, runoff, and planting-space constraints.
- Use site-adapted planting and maintenance: Consider native species where ecologically appropriate, assess introduced species for compatibility and risk, and avoid species-level productivity claims without field evidence.
- Treat night-time lights cautiously: VIIRS may describe urban activity, but it was not a significant UNPP correlate in the fitted model and should not substitute for direct land-cover or management indicators.
- Maintain continuous, comparable monitoring: Harmonize product coverage, distinguish incomplete years, and combine remote sensing with field inventories and maintenance records.
Supplementary Materials
The following supporting information can be downloaded at: https://www.mdpi.com/article/10.3390/f17101164/s1, Supplementary File S1: Representative Google Earth Engine (GEE) JavaScript code excerpts for extracting and aggregating NPP, NDVI, land surface temperature (LST), precipitation (CHIRPS), and nighttime light (VIIRS) data for Chengdu’s five central districts.
Author Contributions
Y.L.: Methodology, formal analysis, writing—original draft; Z.Z.: Methodology, visualisation, writing—review and editing; K.C.: Data curation, investigation, writing—review and editing; Y.W.: Validation, visualisation, writing—review and editing; F.G.: Validation, resources, writing—review and editing; J.L.: Funding acquisition, supervision, writing—review and editing; Y.Z.: Conceptualisation, project administration, writing—review and editing. All authors have read and agreed to the published version of the manuscript.
Funding
This work was supported by the National Natural Science Foundation of China (No. 5250061695), the Central Universities Graduate Innovation Fund of China (No. 2025SYJSCX122), the Chengdu Social Science Research Program (No. 2024CS081), the China-Portugal Joint Laboratory of Cultural Heritage Conservation Science (No. SDYY2405), Key Research Base Program of Sichuan Social Sciences Association of China (No. 25SCZSXW02) and the China Scholarship Council (No. 202410890003).
Data Availability Statement
The data that support the findings of this study are available from the corresponding authors upon reasonable request.
Conflicts of Interest
The authors declare no conflicts of interest. The funders had no role in the design of the study; the collection, analysis, or interpretation of the data; the writing of the manuscript; or the decision to publish the results.
Declaration of Generative AI in Scientific Writing
During the preparation of this manuscript, the authors used AI-assisted language editing solely to improve English expression. The authors reviewed and revised all output and take full responsibility for the final content of the manuscript.
Submission Declaration and Verification
The authors declare that this work has not been published previously, is not under consideration for publication elsewhere, and has been approved for publication by all authors and the responsible authorities, either explicitly or tacitly.
References
- Liu, Y.; Zhang, M.; Zhang, Y. Vertical greening for public buildings retrofitting and urban carbon neutrality: A nature-based solution and design practice in China. Ecol. Eng. 2025, 216, 107617. [Google Scholar] [CrossRef] [Scilit]
- Cramer, W.; Kicklighter, D.W.; Bondeau, A.; Moore, B., III; Churkina, G.; Nemry, B.; Ruimy, A.; Schloss, A.L. The Participants of the Potsdam NPP Model Intercomparison. Comparing global models of terrestrial net primary productivity (NPP): Overview and key results. Glob. Change Biol. 1999, 5, 1–15. [Google Scholar] [CrossRef] [Scilit]
- Schultz, P.; Halpert, M. Global correlation of temperature, NDVI and precipitation. Adv. Space Res. 1993, 13, 277–280. [Google Scholar] [CrossRef] [Scilit]
- Zheng, Y.; Tang, L.; Wang, H. An improved approach for monitoring urban built-up areas by combining NPP-VIIRS nighttime light, NDVI, NDWI, and NDBI. J. Clean. Prod. 2021, 328, 129488. [Google Scholar] [CrossRef] [Scilit]
- Tang, L.; Wang, J.; Xu, L.; Lu, H. Exploring new avenues in sustainable urban development: Ecological carbon dynamics of Park City in Chengdu. Sustainability 2024, 16, 6471. [Google Scholar] [CrossRef] [Scilit]
- Guan, X.; Shen, H.; Li, X.; Gan, W.; Zhang, L. A long-term and comprehensive assessment of the urbanization-induced impacts on vegetation net primary productivity. Sci. Total Environ. 2019, 669, 342–352. [Google Scholar] [CrossRef] [Scilit]
- Guo, L.; Liu, R.; Shoaib, M.; Men, C.; Wang, Q.; Miao, Y.; Jiao, L.; Wang, Y.; Zhang, Y. Impacts of landscape change on net primary productivity by integrating remote sensing data and ecosystem model in a rapidly urbanizing region in China. J. Clean. Prod. 2021, 325, 129314. [Google Scholar] [CrossRef] [Scilit]
- Zhang, M.; Du, H.; Zhou, G.; Mao, F.; Li, X.; Zhou, L.; Zhu, D.; Xu, Y.; Huang, Z. Spatiotemporal patterns and driving force of urbanization and its impact on urban ecology. Remote Sens. 2022, 14, 1160. [Google Scholar] [CrossRef] [Scilit]
- Li, J.; Xie, B.; Dong, H.; Zhou, K.; Zhang, X. The impact of urbanization on ecosystem services: Both time and space are important to identify driving forces. J. Environ. Manag. 2023, 347, 119161. [Google Scholar] [CrossRef] [Scilit]
- Chen, Y.; Lu, D.; Xu, B.; Ren, R.; Wang, Z.; Feng, Z. Determining the dominant contributions between direct and indirect impacts of long-term urbanization on plant net primary productivity in Beijing. Remote Sens. 2024, 16, 444. [Google Scholar] [CrossRef] [Scilit]
- Running, S.W.; Nemani, R.R.; Heinsch, F.A.; Zhao, M.; Reeves, M.; Hashimoto, H. A continuous satellite-derived measure of global terrestrial primary production. BioScience 2004, 54, 547–560. [Google Scholar] [CrossRef] [Scilit]
- Turner, D.P.; Ritts, W.D.; Cohen, W.B.; Gower, S.T.; Running, S.W.; Zhao, M.; Costa, M.H.; Kirschbaum, A.A.; Ham, J.M.; Saleska, S.R.; et al. Evaluation of MODIS NPP and GPP products across multiple biomes. Remote Sens. Environ. 2006, 102, 282–292. [Google Scholar] [CrossRef] [Scilit]
- Zhang, M.; Yuan, N.; Lin, H.; Liu, Y.; Zhang, H. Quantitative estimation of the factors impacting spatiotemporal variation in NPP in the Dongting Lake wetlands using Landsat time series data for the last two decades. Ecol. Indic. 2022, 135, 108544, Correction in Ecol. Indic. 2022, 144, 109478. https://doi.org/10.1016/j.ecolind.2022.109478. [Google Scholar] [CrossRef] [Scilit]
- Wang, Z.; Wang, H.; Wang, T.; Wang, L.; Huang, X.; Zheng, K.; Liu, X. Effects of environmental factors on the changes in MODIS NPP along DEM in global terrestrial ecosystems over the last two decades. Remote Sens. 2022, 14, 713. [Google Scholar] [CrossRef] [Scilit]
- Liu, Y.; Xu, M.; Guo, B.; Yang, G.; Li, J.; Yu, Y. Changes in the vegetation NPP of mainland China under the combined actions of climatic-socioeconomic factors. Forests 2023, 14, 2341. [Google Scholar] [CrossRef] [Scilit]
- Huang, S.; Tang, L.; Hupy, J.P.; Wang, Y.; Shao, G. A commentary review on the use of normalized difference vegetation index (NDVI) in the era of popular remote sensing. J. For. Res. 2021, 32, 1–6, Correction in J. For. Res. 2021, 32, 2719. https://doi.org/10.1007/s11676-020-01176-w. [Google Scholar] [CrossRef] [Scilit]
- Pettorelli, N.; Vik, J.O.; Mysterud, A.; Gaillard, J.M.; Tucker, C.J.; Stenseth, N.C. Using the satellite-derived NDVI to assess ecological responses to environmental change. Trends Ecol. Evol. 2005, 20, 503–510, Correction in Trends Ecol. Evol. 2006, 21, 11. https://doi.org/10.1016/j.tree.2005.11.006. [Google Scholar] [CrossRef] [Scilit]
- Benali, A.; Carvalho, A.C.; Nunes, J.P.; Carvalhais, N.; Santos, A. Estimating air surface temperature in Portugal using MODIS LST data. Remote Sens. Environ. 2012, 124, 108–121. [Google Scholar] [CrossRef] [Scilit]
- Marzban, F.; Sodoudi, S.; Preusker, R. The influence of land-cover type on the relationship between NDVI–LST and LST–Tair. Int. J. Remote Sens. 2018, 39, 1377–1398. [Google Scholar] [CrossRef] [Scilit]
- Dinku, T.; Funk, C.; Peterson, P.; Maidment, R.; Tadesse, T.; Gadain, H.; Ceccato, P. Validation of the CHIRPS satellite rainfall estimates over eastern Africa. Q. J. R. Meteorol. Soc. 2018, 144, 292–312. [Google Scholar] [CrossRef] [Scilit]
- Xiong, X.; Butler, J.J. MODIS and VIIRS calibration history and future outlook. Remote Sens. 2020, 12, 2523. [Google Scholar] [CrossRef] [Scilit]
- Running, S.W.; Zhao, M. User’s Guide: Daily GPP and Annual NPP (MOD17A2H/A3H) and Year-End Gap-Filled (MOD17A2HGF/A3HGF) Products, Collection 6.1; University of Montana: Missoula, MT, USA, 2021; pp. 1–33. Available online: https://lpdaac.usgs.gov/documents/972/MOD17_User_Guide_V61.pdf (accessed on 22 September 2026).
- Waring, R.H.; Landsberg, J.J.; Williams, M. Net primary production of forests: A constant fraction of gross primary production? Tree Physiol. 1998, 18, 129–134. [Google Scholar] [CrossRef] [Scilit]
- Huang, X.; Xiao, J.; Wang, X.; Ma, M. Improving the global MODIS GPP model by optimizing parameters with FLUXNET data. Agric. For. Meteorol. 2021, 300, 108314. [Google Scholar] [CrossRef] [Scilit]
- Amiri, M.; Pourghasemi, H.R. Mapping the NDVI and monitoring of its changes using Google Earth Engine and Sentinel-2 images. In Computers in Earth and Environmental Sciences; Elsevier: Amsterdam, The Netherlands, 2022; pp. 127–136. [Google Scholar] [CrossRef] [Scilit]
- D’Odorico, P.; Gonsamo, A.; Damm, A.; Schaepman, M.E. Experimental evaluation of Sentinel-2 spectral response functions for NDVI time-series continuity. IEEE Trans. Geosci. Remote Sens. 2013, 51, 1336–1348. [Google Scholar] [CrossRef] [Scilit]
- Velastegui-Montoya, A.; Montalván-Burbano, N.; Carrión-Mero, P.; Rivera-Torres, H.; Sadeck, L.; Adami, M. Google Earth Engine: A global analysis and future trends. Remote Sens. 2023, 15, 3675. [Google Scholar] [CrossRef] [Scilit]
- Kumar, L.; Mutanga, O. Google Earth Engine applications since inception: Usage, trends, and potential. Remote Sens. 2018, 10, 1509. [Google Scholar] [CrossRef] [Scilit]
- Zhou, J.; Chen, L. Remote sensing monitoring of the impact of urban expansion patterns on forest fragmentation: A case study of Chengdu City. J. Hangzhou Norm. Univ. Nat. Sci. Ed. 2024, 23, 453–462. [Google Scholar] [CrossRef]
- Homet, K.; Kremer, P.; Smith, V.; Strader, S. Multi-variable assessment of green stormwater infrastructure planning across a city landscape: Incorporating social, environmental, built-environment, and maintenance vulnerabilities. Front. Environ. Sci. 2022, 10, 958704. [Google Scholar] [CrossRef] [Scilit]
- Tang, S. Assessing the impacts of the Park City Initiative on travel: 15-minute multimodal accessibility to urban parks in Chengdu, China. Int. J. Urban Sci. 2026, 1–22. [Google Scholar] [CrossRef] [Scilit]
- National Development and Reform Commission; Ministry of Natural Resources; Ministry of Housing and Urban-Rural Development. Overall Plan for Chengdu to Build a Park City Demonstration Zone Practicing the New Development Philosophy. Available online: https://www.ndrc.gov.cn/xwdt/ztzl/xxczhjs/ghzc/202203/t20220316_1319385.html (accessed on 22 September 2026).
- ICLEI Cities Biodiversity Center. Chengdu, China’s ‘Park City’, Is a Global Frontrunner in Taking Innovative Urban Biodiversity Action. Available online: https://cbc.iclei.org/news/chengdu-chinas-park-city-is-a-global-frontrunner-in-taking-innovative-urban-biodiversity-action/ (accessed on 22 September 2026).
- Chen, S.; Qiu, J.; Yang, M. Addressing the green space management challenges of the Park City in China: How can nature-based solutions contribute? Environ. Dev. 2025, 55, 101235. [Google Scholar] [CrossRef] [Scilit]

Disclaimer/Publisher’s Note: The statements, opinions and data contained in all publications are solely those of the individual author(s) and contributor(s) and not of MDPI and/or the editor(s). MDPI and/or the editor(s) disclaim responsibility for any injury to people or property resulting from any ideas, methods, instructions or products referred to in the content. |
© 2026 by the authors. Licensee MDPI, Basel, Switzerland. This article is an open access article distributed under the terms and conditions of the Creative Commons Attribution (CC BY) license.