


Abstract
Desertification erodes arable land and human habitats. Vegetation restoration represents a critical process for improving the quality of sandy land by enhancing soil structure and nutrient cycling. This study aims to investigation how vegetation restoration affects soil physicochemical properties and soil quality. Five vegetated land types were selected (Pinus sylvestris var. mongholica Litv., PS; Amygdalus pedunculata Pall., AP; Salix psammophila, SP; Amorpha fruticosa L., AF; Artemisia desertorum Spreng., AD). Bare sandy land (BS) served as the control. The physicochemical properties of 270 soil samples from three vertical depth intervals (0–10, 10–20, and 20–30 cm) were analyzed. The findings demonstrated that vegetation restoration markedly improved the proportion of finer soil particles (clay and silt) and organic carbon, while the variations in total phosphorus, ammonia nitrogen, and nitrate nitrogen were not significant. To better understand the variations in soil quality in different vegetated lands, a soil quality index (SQI) was developed that considers multiple soil physical and chemical indicator selections and scoring methods. The SQI based on the minimum dataset and linear scoring method better differentiated the soil quality for sandy lands and showed higher values for SP among all five vegetated lands and BS. Improvements in soil quality were closely related to vegetation properties (density and coverage) and litter characteristics (thickness, water content, and total phosphorus content). Restoration strategies for sandy lands should focus more strongly on species selection, taking into account interspecific variations in litter production, physicochemical properties, canopy architecture, and planting density to more effectively improve soil quality.
1. Introduction
Desertification affects approximately 25% of the Earth’s terrestrial surface area, characterized by vegetation coverage below 5% and dominant mobile dunes [1,2,3]. This has led to soil erosion, land degradation, and the loss of agricultural productivity over the last few decades [4,5]. Vegetation restoration is widely recognized as an effective strategy for combating desertification and environmental amelioration in arid and semiarid zones [6,7]. Since the 1980s, large-scale vegetation establishment and restoration efforts have been initiated in the semiarid sandy land of northern China following the implementation of the “Three-North Shelterbelt Forest Program.” As a result, vegetation coverage reached 55%, with extensive sandy areas being replaced by woodlands and grasslands [8]. Studying the changes in soil physicochemical properties across various vegetation restoration strategies is important for systematically evaluating the effectiveness of ecological construction and optimizing vegetation configuration models. This serves as the core basis for ensuring the sustainability of restoration projects.
Soil and vegetation constitute the fundamental components within terrestrial ecosystems [9,10]. Moreover, soil physicochemical properties and vegetation growth are characterized by mutually interdependent and constraining relationships [11]. Numerous studies have confirmed significant improvements in the soil properties following vegetation restoration in sandy areas. After implementing vegetation restoration in homogeneous sandy soils of the Kalahari Transect, the area of the mobile sand dunes has been effectively controlled, and at the same time, the soil water and nutrient conditions have improved significantly [12]. Similarly, in alpine sandy lands, vegetation restoration increases soil clay and silt content, reduces bulk density, and improves water conductivity [13]. The availability of soil water and nutrients constitutes a critical foundation for plant growth and development. Sandy land is characterized by sandy soils with poor structure and limited nutrients. Consequently, knowledge of the changes in soil physical and chemical properties after vegetation restoration is crucial for the sustainability of vegetation restoration in the semiarid sandy lands of northern China.
The effects of revegetation types on soil physical and chemical properties have been demonstrated in various ecosystems and areas, and it is ultimately necessary to explore appropriate vegetation types to achieve higher economic benefits [6]. In the Konya-Karapınar region of Turkey, long-term land-use conversion from forest to grazing for more than 60 years has demonstrated the potential for significant soil quality improvement. Notably, soil quality was observed to reach its highest level within the apple orchard areas of the region [14]. In the Tengger Desert of northern China, soil physical and chemical properties improved following vegetation restoration, with shrub restoration having more favorable effects than herbaceous restoration in terms of increasing silt, clay, and organic carbon content [15]. In the Yellow River Delta, tree and shrub restoration significantly reduced the soil sand content compared to grasslands, primarily because of the higher coverage of trees and shrubs, which effectively reduced the loss of fine soil particles [16]. Similar studies on the Loess Plateau have indicated that tree and shrub restorations have a better effect on soil properties than herbs, and caragana has been identified as particularly effective in improving soil physical and chemical properties [17,18]. After decades of vegetation restoration, vegetation communities in the semiarid sandy lands of northern China have changed to include artificial trees, shrubs, and grasses [19,20]. However, previous studies have predominantly focused on numerical comparisons of single properties, lacking a systematic analysis that integrates both physical and chemical properties, thereby hindering the comprehensive assessment of soil quality.
The soil quality index (SQI) is broadly adopted for soil quality assessment after vegetation restoration and land-use changes [21,22]. Previous studies have confirmed that the accuracy of soil quality evaluation relies significantly on the methods of soil indicator selection and scoring [23,24]. Traditional approaches employ principal component analysis (PCA) to find appropriate indicators for all soil properties [25,26]. However, a recent study advocated the independent selection of physical, chemical, and biological indicators, which exhibited better performance and discrimination in the evaluation of soil quality [27]. In addition, comparative studies of linear and nonlinear scoring equations have yielded various results. A comparison of soil quality indexing methods for vegetable production systems in northern California indicated that the nonlinear scoring technique demonstrated a closer alignment with integrated ecosystem processes compared to its linear counterpart [28]. However, other studies have indicated that linear methods provide the best discrimination in soil quality assessments [29,30]. The establishment of the SQI is region specific [31]. Thus, to accurately evaluate variations in soil quality under different revegetation types, the selection of suitable soil indicators and scoring methods is indispensable.
In our study, the soil physicochemical properties of five vegetation restoration types and bare sandy land (BS) in the semiarid sandy land of northern China were measured, and the SQIs established under different soil physical and chemical indicator selection and scoring methods were evaluated. The core research questions of this study are: In the Mu Us Sandy Land, do different vegetation restoration patterns (trees, shrubs, or herbs) lead to significant differences in the improvement of soil quality? What are the key factors driving these differences? To address these questions, our study aimed to (1) understand the impacts of vegetation restoration on soil physicochemical quality, (2) establish a suitable SQI development method for evaluating soil quality of semiarid sandy lands, and (3) identify the suitability of plant species in enhancing soil quality in revegetated sandy lands.
2. Materials and Methods
2.1. Study Area
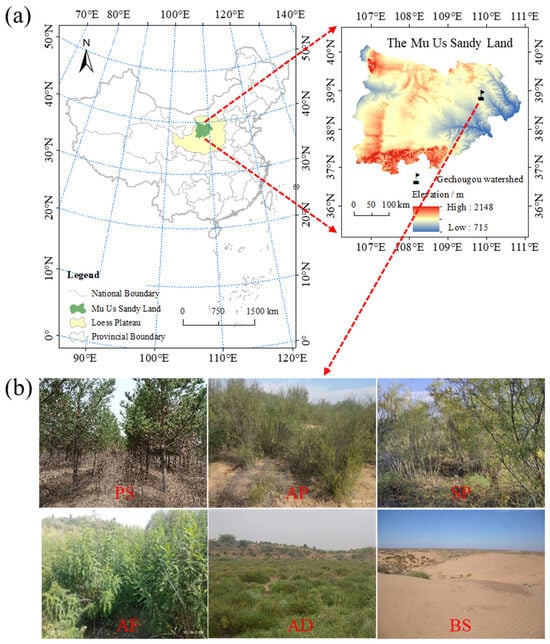
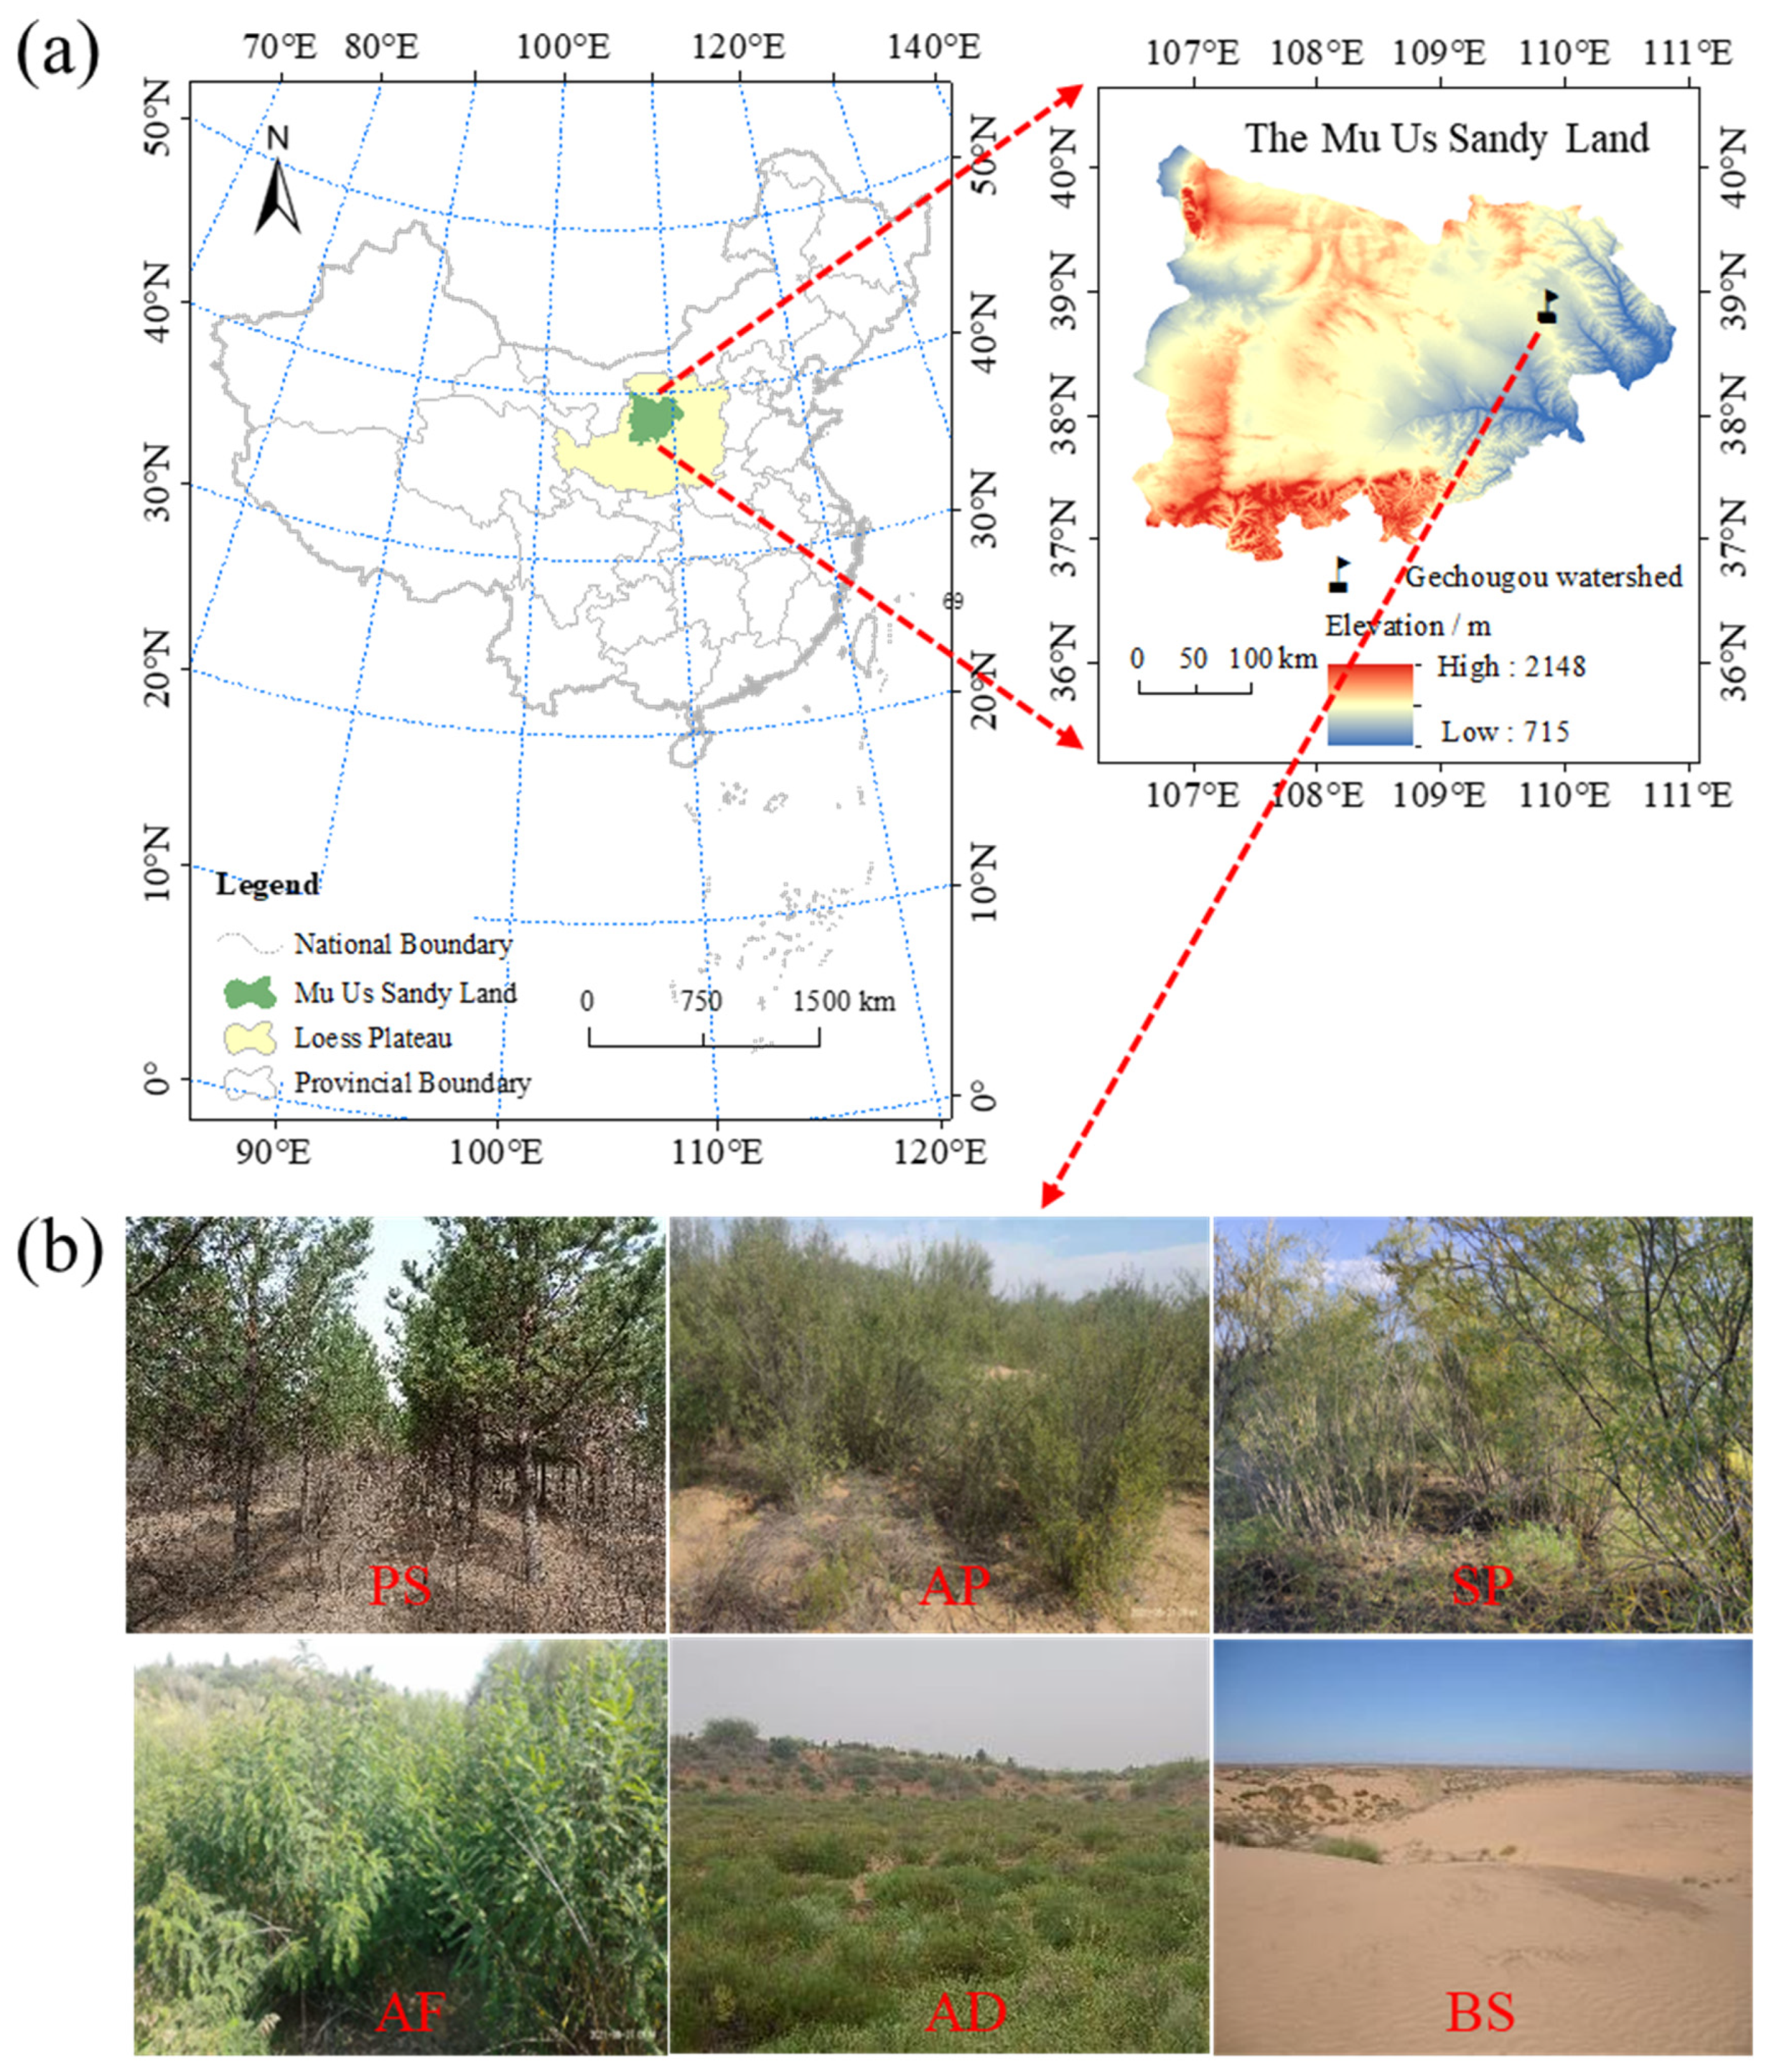
Our study was conducted within the Gechougou watershed (38°11′–38°53′ N, 109°21′–110°03′ E), situated in the Mu Us Sandy Land, northern China (Figure 1a), which encompasses an altitude ranging from 1145 to 1263 m. The climate type is temperate semiarid continental, with a mean annual temperature of 9.1 °C and mean annual precipitation of 420 mm, with over 70% of the rainfall occurring from July to September [32]. The main soil type in the study area is sandy primosols. Over the past few decades, the “Three-North Shelterbelt Forest Program” has been implemented in the study area to prevent severe desertification and wind erosion. The dominant vegetation type is Pinus sylvestris var. mongholica Litv., Amygdalus pedunculata Pall., Salix psammophila, Amorpha fruticosa L., and Artemisia desertorum Spreng (Figure 1b). Trees, shrubs, and grasses offer ideal fields for investigating the relationships between different vegetation types and soil quality.
Figure 1.
Location of the study area (a) and five typical vegetation types and bare sandy land in the Gechougou watershed (b). PS, AP, SP, AF, AD, and BS are Pinus sylvestris var. mongholica Litv., Amygdalus pedunculata Pall., Salix psammophila, Amorpha fruticosa L., Artemisia desertorum Spreng, and bare sandy land, respectively.
2.2. Data Collection and Analyses
All soil samples were collected in October 2023, 20 years after the vegetation restoration was implemented, which were collected from three similar and randomized plots (20 × 20 m) with five vegetation types and one BS. The study plots for each vegetation type were carefully selected to have highly similar topographic conditions (slope, aspect) and identical soil parent material to the greatest extent possible. The distance between sampling plots did not exceed 2 km. We surveyed the numbers of plant individuals in each 20 m × 20 m sample square and calculated the plant density accordingly. Litter thickness was measured using a ruler at each soil sampling site, and vegetation coverage was measured using a Nikon Z30 digital camera (Nikon Corporation, Tokyo, Japan) (Table 1). Five sampling points were selected from each plot by using the diagonal method. At each sampling point, soil samples were obtained from three layers (0–10, 10–20, and 20–30 cm) in the 0–30 cm profile. The SWC (%) was measured using an oven drying method at 105 °C for 24 h. Soil bulk density (BD, g cm−3) was determined using an undisturbed soil core (100 cm3). Soil texture (the content of clay, silt, and sand) was measured using a Mastersizer 3000 (Marvin, London, UK). Soil organic carbon content (SOC, g kg−1) was quantified using the potassium dichromate volumetric method (external heating method), total nitrogen content (TN, g kg−1) was measured by the Kjeldahl digestion method, and total phosphorus content (TP, g kg−1) was measured colorimetrically after digestion with HClO4-H2SO4. The Olsen phosphorus content (OP, mg kg−1) was measured using the Olsen method. Available potassium (AK) content (mg kg−1) was determined using a flame photometer. Ammonia nitrogen content (NH4+-N, mg kg−1) and nitrate nitrogen content (NO3−-N, mg kg−1) were measured using a continuous flow analyzer (AutoAnalyzer-AA3, Seal Analytical, Norderstedt, Germany). The soil pH was measured using the glass electrode method. For detailed measurement methods, please refer to Yang et al. (2021) [33]. The measure methods of litter properties (e.g., litter water content (LWC), litter organic carbon (LOC), litter total nitrogen (LN), and litter total potassium (LP)) were the same as those of soil samples.
Table 1.
Plant properties of different vegetation types.
2.3. Development of the SQI
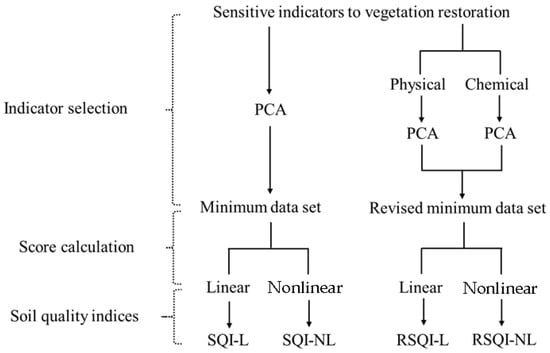
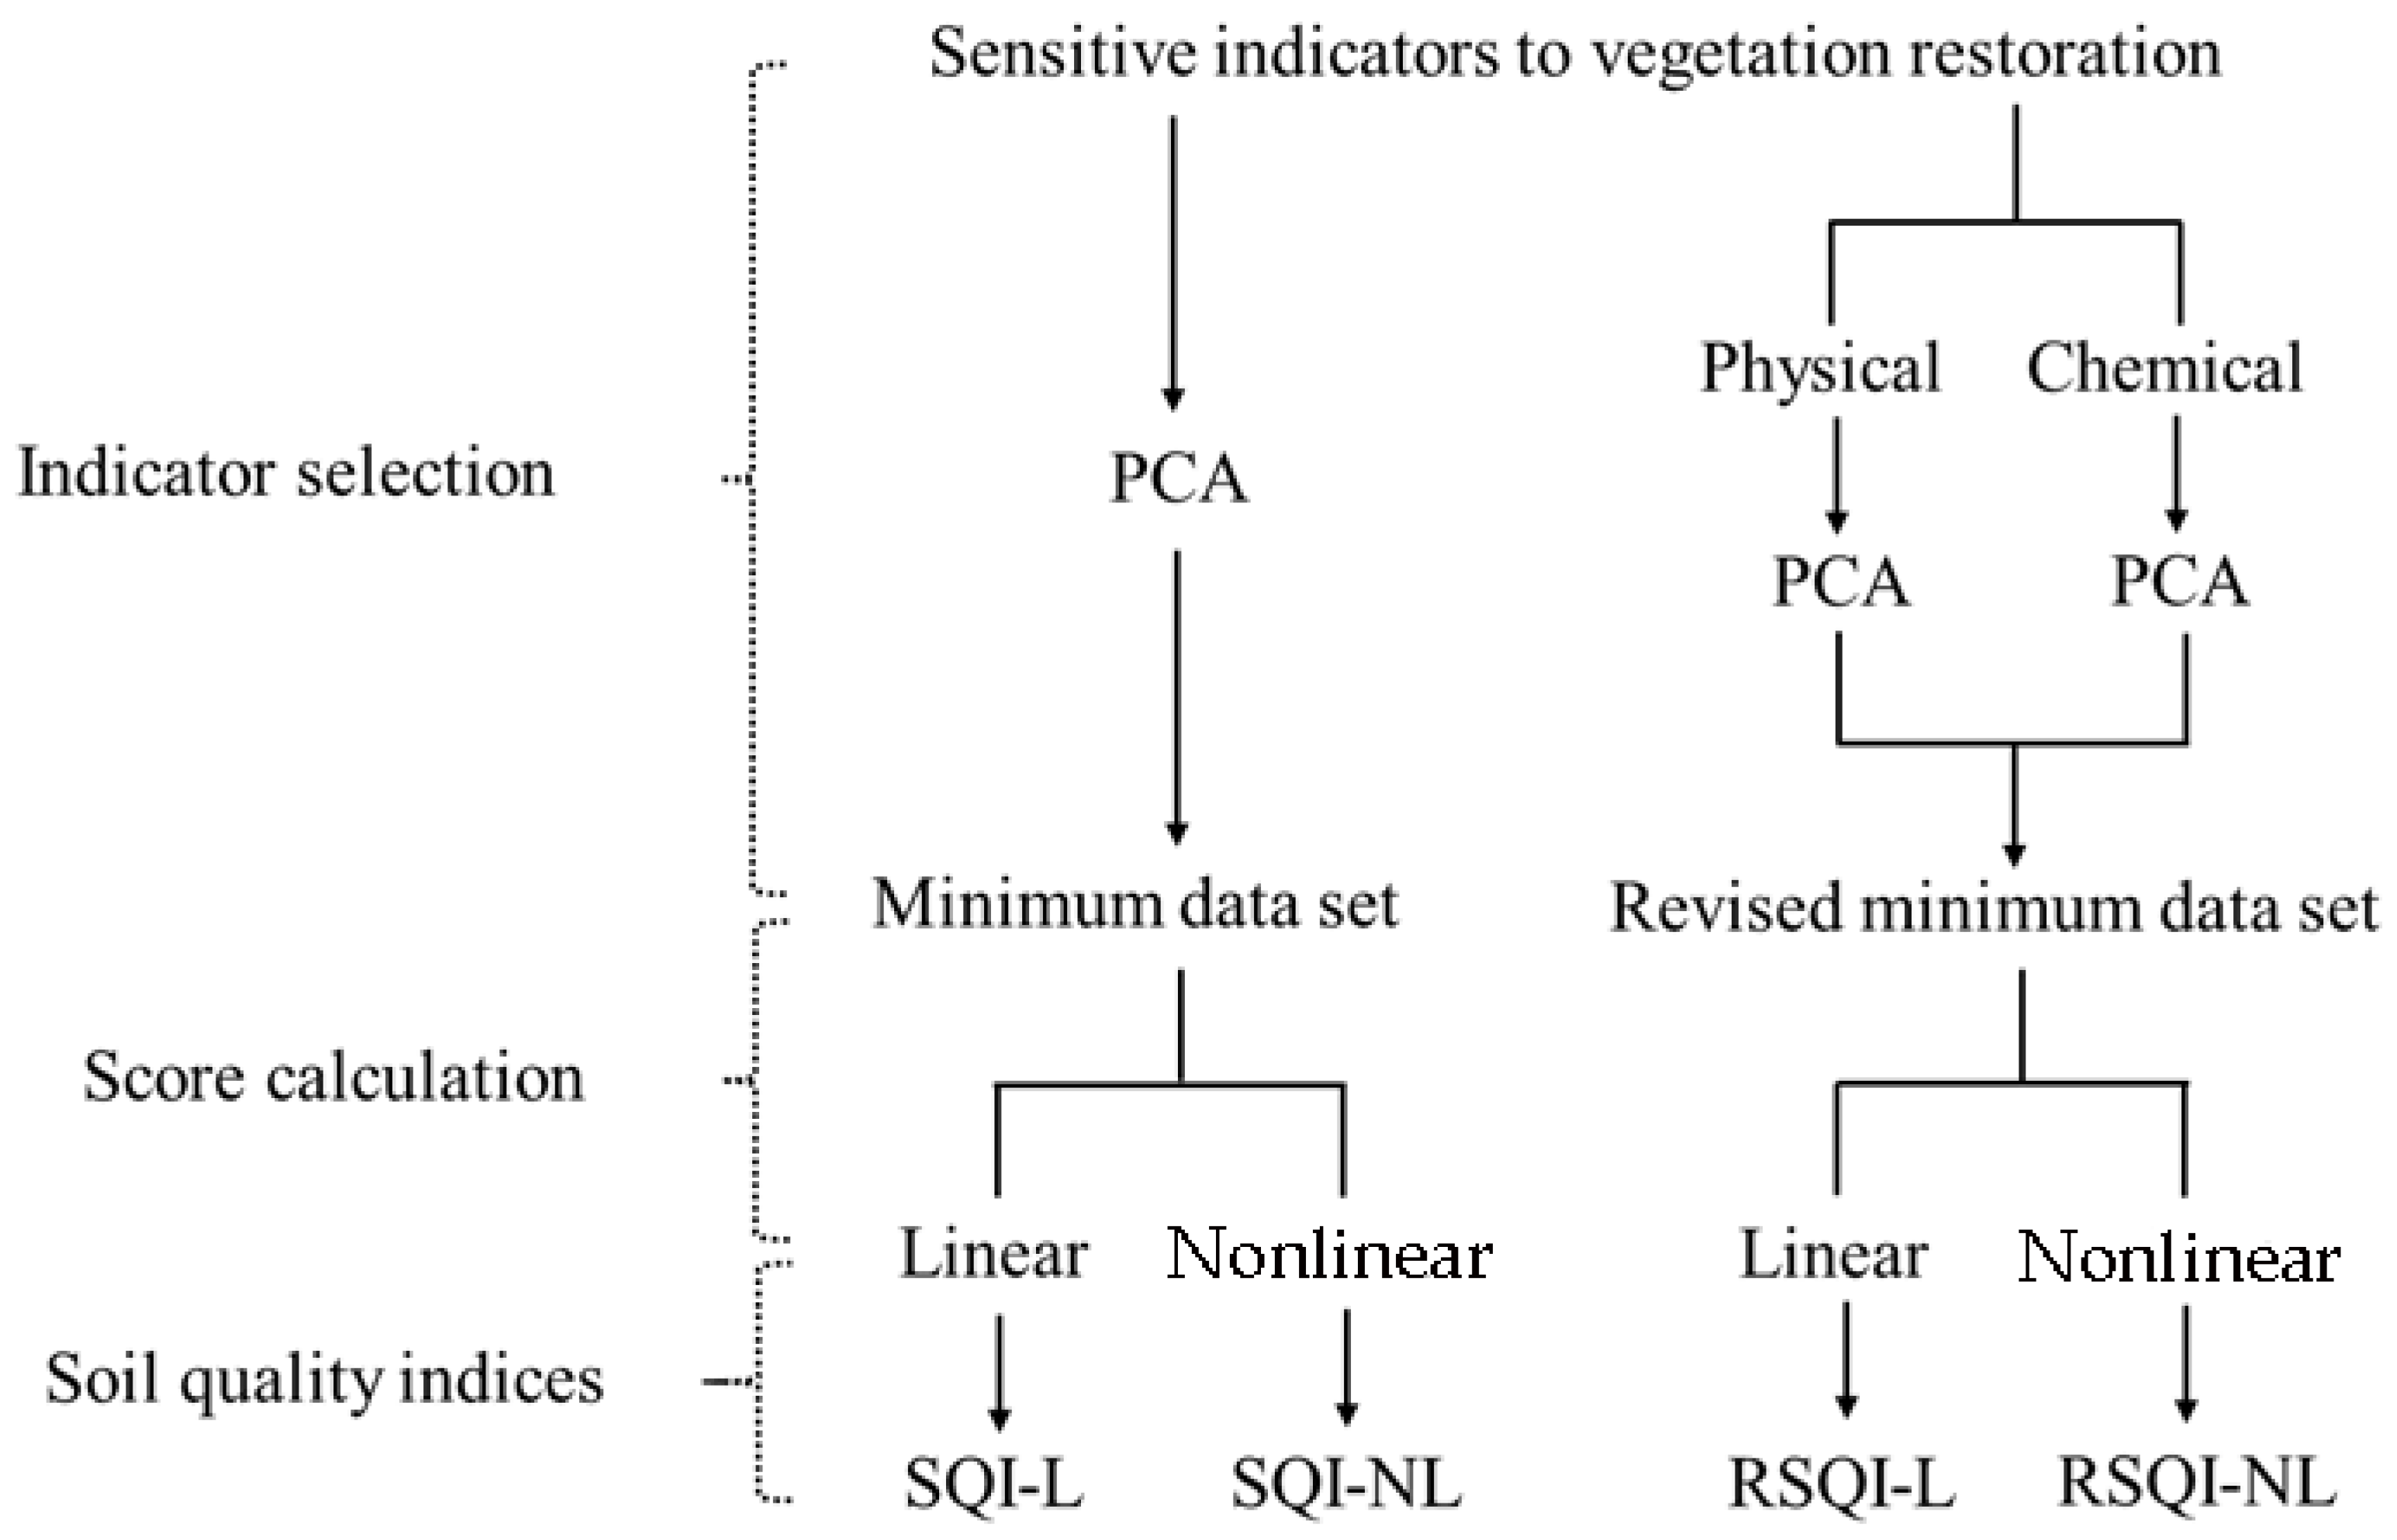
The study developed four distinct soil quality indices (SQIs) by different soil physical and chemical indicator selection and scoring methods in three steps (Figure 2). First, principal component analysis (PCA) was employed to identify important factors for constructing the minimum dataset (MDS) [34,35] and revising the minimum dataset (RMDS) [27].
Figure 2.
Diagram for the soil quality indices established in this study. PCA is principal component analysis, Linear and Nor-Linear are the linear scoring method and nonlinear scoring method, SQI-L, SQI-NL, RSQI-L, and RSQI-NL are the minimum dataset combined with the linear scoring method, the minimum dataset combined with the nonlinear scoring method, the revised minimum dataset combined with the linear scoring method, and the revised minimum dataset combined with the nonlinear scoring method, respectively.
Then, we used nonlinear and linear scoring functions to normalize these indicators [28]:
where SNL is the nonlinear score of the indicators, a = 1, x is the soil indicator value, x0 is the mean value of each soil indicator, and b = −2.5 for “more is better” or b = 2.5 for “less is better” [36], while SL is the linear score of the indicators, l and h are the minimum and maximum values of the soil indicators, respectively [37].
The weights (Wi) were calculated from the result of PCA [27]:
where Ci is the communality of soil physical and chemical indicators i and n is the number of soil physical and chemical indicators.
Finally, the SQI was calculated as follows [28,38]:
where the SQI is soil quality index, Si is the linear or nonlinear score of soil indicator i, n is the number of selected soil physical and chemical indicators in the MDS or RMDS, and Wi is the weight of soil indicator i.
2.4. Statistical Analysis
To determine the appropriateness of the SQIs for soil quality assessment in the semiarid sandy land of northern China, the sensitivity indices (SIs) of the four SQIs were calculated using the following equation [39,40]:
where SI is the sensitivity index of the SQI; a higher value indicates greater sensitivity to vegetation restoration. SQImax and SQImin are the maximum and minimum SQI values, respectively.
One-way analysis of variance (ANOVA) and Duncan’s test were employed to evaluate the variations in soil physicochemical properties and SQI among different vegetation types and soil depths. A two-way analysis of variance (ANOVA) was used to evaluate the effects of vegetation type, soil depth, and their interactions on soil physicochemical properties. Pearson’s correlation coefficients were calculated to examine the relationships between the 12 soil physicochemical properties. Redundancy analysis (RDA) was used to quantify the relationships between soil physicochemical properties and plant properties, and details can be found in Yang et al. (2021) [33]. All analyses were conducted by SPSS (version 26.0) and figures were created by the software of Origin 2021.
3. Results
3.1. Soil Physicochemical Properties Under Different Vegetation Types and BS
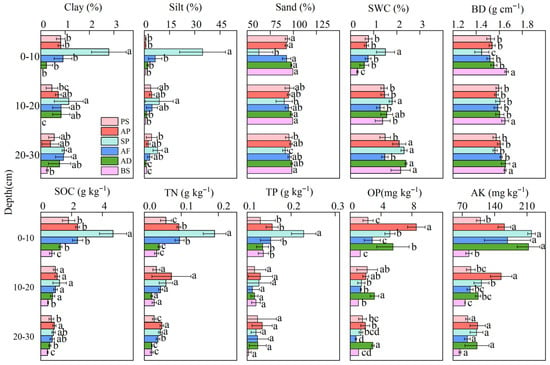
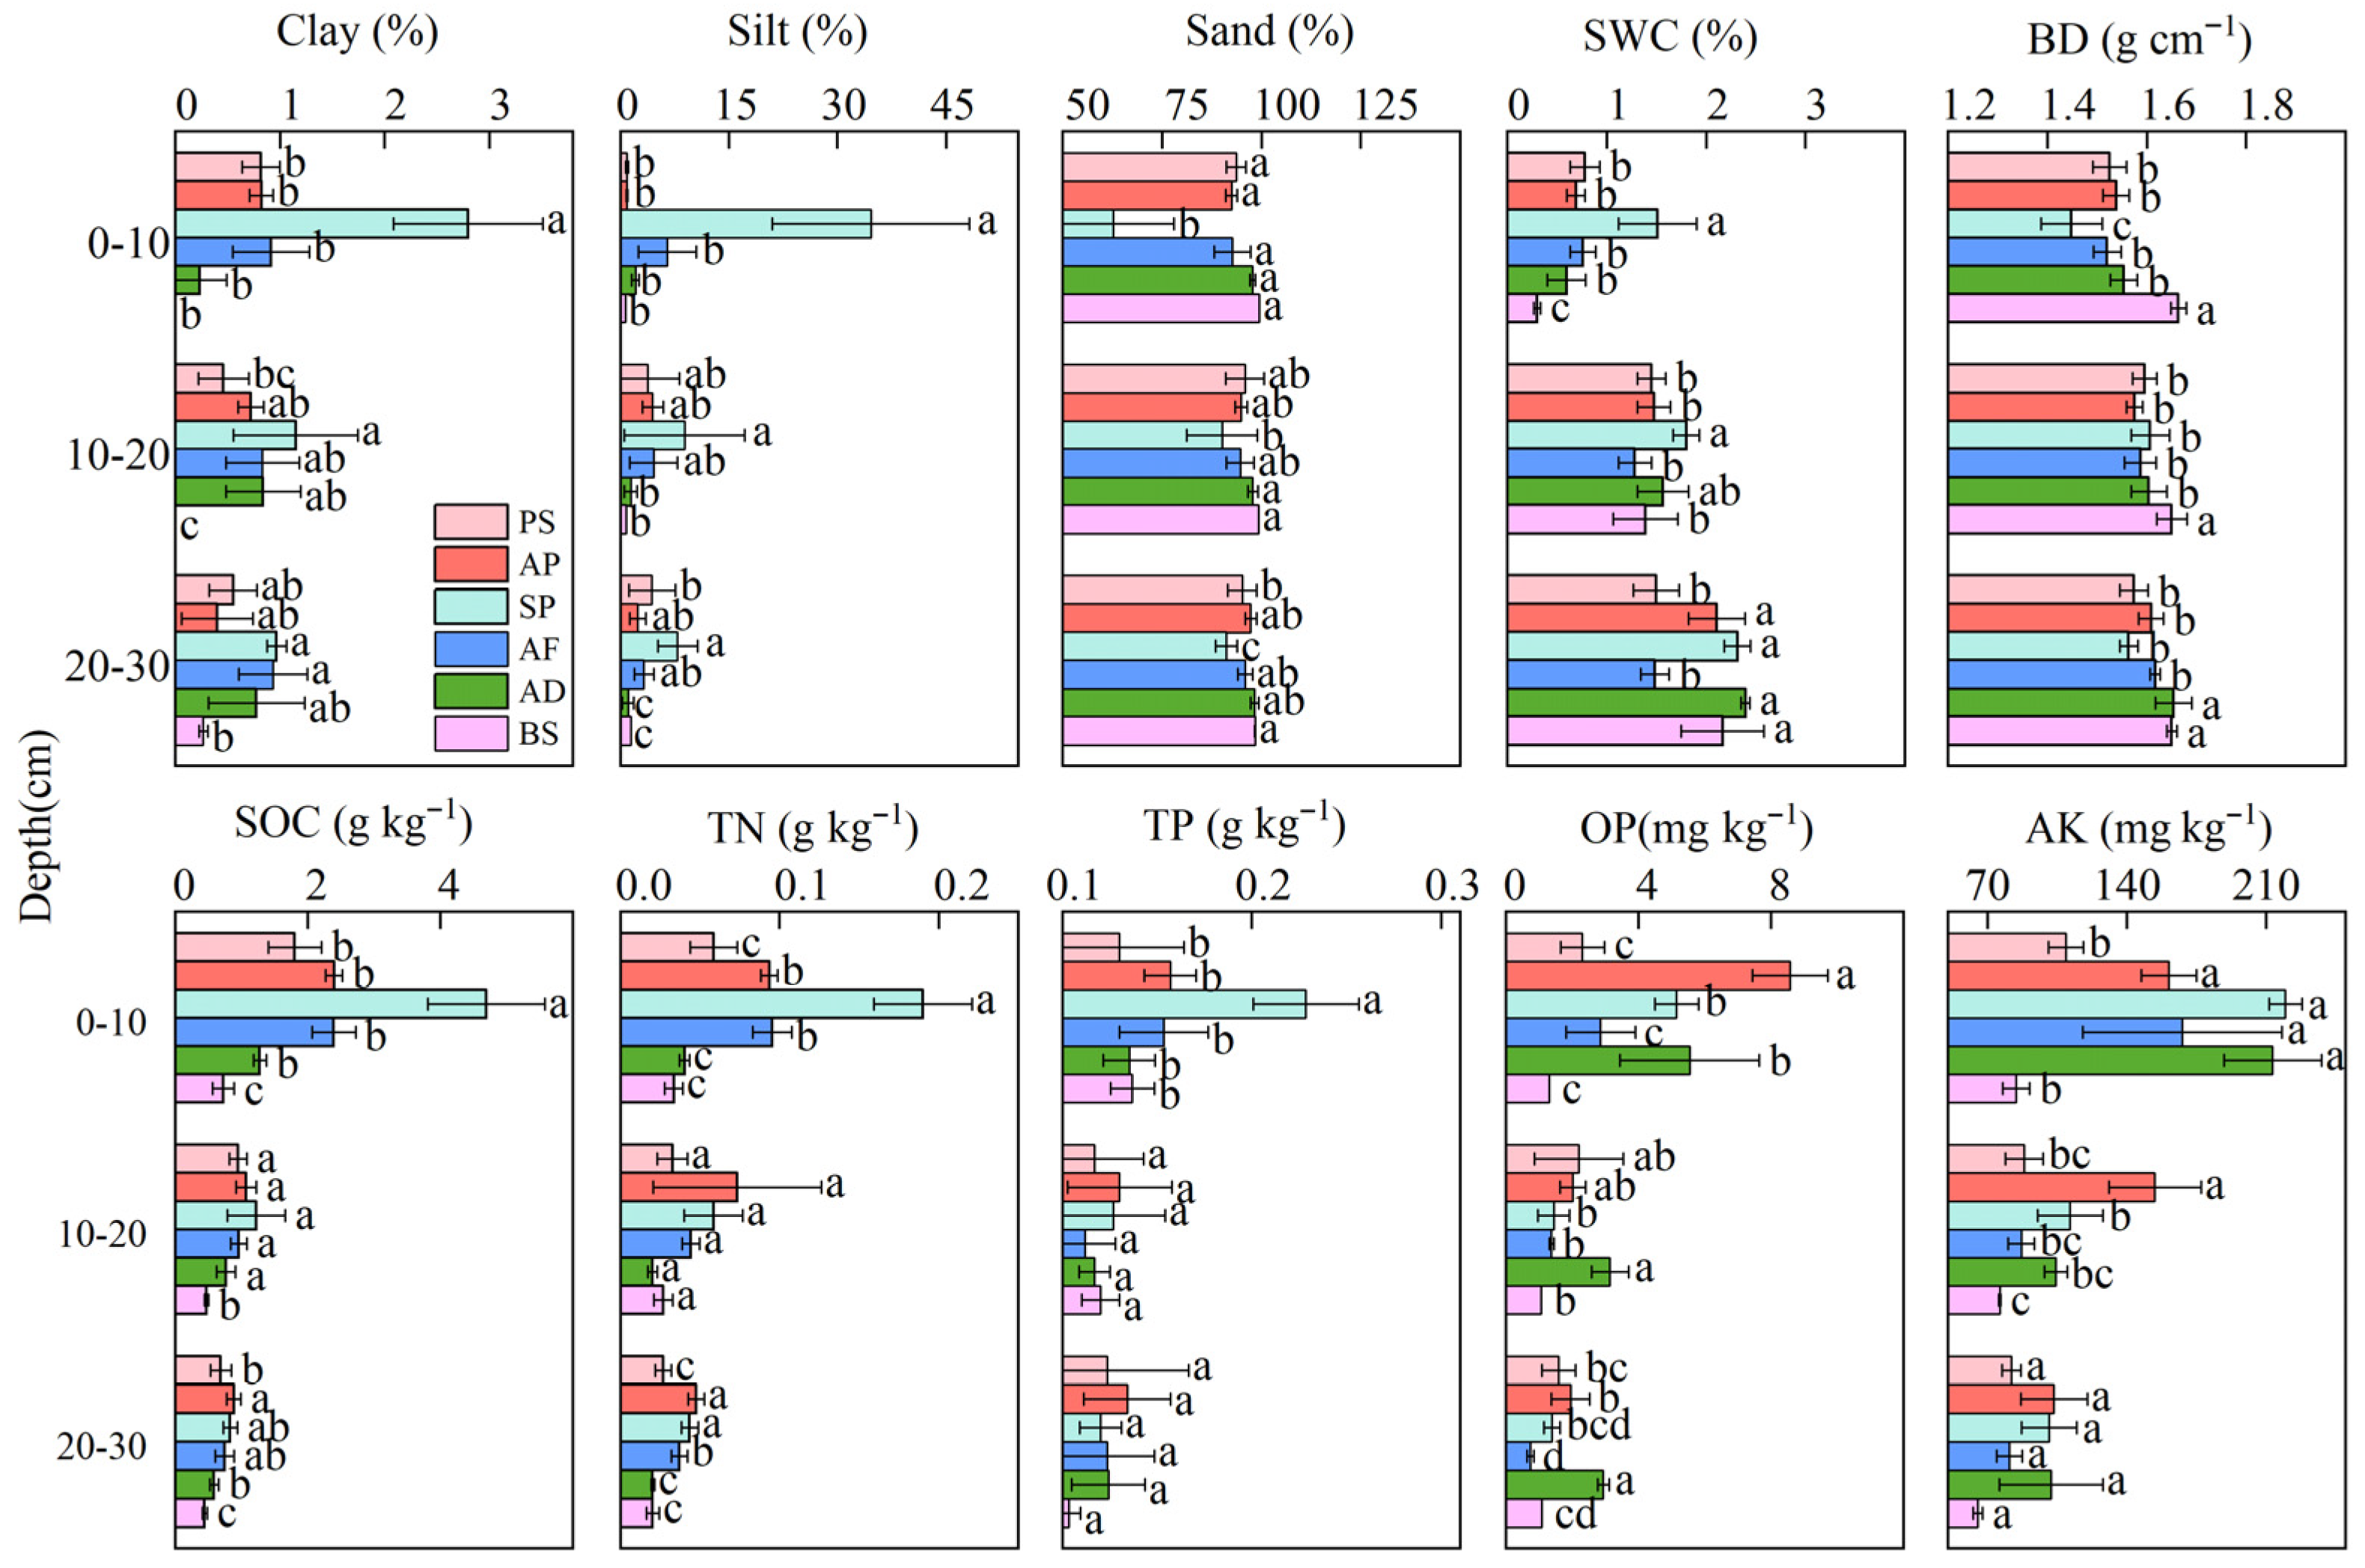
The soil physicochemical properties across the five vegetation types and the BS are shown in Figure 3. As soil pH, NH4+-N, and NO3−-N showed no significant differences among the vegetation types (Table 2, p > 0.05), Figure 3 does not display changes in these variables. Except for soil pH, TP, NO3−-N, and NH4+-N, other soil physicochemical properties showed significant differences among the various vegetation types and BS (Table 2). The clay, silt, SOC, TN, OP, and AK content decreased in the following order: shrubs (Amygdalus pedunculata Pall. (AP), Salix psammophila (SP), and Amorpha fruticosa L. (AF)) > trees (PS) > grass (AD) > BS, whereas the sand content and BD exhibited opposite trends, and the trend is most evident in the 0–10 cm soil layer. Specifically, the levels of clay, silt, SOC, and AK were significantly higher in AP, SP, AF, PS, and AD than in BS (p < 0.05). Notably, under SP, soil clay, silt, SWC, and SOC were significantly higher than that of the other vegetation types and BS (p < 0.05), whereas sand and BD had the lowest values. The coefficient of variation (CV) for the soil pH of different vegetation types and BS was 4.89%, indicating weak variation, whereas silt content exhibited high variability, with a CV of 143.83%. The CVs of other soil physicochemical properties showed a range of 10–100%, which reflects moderate variation.
Figure 3.
Profile distribution of soil physicochemical properties. For abbreviations of soil physicochemical properties, see Section 2.2. For the definitions of PS, AP, SP, AF, AD, and BS, see Figure 1. Data are means ± standard errors. According to Duncan’s test, different letters from among vegetation types within the same soil layers are significantly different at p < 0.05.
Table 2.
The results of soil physicochemical properties were influenced by five different vegetation types and BS (VT), soil depth (SD), and their interactions (VT × SD).
In the different soil layers, the soil clay content and chemical properties (SOC, TN, TP, OP, and AK) decreased with increasing soil depth in the following order: 0–10 cm > 10–20 cm > 20–30 cm (Figure 3). Except for soil clay content and pH, other soil physicochemical properties exhibited significant (p < 0.05) differences among soil layers (Table 2). In the 0–10 cm layer, the clay, silt, SWC, SOC, TN, and TP contents increased in the following order: shrubs (AP, SP, and AF) > trees (PS) > grass (AD) > bare sandy land (BS). However, no significant differences (p > 0.05) were observed between vegetation types and BS for soil TP in the 10–20 cm and 20–30 cm layers and soil AK in the 20–30 cm layer. Additionally, the interaction between the five vegetation types and BS (VT) and soil depth (SD) had a significant effect on the silt, sand, SWC, BD, SOC, TN, OP, and AK contents (p < 0.001).
3.2. Comparison of SQIs
Except for soil pH, which exhibited weak variation (CV < 10%), the other 12 soil physicochemical properties exhibited moderate to high variability (CV ≥ 10%) and were therefore included in the total dataset (TDS). For the MDS methods, the results of PCA showed that the initial three components collectively explained 77.08% of the total observed variability in the dataset, all of which had eigenvalues greater than one (Table 3). PC1 accounted for 52.44% of the variance, with SOC, silt, and sand exhibiting high loading values of 0.953, 0.898, and −0.896. Because of the significant correlations between SOC, silt, and sand (Table A1), SOC was retained in PC1. The SWC and NH4+-N were assigned to the second and third components, respectively. Finally, SOC, SWC, and NH4+-N were selected for the MDS. Similarly, two physical (sand and SWC) and two chemical properties (SOC and NO3−-N) were selected for the RMDS.
Table 3.
Principal component analysis results of 12 soil physicochemical properties.
Table A2 presents the parameters for the nonlinear and linear equations, as well as the weights of the soil physical and chemical indicators from the MDS and RMDS. The weights of the soil physical and chemical indicators in the MDS varied from 0.234–0.402. The weights of SWC and sand in the RMDS were 0.247 and 0.253, whereas those of SOC and NO3−-N were 0.254 and 0.246, respectively. Finally, the SQI and RSQI were established as follows:
SQI = (0.402 × SOC) + (0.234 × SWC) + (0.364 × NH4+-N)
RSQI = (0.253 × sand) + (0.247 × SWC) + (0.254 × SOC) + (0.246 × NO3−-N)
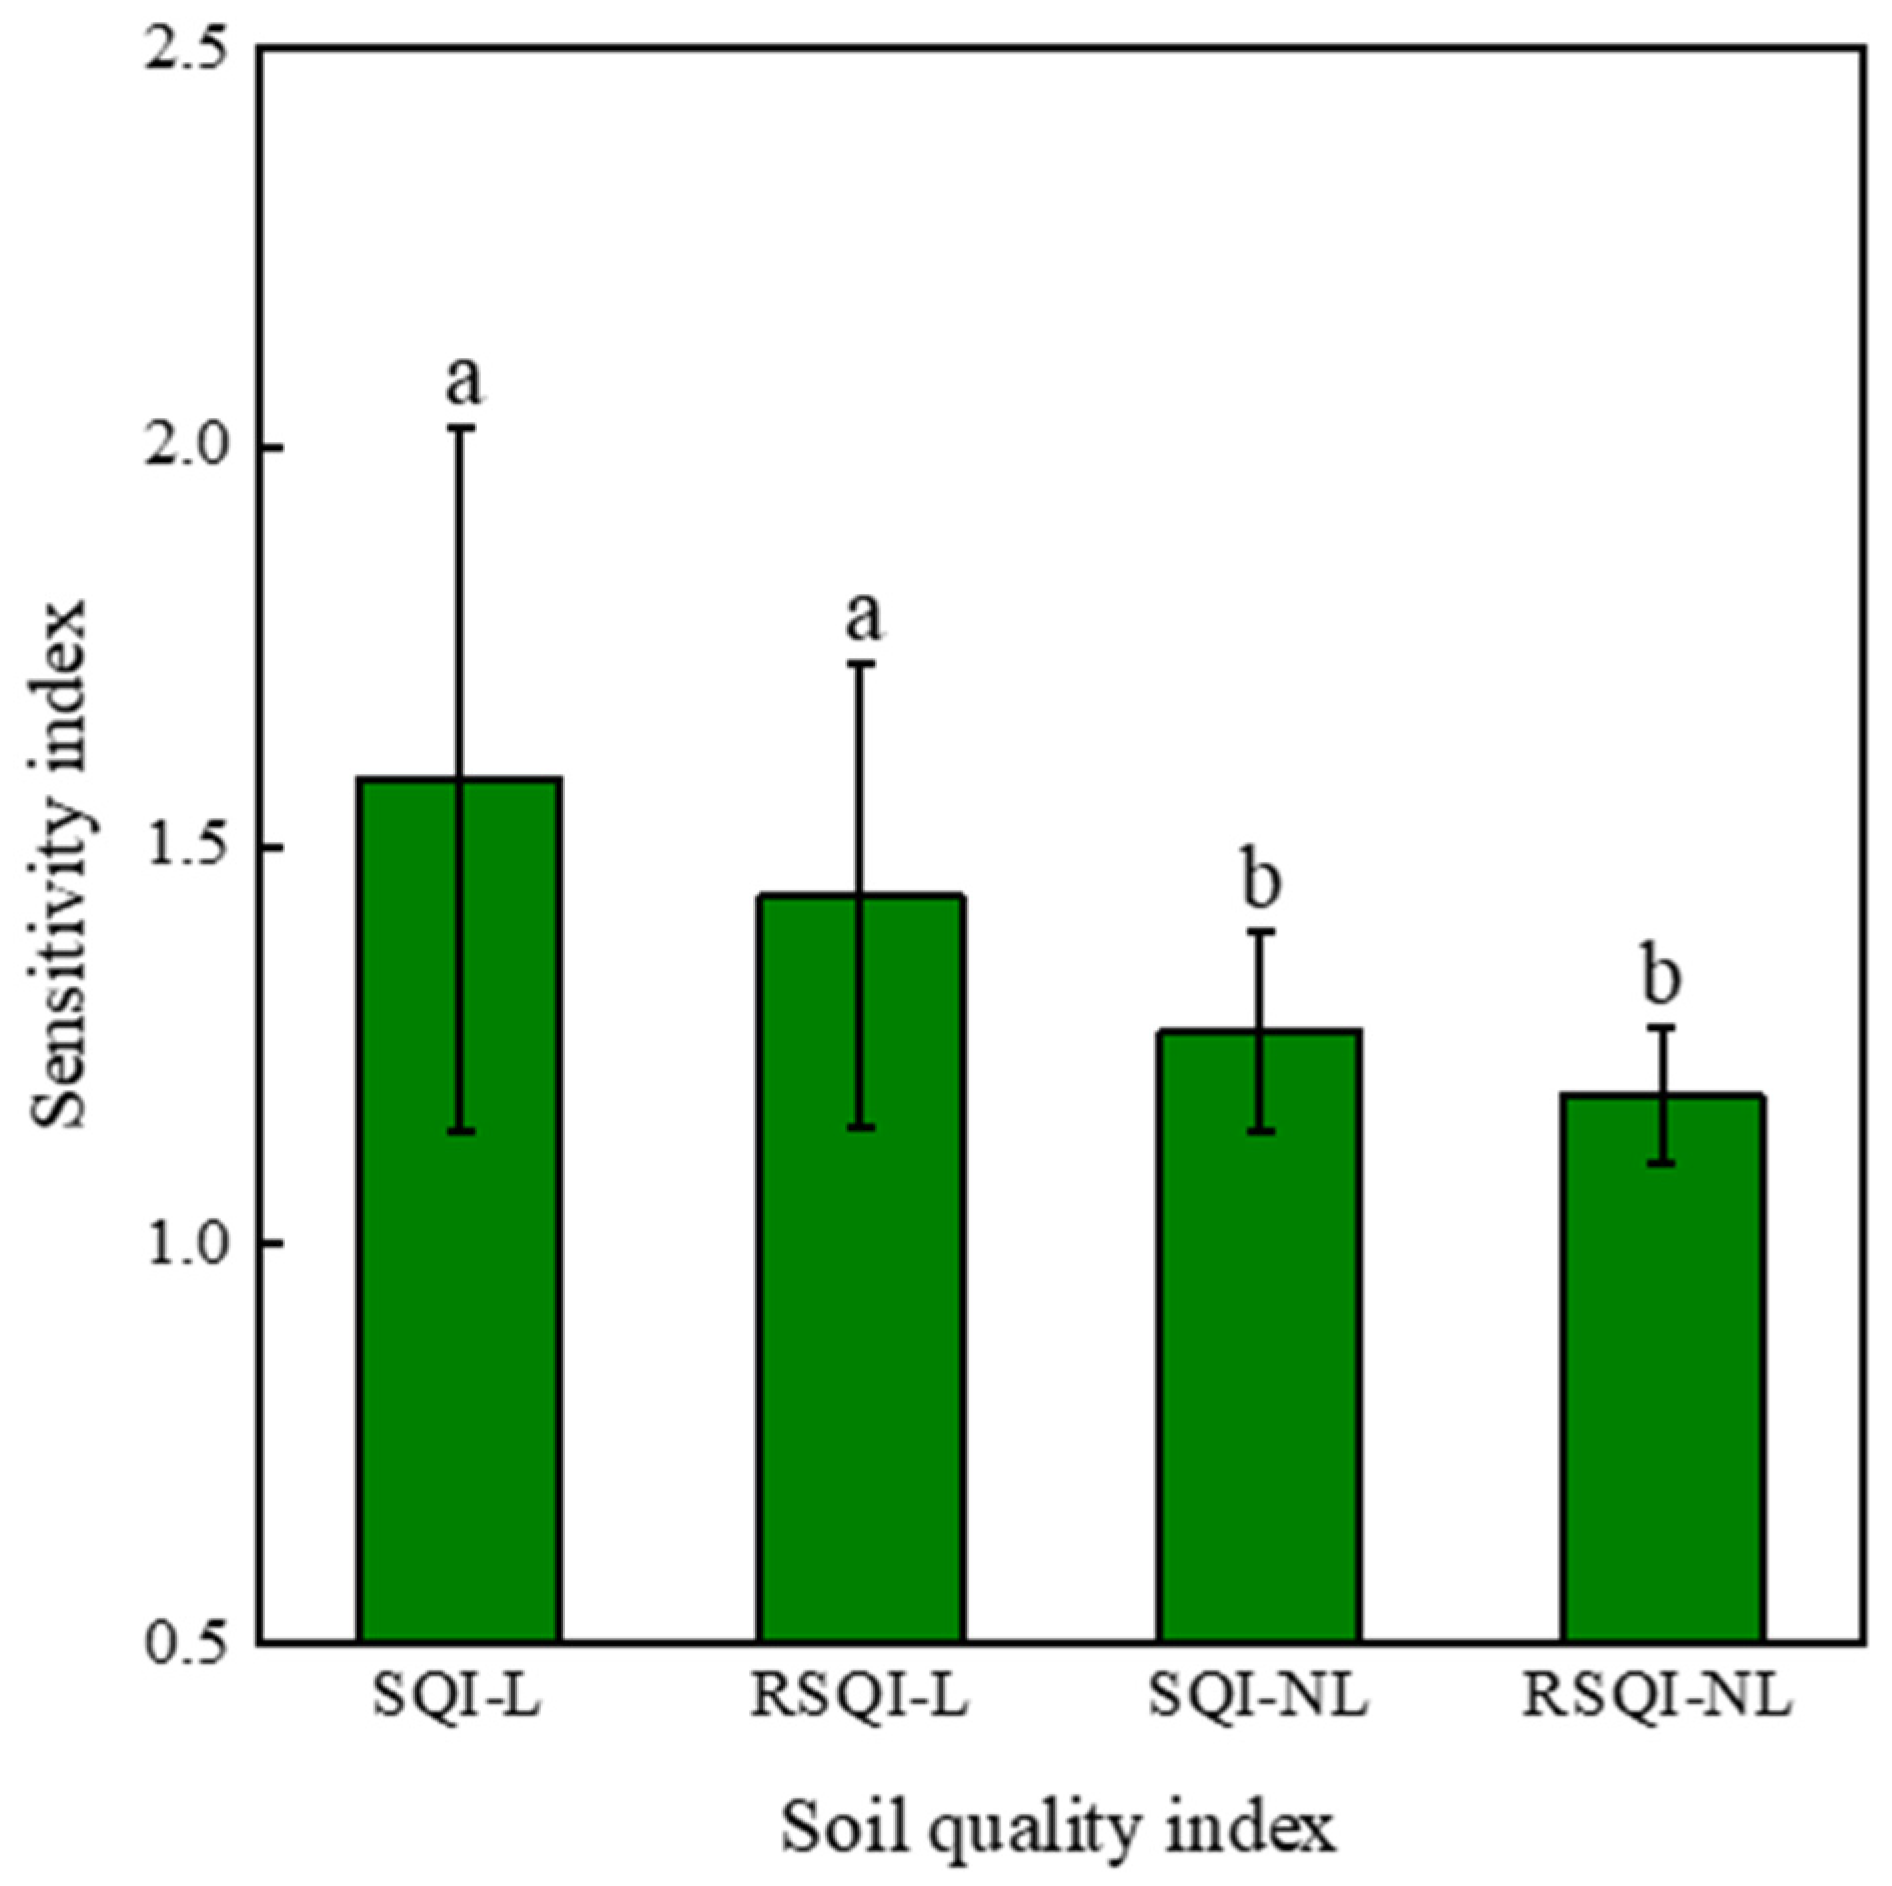
The SI values for the four SQIs were calculated using Equation (6). As shown in Figure A1, the SI values for both the SQI-L and RSQI-L were markedly greater than those of SQI-NL and RSQI-NL (p < 0.05), whereas no statistically significant disparities were observed between SQI-L and RSQI-L or between SQI-NL and RSQI-NL (p > 0.05).
3.3. SQI Across Vegetation Types and BS
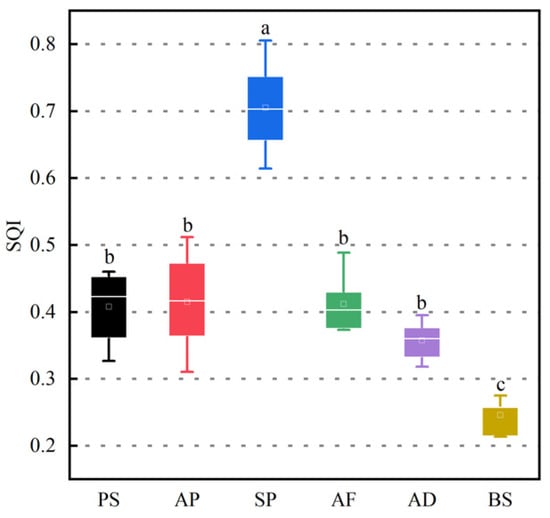
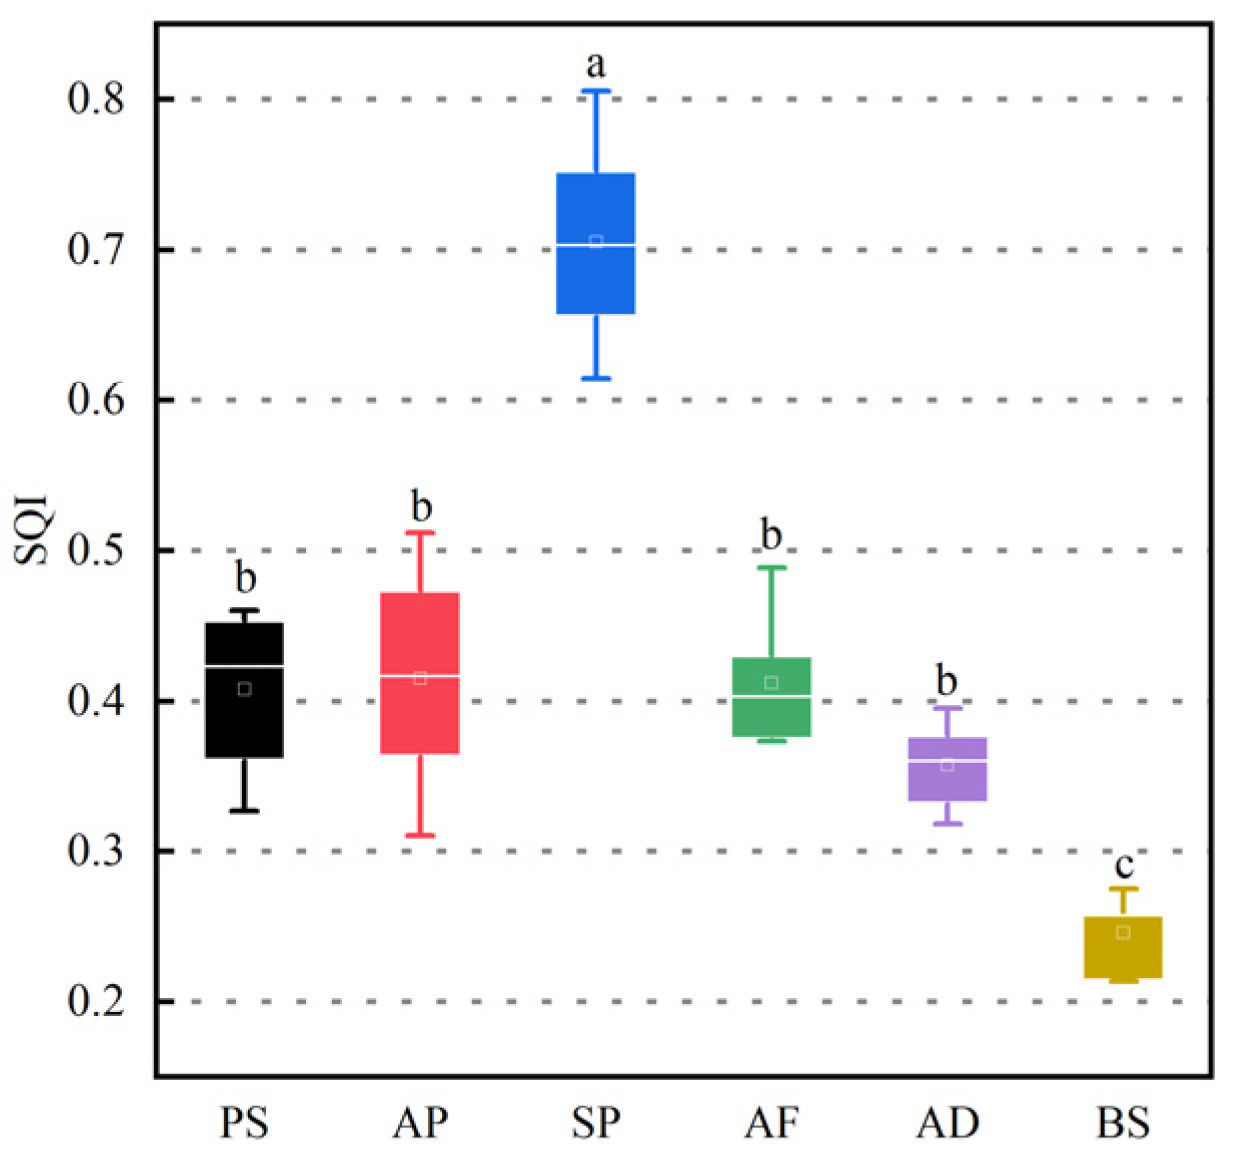
The SQI was calculated by the linear scoring equations and MDS, and these values of the different vegetation types and BS are shown in Figure 4. SP had the highest SQI (0.706 ± 0.069), followed by AP (0.416 ± 0.073) > AF (0.412 ± 0.044) > PS (0.408 ± 0.056) > AD (0.357 ± 0.029) > BS (0.246 ± 0.026). The SQI was significantly elevated in all five vegetation restoration types compared to BS, with the SP recording the highest value among all vegetation strategies (p < 0.05).
Figure 4.
SQI in different vegetation types and BS. For the definitions of PS, AP, SP, AF, AD, and BS, see Figure 1. According to Duncan’s test, different letters from among vegetation types are significantly different at p < 0.05.
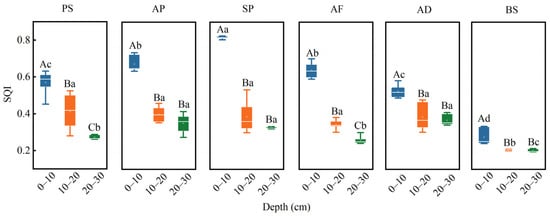
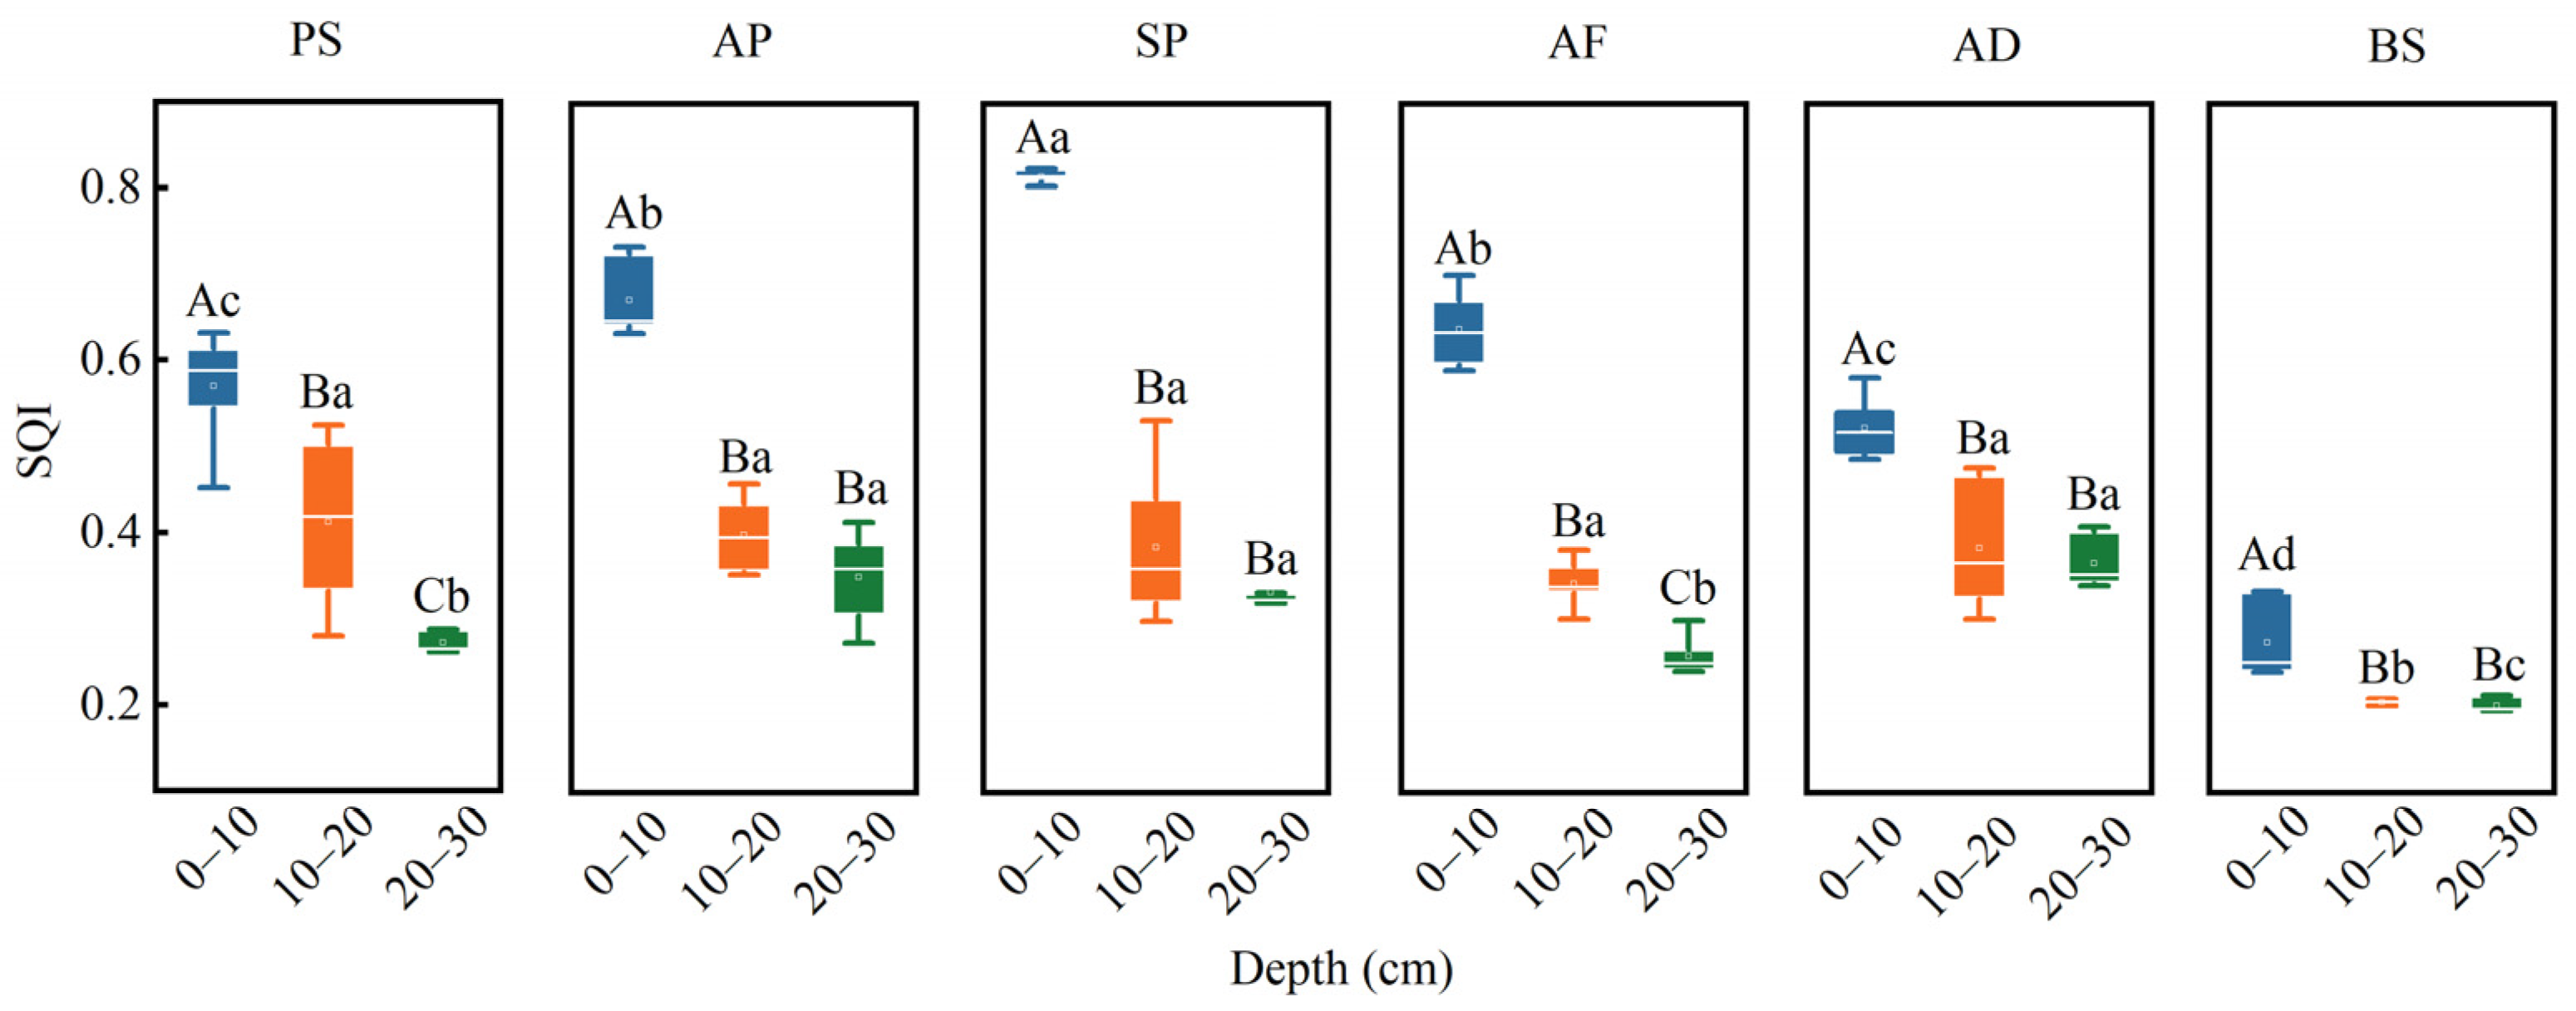
In the soil profile, the SQI values decreased as soil depth increased across different vegetation types and BS (Figure 5). The SQI of surface soils (0–10 cm) was significantly greater than that of the deeper layers (10–20 cm and 20–30 cm; p < 0.05), highlighting that soil quality improvements mainly occurred in the surface soil.
Figure 5.
Vertical variation in SQI of different vegetation types and BS. For the definitions of PS, AP, SP, AF, AD, and BS, see Figure 1. According to Duncan’s test, different uppercase letters indicate significant differences between soil layers for the same vegetation type and BS (p < 0.05). Different lowercase letters represent significant differences among the various vegetation types within the same soil layer (p < 0.05).
3.4. Relationships Between Vegetation Properties and Soil Physicochemical Properties
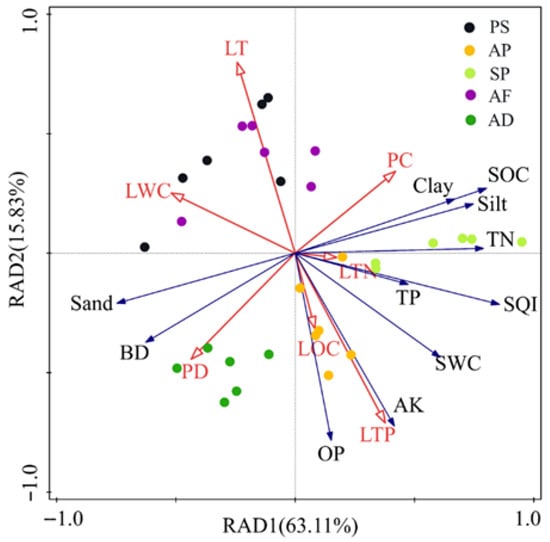
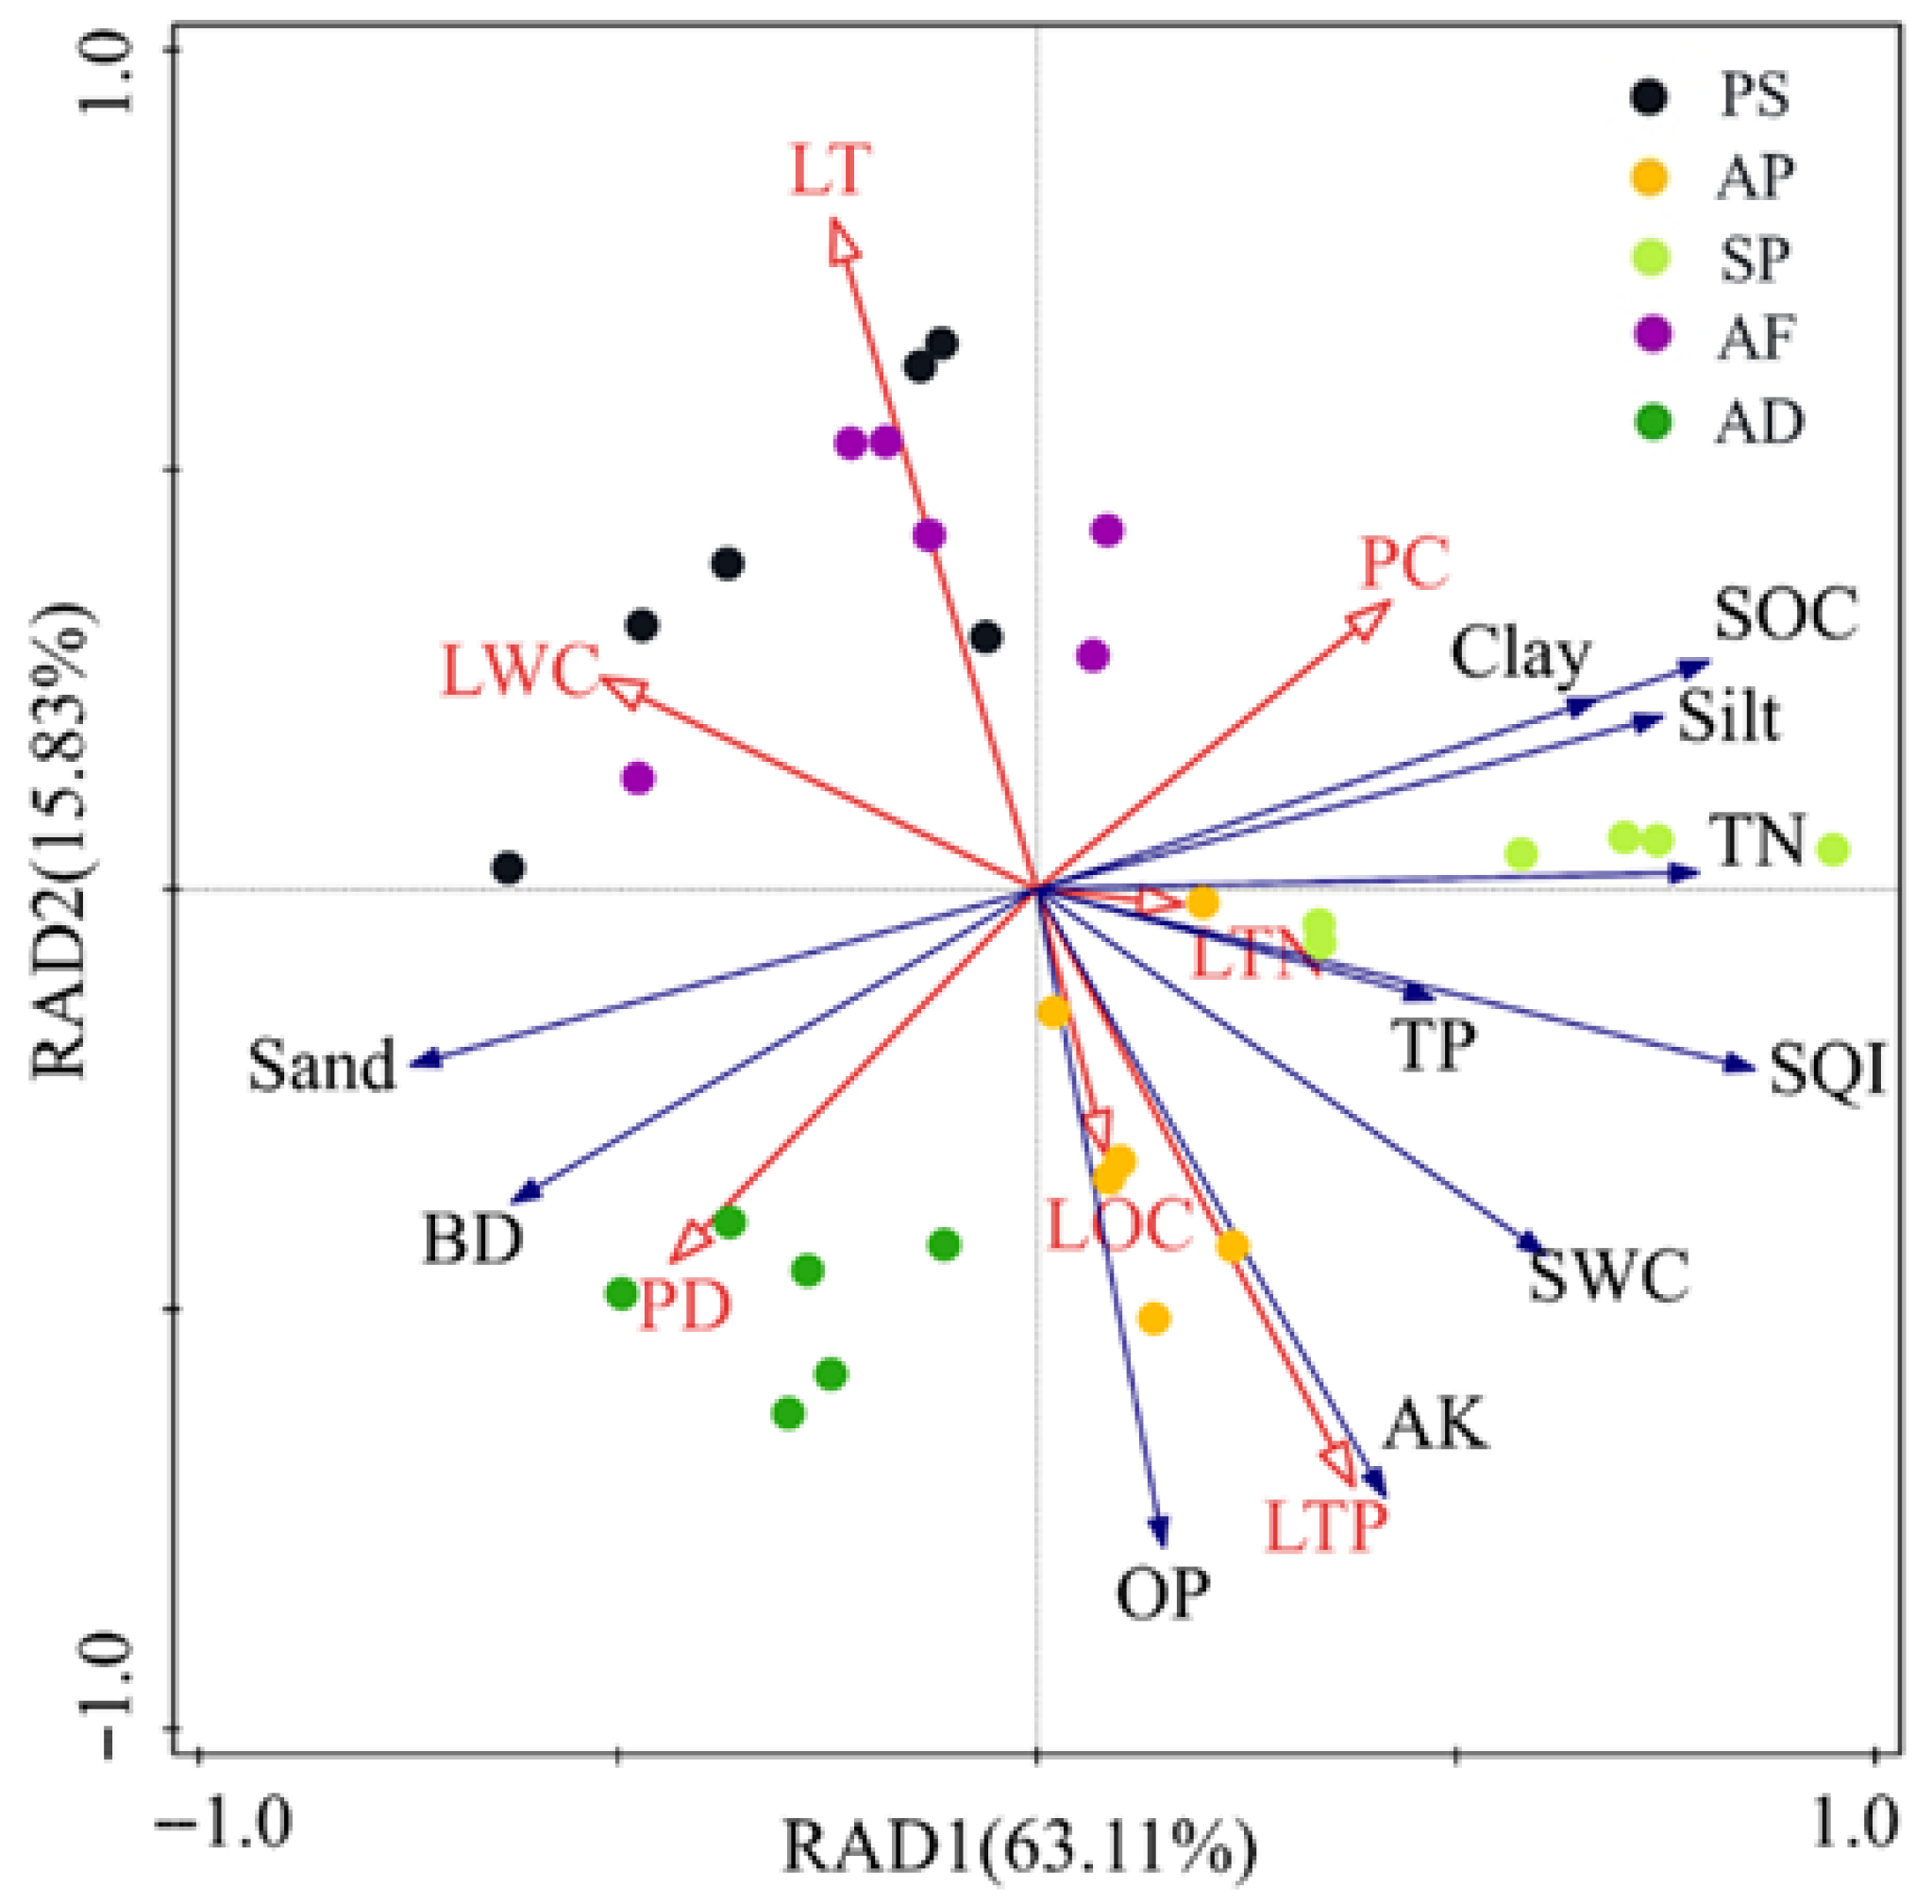
Based on the results of redundancy analysis, RDA1 and RDA2 collectively accounted for 63.11% and 15.83% of the total variance in soil physicochemical properties across various vegetation types (Figure 6). The results for the different vegetation types occupied different positions. This demonstrated significant differences in the key drivers of soil physicochemical properties among vegetation types. The soil physicochemical properties of SP were mainly affected by PC and LTN; AF and PS were mainly affected by LT and LWC; AD was mainly affected by PD; and AP was mainly affected by LOC and LTP.
Compared to other vegetation properties, LOC and LTN had a smaller influence on soil physicochemical properties. The Pearson correlation results (Table 4) further support this result, where LOC and LTN showed no significant relationship with any of the soil physicochemical properties (p > 0.05). In addition, PD was significantly positively correlated with sand and BD (p < 0.05). Conversely, the analysis revealed significant negative correlations with silt and SOC (p < 0.05). In contrast, PC showed an inverse relationship with the soil physicochemical properties. LT and LWC were significantly and negatively correlated with SWC and AK (p < 0.05). A significant positive correlation was identified between LTP and TN, OP, AK, and SQI (p < 0.05). Conversely, significant negative correlations were found for PD and LWC with SQI (p < 0.05).
Table 4.
Pearson correlation coefficients between vegetation properties and soil physicochemical properties.
4. Discussion
4.1. Effects of Vegetation Restoration on Soil Physicochemical Properties
Soil and vegetation, as the two fundamental elements of land-based ecosystems, form interdependent and restrictive relationships [33]. Vegetation restoration enhances vegetation cover, stabilizes sand dunes, and mitigates wind erosion [41,42,43]. These changes decrease the loss of fine soil particles (clay particles) and promote the gradual accumulation of silt, clay, and nutrients [44]. This is consistent with our results, showing that vegetation properties are closely related to soil physicochemical properties (Table 4). In this study, the results also showed notable increases in clay and silt content, together with increases in SOC, TN, AP, and AK compared to BS (Figure 3). In addition, a decrease in soil bulk density and an increase in soil clay content improved the soil structure and increased the soil water-holding capacity, which contributed to soil water conservation [45,46] and increased soil moisture across all the vegetation types (Figure 3). Our results demonstrate the vital role of vegetation restoration in soil nutrient accumulation and hydrological regulation, with the most pronounced effects observed in the surface soil (0–10 cm). It is important to note that the SQI developed in this study was based solely on soil physical and chemical properties. While these indicators are fundamental and have established relationships with soil functions, the inclusion of biological properties (e.g., microbial biomass, enzyme activities) would provide a more comprehensive evaluation of soil health. Future studies should aim to integrate such biological metrics to refine the SQI and better elucidate the mechanisms linking vegetation restoration to soil quality improvement.
Vegetation restoration significantly altered plant community structure and litter characteristics, and these vegetation properties were closely associated with soil physicochemical properties in our study area (Table 4). Similar studies have shown that these changes affect the dynamics of soil nutrients and water through microbial activity and rainfall redistribution [47,48,49]. Specifically, vegetation composition and litter properties exert direct control over soil nutrient cycling [33]. This regulation occurs through changes in the amount and quality of organic debris entering the soil, thereby governing microbial-driven decomposition processes and the subsequent rate of nutrient release [47]. Such alterations in plant cover impact hydrological processes within the soil by changing the partitioning of precipitation. For instance, an increased canopy density enhances rain interception and evaporative losses, whereas modifications to the litter layer affect the penetration of water into the soil and its subsequent storage [45]. Furthermore, root distribution affects the distribution, accumulation, and cycling of soil water and nutrients [33]. These factors jointly contributed to the differences in the soil physical and chemical properties among the different vegetation types in this study (Figure 3). These findings suggest that differences exist in soil nutrient and water consumption and accumulation caused by soil–plant interactions across different vegetation types [50].
4.2. Variation of SQI Values After Vegetation Restoration
The selection of suitable soil physical and chemical indicators and scoring methods is indispensable for an accurate evaluation of soil quality [24,51]. Our study indicated that both the MDS and the RMDS had better soil quality evaluations (Figure A1). This was because both the physical and chemical properties of the soil were included in the MDS. Conversely, when the MDS excludes physical properties, the SQI constructed using the RMDS is better than that constructed using the MDS [27]. In addition, linear scoring demonstrated better performance in this study (Figure A1). This is mainly due to the variability in the selection of indicators and the influence of their observational range [28,52].
The SQI results demonstrated a significant improvement in soil quality following vegetation restoration. In particular, the SQI values for trees and shrubs were higher than those for grass, indicating that tree and shrub plantations showed greater improvement in soil quality. This is likely related to soil water and nutrients improving in tree and shrub plantations compared to AD (Figure 3). Previous studies have also shown that lower SQI at grass sites is mainly attributed to a low level of soil organic matter [16,53]. Trees and shrubs had higher SOC contents in this study (Figure 3). In addition, surface soils (0–10 cm) had higher SQI values than deeper soils (10–30 cm), suggesting that vegetation restoration has a greater impact on surface soil quality. These findings verify that the stratification patterns of soil quality in previous studies might be due to the layered accumulation of plant litter and activity of soil microorganisms [54,55,56]. Plant litter contributes to the SOC accumulation, which is composed of different organic compounds and is essential for SOC cycling of soil organic carbon, thereby enhancing soil quality [16,57].
4.3. Implications for Vegetation Restoration
As a key ecological project, vegetation restoration contributes significantly to improving soil conditions, and these enhancements have beneficial effects on vegetation growth, highlighting that vegetation restoration is inseparable from improvements in soil physicochemical properties in this ecologically fragile region [52,58]. We found that decades of vegetation restoration substantially enhanced the soil conditions. Improvements in soil physicochemical properties were associated with litter thickness and water content, which significantly affected the soil water and nutrients (Table 4). Soil water is a critical resource for plant growth and directly affects transpiration and photosynthetic efficiency [32,33]. Furthermore, after vegetation restoration, the interactions between plant roots and microbial activity accelerate litter decomposition and enrich soil nutrient pools, which are important processes in ecosystem biogeochemical cycles and energy fluxes [47,59,60]. Sandy land has relatively low soil water and nutrient levels [61]. Thus, in this arid area, vegetation restoration is essential to improve soil quality and guarantee sustainable vegetation growth.
The soil physicochemical quality of semiarid sandy land was improved by vegetation restoration. In particular, SP had a more significant impact on soil quality in the study region than the other vegetation types, as evidenced by its higher SQI value (Figure 4). This is mainly because SP has higher plant coverage, lower plant density, and lower litter water content (Table 1). Low vegetation density can reduce competition for water and nutrients among plants [62]. A strong positive relationship was observed between plant coverage and key soil parameters, including silt content, clay content, and SOC (Table 4). High SP coverage effectively reduced wind erosion and increased the accumulation of fine soil particles (clay and silt) and nutrients. Additionally, we identified a statistically significant negative correlation between LWC and SWC. This result further supports our research finding that the litter water content of SP was lower than that of the other vegetation types, whereas its SWC was higher. This may be attributed to the fact that the positive effect of its thinner litter layer on water infiltration outweighs the potential negative effect of canopy interception from high vegetation cover. This conclusion is supported by two lines of evidence. First, Table 4 revealed a significant negative correlation between litter thickness and soil water content, whereas plant cover showed no significant correlation. Second, previous studies confirmed that approximately 70% of total precipitation reaches the forest floor as throughfall, and only 20% of precipitation was intercepted by the canopy, which indicated more precipitation infiltration into the soil profile than intercepted [63]. These factors collectively contributed to SP’s higher SWC and SOC in the present study (Figure 3). Both SOC and SWC, which together accounted for 68.04% of the variance in the soil physical and chemical indicators, were chosen as critical indicators for the soil quality assessment (Table 3). Consequently, SOC and SWC are pivotal indicators for assessing vegetation restoration outcomes in the semiarid sandy lands of northern China, as their concurrent improvements resulted in a significantly higher SQI for SP.
5. Conclusions
In sandy lands, soils are characterized by poor structure and low nutrient content, making methods and mechanisms for improving soil quality a critical concern for desertification control and regional ecological restoration. In this study, although vegetation restoration significantly enhanced soil quality, its effects were primarily observed on soil physical properties (soil clay, silt, water content, and bulk density) and organic carbon content, with limited improvements in soil nutrients (total phosphorus, ammonia nitrogen, and nitrate nitrogen content). These improvements were more significant in the surface soil layer (0–10 cm) than in deeper soil layers (10–30 cm). The SQI, which was derived from the minimum dataset and line scoring, demonstrated the best sensitivity and suitability for the evaluation of semiarid sandy land soil quality. Notably, SOC and SWC were consistently selected as critical indicators in the SQI calculation. The improvements in soil quality were closely related to vegetation properties (density and coverage) and litter characteristics (thickness, water content, and total phosphorus). To improve soil quality in revegetated sandy lands, greater emphasis should be placed on species selection, particularly regarding interspecies differences in litter production, physicochemical properties, and canopy characteristics, as well as planting density, in the formulation of sandy land management and vegetation restoration strategies.
Author Contributions
Conceptualization, P.Z.; methodology, X.B.; software, P.Z. and X.B.; validation, M.S. and C.Z.; formal analysis, P.Z. and C.Z.; investigation, P.Z.; resources, C.Z.; data curation, P.Z. and X.B.; writing—original draft preparation, P.Z.; writing—review and editing, M.S., and C.Z.; visualization, P.Z. supervision, M.S. and C.Z.; project administration, M.S.; funding acquisition, C.Z. All authors have read and agreed to the published version of the manuscript.
Funding
This study was supported by the Chinese Academy of Sciences.
Data Availability Statement
The raw data supporting the conclusions of this article will be made available by the authors on request.
Acknowledgments
We thank Yinglong Zhang for the support to collect samples in the field. We are grateful to the editors and anonymous reviewers for their constructive comments and suggestions during this review phase of this paper.
Conflicts of Interest
The authors declare no conflicts of interest.
Abbreviations
The following abbreviations are used in this manuscript:
| PS | Pinus sylvestris var. mongholica Litv. |
| AP | Amygdalus pedunculata Pall. |
| SP | Salix psammophila |
| AF | Amorpha fruticosa L. |
| AD | Artemisia desertorum Spreng. |
| BS | Bare sandy land |
| SQI | Soil quality index |
| MSD | Minimum dataset |
| RMSD | Revising the minimum dataset |
| SI | Sensitivity index of the SQI |
| PCA | Principal component analysis |
| SWC | Soil water content |
| BD | Soil bulk density |
| SOC | Soil organic carbon content |
| TN | Total nitrogen content |
| TP | Total phosphorus content |
| OP | Olsen phosphorus content |
| AK | Available potassium content |
| NH4+-N | Ammonia nitrogen content |
| NO3−-N | Nitrate nitrogen content |
| PD | Plant density |
| PC | Plant coverage |
| LT | Litter thickness |
| LWC | Litter water content |
| LOC | Litter organic carbon |
| LTN | Litter total nitrogen |
| LTP | Litter total potassium |
Appendix A
Table A1.
Pearson correlation coefficients between the soil physicochemical properties.
Table A2.
The model coefficients of nonlinear and linear equations and the weights for the soil physical and chemical indicators in the minimum and revised minimum datasets.
Figure A1.
Sensitivity index (SI) of the soil quality indices. Different letters indicate significant differences among the different soil quality indices (p < 0.05). Error bars are the standard error.
References
- Gao, G.L.; Ding, G.D.; Zhao, Y.Y.; Wu, B.; Zhang, Y.Q.; Qin, S.G.; Bao, Y.F.; Yu, M.H.; Liu, Y.D. Fractal approach to estimating changes in soil properties following the establishment of Caragana korshinskii shelterbelts in Ningxia, NW China. Ecol. Indic. 2014, 43, 236–243. [Google Scholar] [CrossRef] [Scilit]
- Huang, J.P.; Zhang, G.L.; Zhang, Y.T.; Guan, X.D.; Wei, Y.; Guo, R.X. Global desertification vulnerability to climate change and human activities. Land Degrad. Dev. 2020, 31, 1380–1391. [Google Scholar] [CrossRef] [Scilit]
- Reynolds, J.F.; Smith, D.M.S.; Lambin, E.F.; Turner, B.L.; Mortimore, M.; Batterbury, S.P.J.; Downing, T.E.; Dowlatabadi, H.; Femandez, R.J.; Herrick, J.E. Global desertification: Building a science for dryland development. Science 2007, 316, 847–851. [Google Scholar] [CrossRef] [Scilit]
- Bryan, B.A.; Gao, L.; Ye, Y.; Sun, X.; Connor, J.D.; Crossman, N.D.; Stafford-Smith, M.; Wu, J.; He, C.; Yu, D.; et al. China’s response to a national land-system sustainability emergency. Nature 2018, 559, 193–204. [Google Scholar] [CrossRef] [Scilit] [PubMed]
- Ge, J.M.; Wang, S.; Fan, J.; Gongadze, K.; Wu, L.H. Soil nutrients of different land use types and topographic positions in the water-wind erosion crisscross region of China’s Loess Plateau. Catena 2020, 184, 104243. [Google Scholar] [CrossRef] [Scilit]
- Qi, Y.B.; Chen, T.; Pu, J.; Yang, F.Q.; Shukla, M.K.; Chang, Q.R. Response of soil physical, chemical and microbial biomass properties to land use changes in fixed desertified land. Catena 2018, 160, 339–344. [Google Scholar] [CrossRef] [Scilit]
- Xu, D.Y.; Zhang, X. Multi-scenario simulation of desertification in North China for 2030. Land. Degrad. Dev. 2021, 32, 1060–1074. [Google Scholar] [CrossRef] [Scilit]
- Xiu, L.; Yan, C.Z.; Li, X.S.; Qian, D.; Feng, K. Monitoring the response of vegetation dynamics to ecological engineering in the Mu Us Sandy Land of China from 1982 to 2014. Environ. Monit. Assess. 2018, 190, 543. [Google Scholar] [CrossRef] [Scilit]
- Lei, S.H.; Jia, X.X.; Zhao, C.L.; Shao, M.A. A review of saline-alkali soil improvements in China: Efforts and their impacts on soil properties. Agric. Water Manag. 2025, 317, 109617. [Google Scholar] [CrossRef] [Scilit]
- Cortois, R.; Schröder-Georgi, T.; Weigelt, A.; van der Putten, W.H.; De Deyn, G.B. Plant–soil feedbacks: Role of plant functional group and plant traits. J. Ecol. 2016, 104, 1608–1617. [Google Scholar] [CrossRef] [Scilit]
- Mariotte, P.; Mehrabi, Z.; Bezemer, T.M.; De Deyn, G.B.; Kulmatiski, A.; Drigo, B.; Veen, G.F.; van der Heijden, M.G.A.; Kardol, P. Plant–Soil Feedback: Bridging Natural and Agricultural Sciences. Trends Ecol. Evol. 2018, 33, 129–142. [Google Scholar] [CrossRef] [Scilit]
- D’Odorico, P.; Caylor, K.; Okin, G.S.; Scanlon, T.M. On soil moisture–vegetation feedbacks and their possible effects on the dynamics of dryland ecosystems. J. Geophys. Res. 2007, 112, G04010. [Google Scholar] [CrossRef] [Scilit]
- Li, Q.X.; Jia, Z.Q.; Liu, T.; Feng, L.L.; He, L.X.Z. Effects of different plantation types on soil properties after vegetation restoration in an alpine sandy land on the Tibetan Plateau, China. J. Arid Land 2017, 9, 200–209. [Google Scholar] [CrossRef] [Scilit]
- Negis, H.; Seker, C.; Gümüs, I.; Erci, V. Establishment of a minimum data set and soil quality assessment for multiple reclaimed areas on a wind-eroded region. Catena 2023, 229, 107208. [Google Scholar] [CrossRef] [Scilit]
- Li, X.R.; He, M.Z.; Duan, Z.H.; Xiao, H.L.; Jia, X.H. Recovery of topsoil physicochemical properties in revegetated sites in the sand-burial ecosystems of the Tengger Desert, northern China. Geomorphology 2007, 88, 254–265. [Google Scholar] [CrossRef] [Scilit]
- Zhang, Y.H.; Wang, L.; Jiang, J.; Zhang, J.C.; Zhang, Z.M.; Zhang, M.X. Application of soil quality index to determine the effects of different vegetation types on soil quality in the Yellow River Delta wetland. Ecol. Indic. 2022, 141, 109116. [Google Scholar] [CrossRef] [Scilit]
- Jiao, F.; Wen, Z.M.; An, S.S. Changes in soil properties across a chronosequence of vegetation restoration on the Loess Plateau of China. Catena 2011, 86, 110–116. [Google Scholar] [CrossRef] [Scilit]
- Zhang, C.; Xue, S.; Liu, G. A comparison of soil qualities of different revegetation types in the Loess Plateau, China. Plant Soil 2011, 347, 163–178. [Google Scholar] [CrossRef] [Scilit]
- Gao, Y.; Dang, P.; Zhao, Q. Effects of vegetation rehabilitation on soil organic and inorganic carbon stocks in the Mu Us Desert, northwest China. Land. Degrad. Dev. 2018, 29, 1031–1040. [Google Scholar] [CrossRef] [Scilit]
- Lin, M.; Hou, L.Z.; Qi, Z.M.; Wan, L. Impacts of climate change and human activities on vegetation NDVI in China’s Mu Us Sandy Land during 2000–2019. Ecol. Indic. 2022, 142, 109164. [Google Scholar] [CrossRef] [Scilit]
- Karlen, D.L.; Ditzler, C.A.; Andrews, S.S. Soil quality: Why and how? Geoderma 2003, 114, 145–156. [Google Scholar] [CrossRef] [Scilit]
- Ma, R.T.; Hu, F.N.; Xu, C.Y.; Liu, J.F.; Yu, Z.H.; Liu, G.; Zhao, S.W.; Zheng, F.L. Vegetation restoration enhances soil erosion resistance through decreasing the net repulsive force between soil particles. Catena 2023, 226, 107085. [Google Scholar] [CrossRef] [Scilit]
- Gong, L.; Ran, Q.; He, G.; Tiyip, T. A soil quality assessment under different land use types in Keriya river basin, Southern Xinjiang, China. Soil Tillage Res. 2015, 146, 223–229. [Google Scholar] [CrossRef] [Scilit]
- Li, F.F.; Zhang, X.S.; Zhao, Y.; Song, M.J.; Liang, J. Soil quality assessment of reclaimed land in the urban-rural fringe. Catena 2023, 220, 106692. [Google Scholar] [CrossRef] [Scilit]
- Choudhury, B.U.; Mandal, S. Indexing soil properties through constructing minimum data sets for soil quality assessment of surface and profile soils of intermontane valley (Barak, North East India). Ecol. Indic. 2021, 123, 107369. [Google Scholar] [CrossRef] [Scilit]
- Vasu, D.; Singh, S.K.; Ray, S.K.; Duraisami, V.P.; Tiwary, P.; Chandran, P.; Nimkar, A.M.; Anantwar, S.G. Soil quality index (SQI) as a tool to evaluate crop productivity in semi-arid Deccan plateau, India. Geoderma 2016, 282, 70–79. [Google Scholar] [CrossRef] [Scilit]
- Yu, P.J.; Liu, J.L.; Tang, H.Y.; Sun, X.Z.; Liu, S.W.; Tang, X.G.; Ding, Z.; Ma, M.G.; Ci, E. Establishing a soil quality index to evaluate soil quality after afforestation in a karst region of Southwest China. Catena 2023, 230, 107237. [Google Scholar] [CrossRef] [Scilit]
- Andrews, S.S.; Karlen, D.L.; Mitchell, J.P. A comparison of soil quality indexing methods for vegetable production systems in Northern California. Agric. Ecosyst. Environ. 2002, 90, 25–45. [Google Scholar] [CrossRef] [Scilit]
- Askari, S.M.; Holden, M.N. Quantitative soil quality indexing of temperate arable management systems. Soil Tillage Res. 2015, 150, 57–67. [Google Scholar] [CrossRef] [Scilit]
- Guo, L.L.; Sun, Z.G.; Ouyang, Z.; Han, D.R.; Li, F.D. A comparison of soil quality evaluation methods for Fluvisol along the lower Yellow River. Catena 2017, 152, 135–143. [Google Scholar] [CrossRef] [Scilit]
- Brockett, B.F.T.; Prescott, C.E.; Grayston, S.J. Soil moisture is the major factor influencing microbial community structure and enzyme activities across seven biogeoclimatic zones in western Canada. Soil Biol. Biochem. 2012, 44, 9–20. [Google Scholar] [CrossRef] [Scilit]
- Pei, Y.W.; Huang, L.M.; Shao, M.A.; Zhang, Y.L.; Pan, Y.H. Water use pattern and transpiration of Mongolian pine plantations in relation to stand age on northern Loess Plateau of China. Agric. For. Meteorol. 2023, 330, 109320. [Google Scholar] [CrossRef] [Scilit]
- Yang, X.; Shao, M.A.; Li, T.C.; Zhang, Q.Y.; Gan, M.; Chen, M.Y.; Bai, X. Distribution of soil nutrients under typical artificial vegetation in the desert-loess transition zone. Catena 2021, 200, 105165. [Google Scholar] [CrossRef] [Scilit]
- Bentham, H.; Harris, J.A.; Birch, P.; Short, K.C. Habitat Classification and Soil Restoration Assessment Using Analysis of Soil Microbiological and Physico-chemical Characteristics. J. Appl. Ecol. 1992, 29, 711–718. [Google Scholar] [CrossRef] [Scilit]
- Glover, J.D.; Reganold, J.P.; Andrews, P.K. Systematic method for rating soil quality of conventional, organic, and integrated apple orchards in Washington State. Agric. Ecosyst. Environ. 2000, 80, 29–45. [Google Scholar] [CrossRef] [Scilit]
- Marion, L.F.; Schneider, R.; Cherubin, M.R.; Colares, G.S.; Wiesel, P.G.; Costa, A.B.; Lobo, E.A. Development of a soil quality index to evaluate agricultural cropping systems in southern Brazil. Soil Tillage Res. 2022, 218, 105293. [Google Scholar] [CrossRef] [Scilit]
- Li, R.R.; Kan, S.S.; Zhu, M.K.; Chen, J.; Ai, X.Y.; Chen, Z.Q.; Zhang, J.J.; Ai, Y.W. Effect of different vegetation restoration types on fundamental parameters, structural characteristics and the soil quality index of artificial soil. Soil Tillage Res. 2018, 184, 11–23. [Google Scholar] [CrossRef] [Scilit]
- Raiesi, F. A minimum data set and soil quality index to quantify the effect of land use conversion on soil quality and degradation in native rangelands of upland arid and semiarid regions. Ecol. Indic. 2017, 75, 307–320. [Google Scholar] [CrossRef] [Scilit]
- Mamehpour, N.; Rezapour, S.; Ghaemian, N. Quantitative assessment of soil quality indices for urban croplands in a calcareous. Geoderma 2021, 382, 114781. [Google Scholar] [CrossRef] [Scilit]
- Roy, D.; Datta, A.; Jat, H.S.; Choudhary, M.; Sharma, P.C.; Singh, P.K.; Jat, M.L. Impact of long-term conservation agriculture on soil quality under cereal basedsystems of North West India. Geoderma 2022, 405, 115391. [Google Scholar] [CrossRef] [Scilit]
- Rubino, M.; Dungait, J.A.J.; Evershed, R.P.; Bertolini, T.; De Angelis, P.; D’Onofrio, A.; Lagomarsino, A.; Lubritto, C.; Merola, A.; Terrasi, F.; et al. Carbon input belowground is the major C flux contributing to leaf litter mass loss: Evidences from a 13C labelled-leaf litter experiment. Soil Biol. Biochem. 2010, 42, 1009–1016. [Google Scholar] [CrossRef] [Scilit]
- Villarino, S.H.; Pinto, P.; Jackson, R.B.; Piñeiro, G. Plant rhizodeposition: A key factor for soil organic matter formation in stable fractions. Sci. Adv. 2021, 7, eabd3176. [Google Scholar] [CrossRef] [Scilit] [PubMed]
- Yu, W.J.; Zhang, Z.; Li, Q.; Zou, J.T.; Feng, Z.D.; Wen, T. Effects of Pinus sylvestris var. mongolica afforestation on soil physicochemical properties at the southern edge of the Mu Us Sandy Land, China. For. Ecol. Manag. 2023, 545, 121254. [Google Scholar]
- Wu, Y.X.; Yu, X.X.; Jia, G.D. Seasonal Variation of Soil Erodibility Under Vegetation Restoration in the Agro-pastoral Ecotone of Northern China. J. Soil Sci. Plant Nutr. 2023, 23, 2331–2343. [Google Scholar] [CrossRef] [Scilit]
- Cui, Y.S.; Pan, C.Z.; Zhang, G.; Sun, Z.W.; Wang, F.X. Effects of litter mass on throughfall partitioning in a Pinus tabulaeformis plantation on the Loess Plateau, China. Agric. Ecosyst. Environ. 2022, 318, 108908. [Google Scholar] [CrossRef] [Scilit]
- Li, H.Q.; Yao, Y.F.; Zhang, X.J.; Zhu, H.S.; Wei, X.R. Changes in soil physical and hydraulic properties following the conversion of forest to cropland in the black soil region of Northeast China. Catena 2021, 198, 104986. [Google Scholar] [CrossRef] [Scilit]
- Liu, D.; Huang, Y.M.; An, S.S.; Sun, H.Y.; Parag, B.; Chen, Z.W. Soil physicochemical and microbial characteristics of contrasting land-use types along soil depth gradients. Catena 2018, 162, 345–353. [Google Scholar] [CrossRef] [Scilit]
- Sun, R.; Lan, G.; Yang, C.; Wu, Z.; Chen, B.; Fraedrich, K. Soil quality variation and its driving factors within tropical forests on Hainan Island, China. Land. Degrad. Dev. 2023, 34, 3418–3432. [Google Scholar] [CrossRef] [Scilit]
- Zornoza, R.; Mataix-Solera, J.; Guerrero, C.; Arcenegui, V.; Mataix-Beneyto, J.; Gómez, I. Validating the effectiveness and sensitivity of two soil quality indices based on natural forest soils under Mediterranean conditions. Soil Biol. Biochem. 2008, 40, 2079–2087. [Google Scholar] [CrossRef] [Scilit]
- Teng, Q.M.; Lu, X.N.; Zhang, Q.Q.; Cai, L.L.; Muhammad, F.S.; Li, Y.F.; Touqeer, A.; Li, Y.; Chang, S.X.; Li, Y.C. Litterfall quality modulates soil ammonium and nitrate supply through altering microbial function in bamboo encroachment of broadleaf forests. Geoderma 2023, 437, 116592. [Google Scholar] [CrossRef] [Scilit]
- Lehmann, J.; Bossio, A.D.; Kögel-Knabner, I.; Rillig, M.C. The concept and future prospects of soil health. Nat. Rev. Earth Environ. 2020, 1, 544–553. [Google Scholar] [CrossRef] [Scilit]
- Yu, P.J.; Liu, S.W.; Zhang, L.; Li, Q.; Zhou, D.W. Selecting the minimum data set and quantitative soil quality indexing of alkaline soils under different land uses in northeastern China. Sci. Total Environ. 2018, 616–617, 564–571. [Google Scholar] [CrossRef] [Scilit] [PubMed]
- Rinot, O.; Levy, J.G.; Steinberger, Y.; Svoray, T.; Eshel, G. Soil health assessment: A critical review of current methodologies and a proposed new approach. Sci. Total Environ. 2019, 648, 1484–1491. [Google Scholar] [CrossRef] [Scilit] [PubMed]
- Lu, S.B.; Chen, Y.M.; Sardans, J.; Peñuelas, J. Ecological stoichiometric comparison of plant-litter-soil system in mixed-species and monoculture plantations of Robinia pseudoacacia, Amygdalus davidiana, and Armeniaca sibirica in the Loess Hilly Region of China. For. Ecosyst. 2023, 10, 100123. [Google Scholar] [CrossRef] [Scilit]
- Medriano, C.A.; Chan, A.D.; Sotto, R.; Bae, S. Different types of land use influence soil physiochemical properties, the abundance of nitrifying bacteria, and microbial interactions in tropical urban soil. Sci. Total Environ. 2023, 869, 161722. [Google Scholar] [CrossRef] [Scilit]
- Chen, M.Y.; Yang, X.; Shao, M.A.; Wei, X.R.; Li, T.C. Changes in soil C–N–P stoichiometry after 20 years of typical artificial vegetation restoration in semiarid continental climate zones. Sci. Total Environ. 2022, 852, 158380. [Google Scholar] [CrossRef] [Scilit]
- Qiu, D.X.; Xu, R.R.; Wu, C.X.; Mu, X.M.; Zhao, G.J.; Gao, P. Vegetation restoration improves soil hydrological properties by regulating soil physicochemical properties in the Loess Plateau, China. J. Hydrol. 2022, 609, 127703. [Google Scholar] [CrossRef] [Scilit]
- Ni, J.J.; Cheng, Y.F.; Wang, Q.H.; Ng, C.W.W.; Garg, A. Effects of vegetation on soil temperature and water content: Field monitoring and numerical modelling. J. Hydrol. 2019, 571, 494–502. [Google Scholar] [CrossRef] [Scilit]
- Peng, X.D.; Dai, Q.H.; Ding, G.J.; Shi, D.M.; Li, C.L. Impact of vegetation restoration on soil properties in near-surface fissures located in karst rocky desertification regions. Soil Tillage Res. 2020, 200, 104620. [Google Scholar] [CrossRef] [Scilit]
- Helfrich, M.; Ludwig, B.; Potthoff, M.; Flessa, H. Effect of litter quality and soil fungi on macroaggregate dynamics and associated partitioning of litter carbon and nitrogen. Soil Biol. Biochem. 2008, 40, 1823–1835. [Google Scholar] [CrossRef] [Scilit]
- Shen, X.F.; Niu, L.T.; Jia, X.X.; Yang, T.; Hu, W.; Wu, C.Y.; Chu, J.D.; Biswas, A.; Shao, M.A. Disentangling ecological restoration’s impact on terrestrial water storage. Geophys. Res. Lett. 2025, 52, e2024GL111669. [Google Scholar] [CrossRef] [Scilit]
- Zhang, Z.H.; Huisingh, D. Combating desertification in China: Monitoring, control, management and revegetation. J. Clean. Prod. 2018, 182, 765–775. [Google Scholar] [CrossRef] [Scilit]
- Zhu, Z.C.; Shao, M.A.; Jia, X.X.; Zhao, C.L. Rainfall partitioning characteristics and simulation of typical shelter forest in Chinese Mu Us Sandy Land. Sci. Total Environ. 2024, 945, 174091. [Google Scholar] [CrossRef] [Scilit] [PubMed]

Disclaimer/Publisher’s Note: The statements, opinions and data contained in all publications are solely those of the individual author(s) and contributor(s) and not of MDPI and/or the editor(s). MDPI and/or the editor(s) disclaim responsibility for any injury to people or property resulting from any ideas, methods, instructions or products referred to in the content. |
© 2025 by the authors. Licensee MDPI, Basel, Switzerland. This article is an open access article distributed under the terms and conditions of the Creative Commons Attribution (CC BY) license (https://creativecommons.org/licenses/by/4.0/).