


Abstract
Student engagement within Learning Management Systems (LMSs) provides valuable behavioural data for understanding and predicting learning outcomes. However, predicting students’ forum consumption behaviour remains challenging because LMS datasets may contain redundant engagement indicators that increase model complexity. This study proposes a hybrid predictive modelling framework that integrates Ant Colony Optimisation (ACO) with three ensemble regression algorithms—Random Forest (RF), Gradient Boosting (GB), and Stacking—to predict forum consumption behaviour using LMS-derived engagement indicators. Guided by Educational Data Mining (EDM) and Social Learning Theory (SLT), behavioural, cognitive, and social engagement dimensions were operationalised using LMS indicators, with Freq_Forum_Consume serving as the target variable. ACO was employed as a wrapper-based feature-selection technique to identify informative predictors before model training. The performance of the ACO–ensemble models was compared with corresponding baseline models using the coefficient of determination (R2), Mean Absolute Error (MAE), and Root Mean Squared Error (RMSE). The results show that ACO reduced the predictor space from nine to six variables for GB and to seven variables for both Stacking and RF, while maintaining or improving predictive performance. ACO-GB achieved the strongest overall performance (R2 = 0.8332, MAE = 55.3173, RMSE = 71.4150). Consistent results across multiple ACO parameter configurations further demonstrated parameter consistency within the tested search settings. The selected predictors represented behavioural, cognitive, and social engagement dimensions, highlighting their complementary contribution to predicting forum consumption behaviour. The proposed framework provides a more parsimonious and interpretable approach to LMS-based learning analytics while retaining predictive performance.
1. Introduction
Learning Management Systems (LMSs) have become essential components of modern higher education, providing web-based platforms that support teaching, learning, assessment, and institutional administration [1]. Their accessibility enables flexible and continuous engagement with learning resources while supporting collaborative learning through discussion forums, quizzes, live chats, and virtual classrooms [2,3,4]. The rapid expansion of online learning, accelerated by the COVID-19 pandemic, has further reinforced the importance of LMSs in ensuring educational continuity and promoting student-centred learning [5,6]. Empirical studies have consistently shown that both active participation and passive engagement, such as frequent access to course materials and discussion forums, are passively associated with academic performance and deeper learning [7].
The widespread adoption of LMS has generated large volumes of student interaction data, including behavioural, cognitive, and performance-related information. Learning analytics leverages these data to identify engagement patterns, personalise learning experiences, and support the early identification of students at risk of poor academic performance or dropout [8]. Furthermore, advances in artificial intelligence (AI) and machine learning have enhanced the ability of higher education institutions to analyse LMS data and support data-driven educational decision-making [9,10]. Despite these developments, LMS data remain underutilised for predicting specific engagement behaviours such as student forum consumption, while the high dimensionality, sparsity, redundancy, and nonlinear complexity of LMS datasets continue to challenge predictive accuracy and model generalisability [2,7,11].
Deep learning models have demonstrated strong predictive performance by learning complex nonlinear patterns from educational data [12]. However, these approaches often function as computationally intensive “black-box” models with limited interpretability. Likewise, conventional dimensionality reduction and feature selection methods exhibit important limitations. Principal Component Analysis (PCA) improves computational efficiency by transforming variables into latent components but obscures the semantic meaning of the original engagement indicators [13,14]. Recursive Feature Elimination (RFE) and mutual information-based methods primarily evaluate variables individually or through pairwise relationships, limiting their ability to capture higher-order behavioural interactions that are informative only when variables act together [15,16]. Similarly, filter-based approaches may overlook interaction-dependent features, while post hoc explainability techniques such as Shapley Addictive exPlanations (SHAP) and Local Interpretable Model-agnostic Explanations (LIME) explain model predictions without explicitly modelling interaction structures. Generalised Addictive Models (GAMs) improve interpretability through nonlinear additive effects but remain limited in representing complex cooperative interactions unless interaction terms are manually specified [17]. These limitations are particularly important in LMS environments, where behavioural, cognitive, and social engagement are inherently interconnected [18,19].
Feature selection (FS) techniques are commonly classified into three categories: filter, embedded, and wrapper methods, each differing in the extent to which they interact with the learning algorithm. Filter methods are model-independent and rank features using statistical measures without involving a predictive model. Although computationally efficient, they may retain redundant features because dependencies and interactions among variables are not explicitly considered [20]. Embedded methods incorporate FS directly into the model training process, enabling simultaneous FS and model construction. While computationally efficient, they are inherently algorithm-specific and often produce model-specific feature importance rather than explicit feature subsets, limiting interpretability and cross-model comparison. In contrast, wrapper methods evaluate candidate feature subsets based on the predictive performance of a learning algorithm, selecting those that maximise prediction accuracy and generalisability [21]. By considering feature interactions during the search process, wrapper methods typically produce feature subsets that are better aligned with the learning algorithm, thereby improving predictive performance while retaining a compact and interpretable set of predictors.
Despite the growing use of machine learning techniques in educational data mining, accurately predicting student engagement from LMS interaction data remains challenging because engagement indicators are often multidimensional, highly correlated, and may contain redundant information, which can reduce predictive performance and model interpretability. Although previous studies have demonstrated an association between LMS engagement metrics and academic outcomes, comparatively few have systematically investigated the combined role of feature optimisation and ensemble learning for predicting students’ forum consumption behaviour. Consequently, there remains a need for predictive frameworks capable of identifying the most informative engagement indicators while maintaining robust predictive performance and producing interpretable insights that can support educational decision-making [22,23].
FS has therefore emerged as an important preprocessing step in predictive modelling because it reduces feature redundancy, improves computational efficiency, enhances model interpretability, and frequently improves performance by retaining only the most informative variables [24]. Among wrapper-based optimisation techniques, BIO-inspired algorithms have demonstrated considerable success in identifying optimal feature subsets for complex, high-dimensional datasets owing to their adaptive search capabilities and ability to balance exploration and exploitation during optimisation [25,26]. In particular, ACO has shown considerable promise for wrapper-based FS by efficiently exploring the feature space and identifying informative combinations of predictors while avoiding premature convergence to locally optimal solutions [27].
Motivated by limitations of traditional FS and engagement modelling methods, which often fail to account for the complex, nonlinear, and interdependent nature of student interactions in LMS environments, this study proposes a hybrid ACO–ensemble learning framework for predicting students’ forum consumption behaviour using LMS-derived engagement indicators. Guided by EDM and SLT, behavioural, cognitive, and social engagement indicators are operationalised as measurable predictors of forum consumption behaviour.
Within the proposed framework, ACO performs wrapper-based FS to identify an optimal subset of engagement indicators before model development. The selected features are subsequently evaluated using three complementary ensemble regression algorithms: Random Forest (RF), Gradient Boosting (GB), and Stacking, which represent the bagging, boosting, and meta-learning paradigms, respectively [28]. This comparative strategy enables evaluation of the effectiveness and robustness of optimised feature subsets across different ensemble learning mechanisms while supporting interpretability and reducing feature redundancy. By integrating feature optimisation with ensemble learning, the proposed framework seeks to improve prediction accuracy, reduce feature redundancy, and provide theoretically grounded insights into the engagement behaviours associated with students’ forum consumption in online learning environments.
The remainder of this paper is organised as follows: Section 2 provides a review of the relevant literature, Section 3 details materials and methods, Section 4 presents and analyses the results, Section 5 discusses the implications of the findings, and Section 6 concludes the paper and outlines directions for future research.
2. Literature Review
2.1. Learning Management Systems and Their Role in Enhancing Quality Learning in Higher Education
The rapid expansion of digital learning technologies has significantly transformed teaching and learning practices in higher education, with LMSs becoming central platforms for delivering course materials, facilitating communication, and supporting collaborative learning activities such as discussion forums, quizzes, and assignments. This widespread adoption of LMS platforms has enabled institutions to support flexible and blended learning environments while simultaneously generating large volumes of digital interaction data that capture students’ learning activities and engagement behaviours [29,30]. These systems record detailed logs of learner interactions, including course views, lecture access, forum participation, and session activities, providing valuable insights into how students engage with online learning environments. However, the scale of academic offerings generates substantial data within these systems. Consequently, the effective analysis of LMS-derived student data, particularly through visualisation, is crucial for identifying patterns, detecting problems early, and evaluating course effectiveness [3]. This can be demonstrated by an LMS that effectively provides datasets for analysing and reporting learning and reflecting on the learning outcomes [31]. For instance, frequent use of LMS platforms such as Moodle, timely assignment submission, and engagement with instructional materials are associated with improved academic performance [32], while participation in discussion forums further correlates with student success [33]. Monitoring engagement across educational activities can therefore enhance learning quality and support the early detection of at-risk students. Assessment engagement patterns also serve as effective indicators of student behaviour and performance. Although prior research has relied on statistical analyses, surveys, and qualitative methods, these approaches often fail to reveal latent patterns in student data, lack scalability and generalisability, and may not reliably capture engagement due to their reliance on self-reported behaviours, emotions, and course design. Nonetheless, active participation in learning activities remains a key determinant of student engagement [34].
2.2. Student Engagement in Online Learning Environments
Student engagement encompasses active involvement in learning activities, including content immersion, interaction with instructors, and collaboration with peers [35]. Sustained engagement over time is associated with stable academic achievement, whereas disengagement, particularly among initially low-engaged students, correlates with poorer outcomes. Conversely, improvements in engagement are associated with acceptable performance and lower dropout rates, whereas a lack of such improvements signals increased academic risk and the need for timely intervention [36]. Consequently, engagement within technology-enhanced learning (TEL) environments plays a crucial role in enhancing educational outcomes, particularly in online education contexts [37].
In this context, identifying patterns in educational data offers a means to address dropout rates, enhance student performance and engagement, and improve overall learning satisfaction [38]. Predictive systems that adapt tasks based on student performance further support cognitive development and sustain engagement [39]. As a result, increased engagement promotes task completion, leading to improved learning outcomes and reduced course dropout rates. This is evident in a study conducted by [40], which illustrated engagement metrics such as course material access, forum participation, log-in frequency, interaction patterns, and messaging activity, all of which are crucial for understanding student behaviour and performance. Similarly, a study by [41] shows that prior Grade Point Average (GPA) predicts early performance, whereas midterm grades and LMS engagement indicators at the outset of a course, such as clicks, page views, and session frequency, become more influential over time, highlighting their value in monitoring progress and identifying at-risk students. Therefore, recognising engagement metrics as key predictors allows institutions to promote behaviours that improve learning, such as consistent access to course materials and timely assignment submission [42]. However, despite extensive recognition of student engagement as a crucial determinant of academic success, retention, and persistence in higher education, robust methods for accurately evaluating and predicting engagement in online learning environments remain limited [43]. Although existing studies demonstrate the correlation between engagement indicators and student outcomes, many fail to employ predictive modelling techniques capable of generating accurate, actionable insights. As a result, the influence of distinct interaction patterns on diverse learning outcomes across contexts remains underexplored [23]. Addressing this gap could enhance understanding of learners’ engagement with e-learning design features and facilitate innovative, data-driven approaches through emerging technologies, such as artificial intelligence (AI) [44]. Furthermore, limited research has systematically examined the interplay among LMS attributes, FS methods, and predictive model optimisation for accurately predicting student progress [22].
2.3. Forum Participation and Consumer Behaviour
In online learning, discussion forums play a vital role in supporting collaboration and interaction among learners. Analysing patterns of forum usage and their relationship with course outcomes can provide valuable insights into learner behaviour and inform strategies to improve forum engagement and overall learning experiences [45]. Supporting this view, ref. [46] demonstrated that forum participation enhances communication and deepens understanding of course content. This, in turn, reinforces learning, improves knowledge mastery, and contributes to higher academic performance. Similarly, ref. [47] found that exposure to EST online materials through communication and collaboration via online forum discussions strengthened students’ subject knowledge. Furthermore, learners’ comprehension of online EST reading materials improved due to the discussion forum’s interactive and heuristic approach to learning. Thus, regular engagement with forums promotes critical thinking, collaboration, and active participation, enabling students to articulate ideas, receive feedback, and deepen their understanding and application of course contexts [48]. This aligns with [49], who states that incorporating discussion forums enhances critical thinking, communication, and collaboration by promoting community and enabling voluntary, content-focused dialogue and joint project work among students. This concurs with [50], who demonstrated that regular participation in online discussion forums enhances students’ critical reading, thinking, and reflection abilities, as well as their behavioural, emotional, and cognitive engagement, thereby fostering their social skills and confidence in the learning process. Thus, discussion forums as interactive tools enhance learning and encourage learner engagement [51].
2.4. Engagement Indicators for Predicting Forum Consumption Behaviour
Student engagement in online learning environments is commonly conceptualised as a multidimensional construct encompassing behavioural, cognitive, emotional, and social dimensions [18,19]. Consistent with Social Learning Theory (SLT), learning occurs through interaction, observation, and participation in collaborative environments such as discussion forums [52,53]. Educational Data Mining (EDM) operationalises these constructs by analysing interaction data captured in LMS, enabling the identification of engagement patterns that support collaborative and self-regulated learning [54]. However, the operationalisation of engagement in learning analytics research largely depends on the type of data available. In LMS environments, data primarily capture traceable learner actions, such as logins, content access, forum participation, and assignment submissions, which predominantly reflect engagement [55]. These interaction patterns can also reveal indicators of cognitive engagement, such as persistence and structured learning behaviour [40,41], while discussion forums facilitate peer interaction and knowledge exchange, representing social engagement [45,51]. Although emotional engagement is recognised as an important dimension reflecting learners’ effective states, it is typically not directly observable through LMS interaction logs. Consequently, consistent with data-driven learning analytic approaches, this study operationalises behavioural, cognitive, and social engagement indicators derived from LMS interaction logs as predictors of forum consumption behaviour. To enhance predictive performance and model interpretability in high-dimensional LMS datasets, these indicators are analysed using a hybrid ACO–ensemble learning framework that combines wrapper-based FS with RF, GB, and Stacking regression models.
3. Materials and Methods
3.1. Theoretical Framework
The study is situated within a positivist research paradigm, which emphasises objective measurement, empirical observation, and the quantitative evaluation of phenomena [56]. The paradigm is particularly appropriate for EDM, where large-scale LMS interaction data are systematically analysed to identify behavioural patterns and evaluate predictive models using objective performance metrics.
The study is further informed by EDM and Social Learning Theory (SLT), which collectively provide the conceptual basis for modelling students’ forum consumption behaviour. EDM focuses on extracting meaningful knowledge from educational databases by analysing students’ digital learning traces to understand learning behaviour and support data-informed educational decision-making [54]. Within LMS environments, these digital traces represent observable indicators of students’ engagement with learning resources, course activities, and collaborative interactions.
SLT proposes that learning occurs through observation, interaction, and participation within collaborative environments [52,53]. In online learning environments, discussion forums provide opportunities for students to observe peer interactions, exchange ideas, and construct knowledge collaboratively. Consequently, forum consumption behaviour is viewed as an important manifestation of students’ engagement within collaborative learning environments.
Consistent with these theoretical perspectives, this study conceptualises student engagement as a multidimensional construct comprising behavioural, cognitive, and social engagement, operationalised using observable LMS interaction data. These engagement dimensions provide the theoretical foundation for selecting predictor variables used to model students’ forum consumption behaviour.
3.2. Dataset Description
This study uses a simulated dataset of students’ online engagement and academic achievement throughout a programme of study. The dataset was developed based on findings from a published study that analysed student interaction logs obtained from a university Moodle Learning Management System (LMS) for the period 2015–2018. The original data were used to derive indicators of learning-activity frequency, session activity, total online duration, active days, and activity regularity [57]. The resulting dataset was imported into a Jupyter Notebook using the Python Pandas library (version 2.x) for preprocessing and analysis. Jupyter Notebook (https://jupyter.org/) is an open-source, web-based interactive computing environment that supports data analysis and scientific computing.
The simulated dataset contains 1136 student course records representing 142 students across eight sequential courses. For the present study, Freq_Forum_Consume, representing the number of forum posts viewed, was used as the target variable. After removing Regularity_Forum_Consume and Final_Grade to address potential target overlap and future information concerns, nine LMS engagement indicators were retained as predictors.
In the source study, engagement indicators were analysed using Latent Class Analysis (LCA) to classify students as Active, Average, or Disengaged, and final grades as Achiever, Intermediate, or Low. These classifications provide context for the construction of the simulated dataset but were not used as predictors in the present study [57]. The dataset is distributed under a CC BY 4.0 licence.
Table 1 presents the definitions and descriptive statistics of the variables used in the analysis. The descriptive statistics include the number of observations, mean, standard deviation, minimum, first quartile, median, third quartile, and maximum. All nine predictors and the target feature contain 1136 observations, with no missing observations in the features included in the modelling analysis.
Table 1.
Definitions and descriptive statistics of the study variables.
3.3. Research Design
The study employed a quantitative, comparative predictive modelling design to investigate the effect of ACO-guided FS on predicting students’ forum consumption behaviour using LMS engagement indicators. Three complementary ensemble regression algorithms—RF, GB, and Stacking—were first developed as baseline models using the nine retained LMS engagement predictors. A corresponding ACO–ensemble model was then developed for each algorithm, with ACO performing wrapper-based FS before training the respective regression model.
The research design enabled a systematic comparison between models trained using the full set of nine predictors and their corresponding ACO–ensemble models trained using reduced feature subsets. This comparison addressed the study objectives by examining the effect of ACO-guided FS on predictive performance and feature reduction, identifying informative engagement indicators, and assessing the consistency of the selected feature subsets across different ensemble learning algorithms. The resulting feature reduction also provided a more parsimonious predictor space for interpreting the engagement indicators associated with students’ forum consumption behaviour.
The comparison design specifically addresses four objectives:
- To evaluate the effect of ACO-based FS on the predictive performance of ensemble regression models for forum consumption behaviour.
- To identify informative behavioural, cognitive, and social LMS engagement indicators associated with forum consumption behaviour.
- To assess the consistency of ACO-selected feature subsets across complementary ensemble learning algorithms and tested ACO parameter configurations.
- To examine the relationship between feature-space reduction and predictive performance, with emphasis on developing a more parsimonious and interpretable predictor set.
Figure 1 illustrates the conceptual framework underpinning the proposed predictive modelling approach. The framework integrates EDM, feature optimisation, and ensemble learning to predict students’ forum consumption behaviour from LMS engagement data.
Figure 1.
Conceptual framework flowchart.
Following data preparation, the workflow branches into parallel modelling pathways. The first pathway develops the baseline ensemble regression models (RF, GB, and Stacking) using the complete set of original engagement variables. These models establish the reference level of predictive performance against which the effectiveness of feature optimisation can be evaluated. The second pathway applies ACO as a wrapper-based FS technique to identify an optimal subset of engagement indicators. The selected features are subsequently used to train the corresponding hybrid ACO-RF, ACO-GB, and ACO–Stacking models. This optimisation process reduces feature redundancy while preserving the engagement indicators that contribute most to predicting forum consumption behaviour.
Predictions generated by both modelling pathways are subsequently evaluated using the R2, MAE, and RMSE. These complementary evaluation metrics facilitate a comprehensive comparison of predictive accuracy and model robustness.
Finally, the comparative analysis is used to determine whether ACO-guided FS improves predictive performance while simultaneously reducing model complexity and enhancing interpretability. The selected features are subsequently interpreted according to the behavioural, cognitive, and social engagement dimensions defined in Table 2, thereby providing meaningful educational insights into the factors associated with students’ forum consumption behaviour.
Table 2.
Operationalisation of engagement dimensions using LMS-derived indicators.
3.4. Operationalised Student Engagement Dimensions
To translate the theoretical constructs into measurable variables, student engagement was operationalised using LMS-derived indicators extracted from system interaction logs. Behavioural engagement was represented through students’ observable participation in learning activities, cognitive engagement through indicators reflecting persistence and structured learning behaviours, and social engagement through participation in collaborative discussion forums. Consistent with the study objective, forum consumption behaviour (Freq_Forum_Consume) constituted the dependent variable to be predicted.
The operationalisation presented in Table 2 establishes the conceptual relationship between the theoretical engagement dimensions and the measurable LMS indicators used throughout the predictive modelling process.
Operationalisation provides a theoretically grounded framework for interpreting the selected predictors identified through ACO. Rather than representing isolated activities, the indicators collectively capture complementary dimensions of student engagement that underpin the predictive models developed in this study.
3.5. Preprocessing
Prior to model development, the dataset was examined for data quality issues. No missing values were identified; therefore, no imputation or data exclusion procedures were required. To ensure consistency across the modelling framework, all predictor variables were standardised using the Standard Scaler implementation in Scikit-learn, which transforms each feature to have a mean of zero and a standard deviation of one. Although tree-based algorithms are generally insensitive to feature scaling, standardisation was applied uniformly across all models to maintain a consistent preprocessing pipeline and facilitate comparison among the ensemble learning algorithms.
For the baseline models, standardisation was applied to the complete set of nine LMS engagement indicators prior to model training. Within the ACO–ensemble framework, the same standardised predictor set was used as input to the wrapper-based ACO FS process. The selected feature subsets were subsequently used to train the corresponding RF, GB, and Stacking models.
3.6. Ensemble Predictive Models
This study employed three complementary ensemble regression algorithms—RF, GB, and Stacking—to predict students’ forum consumption behaviour from LMS engagement indicators. The models were selected to provide complementary learning mechanisms and to enable evaluation of whether ACO-selected features remained informative across different ensemble learning paradigms.
RF was included as a bagging-based ensemble that combines predictions from multiple decision trees, making it well suited to LMS engagement data containing potentially correlated predictors. Its ability to capture nonlinear relationships and interactions without requiring strong assumptions about the underlying data distribution further supports its application in this context. GB was selected as a boosting-based approach that sequentially learns from prediction errors, enabling it to capture complex nonlinear relationships among engagement indicators [58]. Stacking, in turn, was included as a meta-learning ensemble that combines predictions from multiple base learners, providing a complementary modelling approach for assessing whether the ACO-selected feature subsets retain predictive value across different learning mechanisms [59].
For each algorithm, a baseline model was first developed using the complete set of nine original LMS engagement indicators. A corresponding ACO-optimised model was then developed using the feature subset identified through ACO-based wrapper FS. This design enabled a direct comparison between models trained using the full feature set and those trained using the reduced ACO-selected feature sets. The comparison was used to determine whether ACO could reduce feature redundancy and model dimensionality while maintaining or improving predictive performance.
The integration of ACO with the ensemble models was therefore structured as a two-stage process: feature optimisation followed by predictive modelling. ACO searched for informative combinations of LMS engagement indicators, while RF, GB, and Stacking independently evaluated the predictive utility of the resulting subsets. Evaluating the selected features across these complementary ensemble approaches also enabled the study to assess whether the identified predictors were consistently informative rather than being specific to a single learning algorithm. This directly supports the study objectives of identifying informative engagement indicators, reducing redundant predictors, and evaluating the predictive effectiveness of the resulting compact feature subsets.
3.7. ACO-Based Wrapper Feature Selection
ACO was employed as a wrapper-based feature-selection method to identify compact subsets of the nine retained LMS engagement predictors. FS was performed independently for Gradient Boosting (GB), Stacking, and Random Forest (RF).
Each engagement indicator was treated as a candidate feature. ACO assigned pheromone values to the features and updated them according to the predictive performance of candidate subsets. Selection probabilities were influenced by pheromone and heuristic information, controlled by α and β, respectively.
Each ant generated a subset containing four to nine predictors. Candidate subsets were evaluated using 5-fold cross-validation, with mean R2 serving as the fitness measure. Higher-performing subsets received greater pheromone reinforcement, while pheromone evaporation and deposition controlled subsequent updates.
The search continued until the specified iteration limit or early-stopping criterion was reached. The subset achieving the highest cross-validation R2 was retained for the respective ensemble model and used for subsequent training and evaluation.
A fixed random seed of 42 was applied to support reproducibility. Different ant populations, iteration budgets, and combinations of α, β, and ρ were examined in the ACO Parameter Sensitivity Analysis (Section 3.8) to determine whether the optimisation configuration materially affected feature-selection outcomes or predictive performance.
Finally, the ACO-selected subsets were compared with the full nine-predictor models to determine whether feature reduction could maintain or improve predictive performance while reducing the predictor space.
3.8. ACO Parameter Selection and Sensitivity Analysis
ACO performance can be influenced by the configuration of its search parameters, including ant population, iteration budget, pheromone influence (α), heuristic influence (β), evaporation rate (ρ), and pheromone deposit. These parameters affect the balance between exploration and exploitation and may influence feature-selection outcomes [24,25,26].
As shown in Table 3, parameter sensitivity was examined across the ACO-GB, ACO–Stacking, and ACO-RF models by varying the ant population and iteration budget. The tested configurations included 30, 50, and 80 ants and 30, 50, and 100 maximum iterations. Combinations of α, β, and ρ were also examined, while the pheromone deposit was set to 0.5. The feature-subset size was constrained to four to nine predictors, and candidate subsets were evaluated using 5-fold cross-validation.
Table 3.
ACO parameter configurations and sensitivity analysis settings.
Early-stopping thresholds of 10 and 20 iterations were additionally examined to determine whether extending the search produced further improvements. A fixed random seed of 42 was used throughout to support reproducibility. Feature-selection outcomes and predictive performance were compared across the tested configurations.
The analysis was intended to determine whether variations in the tested ACO configurations materially affected feature-selection outcomes or predictive performance. The results provide evidence of consistency across the configurations investigated.
3.9. Validation and Evaluation Strategy
A multi-stage validation and evaluation strategy was employed to ensure consistent and reliable assessment of predictive performance. A fixed random seed of 42 was used throughout the experiments to support reproducibility.
During the ACO wrapper-based feature-selection stage, candidate feature subsets were evaluated using 5-fold cross-validation, as specified in Table 3. The mean R2 across the five folds served as the fitness measure for selecting the best-performing feature subset for each ensemble model.
Following FS, the ACO-optimised models were evaluated using 3-fold cross-validation with 10 repetitions (30 folds). The same evaluation procedure was applied to the baseline GB, Stacking, and RF models using the original predictor set, providing a consistent basis for comparison. Model hyperparameter optimisation, where applicable, was conducted using cross-validation prior to final evaluation.
An independent test set, excluded from ACO FS and model optimisation, was subsequently used to assess predictive performance on previously unseen observations. Performance was evaluated using R2, MAE, and RMSE, with higher R2 and lower MAE and RMSE indicating better predictive performance.
Thus, the evaluation strategy clearly distinguishes between 5-fold cross-validation for ACO FS, 3-fold cross-validation for comparative model evaluation, and independent test-set evaluation. This framework enabled assessment of whether ACO could reduce the predictor space while maintaining or improving the prediction of students’ forum consumption behaviour.
3.10. Algorithm of the Proposed ACO–Ensemble Framework
The following pseudocode summarises the overall workflow of the proposed ensemble framework, integrating data preparation, model-specific wrapper-based FS, ensemble model development, and performance evaluation. Algorithm 1 provides a reproducible overview of the methodological sequence described in Section 3.7, Section 3.8 and Section 3.9.
| Algorithm 1. ACO–Ensemble Framework |
Input:
|
4. Results
4.1. ACO Parameter Sensitivity and Sensitivity Analysis
Table 4 presents the ACO parameter sensitivity analysis conducted across the GB, Stacking, and RF models. The analysis considered different combinations of ant population, iteration budget, pheromone influence (α), heuristic influence (β), evaporation rate (ρ), and early-stopping thresholds to examine whether changes in the optimisation configuration affected FS and predictive performance. The pheromone deposit value was maintained at 0.5 across all configurations.
Table 4.
ACO parameter sensitivity and sensitivity analysis across ensemble models.
As shown in Table 4, the predictive performance of each ACO–ensemble model remained unchanged across the tested configurations. GB consistently achieved R2 = 0.8332, MAE = 55.3173, and RMSE = 71.4150, while selecting six features in all three configurations. Stacking similarly maintained R2 = 0.8313, MAE = 55.9915, and RMSE = 71.8245, consistently selecting seven features. RF produced R2 = 0.8265, MAE = 56.7765, and RMSE = 72.8403 across all configurations and also retained seven features.
The consistency of these results across different ant populations, iteration budgets, and combinations of α, β, and ρ indicates that the predictive outcomes were not materially affected by the tested ACO configurations. Although the number of selected features differed between GB and the other two models, each model produced the same feature-space size across its tested configurations. This suggests consistency in the optimisation outcome within each ensemble modelling approach.
The early-stopping analysis provides additional evidence of convergence consistency. Early-stopping thresholds of 10 and 20 iterations produced the same predictive results for all three ACO–ensemble models. Thus, extending the optimisation beyond 10 iterations did not yield further predictive improvement under the tested configurations.
4.2. Feature Selection Results
Table 5 presents the LMS engagement indicators selected by ACO across the B, Stacking, and RF ensemble models. Nine LMS engagement indicators were considered for FS, with Freq_Forum_Consume retained as the prediction target. ACO selected six predictors for ACO-GB and seven predictors for both ACO–Stacking and ACO-RF. This corresponds to reductions of 33.3% and 22.2%, respectively, in the predictor space.
Table 5.
LMS engagement indicators selected by ACO–ensemble models.
A high degree of agreement was observed across the three ACO–ensemble models. Five indicators—Freq_Course_View, Freq_Forum_Contribute, Session_Count, Freq_Lecture_View, and Total_Duration—were selected by all three models. Their consistent selection indicates that general LMS activity, learning-resource access, and direct participation in forums provide important predictive information for modelling students’ forum consumption frequency.
From a behavioural engagement perspective, the consistent selection of Freq_Course_View, Session_Count, Freq_Lecture_View, and Total_Duration is notable. These indicators capture different aspects of students’ observable interaction with the LMS, including course access, learning sessions, lecture viewing, and time spent online. Their selection across all three ensemble approaches suggests that the intensity and extent of students’ broader LMS participation provide useful information for predicting forum consumption frequency.
The results also highlight the importance of social engagement. Freq_Forum_Contribute and Regularity_Forum_Contribute were retained across the ACO-GB, ACO–Stacking, and ACO-RF models. Freq_Forum_Contribute represents the frequency of students’ active participation in forums, while Regularity_Forum_Contribute reflects the consistency of this participation. Their selection alongside the broader LMS activity indicators suggests that students’ active discussion participation provides complementary information for predicting the frequency with which they consume forum content.
The cognitive engagement indicators showed greater variation across models. Regularity_Lecture_View was selected by ACO–Stacking and ACO-RF but not by ACO-GB. This suggests that the regularity of accessing lecture material provided additional predictive information for the two models, whereas its contribution was not sufficient for retention by ACO-GB. In contrast, Regularity_Course_View was excluded by all three ACO–ensemble models, indicating that it provided limited additional predictive information when considered alongside the retained engagement indicators.
Model-specific differences were therefore relatively limited. ACO-GB selected Freq_Course_View, Freq_Forum_Contribute, Session_Count, Freq_Lecture_View, Regularity_Forum_Contribute, and Total_Duration, whereas ACO–Stacking and ACO-RF additionally retained Regularity_Lecture_View. This pattern indicates that the three ensemble learning approaches identified a common set of predictors, while Stacking and RF extracted additional information from the regularity of lecture access.
Conversely, Regularity_Course_View and Active_Days were excluded by all three ACO–ensemble models. Their exclusion should not be interpreted as indicating that these variables are unimportant measures of student engagement. Rather, within the present predictive framework, they provided limited additional predictive information after the retained indicators were considered jointly. Their information may overlap with measures such as Session_Count, Freq_Course_View, Freq_Lecture_View, and Total_Duration, which capture related aspects of students’ LMS activity.
Overall, the results in Table 4 demonstrate that ACO identified a compact and largely consistent subset of LMS engagement indicators for predicting Freq_Forum_Consume. Five predictors were consistently selected across all three ACO–ensemble models, while Regularity_Lecture_View provided additional information for ACO–Stacking and ACO-RF. The reduction from nine candidate predictors to six or seven therefore demonstrates that ACO can reduce the predictor space while retaining the engagement indicators most useful for predicting forum consumption behaviour. The consistency of the selected predictors across the three complementary ensemble learning approaches further supports their relevance within the proposed ACO-based feature-selection framework.
4.3. Performance Comparison Between Full-Feature and ACO-Selected Models
Table 6 compares the predictive performance of the baseline ensemble models trained using the nine original LMS engagement predictors with their corresponding ACO–ensemble models trained using the ACO-selected feature subsets. Performance was assessed using the R2, MAE, and RMSE.
Table 6.
Performance comparison between full-feature and ACO-selected feature models.
The results show that ACO reduced the predictor space while maintaining or improving predictive performance across all three ensemble models. For GB, the predictor set was reduced from nine to six variables, representing a 33.3% reduction in dimensionality. Stacking and RF were each reduced from nine to seven predictors, corresponding to a 22.2% reduction. These findings indicate that several original predictors provided limited additional information for predicting students’ forum consumption behaviour.
Among the three models, ACO-GB achieved the strongest overall predictive performance. Its R2 increased from 0.8310 for the full-feature model to 0.8332 following FS. MAE decreased from 55.4174 to 55.3173, while RMSE decreased from 71.8776 to 71.4150. Although these improvements were modest, they were achieved alongside a reduction of three predictors, indicating that the excluded variables contributed limited additional predictive information to the GB model.
A similar improvement was observed for ACO–Stacking. R2 increased from 0.8302 to 0.8313, while MAE decreased from 56.1305 to 55.9915, and RMSE decreased from 72.0548 to 71.8245. The predictor space was reduced from nine to seven variables, indicating that the ACO-selected subset retained the information required to predict forum consumption behaviour while eliminating two predictors.
The largest improvement was observed for ACO-RF. R2 increased from 0.8109 to 0.8265, representing an improvement of ΔR2 = +0.0156. MAE decreased from 58.2091 to 56.7765, while RMSE decreased from 76.0312 to 72.8403. This improvement was achieved despite reducing the predictor set from nine to seven variables, suggesting that removing less informative or redundant predictors was particularly beneficial for RF.
Overall, the results in Table 6 demonstrate that ACO-guided FS reduced the dimensionality of the LMS predictor space without compromising predictive performance. All three ACO–ensemble models showed improvements in R2 and reductions in prediction error relative to their corresponding full-feature models. These findings provide empirical support for the study’s objective of identifying a compact set of informative LMS engagement indicators for predicting students’ forum consumption behaviour.
The magnitude of improvement varied across the ensemble approaches. ACO-RF produced the largest relative improvement following FS, whereas ACO-GB achieved the strongest overall predictive performance. This variation suggests that the contribution of individual engagement indicators may depend partly on the learning mechanism employed by the ensemble model. Nevertheless, the consistent improvement following feature reduction across all three models provides evidence that ACO was able to remove predictors contributing limited additional information while retaining indicators relevant to the prediction of forum consumption behaviour.
4.4. Predicted vs. Actual Performance
Figure 2, titled “Predicted vs. Actual,” illustrates the relationship between the observed and predicted values of students’ forum consumption behaviour for the three ACO–ensemble models: ACO-GB, ACO-RF, and ACO–Stacking. The target variable, Freq_Forum_Consume, operationalises forum consumption behaviour as the frequency with which students viewed forum posts. The dashed diagonal line represents perfect prediction, where predicted values equal observed values. Observations closer to this reference line therefore indicate greater agreement between predicted and actual forum consumption behaviour.
Figure 2.
Predicted vs. actual.
Overall, the predictions from the three ACO–ensemble models follow the diagonal reference line reasonably closely, indicating that the models captured important relationships between the selected LMS engagement indicators and forum consumption behaviour. The clustering of observations around the reference line is consistent with the quantitative results reported in Table 6, where all three ACO–ensemble models improved on their corresponding full-feature models.
Among the models, ACO-GB shows a strong concentration of predictions around the reference line and achieved the highest R2 (0.8332) and lowest RMSE (71.4150). ACO–Stacking displays a comparable prediction pattern, with an R2 of 0.8313. ACO-RF also shows a close relationship between predicted and observed values and achieved the largest improvement relative to its corresponding full-feature model.
Some dispersion around the reference line is evident, particularly for observations with higher Freq_Forum_Consume values. This indicates greater prediction error for some observations with relatively high levels of forum consumption. However, the deviations occur on both sides of the reference line, with no pronounced systematic pattern of overprediction or underprediction across the observed range.
Overall, Figure 2 provides visual support for the quantitative findings in Table 5. The correspondence between observed and predicted values indicates that the ACO-selected feature subsets retained sufficient predictive information for modelling forum consumption behaviour while reducing the predictor space. Specifically, ACO reduced the predictor set from nine variables to six for GB and seven for both Stacking and RF. The broadly similar prediction patterns across the three ACO–ensemble models further support the predictive relevance of the selected LMS engagement indicators across different ensemble learning mechanisms.
4.5. Actual vs. Predicted Distribution
Figure 3 compares the distributions of the observed and predicted values of forum consumption behaviour generated by the three ACO–ensemble models: ACO-GB, ACO-RF, and ACO–Stacking. The density curves provide a visual assessment of how closely the predicted values reproduce the distribution of the observed target values.
Figure 3.
Actual vs. predicted distributions—3 ACO–ensemble models.
Overall, the predicted distributions show substantial overlap with the observed distribution, indicating that the three ACO–ensemble models captured the main distributional characteristics of forum consumption behaviour. The highest density for both observed and predicted values occurs approximately within the 45–60 range, suggesting that the models reproduced the region containing the largest concentration of observations reasonably well.
Among the three models, ACO-GB shows the closest alignment with the observed distribution. The similarity in the location of the peak and the overall shape of the density curve indicates that the model reproduced the central pattern of forum consumption behaviour effectively. This observation is consistent with the quantitative results in Table 6, where ACO-GB achieved the highest R2 and lowest RMSE among the three ACO–ensemble models.
The ACO-RF and ACO–Stacking models also show substantial overlap with the observed distribution. Although some differences are visible across portions of the distribution, particularly toward the lower and upper ranges, the overall patterns remain similar to the observed values. The predicted distributions therefore indicate that both models captured the general variation in forum consumption behaviour.
Overall, Figure 3 provides additional visual support for the quantitative results presented in Table 6. The similarity between the observed and predicted distributions indicates that the ACO-selected feature subsets retained sufficient predictive information to model forum consumption behaviour, despite reducing the number of LMS predictors. The broadly similar distributions produced by the three ACO–ensemble models further support the usefulness of the selected engagement indicators across different ensemble learning mechanisms.
4.6. Cross-Validation and Independent Test Performance
Figure 4 compares the cross-validation (CV) and test-fold performance of the three ACO–ensemble models: ACO-GB, ACO–Stacking, and ACO-RF using the 3-fold × 10-repeated Repeated Fold procedure. The comparison considers R2, MAE, and RMSE to assess the consistency of model performance across repeated data partitions.
Figure 4.
Test vs. cross-validation metrics of the ACO-optimised models.
Overall, the results show relatively small differences between the CV and test-fold performance across the three models. This indicates that the models maintained broadly consistent predictive performance across the repeated training and held-out fold evaluations. The close correspondence between the two sets of results also suggests that model performance was not strongly influenced by individual data partitions.
For R2, ACO-GB achieved the highest test-fold performance (R2 = 0.8332), with a higher CV R2 of approximately 0.8425. ACO–Stacking recorded a test-fold R2 of 0.8313 and a CV R2 of approximately 0.8382, while ACO-RF achieved a test-fold R2 of 0.8265 and a CV R2 of approximately 0.8380. The relatively small differences between CV and test-fold R2 indicate consistent explanatory performance across the repeated folds.
The error-based metrics show a similar pattern. ACO-GB recorded a test-fold MAE of 55.3173 compared with a CV MAE of approximately 54.0. ACO–Stacking produced a test-fold MAE of 55.9915 and a CV MAE of approximately 54.7, while ACO-RF recorded 56.7765 and approximately 54.8, respectively. For RMSE, the test-fold values were 71.4150 for ACO-GB, 71.8245 for ACO–Stacking, and 72.8403 for ACO-RF. The corresponding CV values were approximately 70.2, 71.2, and 71.3. Thus, the test-fold errors were generally slightly higher than the CV estimates; however, the differences remained relatively small.
Among the three models, ACO-GB demonstrated the strongest overall predictive performance, achieving the highest test-fold R2 and the lowest test-fold MAE and RMSE. ACO–Stacking showed comparable performance, while ACO-RF produced somewhat lower explanatory power and higher prediction errors. Nevertheless, all three models exhibited similar relationships between their CV and test-fold results, supporting the consistency of the ACO-selected feature subsets across the different ensemble learning mechanisms.
Overall, Figure 4 demonstrates consistent predictive performance across repeated cross-validation and test-fold evaluations. These findings support the reliability of the ACO-selected feature subsets within the evaluated dataset and complement the feature-selection and model-performance results presented in the preceding sections.
4.7. Comparative Performance Evaluation
Figure 5 compares the R2 values of the baseline ensemble models with those of their corresponding ACO–ensemble models. The comparison assesses whether ACO-based FS affected the explanatory performance of GB, Stacking, and RF after reducing the number of LMS engagement predictors.
Figure 5.
R2 comparison of the baseline and ACO-optimised ensemble models.
The results show that ACO-based FS improved R2 across all three ensemble models. For GB, R2 increased from 0.8310 for the baseline model to 0.8332 for the ACO–ensemble model. Similarly, Stacking increased from 0.8302 to 0.8313, while RF showed the largest improvement, increasing from 0.8109 to 0.8265. These results indicate that reducing the predictor space did not compromise the explanatory performance of the models.
The improvement was most pronounced for ACO-RF, with an increase of ΔR2 = 0.0156. This suggests that some of the predictors removed during ACO-based feature FS contributed limited additional information for RF and that their removal consequently enhanced predictive performance. The smaller improvements observed for GB and Stacking indicate that these models were less affected by the removal of the excluded predictors.
The reduction in feature space was also achieved with fewer predictors. The GB model was reduced from nine to six predictors, while Stacking and RF were reduced from nine to seven predictors. Thus, ACO removed predictors without reducing the proportion of variance explained by any of the three ensemble models. Rather, the observed increases in R2 suggest that the retained predictors provided a more concise representation of the information relevant to predicting students’ forum consumption behaviour.
Overall, Figure 5 provides visual evidence that ACO-based FS enhanced or preserved model explanatory performance while reducing the number of LMS engagement predictors. The results support the study objective of identifying a compact set of informative engagement indicators for predicting forum consumption behaviour, while demonstrating that the effect of feature reduction varied across the three ensemble learning mechanisms.
5. Discussion
5.1. ACO-Guided Feature Selection Identifies Informative Engagement Indicators While Reducing Feature Redundancy
A primary objective of this study was to determine whether wrapper-based ACO FS could identify a compact subset of LMS engagement indicators while maintaining or improving predictive performance. The results in Table 4 show that ACO reduced the predictor space from nine original LMS engagement indicators to six for GB and seven for both Stacking and RF. This represents reductions of 33.3% for GB and 22.2% for Stacking and RF. The findings indicate that some predictors provided limited additional information when considered jointly with the retained indicators.
Several indicators were consistently selected across all three ACO–ensemble models, namely Freq_Course_View, Freq_Forum_Contribute, Session_Count, Freq_Lecture_View, Regularity_Forum_Contribute, and Total_Duration. Their consistent selection suggests that these indicators contain complementary information relevant to predicting students’ forum consumption behaviour. In contrast, Regularity_Course_View and Active_Days were excluded by all three models, suggesting that they contributed limited additional predictive information after the retained indicators were considered collectively. This illustrates the value of wrapper-based selection in assessing the predictive contribution of feature combinations rather than individual variables in isolation [20,21].
The findings are consistent with concerns regarding redundant or overlapping LMS engagement indicators in educational datasets [2,7,11]. They also support the use of intelligent wrapper-based optimisation where feature reduction needs to be considered alongside predictive performance and interpretability [24,25,26].
5.2. Behavioural, Cognitive and Social Engagement Collectively Explain Forum Consumption Behaviour
Interpreting the selected predictors using the engagement dimensions operationalised in Table 1 provides insight into the factors associated with students’ forum consumption behaviour. The selected indicators span behavioural, cognitive, and social engagement, supporting the multidimensional view of student engagement adopted in the study [18,19].
Behavioural engagement was strongly represented across the ACO–ensemble models. Session_Count, Freq_Lecture_View, and Total_Duration were selected by all three models, while Freq_Course_View was also consistently retained. These indicators reflect the extent and intensity of students’ interaction with the LMS. Their selection suggests that broader patterns of LMS participation provide useful information for predicting forum consumption behaviour. This is consistent with previous research showing that observable LMS activity can provide meaningful evidence of student engagement and learning behaviour [30,35,55,60].
Social engagement was also consistently represented through Freq_Forum_Contribute and Regularity_Forum_Contribute. Their selection across the three models indicates that active participation in forum discussions is associated with the frequency with which students consume forum content. This relationship is consistent with Social Learning Theory, which emphasises learning through interaction, observation, and participation in social environments [52,53]. It also aligns with research highlighting the role of discussion forums in supporting communication, collaboration, knowledge construction, and sustained learner engagement [45,48,51].
The cognitive engagement dimension was represented by Regularity_Lecture_View, which was selected by the Stacking and RF models. Its model-specific selection suggests that regularity in accessing learning content may provide additional predictive information beyond the common behavioural and social indicators. The finding is consistent with research linking regular and sustained learning activity with student progress and engagement [40,41,42].
Overall, the feature-selection results suggest that forum consumption behaviour is associated with a combination of broader LMS participation, learning-resource access, and active forum participation rather than a single engagement dimension. The findings therefore support the multidimensional operationalisation of engagement used in this study and demonstrate how LMS interaction indicators can provide measurable evidence for understanding students’ forum consumption behaviour within an Educational Data Mining (EDM) framework [54].
5.3. ACO-Enhanced Ensemble Learning Improves Predictive Performance While Preserving Model Robustness
The second objective of this study was to determine whether ACO-guided FS could improve the predictive performance of the ensemble models while reducing the number of LMS predictors. The results presented in Table 6 and Figure 5 demonstrate that feature reduction did not compromise predictive performance. The GB predictor set was reduced from nine to six variables, while Stacking and RF were reduced from nine to seven variables. Despite these reductions, all three ACO–ensemble models achieved higher R2 values and lower prediction errors than their corresponding baseline models. The largest improvement was observed for RF, for which R2 increased from 0.8109 to 0.8265, while GB achieved the strongest overall predictive performance after FS. These findings suggest that the excluded predictors contributed limited additional predictive information and that ACO retained a more informative subset of LMS engagement indicators.
The robustness of the resulting models is further supported by Figure 4 and Figure 5 and Table 6. The close alignment between observed and predicted values in Figure 4 and the substantial overlap between observed and predicted distributions in Figure 5 indicate that the ACO–ensemble models captured the main patterns of forum consumption behaviour. Furthermore, the close correspondence between repeated cross-validation and test-fold performance in Table 6 indicates that predictive performance remained relatively consistent across repeated data partitions. Taken together, these findings demonstrate that ACO-based FS can reduce predictor dimensionality while maintaining or improving predictive performance and preserving consistent model behaviour across the evaluated ensemble learning approaches.
6. Conclusions
This study proposed a hybrid ACO–ensemble learning framework for predicting students’ forum consumption behaviour using LMS-derived engagement indicators. Guided by EDM and Social Learning Theory SLT, the framework integrated wrapper-based Ant ACO with three complementary ensemble regression models—RF, GB, and Stacking—to identify informative engagement indicators while reducing predictor redundancy.
The results demonstrate that ACO-based FS effectively reduced the original nine LMS predictors to six for GB and seven for Stacking and RF, without compromising predictive performance. All three ACO–ensemble models achieved improved R2 and reduced prediction errors compared with their corresponding baseline models. ACO-GB achieved the strongest overall predictive performance, while ACO-RF demonstrated the largest improvement relative to its baseline model. These findings indicate that the excluded predictors contributed limited additional predictive information and that ACO was able to identify more compact subsets while retaining the information required to predict forum consumption behaviour.
The consistency of the results across the evaluated ACO parameter configurations provides empirical evidence of parameter consistency within the tested search settings. Furthermore, the close agreement between repeated cross-validation and test-fold performance indicates that the ACO–ensemble models maintained consistent predictive performance across repeated data partitions. These findings collectively address the study objectives by demonstrating that ACO-based wrapper FS can reduce LMS predictor dimensionality while maintaining or improving predictive performance across complementary ensemble learning approaches.
The study also provides educational insights into the multidimensional nature of student engagement. The selected predictors represented behavioural, cognitive, and social engagement dimensions, suggesting that forum consumption behaviour is associated with broader patterns of LMS participation, learning-resource interaction, and forum participation. This supports the use of LMS interaction indicators as measurable proxies for understanding student engagement within online learning environments.
Methodologically, the study demonstrates the potential of combining intelligent FS with complementary ensemble learning mechanisms to develop more parsimonious predictive models. The resulting feature reduction also improves the interpretability of the predictor space by highlighting engagement indicators that contributed most consistently to the prediction task. From a learning analytics perspective, these findings can support the development of data-driven approaches for monitoring student engagement and identifying patterns associated with forum consumption behaviour.
Future research should validate the framework using datasets from different institutions, disciplines, student populations, and LMS platforms to assess its broader applicability. Future studies could also examine multiple random seeds and more extensive ACO sensitivity analyses to further assess stochastic stability, as well as investigate alternative optimisation algorithms and additional LMS engagement indicators. Such extensions could provide further evidence regarding the robustness, generalisability, and interpretability of ACO-based FS for educational predictive modelling.
Author Contributions
Conceptualisation, F.L.Y.K. and R.M.; methodology, F.L.Y.K.; software, F.L.Y.K.; writing—original draft preparation, F.L.Y.K.; writing—review and editing, F.L.Y.K.; supervision, R.M. All authors have read and agreed to the published version of the manuscript.
Funding
This research received no external funding.
Data Availability Statement
The dataset used for training is available on the GitHub repository: https://github.com/lamethods/data/blob/main/9_longitudinalEngagement/LongitudinalEngagement.csv (accessed on 2 July 2026).
Conflicts of Interest
The authors declare no conflict of interest.
Abbreviations
The following abbreviations are used in this manuscript:
| ACO | Ant Colony Optimisation |
| CV | cross-validation |
| EDM | Educational Data Mining |
| FS | Feature Selection |
| GAMs | Generalised Addictive Models |
| GB | Gradient Boosting |
| LIME | Local Interpretable Model-agnostic Explanations |
| LMS | Learning Management System |
| MAE | Mean Absolute Error |
| PCA | Principal Component Analysis |
| R2 | coefficient of determination |
| RF | Random Forest |
| RFE | Re-cursive Feature Elimination |
| RMSE | Root Mean Squared Error |
| SHAP | Shapley Addictive exPlanations |
| SLT | Social Learning Theory |
References
- Sanchez, L.; Penarreta, J.; Soria Poma, X. Learning management systems for higher education: A brief comparison. Discov. Educ. 2024, 3, 58. [Google Scholar] [CrossRef] [Scilit]
- Veluvali, P.; Surisetti, J. Learning management system for greater learner engagement in higher education—A review. High. Educ. Future 2022, 9, 107–121. [Google Scholar] [CrossRef] [Scilit]
- Pérez-Suay, A.; Van Vaerenbergh, S.; Diago, P.D.; Pascual-Venteo, A.B.; Ferri, F.J. Data-driven modeling through the moodle learning management system: An empirical study based on a mathematics teaching subject. IEEE Rev. Iberoam. Tecnol. Aprendiz. 2023, 18, 19–27. [Google Scholar] [CrossRef] [Scilit]
- Nisak, S.K. Optimizing Interactive Learning Management System (LMS) in Improving Students’ English Language Skills. Zabags Int. J. Educ. 2024, 2, 78–87. [Google Scholar] [CrossRef] [Scilit]
- Almusharraf, A.I. An investigation of university students’ perceptions of learning management systems: Insights for enhancing usability and engagement. Sustainability 2024, 16, 10037. [Google Scholar] [CrossRef] [Scilit]
- Husni, N.A.; Jumaat, N.; Tasir, Z. Investigating student’s cognitive engagement, motivation and cognitive retention in learning management system. Int. J. Emerg. Technol. Learn. (iJET) 2022, 17, 184–200. [Google Scholar] [CrossRef] [Scilit]
- Karapiperis, D.; Tzafilkou, K.; Tsoni, R.; Feretzakis, G.; Verykios, V.S. A probabilistic approach to modeling students’ interactions in a learning management system for facilitating distance learning. Information 2023, 14, 440. [Google Scholar] [CrossRef] [Scilit]
- Barbare, L.; Jurenoks, A.; Rauba, M.; Viskere, Z. METHODOLOGY FOR ANALYSING LMS DATA TO PREDICT STUDENT DROPOUT RISK IN HIGHER EDUCATION. In Environment. Technology. Resources. Proceedings of the International Scientific and Practical Conference; RTU Press: Riga, Latvia, 2025; Volume 2, pp. 57–64. [Google Scholar] [CrossRef] [Scilit]
- Fahimey, A.F.M.; Masrom, M.; Suwastika, N.A.; Azizan, A.; Othman, S.A.; Nuha, H.H. Enhancing learning management systems with artificial intelligence in vocational education in malaysia. In 2024 IEEE International Conference on Computing (ICOCO), Kuala Lumpur, Malaysia; IEEE: Piscataway, NJ, USA, 2024; pp. 474–478. [Google Scholar]
- Mehnen, L.; Pohn, B. Supporting academic teaching with integrating AI in learning management systems: Introducing a toolchain for students and lecturers. In 2024 International Conference on Software, Telecommunications and Computer Networks (SoftCOM); IEEE: New York, NY, USA, 2024; pp. 1–6. [Google Scholar]
- Iranzad, R.; Liu, X. A review of random forest-based feature selection methods for data science education and applications. Int. J. Data Sci. Anal. 2025, 20, 197–211. [Google Scholar] [CrossRef] [Scilit]
- Abraham, B.M.; Jyothirmai, M.V.; Sinha, P.; Viñes, F.; Singh, J.K.; Illas, F. Catalysis in the digital age: Unlocking the power of data with machine learning. Wiley Interdiscip. Rev. Comput. Mol. Sci. 2024, 14, e1730. [Google Scholar] [CrossRef] [Scilit]
- Pelger, M.; Xiong, R. Interpretable sparse proximate factors for large dimensions. J. Bus. Econ. Stat. 2022, 40, 1642–1664. [Google Scholar] [CrossRef] [Scilit]
- Zhang, X.; Xiong, H. Interpretable feature interaction via statistical self-supervised learning on tabular data. Mach. Learn. Sci. Technol. 2026, 7, 015022. [Google Scholar] [CrossRef] [Scilit]
- Yu, Y.; Wang, D.; Chen, Y.; Wang, H.; Huang, M. Contribution Tracking Feature Selection (CTFS) Based on the Fusion of Sparse Autoencoder and Mutual Information. Comput. Mater. Contin. 2024, 81, 3761–3780. [Google Scholar] [CrossRef] [Scilit]
- Zhou, P.; Liang, J.; Yan, Y.; Zhao, S.; Wu, X. Explainable feature selection and ensemble classification via feature polarity. Inf. Sci. 2024, 676, 120818. [Google Scholar] [CrossRef] [Scilit]
- Retzlaff, C.O.; Angerschmid, A.; Saranti, A.; Schneeberger, D.; Roettger, R.; Mueller, H.; Holzinger, A. Post-hoc vs ante-hoc explanations: XAI design guidelines for data scientists. Cogn. Syst. Res. 2024, 86, 101243. [Google Scholar] [CrossRef] [Scilit]
- Wiedbusch, M.; Dever, D.; Li, S.; Amon, M.J.; Lajoie, S.; Azevedo, R. Measuring multidimensional facets of SRL engagement with multimodal data. In Unobtrusive Observations of Learning in Digital Environments: Examining Behavior, Cognition, Emotion, Metacognition and Social Processes Using Learning Analytics; Springer: Berlin/Heidelberg, Germany, 2023; pp. 141–173. [Google Scholar]
- Wang, M.-T.; Scanlon, C.L.; Henry, D.A. Learning motivation and engagement. In Encyclopedia of Adolescence, 2nd ed.; Neblett, E., Troop-Gordon, W., Eds.; Academic Press: New York, NY, USA, 2024. [Google Scholar] [CrossRef] [Scilit]
- Njoku, U.F.; Abelló Gamazo, A.; Bilalli, B.; Bontempi, G. Wrapper methods for multi-objective feature selection. In 26th International Conference on Extending Database Technology, Ioannina, Greece; Open Proceedings: Konstanz, Germany, 2023; pp. 697–709. [Google Scholar]
- Pudjihartono, N.; Fadason, T.; Kempa-Liehr, A.W.; O’Sullivan, J.M. A review of feature selection methods for machine learning-based disease risk prediction. Front. Bioinform. 2022, 2, 927312. [Google Scholar] [CrossRef] [Scilit] [PubMed]
- Fahd, K.; Miah, S.J.; Ahmed, K. Predicting student performance in a blended learning environment using learning management system interaction data. Appl. Comput. Inform. 2025, 21, 220–231. [Google Scholar] [CrossRef] [Scilit]
- Cruz, J.; Florentino, M.; Lacatan, L.; Peralta, R. Leveraging Predictive Analytics on LMS Logs to Examine the Impact of Engagement on Academic Performance among College Students Enrolled in Centro Escolar University. Int. J. Res. Sci. Innov. 2025, XII, 563–573. [Google Scholar] [CrossRef] [Scilit]
- Yilmaz Eroglu, D.; Akcan, U. An adapted ant colony optimization for feature selection. Appl. Artif. Intell. 2024, 38, 2335098. [Google Scholar] [CrossRef] [Scilit]
- Balasubramaniam, S.; Kadry, S.; Tk, M.K.; Kumar, K.S. Bio-Inspired Algorithms in Machine Learning and Deep Learning for Disease Detection; CRC Press: Boca Raton, FL, USA, 2025. [Google Scholar]
- Ma, C. Improving the Prediction of Student Performance by Integrating a Random Forest Classifier with Meta-Heuristic Optimization Algorithms. Int. J. Adv. Comput. Sci. Appl. 2024, 15, 1032. [Google Scholar] [CrossRef] [Scilit]
- Ma, W.; Zhou, X.; Zhu, H.; Li, L.; Jiao, L. A two-stage hybrid ant colony optimization for high-dimensional feature selection. Pattern Recognit. 2021, 116, 107933. [Google Scholar] [CrossRef] [Scilit]
- Khalifa, A.; Said, F.B.; Kacem, Y.H. Optuna-optimized meta-learner and ensemble learning models for student performance prediction. Procedia Comput. Sci. 2025, 270, 1826–1835. [Google Scholar] [CrossRef] [Scilit]
- Khan, M.; Naz, S.; Khan, Y.; Zafar, M.; Khan, M.; Pau, G. Utilizing machine learning models to predict student performance from LMS activity logs. IEEE Access 2023, 11, 86953–86962. [Google Scholar] [CrossRef] [Scilit]
- Maluleke, A.F. Enhancing learning analytics through learning management systems engagement in African higher education. J. Educ. Learn. Technol. 2024, 5, 130–149. [Google Scholar] [CrossRef] [Scilit]
- Waheed, H.; Hassan, S.-U.; Aljohani, N.R.; Hardman, J.; Alelyani, S.; Nawaz, R. Predicting academic performance of students from VLE big data using deep learning models. Comput. Hum. Behav. 2020, 104, 106189. [Google Scholar] [CrossRef] [Scilit]
- Młynarska, E.; Greene, D.; Cunningham, P. Indicators of good student performance in moodle activity data. arXiv 2016, arXiv:1601.02975. [Google Scholar]
- Bonafini, F.; Chae, C.; Park, E.; Jablokow, K. How much does student engagement with videos and forums in a MOOC affect their achievement? Online Learn. J. 2017, 21, 4. [Google Scholar] [CrossRef] [Scilit]
- Hussain, M.; Zhu, W.; Zhang, W.; Abidi, S.M.R. Student Engagement Predictions in an e-Learning System and Their Impact on Student Course Assessment Scores. Comput. Intell. Neurosci. 2018, 2018, 6347186. [Google Scholar] [CrossRef] [Scilit] [PubMed]
- Kumi, R. Discussion forums and student engagement: A social network analysis perspective. Decis. Sci. J. Innov. Educ. 2023, 21, 197–207. [Google Scholar] [CrossRef] [Scilit]
- Saqr, M.; López-Pernas, S.; Helske, S.; Hrastinski, S. The longitudinal association between engagement and achievement varies by time, students’ profiles, and achievement state: A full program study. Comput. Educ. 2023, 199, 104787. [Google Scholar] [CrossRef] [Scilit]
- Lu, C.; Bulut, O.; Demmans Epp, C.; Gierl, M. Impacts of engagement on academic outcomes in technology-enhanced learning. Distance Educ. 2025, 46, 318–337. [Google Scholar] [CrossRef] [Scilit]
- Rajabalee, Y.B.; Santally, M.I.; Rennie, F. The use of learning analytics to improve online learning outcomes: A systematic literature review. In Proceedings of the Pan Commonwealth Forum on Open and Online Learning (PCF9), Edinburgh, Scotland, 9–12 September 2019. [Google Scholar]
- Sandeep, S.; Shelton, C.R.; Pahor, A.; Jaeggi, S.M.; Seitz, A.R. Application of machine learning models for tracking participant skills in cognitive training. Front. Psychol. 2020, 11, 1532. [Google Scholar] [CrossRef] [Scilit] [PubMed]
- Ahmadi, G.; Mohammadi, A.; Asadzandi, S.; Shah, M.; Mojtahedzadeh, R. What are the indicators of student engagement in learning management systems? a systematized review of the literature. Int. Rev. Res. Open Distrib. Learn. 2023, 24, 117–136. [Google Scholar] [CrossRef] [Scilit]
- Shayan, P.; van Zaanen, M. Predicting student performance from their behavior in learning management systems. Int. J. Inf. Educ. Technol. 2019, 9, 337–341. [Google Scholar] [CrossRef] [Scilit]
- Arévalo-Cordovilla, F.E.; Peña, M. Comparative analysis of machine learning models for predicting student success in online programming courses: A study based on LMS data and external factors. Mathematics 2024, 12, 3272. [Google Scholar] [CrossRef] [Scilit]
- Ayouni, S.; Hajjej, F.; Maddeh, M.; Al-Otaibi, S. A new ML-based approach to enhance student engagement in online environment. PLoS ONE 2021, 16, e0258788. [Google Scholar] [CrossRef] [Scilit] [PubMed]
- Mikić, V.; Keković, G.; Mangaroska, K.; Ilić, M.; Kopanja, L.; Vesin, B. Exploring learner engagement in e-learning environments: A predictive analytics perspective. Int. J. Hum.-Comput. Interact. 2026, 42, 3896–3919. [Google Scholar] [CrossRef] [Scilit]
- Yee, M.; Roy, A.; Perdue, M.; Cuevas, C.; Quigley, K.; Bell, A.; Rungta, A.; Miyagawa, S. AI-assisted analysis of content, structure, and sentiment in MOOC discussion forums. Front. Educ. 2023, 8, 1250846. [Google Scholar] [CrossRef] [Scilit]
- He, C.; Ma, P.; Zhou, L.; Wu, J. Is Participating in MOOC Forums Important for Students? A Data-driven Study from the Perspective of the Supernetwork. J. Data Inf. Sci. 2018, 3, 62–77. [Google Scholar] [CrossRef] [Scilit]
- Azmuddin, R.A.; Jamalai, M.; Rahim, A.A.A.; Ali, M.M.A.; Khamis, N.Y. Exploration of online discussion forum on reading EST texts for ESL learners. Malays. J. Learn. Instr. 2022, 19, 97–122. [Google Scholar] [CrossRef] [Scilit]
- Al-Husban, N.A. Critical thinking skills in asynchronous discussion forums: A case study. Int. J. Technol. Educ. 2020, 3, 82–91. [Google Scholar] [CrossRef] [Scilit]
- Gasmi, A.A. Through the Lens of Students: How Online Discussion Forums Affect Students’ Learning. Int. J. Technol. Educ. 2022, 5, 669–684. [Google Scholar] [CrossRef] [Scilit]
- Rafiq, J.E.; Amraouy, M.; Namir, A.; Bennane, A.; Zakrani, A. Optimizing learning performance through AI-enhanced discussion forums. In 2023 14th International Conference on Intelligent Systems: Theories and Applications (SITA); IEEE: New York, NY, USA, 2023; pp. 1–6. [Google Scholar]
- Nabavi, R.; Bijandi, M. A Literature Review on Bandura’s Social Learning Theory & Social Cognitive Learning Theory; University of Sciences & Culture: Tehran, Iran, 2012. [Google Scholar]
- Alam, A. Improving learning outcomes through predictive analytics: Enhancing teaching and learning with educational data mining. In 2023 7th International Conference on Intelligent Computing and Control Systems (ICICCS); IEEE: New York, NY, USA, 2023; pp. 249–257. [Google Scholar]
- Feng, L.; Heng, H. Research on the application of artificial intelligence technology in teaching the cultural inheritance and innovation of urban public space. Appl. Math. Nonlinear Sci. 2024, 9, 1–12. [Google Scholar] [CrossRef] [Scilit]
- Nkomo, L.M.; Daniel, B.K.; Butson, R.J. Synthesis of student engagement with digital technologies: A systematic review of the literature. Int. J. Educ. Technol. High. Educ. 2021, 18, 34. [Google Scholar]
- Hoyos, A.J.R.; Navarro, A.A.; Fuentes, A.P. QUANTITATIVE, QUALITATIVE, AND MIXED METHODS APPROACHES IN SCIENTIFIC RESEARCH: CONCEPTUAL FOUNDATIONS, DIFFERENCES, AND APPLICATIONS. Int. J. Appl. Math. 2025, 38, 595–604. [Google Scholar] [CrossRef] [Scilit]
- López-Pernas, S.; Saqr, M.; Conde, J.; Del-Río-Carazo, L. A broad collection of datasets for educational research training and application. In Learning Analytics Methods and Tutorials: A Practical Guide Using R; Springer Nature: Cham, Switzerland, 2024; pp. 17–66. [Google Scholar]
- García-Álvarez, M.T.; López-Rodríguez, J.; Teijeiro-Alvarez, M.; Mariz-Perez, R.M. El uso del foro en Educación Superior: Aplicación para la asignatura “Economía de la Empresa: Dirección y organización”. In Contextos Universitarios Transformadores: A Innovación Como Eixo Vertebrador da Docencia. VI Xornadas de Innovación Docente; Centro Universitario de Formación e Innovación Educativa: A Coruña, Spain, 2023; pp. 103–112. [Google Scholar]
- Hayadi, B.H.; Hariguna, T. Predictive Analytics in Mobile Education: Evaluating Logistic Regression, Random Forest, and Gradient Boosting for Course Completion Forecasting. Int. J. Interact. Mob. Technol. 2025, 19, 210–232. [Google Scholar] [CrossRef] [Scilit]
- Li, Q.; Wang, X. Bayesian optimization of stacking ensemble learning model for HPC compressive strength prediction. Expert Syst. Appl. 2025, 288, 128281. [Google Scholar] [CrossRef] [Scilit]
- Khan, Z.; Ali, A.; Khan, D.M.; Aldahmani, S. Regularized ensemble learning for prediction and risk factors assessment of students at risk in the post-COVID era. Sci. Rep. 2024, 14, 16200. [Google Scholar] [CrossRef] [Scilit] [PubMed]
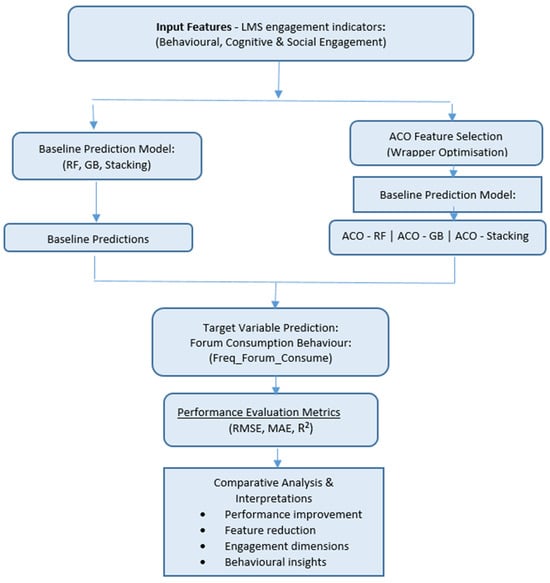
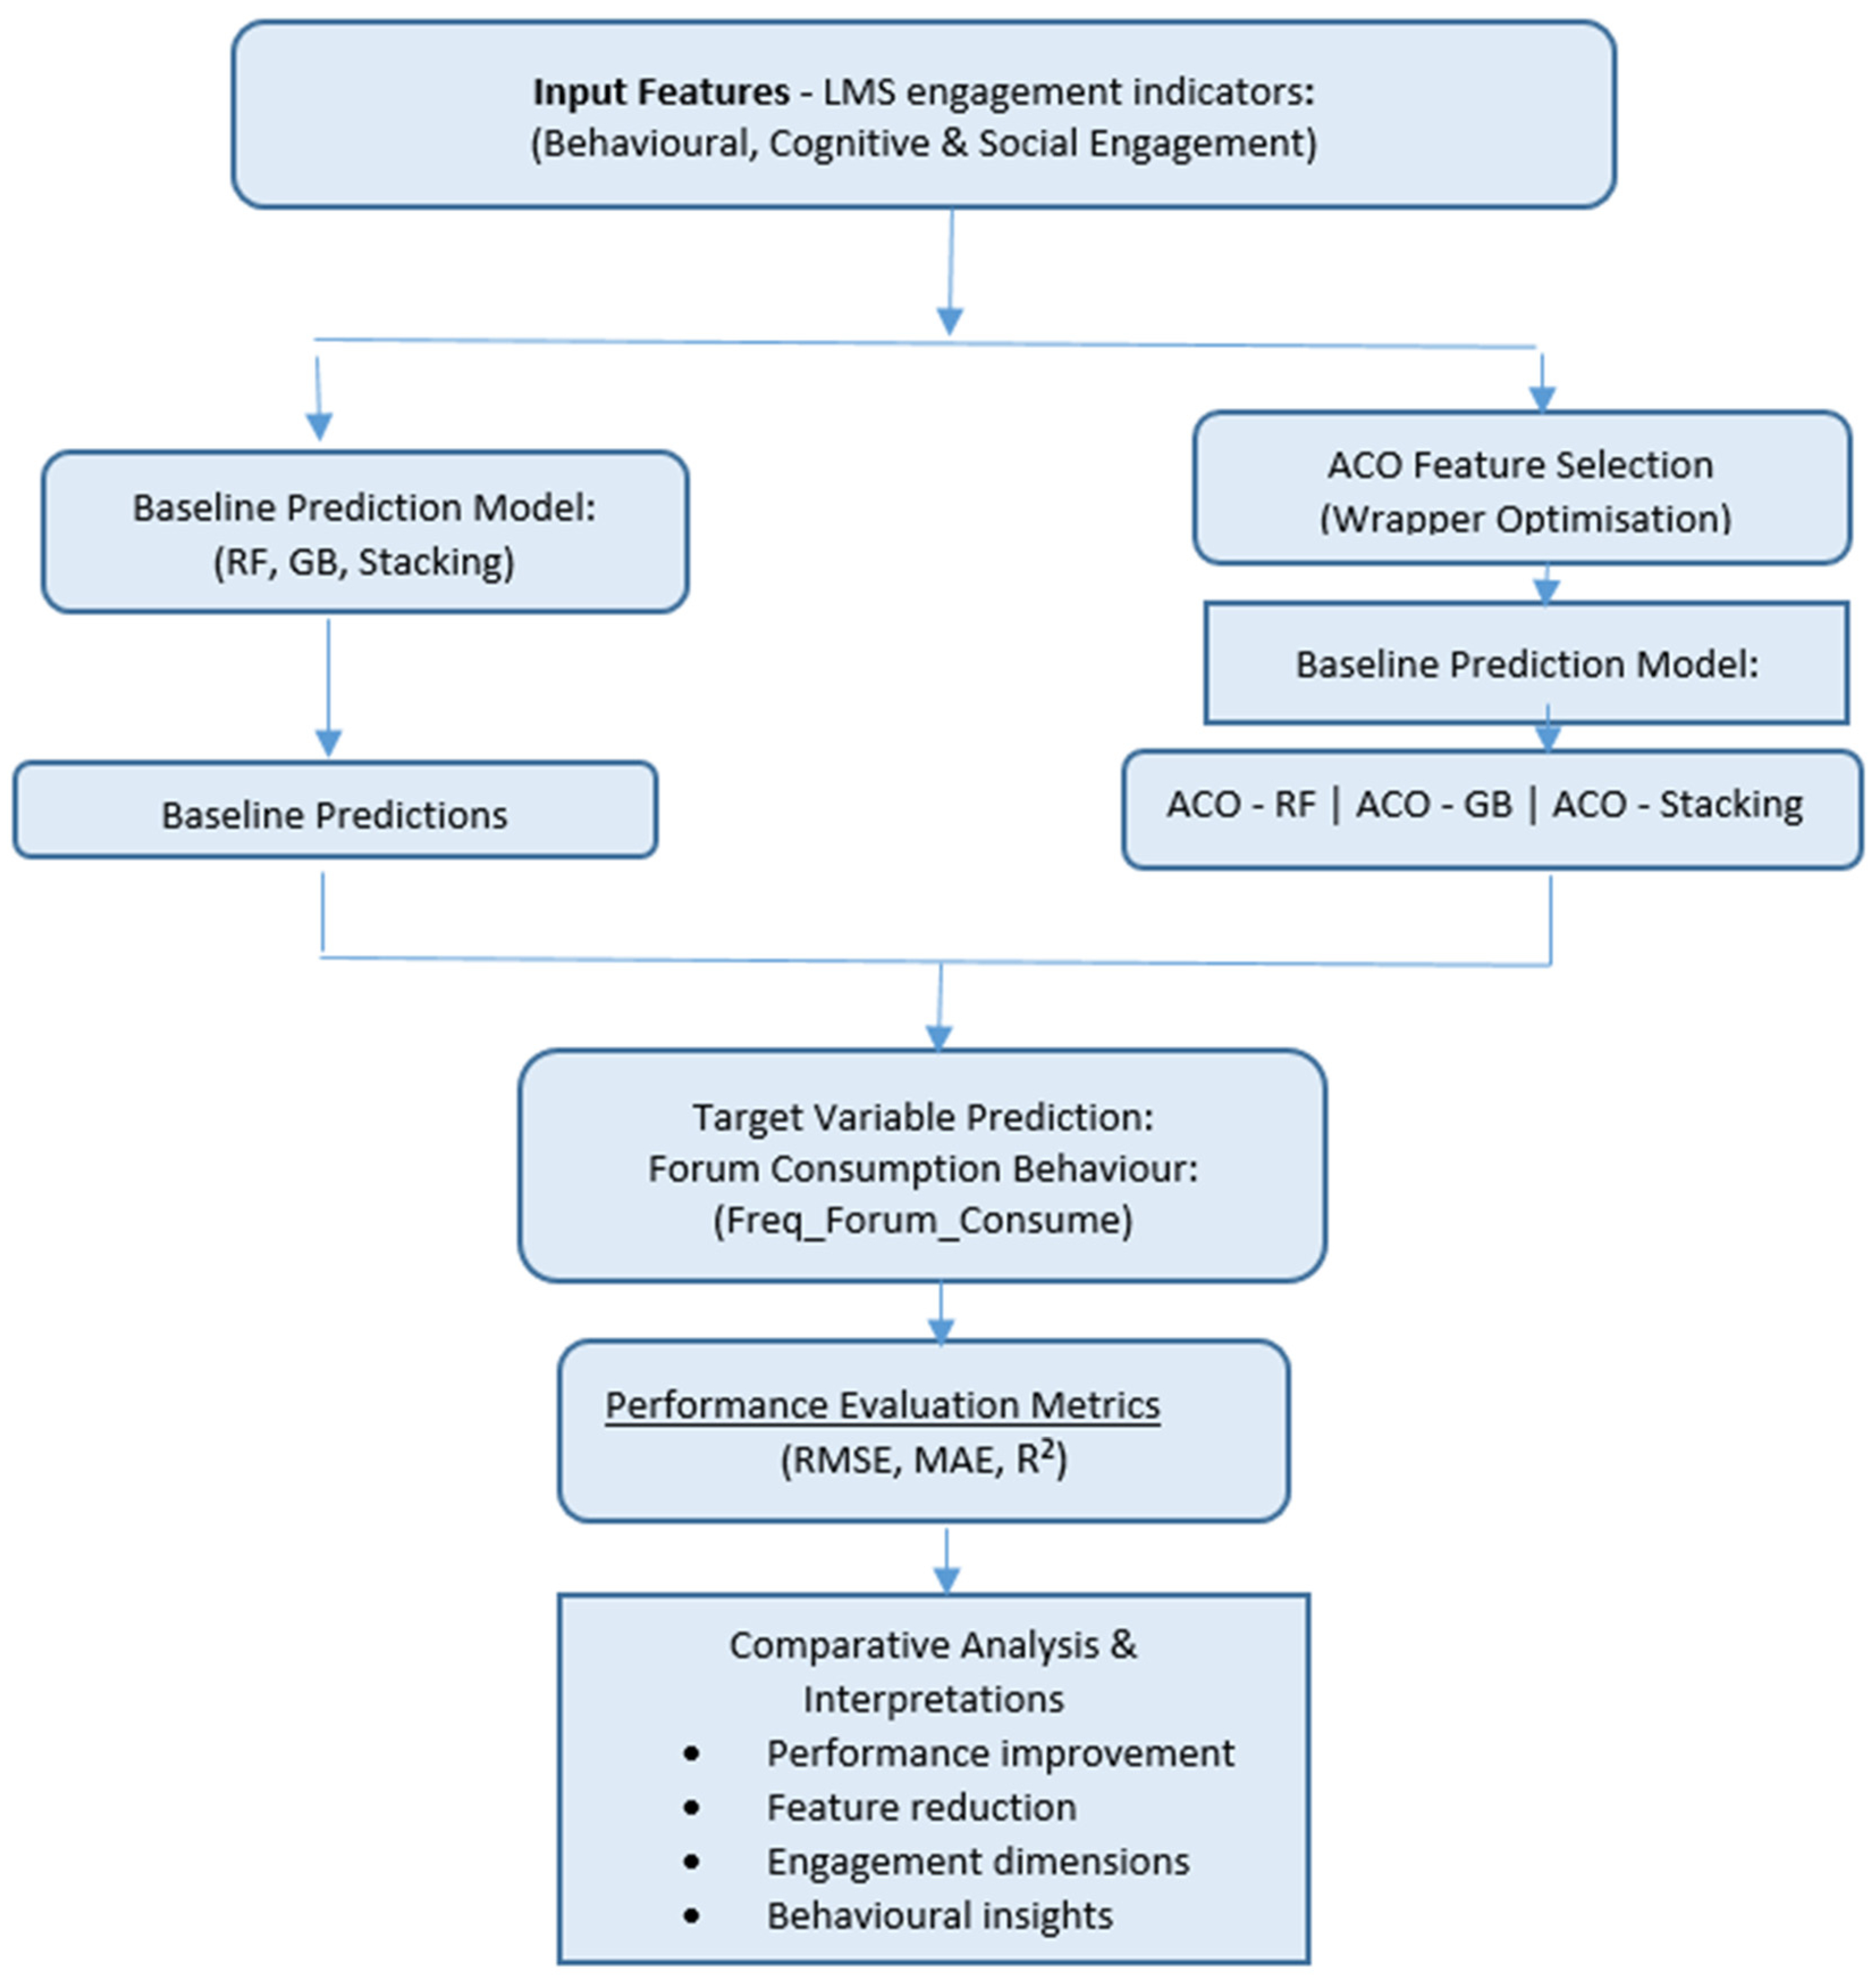
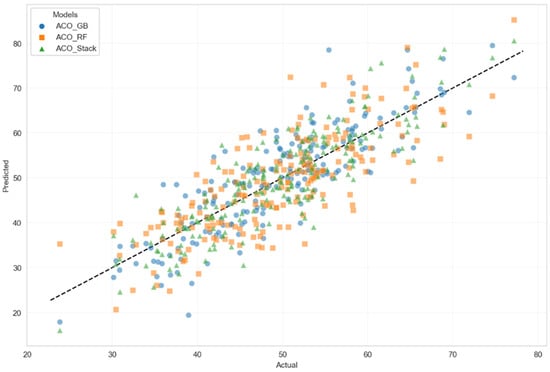
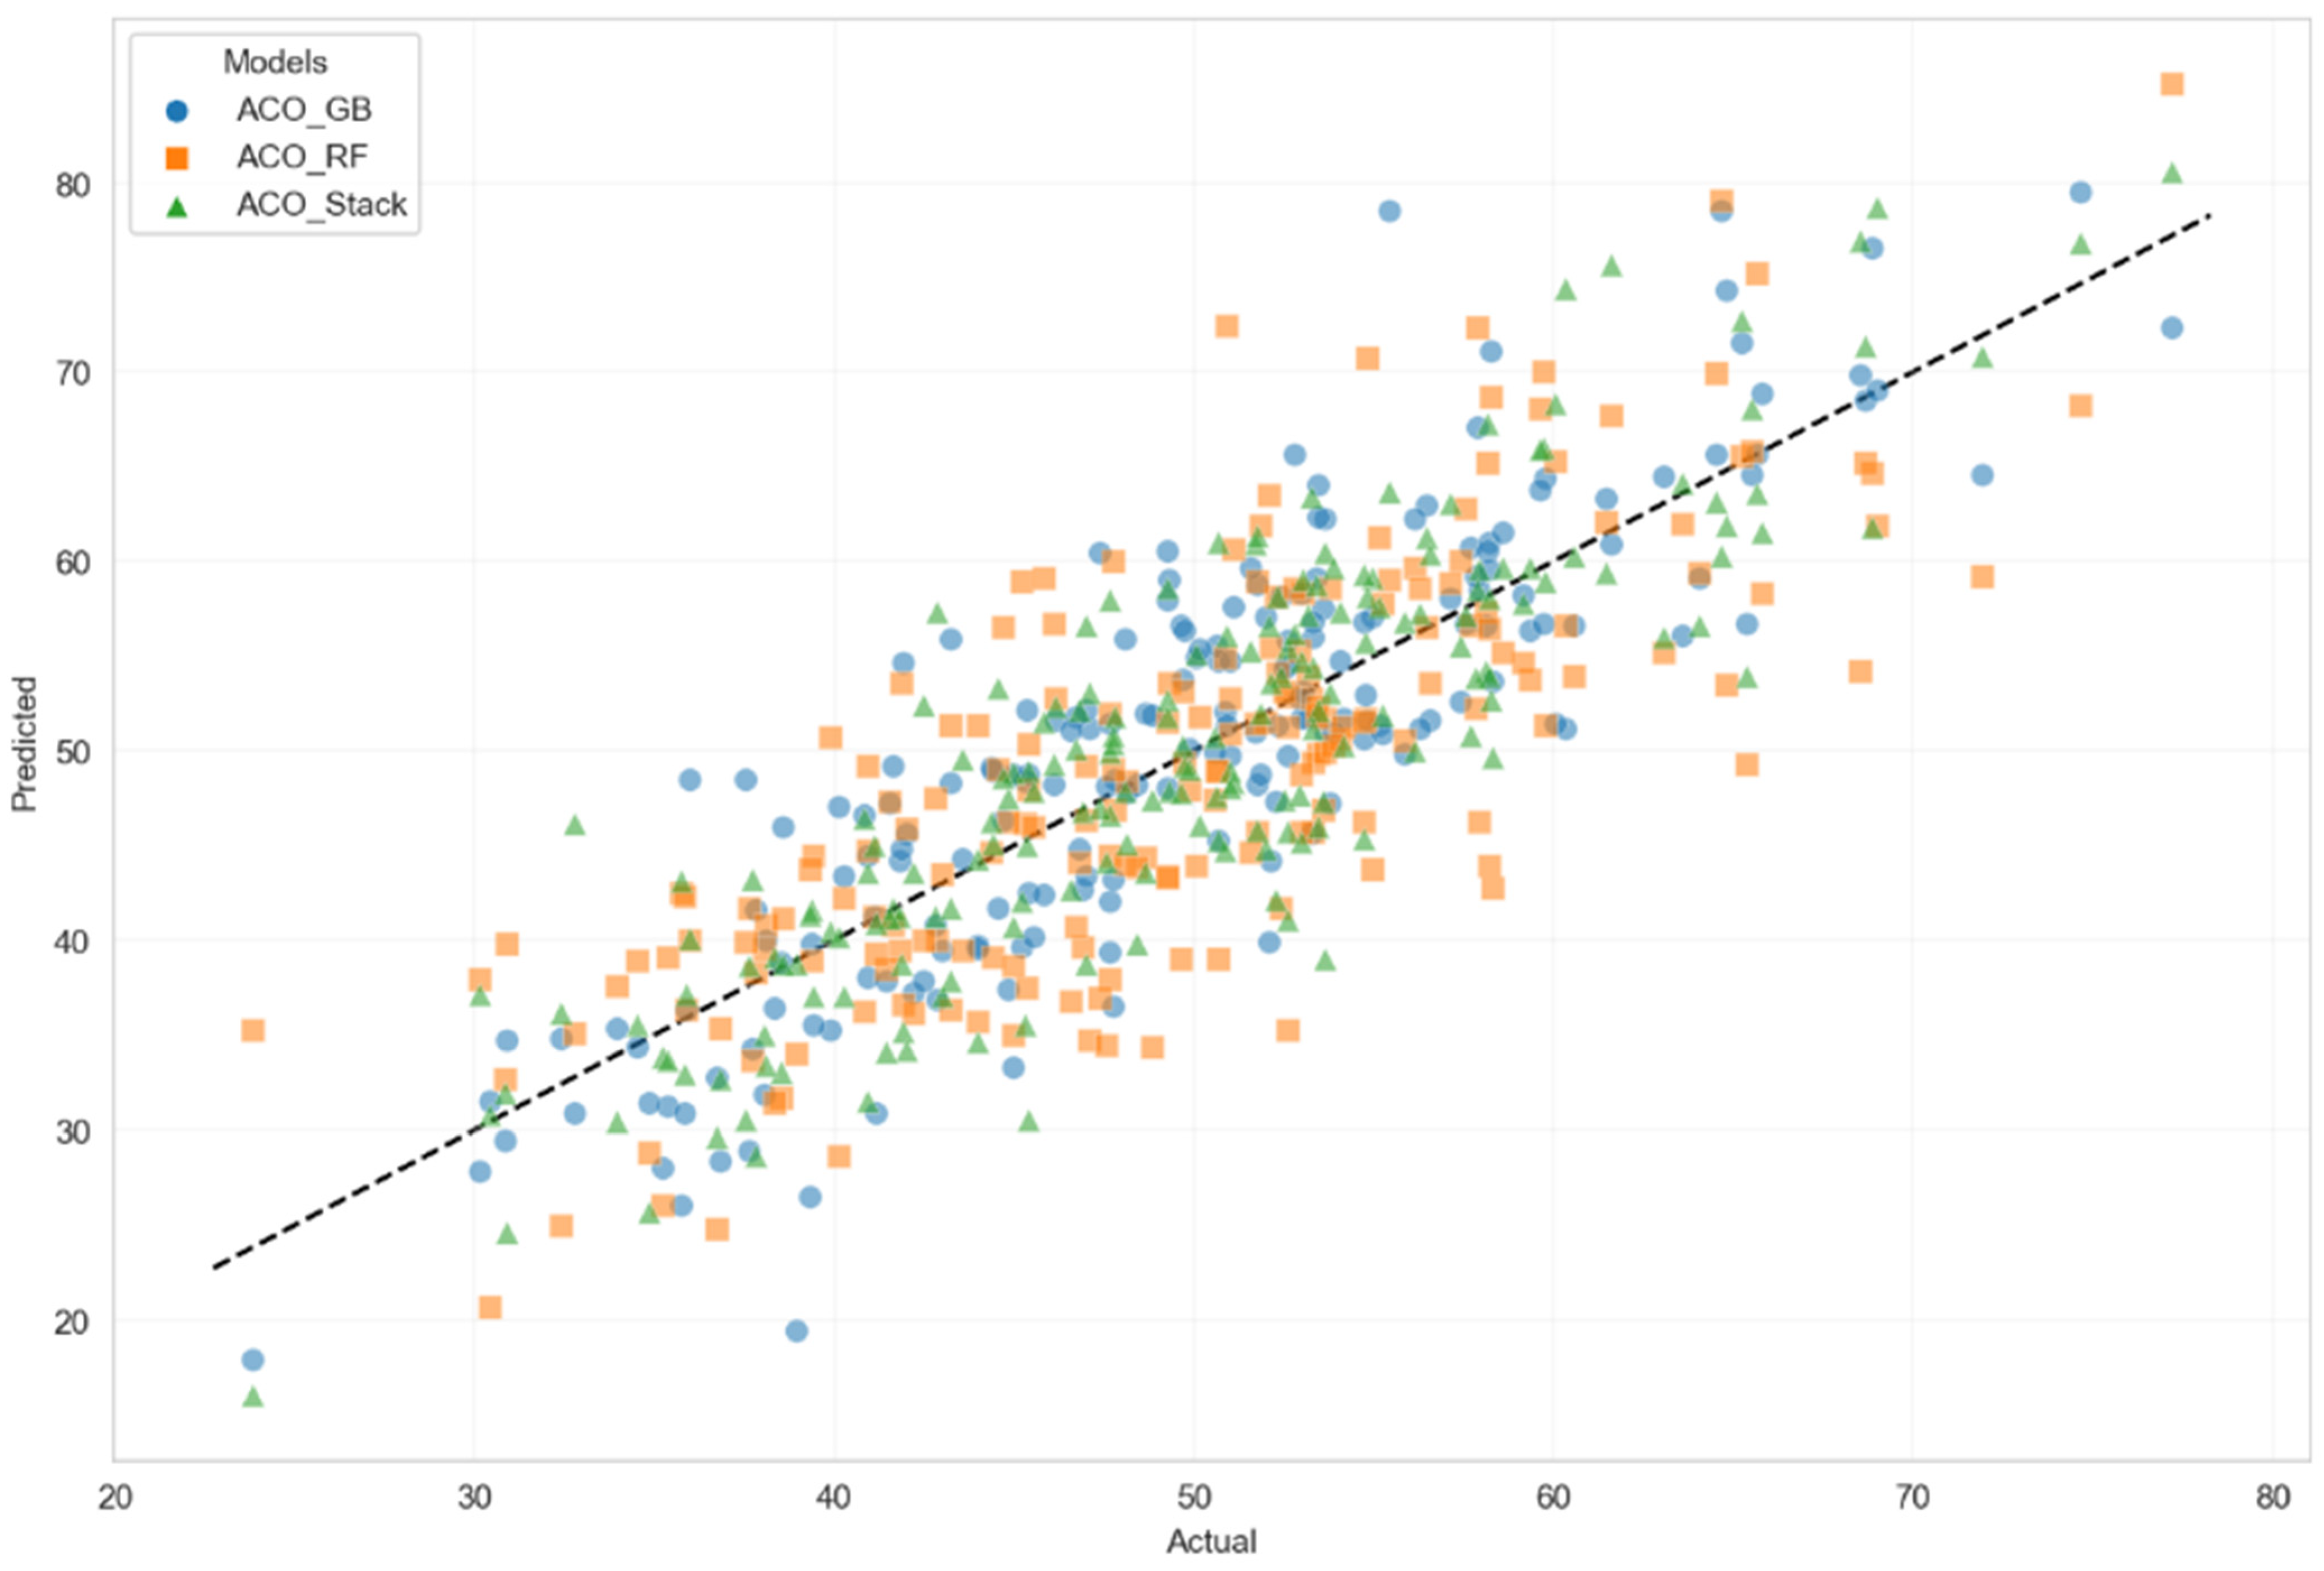
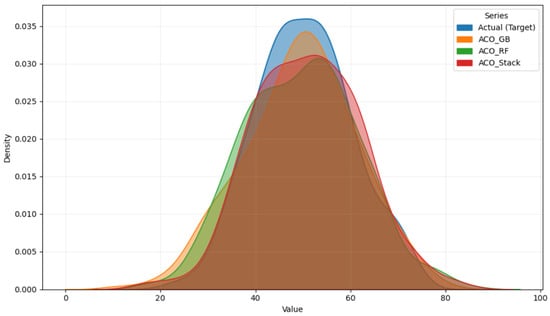
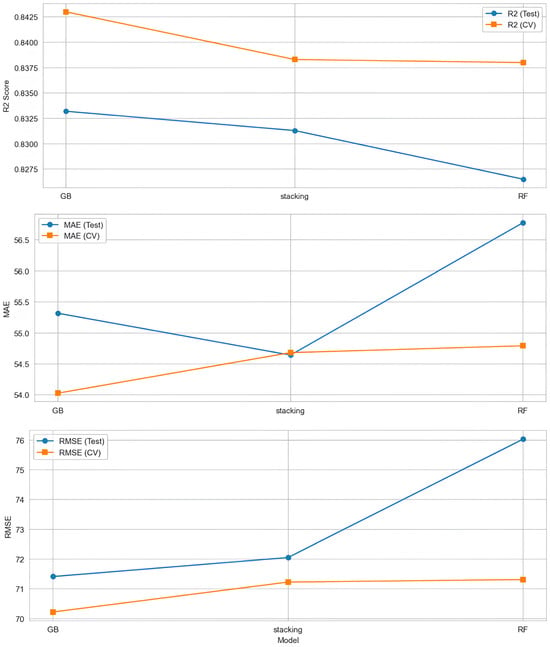
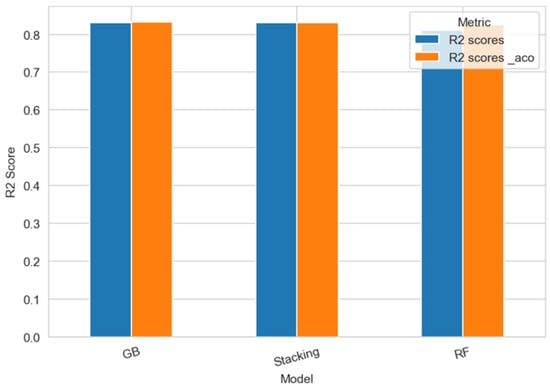
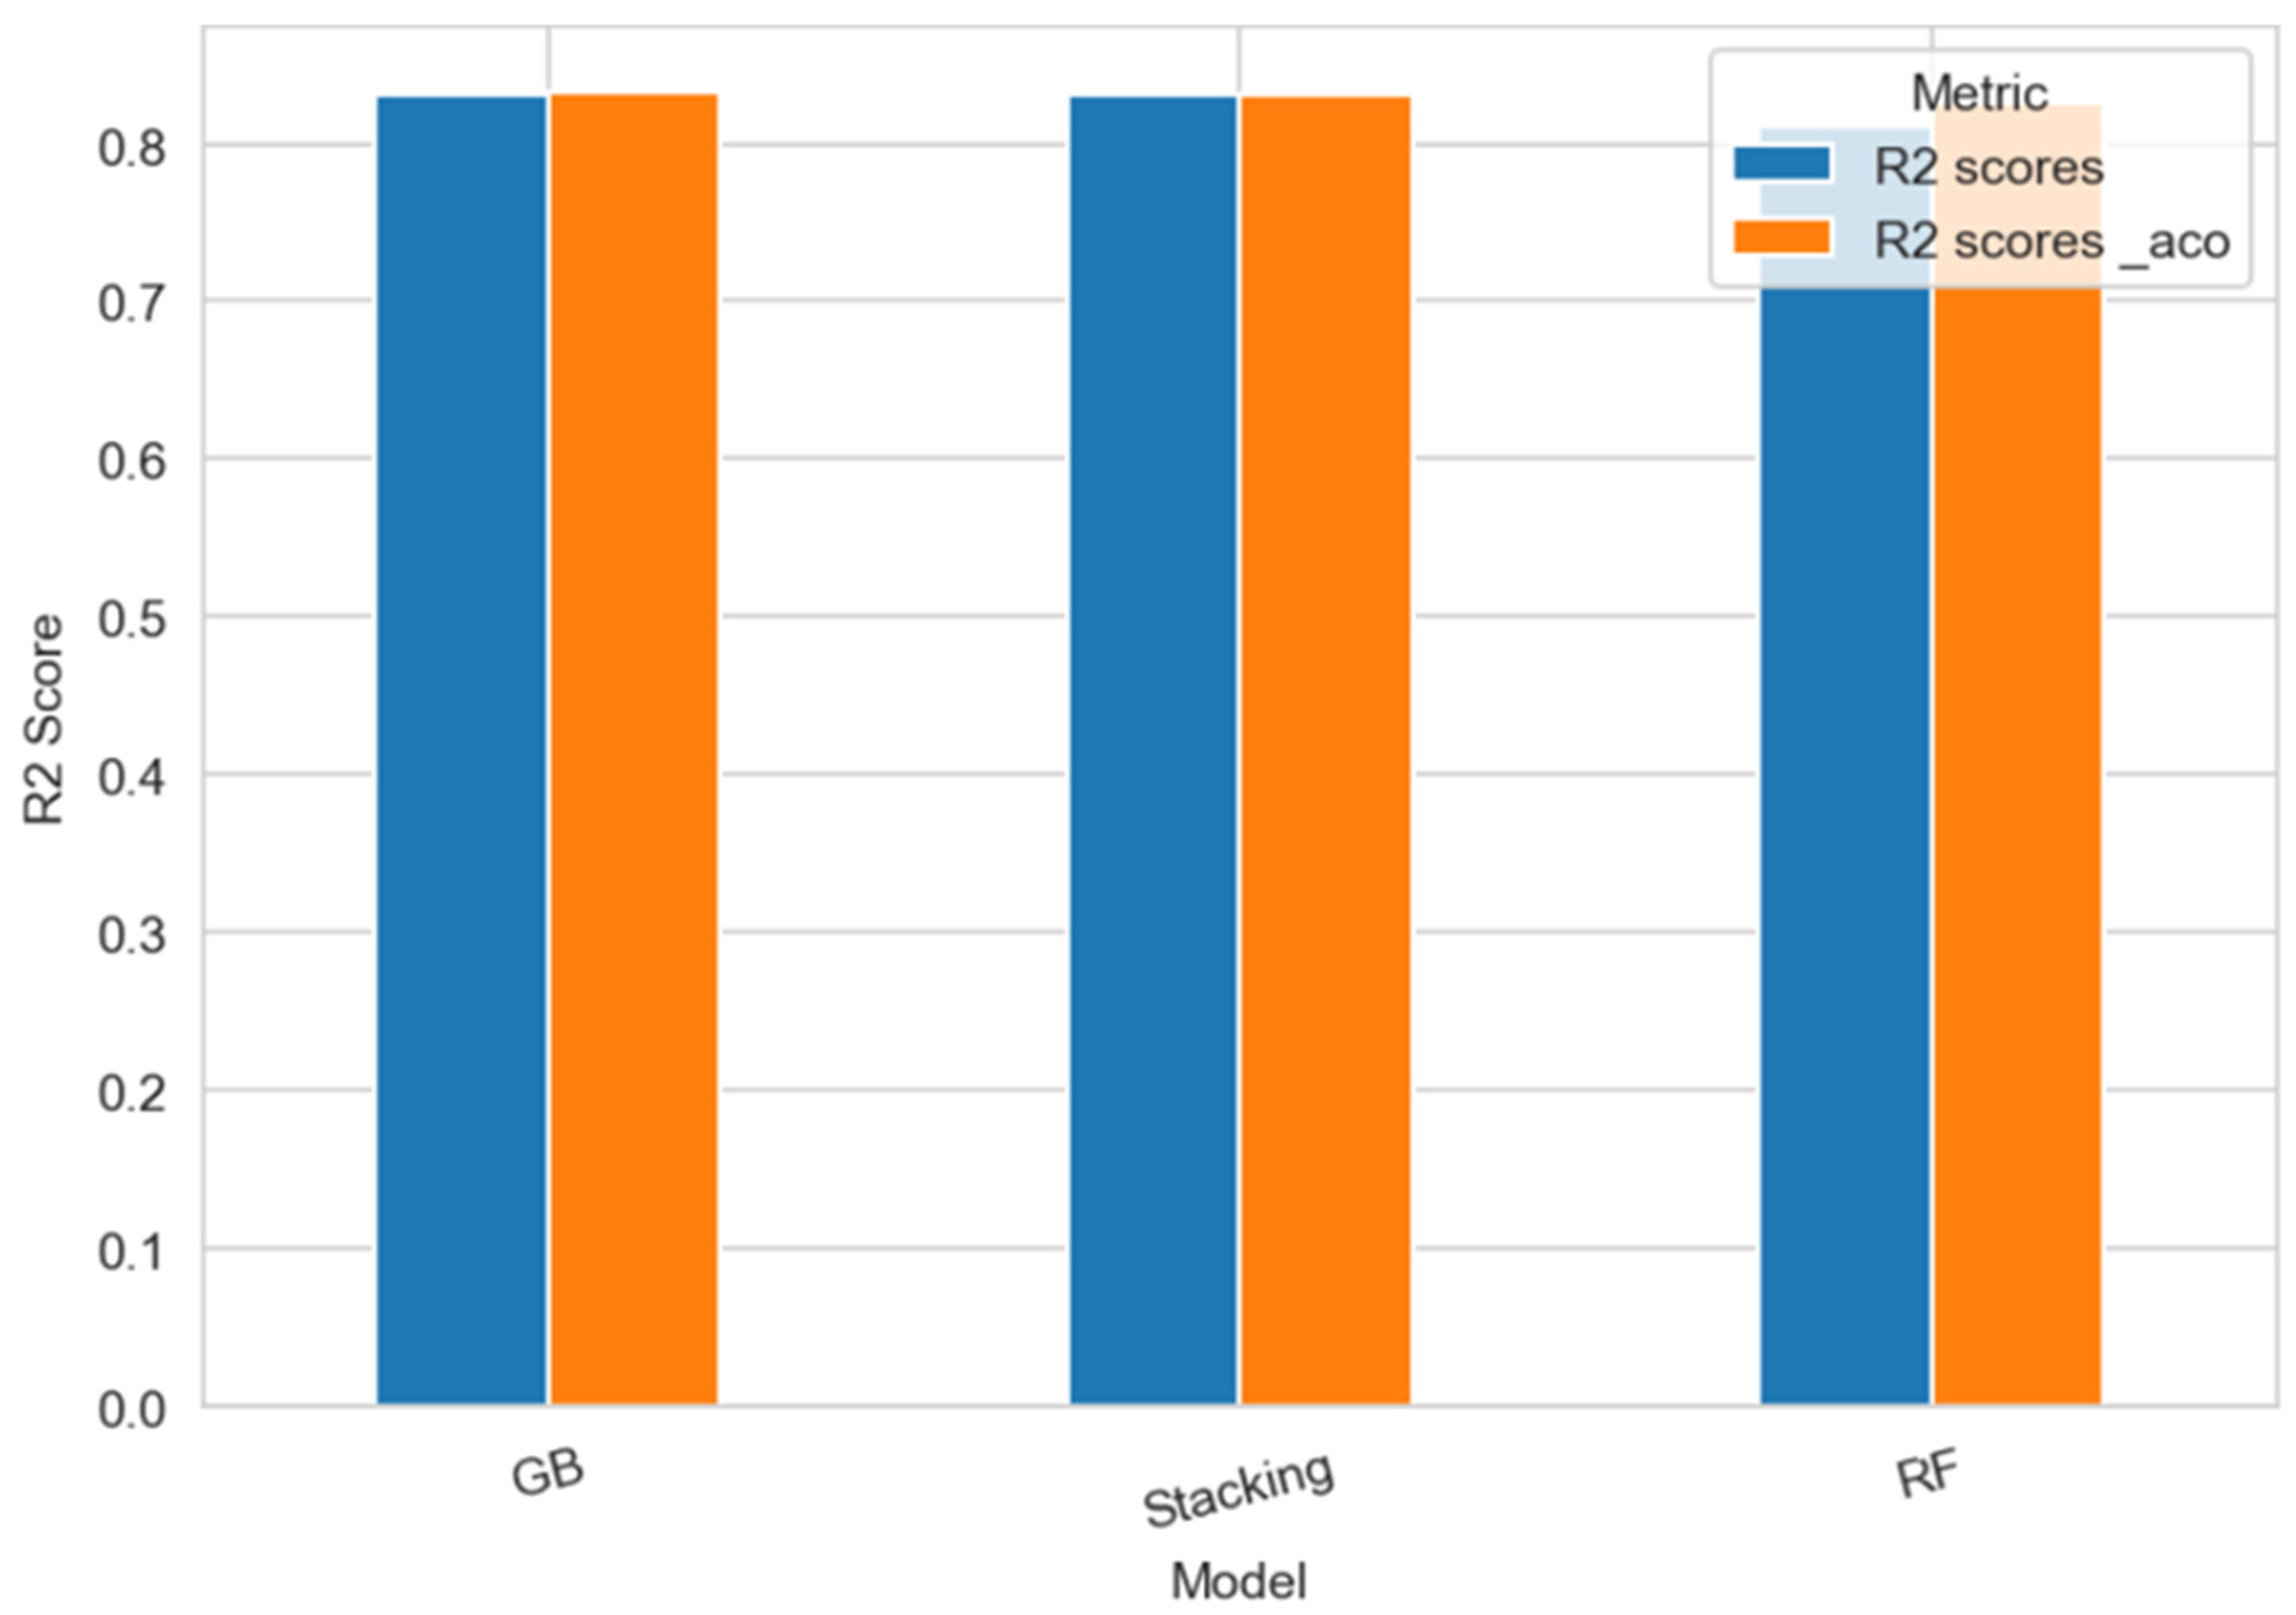

Disclaimer/Publisher’s Note: The statements, opinions and data contained in all publications are solely those of the individual author(s) and contributor(s) and not of MDPI and/or the editor(s). MDPI and/or the editor(s) disclaim responsibility for any injury to people or property resulting from any ideas, methods, instructions or products referred to in the content. |
© 2026 by the authors. Licensee MDPI, Basel, Switzerland. This article is an open access article distributed under the terms and conditions of the Creative Commons Attribution (CC BY) license.