


Abstract
This paper describes an intelligent, CAD-based decision support and optimization framework for predicting fabric waste directly from geometry attributes of apparel pattern segments. It is applicable during the early design stage, providing a pre-screening alternative prior to the use of time-consuming nesting software. A synthetic database of 1000 apparel layouts was generated through a specifically developed Python algorithm, which creates realistic geometries of apparel pattern segments based on skirts, bodices and sleeves for a stipulated fabric width. Eight geometry attributes, with the ability to represent pattern fragmentation, pattern size, shape attributes, boundary complexity, and overall pattern variation were derived, and a random forest (RF) regressor was formulated to predict the essential nesting efficiency (NE) parameter. It was tested utilizing 500 decision trees, with 75% available features allocated for each split. Model performance was tested with 5-fold cross-validation (CV) which led to a coefficient of determination of 0.922, with an average prediction error of −0.0002. Validation of the method with layouts created with the Deepnest software demonstrated promising agreement between software-predicted and model-predicted values of fabric NE. The key influential features were revealed as total perimeter, convexity, number of pattern pieces and compactness, accounting for 90% of model information.
1. Introduction
Due to cost reduction goals in the multibillion apparel industry [1], material conservation and sustainability has become a major issue in the apparel production process. Among all manufacturing processes, fabric consumption is the process with the highest contribution to production cost, and efficient pattern layout aims to address this issue at the garment design stage. The development of CAD tools and automatic nesting software have greatly advanced layout optimization. However, applying these tools repeatedly during the iterative design process for various apparel products is often time-consuming and computationally intensive. In recent years, many intelligent computer approaches have been studied to predict layout quality by using geometric information, which enables designers to evaluate apparel patterns before investing in nest software.
Fabric utilization is the most critical issue in apparel design and manufacturing. An early study from Heistermann and Lengauer [2] pointed out the significance of part nesting in the leather manufacturing industry and the problem that irregular shapes generate. The authors utilized an algorithmic approach to increase nesting efficiency (NE). Chryssolouris et al. [3] proposed a rule-based method that considers both NE and production objectives. This approach is based on the generation of scheduling alternatives, their transformation through rules into nesting solutions and their evaluation with respect to certain criteria that correspond to production objectives. Zhu et al. [4] proposed an algorithm for the 2D irregular nesting problem by taking into consideration the flaws on the textile fabric. A genetic algorithm (GA) was utilized to rank the pieces, and subsequently, a strategy was applied to achieve flaw circumvention and ascertain the pieces’ adjacency positioning. The authors integrated the method in a software environment for testing in a case study related to the textile industry. In general, researchers in the field either utilize commercial software for nesting [5,6] or develop and apply custom algorithms that focus on the optimal fabric utilization [7,8].
In recent years, the advent of AI-driven technologies and the development of machine learning (ML) methods have led to an increase in studies related to AI-assisted nesting in the textile industry. Salama et al. [9] presented a method that combines different optimization algorithms, including k-nearest neighbor, naive Bayes, decision trees, and support vector machine with an aim to classify the pattern size from the fabric layer. Noël et al. [10] proposed a two-stage model that combines data-driven non-rigid transformations for grading with layout optimization. Authors achieved an increase of about 70% in fabric utilization in an eight-trouser case study. Li et al. [11] worked on a framework that links material efficiency with production feasibility under uncertainty. The aim of the study is to improve both cutting stability and material utilization in practical production conditions. Lallier et al. [12] introduced a regression approach to estimate efficiency without directly nesting a layout. This approach models the 2D nesting problem as a graph where the nodes are images derived from pieces and the edges contain the constraint information. The method combines convolutional neural networks for capturing the image-based characteristics and graph neural networks for the constraints.
Overall, commercial nesting algorithms can produce highly optimized marker layouts, but repetitively executing the nesting process during the product iterative design stage is computationally time-consuming and relatively uneconomical for small to medium-sized production industries. It can also be difficult to evaluate the importance of certain particular pattern shapes on the overall NE during the CAD product design stage. Additionally, most studies in fabric utilization rely either on heuristic and metaheuristic algorithms or ML methods that focus on pattern sketches, images or rule-based mechanisms. Moreover, the number of studies that utilized geometrical aspects is limited. Our previous work [13] proved the viability of using a neuro-fuzzy model to predict NE from five CAD-based geometric descriptors. While obtaining a prediction accuracy comparable to the present work, the aforementioned study was more of a demonstration, since it focused solely on NE prediction and relied on a relatively coarse geometric representation of the apparel layouts. The present work advances the idea through the development of a design optimization-oriented algorithmic framework. The geometric descriptor space is expanded and redefined to eight descriptors, while random forest (RF) regression with feature importance and Shapley additive explanations (SHAP) analysis are utilized to measure the magnitude and sign of each descriptor’s contribution, respectively. Finally, the trained surrogate is coupled with the genetic algorithm (GA) to identify solution regions of the CAD descriptor space that lead to higher material utilization. Independent software validation with 30 new layouts is also performed. In particular, a set of eight geometry-based pattern fragmentation, size, shape properties, boundary complexity, and pattern diversity descriptors are statistically correlated with NE data derived from repeatedly nested marker layouts to construct an RF-based regression model. This closed-form branch predictor monitors the pattern development stage and efficiently guides the designer towards more fabric-material-efficient pattern modifications without running the computationally expensive nesting process iteratively. Therefore, the novelty of the present work does not lie solely in the application of a different machine learning algorithm, but in the transition from a prediction-oriented framework to an interpretable prediction-and-optimization framework, linking CAD geometry, ensemble learning and evolutionary optimization within a unified methodology for apparel NE assessment. Finally, unlike previous nesting layout optimization studies [14,15,16], which primarily discussed the design for nested layout optimization, this study introduces a pattern-shape-driven design optimization framework that relates apparel pattern characteristics with the resulting fabric NE, therefore establishing a practical approach toward achieving sustainable apparel computer-aided pattern design. The proposed prediction framework is validated using various layout results from Deepnest [17] algorithms.
2. Materials and Methods
2.1. Framework of the Study
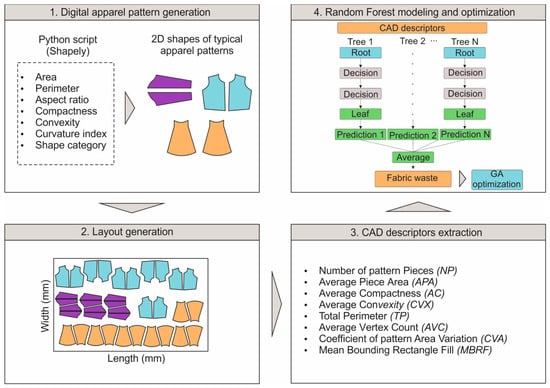
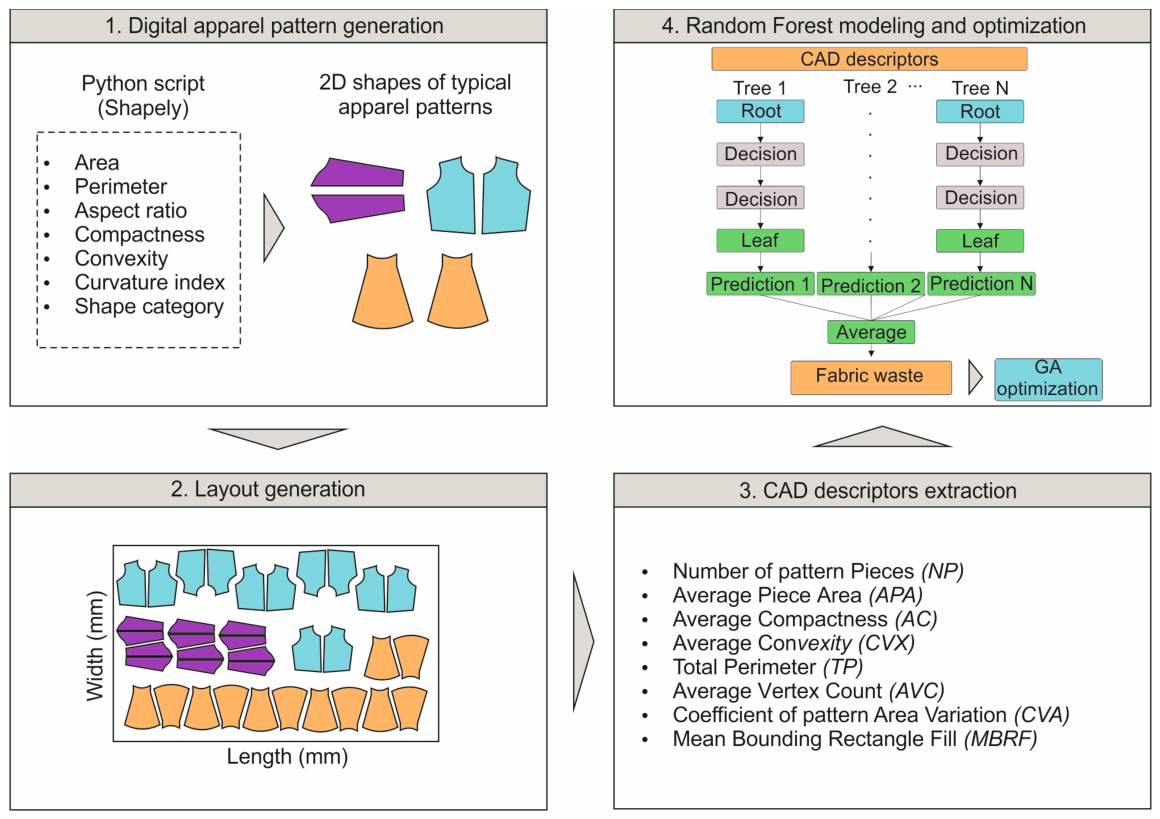
The proposed methodology includes four main steps, summarized in Figure 1. The first step involves scripting a program in Python 3.13.5 using the Shapely library that generates 2D synthetically created apparel geometric shapes corresponding to common garment shapes (i.e., sleeves, bodices, skirts) relevant to apparel pattern design. These geometries were based on typical proportions found in the apparel pattern literature [18] and were based on being parameterized so as to achieve plausible-shaped variation. Geometric characteristics describing the generated apparel pattern shapes (i.e., area, perimeter, shape factor, compactness, convex hull) were calculated, and then geometries that were deemed to be problematic or unrealistic within typical apparel design were removed from the set of generated shapes. This was used to introduce a large number of plausible apparel pattern shape types into the study. For each set of parts, the pattern pieces were combined together in a virtual fabric marker with indefinite sizes of 3000 mm × 5000 mm during the second step. The pattern placement was done automatically under some garment manufacturing constraints, such as no overlapping, position check between parts, fabric width limit and positive angles, while the different sizes were distinguished with different scales. As a result, 1000 representative fabric placements were generated with wide spectrum nesting ratios. In the third stage, each generated layout was characterized by eight geometry-based CAD descriptors [19], and were used as the inputs of the prediction model. The identified CAD descriptors are the number of pattern pieces (NP), average piece area (APA), pattern piece shape compactness (AC), pattern piece shape convexity (CVX), total boundary length (TP), mean number of polygon vertices (AVC), pattern area variation (CVA), and mean bounding rectangle fill (MBRF), which describe the five mutually complementary geometrical aspects of apparel pattern design: pattern fragmentation, pattern size, shape features, boundary complexity and pattern variation. Table 1 summarizes the descriptors along with their corresponding categorization. The NE defined by the generated layouts was used as the output variable of the framework. In the final fourth stage, the RF regression model was trained to learn the relationship between the extracted CAD descriptors and NE. The model was trained and tested using 5-fold cross-validation (CV) and its prediction performance was checked against the nesting results directly from Deepnest 1.0.5 open-source nesting software. Based on the trained RF model, the feature importance analysis was further conducted to identify the geometric descriptors with the most significant influences on the NE. Lastly, the genetic algorithm (GA) was integrated with the trained RF model to reveal the combinations of CAD descriptors that can achieve as high NE as possible. The proposed method can be considered an intelligent decision support to achieve geometry-driven apparel pattern optimization prior to energy-consuming nesting operations.
Figure 1.
The major stages of the study.
Table 1.
The CAD descriptors used in the study and their corresponding categorization.
2.2. Extraction of the CAD Descriptors and Dataset Generation
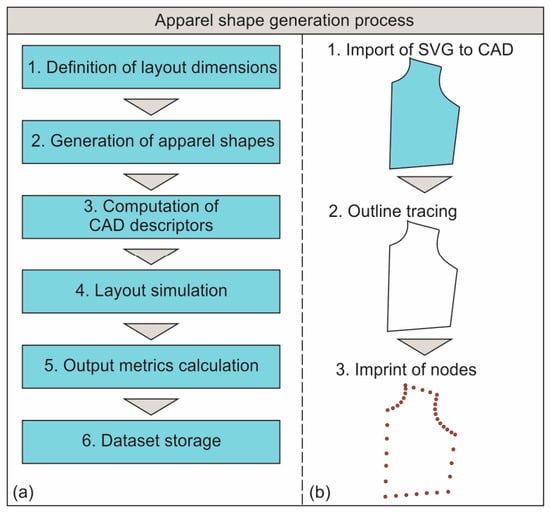
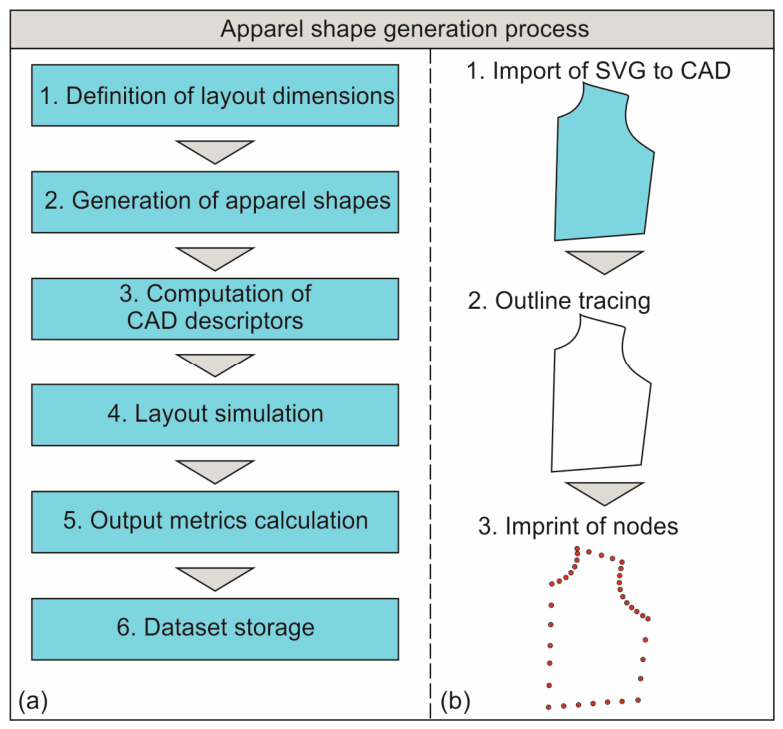
Figure 2a illustrates a summary of the systematic procedure followed to generate the dataset used for this research work, consisting of 1000 apparel layouts. It begins with the definition of fabric dimensions, which defines the virtual marker used for all the simulations. Next, apparel pattern geometries are generated with a Python code using a parametric approach to mimic typical apparel pattern components. For each generated layout, the 8 geometry-based CAD descriptors are computed. Multiple layout simulations (arranging the pattern components inside the fabric marker) are performed following ergonomic and manufacturing constraints, including avoiding overlaps, maintaining distance between neighboring pieces and restricting the pattern components to a maximum number of fabric widths and orientations. Following each simulation, the NE is calculated as the ratio of the total pattern components’ area to the used fabric marker area. Finally, the descriptors and the NE values of the production are stored in a structured database, which is used for RF modeling, identifying of important variables and optimizing.
Figure 2.
Apparel shape generation workflow (a) and shape tracing workflow (b).
Figure 2b depicts the CAD procedure employed to generate realistic shape geometries of apparel patterns. First, sample garment patterns from the literature and publicly available apparel pattern databases were imported into a generalized CAD environment in SVG format (creation of the outline sketches). Next, the outlines were traced to obtain 2D CAD sketches that precisely reproduced the original pattern geometries. In the last step, a sufficient number of boundary control points were inscribed along the pattern outlines to reproduce the straight and arched sections, and to maintain minimal geometric complexity, avoiding excessive sample points. The coordinates of the inscribed control points were saved and imported into the Python shape generation algorithm mentioned above in order to generate realistic apparel pattern geometries for a large-scale dataset. A similar technique is discussed by Papachristou et al. [20] for DXF CAD files imported into software such as CLO3D/VStitcher for virtual garment generation.
Table 2 contains a short description of each descriptor used in the study, the upper and lower boundaries of the corresponding variables and the formulae used to calculate the descriptors during the equivalent step. NP indicates the quantity of garment pattern pieces in a layout. It is a measure of pattern fragmentation, since mass production layouts of too many small pattern pieces tend to be more complicated and involve more voids between neighboring pattern pieces. Equation (1) is used to determine the average piece area in mm2, with n essentially being the number of pieces in the layout and Ai the area of the ith piece. This descriptor indicates how big the pattern area is and the flexibility during the placement. Usually, higher values of this descriptor reduce the placement flexibility. Equation (2) calculates the average compactness, which helps evaluate the regularity of the shapes created from the garment pieces. It takes into account the ratio of the object’s area to its perimeter. Compact shapes tend to nest more efficiently and leave fewer scraps. AC is calculated for each piece using the isoperimetric ratio and then averaging all the items. Pi is the perimeter of the ith pattern. Equation (3) estimates the level of similarity of each pattern to its convex hull. Irregular geometries (having concavities or indentations) provide benefits by using less fabric as imperfect shapes are nested as far as possible in a fabric marker. Figures with high convexity provide fewer indentations and are less difficult to nest. High values of CVX provide regular geometric shapes that can be more efficiently nested in the marker. Pi,convex corresponds to the perimeter length of the convex part of the pattern. Equation (4) is used to measure the total perimeter length of all garment pieces in the layout. It is an indication of boundary complexity as higher values of total cutting length are usually associated with more irregular geometries and greater manufacturing effort. It can also result in poor nesting efficiency, as complex boundaries are more difficult to nest. Equation (5) expresses the mean number of vertices defining the boundaries of the garment patterns. It provides a measure of geometric complexity, with patterns containing numerous vertices exhibiting more intricate outlines. Such geometries generally require more sophisticated positioning during nesting and may reduce material utilization. Vi is the number of vertices of the ith piece. Equation (6) represents the variation in the size of the pieces of garments within the layout with the coefficient of variation for the areas of the pattern pieces. High CVA means large differences between small and big pattern pieces. Big pattern pieces largely influence the packing performance. CVA is essentially the standard deviation of the piece areas in the layout divided by the average piece area. Equation (7) represents how well individual garment patterns fit into the tightest possible oriented bounding rectangle fill (MBRF). A well-packed pattern will give a higher BFR and a more desirable nesting. The value of this descriptor is the mean fill ratio of all pattern pieces. AMBR,i denotes the area of the minimum rotated bounding rectangle of the ith pattern. Finally, Equation (8) is a measure of how effective the fabric is utilized in a layout, with Alayout being the area of the layout.
Table 2.
Formulation and boundaries of the input and output variables.
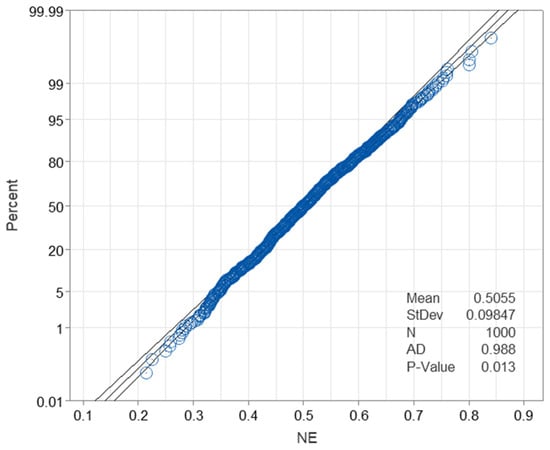
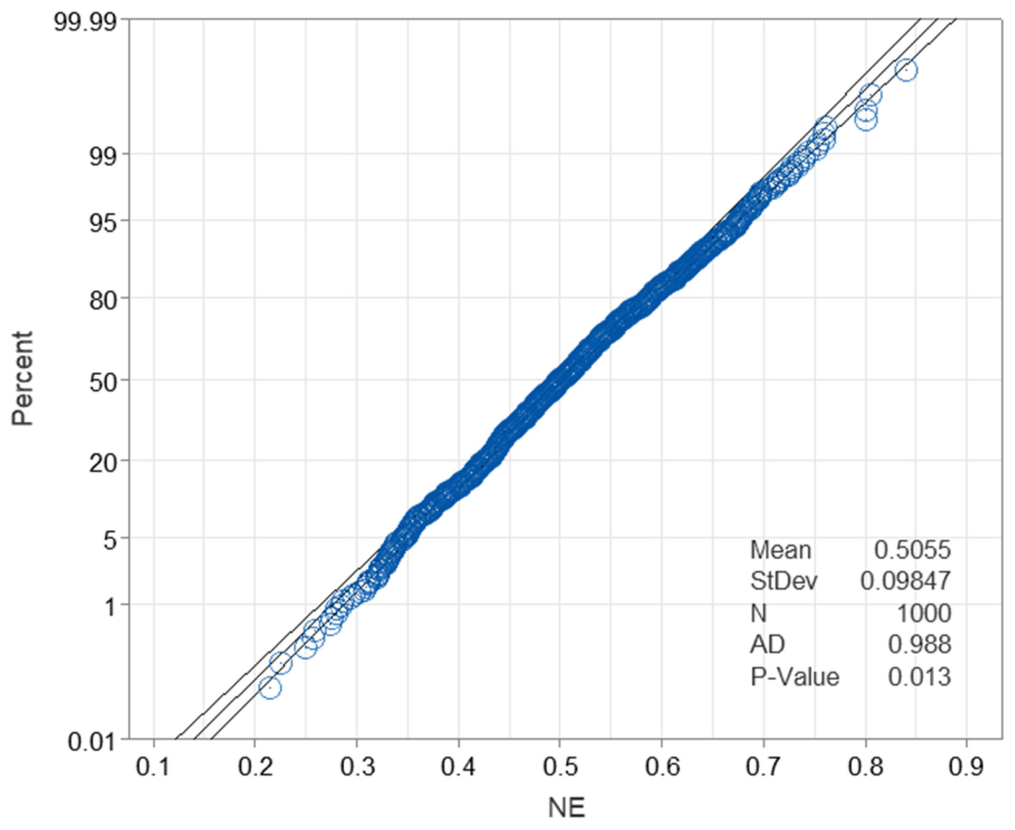
In order to examine the graphical distribution of the generated dataset, the entire collection of generated NE values is subjected to an Anderson–Darling (A–D) test [21]. This test compares the sample data to the anticipated probability distribution, in this instance the normal distribution, with increased sensitivity in the distribution extremities. The complete set of generated data points is used to generate a normal probability plot which compares the data points to the probability that they are normally distributed by a 95% confidence band. The result (Figure 3) shows that the generated data produces an approximately linear series of data points. This indicates that the set of NE values are similar to a normal distribution, with some departure from this distribution in the outer extremities. The values calculated for the A–D test statistic are 0.988 with an associated p-value of 0.013, indicating a statistically significant departure from the null hypothesis of normality at the 5% significance level. Nevertheless, the normal probability plot exhibits an approximately linear central trend, with deviations occurring primarily toward the tails. Given the large sample size of 1000 observations, the test is sensitive to relatively small departures from normality. The analysis is therefore used as a descriptive characterization of the generated NE dataset rather than as an assumption required for RF modeling. Therefore, the NE distribution may be regarded as approximately normal, even though normality is not an assumption required by the RF regression algorithm. The generated dataset covers a wider range of nesting efficiencies than most industry examples. Reported apparel marker efficiencies are generally between 60% and 85% [22] depending on garment complexity and marker strategy, but lower efficiency layouts were also generated so that the ML algorithm can learn from both types.
Figure 3.
The normal probability plot for the total of the generated data points.
3. Random Forest Model Development
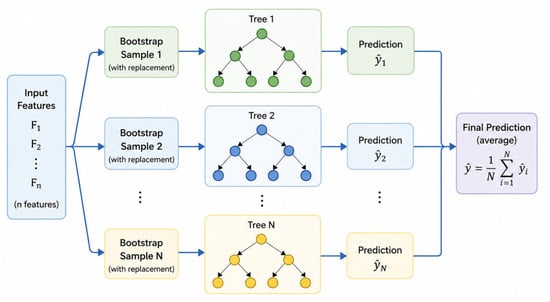
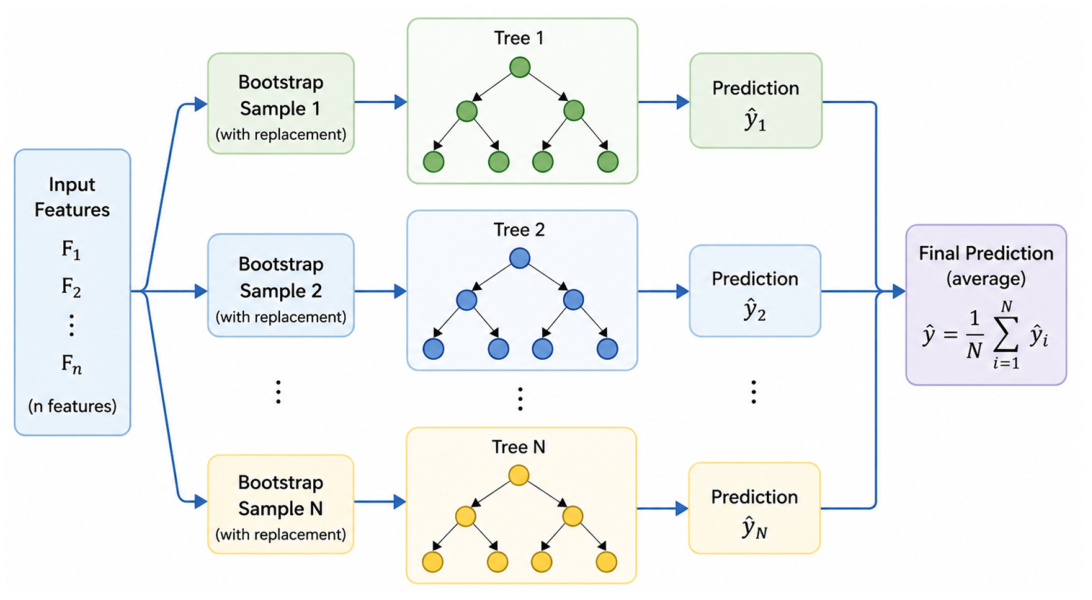
The random forest is a general ensemble learning method [23,24] for classification or regression that operates by constructing multiple decision trees during training and combining their prediction for estimating new data points. In the construction of each tree, the data are sampled randomly with replacement, and for each node, a random subset of variables is considered for splitting. The result is determined by averaging the outputs of all trees for the regression procedure [25]. For this procedure, the output is very robust in the presence of noise and reduces the risk of overfitting and bad prediction performance. This method is highly non-linear, particularly between the variables without any assumptions on data distribution and interaction. It is capable of determining the variable importance, and this important feature will help us to observe which geometric factors influence the nesting more strongly. The general structure of the developed RF regression model is summarized in Figure 4. First, the input features for the model consisted of the extracted CAD descriptors. During the training stage, numerous bootstrap samples were generated from the training dataset, and these samples were drawn randomly with replacement, so that the individual decision trees learned from a slightly different set of the available observations. Furthermore, at each node split, a random sample of the input descriptors was evaluated to effectively create even more model diversity and to reduce the correlation of the individual trees. Each of the individual decision trees yielded its own value prediction for the target parameter (i.e., NE), while the overall model prediction was derived by averaging the individual predictions. This ensemble learning approach resulted in a more stable prediction and lowered prediction variance, and minimized the number of foreseen overfitting issues compared to a simple decision tree. Hence, the proposed RF model not only deduced well-behaved inputs for the accurate and stable prediction of apparel nesting efficiency, but also allowed for the calculation of descriptor importances, i.e., the geometric features that positively affected the nesting efficiency the most.
Figure 4.
Predicting NE using random forest structure.
In order to select the optimum model parameters, a sequential hyperparameter search was carried out through 5-fold CV [26], with the cross-validation coefficient of determination (CV-R2), cross-validation mean absolute error (CV-MAE) and cross-validation root mean square error (CV-RMSE) recorded as the model selection criteria. The search order is summarized in Table 3, with a baseline model containing 100 trees, limitless depth, 1 sample per leaf, 2 samples for split and the square root of the total number of features. First, the number of trees (n_estimators) were investigated from 100 to 500, and the highest prediction accuracy resulted from 500 estimators. Next, the maximum depth of each tree (max_depth) was explored, with values None, 5, 10, 15 and 20. Based on the reported errors, the most accurate model had a depth of 20. The minimum number of samples required at a leaf node (min_samples_leaf) was examined for values 1 to 5, with the most accurate model having a value of 1. Subsequently, the minimum number of samples required to split an internal node (min_samples_split) was explored at values 2, 4, 6, 8 and 10, which resulted in the default value of 2 being most accurate. The final hyperparameter explored was the maximum number of features available at each split (max_features), with this parameter resulting in the largest gain from the hyperparameter values under examination at 0.75, which increased CV-R2 to 0.92249 with CV-MAE of 0.02036 and CV-RMSE equal to 0.02721. These values represent the mean performance across the five cross-validation folds and were used for hyperparameter selection. In addition, the standard deviation of each metric quantifies the variability between folds, providing an indication of the consistency of model performance across the five cross-validation folds. With this in mind, the construction of the final RF model proceeded, using 500 estimators, a maximum tree depth of 20, a minimum leaf size of 1, a minimum split size of 2, and allowing a maximum of 75% of the available features at each split. The final model was subsequently evaluated on the held-out 20% testing subset, which yielded R2 = 0.93102.
Table 3.
Random forest hyperparameter tuning sequence.
To further assess the suitability of the proposed RF model, its predictive performance was compared with Linear Regression (LR) and a single decision tree (DT) as representative linear and tree-based baseline learners, respectively. Both baseline models were implemented using the default scikit-learn hyperparameters, with only the DT random state fixed for reproducibility, and were evaluated using the same 5-fold cross-validation procedure as the RF model. The purpose of this comparison is not to compare competing algorithms, but to demonstrate reference performance against conventional base learners. For this reason, the default settings for the base models were retained. The comparison was carried out by utilizing typical metrics as discussed in the recent work by Emonena et al. [27]. As shown in Table 4, RF achieved the highest mean CV-R2 (0.92249), and the lowest CV-MAE (0.02036) as well as CV-RMSE (0.02721), while also exhibiting lower variability between the folds compared to both baseline models. These results support the use of the optimized RF ensemble for the present study.
Table 4.
Baseline model comparison.
4. Results and Discussion
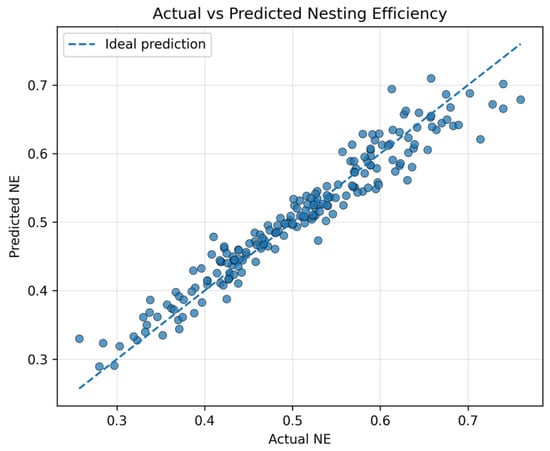
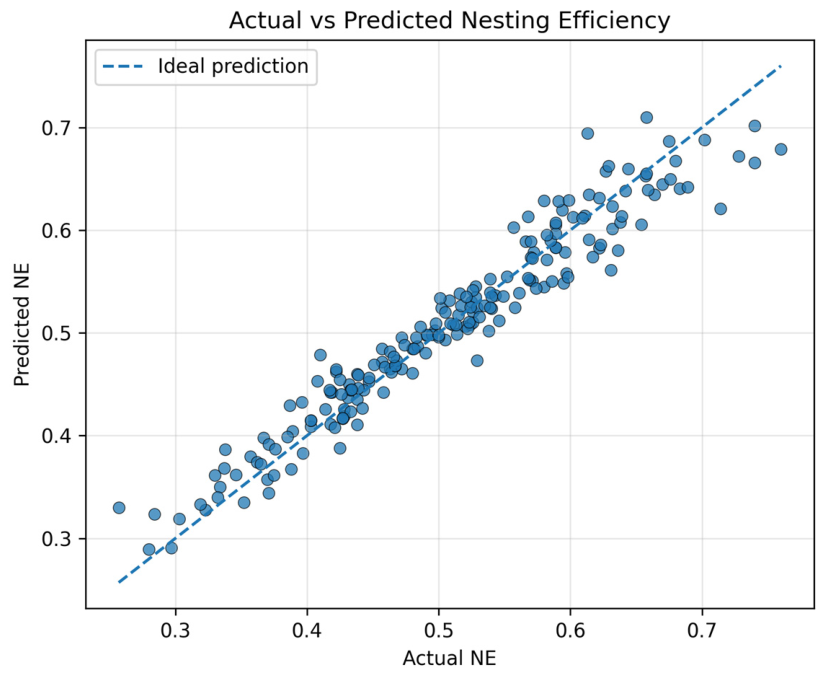
A comparison between the actual and the predicted values of NE was first carried out with the aid of a scatter plot (Figure 5). This plot depicts how well the developed RF model can predict NE in the test dataset. The dashed diagonal line indicates the predicted nest efficiencies when they are in perfect agreement with the experimentally calculated nesting efficiencies. The outlier values plotted near the diagonal line provide evidence that the developed model predicts the NE values quite well. These predictions are very strong in the middle of the nesting efficiency (roughly 0.40–0.60) where most of the samples of the test data lie. In this region, only slight variations from the ideal line are noted, which shows that the RF is able to model the non-linear relationship between the selected CAD features and the NE very well. This corresponds to the high CV-R2 obtained during model evaluation. A slightly greater spread is observed for arrangements with improved nesting efficiencies (NE > 0.60), where many of the prediction lines diverge slightly from the ideal. In this area, the model appears to under-predict the real values, but only to a minor degree. Variances are relatively low, however, and no trend can be observed. Considering the fact that no clear outliers are observed, and that the distribution of the points is relatively symmetric around the ideal predication, the proposed RF model can be assumed as robust and reasonably extended to unseen samples.
Figure 5.
Comparison between the actual and predicted output of the CV dataset.
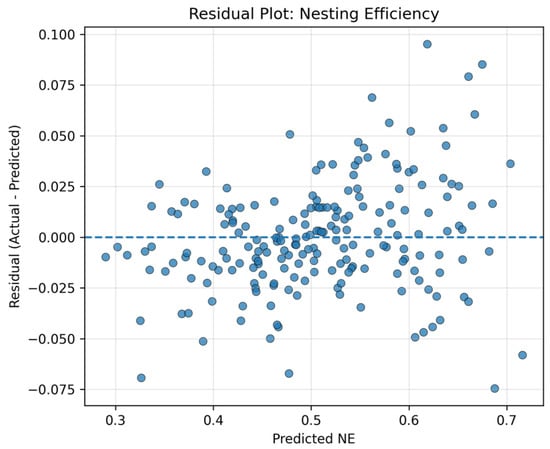
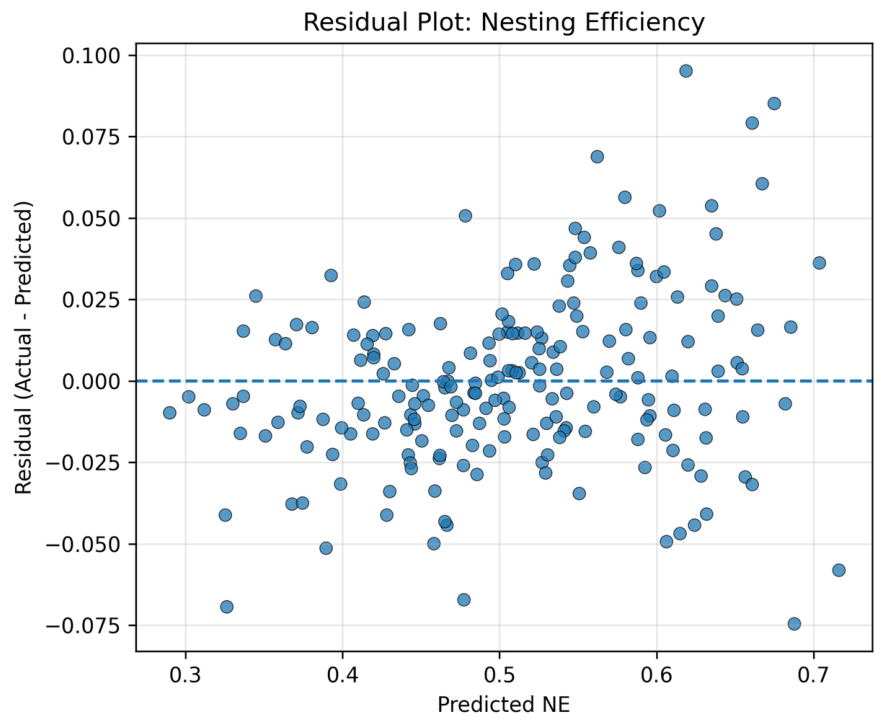
Next, the residual plot was plotted (Figure 6). It provides additional information related to the actual versus predicted NE comparison. The residuals were calculated as the difference between actual and predicted nest efficiency (error = NEactual − NEpredicted). The horizontal dashed line shows the case where the actual nest efficiency prediction has no error. As demonstrated by Figure 6, the residuals tend to be slightly skewed with a normal distribution profile with respect to the predicted nesting efficiency values for the entire test set, with most residuals falling within roughly +/−0.05, and only a few data points having residuals close to +/−0.10. Most of these higher error ratings are found within layout classes with higher NE values, where training samples are less closely packed and the geometric relationships involved become more complicated. Still, this test set does not contain any seemingly anomalous outliers. A small rise in the variation in the residuals was observed as the predicted NE increases, indicative of a small amount of heteroscedasticity. This is reasonable since higher nesting efficiencies are characteristic of configurations which have a tighter pattern grid, where small differences in the geometry between configurations can have disproportionately greater effects on nesting performance. Nonetheless, the residuals are distributed randomly with respect to the fitted values, showing that the RF model effectively encapsulates the non-linear nature of the underlying relationship.
Figure 6.
The residuals of the test data points.
In summary, the residual plot to validate the developed prediction model supports its excellent performance. Since no distinct structure has been observed in the residuals, it can be concluded that the chosen geometric properties can successfully capture the variation in nesting efficiency, and the relatively small prediction error found in the CV dataset suggests high predictive power of the proposed framework. Together with the high coefficient of determination (R2 = 0.922) and the accurate correspondence of the actual versus predicted plot, the residual estimate demonstrates that the developed RF model can accurately and reliably predict nesting efficiency using CAD-based geometric profile variables, thus providing an efficient decision support tool for apparel pattern design.
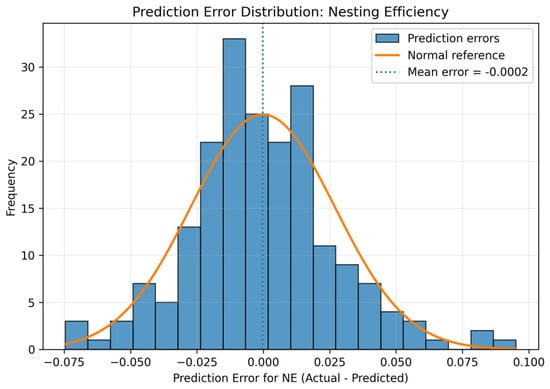
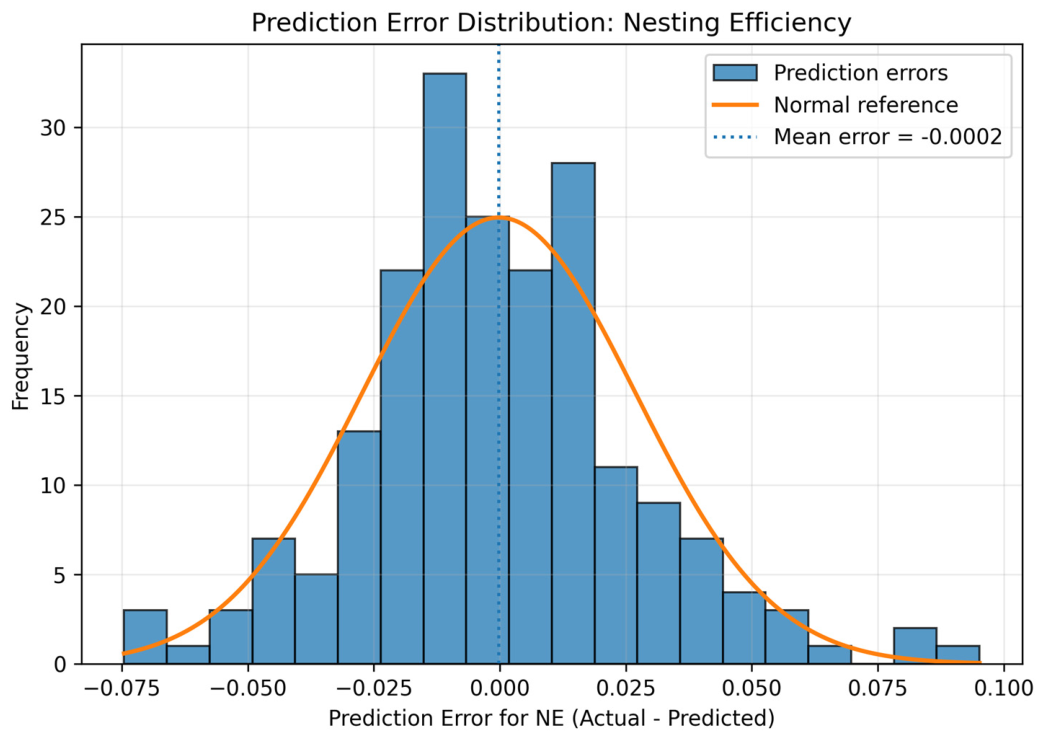
Additionally, the distribution of the prediction errors is described in Figure 7. It is evident that the distribution of the prediction errors is similar to a bell curve centered near zero, with a mean prediction error of −0.0002. This occurs because the developed RF model has no tendency to overestimate or underestimate the output, therefore leading to unbiased results. Furthermore, most of the observations had prediction errors near the center of the distribution. There are relatively few observations at either tail of the distribution showing that large prediction errors are rare. The agreement between the observed error histogram and the fitted normal reference curve further confirms that the prediction errors are randomly distributed and no systematic pattern exists. This is consistent with the residual analysis, and therefore lends further promise to the generalization ability of the developed model to predicting NE directly from CAD-derived geometric descriptors.
Figure 7.
The error distribution histogram for the residuals of the test data points.
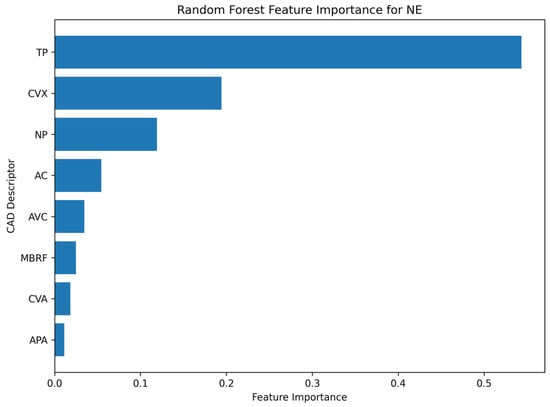
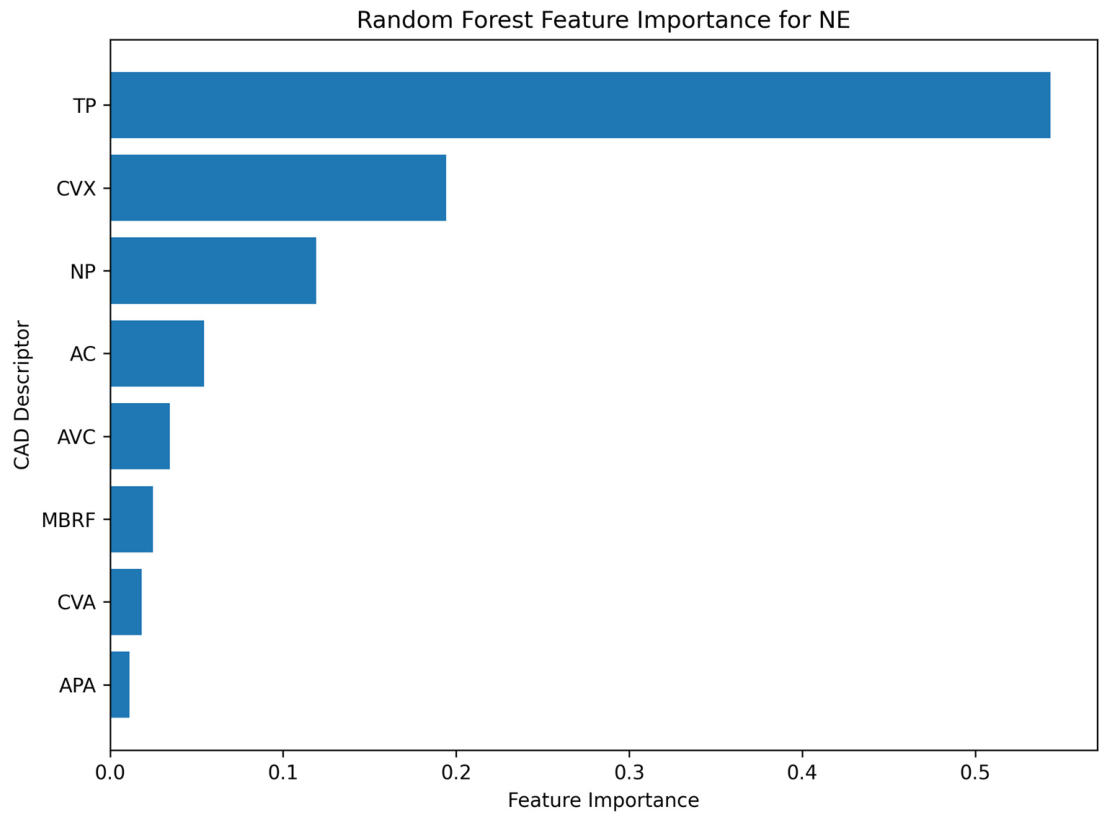
In Figure 8, the relative contribution of the eight CAD descriptors identified from the RF model is shown. The most influential descriptor for the model appears to be TP, which accounts for more than 50% of the model’s performance. The results show that the total perimeter length of the entire garment iteration has the largest effect, with bigger and more complex cutting loops leading to larger remaining areas after nesting. The second-most important descriptor is CVX, which associates with smoother, less inscribed outlines facilitating NE. The contribution of NP further increases the NE as more fragmentation leads to a wider variety of placement options, less empty spaces and, finally, higher nesting efficiencies. Lastly, a higher value for AC, on the other hand, is associated with geometries that are more efficiently occupied and generate fewer empty spaces during nesting. This finding is supported by the work of Bennell and Oliveira [19], where they established that geometric characteristics, including perimeter, convexity, concavity and the interactions between shape attributes, were the key factors affecting enabled packing density in an irregular nesting problem. The remaining four descriptors, that is, AVC, MBRF, CVA and APA are relatively less significant. They mainly contribute with additional geometric information to fine-tune the prediction once boundary complexity, convexity, fragmentation and compactness effects are understood. The importance of the four most prominent descriptors, that is, TP, CVX, NP and AC, in fact sums up to almost 90% and demonstrates that apparel pattern nesting performance fundamentally depends on boundary complexity and overall shape characteristics rather than individual size features. This indeed indicates that geometry-based optimization approaches in this context are expected to mainly emphasize reducing pattern boundary complexity, emphasizing convexity and compactness, and minimizing an excessive amount of pattern pieces while maintaining the garment function. The relatively insignificant contribution of the mean piece area indicates that size alone is inadequate to explain nesting efficiency. Irregular packing studies [28] have also encountered this issue and found boundary geometries and shape descriptors to be better predictors of feasible packing density than area. Finally, NP was identified as an important factor in our previous work [13]; however, CVX was not. This contradiction is probably attributed to the nature of the patterns used in the previous work, which were rather simplistic. Additionally, the fact that convexity and compactness are significant factors is also consistent with findings by Abdou et al. [29]. The authors claimed that the compatibility of shapes and the contour details are indicative of the nesting result and can serve as a basis for shape placement heuristics in schedule optimization.
Figure 8.
The feature importance graph.
Despite the fact that the contributions of some descriptors were relatively insignificant, they were retained for their direct geometric interpretability, since the proposed framework is intended to support future rule-based translation of descriptor values into actionable apparel design recommendations, as discussed in Section 4.2.
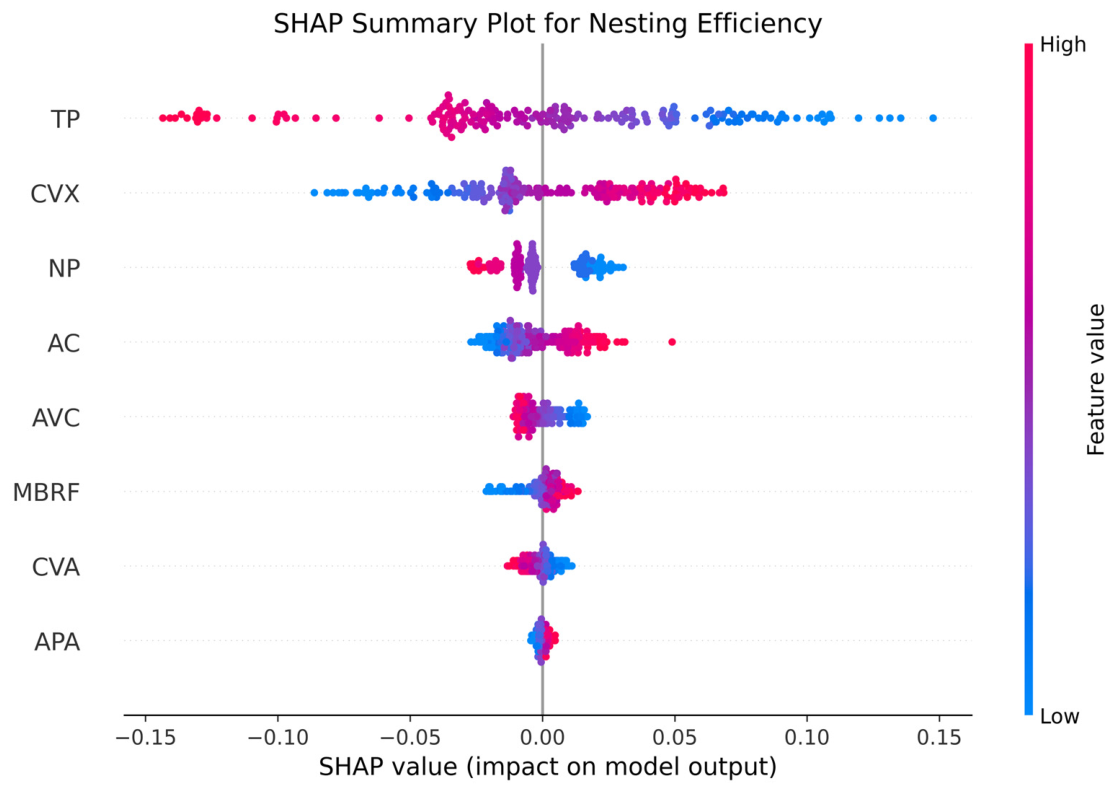
In order to further explore the directionality of the influence of the descriptors on the RF-predicted NE, the SHAP analysis was also carried out. The summary plot for the SHAP analysis (Figure 9) displays both the magnitude and the direction of the influence by each descriptor on the predicted NE. It is evident that the TP descriptor generates the strongest effect by far with high TP values often correlated with negative SHAP values. This means that greater total perimeter results in a lower predicted NE, whereas positive SHAP values are often correlated with higher CVX. Therefore, more convex pattern geometries are almost always associated with higher nesting efficiencies. A similar positive trend exists for the AC descriptor, whereas negative trends were identified for NP. The rest of the descriptors yielded much lower magnitudes of SHAP values, although positive trends exist for MBRF and negative inverse relationships seem to exist for the AVC and CVA descriptors. Finally, the APA descriptor has negligible influence on the predicted NE. This SHAP analysis elucidates trends in the influence of the descriptors and adds to the previous feature importance analysis by not only revealing the relative magnitudes of a given descriptor’s impact on the RF-predicted NE, but also whether the tendency of this effect is in the positive or negative direction.
Figure 9.
The SHAP analysis plot.
In this study, the directional information extracted from the SHAP analysis can be used in conjunction with the GA results to suggest how movement in the space of the dominant descriptors influences the predicted NE. The model currently predicts higher NE as TP and NP decrease and CVX and AC increase. As discussed in Section 4.2, such information may be converted into practical geometric advice for refining the pattern shape being optimized toward the range of descriptors identified, via the GA, as optimal.
4.1. External Validation with Industrial Software
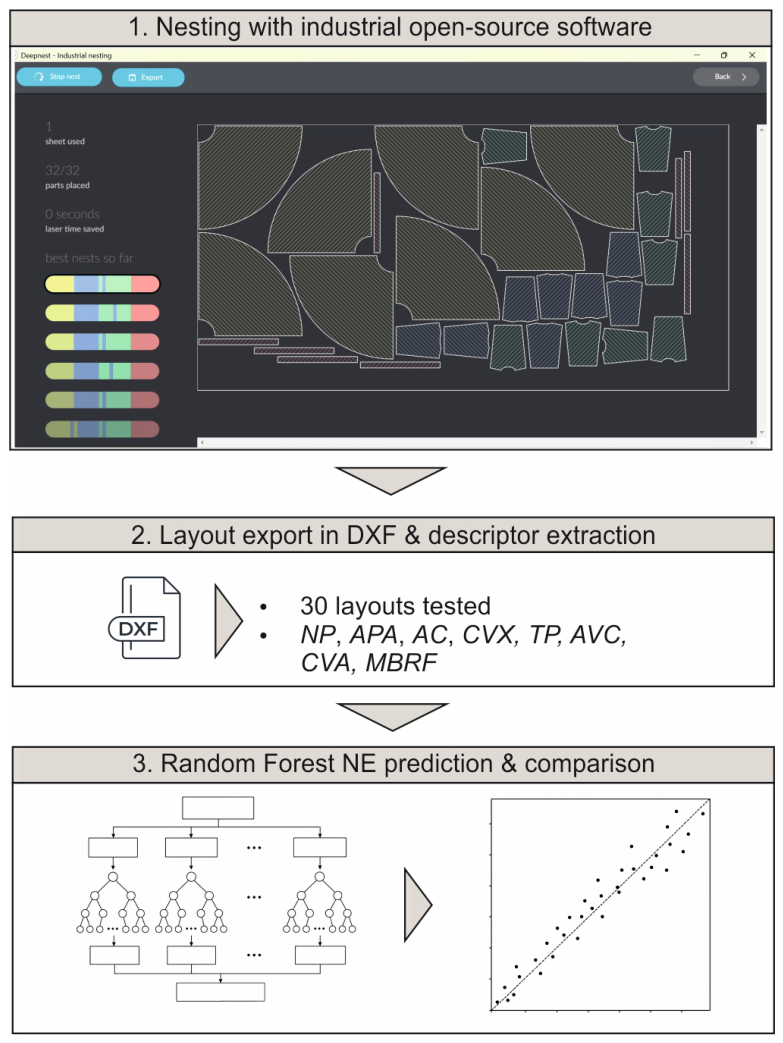
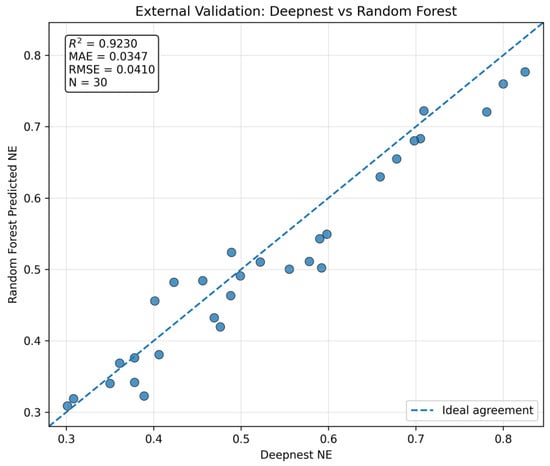
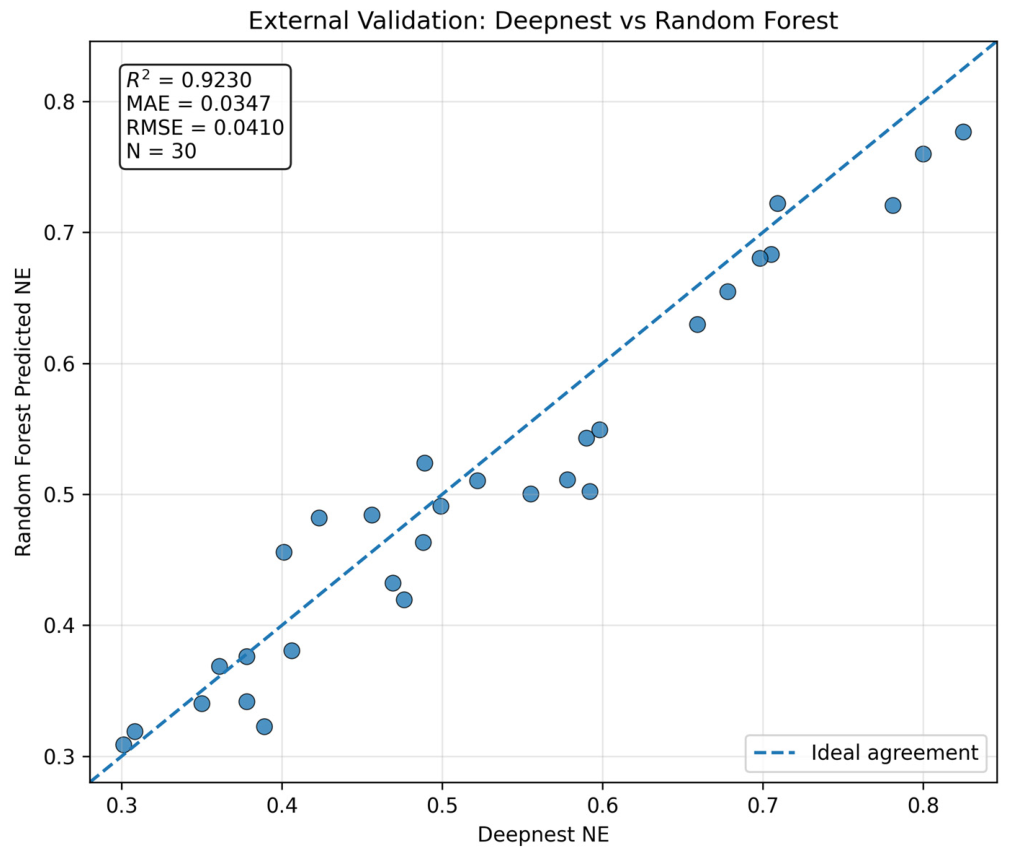
The generalization ability of the prediction model was assessed by performing an external validation [30], using an independent open-source industrial nesting software, namely Deepnest, as shown by the flowchart in Figure 10. First, 30 apparel layouts were created and optimized within the nesting software to obtain a set of real, visually plausible nesting layouts, and related NE values. Next, the optimized layouts were exported in DXF format, and the eight CAD descriptors (NP, APA, AC, CVX, TP, AVC and MBRF) were extracted with the developed script. These data were then used as inputs for the trained RF model to predict the relative NE values. The predicted values were then compared to the nesting software ones using regression metrics and a scatter plot (Figure 11) of the observed versus predicted values.
Figure 10.
The workflow of the external validation process.
Figure 11.
Comparison between the RF-predicted and the Deepnest-predicted values.
The predicted NE values obtained using the proposed RF model were plotted against the reference nesting efficiencies obtained from the independent Deepnest nesting software for 30 randomly selected apparel configurations. As can be observed in Figure 10, most points are nearly evenly spread around the ideal agreement line (y = x). In the external validation, a coefficient of determination equal to 0.9230 was found, demonstrating that the proposed model effectively predicts the nesting efficiency given by the industrial software based on the aforementioned synthetic dataset. The overall MAE of 0.0347 and RMSE of 0.0410 further confirms that the prediction errors are relatively small over the entire span of nesting efficiencies. The deviations from the ideal agreement line generally appear to be slight and uncorrelated with each other, implying that the prediction errors are random rather than due to systematics in the model. Slightly larger errors (beyond 10%) were detected for some layouts in the middle and high-end of the NE regions but are still deemed acceptable given the highly non-linear nature of the relationship between the geometric descriptors and the ultimate NE. Finally, it should be noted that the model tends to underestimate NE, compared to the software estimations, at higher efficiency values. As a whole, the prediction of the RF model is highly consistent with the findings obtained using Deepnest, further validating the eight CAD descriptors selected that describe the geometric properties affecting nesting effectiveness.
4.2. Process Optimization with GA and Design Recommendations
Genetic algorithms (GAs) are population-based evolutionary optimization techniques that are inspired by the processes of natural selection and biological evolution and find application in many engineering problems [31,32,33]. Unlike traditional optimization algorithms, the search process is performed on a population of potential solutions rather than on an individual candidate. GAs utilize the principles of natural selection to release the search from local optima and maintain healthy diversity within the population. In a typical GA iteration, candidate solutions with higher objective function values become candidates for reproduction, while crossover of solutions takes the form of exchanging solution components between “parent” solutions and mutation is applied to randomly alter solution components within a population. Success of GAs for optimization of the large and highly non-linear search space of many engineering design optimization problems has been well established in the literature, owing to its ability to evaluate millions of solutions without the need for derivatives. In this research, once the trained RF model was obtained, for each iteration of the GA multiple apparel pattern configurations were evaluated very quickly to find the pattern that yielded the maximum nesting potential, based on the predicted values of NE.
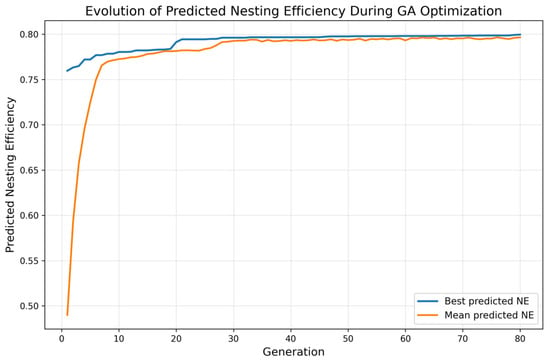
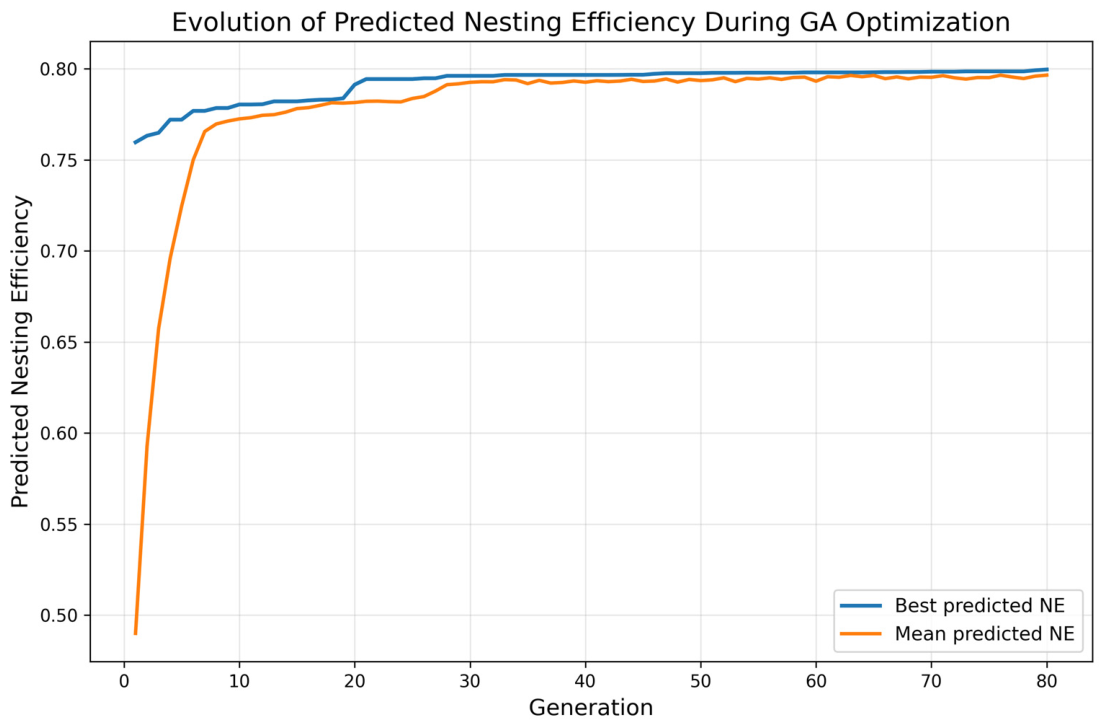
The GA optimization was performed in the CAD descriptor space and the pattern geometries are not directly involved in the GA optimization process. Any candidate solution is just a combination of eight CAD values and its fitness was estimated by the NE predicted by the trained RF model. The solution, therefore, was the target combination of the geometric descriptors corresponding to high predicted NE instead of directly generated or reconstructed apparel layout. Figure 12 shows the evolution of the GA throughout the process of evolving the maximum nesting efficiency solution, whereas Table 5 includes the parameters used for the optimization process according to guidelines that are available in the literature [34]. The blue curve shows the maximum predicted NE value in each generation and the orange curve shows the mean predicted nesting efficiency value in each generation of the population. There is also a very rapid change in the nesting efficiency in the first 10–15 generations which reveals that the optimization algorithm is successful in locating the promising regions of the design space. The maximum predicted nesting efficiency value increases from around 0.76 in the initial population to around 0.78 and the mean predicted nesting efficiency value increases from around 0.49 to around 0.77. Further improvement appears more gradually with the best obtained predicted NE approaching 0.80 after about 20 to 30 generations, while the best and mean predicted NE remained comparatively constant for the rest of the optimization process. Thus, convergence with no significant further improvement was achieved. Also, the deviation of the best predicted NE from the mean predicted NE was gradually reduced, which also implies that the candidate solutions tend to be similar to each other in terms of the predicted NE. Collectively, the convergence was relatively smooth and stable through the process of optimization, with an optimal predicted NE of about 0.80 using the proposed next settings (population size of 150, crossover rate of 0.95 and mutation rate of 0.05). These results proved the ability of RF-GA framework to identify descriptor sets that are associated with high predicted NE efficiently without utilizing the time-consuming geometric nesting process repeatedly. The optimized NE value was achieved by utilizing the next descriptor values: NP = 8, APA = 763,634 mm2, AC = 0.754, CVX = 0.992, TP = 22,855 mm, AVC = 13, CVA = 0.196 and MBRF = 0.845. It should be noted that the optimized combination of descriptors does not uniquely specify any particular apparel pattern layout. The descriptors specify a vector of integrated geometrical attributes, which means that there are many possible pattern geometries that would yield similar descriptor values. As a result, reverse generation of the optimized solution would amount to a separate inverse-design problem that would involve generation and evaluation of many candidate geometries. The proposed GA results should thus be interpreted as providing a set of quantitative design goals that underscore a high-quality region of the descriptor space rather than specify a particular optimized pattern layout.
Figure 12.
The GA optimization process with respect to the generations.
Table 5.
The sequential tuning procedure for the GA settings.
A sequential sensitivity analysis was conducted to identify the best settings for population size, number of generations, crossover rate, and mutation rate, within a predefined range. Each setting was evaluated through ten independent GA runs while the remaining parameters were kept constant, and the setting producing the highest mean best predicted NE was retained for the subsequent tuning stage. The final parameters chosen through sensitivity analysis are population size 150, 80 generations, 0.95 crossover rate and 0.05 mutation rate, as shown in Table 5. Standard deviations in the mean best predicted NE for each variation stage were low, indicating stability in the variation stage.
The refined descriptor values provide quantitative design rules that can be converted for the geometric manipulation of apparel patterns. Similar design-driven strategies have been used for minimizing fabric waste [35]. In general, the boundary complexity can be reduced, and the convexity as well as the compactness can be improved. Moreover, the excessive dissected pattern can be simplified and better use of the boundary rectangle can be achieved. A few examples of design recommendations are shown in Table 6 for pieces that were used in the study.
Table 6.
Design recommendation examples based on the descriptors.
5. Conclusions
In this paper, an intelligent data-driven methodology is proposed for fast prediction and optimization of fabric NE while relying only on CAD representations of apparel pattern shapes as geometric inputs. A wide dataset of 1000 realistic apparel layout arrangements was created through a custom-developed Python program that emulates apparel shapes and real-world nesting restrictions. Eight CAD descriptors were retrieved from each layout arrangement and employed into an RF regression model. The model demonstrated high predictive accuracy, with a 5-fold CV R2 of 0.922 and a mean prediction error of −0.0002. The A-D test for normality established that the dataset is close to normal distribution, allowing for model training at a range of typical nesting efficiencies. The feature importance identified that the following parameters, in order of importance, are: TP, CVX, NP and AC. Together the four descriptors account for 90% of model explainability, being the four most dominant geometrical parameters of nesting efficiency. A genetic algorithm was used in conjunction with the trained model to identify combinations of descriptors related to better material usage. The quality of the solutions converged quickly and heuristically on the best design, illustrating that the suggested surrogate-based optimization framework is appropriate for apparel CAD tasks. Instead of challenging the pattern’s geometry, the optimization supplies numeric target values for the geometric descriptors so that these can be easily interpreted into applicable design recommendations for pattern improvement prior to nesting. The proposed methodology was further benchmarked with 30 independent apparel layouts randomly generated with the open-source industrial nesting software Deepnest. Once exported to DXF format and with the relevant CAD descriptors extracted, the trained RF model yielded an external validation R2 equal to 0.9230, MAE = 0.0347 and RMSE = 0.0410, with a very good agreement with the nesting efficiencies from the independent software. This proved that the present framework can be extrapolated on previously unseen apparel layouts.
In conclusion, the decision support framework developed in this work offers an effective means of making quick decisions on the NE solely based on CAD geometry information, significantly minimizing the unnecessary nesting iterations throughout the apparel design process. The integration of ML, GA and CAD-based geometric descriptor extraction in this work constitutes a viable approach of measuring nesting performance to leverage material utilization efficiency and accomplish more sustainable apparel product development. Meanwhile, the descriptor extraction algorithm developed in this work paves the way by providing a framework that can be easily extended to real industrial CAD patterns, thus effectively building an intelligent CAD system that infers the optimal geometric solutions for garment development.
6. Limitations and Future Work
Despite its high prediction accuracy and it being a more efficient alternative to the repeated nesting simulation approach, the methodology proposed in this paper has some limitations. For instance, although the parametric apparel pattern simulation used a variety of garment geometries to generate the training set for the RF model, the creation of a synthetic dataset cannot encompass the large variation in pattern designs in the commercial sector. Moreover, the research is limited to investigation of the geometric information of pattern pieces, while other influential manufacturing considerations, such as fabric anisotropy, directional prints, seam allowance design, pattern matching and production-related placement restrictions, were not explicitly taken into account in this research. Finally, the optimization performed is based on the optimal selection of CAD descriptors based on the best fit, rather than altering the pattern geometry directly. Another drawback is related to the validation dataset. While the proposed model was externally tested over 30 proprietary layouts produced by Deepnest, these layouts do not constitute a true industrial validation with respect to an actual commercial apparel CAD pattern catalog. Consequently, subsequent work should aim to use the described descriptor extraction/prediction methodology on real industrial garment patterns over a larger number of garment types, sizes and geometric details.
Further research can compare the proposed framework with existing apparel CAD tools using actual apparel CAD patterns derived from industrial designer applications, before generalizing the descriptor set, to account for more manufacturing constraints. A follow-up project would be to design a fully automated geometry-refinement module that maps the optimized descriptor values directly to garments patterns to complete a closed-loop apparel CAD design optimization architecture. Ultimately, the proposed methodology can be combined with commercial apparel CAD applications to deliver on-screen design suggestions which improves the material usage during early apparel pattern design.
Funding
This research received no external funding.
Data Availability Statement
The raw data supporting the conclusions of this article will be made available by the authors on request.
Conflicts of Interest
The author declares no conflicts of interest.
References
- Tewari, M. Is Price and Cost Competitiveness Enough for Apparel Firms to Gain Market Share in the World after Quotas? A Review. Glob. Econ. J. 2006, 6, 1850096. [Google Scholar] [CrossRef] [Scilit]
- Heistermann, J.; Lengauer, T. The Nesting Problem in the Leather Manufacturing Industry. Ann. Oper. Res. 1995, 57, 147–173. [Google Scholar] [CrossRef] [Scilit]
- Chryssolouris, G.; Papakostas, N.; Mourtzis, D. A Decision-Making Approach for Nesting Scheduling: A Textile Case. Int. J. Prod. Res. 2000, 38, 4555–4564. [Google Scholar] [CrossRef] [Scilit]
- Zhu, H.; Chen, L.; Han, S. An Innovative Irregular Nesting Algorithm for Flaw Avoidance. In Proceedings of the Computing and Combinatorics; Chen, Y., Gao, X., Sun, X., Zhang, A., Eds.; Springer Nature: Singapore, 2025; pp. 189–201. [Google Scholar]
- Nazemi, S.; Ganji, A.; Bengar, R.A. Effect of Automatic Nesting on the Usage of Fabric in Women Shirt Pattern (Case Study Gemini and Gerber Software). In Proceedings of the 14th Joint International Conference, Gdynia, Poland, 5–8 September 2022; pp. 9–11. [Google Scholar]
- Mostafa, S.; Mohamed, A. The Benefits of Using 3D CAD Software to Modify Clothing Virtual Prototype. Int. Des. J. 2025, 15, 415–426. [Google Scholar] [CrossRef] [Scilit]
- Heo, S.; Kim, S. Automatic Zero-Waste Garment Pattern Generation for Optimal Fabric Utilization. J. Eng. Fiber. Fabr. 2025, 20, 15589250251401683. [Google Scholar] [CrossRef] [Scilit]
- Aguilar-Tortosa, E.; Duta-Costache, E.-A.; Vera-Brazal, E.; Sánchez-Romero, J.-L.S.-R.; Gómez-Hernández, J.F.; Jimeno-Morenilla, A.; Maciá-Lillo, A. Nesting Process Automation in the Footwear Industry: A Hybrid Approach to Minimize Material Waste. Appl. Sci. 2025, 15, 320. [Google Scholar] [CrossRef] [Scilit]
- Salama, W.M.; Aly, M.H.; Abed, A.M.; Eladly, A.M. Efficiency Marker Evaluation Based on Optimized Deep Learning Supported by Bayesian Optimization Technique. Text. Res. J. 2023, 93, 4273–4289. [Google Scholar] [CrossRef] [Scilit]
- Noël, M.; Lo, N.; Nahimana, E. Multi-Objective AI for Pattern Grading: Enhancing Fit and Fabric Utilization in Low-Resource Settings. In Proceedings of the 2026 International Conference on Artificial Intelligence, Computer, Data Sciences and Applications (ACDSA), Boracay Island, Philippines, 5–7 February 2026; pp. 1–6. [Google Scholar]
- Li, S.; Cui, H.; Wang, X. Data-Driven Robust Optimization for Integrated Fabric Nesting and Cutting-Path Planning with Machine-Learned Deformation. Expert Syst. Appl. 2026, 328, 132964. [Google Scholar] [CrossRef] [Scilit]
- Lallier, C.; Blin, G.; Pinaud, B.; Vézard, L. Graph Neural Network Comparison for 2D Nesting Efficiency Estimation. J. Intell. Manuf. 2024, 35, 859–873. [Google Scholar] [CrossRef] [Scilit]
- Tzotzis, A.; Minaoglou, P.; Nedelcu, D.; Mazurchevici, S. Neuro-Fuzzy Framework with CAD-Based Descriptors for Predicting Fabric Utilization Efficiency. Eng 2025, 6, 368. [Google Scholar] [CrossRef] [Scilit]
- Katheesan, K.; Ariyaratne, M.K.A.; Wanigasingha, N.H.; De Silva, P. Genetic Algorithm Based Cut Order Plan and Cut-Panel Nesting Optimization for Apparel Industry. Int. J. Comput. Digit. Syst. 2024, 17, 1–10. [Google Scholar]
- Duta, E.; Jimeno-morenilla, A. An Approach to Apply the Jaya Optimization Algorithm to the Nesting of Irregular Patterns. J. Comput. Des. Eng. 2024, 11, 112–121. [Google Scholar] [CrossRef] [Scilit]
- Naveed, T.; Khan, A.; Ramzan, M.B.; Ilyas, R.; Shahid, A.; Khan, I.A.; Awais, M.; Javed, K. Fabric Utilization of Women’s Kameez Designs with Different Types of Sleeves in the Apparel Industry. Textiles 2025, 5, 48. [Google Scholar] [CrossRef] [Scilit]
- Deepnest. Available online: https://deepnest.io/ (accessed on 1 August 2026).
- Korosteleva, M.; Lee, S.-H. Dataset of 3D Garments with Sewing Patterns. Available online: https://zenodo.org/records/5267549 (accessed on 10 December 2025).
- Bennell, J.A.; Oliveira, J.F. The Geometry of Nesting Problems: A Tutorial. Eur. J. Oper. Res. 2008, 184, 397–415. [Google Scholar] [CrossRef] [Scilit]
- Papachristou, E.; Kalaitzi, D.; Pissas, V. A Methodological Framework for the Integration of 3D Virtual Prototyping into the Design Development of Laser-Cut Garments. J. Eng. Fiber. Fabr. 2023, 18, 15589250231194621. [Google Scholar] [CrossRef] [Scilit]
- Nelson, L.S. The Anderson-Darling Test for Normality. J. Qual. Technol. 1998, 30, 298–299. [Google Scholar] [CrossRef] [Scilit]
- Enes, E.; Kipöz, Ş. The Role of Fabric Usage for Minimization of Cut-and-Sew Waste within the Apparel Production Line: Case of a Summer Dress. J. Clean. Prod. 2020, 248, 119221. [Google Scholar] [CrossRef] [Scilit]
- Salman, H.A.; Kalakech, A.; Steiti, A. Random Forest Algorithm Overview. Babylon. J. Mach. Learn. 2024, 2024, 69–79. [Google Scholar] [CrossRef] [Scilit] [PubMed]
- Schonlau, M.; Zou, R.Y. The Random Forest Algorithm for Statistical Learning. Stata J. 2020, 20, 3–29. [Google Scholar] [CrossRef] [Scilit]
- Jennings, C.; Terpenny, J.; Gao, R.X. A Comparative Study on Machine Learning Algorithms for Smart Manufacturing: Tool Wear Prediction Using Random Forests. J. Manuf. Sci. Eng. 2017, 139, 071018. [Google Scholar] [CrossRef] [Scilit]
- Fushiki, T. Estimation of Prediction Error by Using K -Fold Cross-Validation. Stat. Comput. 2011, 21, 137–146. [Google Scholar] [CrossRef] [Scilit]
- Emonena, I.; Yong, X.; Ashiedu, F.I.; Emovon, I.; Samuel, O.D.; G. C., M.P.; Enweremadu, C.C.; Chan, C.K. CrayStack: A Simplified Crayfish Optimization Driven Stacking Ensemble for Prediction of Machining Quality Characteristics under Data Scarcity. Sci. Rep. 2026. [Google Scholar] [CrossRef] [Scilit] [PubMed]
- Dickinson, J.K.; Knopf, G.K. A Moment Based Metric for 2-D and 3-D Packing. Eur. J. Oper. Res. 2000, 122, 133–144. [Google Scholar] [CrossRef] [Scilit]
- Abdou, K.; Mohammed, O.; Eskandar, G.; Ibrahim, A.; Huber, M.F.; Matt, P. Smart Nesting: Estimating Geometrical Compatibility in the Nesting Problem Using Graph Neural Networks. J. Intell. Manuf. 2024, 35, 2811–2827. [Google Scholar] [CrossRef] [Scilit]
- Ho, S.Y.; Phua, K.; Wong, L.; Wen, W.; Goh, B. Extensions of the External Validation for Checking Learned Model Interpretability and Generalizability. Patterns 2020, 1, 100129. [Google Scholar] [CrossRef] [Scilit] [PubMed]
- Luis-Pérez, C.J.; Buj-Corral, I. Multi-Objective Optimization of Surface Roughness, Dimensional Errors and Density in FFF 3D-Printed Glass Fiber-Reinforced PP Parts via Adaptive Neuro-Fuzzy Inference Modeling. Rapid Prototyp. J. 2025, 31, 1905–1932. [Google Scholar] [CrossRef] [Scilit]
- Tzotzis, A.; Maropoulos, P.; Kyratsis, P. A Dynamic Surface Roughness Prediction System Based on Machine Learning for the 3D-Printed Carbon-Fiber-Reinforced-Polymer (CFRP) Turning. J. Intell. Manuf. 2025, 7075, 1405–1431. [Google Scholar] [CrossRef] [Scilit]
- Wang, Z.; Tao, X.; Zeng, X.; Xing, Y.; Xu, Z.; Bruniaux, P. A Machine Learning-Enhanced 3D Reverse Design Approach to Personalized Garments in Pursuit of Sustainability. Sustainability 2023, 15, 6235. [Google Scholar] [CrossRef] [Scilit]
- Eiben, A.E.; Smith, J.E. Genetic Algorithms. In Introduction to Evolutionary Computing; Eiben, A.E., Smith, J.E., Eds.; Springer: Berlin/Heidelberg, Germany, 2003; pp. 37–69. ISBN 978-3-662-05094-1. [Google Scholar]
- Marin, I.-E.; Avadanei, M.-L.; Vasile, E.-A.; Roșca, M.-I. Closing the loop: Design-driven strategies for tackling textile fabric waste. In Proceedings of the The 9th International Symposium “Technical textiles—Present and Future”, Iasi, Romania, 20 November 2026; pp. 144–151. [Google Scholar]

Disclaimer/Publisher’s Note: The statements, opinions and data contained in all publications are solely those of the individual author(s) and contributor(s) and not of MDPI and/or the editor(s). MDPI and/or the editor(s) disclaim responsibility for any injury to people or property resulting from any ideas, methods, instructions or products referred to in the content. |
© 2026 by the author. Licensee MDPI, Basel, Switzerland. This article is an open access article distributed under the terms and conditions of the Creative Commons Attribution (CC BY) license.