


Abstract
Human–robot collaboration (HRC) significantly enhances manufacturing flexibility and productivity, yet it faces persistent operational challenges stemming from the fundamental capability asymmetry between humans and robots. Task scheduling is a critical factor impacting the productivity of HRC systems, particularly when human worker fatigue is taken into account. Related task scheduling studies predominantly assume fixed subtask processing times, yet the inherent variability of human workers necessitates non-fixed durations. This paper addresses the HRC task scheduling problem with non-fixed human execution times, explicitly modelling workers’ temporal uncertainty using fuzzy triangular numbers. We proposed a new probability density function for fuzzy triangular numbers in Monte Carlo simulation, which is constructed based on a proportional-to-area principle. Through 5000 random simulations, the resulting distribution outperforms the existing method. Meanwhile, an improved decomposition-based multi-objective evolutionary algorithm is proposed to solve the multi-objective scheduling problem, simultaneously considering productivity and human fatigue. The numerical experiments indicate that the proposed algorithm outperforms the comparison methods.
1. Introduction
Human–robot collaboration (HRC) is an enabling technology of Industry 4.0 and Industry 5.0 [1], combining humans’ flexibility and decision-making with robots’ strength and precision [2]. While HRC enhances manufacturing flexibility and productivity [3], it also introduces greater complexity in system planning and scheduling [4,5]. Task scheduling in HRC must simultaneously pursue production efficiency [6] and worker well-being, as rest breaks are critical for fatigue recovery and error reduction [7,8,9]. This study addresses the multi-objective scheduling problem of HRC assembly cells, considering both cycle time and micro-breaks for human workers.
Although prior research, including our own [4], typically assumes fixed task execution times, human task completion times in real-world manufacturing exhibit inherent variability. To address this gap, we investigate HRC task scheduling with fuzzy execution times and propose a novel Monte-Carlo simulation (MCS) approach based on a proportional-to-area probability density function. For multi-objective optimization, we introduce an enhanced binary butterfly optimization algorithm (BOA) integrated within an MOEA/D framework to solve the Pareto optimal solution set. The primary contributions of this study are as follows:
- A new MCS method of representing triangular fuzzy numbers (TFNs) using probability density functions is proposed. This approach effectively captures the inherent stochastic nature of tasks performed by human workers, extending and enhancing current research in the field.
- An improved method of BOA is introduced into the framework of MOEA/D to enable the efficient solving of the Pareto solution set for the multi-objective task scheduling problem characterized by fuzzy execution times.
The rest of the paper is organized as follows. In Section 2, the literature review concerning the presented approach is introduced. A novel TFNs simulation method is detailed in Section 3, while the TFNs-based task scheduling approach is described in Section 4. We present the proposed algorithm in Section 5. Section 6 provides the experimental verification of the proposed model and method, followed by the conclusions in Section 7.
2. Related Work
2.1. HRC Task Planning and Scheduling
Optimization-based approaches have frequently been used to solve the task planning and scheduling problem of HRC. Genetic Algorithm (GA) solves task allocation problems by considering the assembly line balancing problem in HRC systems [10]. HRC task scheduling is formalized as a multi-mode, multi-processor optimization problem minimizing total work time and is solved by GAs [11]. Moreover, many practical task scheduling problems with multiple criteria have been studied based on multi-objective methods. HRC disassembly line balancing with stochastic task times was investigated using an AND/OR graph to model disassembly processes, aiming to maximize profit and minimize energy consumption [12]. A multi-objective optimization model involving production cost, production time, and idle time minimization of a human–robot collaboration task assignment is proposed by [6].
Due to occupational diseases and human errors, many approaches have focused on human fatigue in manufacturing. Jaber et al. [13] developed a promising mathematical model called Learning–Forgetting Fatigue Recovery (LFFR) to evaluate workers’ fatigue-recovery process through parameters and duration of the task. The LFFR model has been approved by scholars and integrated into their studies, for example, in reliability assessment of human–machine systems [14], HRC disassembly systems [15], scheduling of manual assembly lines [16], and the hybrid flow shop scheduling problem [17]. In our previous studies [4,18], we proposed a novel task scheduling model integrated with micro-breaks inside job cycles for human workers’ recovery.
2.2. Scheduling with Triangular Fuzzy Numbers
In actual manufacturing systems, a range of uncertain factors exist, including processing time, product demands, machine maintenance, and others. Fuzzy theory has been widely utilized in fuzzy scheduling to represent uncertainty, and many works have been conducted on fuzzy scheduling problems [19]. The use of triangular fuzzy numbers (TFNs) is one of the major representation methods for uncertainty variables [20].
Triangular fuzzy numbers (TFNs) have been widely adopted in scheduling research to characterize uncertain operational parameters. In the assembly flow shop scheduling problem study, TFNs are applied to indicate processing time [19]. Further extending this paradigm, recent intelligent workflow scheduling schemes utilize TFNs to quantify uncertainties in server computational capacity and inter-server bandwidth [21].
The arithmetic operations and ranking are elements of TFN applications [22]. Zou et al. proposed a two-dimensional method of MCS to rank TFNs [23]. Jin et al. proposed an MCS from a TFN probability distribution function to overcome the larger error shortcoming of the conventional method [24]. The probability density function and possibility distribution function are used to model the uncertainty/imprecision variables. Fuzzy MCS with point-cloud-based probability–possibility transformation are applied to transfer a fuzzy number into its equivalent probability density function [25].
Although this method is effective for symmetric TFNs, its performance is highly dependent on the selection of the distribution-controlling parameters.
This paper proposes a new probability density function, which serves as the basis for representing uncertain execution time using the method of MCS.
3. A Novel MCS Method of TFNs
A TFN can be denoted as , where and indicate the lower and upper limit values of and indicates the center value of , . The membership function of is defined in (1).
In reference [24], a TFN probability density function is proposed as (2) and the probable value of the TFN variable x is obtained as (2), thus enabling the representation of x using MCS. However, the results obtained through the above method exhibit certain deviations, as the probabilities of multiple values do not conform to the expected pattern.
From (3), the properties of the TFN probability density function can be derived as follows:
- When , reaches its maximum value;
- When , is monotonically increasing;
- When , is monotonically decreasing;
- When , ;
- .
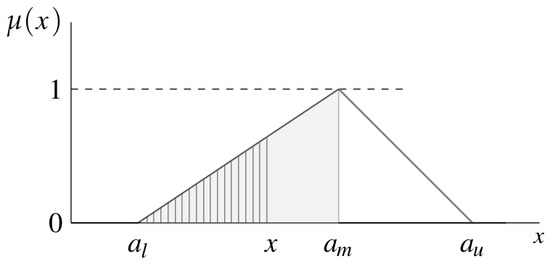
In this paper, we improved the TFN probability density function derivation method by the ratio of area. Figure 1 shows the probability density function derivation when . When , area of shading is . The total left area of the TFN is .
Figure 1.
TFN probability density function derivation schematic.
To satisfy the constraint that the probabilities of x approaching from both sides are equal and that the total probability is 1, we correct the (4) by coefficient . Therefore, when , the TFN probability density function is shown in (5).
Similarly, when , the probability density function of TFN can be obtained. Finally, the probability density function of is shown in (6).
Then, the probability distribution function can be obtained as (7).
Finally, (8) is obtained by the inverse transform method [24]. The probable value of x can be stochastic simulated by (8).
where is a uniformly distributed random number from 0 to 1.
In the MCS of TFNs, a series of random numbers is substituted into (8) to generate the probable values of x. In the calculation, a TFN can be replaced by the generation value of x.
A comparative analysis of the proposed method against the approach of Jin et al. [24] is provided in Table 1. In this evaluation, three typical triangular fuzzy numbers are adopted as test benchmarks, and the simulation is performed with 5000 independent runs to ensure the validity of the statistical inferences.
Table 1.
Comparison of old and new methods for triangular fuzzy numbers.
As shown in Table 1, the Kolmogorov–Smirnov (K-S) test rejects the identical-distribution hypothesis for all three TFNs (), indicating significant distributional differences between the two methods. Nevertheless, the MAE values confirm acceptable numerical consistency. Notably, the proposed method achieves substantial stability improvements, demonstrating superior overall performance for subsequent optimization applications.
4. TFN-Based Model for Multi-Objective Optimization Problems in HRC Cell
In the HRC task scheduling studied in this paper, the execution time of a human worker performing a subtask is considered as an interval TFN. The following assumptions are obtained:
Assumption 1.
The execution time of a human worker performing a subtask is a TFN, and all the TFNs are independently and identically distributed.
Assumption 2.
Human workers can finish scheduled tasks in the given time regardless of the fatigue level.
Assumption 3.
Subtask execution time is not correlated with human workers’ tenure, experience, or fatigue.
Assumption 4.
When there are multiple workers in the HRC cell, the longest subtask execution time is taken as the execution time of all workers.
Assumption 5.
The subtask execution time of the robot is fixed.
Assumption 6.
To reduce computational burden, all agents (both human and robotic) are assumed to be indistinguishable, sharing identical fuzzy distribution parameters and equal task assignment opportunities.
In the proposed HRC assembly cell, there are h human workers and r robots in the task scheduling problem . There are n subsets S with sequential restriction in each assembly cycle. There are tasks without sequential restriction in subset . Whether a task is in parallel or sequential order depends on the number of suitable operators. Decision variable presents whether the task from subset is assigned to operator K. Matrices and present the task scheduling result of for human workers and robots, respectively. There are columns in and . The numbers of rows of and are h and r, respectively. The task execution time is presented by -dimensional vectors (TFN time) and (fixed time). Time matrices of sequence for human workers and robots are presented in (11) and (10).
Moreover, the total execution time of can be described by Equation (12). Total execution for the assembly cycle .
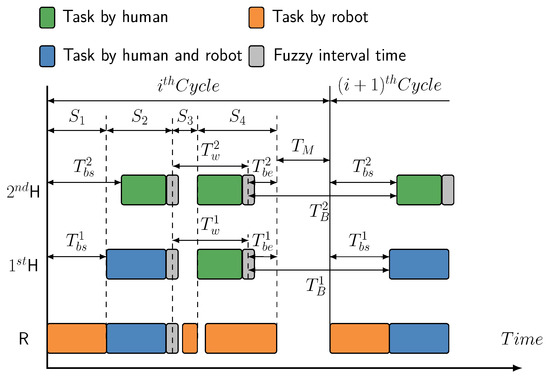
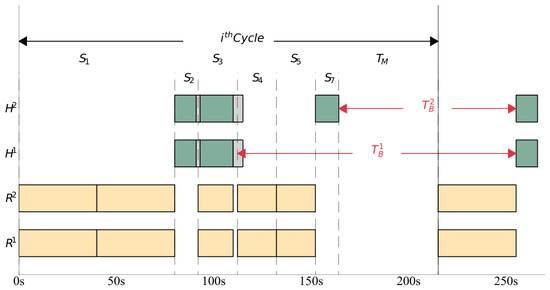
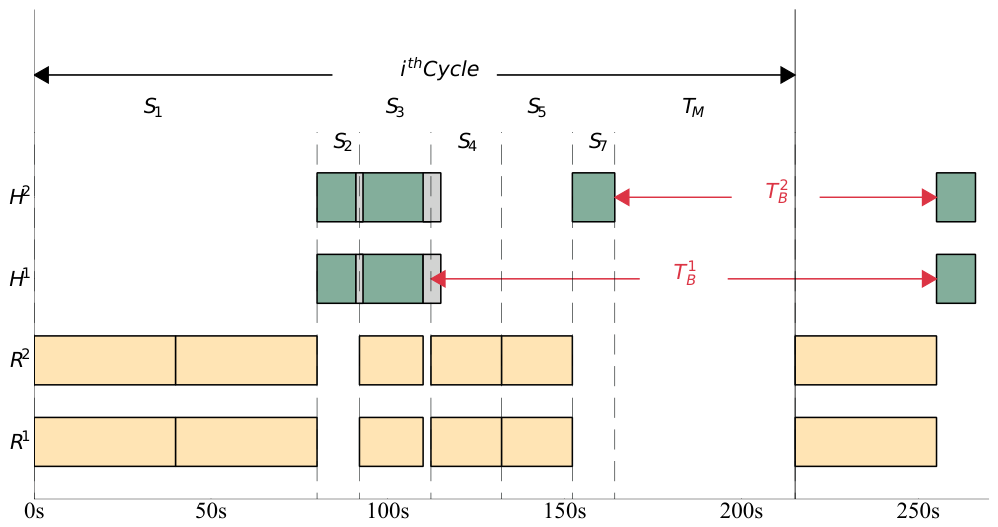
From human worker’s point of view, the assembly cycle can be divided into working periods and rest periods, which is shown in (14) and Figure 2. Three break phases for each human worker, , , and , are found by ignoring other small periods [4].
Figure 2.
Phrase definition inside job cycle.
In the time calculation of A, human workers’ working time is presented by TFN, which is generated by (8). In the MOPs of this paper, we jointly consider cycle time and human workers’ fatigue minimization. is the objective of mean cycle time minimization. is the objective of human workers’ mean fatigue minimization. The objectives are as follows:
Similar constraints can be found in our previous paper [4].
The process for the objective function calculation by MCS iterative solving is as follows:
- Step 1: Set the iteration to 1.
- Step 2: Generate task scheduling result.
- Step 3: Generate fuzzy task execution time by (8).
- Step 4: Calculate cycle time A.
- Step 5: Calculate human workers’ fatigue F after one work shift.
- Step 6: Increase iteration by 1.
- Step 7: If the number of iterations is reached, return the expectation values of A and F; otherwise go to Step 2.
5. Proposed Algorithm: MOEA/D-BOA
5.1. MOEA/D-BOA
We proposed a new method based on BOA individual evolution within the MOEA/D framework to solve the Pareto front of MOPs. In BOA, each butterfly presents a task scheduling result. Task coding and time coding take place within the butterfly coding. The task coding corresponds to the task scheduling of each operator (human workers and robots). The time coding corresponds to the time gap between two work cycles (Figure 2).
The code-to-time conversion of is shown in (16).
where n is the task number, is the code of time coding, is the scaling factor, which ensures the value is within reasonable limits.
The MOEA/D-BOA algorithm is shown in Algorithm 1. Unlike the original MOEA/D algorithm, we set each reference point to each minimum objective. In this paper, each reference point corresponds to the best butterfly of each objective.
| Algorithm 1 MOEA/D-BOA algorithm |
| Require: N: Population size; T: Neighbor size; G: Maximum iteration |
| Ensure: External population (EP) |
| Step 1: Initialization |
| Generate uniformly distributed weight vectors |
| Initialize as empty set |
| for do |
| for do |
| if then |
| Calculate Euclidean distance between and |
| end if |
| end for |
| Determine the T neighborhoods of based on distances: |
| end for |
| Initialize population |
| for each do |
| Calculate fitness of butterfly |
| end for |
| Initialize reference point |
| Step 2: Butterfly Optimization |
| Execute Algorithm 2 |
| Update neighborhoods based on current population |
| Update reference point Z |
| Update with non-dominated solutions |
| if current iteration == G then |
| Output |
| else |
| Goto Step 2 |
| end if |
The original BOA is suitable for solving real number problems, and improvements are made to make it suitable for solving binary problems in this paper. The stimulus intensity is defined as the difference in the fitness function between two butterflies. To ensure that the impact of the fitness function is balanced across multiple objectives, the difference in the fitness function is normalized, which is shown in (17).
The movement of butterfly towards butterfly is presented as the substitution of some columns of by . The number of substitution columns is determined by (18).
where D is the coefficient of coding difference, is the number of bits of the coding difference between two butterflies, is the number of bits of one butterfly, is the number of columns to be substituted, and is the stimulus intensity between two butterflies. Butterfly , which could be the global best butterfly or one of ’s neighbor, is the target of .
The improved binary butterfly algorithm is shown in Algorithm 2.
| Algorithm 2 Improved binary BOA algorithm |
| Generate butterfly generation |
| Calculate each butterfly’s fitness |
| Initialize reference point |
| for Each butterfly do |
| Generate random number r |
| if then |
| Randomly select a reference point as the target butterfly |
| else |
| Randomly select a butterfly from the neighborhood as the target butterfly |
| end if |
| Calculate from (18) |
| if then |
| Current butterfly crossover |
| else |
| Current butterfly mutation |
| end if |
| end for |
5.2. Computational Complexity
The computational complexity of the proposed MOEA/D-BOA is analyzed as follows, where is the population size, the number of decision variables, m is the number of objectives, the neighborhood size, is the external population size, and is the maximum number of generations. During initialization, population initialization costs , weight vector generation costs , and the one-time neighborhood construction costs . In each generation, crossover and mutation cost , while EP and reference point updates cost and , respectively. Therefore, the overall complexity is
where the initialization terms are dominated by the iterative term for sufficiently large .
For comparison, the standard MOEA/D maintains no external population, and its complexity is
which is dominated by .
Compared with standard MOEA/D, the proposed algorithm incurs additional per-generation costs of for EP maintenance and for decision-space evolutionary operations, whereas MOEA/D mainly operates in the m-dimensional objective space. Since typically , this increased complexity is the inherent trade-off for achieving superior solution quality and diversity, as verified experimentally.
6. Numerical Experiments and Results
6.1. Instances
For a better description of the proposed method for task scheduling, two assembly cases were studied by inspiration of an industry case. In this paper, we focused on a small assembly cell that contains no more than two robots and two human workers. Therefore, there are four possible forms of collaboration. There are six and seven sequences in these cases, respectively. Table 2 summarizes the sequence configurations adopted in this study, while Table 3 provides detailed specifications for each sequence, including the number of constituent tasks and the corresponding execution times for human workers and robots. In the robotic case, execution times are treated as deterministic constants, whereas human task times are represented as TFNs. The detailed setup and outcomes of these two cases are presented in the Supplementary Materials (File S3. problem_instances.json).
Table 2.
Sequence type information.
Table 3.
Sequence information of TFN cases.
For each TFN, the lower and upper bounds are directly derived from experimental measurements, corresponding to the best-case and worst-case durations. The modal value, representing the most likely execution time under normal conditions, cannot be obtained directly from the experimental measurements and is therefore estimated based on reasonable assumptions grounded in the observed data patterns.
Across two cases, there are a total of 14 and 18 tasks, respectively. In the study cases, we focused on the work shift of 4 h (14,400 s).
6.2. Parameter Sensitivity Analysis
Three key parameters—population size , maximum generations , and neighborhood size —were evaluated using Hypervolume (HV) and Spacing (SP) with 3–4 levels per parameter and three repetitions. Table 4 summarizes the range, correlation r, sensitivity index, and ANOVA p () for each parameter.
Table 4.
Sensitivity analysis results under different parameter configurations.
Based on Table 4, neighborhood size is identified as the most influential parameter: a smaller neighborhood significantly outperforms larger ones in HV, as excessive values severely degrade performance, indicating that compact neighborhoods better preserve population diversity. Regarding generation count, 50 generations proves optimal, as further increases not only diminish HV but also triple the runtime, implying premature convergence and over-exploration. Population size exhibits a monotonic HV improvement with increasing Np, albeit at a considerable runtime cost.
To provide a comprehensive and fair performance comparison, all algorithms were independently executed five times on each test instance. To comprehensively evaluate the performance of the compared algorithms, two widely adopted performance metrics are employed: HV and Inverted Generational Distance (IGD). HV measures both the convergence and diversity of the obtained solution set by calculating the volume of the objective space dominated by the approximation set, where a larger value indicates better performance. IGD evaluates the average distance from each point in the reference front to the nearest obtained solution, simultaneously reflecting convergence and diversity, with a smaller value being preferable. Since the true Pareto front is unavailable for the test problems under consideration, we construct a reference front by collecting all non-dominated solutions obtained from all algorithms across all runs, and then extracting the Pareto-optimal set from this union. The statistical results, including the mean, standard deviation, minimum, and maximum values, are reported to ensure a thorough assessment from both central tendency and stability perspectives. The complete raw results, including all output data from the experiments, are available as JSON files in the Supplementary Materials (File S1).
As shown in Table 5 and Table 6, MOEA/D-BOA consistently outperforms the other algorithms across both performance metrics. It achieves the highest HV values and the lowest IGD values on both experimental cases, demonstrating superior solution quality in terms of both convergence and diversity. MOEA/D-BOA effectively balances exploration and exploitation, leading to solution sets that are both close to and well-distributed along the true Pareto front.
Table 5.
Hypervolume statistics of different algorithms.
Table 6.
IGD statistics of different algorithms.
Nevertheless, MOEA/D-BOA exhibits slightly larger standard deviations and longer runtimes than MOEA/D-GA, indicating marginally reduced stability and increased computational cost. However, given the substantial improvements in both HV and IGD, these minor disadvantages are considered acceptable.
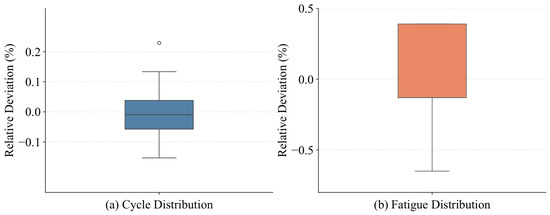
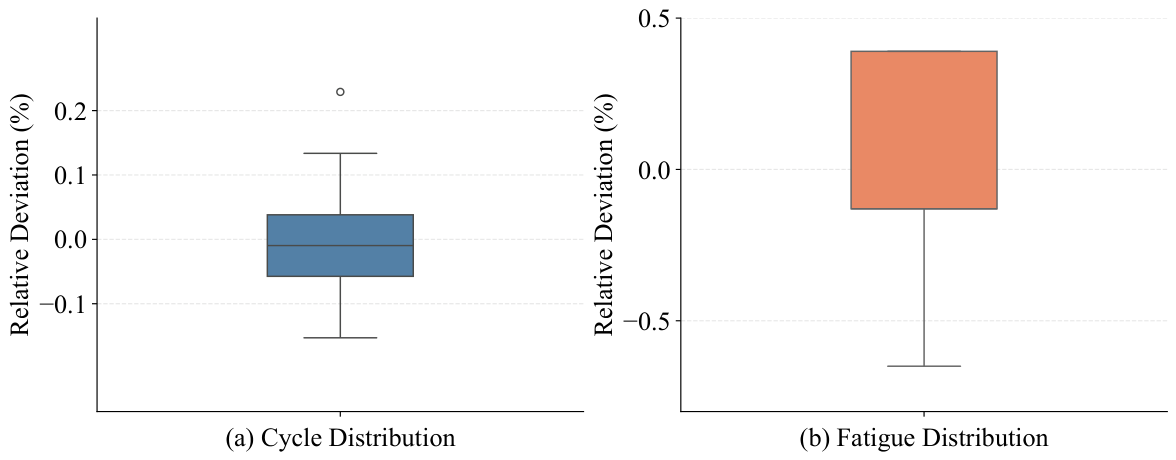
A typical scheduling outcome obtained by MOEA/D-BOA is illustrated in Figure 3. Furthermore, Figure 4 reveals the relative fitness values across 5000 iterations corresponding to this schedule. The two subfigures in Figure 4 reveal distinctly different distribution patterns when examined in terms of relative deviation. The cycle time fitness, the relative deviation is tightly confined to a narrow band of approximately −0.15% to +0.23%. This pronounced concentration indicates that the cycle-time objective is highly robust to variations, a direct consequence of the aggregation of TFN-represented task durations, wherein positive and negative spreads effectively cancel out over the task cycle, yielding minimal relative fluctuation. In contrast, the fatigue fitness exhibits a substantially broader relative-deviation range nearly three times the width observed for the cycle time fitness. This marked disparity quantitatively highlights the inherent asymmetry in fatigue dynamics. Unlike duration summation, fatigue onset and recovery are governed by unequal rate parameters, such that even symmetrically distributed task durations give rise to directionally cumulative deviations across the work cycle. Nevertheless, the relative deviation remains confined to a single-digit percentage range, indicating that although the directional bias is unavoidable, the proposed method effectively prevents fatigue accumulation from diverging beyond a controllable margin, thereby ensuring operational feasibility without compromising solution quality.
Figure 3.
Gantt charts of typical scheduling result of MOEA/D-BOA.
Figure 4.
Fitness iteration distribution of MOEA/D-BOA typical result.
7. Conclusions
In this paper, we address the human–robot collaborative assembly scheduling problem under non-fixed human execution times by modeling temporal uncertainty with TFNs and proposing a new probability density function for Monte Carlo simulation based on a proportional-to-area principle. The resulting distribution, validated through 5000 random simulations, demonstrates superior performance over existing approaches. Furthermore, the MOEA/D-BOA algorithm is proposed to simultaneously optimize productivity and human fatigue. Numerical experiments on two industry-inspired assembly cases confirm that the proposed method consistently outperforms all compared algorithms across every evaluated metric, with substantial improvements in both IGD and HV. These findings validate the effectiveness of the fuzzy simulation strategy and the robustness of the optimization algorithm in balancing the two conflicting objectives under uncertainty. Future work will extend the current framework to dynamic scheduling scenarios with real-time fatigue monitoring and adaptive task re-allocation.
Supplementary Materials
The following supporting information can be downloaded at: https://www.mdpi.com/article/10.3390/a19080673/s1, File S1: Raw experimental results in JSON format; File S2: Full results for all algorithms and runs (all_results.json); File S3: Problem instance configurations for the two case studies (problem_instances.json); File S4: Experiment configuration parameters (experiment_config.json); File S5: Statistical summaries of Hypervolume (HV) metric (statistics_hv.csv); File S6: Statistical summaries of Inverted Generational Distance (IGD) metric (statistics_igd.csv); File S7: Runtime statistics for all algorithms (statistics_runtime.csv). File S8: (README.txt).
Author Contributions
Conceptualization, M.Z.; methodology, M.Z.; algorithm, S.Z.; validation, Q.F.; resources, J.H.; data curation, Q.Q.; writing—original draft preparation, M.Z.; writing—review and editing, J.H. and D.T.; visualization, X.Y.; supervision, H.Q.; project administration, Y.Z.; funding acquisition, Y.Z. All authors have read and agreed to the published version of the manuscript.
Funding
This research was funded by Guangxi Key Research and Development Program (Guike FN2504240014).
Data Availability Statement
All case study data (input and results) are provided in the Supplementary Materials.
Conflicts of Interest
Yi Zhou, Jiaxiong He, Denghong Tan, and Qiuxi Qin were employed by the company Guangxi Beitou DigitalTechnology Industry Co., Ltd. Xing Yang and Qi Feng were employed by the company of Guangxi Transportation Science and Technology Group Co., Ltd. The remaining authors declare that the research was conducted in the absence of any commercial or financial relationships that could be construed as a potential conflict of interest.
References
- Yuan, G.; Liu, X.; Qiu, X.; Zheng, P.; Pham, D.T.; Su, M. Human-robot collaborative disassembly in Industry 5.0: A systematic literature review and future research agenda. J. Manuf. Syst. 2025, 79, 199–216. [Google Scholar] [CrossRef] [Scilit]
- Stecke, K.E.; Mokhtarzadeh, M. Balancing collaborative human-robot assembly lines to optimise cycle time and ergonomic risk. Int. J. Prod. Res. 2022, 60, 25–47. [Google Scholar] [CrossRef] [Scilit]
- Baratta, A.; Cimino, A.; Longo, F.; Nicoletti, L. Digital twin for human-robot collaboration enhancement in manufacturing systems: Literature review and direction for future developments. Comput. Ind. Eng. 2024, 187, 109764. [Google Scholar] [CrossRef] [Scilit]
- Zhang, M.; Li, C.; Shang, Y.; Liu, Z. Cycle Time and Human Fatigue Minimization for Human-Robot Collaborative Assembly Cell. IEEE Robot. Autom. Lett. 2022, 7, 6147–6154. [Google Scholar] [CrossRef] [Scilit]
- Proia, S.; Carli, R.; Cavone, G.; Dotoli, M. Control Techniques for Safe, Ergonomic, and Efficient Human-Robot Collaboration in the Digital Industry: A Survey. IEEE Trans. Autom. Sci. Eng. 2022, 19, 1798–1819. [Google Scholar] [CrossRef] [Scilit]
- Zhu, Q.; Huang, S.; Wang, G.; Moghaddam, S.K.; Lu, Y.; Yan, Y. Dynamic reconfiguration optimization of intelligent manufacturing system with human-robot collaboration based on digital twin. J. Manuf. Syst. 2022, 65, 330–338. [Google Scholar] [CrossRef] [Scilit]
- Di Pasquale, V.; Fruggiero, F.; Iannone, R.; Miranda, S. A Model for Break Scheduling Assessment in Manufacturing Systems. Comput. Ind. Eng. 2017, 111, 563–580. [Google Scholar] [CrossRef] [Scilit]
- Scholz, A.; Wendsche, J.; Ghadiri, A.; Singh, U.; Peters, T.; Schneider, S. Methods in Experimental Work Break Research: A Scoping Review. Int. J. Environ. Res. Public Health 2019, 16, 3844. [Google Scholar] [CrossRef] [Scilit] [PubMed]
- Ranavolo, A.; Chini, G.; Draicchio, F.; Silvetti, A.; Varrecchia, T.; Fiori, L.; Tatarelli, A.; Rosen, P.; Wischniewski, S.; Albrecht, P.; et al. Human-Robot Collaboration (HRC) Technologies for Reducing Work-Related Musculoskeletal Diseases in Industry 4.0. In IEA2021: Triennial Congress of the International Ergonomics Association; Springer International Publishing: Cham, Switzerland, 2021; pp. 335–342. [Google Scholar] [CrossRef] [Scilit]
- Dalle Mura, M.; Dini, G. Designing assembly lines with humans and collaborative robots: A genetic approach. CIRP Ann. 2019, 68, 1–4. [Google Scholar] [CrossRef] [Scilit]
- Ferreira, C.M.; Figueira, G.; Amorim, P. Scheduling Human-Robot Teams in Collaborative Working Cells. Int. J. Prod. Econ. 2021, 235, 108094. [Google Scholar] [CrossRef] [Scilit]
- Guo, X.; Fan, C.; Zhou, M.; Liu, S.; Wang, J.; Qin, S.; Tang, Y. Human–Robot Collaborative Disassembly Line Balancing Problem With Stochastic Operation Time and a Solution via Multi-Objective Shuffled Frog Leaping Algorithm. IEEE Trans. Autom. Sci. Eng. 2024, 21, 4448–4459. [Google Scholar] [CrossRef] [Scilit]
- Jaber, M.Y.; Givi, Z.S.; Neumann, W.P. Incorporating Human Fatigue and Recovery into the Learning-Forgetting Process. Appl. Math. Model. 2013, 37, 7287–7299. [Google Scholar] [CrossRef] [Scilit]
- Che, H.; Zeng, S.; Guo, J. Reliability Assessment of Man-Machine Systems Subject to Mutually Dependent Machine Degradation and Human Errors. Reliab. Eng. Syst. Saf. 2019, 190, 106504. [Google Scholar] [CrossRef] [Scilit]
- Li, K.; Liu, Q.; Xu, W.; Liu, J.; Zhou, Z.; Feng, H. Sequence Planning Considering Human Fatigue for Human-Robot Collaboration in Disassembly. Procedia CIRP 2019, 83, 95–104. [Google Scholar] [CrossRef] [Scilit]
- Ostermeier, F.F. The impact of human consideration, schedule types and product mix on scheduling objectives for unpaced mixed-model assembly lines. Int. J. Prod. Res. 2020, 58, 4386–4405. [Google Scholar] [CrossRef] [Scilit]
- Wu, J.; Liu, Y.; Zhang, Y. Multi-objective evolutionary co-learning framework for energy-efficient hybrid flow-shop scheduling problem with human-machine collaboration. Swarm Evol. Comput. 2025, 95, 101932. [Google Scholar] [CrossRef] [Scilit]
- Zhang, M.; Li, C.; Shang, Y.; Huang, H.; Zhu, W.; Liu, Y. A task scheduling model integrating micro-breaks for optimisation of job-cycle time in human-robot collaborative assembly cells. Int. J. Prod. Res. 2021, 60, 4766–4777. [Google Scholar] [CrossRef] [Scilit]
- Li, M.; Su, B.; Lei, D. A novel imperialist competitive algorithm for fuzzy distributed assembly flow shop scheduling. J. Intell. Fuzzy Syst. 2021, 40, 4545–4561. [Google Scholar] [CrossRef] [Scilit]
- Yuan, G.; Yang, Y.; Tian, G.; Fathollahi-Fard, A. Capacitated Multi-objective Disassembly Scheduling with Fuzzy Processing Time via a Fruit Fly Optimization Algorithm. Environ. Sci. Pollut. Res. 2022. [Google Scholar] [CrossRef] [Scilit] [PubMed]
- Chen, X.; Lin, C.; Lin, B. An Intelligent Workflow Scheduling Scheme for Complex Network Robustness in Fuzzy Edge-Cloud Environments. IEEE Trans. Netw. Sci. Eng. 2024, 11, 1106–1123. [Google Scholar] [CrossRef] [Scilit]
- Xie, X.; Liu, Y.; Gu, Y.; Zhou, J. Arithmetic operations on triangular fuzzy numbers via credibility measures: An inverse distribution approach. J. Intell. Fuzzy Syst. 2018, 35, 3359–3374. [Google Scholar] [CrossRef] [Scilit]
- Zou, S.C.; Liu, F.; You, Q.R. A Two-Dimensional Simulation Approach for Ranking Fuzzy Numbers by the Monte Carlo Technique. Int. J. Uncertain. Fuzziness Knowl.-Based Syst. 2021, 29, 559–586. [Google Scholar] [CrossRef] [Scilit]
- Ju-liang, J.; Qiu-ying, F.; Ming, Z.; Yu-liang, Z. Economic Risk Analysis Method of flood control engineering system based on stochastic simulation of triangular fuzzy numbers. In Proceedings of the 2009 Chinese Control and Decision Conference, CCDC, Guilin, China, 17–19 June 2009; pp. 5934–5938. [Google Scholar]
- Sharif Ullah, A.M.M.; Shamsuzzaman, M. Fuzzy Monte Carlo Simulation using point-cloud-based probability–possibility transformation. Simulation 2013, 89, 860–875. [Google Scholar] [CrossRef] [Scilit]

Disclaimer/Publisher’s Note: The statements, opinions and data contained in all publications are solely those of the individual author(s) and contributor(s) and not of MDPI and/or the editor(s). MDPI and/or the editor(s) disclaim responsibility for any injury to people or property resulting from any ideas, methods, instructions or products referred to in the content. |
© 2026 by the authors. Licensee MDPI, Basel, Switzerland. This article is an open access article distributed under the terms and conditions of the Creative Commons Attribution (CC BY) license.