


Abstract
This paper presents a high-spatial-resolution 3D system to simulate air quality in urban environments by coupling the WRF/Chem regional model with the PALM4U computational fluid dynamics model, together with an emission model using the SUMO microscopic traffic model. The system has been applied to two experiments in the city of Madrid, Spain. The first study quantifies the impact of four high-rise buildings on pollutant dispersion. The second evaluates the effect of changing tree types (broad-leaf vs. needle-leaf) in the Retiro Park on NO2 and O3 concentrations. Both simulations adopt a multiscale approach, using detailed 3D urban morphology, traffic flow data and meteorological conditions. In the first experiment, high-rise buildings caused local variations in NO2 and O3 of up to 15% and 20%, respectively. In the second experiment, replacing broad-leaf trees with needle-leaf trees led to a mean NO2 reduction of 1.69% across 90.67% of the study area. This research demonstrates the value of integrated CFD modeling for planning urban mitigation strategies and optimizing air quality in complex urban environments.
1. Introduction
Urban air quality remains one of the most pressing environmental challenges because of its direct implications for public health. There is growing evidence of the serious health consequences associated with prolonged exposure to air pollutants, such as increased incidence and severity of respiratory and cardiovascular conditions, which in turn contribute to higher mortality rates [1]. Despite the critical importance of monitoring pollutant levels, conducting comprehensive and simultaneous measurements in a densely populated urban area poses significant logistical and economic challenges, such as high operational costs and limited spatial availability of instrumentation.
In contrast, numerical modeling has emerged as a flexible and scalable alternative for assessing urban air quality under various scenarios. Statistical dispersion models, widely accepted in regulatory and research contexts, can provide reasonably accurate estimates of pollutant concentrations near dominant emission sources, assuming reliable meteorological data are available [2]. However, their predictive power decreases significantly in more complex flow environments or at greater distances from emissions, where pollutant transport may involve poorly understood turbulent dynamics. In particular, under conditions of weak turbulence, localized pollution may persist and be transported over longer distances, a phenomenon that conventional statistical techniques do not adequately capture.
To address these limitations, current research focuses on the development of advanced numerical tools aimed at assisting urban planners and policymakers. These tools aim to provide a more detailed understanding of air pollution dynamics and facilitate the priori assessment of possible mitigation strategies [3]. Among the various approaches being explored, green infrastructure—including street trees, green roofs, park vegetation and vertical gardens [4]—has received increasing attention as a nature-based solution (NBS) for improving air quality. This is based on the premise that vegetated surfaces can capture air pollutants more effectively than impermeable artificial materials [5]. However, empirical support for the effectiveness of green infrastructure in reducing pollutant concentrations remains limited [6]. Without systematic approaches to assess their true impact on urban air quality, it remains difficult for scientists and practitioners to determine when, where and to what extent these nature-based interventions should be deployed. Therefore, there is a pressing need for robust simulation frameworks, such as the one proposed in this study, to advance our understanding of the actual effectiveness of NBS in mitigating urban air pollution, or other alternative scenarios.
The dispersion of air pollutants in urban environments is significantly influenced by three-dimensional urban structures such as buildings, trees and other physical features. These features alter local airflow patterns, create areas of turbulence and can trap or redirect plumes of pollutants, thus shaping the spatial distribution of air quality within the urban landscape. To accurately capture these interactions, modeling tools capable of resolving the complex flow dynamics induced by these three-dimensional structures are needed. At the core of these advanced tools are computational fluid dynamics (CFD) models, which are becoming increasingly feasible thanks to the proliferation of high-performance computing infrastructures. These infrastructures, enabled by recent advances in computational power, allow the execution of resource-intensive simulations with spatial resolutions on the order of meters. CFD models provide detailed three-dimensional representations of urban energy and mass exchanges, including wind fields and pollutant concentrations, while explicitly taking into account the aerodynamic effects of buildings and vegetation as obstacles to turbulent flow. By incorporating these physical details, CFD-based approaches provide a powerful means of analyzing how urban form and structure affect pollutant dispersion, thus supporting more informed decision-making in air quality management and urban design.
Two main approaches are commonly used in CFD modeling of urban air quality: Reynolds-Averaged Navier–Stokes (RANS) models and Large Eddy Simulation (LES) models. Each has different methodological foundations and performance characteristics. RANS models are based on time-averaged equations of motion and incorporate parameterizations for turbulence, effectively modeling the full spectrum of turbulent eddies without differentiating between their scales. This approach assumes non-convective transport in turbulent flows and treats turbulence as a broadband stochastic phenomenon lacking dominant frequencies. Although computationally efficient, RANS models have limited ability to represent complex urban dynamics, particularly within street canyons, due to their reliance on gradient diffusion assumptions, which can oversimplify pollutant transport processes in these environments. In contrast, LES models directly resolve the largest and highest-energy eddies, modeling only the smallest turbulent scales. This allows LES to capture the periodicity and unsteady behavior of the flow field, including the intermittent and transient mixing phenomena that are critical for accurately simulating pollutant dispersion in urban environments. Although LES requires significantly more computational resources than RANS, it offers a much more faithful representation of flow structures, especially in scenarios with complex geometries and highly variable wind and turbulence patterns. For this reason, LES is particularly well-suited to the type of study presented here, which involves simulating pollutant dispersion in a dense urban area characterized by high-rise buildings and complex airflow interactions.
Shirzadi and Tominaga [7] have used LESs and wind tunnel experiments to investigate how the presence of low-rise buildings surrounding a high-rise tower drastically alters pollutant dispersion mechanisms. Their results show that, in dense urban environments, pollutants emitted at street level tend to move vertically towards the upper floors of tall buildings due to wake flow interaction, which can increase concentrations at high levels by up to five times compared to a freestanding building. These findings highlight the risk of underestimating the exposure of residents on upper floors if the surrounding urban morphology is not considered in detail. While the study by Shirzadi and Tominaga uses a generic and abstract block configuration to understand basic mechanisms, our work applies the model to a complex real-world environment (the city of Madrid) using real 3D morphology. The boundary conditions of the CFD simulation are dynamic, unlike the fixed wind profiles used in the cited work. Madrid is a highly significant study area due to its complex urban fabric, which combines high-density financial districts with skyscrapers and large green spaces. These characteristics, combined with the city’s unique semi-arid Mediterranean climate and recurring episodes of temperature inversion, provide a challenging yet ideal environment for validating atmospheric modeling systems.
Ioannidis et al. [8] applied a RANS-based CFD model to simulate the dispersion of particulate matter, CO, and NOx at a critical traffic point in Augsburg, Germany. Their study validated the use of digital tools to assess pollution levels at street level, using emission data calculated with COPERT Street software (v2.4) and meteorological data from local sensor networks. Although this work provides a detailed 3D digital pollution network, it focuses on steady-state conditions and a meteorological configuration based on standard velocity profiles. While Ioannidis et al. use the RANS approach, which is more efficient but limited in complex environments, our study employs LES through PALM4U. LES allows for the direct resolution of larger eddies and the capture of transient flow behavior, which is critical in dense areas with tall buildings where RANS often oversimplifies pollutant transport. Ioannidis et al. use a fixed velocity profile for the atmospheric boundary layer. In contrast, our system implements an offline coupling with the mesoscale WRF/Chem model, which provides dynamic and realistic meteorological and chemical boundary conditions that evolve every hour.
In addition to local sources, urban air pollution is also significantly influenced by the short- and long-term transport of gases and particles from surrounding regions. Accurately capturing this external contribution is essential for realistic urban-scale air quality modeling. Therefore, any comprehensive simulation framework must include mechanisms that account for pollutant input and dispersion beyond the urban boundary. In this study, we address this problem by coupling a mesoscale model to provide dynamic boundary conditions for high-resolution microscale CFD simulations. Air quality in cities is characterized by marked spatial heterogeneity, with steep concentration gradients that can occur over very short distances, even along a single street. Traditional mesoscale chemical transport models, while effective at capturing regional pollutant dynamics, typically operate at grid resolutions down to 1 km. These models assume instantaneous mixing of emissions within each grid cell, which prevents them from resolving fine-scale spatial variability critical in densely built-up urban environments [9]. Consequently, they are insufficient to represent the intricate interplay between emissions, wind flow, and urban morphology. Several factors contribute to this small-scale variability, including not only the spatial distribution of vehicular emissions [10], but also the structural complexity of the built environment itself [11]. Elements such as buildings, trees, and narrow street canyons introduce physical heterogeneities that influence both the direction and intensity of airflow and, consequently, turbulent transport and dispersion of pollutants.
Furthermore, mesoscale models are inherently limited in their ability to simulate large-eddy-induced turbulence, which plays a vital role in pollutant mixing and advection within cities. To address this, high-resolution modeling approaches, such as those based on LES, are required. These methods can explicitly resolve larger turbulent structures and account for the geometric influence of urban features, making them better suited to accurately represent the dynamic and spatially complex nature of urban air pollution.
Rodrigues et al. (2024) [12] applied the ENVI-met (v5.1.1.) CFD model to a densely urbanized area of Lisbon to assess how green walls, green roofs and green corridors influence NO2, O3 and particulate matter levels. Their results indicated that, while green walls alone had a negligible impact on flow dynamics, an integrated green infrastructure scenario showed potential benefits in reducing O3 concentrations, albeit with variable impacts on other pollutants due to the barrier effect that vegetation has on urban ventilation. This study highlights the complexity of implementing green infrastructure in urban canyons, where vegetation can improve air quality through deposition but also worsen it by reducing the dispersion of pollutants. Our study integrates the SUMO microscopic traffic model to calculate detailed vehicle-by-vehicle emission profiles. This offers a level of realism at the emission source that is superior to the static or averaged emission methods commonly used in models such as ENVI-met.
Pollutant dispersion in urban environments is inherently a multiscale phenomenon, influenced by processes ranging from regional atmospheric transport to street-level dynamics within the urban canopy. To adequately capture this complexity, we propose a hybrid modeling strategy that leverages the advantages of three-dimensional Eulerian models—effective at simulating background concentrations of major pollutants—and high-resolution urban models, capable of resolving flow and concentration patterns within the complex geometries of built-up areas. Modeling pollutant dispersion in cities requires accounting for the interactions that occur within and around the urban canopy, where turbulence and spatial heterogeneity predominate. This poses a considerable computational challenge, as the governing flow equations are nonlinear, turbulent, and inherently unstable in these environments. CFD models are particularly well-suited to this task, offering a robust framework for simulating the dispersion of air pollutants while explicitly incorporating the detailed morphological characteristics of urban environments.
Operating at the microscale, CFD models solve turbulent flow equations at meter resolution, allowing for a realistic representation of atmospheric processes within the urban canopy. These advanced modeling tools can be valuable resources for urban planners and policymakers, facilitating the identification and evaluation of air quality mitigation strategies prior to their implementation. Previous research has highlighted the benefits of coupling microscale dispersion models with mesoscale weather forecasting systems, observing significant improvements in simulation accuracy when CFD models are initialized and constrained with wind fields derived from downscaled mesoscale outputs [13].
Recent advances in fluid dynamics, along with the increasing availability of high-performance computing resources, have opened new avenues for research in urban air quality modeling. LES models that resolve the dominant turbulence scales have already been applied in some urban contexts to investigate pollutant dispersion, and previous studies have successfully used CFD to simulate intra-urban NO2 variability at horizontal resolutions of a few meters. While many of these earlier works relied on simplified meteorological scenarios or idealized representations of urban cover, such as uniform urban canyons or abstract building designs, our study takes a more realistic approach by incorporating realistic 3D representations of buildings, including their varying heights, and vegetation elements such as trees. Furthermore, this work distinguishes itself by integrating mesoscale and microscale air quality models with traffic simulation tools, enabling the calculation of detailed emission profiles.
The combination of regionally consistent meteorological boundary conditions, detailed urban morphology, and physical and chemical transport mechanisms allows us to simulate pollutant concentrations at different spatial scales with greater accuracy. This multiscale, multi-component framework offers a novel and comprehensive approach to urban air quality modeling, paving the way for more effective air pollution assessment and management strategies in complex urban environments. Numerous modeling techniques, particularly those based on CFD, have been employed to investigate the influence of urban structures on the dispersion of air pollutants [14]. Buildings exert a significant aerodynamic influence on local airflow patterns, which in turn affect pollutant concentrations. For example, tall buildings can intensify the accumulation of pollutants in urban canyons by impeding horizontal air movement, simultaneously creating new circulation patterns that promote dispersion into adjacent areas. While much of the existing literature has relied on simplified urban geometries, often employing two-dimensional representations of idealized urban canyons or abstract urban forms [15], the present study adopts a more comprehensive and realistic modeling approach.
Li et al. (2022) [16] used CFD simulations to jointly assess the impact of building configurations (open spaces and high-rise buildings) and tree planting on residents’ exposure to traffic pollutants. Their results indicate that while the presence of high-rise buildings can increase wind speed at pedestrian level and reduce CO concentration, dense vegetation acts as a barrier that reduces ventilation, potentially increasing the fraction of pollutant inhalation by between 14.89% and 50.19% in certain scenarios. This study highlights the need to consider both built morphology and vegetation location for healthy urban design. The study by Li et al. uses an idealized building matrix of cubic blocks under neutral atmospheric conditions. Our work, on the other hand, applies the model to real and complex scenarios in the city of Madrid, capturing the actual morphological heterogeneity. The paper by Li et al. considers CO as an inert tracer (without chemical reactions). Our study simulates reactive species such as NO2 and O3, including the atmospheric chemical processes that occur within the urban canyon.
We simulate a complex, real-world urban area by incorporating detailed three-dimensional data on buildings, vegetation, and road networks. This allows us to capture the complex interactions between built infrastructure, local meteorology, and pollutant transport mechanisms with greater fidelity than previous models. What distinguishes this work is its integrated framework, which unifies mesoscale and microscale air quality models with traffic emissions simulations. By combining regionally relevant meteorological data with fine-scale turbulence models and detailed emissions profiles, we simulate pollutant dispersion with a high degree of spatial and temporal fidelity. This holistic approach represents a significant advancement in multiscale urban air quality modeling, offering a better understanding of the interaction between infrastructure, emissions, and atmospheric dynamics in diverse urban contexts.
2. Materials and Methods
Our proposed air quality modeling system is structured around the integration of a mesoscale and a microscale (CFD) modeling component, both driven by a set of supporting tools described in subsequent sections.
2.1. Mesoscale Component: WRF/Chem
For the mesoscale component, we employ the Weather Research and Forecasting coupled with Chemistry (WRF/Chem) model [17], a well-established modeling framework that simultaneously simulates meteorological processes and atmospheric chemistry. One of WRF/Chem’s key strengths lies in its fully coupled structure, which allows for simultaneous solution of meteorological and chemical problems. This ensures that both domains share the same physical mesh and use consistent schemes for advection, convection, and diffusion, eliminating the need for interpolation between the chemical and meteorological components. As a result, the model offers more realistic simulations of atmospheric processes with greater internal consistency. Its robustness and accuracy have been widely validated in the literature, including large-scale experiments such as Phase 2 of the Air Quality Model Evaluation Initiative (AQMEII) [18,19]. For gas-phase chemistry, we use the Carbon Bonding Mechanism Version Z (CBM-Z), which provides a detailed representation of atmospheric reactions between volatile organic compounds [20]. Aerosol processes are managed using the Model for the Simulation of Aerosol Interactions and Chemistry (MOSAIC) [21], which accounts for key physicochemical transformations of particulate matter. Dry aerosol deposition is modeled following the approach of Binkowski and Shankar [22], while wet deposition is based on the methodology proposed by Easter [23]. Photolysis rates, crucial for simulating photochemical reactions, are derived from the Fast-J photolysis scheme [24]. In addition, aerosol radiation feedback is included in the simulations, using the Fast Radiative Transfer Model (RRTM) to represent shortwave and longwave radiative processes [25]. To capture cloud microphysics and convective processes, the Lin scheme for microphysics [26] and the Grell 3D ensemble scheme for cumulus parameterization [27] are applied. This comprehensive configuration allows the mesoscale model to accurately represent a wide range of meteorological and chemical interactions relevant to air quality at urban and regional scales. WRF/Chem simulations were initialized and driven at the boundaries using meteorological data from the National Centers for Environmental Prediction’s Global Forecast System (NCEP-GFS), which provides global forecast fields with a spatial resolution of 0.5 degrees [28]. These datasets are widely used in regional atmospheric modeling and are freely accessible to the scientific community, representing a standard input for initializing regional atmospheric simulations. For the outermost domain chemical boundary conditions, predefined atmospheric profiles were employed. These profiles represent typical conditions for the northern mid-latitudes in a relatively clean background atmosphere. The chemical composition of these profiles is derived from climatological data informed by simulations using the NOAA Aeronomy Laboratory Regional Oxidation Model (NALROM), which has been designed to characterize the long-term average oxidation chemistry in the free troposphere [9]. This setting ensures that the chemical initialization reflects plausible large-scale background conditions for trace gases and aerosols entering the model domain.
2.2. CFD Model: PALM4U
The CFD LESs presented in this paper were performed using the Parallelized Large Eddy Simulation Model (PALM), adapted for urban environments as PALM4U [29]. By default, PALM solves incompressible approximations of the Navier–Stokes equations using either the Boussinesq approximation or an anelastic formulation. The Boussinesq formulation assumes constant density, while the anelastic approach allows for density variations with height, making it possible to simulate atmospheric phenomena spanning the entire troposphere, such as deep convection. Both formulations are described by a unified set of equations that differ only in their treatment of the density term [30]. PALM operates in LES mode with a 1.5-order turbulence closure scheme. The evolution of airflow and momentum transport is described by the Navier–Stokes equations or conservation of momentum, for a three-dimensional Cartesian coordinate system:
where u represents fluid velocity vector (u, v, and w), t is the time, is the density, p is the pressure, v is the viscosity and f represents the Coriolis force. Incompressibility is ensured by the zero divergence of the velocity components u:
For the transport of chemical species concentration C (dispersion of pollutants), the advection–diffusion equation is used:
where D is the diffusion coefficient of the pollutant and S represents pollutant sources (emissions) or sinks (deposition), including chemical reactions.
Buildings are explicitly represented as solid obstacles that interact with the airflow through form drag and skin friction. Natural and paved surfaces are modeled using a multi-layer soil model to simulate energy and moisture exchanges. The model also includes a detailed representation of vegetation using a canopy model, which considers the three-dimensional structure of trees by incorporating leaf area density (LAD) and basal area density (BAD). As Dupont and Brunet [31] show, vegetation has a significant and complex impact on momentum, energy, and mass exchange processes near the surface, especially in the lower part of the atmospheric boundary layer (ABL). These processes cannot be adequately captured using simplified surface parameters such as roughness length or volumetric heat fluxes.
The canopy model in PALM is integrated into a detailed radiative transfer scheme that includes the effects of shading. Incoming shortwave (direct, diffuse, and reflected) and longwave radiation is partially absorbed by the canopy grid cells and converted into sensible heat, warming the air within the vegetation layer. Vegetation also emits longwave radiation depending on its local temperature and contributes to the urban energy balance through latent heat fluxes associated with evapotranspiration. PALM also integrates a fully online coupled chemistry module. Chemical species are represented as Eulerian concentration fields that can react and form new compounds during the simulation. In this study, the Carbon Bonding Mechanism (CBM4) [32] was used, which includes 32 species and 81 reactions. Dry deposition processes were modeled using the DEPAC module, which considers vegetation type and meteorological conditions. This comprehensive setup enables PALM4U to simulate pollutant dispersion in complex urban environments with high physical, chemical, and spatial realism.
An offline nesting strategy has been implemented to connect the mesoscale and microscale modeling systems. Specifically, WRF/Chem data are used to define the initial state, as well as the lateral and top boundary conditions of the CFD model, with updates applied hourly. Temporal interpolation of the boundary data ensures smooth transitions between updates. In the x direction, non-cyclic Dirichlet/radiation boundary conditions are imposed, while in the y direction, cyclic conditions are applied. For chemical species, Neumann boundary conditions are specified. The set of variables transferred from WRF/Chem to PALM4U includes the three components of wind speed (u, v, w), potential temperature, specific humidity, soil temperature and moisture content, and NO2, NO, and O3 concentrations. To ensure numerical stability and realistic microscale turbulent structures, synthetic turbulence is introduced at the start of the CFD simulation. PALM4U includes an internal turbulence generator that superimposes velocity fluctuations on the model inlet boundaries. These fluctuations are applied to the WRF/Chem-derived wind components, with their amplitude modulated according to atmospheric stability conditions, thereby maintaining consistency with the prevailing stratification and facilitating the correct development of turbulence within the domain.
2.3. Traffic and Emission Model
A crucial input for modeling pollutant dispersion in urban environments is the accurate representation of emissions, particularly those from road traffic, which remains the primary source of air pollution in most cities. To realistically capture traffic-related emissions, a high-resolution spatial and temporal description of vehicular movement through the urban street network is essential. In this study, we address this requirement by incorporating a microscopic traffic simulation approach using the open-source Simulation of Urban Mobility (SUMO) tool [33]. SUMO provides a discrete-time (1 s resolution) and spatially continuous simulation environment in which each vehicle is explicitly tracked. Each vehicle is characterized by attributes such as a unique identifier, departure time, and predefined route, and its speed is governed by the distance to the preceding vehicle, following a vehicle-following logic. To build the road network for the simulation, we imported detailed geospatial data for the city of Madrid from OpenStreetMap (OSM), including structural attributes such as the number of lanes, street directions, the presence of roundabouts, and the location of traffic lights. While these data are sufficient to initialize the model, it lacks the fidelity required for realistic simulations, requiring additional refinement and calibration. Madrid’s urban network encompasses over 100,000 road segments, and to ensure plausible traffic dynamics, an iterative tuning process was applied. Initial simulations with randomly generated traffic demand identified unrealistic flow interruptions, especially at intersections that created artificial bottlenecks. These problematic areas were systematically corrected by modifying segment parameters until stable traffic flow was achieved.
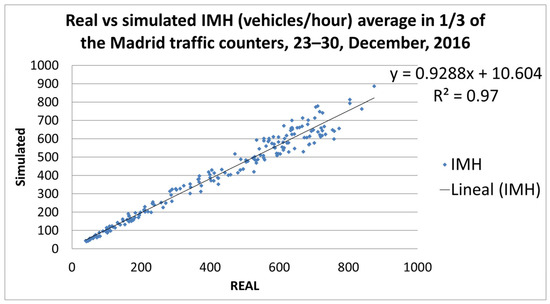
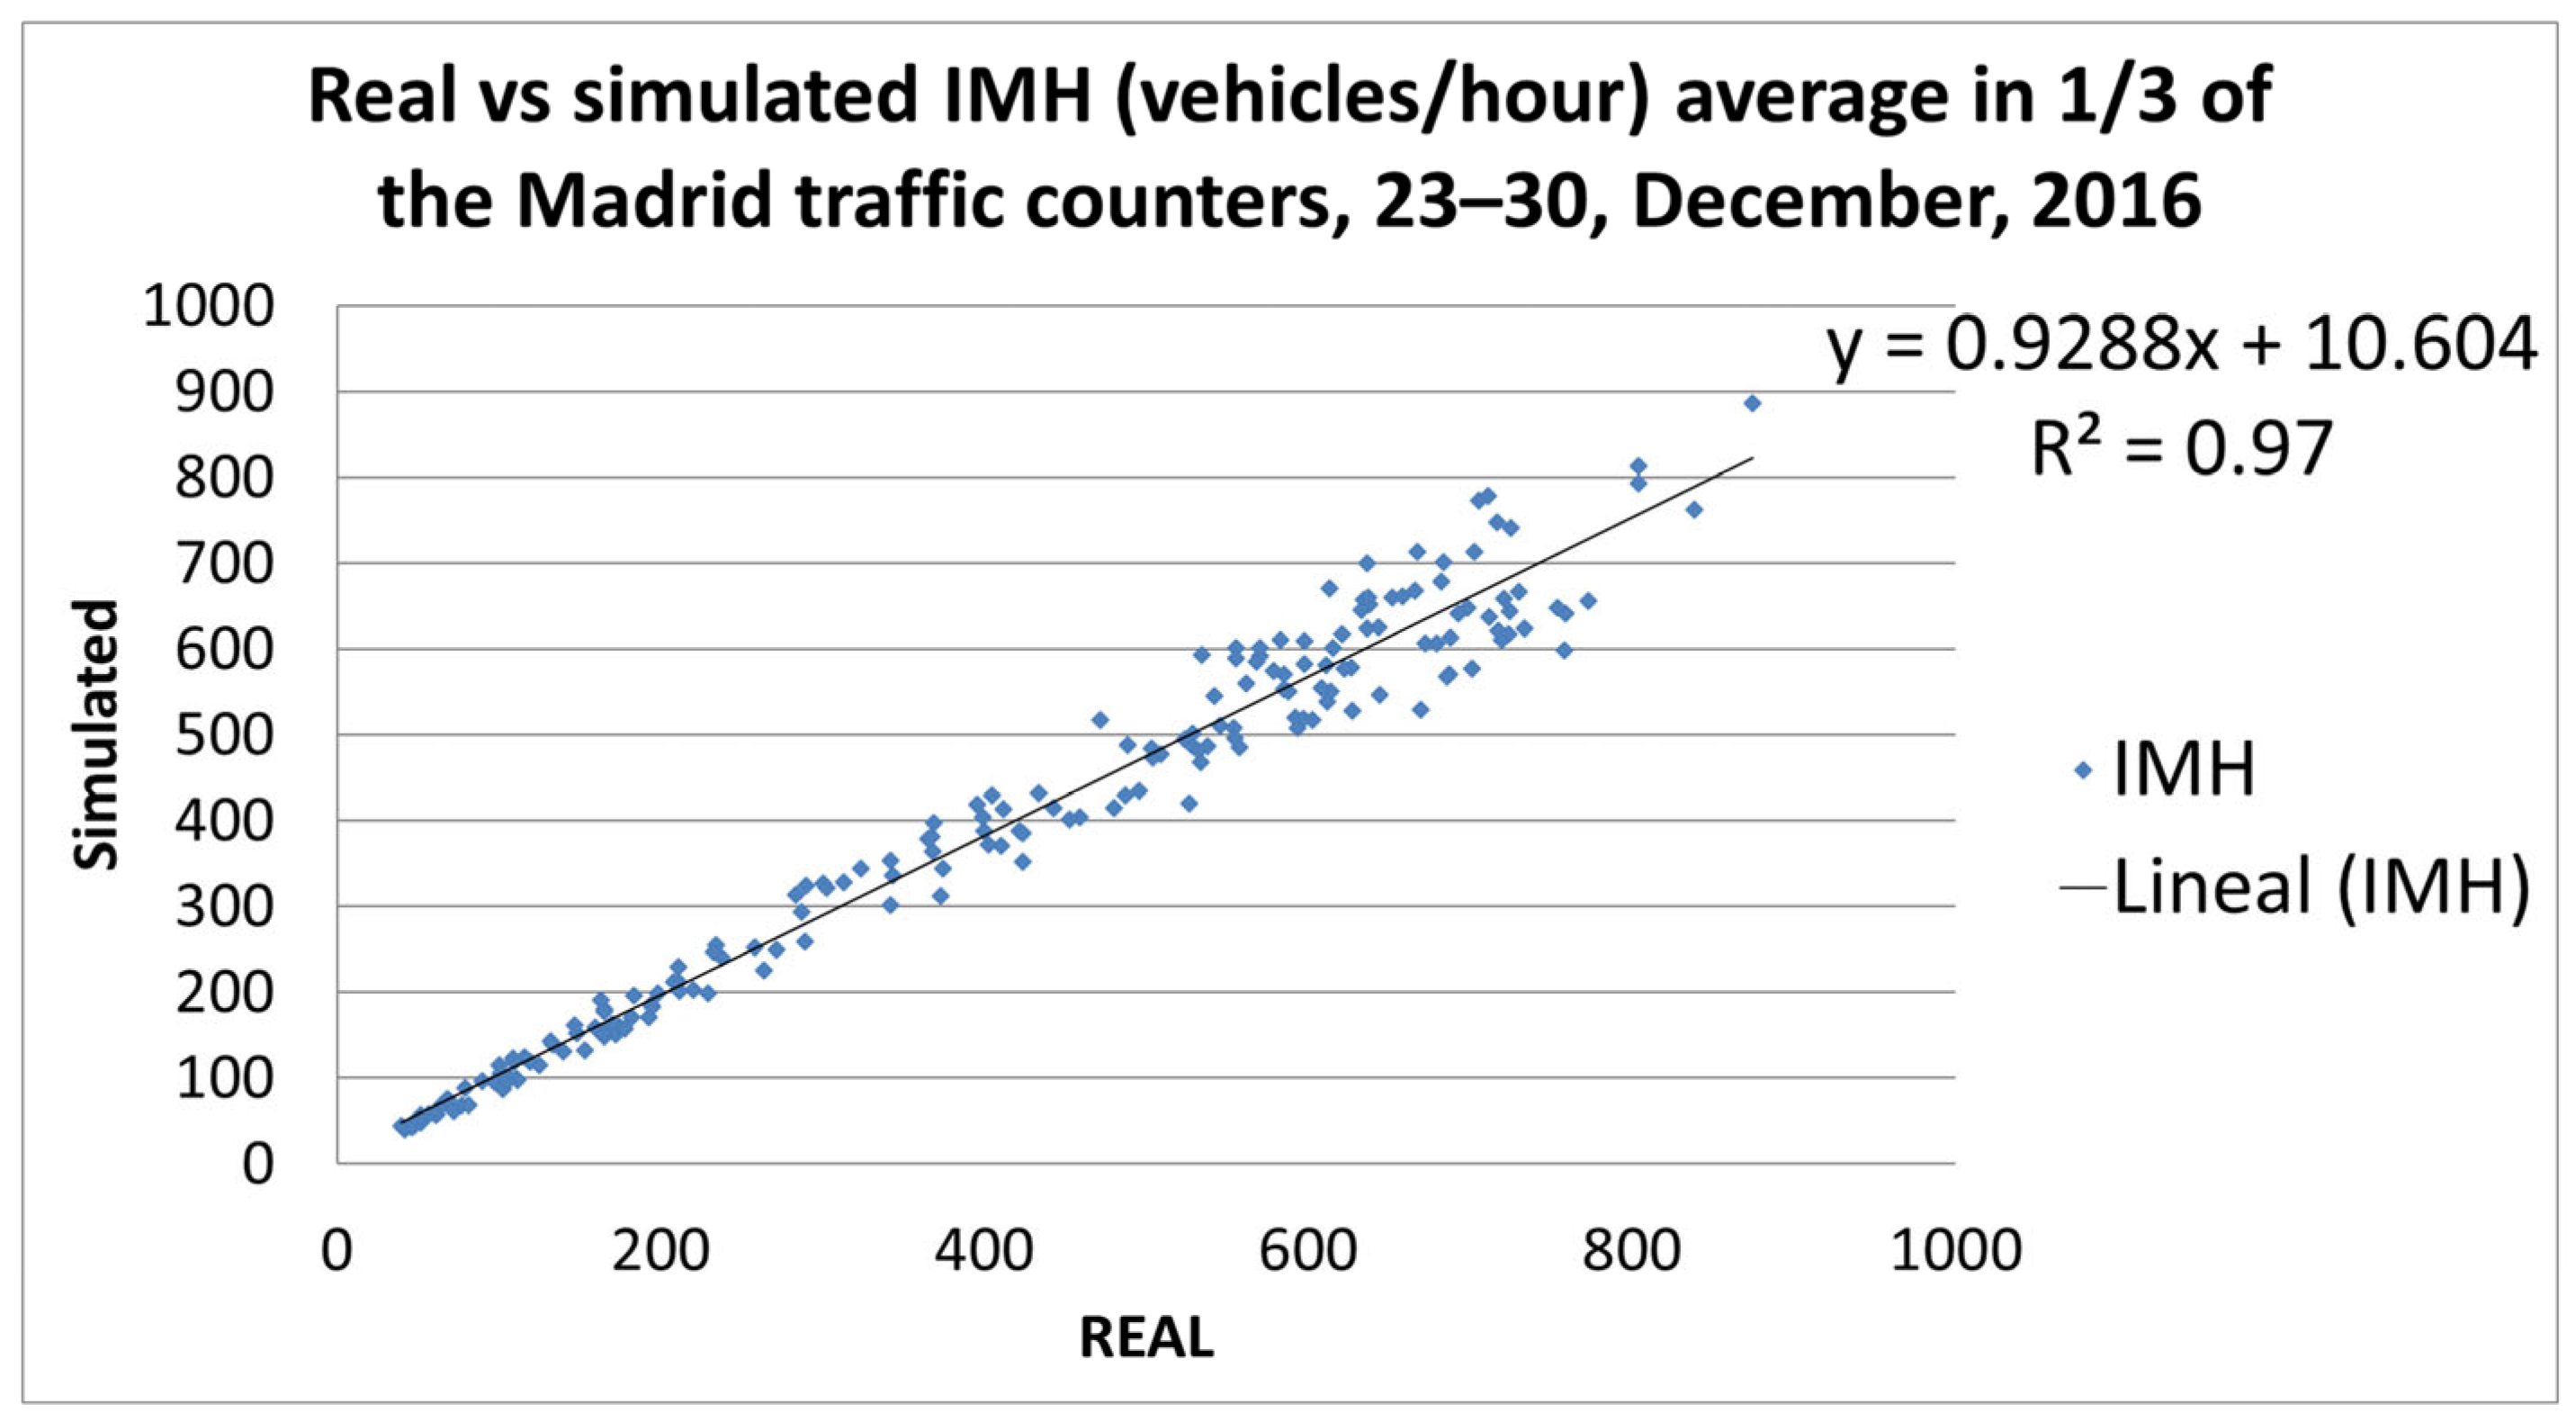
Traffic demand calibration was performed using empirical data from a dense network of over 3000 traffic sensors distributed throughout Madrid. Two-thirds of these detectors were used for model calibration, while the remainder facilitated validation. Calibration followed an iterative approach: simulation results were compared to observed flows, and traffic demand or infrastructure parameters were adjusted accordingly. Areas of persistent congestion were identified through visual inspection and vehicle counts per segment, driving local improvements until the congestion conditions were eliminated. The SUMO traffic model was calibrated using a stochastic ensemble approach. For each simulated day, 130 traffic simulations were run using different route configurations. The performance of the model was evaluated by comparing simulated and observed traffic flows, and the best-performing simulation for each day was selected based on the correlation coefficient (R2) between simulated and measured hourly traffic volumes. The quality of the calibration was evaluated by analyzing the correlation between simulated and observed Hourly Mean Intensity (IMH, by its Spanish acronym), as illustrated in Figure 1, which shows an example of the relationship between modeled and measured traffic flows. While the aggregate mean hourly flow across the validation network reached an R2 of 0.97, the median across individual sensors was 0.80.
Figure 1.
Linear regression of the hourly mean intensity (IMH) of average of 1/3 measurements versus simulation results.
Once calibrated, the model provided detailed information on traffic metrics for each road segment, including vehicle counts, average speed, and average travel distances. These results served as the basis for calculating NOx emissions using a Tier 3 approach, as described in the EMEP/EEA Air Pollution Emissions Inventory Guide (EMEP/EEA, 2016). This method employs speed-dependent emission factors that vary by vehicle type, considering the distinctions between passenger cars, light commercial vehicles, heavy trucks, buses, and motorcycles. Additional disaggregation is applied based on fuel type, engine displacement, vehicle age, and emission control technologies. The vehicle fleet composition was obtained from official Madrid registration records as of December 2016, allowing for a realistic representation of the local vehicle emissions profile.
2.4. Experiments
The simulation framework adopted in this study follows a multiscale nested domain configuration, in which information flows from coarser to finer resolutions through the coupling of boundary conditions. This nesting approach allows for the capture of large-scale atmospheric phenomena while progressively refining spatial detail to resolve urban-scale dynamics. The configuration consists of four computational domains (see Table 1): the first three domains are simulated using the mesoscale model WRF/Chem, and the innermost domain (D4) is solved using the microscale CFD model PALM4U.
Table 1.
Computational domain configuration.
The WRF/Chem mesoscale domains (D1–D3) are centered at 40.478° N, 3.704° W, corresponding to the center of Madrid. Each domain consists of a grid of 45 cells in the longitudinal (x) direction and 50 cells in the latitudinal (y) direction. Vertically, the model atmosphere is resolved using 33 non-uniform layers extending upward to a pressure level of approximately 50 hPa. To improve the accuracy of near-surface processes—crucial for urban climate and air quality assessments—the vertical grid spacing is finer near the surface and increases progressively with altitude. This nested configuration allows the system to dynamically transfer meteorological and chemical information from the synoptic scale to the street scale, thus bridging the gap between regional atmospheric dynamics and localized urban phenomena. The modeling system is applied across all domains with spatial resolutions ranging from 25 km to 5 m, capturing processes ranging from regional transport to street-level conditions. While large differences in resolution could introduce inconsistencies, the results are treated independently within each domain and the appropriate parameterizations are applied at each scale. The coarser domains provide boundary conditions for the finer domains, and comparisons between the 25 km and 5 m simulations indicate that the model reproduces key physical patterns consistently across all scales, supporting the physical consistency of the results. The final domain (D4) benefits from a spatial resolution of 10 m for Experiment 1 and 5 m for Experiment 2, allowing for the detailed representation of complex urban geometries and high-resolution pollutant dispersion modeling.
The study period, between 12 and 18 June 2017, was selected based on the availability of high-resolution data on traffic and air quality, as well as practical calculation limitations. The choice of 2017 as the study period is strategically justified by several factors. The urban morphology of the selected areas in Madrid has seen no significant structural modifications between 2017 and now, ensuring that the simulations reflect current aerodynamic behaviors. The 2017 traffic dataset represents a mature stage of the Euro 6 emission regulations, providing a realistic proxy for contemporary urban pollution levels.
Although this period represents only a brief episode, it was characterized by high ozone concentrations in Madrid, making it a relevant test case for evaluating the model’s performance under high-pollution conditions. While the results are most directly applicable to similar episodes of high ozone levels, the methodological framework and insights into model performance are generalizable and can serve as a basis for studies of other periods. Geospatial data on buildings, roads, and vegetation were obtained from the Madrid City Council’s open data portal.
Although the multiscale coupling presented in this paper represents the latest in urban air quality modeling, it is important to recognize certain inherent limitations and uncertainties. The transition from mesoscale to microscale can introduce inconsistencies, as described above. With regard to emissions, although the SUMO microscopic model provides high-resolution traffic dynamics, uncertainties remain in emission factors (e.g., vehicle age, cold starts). These limitations are common in complex atmospheric modeling; therefore, the results should be interpreted as robust estimates of the relative impacts (ON–OFF) of the scenarios and not as absolute predictions.
Although this study demonstrates the system’s performance under current weather conditions, the integrated WRF/Chem-PALM4U-SUMO framework is designed to easily adapt to future climate scenarios. Future research will focus on applying climate projections (IPCC scenarios) to the model to explore the impact of future climate at the local scale. The system’s ability to simulate both the aerodynamic effects of skyscrapers and the cooling potential of nature-based solutions makes it an essential tool for assessing urban resilience and developing adaptation strategies to address climate-induced atmospheric challenges.
2.4.1. Experiment 1: P. Castilla
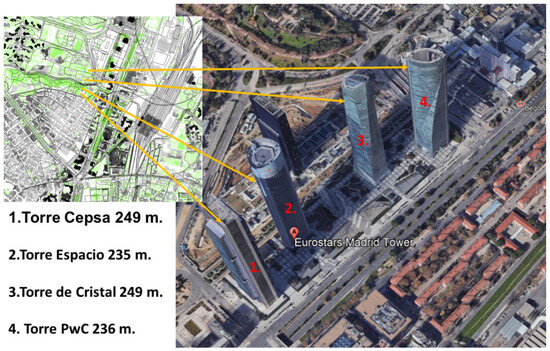
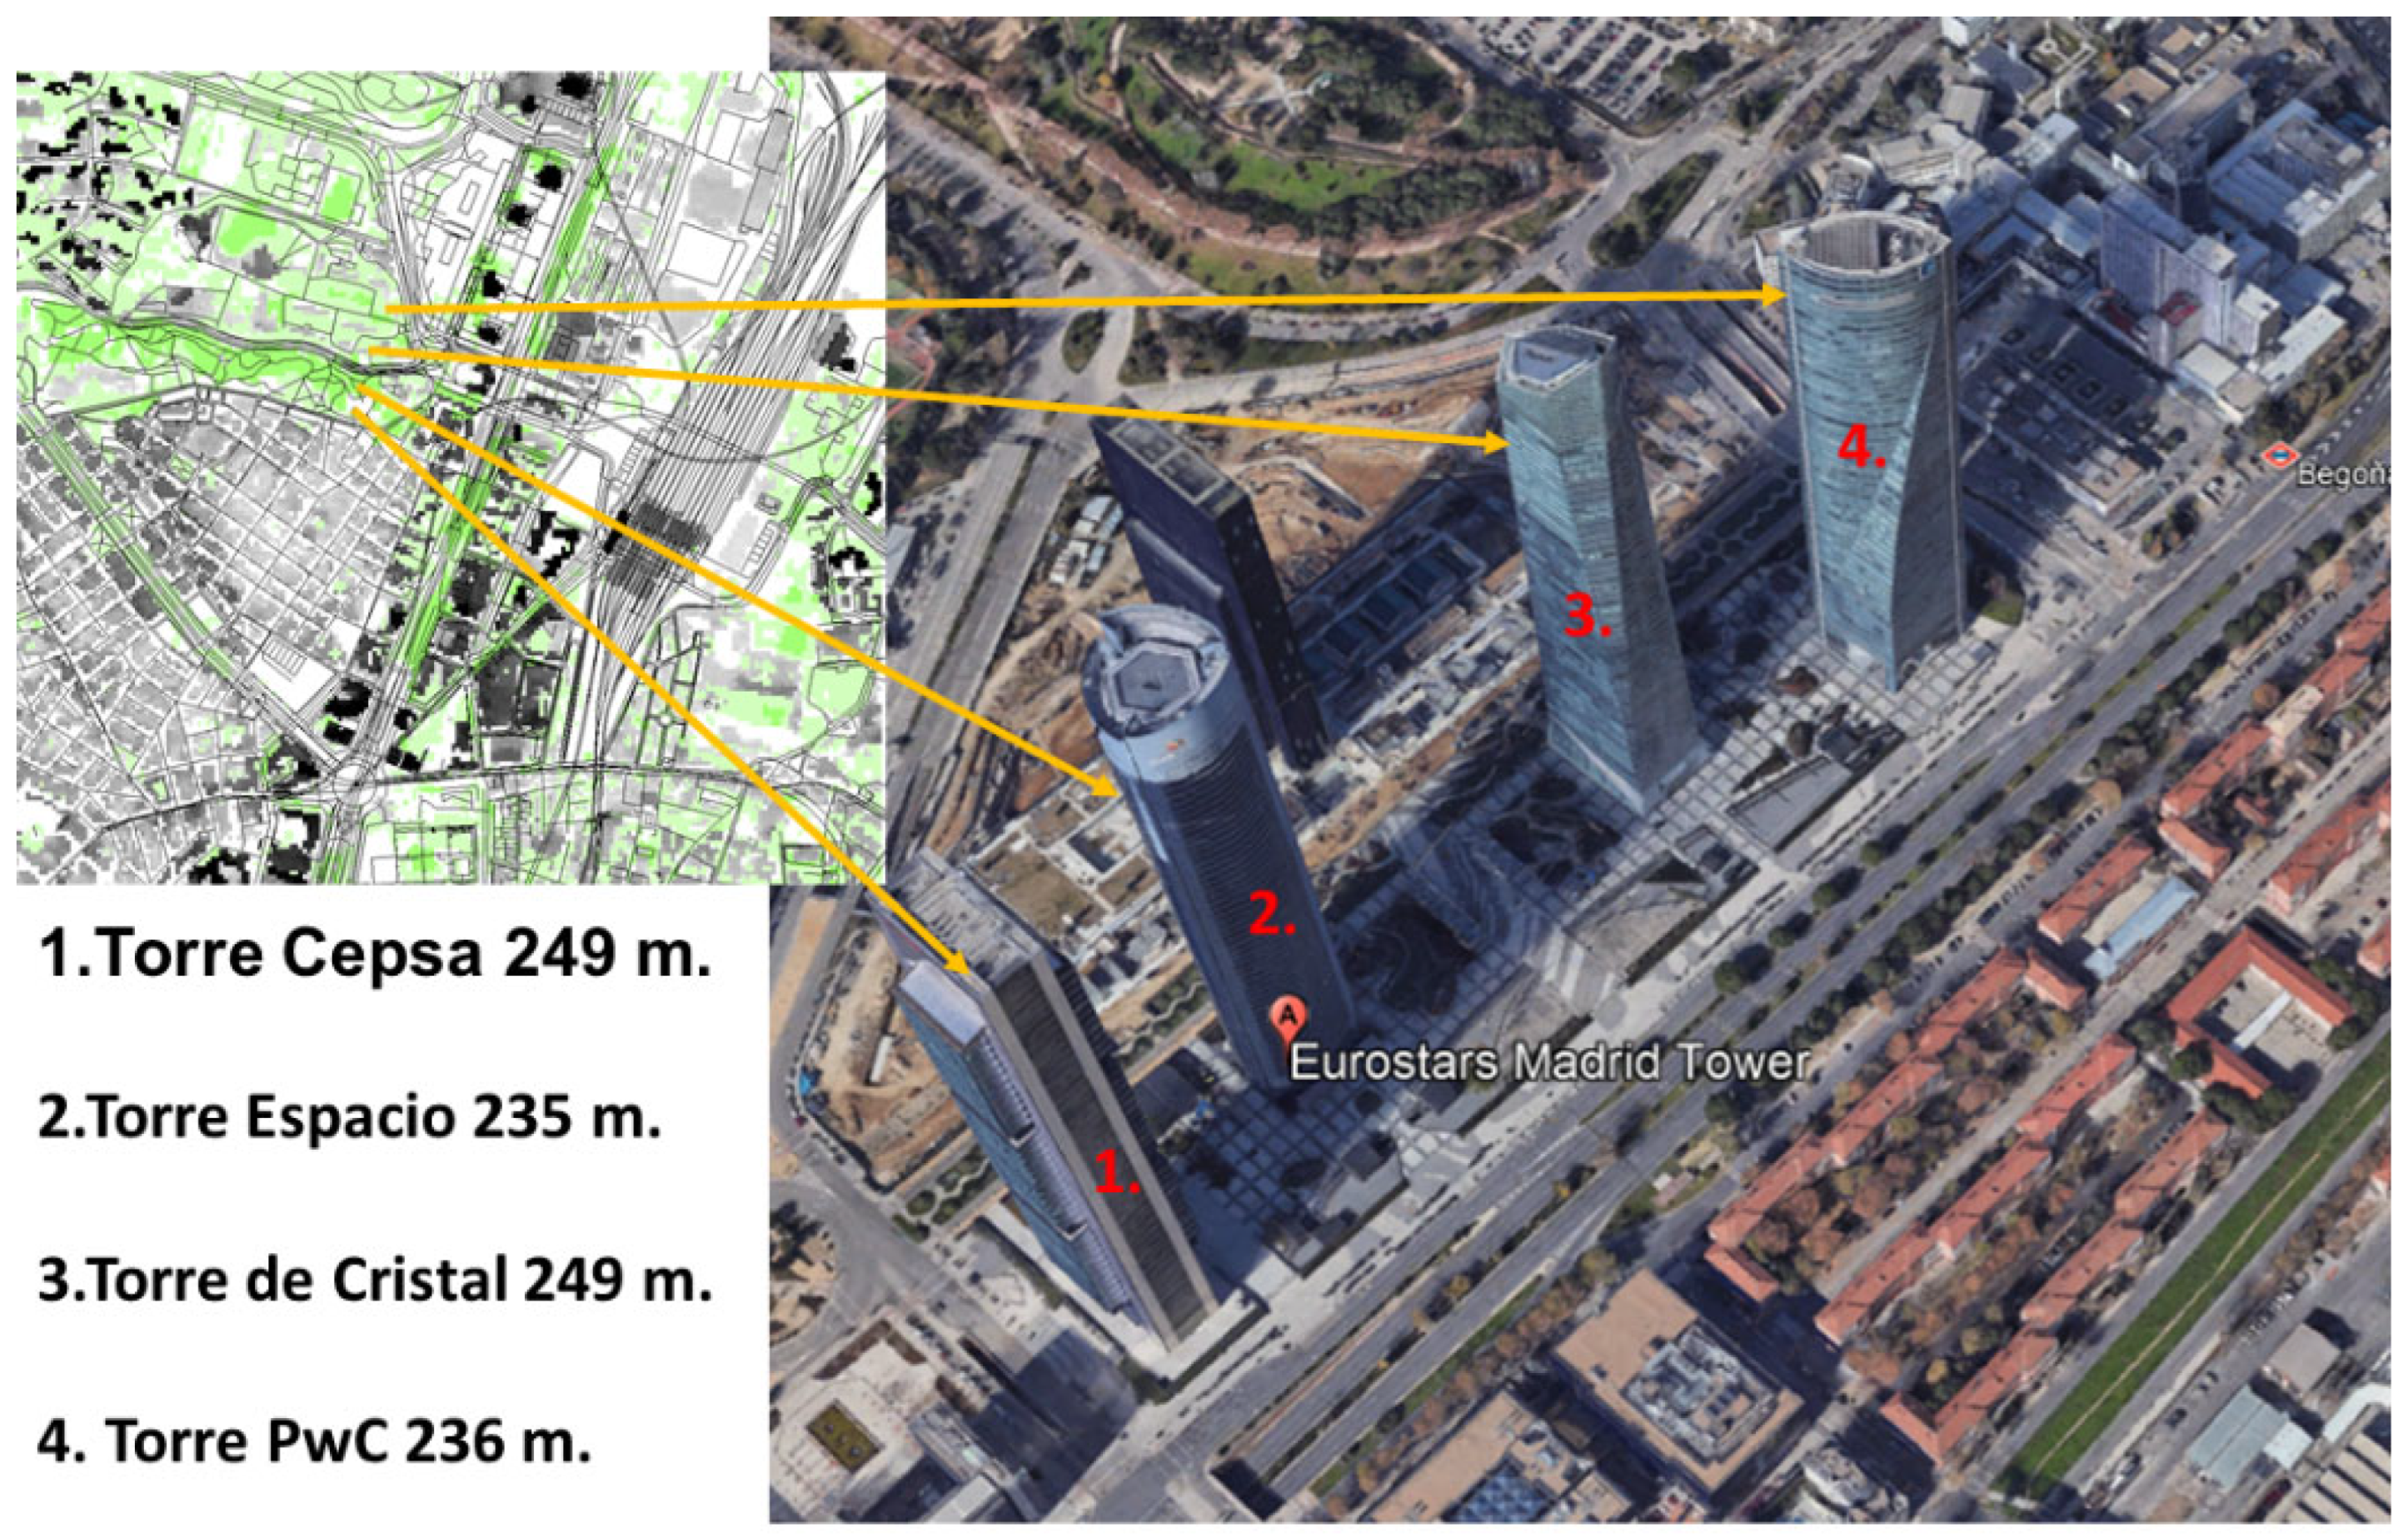
The objective of this first experiment is to evaluate the role of tall buildings in shaping local wind patterns and their influence on the dispersion of air pollutants in an urban environment. The analysis focuses on the “Plaza Castilla” area, a highly urbanized area in central Madrid, modeled using the computational fluid dynamics (CFD) model PALM4U with a spatial resolution of 10 m in a 2 km × 2 km domain. To isolate the impact of tall buildings, two contrasting simulation scenarios were designed. The first scenario, called BAU (Business As Usual), includes the existing built environment, including the four tallest towers in Madrid. The second scenario, called NOTOWERS, is identical in all respects except for the exclusion of these four tall buildings (see Figure 2). By calculating the difference between these two simulations (BAU − NOTOWERS), the objective is to assess the specific contribution of these vertical elements to the distribution of wind flow and air pollutants in the area.
Figure 2.
The four high-rise towers analyzed for their impact on local atmospheric conditions.
The experiment incorporates a comprehensive set of urban and atmospheric characteristics, including micrometeorological conditions, solar radiation and surface energy balance, traffic-derived emissions, chemical transformations, deposition processes, and the interaction of airflow with 3D obstacles such as buildings and vegetation.
2.4.2. Experiment 2: Retiro
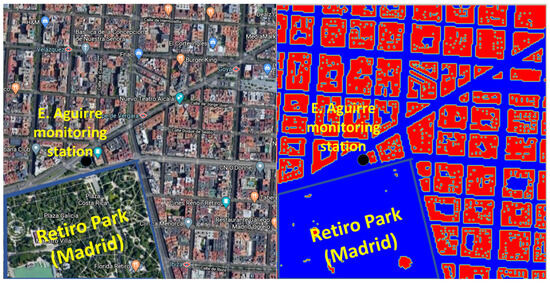
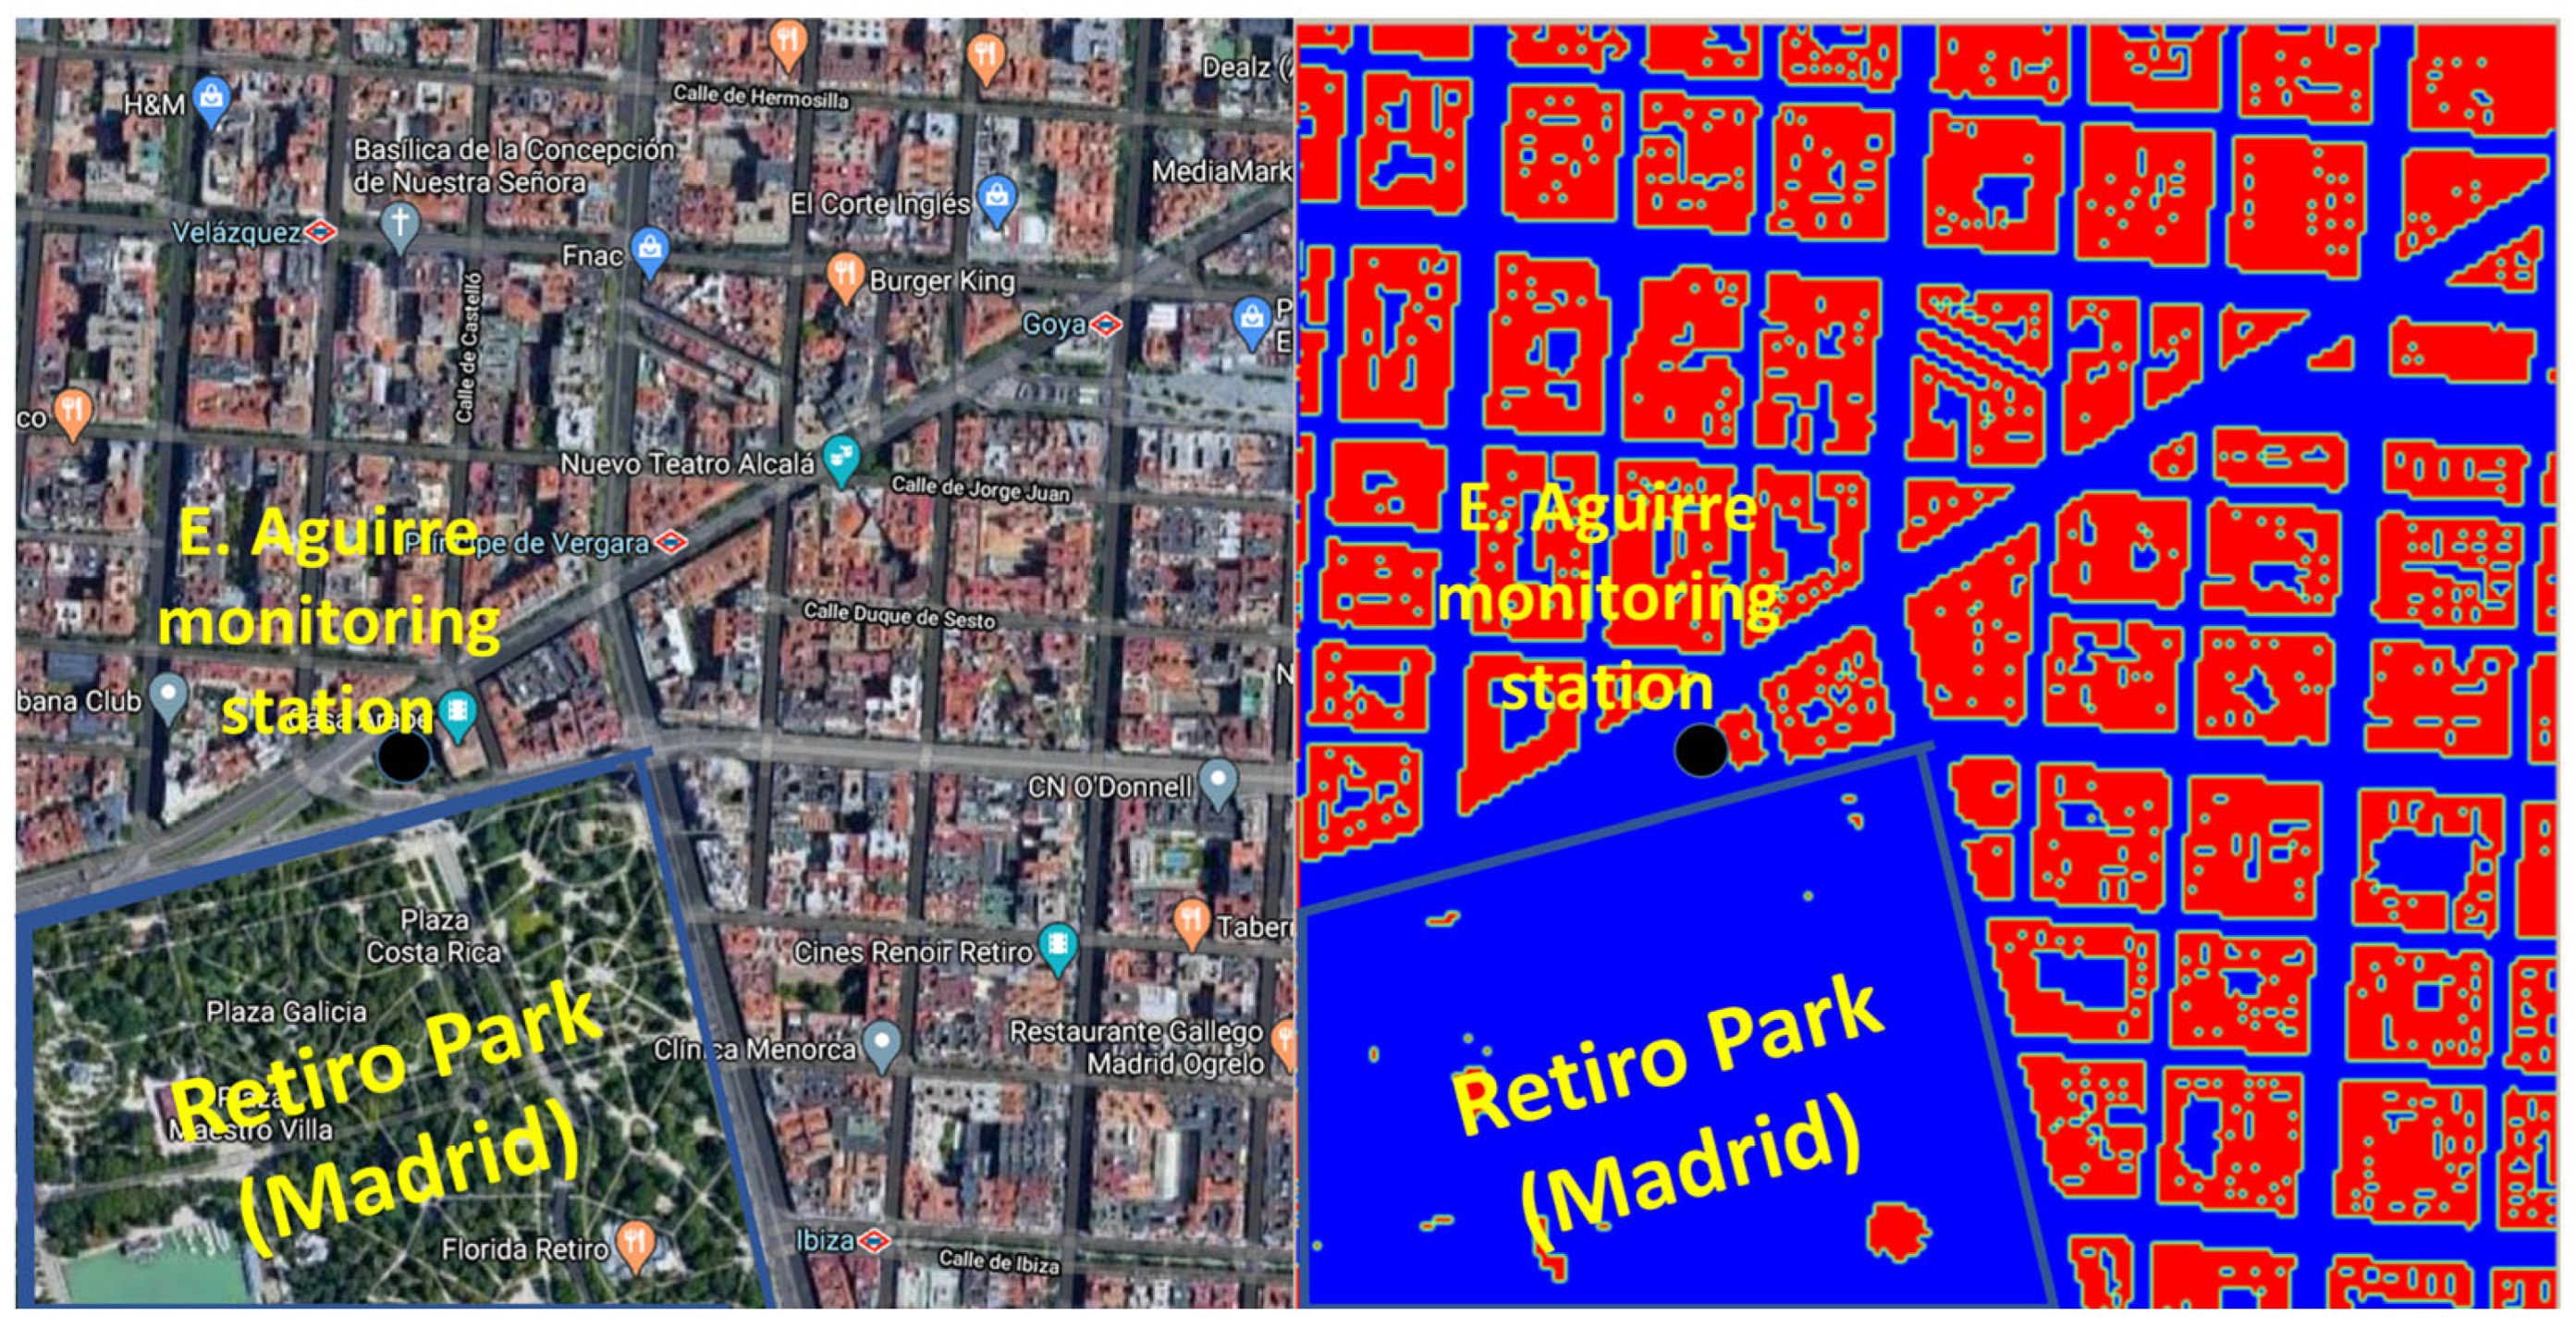
This second experiment focuses on the influence of vegetation type in urban green spaces on local meteorological conditions and air quality. The study area, called Retiro, includes Retiro Park, one of the largest green areas in central Madrid. The simulation domain spans 1 km × 1 km and includes dense street canyons, high-traffic roads, and a heterogeneous distribution of buildings and trees. (see Figure 3). Two CFD simulations were run using the PALM4U model to assess the impact of tree type on pollutant dispersion and micrometeorology. The reference simulation (BAU—Business As Usual) considers the current state of vegetation, with trees represented as “deciduous broadleaf trees” (category 7 in PALM4U). In the alternative scenario (ND—Needle-leaf), the tree type is replaced with “needleleaf trees,” while all other conditions remain unchanged. The difference between the two simulations (BAU−ND) allows quantification of the effects of tree morphology on airflow, pollutant deposition, and dispersion dynamics. In the modeled domain, buildings cover 43.9% of the surface, trees 9.9%, and water bodies 1.4%. According to the official inventory, Retiro Park contains 1194 trees, most of which are “Aesculus hippocastanum” (European horse chestnut), a broad-leaf species.
Figure 3.
Real domain of the Retiro experiment (left) and computational domain with building block (right) in red colour and open air spaces in blue color. Black point is the location of the E. Aguirre air quality monitoring stations.
The park is located in the southwestern section of the model domain and is surrounded by busy roads. This configuration typically generates high levels of nitrogen dioxide (NO2) under stable meteorological conditions. To assess the sensitivity of the CFD model in representing air quality mitigation strategies, this experiment applies a theoretical test: it evaluates how the replacement of broad-leaved trees with needle-leaved trees affects NO2 concentrations and atmospheric conditions. This change modifies not only pollutant deposition rates but also thermal and turbulent fluxes within the urban canopy layer.
3. Results and Discussion
3.1. Performance Evaluation
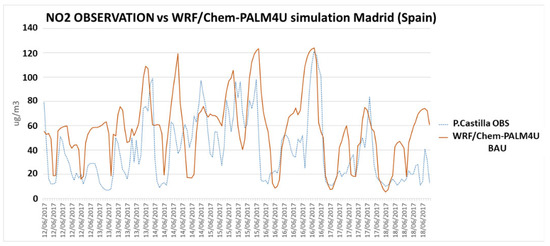
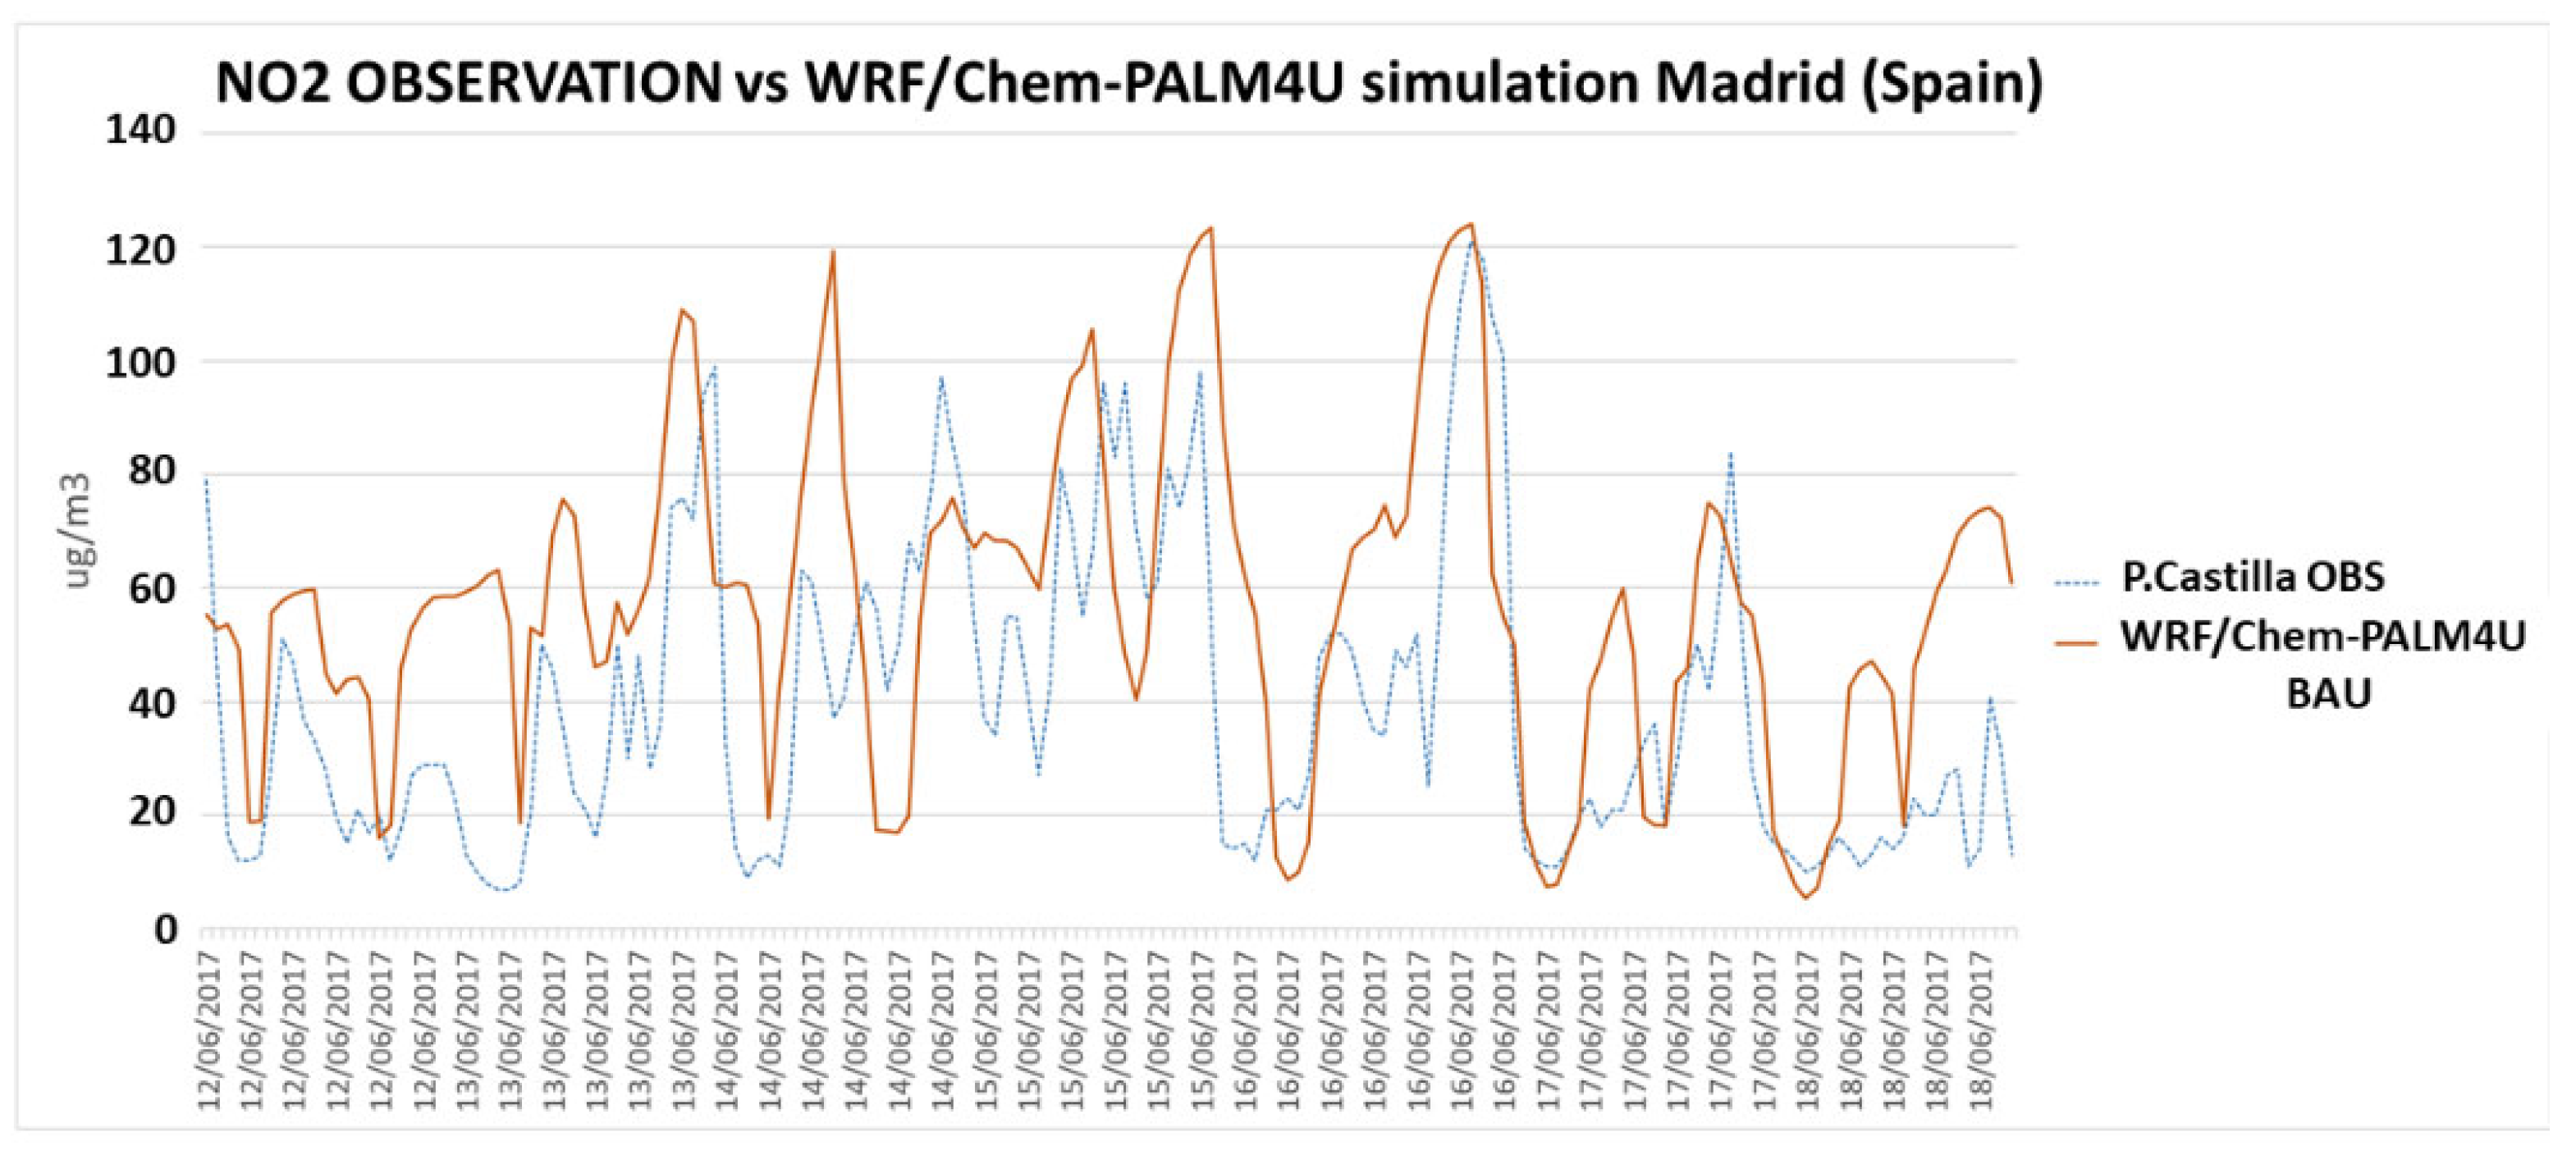
The results of the BAU simulations were compared with observational data to assess the model’s ability to reproduce the temporal dynamics of NO2 and O3 concentrations. Hourly measurements from the P. Castilla monitoring station were used in Experiment 1, and from the E. Aguirre station in Experiment 2. Both stations are classified as urban traffic stations within the Madrid City Council’s official air quality monitoring network. They are located in densely populated areas with a significant influence from vehicle emissions and are the only stations included in the simulation domains. The comparison was performed using time series analysis and supported by statistical metrics such as the Normalized Mean Bias (NMB), the Root Mean Square Error (RMSE), and Pearson’s correlation coefficient (R2). In Experiment 1, the comparison of simulated and observed NO2 concentrations at the P. Castilla station (Figure 4) yielded an R2 of 0.6 and an NMB of 45%. The RMSE was below 30 µg m−3. A detailed analysis of the time-series reveals that this bias is primarily driven by the model’s performance during low-pollution periods. While the system effectively captures the timing and magnitude of peak events, it maintains a higher ‘baseline’ or ‘floor’ concentration compared to the near-zero values occasionally recorded by the sensors. This is likely due to the background levels provided by the mesoscale WRF/Chem boundary conditions and the numerical difficulty of simulating the complete dispersion of pollutants under very stable, low-wind conditions. However, the system’s ability to reproduce the temporal dynamics and the relative impact of urban morphology remains robust. These results suggest that the BAU simulation reasonably reproduces the observed temporal patterns of NO2, considering the complexity of pollutant dispersion at high spatial resolution (10 m × 10 m or 5 m × 5 m) in a dense urban environment.
Figure 4.
Time series of NO2 measured concentrations and modeled with WRF/Chem-PALM4U 10 m spatial resolution for Experiment 1 (P. Castilla).
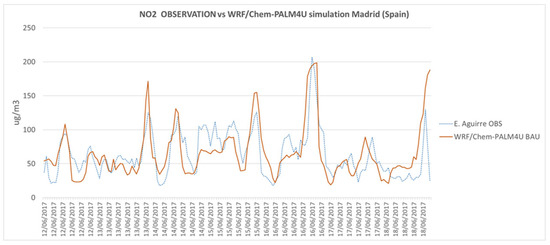
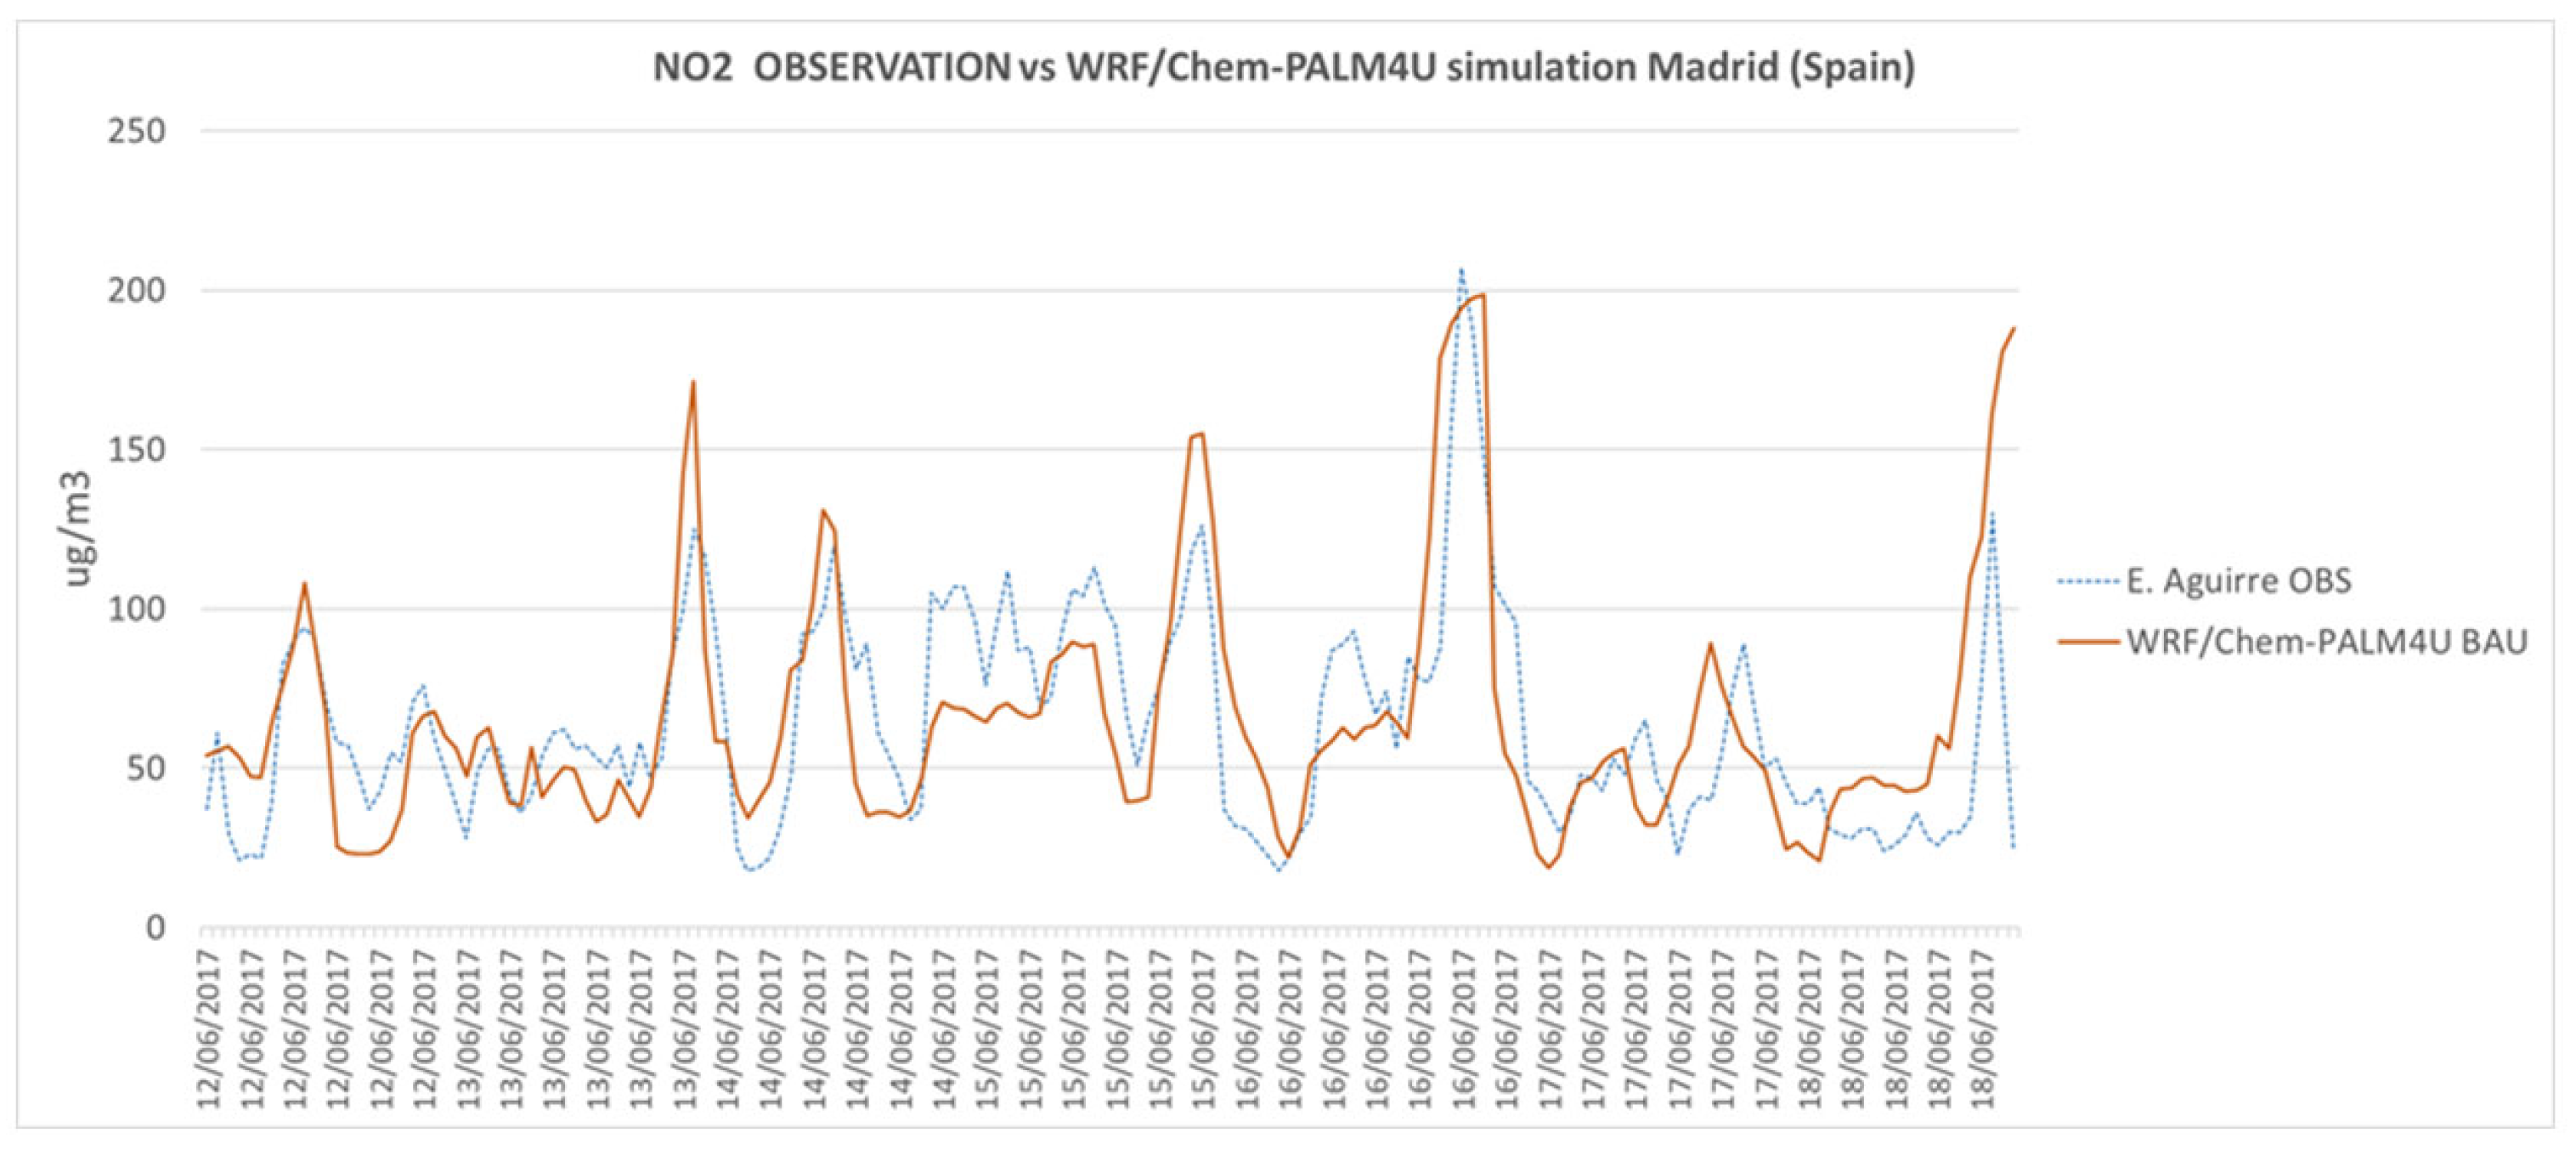
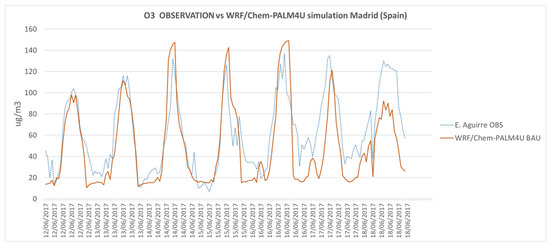
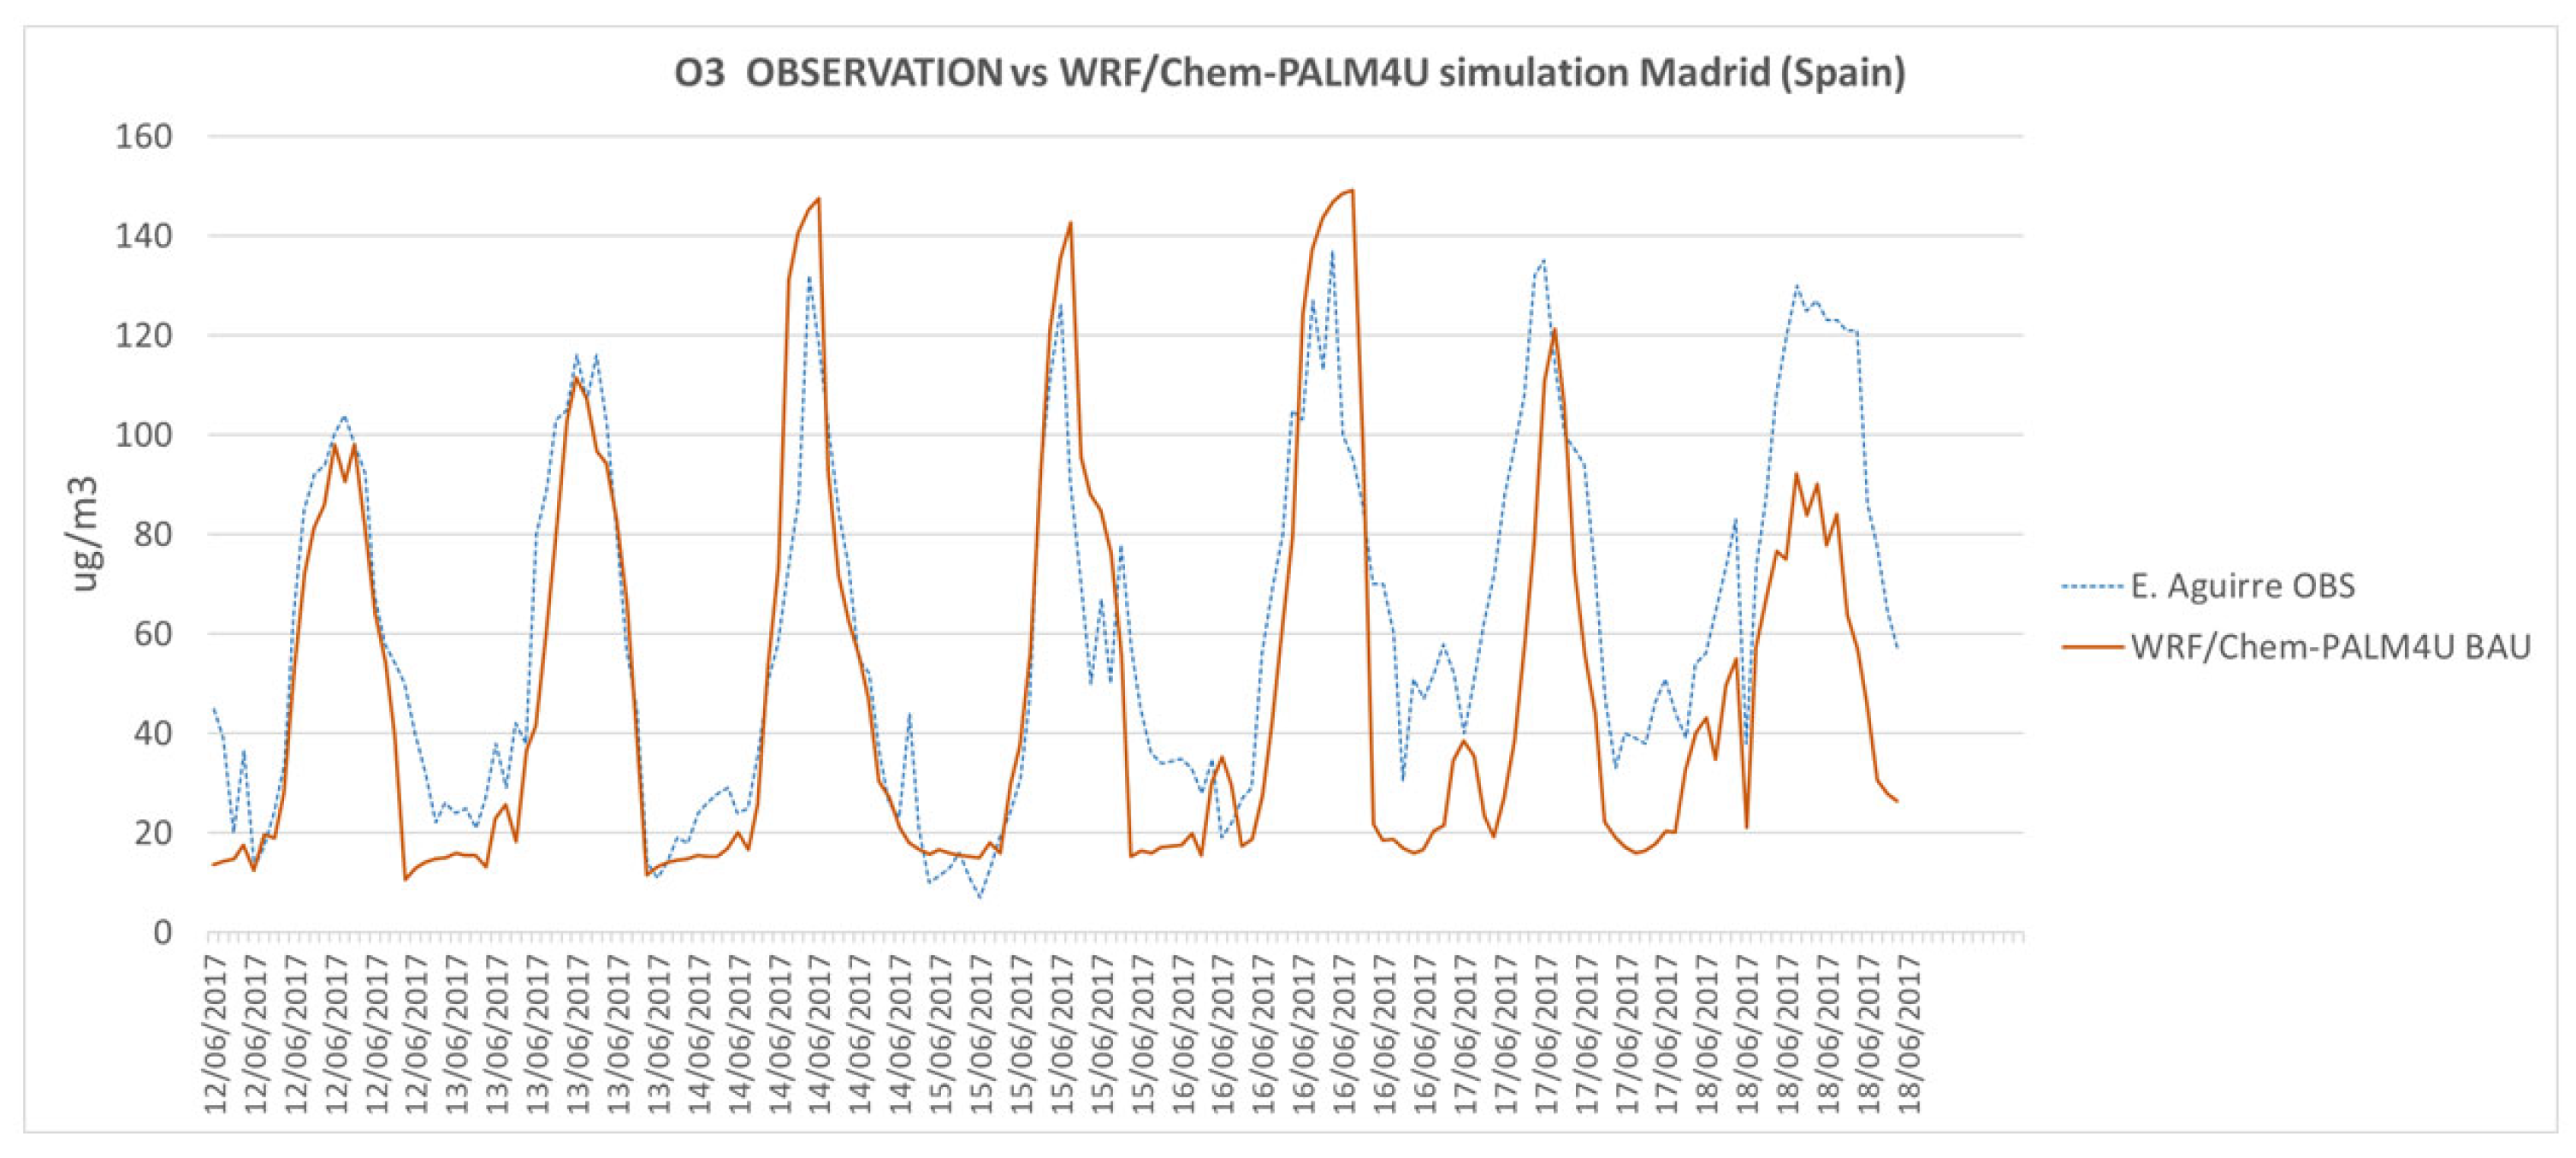
In Experiment 2, the agreement between modeled and observed concentrations was also satisfactory. For NO2, the R2 value was 0.6 (Figure 5) and for O3, 0.7 (Figure 6). The RMSE for both pollutants remained below 30 µg m−3. These values are consistent with the performance range reported in the literature for high-resolution urban air quality simulations. The evaluation focused on the grid cell (5 m × 5 m resolution in PALM4U) where the E. Aguirre monitoring station is located. The results confirm that the BAU simulation captures the main characteristics of pollutant variability during the selected episode. It is noteworthy that the performance of the high-resolution PALM4U simulations is comparable to that of the lower-resolution WRF/Chem simulations, with a resolution of 1 km. This is expected, as background pollutant concentrations from larger-scale meteorological and chemical fields significantly influence local concentration patterns within the CFD domain.
Figure 5.
Time series of hourly concentrations of observed and WRF/Chem-PALM4U NO2 at the E. Aguirre station on 12 June 2017 to 19 June 2017, Experiment 2 (Retiro).
Figure 6.
Time series of hourly concentrations of observed and WRF/Chem-PALM4U O3 (bottom) at the E. Aguirre station on 12 June 2017 to 19 June 2017, Experiment 2 (Retiro).
3.2. P. Castilla Results
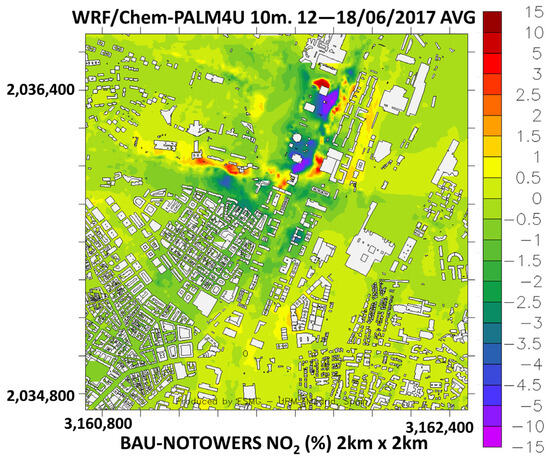
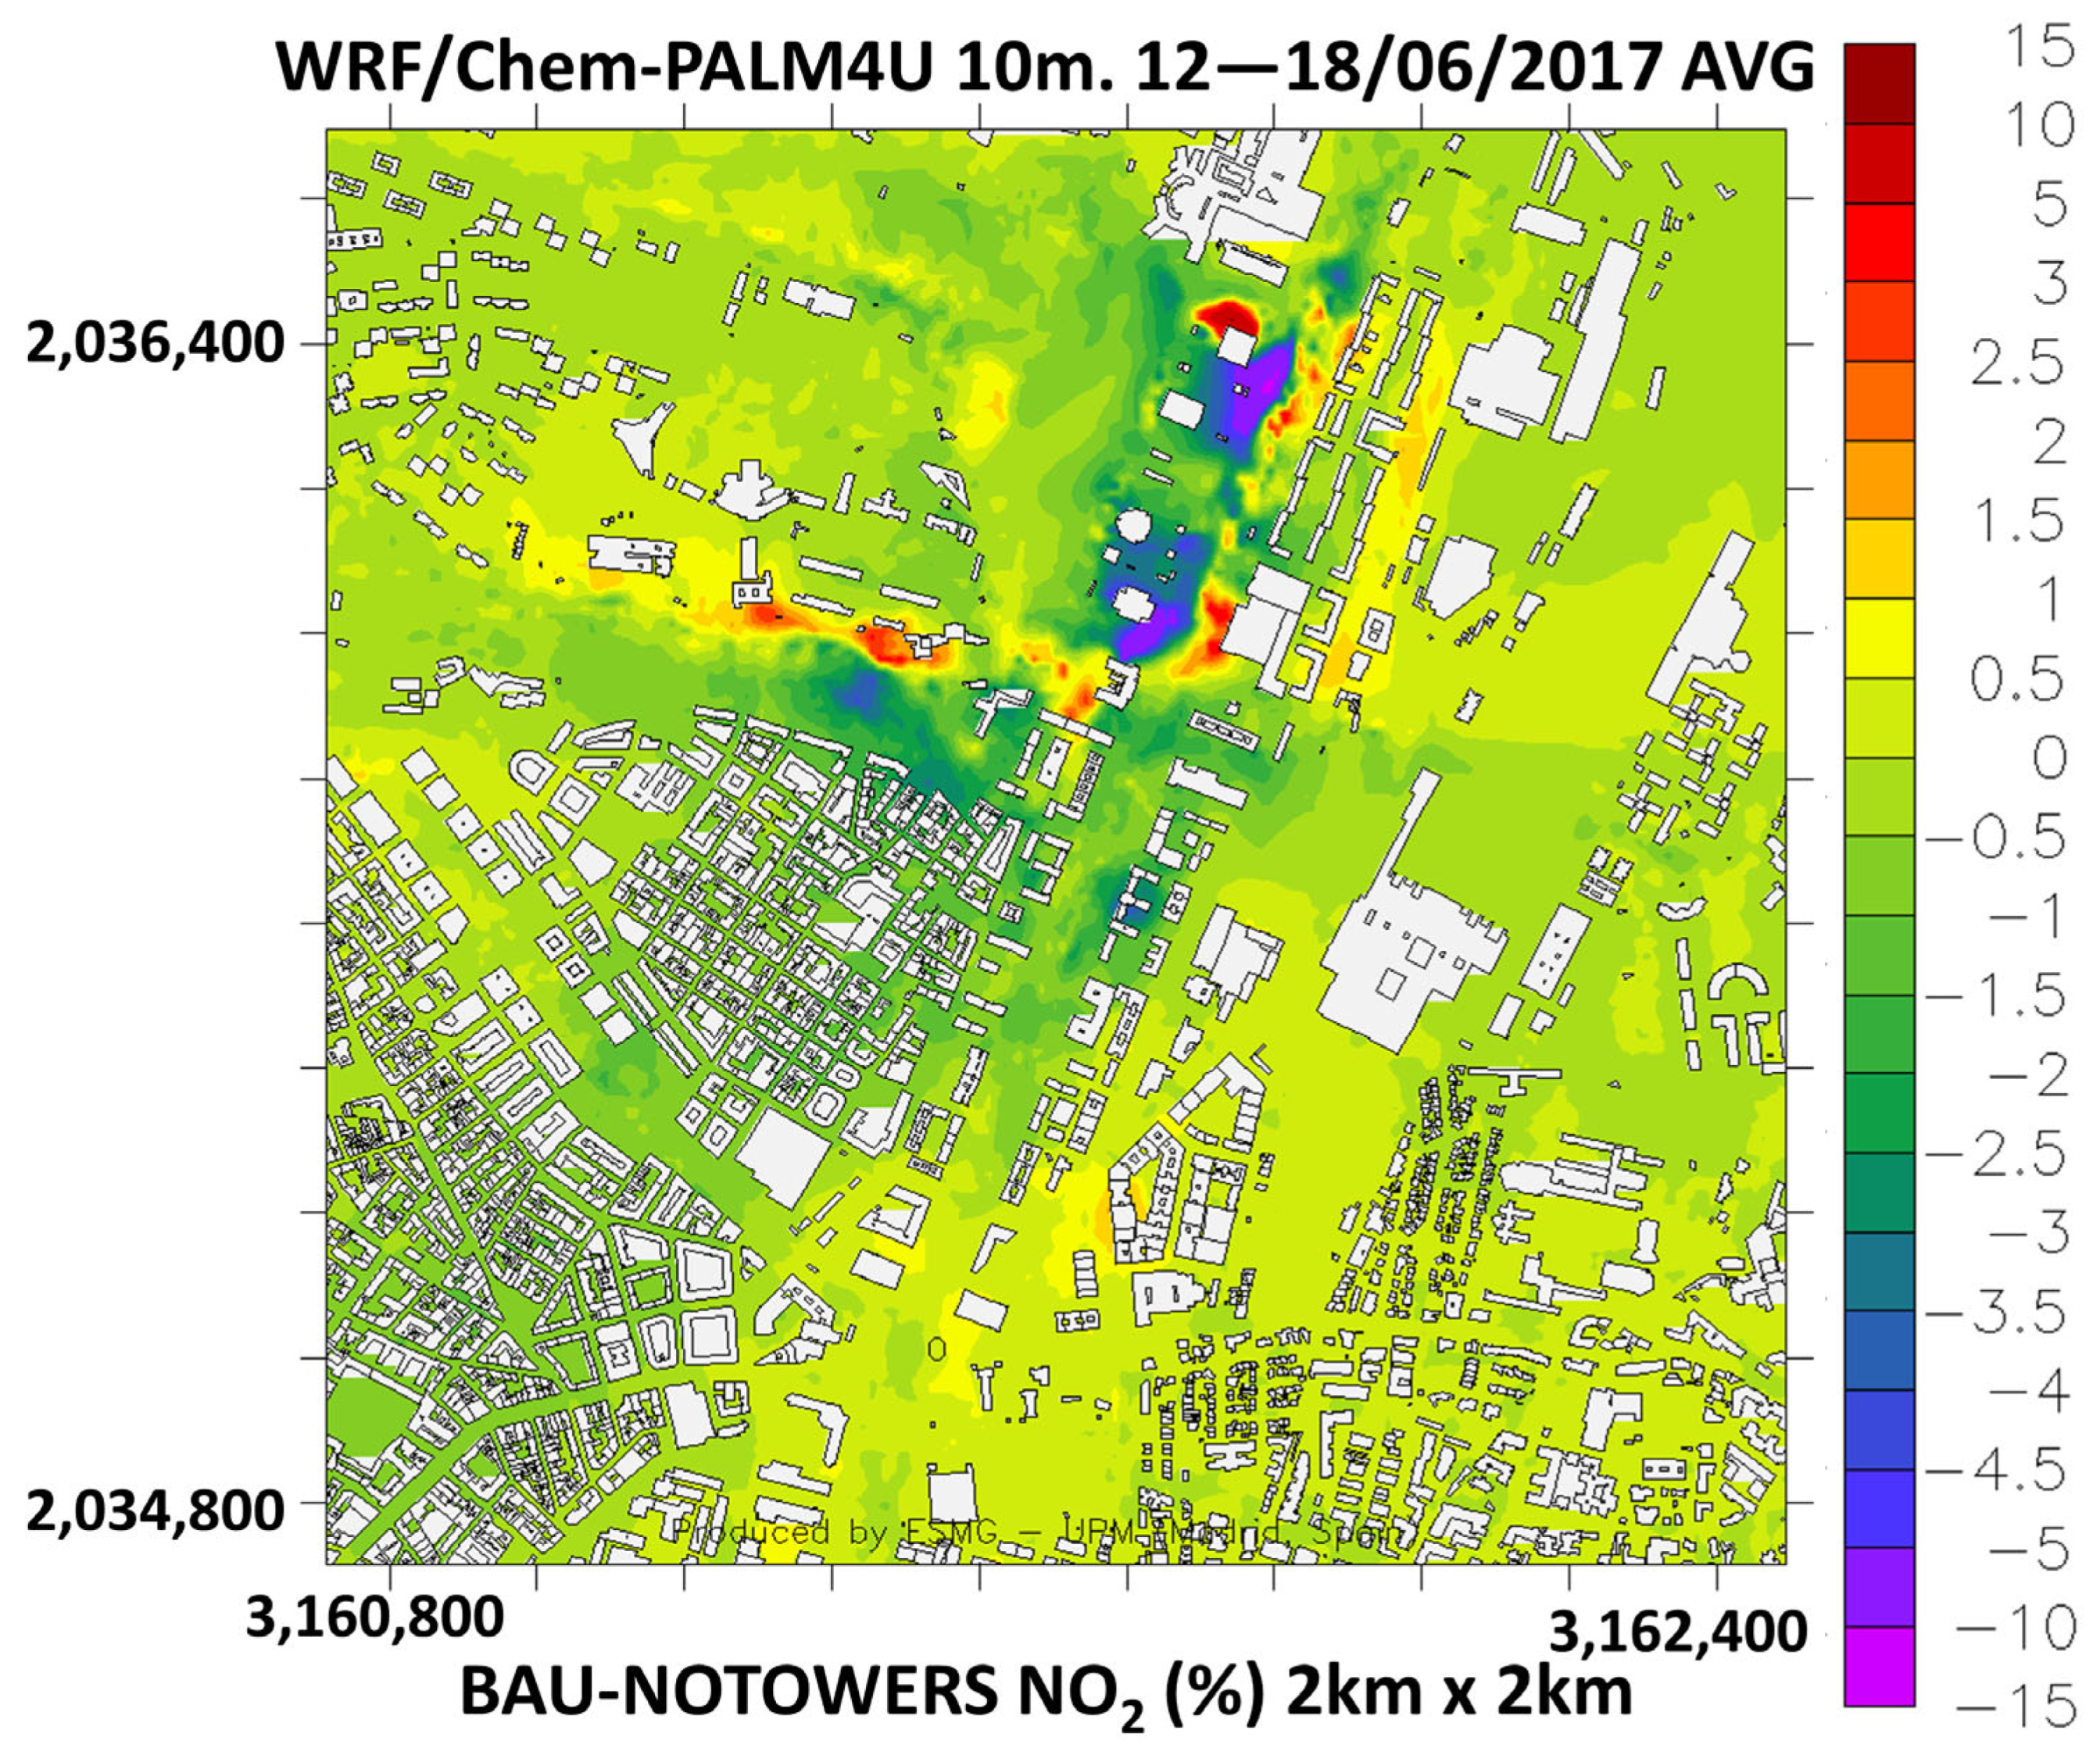
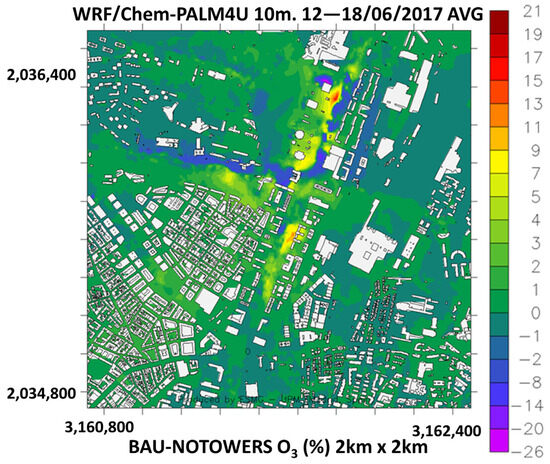
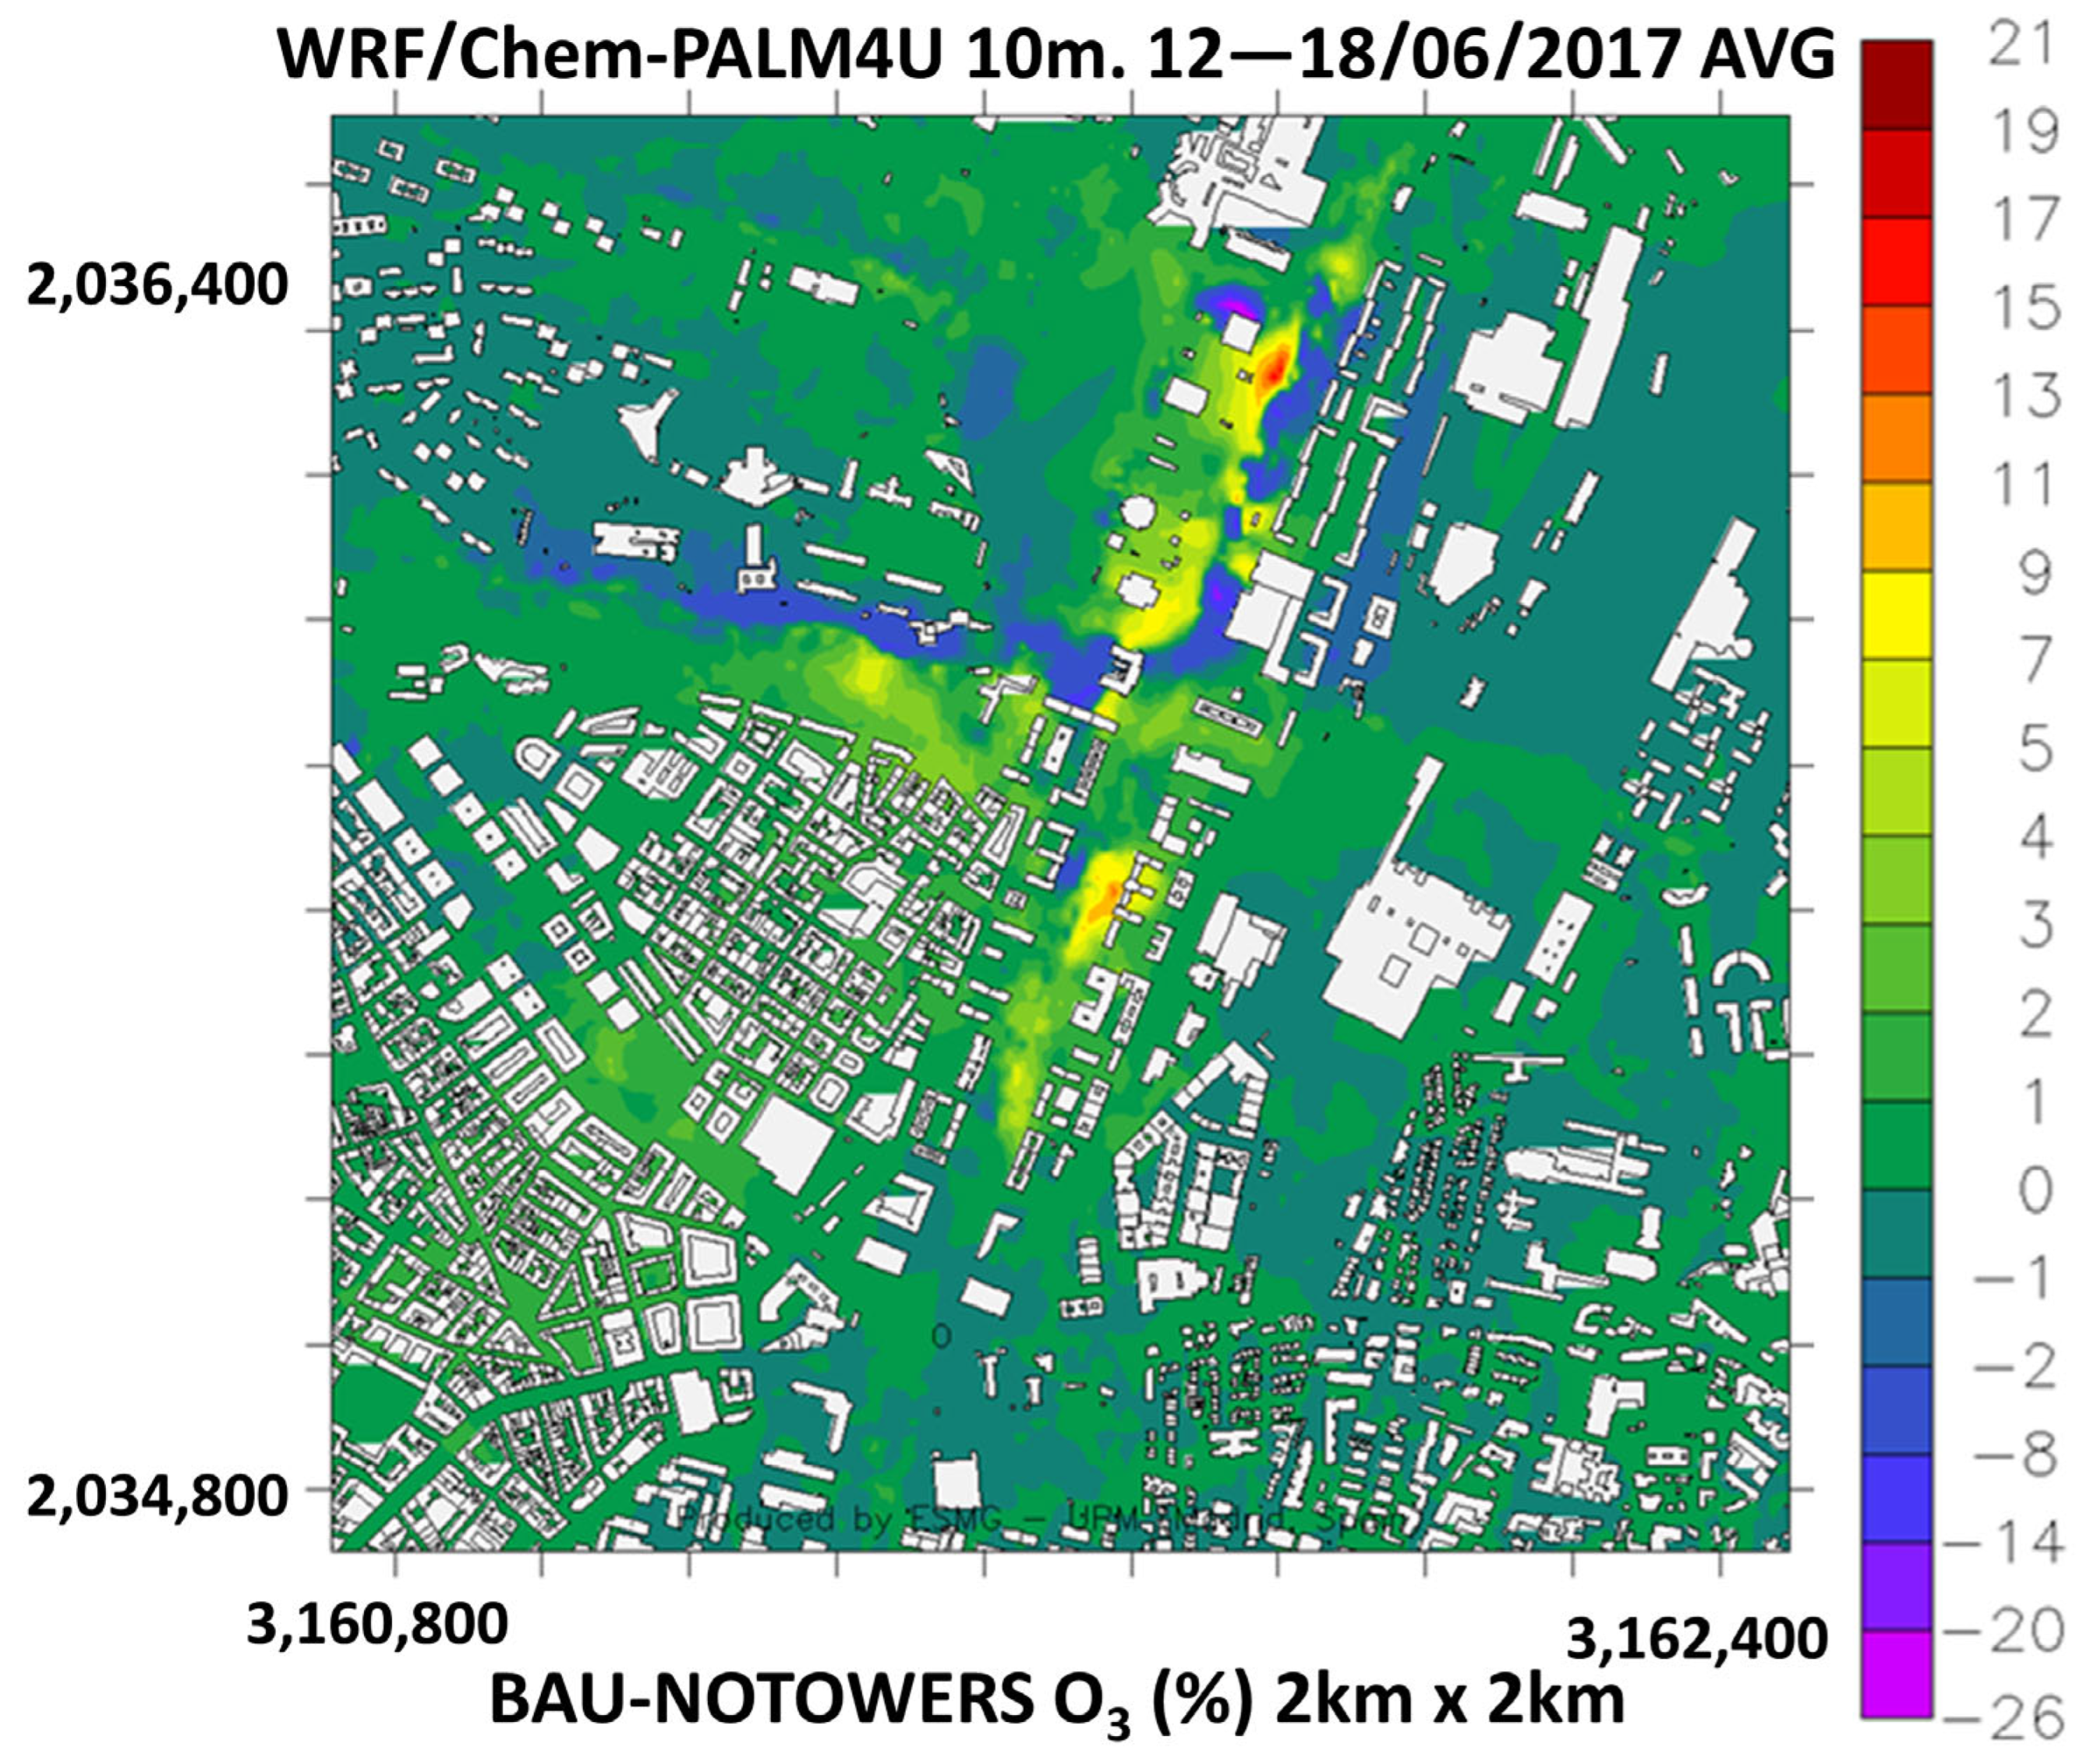
Once the BAU simulation was validated, the influence of the four skyscrapers on pollutant dispersion was evaluated by comparing the BAU and NOTOWERS scenarios in Experiment 1. Figure 7 and Figure 8 show the relative changes in NO2 and O3 concentrations, respectively, resulting from the presence of the towers (expressed as BAU − NOTOWERS, in %).
Figure 7.
Spatial distribution with 10 m spatial resolution of the effects of the four high-rise buildings (BAU-NOTOWER %) on NO2 hourly averaged concentrations for the period 12–18 June 2017. Arrows show the four towers [34].
Figure 8.
Spatial distribution with 10 m spatial resolution of the effects of the four high-rise buildings (BAU-NOTOWER %) on O3 hourly averaged concentrations for the period 12–18 June 2017. Arrows show the four towers [34].
Figure 7 illustrates that towers can induce both increases and decreases in NO2 concentrations, depending on their interaction with local wind patterns and urban morphology. Notably, the southernmost and northernmost towers decrease NO2 levels by up to −15% (purple areas) on the leeward side, while on the opposite side of the street, concentrations increase by up to 10% (red areas). The four buildings, together, cause a notable increase in NO2 concentrations along a street perpendicular to their alignment. An additional critical point of NO2 increase is observed near the northernmost tower, highlighting the complex and localized influence of these structures. The spatial impacts are localized, affecting only certain areas, while most of the region experiences no significant impacts.
Figure 8 shows the corresponding changes in O3 concentrations, which exhibit an opposite trend to that of NO2 due to their photochemical relationship. Where increases in NO2 are observed, O3 tends to decrease, and vice versa. For example, a substantial reduction in O3 concentrations, up to −14%, is observed in the street perpendicular to the buildings, which extends approximately 500 m from the towers. In contrast, the northernmost tower induces a significant increase in O3 concentrations of up to +20%, further demonstrating the strong spatial variability of the impacts.
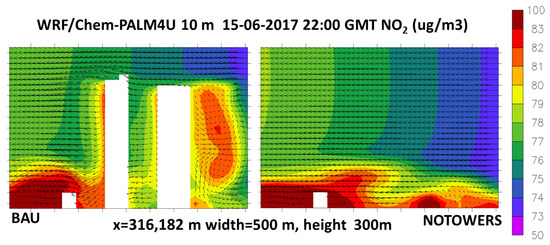
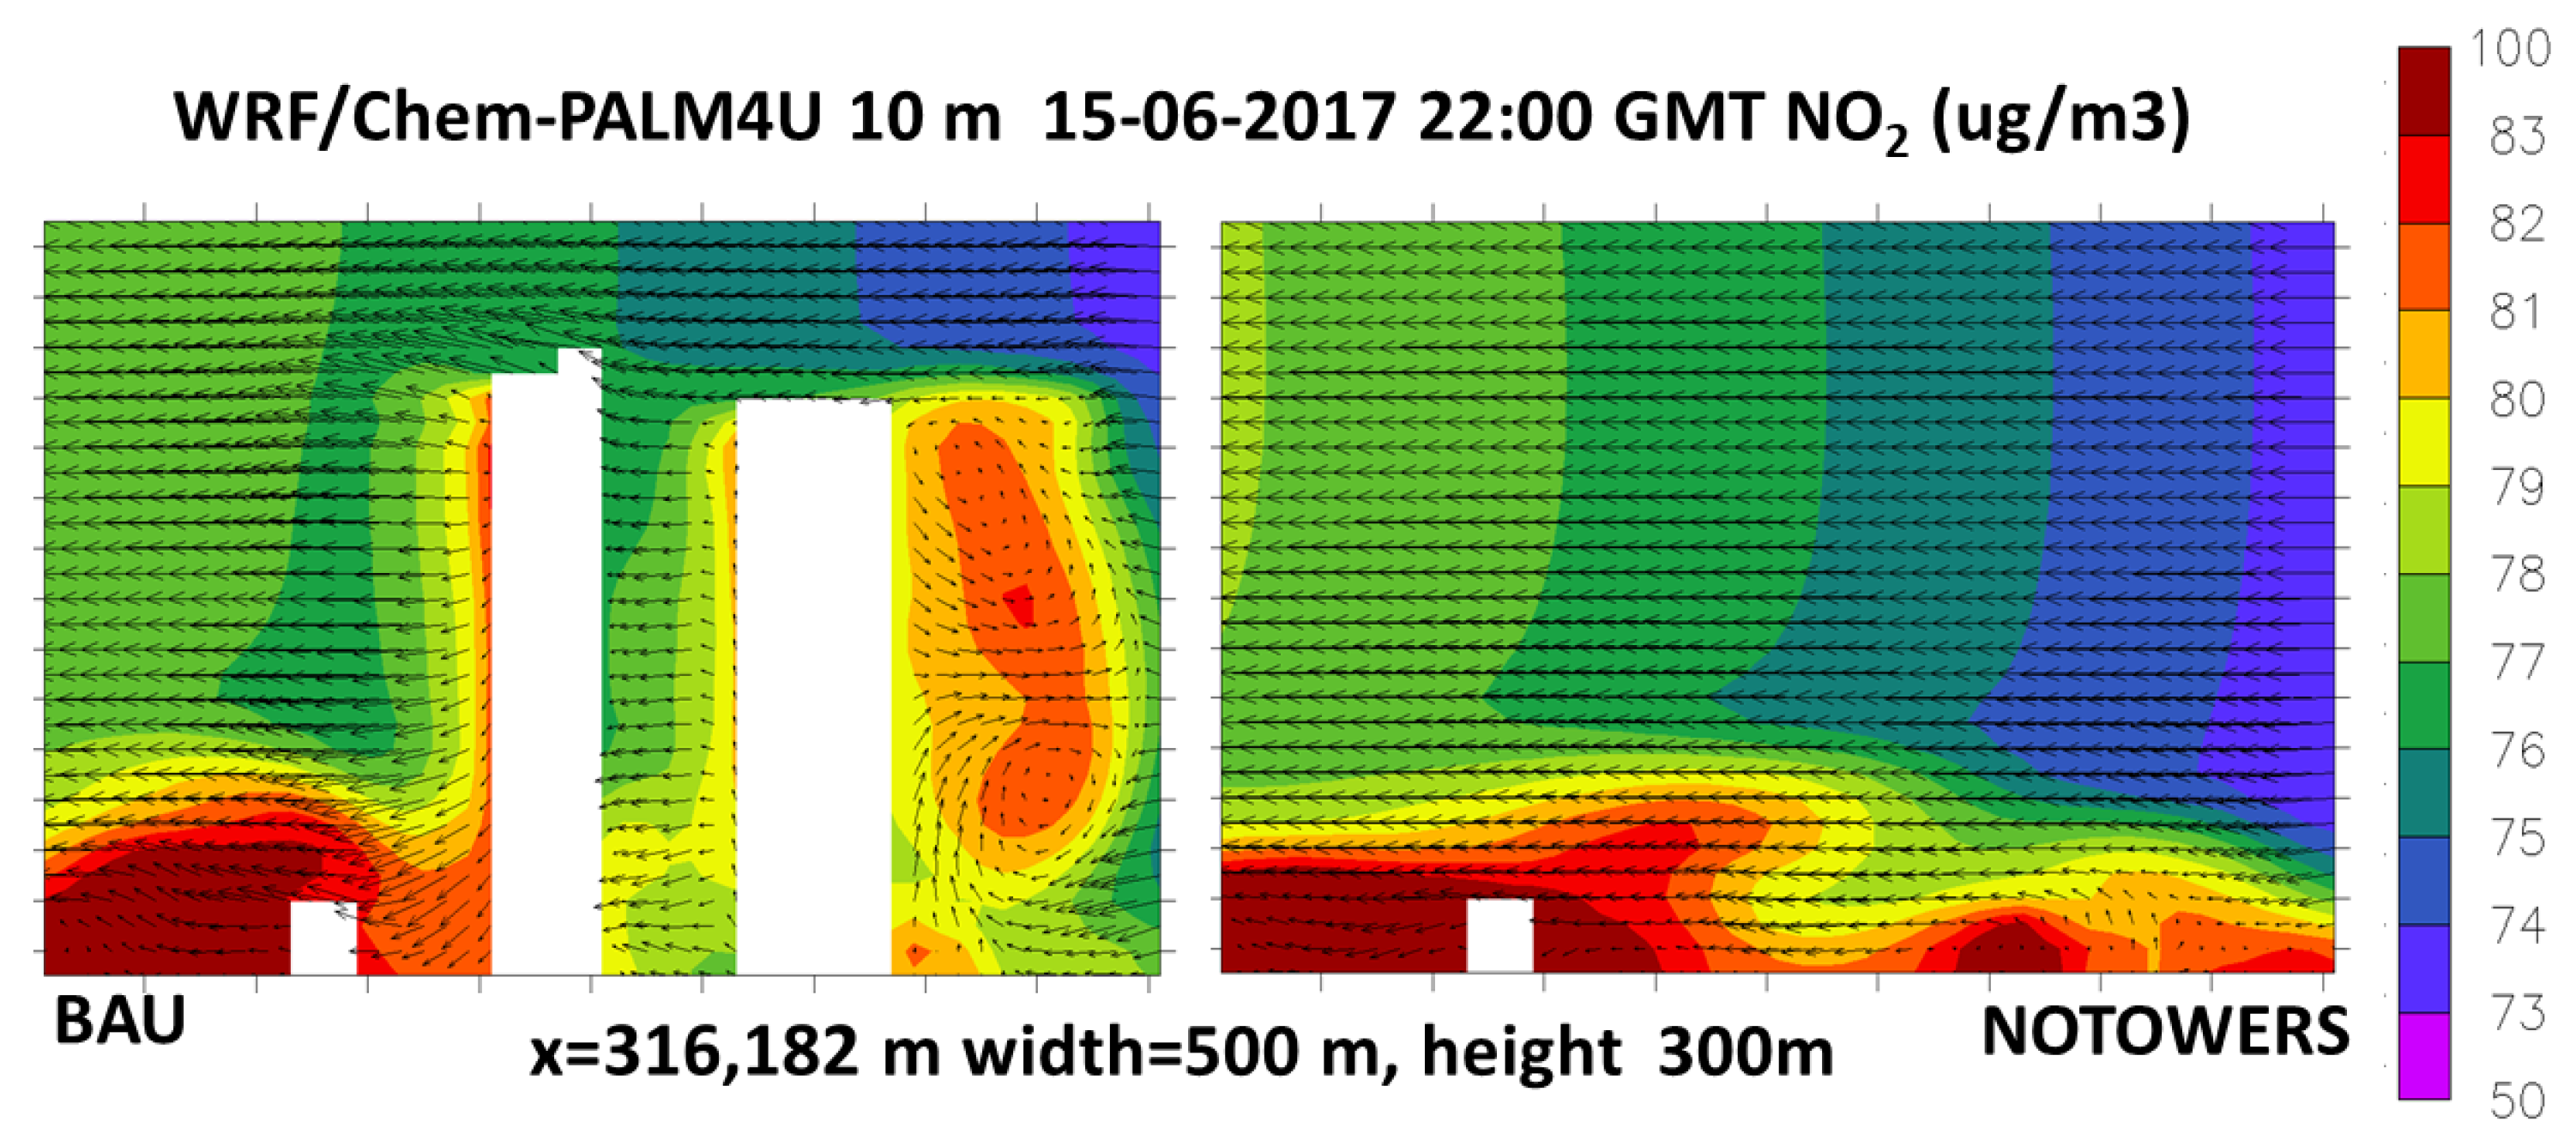
To better understand the vertical distribution of NO2 and wind dynamics around the buildings, Figure 9 presents a YZ cross-section around the first two towers, showing NO2 concentrations and wind vectors at 22:00 GMT on 15 June 2017. The top panel shows the situation with the towers (BAU) and the bottom panel without them (NOTOWERS). The analysis reveals that the second tower generates a vortex that traps pollutants on its leeward side, especially at the middle and upper levels of the building. Without the building, NO2 concentrations at this location would be approximately 74 μg m−3, but the vortex raises them to 83 μg m−3. In the case of the first tower, pollutant accumulation is observed on the windward side, while the space between the two buildings experiences reduced concentrations due to limited airflow penetration.
Figure 9.
Vertical cross-section (YZ) around the two first towers (X = 316,182–316,682 UTM, Zone 30) of NO2 concentrations and wind vectors in the BAU simulation (with towers) and in the NOTOWERS simulation (without towers) for the 15 June 2017 22:00 GMT. Arrows indicate wind direction and intensity [34].
These findings underscore the significant impact that individual high-rise buildings can have on urban air quality, both at the surface and vertical dimensions, by modifying local wind fields and pollutant dispersion patterns.
3.3. Retiro Results
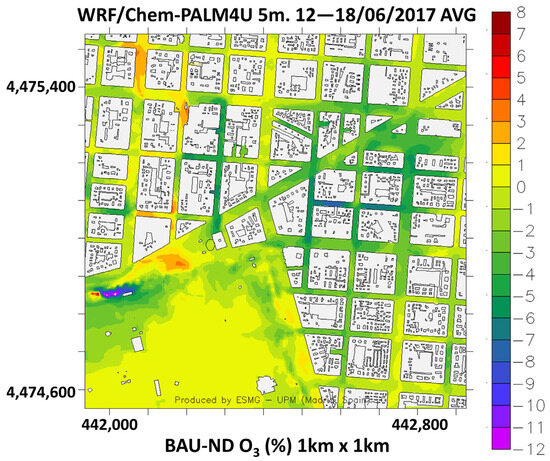
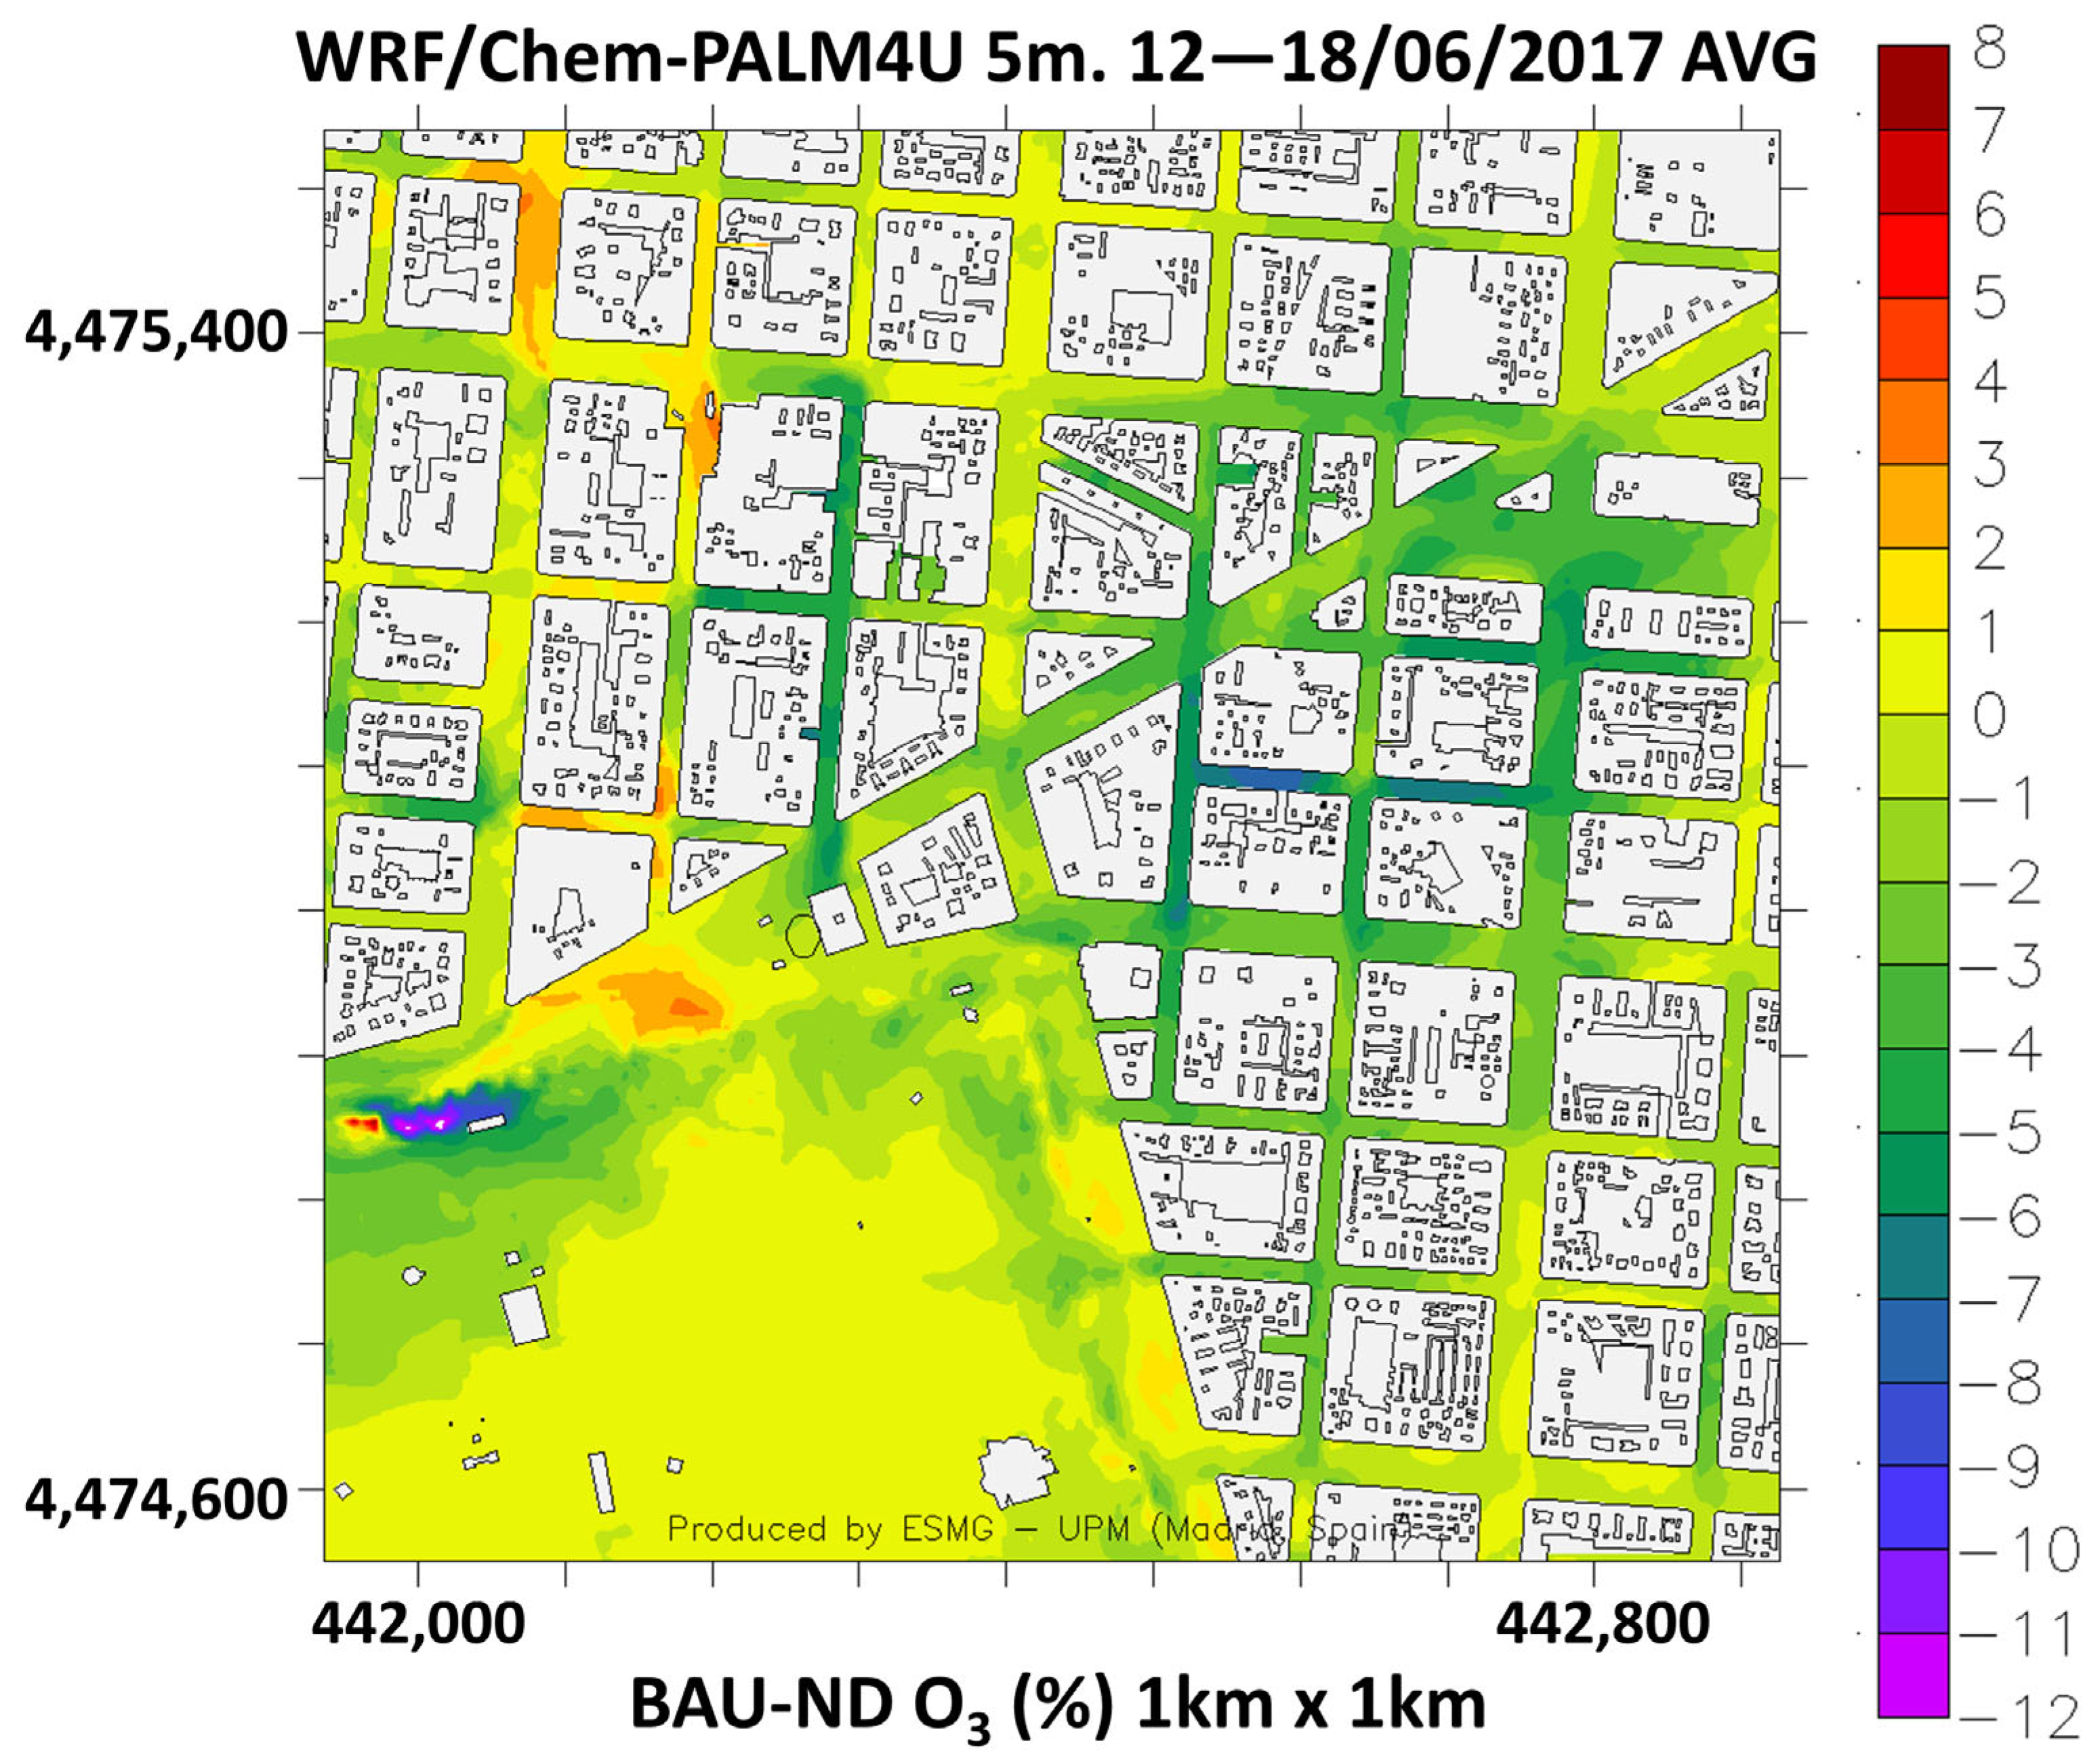
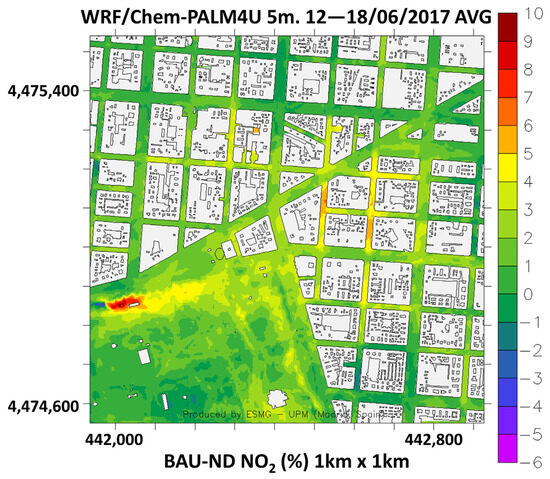
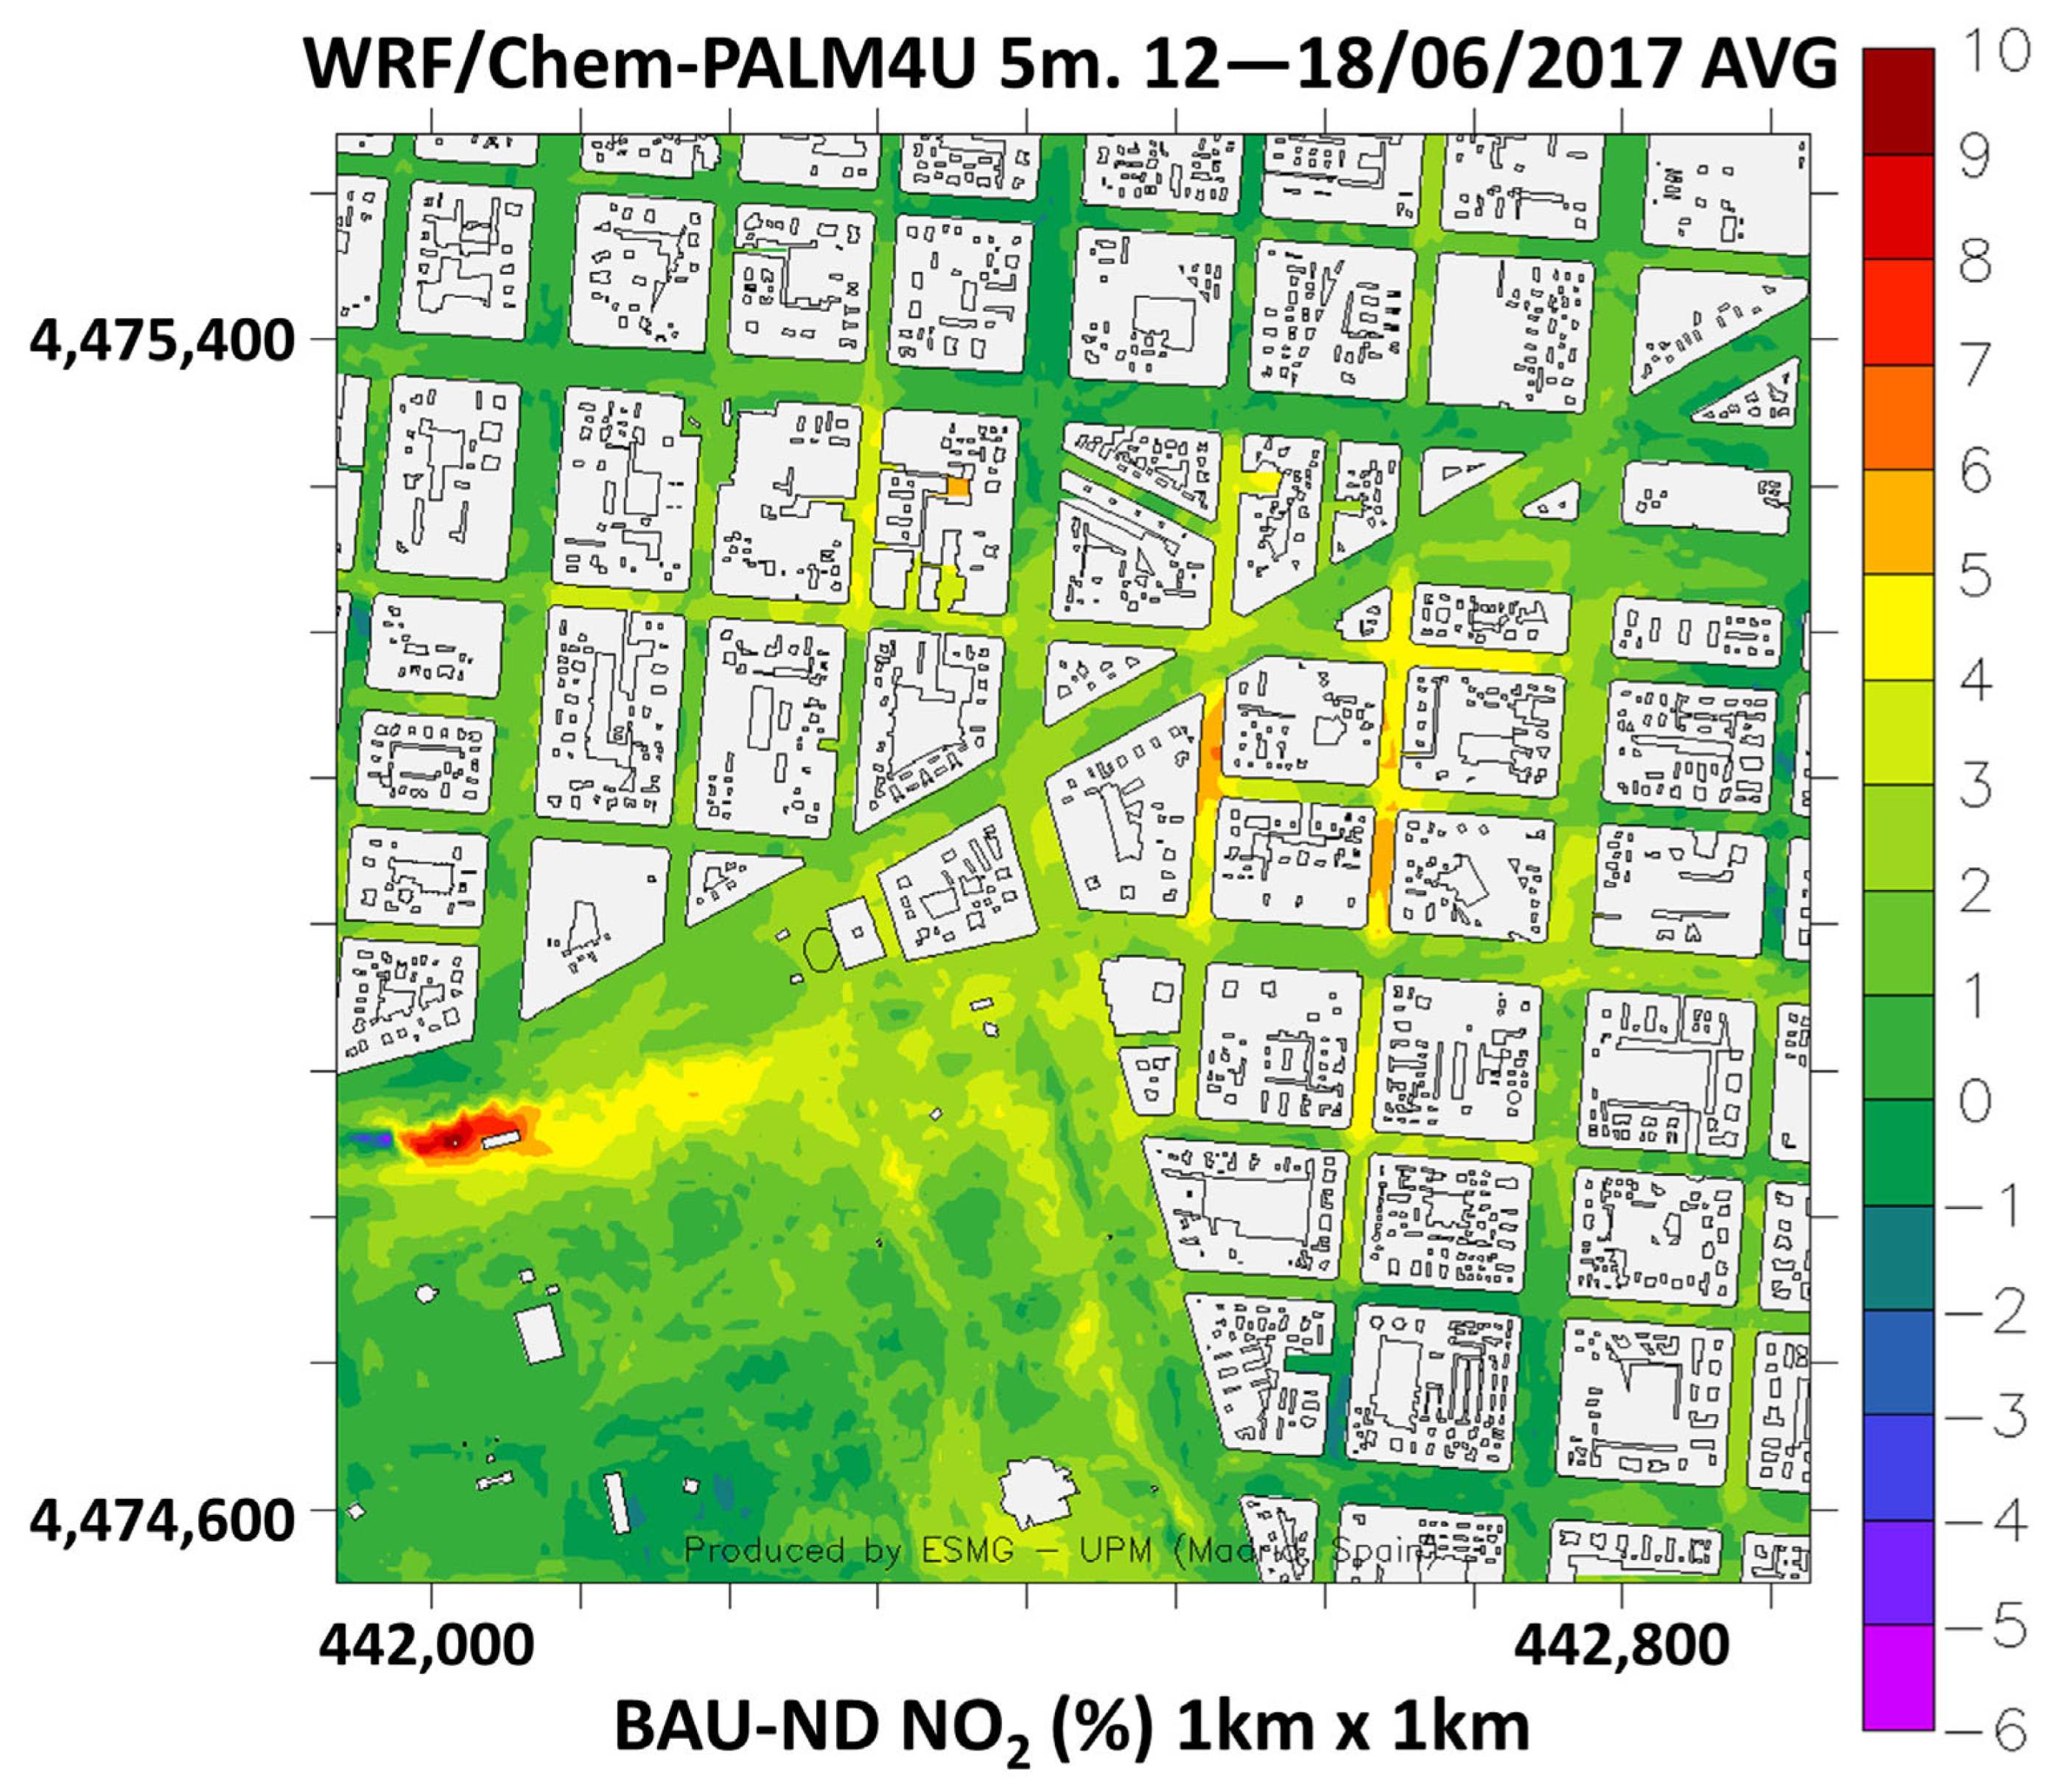
After validating the BAU simulation, the effects of tree type on air pollutant concentrations were analyzed by comparing the BAU and ND simulations. In the ND simulation, the vegetation in the green zone was modified by replacing broad-leaved trees with needle-leaved species. Figure 10 and Figure 11 present the spatial distribution of relative changes in O3 and NO2 concentrations, respectively, expressed as BAU–ND (%), for the period 12–18 June 2017, at a spatial resolution of 5 m.
Figure 10.
Spatial distribution with 5 m spatial resolution of the effects of type of trees (BAU-ND %) on O3 hourly averaged concentrations for the period 12–18 June 2017 [35].
Figure 11.
Spatial distribution with 5 m spatial resolution of the effects of type of trees (BAU-ND %) on NO2 hourly averaged concentrations for the period 12–18 June 2017 [35].
The results show that changing vegetation type alters the spatial patterns of pollutant concentrations, especially around the green zone and its adjacent streets. The effects are spatially heterogeneous, with increases and decreases in pollutant levels observed at pedestrian height. This variability is primarily associated with the different biophysical and aerodynamic properties of the tree types. Figure 11 reveals that the transition from broad-leaved to needle-leaved trees has a significant effect on O3 concentrations. On the street adjacent to the green zone, needle-leaved trees increase O3 concentrations by up to 12% (yellow areas), while decreases of up to 8% are observed in other parts of the same street. These changes are not limited to the trees’ immediate surroundings but also extend to nearby streets. This pattern reflects the complex interactions between vegetation, turbulence, and photochemical processes, including the NOx and VOC-limited regimes that regulate ozone formation. As a result, in the ND simulation, 64.22% of grid cells show an increase in O3 concentrations, with an average increase of 1.93%. In contrast, NO2 concentrations decrease in 90.67% of the domain, with an average reduction of 1.69%.
The main parameter modified between simulations is the minimum canopy resistance (Rc_min), used in the deposition and energy balance formulations. For broad-leaved trees (BAU), Rc_min is set to 240 s m−1, while for needle-leaved trees (ND), it increases to 500 s m−1. This change directly affects canopy resistance (Rc) in the model (Equation (4)), which in turn reduces latent heat flux (LE) (Equation (5)) and increases surface temperature (Equation (6)), according to the land surface scheme implemented in PALM4U [36].
where
Rc: Canopy resistance (s m−1).
Rc_min: Minimum canopy resistance under optimal environmental conditions (s m−1).
LAI: Leaf area index.
f1: Corrector factor based on solar radiation.
f2: Corrector factor based on soil humidity.
f3: Corrector factor based on water vapor pressure deficit.
The factors f1, f2, f3 are dimensionless correction factors accounting for the effects of solar radiation (R), soil moisture availability (Hm), and atmospheric water vapor pressure deficit (e), respectively. These factors modulate the stomatal response to environmental conditions, increasing canopy resistance under unfavorable conditions such as low radiation, soil water stress, or high vapor pressure deficit.
where
L: Latent heat flux (W m−2).
ρ: Air density (kg m−3).
lv: Latent heat of vaporization (J kg−1).
Ra: Aerodynamic resistance (s m−1).
Rc: Canopy resistance (s m−1).
qv: Water vapor mixing ratio of the air (kg kg−1).
qv,sat: Saturation mixing ratio at the surface temperature (kg kg−1).
This equation represents the turbulent transfer of water vapor from the surface to the atmosphere, controlled by both atmospheric transport (aerodynamic resistance) and surface or vegetation processes (canopy resistance).
The surface energy balance is expressed as
where
C: Heat capacity of the surface (J m−2 K−1).
dT: Differential of the radiative surface temperature (T) (K).
dt: Delta time (s).
Rn: Net radiation at the surface (W m−2).
H: Sensible heat flux (W m−2).
L: Latent heat flux (W m−2).
G: Ground (soil) heat flux (W m−2).
This equation describes the temporal evolution of the surface temperature as a result of the imbalance between incoming and outgoing energy fluxes.
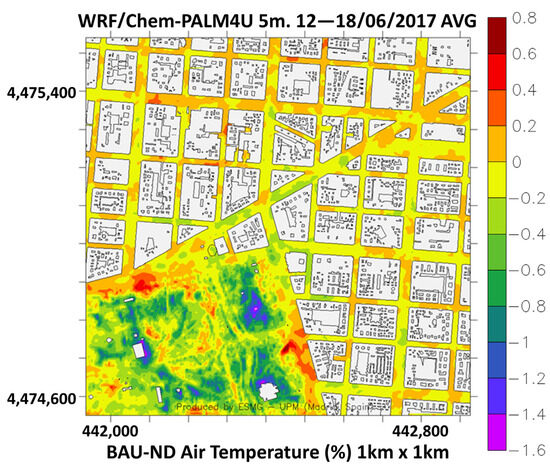
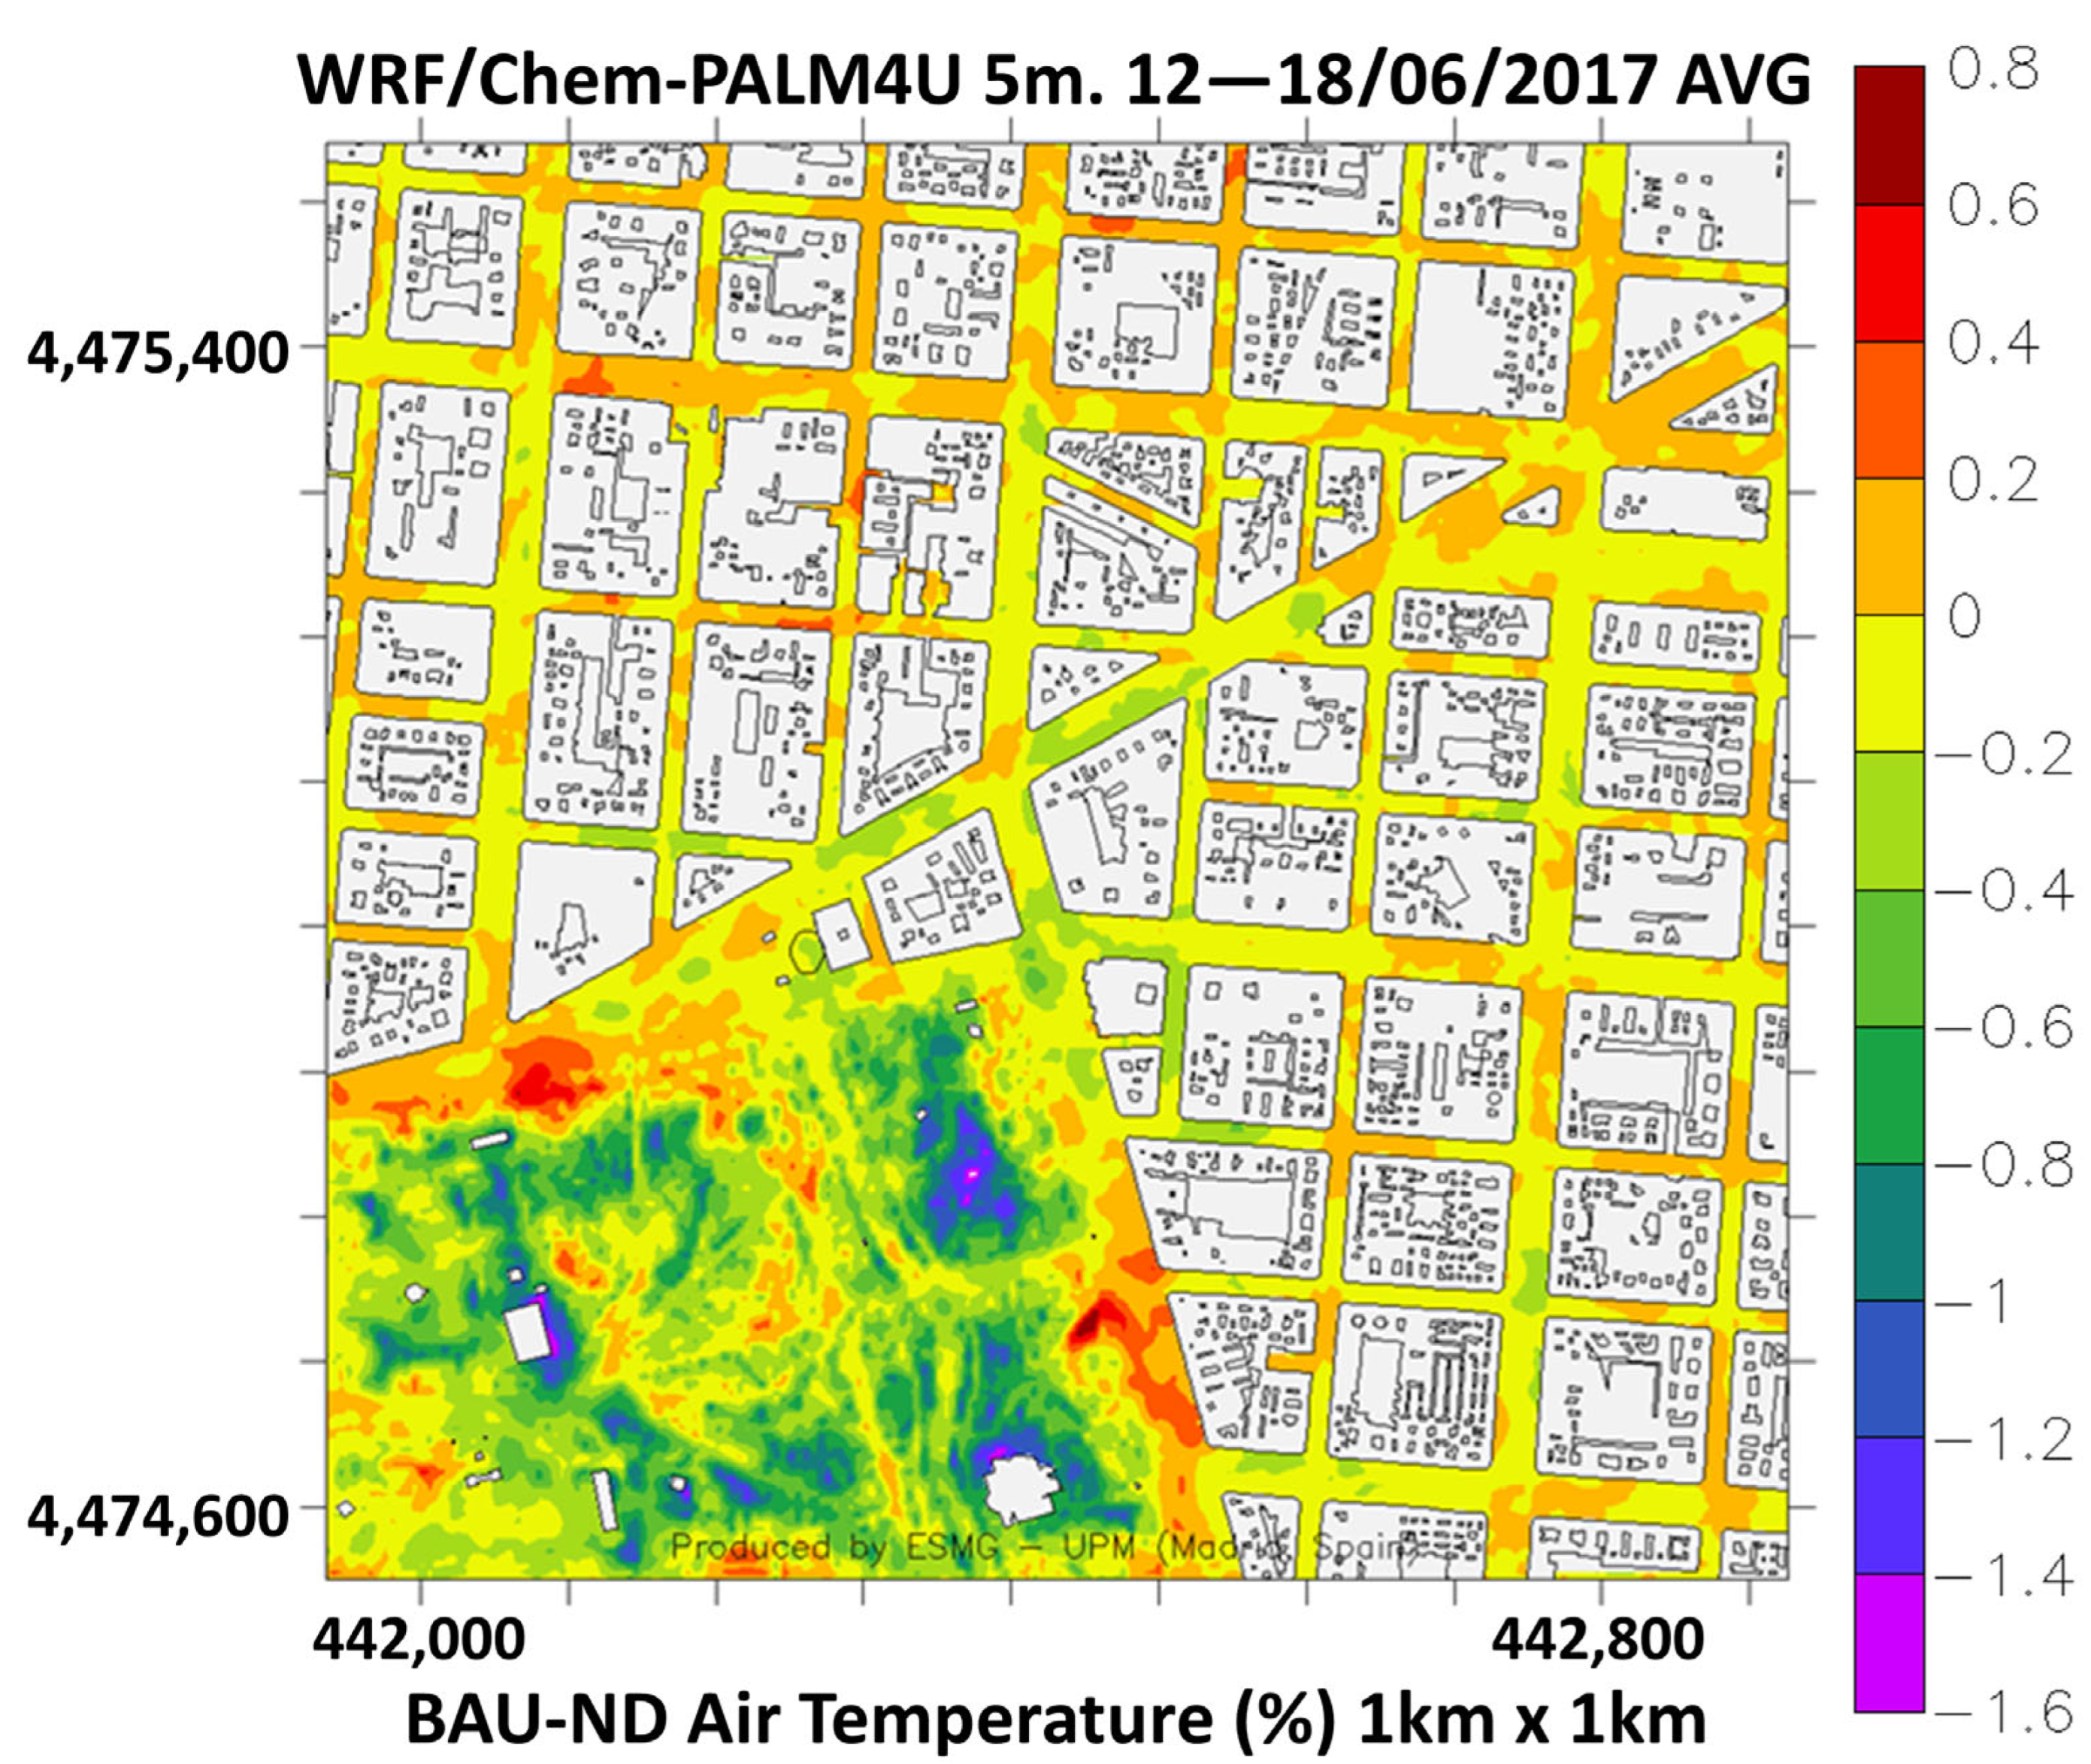
Figure 12 illustrates the spatial distribution of air temperature changes (BAU–ND%) resulting from vegetation type. The most pronounced effects occur in the green zone, where the replacement of broad-leaved trees with needle-leaved trees increases temperatures by up to 1.6% from a reference mean temperature of 24.6 °C. Slight increases are also observed in the surrounding areas. Interestingly, the thermal impact extends beyond the park, as some areas located more than 500–600 m away experience temperature increases, underscoring the nonlocal influence of urban vegetation on the microclimate.
Figure 12.
Spatial distribution with 5 m spatial resolution of the effects of type of trees (BAU-ND %) on air temperature hourly averaged concentrations for the period 12–18 June 2017 [35].
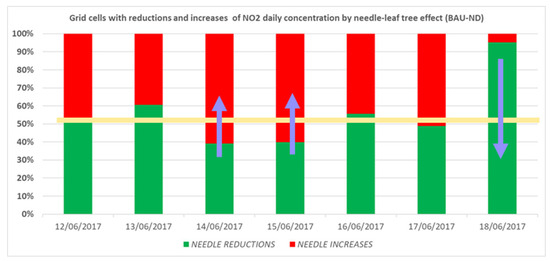
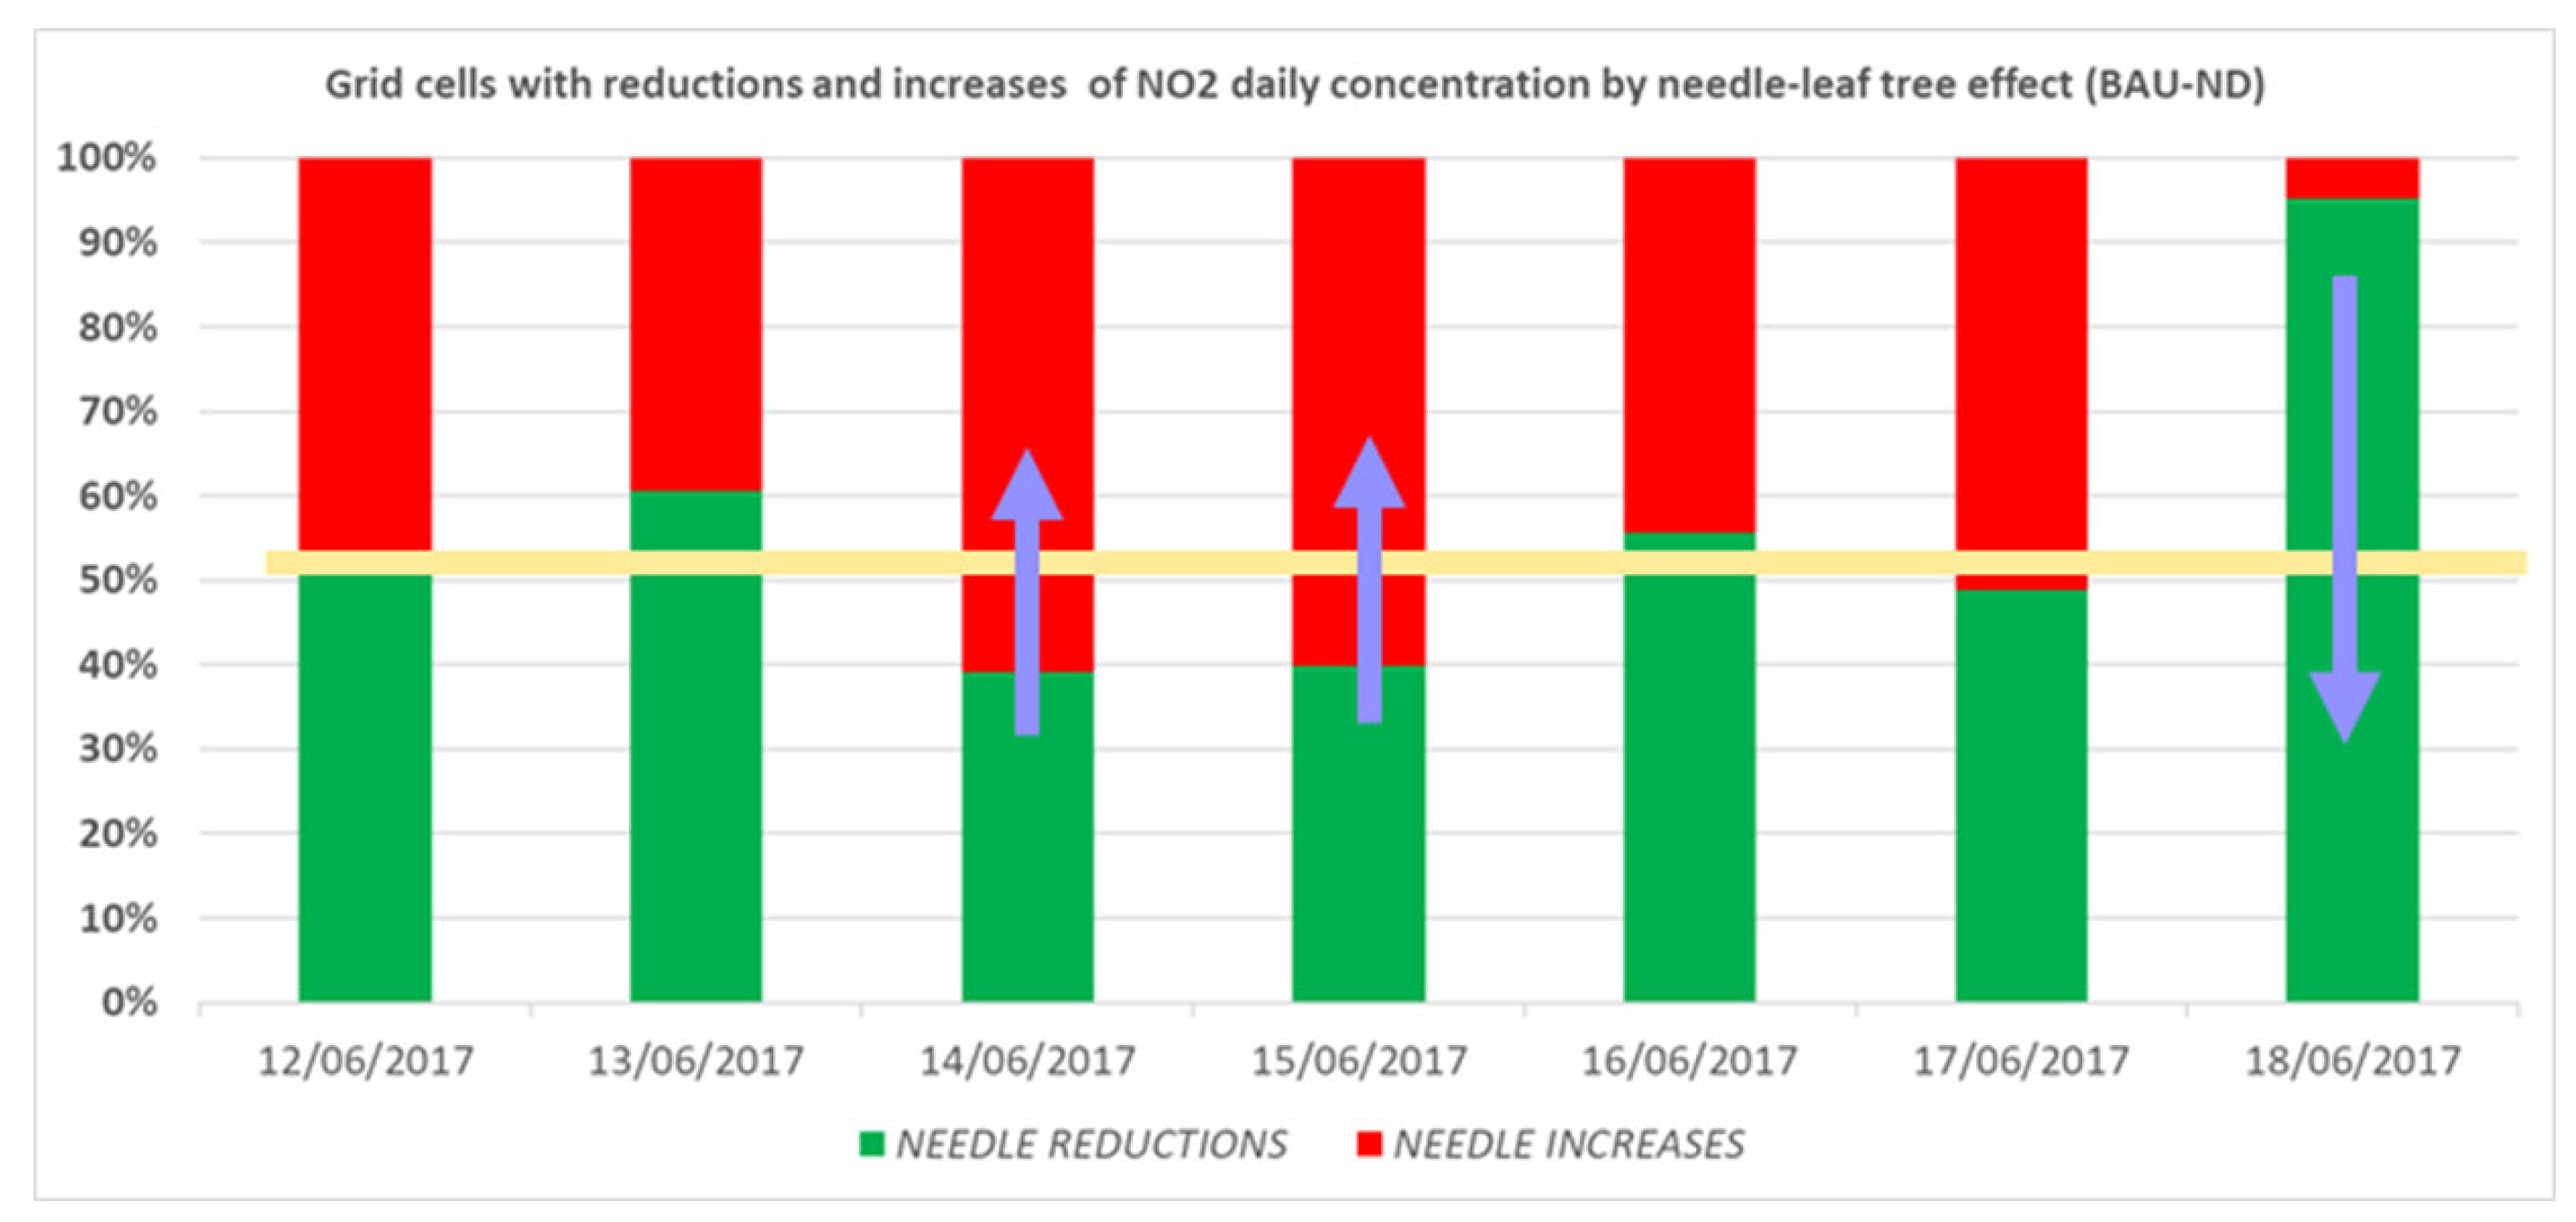
Figure 13 presents the daily variability of the ND simulation effects on NO2 concentrations across the domain. The percentage of grid cells showing increases (red) or decreases (green) is shown for each day between 12 and 18 June. The results indicate that the effect of tree type is not constant over time. For example, needle-leaved trees tend to increase NO2 concentrations on 14 and 15 June, while a significant decrease is observed on 13 June. Notably, on 18 June, approximately 90% of the 1 km2 area experienced a reduction in NO2 levels, suggesting that the impact of vegetation type can have substantial benefits on specific days.
Figure 13.
Percentage (%) of the domain experiencing reductions (green) and increases (red) of NO2 daily concentration by needle trees effects from 12 June 2017 to 18 June 2017 [35].
These findings highlight the importance of considering vegetation characteristics (not only species type but also its biophysical properties) when assessing urban air quality and microclimate interactions in urban planning and greening strategies. Bździuch et al. (2024) [37] used CFD (RANS) modeling to analyze the impact of different vegetation configurations (trees and hedges) on the dispersion of NOx and PM10 in a real urban canyon in Krakow. Their results confirmed that, although vegetation provides ecosystem benefits, its presence in narrow streets can reduce ventilation and increase local pollutant concentrations by up to 30% at certain critical points. This study highlights the importance of modeling the porosity and aerodynamic layout of green infrastructure to avoid undesirable effects on street-level air quality. The study by Bździuch et al. focuses on the physical arrangement of vegetation. Our research goes a step further by assessing the impact of different biological species (deciduous vs. evergreen) and how their specific properties (such as variable Leaf Area Density) differentially affect NO2 and O3 levels. Our study in Retiro Park analyzes not only an urban canyon, but also a large urban forest and how it interacts with the surrounding built environment, offering a broader perspective on sustainable urban planning.
4. Conclusions
This study presents the implementation and application of an integrated urban air quality modeling framework combining an emission model (EMIMO), a traffic flow model (SUMO), a mesoscale chemical transport model (WRF/Chem), and a high-resolution Large Eddy Simulation Model with chemistry (PALM4U-LES). The PALM4U model was applied at a spatial resolution of 10 m, incorporating detailed urban morphology, vegetation characteristics, and anthropogenic emissions at hourly resolution. Boundary and initial conditions were derived from WRF/Chem simulations at a resolution of 1 km. Evaluation of model performance against in situ observations of NO2 and O3 confirms the system’s ability to accurately reproduce the spatial and temporal patterns of pollutant concentrations in urban environments. Two numerical experiments were conducted to explore the impact of key urban design features (high-rise buildings and tree species) on local air quality. The first experiment evaluated the effects of four high-rise buildings, comparing scenarios with (BAU) and without (NOTOWERS) the towers. The results highlight the nonlinear and highly localized influence of urban form on pollutant dispersion. Depending on the position relative to the towers and the prevailing meteorological conditions, NO2 and O3 concentrations were observed to increase or decrease by up to 15% and 20%, respectively. The buildings also modified the wind field and temperature distribution, generating vertical recirculation zones and altering pollutant accumulation. Notably, temperature increases of up to 5% were observed in the immediate vicinity of the buildings, which in turn influenced chemical processes.
These findings underscore the importance of using CFD-LES models such as PALM4U to assess the aerodynamic and microclimatic impacts of high-rise structures on urban air quality. By applying realistic mesoscale boundary conditions and detailed urban morphology, these models offer a unique perspective at metric resolution. This makes them valuable tools for urban planners, designers, and policymakers in evaluating mitigation strategies, exposure reduction, and the potential health benefits associated with urban design decisions. The second experiment evaluated the effects of vegetation type, comparing broad-leaf and needle-leaf tree scenarios (BAU vs. ND) as a form of nature-based solution (NBS). The results demonstrate that changing tree species can significantly influence pollutant concentrations, not only in the immediate vicinity but also in areas located more than 500–600 m from vegetation. Replacing broad-leaf trees (Rc min = 240 s m−1) with needle-leaved trees (Rc min = 500 s m−1) produced measurable changes in canopy resistance, surface energy fluxes, and near-surface air temperature. These changes resulted in heterogeneous variations in pollutant concentrations: NO2 decreased overall (mean −1.69% across 90.67% of cells), while O3 increased (mean −1.93% across 64.22% of cells), with local effects ranging from −12% to −10%. These results emphasize the complex interactions between vegetation, energy balance, and chemical regimes (e.g., limited by NOₓ or VOCs) in shaping urban air quality. The approach confirms that the integrated modeling system is suitable for evaluating the effectiveness of NBS strategies in realistic urban settings and meteorological conditions.
The conclusions regarding the influence of tree type and buildings on NO2 and O3 concentrations are intended to be qualitative. The analysis focuses on relative differences between scenarios in order to explore the potential effects of vegetation characteristics on air quality. A formal analysis of statistical significance is beyond the scope of this study, which aims to provide an initial assessment of the magnitude and spatial patterns of simulated changes rather than a definitive attribution.
While previous studies addressed the experiments in Plaza Castilla and Retiro Park as independent case studies, this work provides a synthesized evaluation of the modeling system’s sensitivity to fundamentally different urban forcing. A key scientific contribution of this integrated analysis is the quantification of the ‘model’s dynamic range’. For instance, the system demonstrates the ability to transition from simulating rigid, non-porous aerodynamic blockages (skyscrapers) to complex biological porous media (vegetation canopy) under the same meteorological forcing (WRF/Chem). This comparative framework allows us to conclude that the WRF/Chem-PALM4U-SUMO coupling is robust across the full spectrum of urban interventions (Gray vs. Green), a validation that was not possible in fragmented earlier publications.
It is important to highlight the system’s ability to capture different physical and chemical phenomena in a real urban environment such as Madrid. In Experiment 1 (Infrastructure), the impact of skyscrapers is predominantly aerodynamic. Towers generate vortices and turbulence that drastically alter wind flow, trapping pollutants on the leeward side. In Experiment 2 (Vegetation), the impact of trees in El Retiro is biophysical and aerodynamic. The change in leaf type alters the resistance of the wind, which modifies latent heat flows and surface temperature. The building experiment shows very localized but intense changes, with increases or decreases of up to 15% in NO2 and 20% in O3. The vegetation experiment shows more extensive changes but of lesser average magnitude.
In conclusion, the combined use of WRF/Chem and PALM4U in this study provides a powerful and flexible platform for assessing the implications of urban design and vegetation strategies on air quality. Future work should extend simulation periods to seasonal or annual scales and explore additional mitigation scenarios. Integrating exposure assessment and health impact modeling is also a promising direction for translating these high-resolution results into actionable urban planning decisions.
Despite the system’s high resolution and integrated nature, this study has some limitations that should be taken into account. First, the simulation period is limited to a representative week in June; therefore, long-term seasonal variations in both meteorology and vegetation phenology are not captured. Second, although ground-level validation was thorough, the vertical profiles of pollutants and wind fields lack direct empirical validation due to the absence of LIDAR or mast measurements in the study area. Finally, the coupling with mesoscale boundary conditions (WRF/Chem) introduces a bias in background concentration, especially during periods of low pollution. However, these limitations do not compromise the model’s primary utility as a tool for assessing the relative impact of urban morphology and mitigation strategies. Despite these limitations, the study provides a robust framework for urban planning, demonstrating that high-resolution CFD modeling is essential for designing effective pollution mitigation strategies.
Author Contributions
Conceptualization, R.S.J. and J.L.P.-C.; methodology, J.L.P.-C.; software, J.L.P.-C.; validation, M.J.-G. and R.S.J.; formal analysis, J.L.P.-C.; investigation, J.L.P.-C. and R.S.J.; resources, M.J.-G.; data curation, M.J.-G.; writing—original draft preparation, R.S.J.; writing—review and editing, J.L.P.-C.; visualization, J.L.P.-C.; supervision, R.S.J. All authors have read and agreed to the published version of the manuscript.
Funding
This research received no external funding.
Data Availability Statement
The data presented in this study are available on request from the corresponding author. Data are not publicly available due to privacy restrictions and sensible data.
Acknowledgments
The UPM authors thankfully acknowledge the computer resources, technical expertise and assistance provided by the Centro de Supercomputación y Visualización de Madrid (CESVIMA). The authors thankfully acknowledge the computer resources at MareNostrum and the technical support provided by the Spanish Supercomputing Network (RES).
Conflicts of Interest
The authors declare no conflicts of interest.
Abbreviations
The following abbreviations are used in this manuscript:
| NBS | Nature-Based Solutions |
| CFD | Computational Fluid Dynamics |
| BAU | Business As Usual |
| LES | Large Eddy Simulation |
| RANS | Reynolds-Averaged Navier–Stokes |
References
- Pope, C.; Dockery, D. Health Effects of Fine Particulate Air Pollution: Lines that Connect. J. Air Waste Manag. Assoc. 2006, 56, 709–742. [Google Scholar] [CrossRef] [Scilit] [PubMed]
- Isakov, V.; Barzyk, T.; Smith, E.; Arunachalam, A.; Naess, B.; Venkatram, A. A web-based screening tool for near-port air quality assessments. Environ. Model. Softw. 2017, 98, 21–34. [Google Scholar] [CrossRef] [Scilit]
- Caplin, A.; Ghandehari, M.; Lim, C.; Glimcher, P.; Thurston, G. Advancing environmental exposure assessment science to benefit society. Nat. Commun. 2019, 10, 1236. [Google Scholar] [CrossRef] [Scilit]
- Berardi, U.; GhaffarianHoseini, A.; GhaffarianHoseini, A. State-of-the-art analysis of the environmental benefits of green roofs. Appl. Energy 2014, 115, 411–428. [Google Scholar] [CrossRef] [Scilit]
- Neft, I.; Scungio, M.; Culver, N.; Singh, S. Simulations of aerosol filtration by vegetation: Validation of existing models with available lab data and application to near-roadway scenario. Aerosol Sci. Technol. 2016, 50, 937–946. [Google Scholar] [CrossRef] [Scilit]
- Pataki, D.E.; Carreiro, M.M.; Cherrier, J.; Grulke, N.E.; Jennings, V.; Pincetl, S.; Pouyat, R.V.; Whitlow, T.H.; Zipperer, W.C. Coupling biogeochemical cycles in urban environments: Ecosystem services, green solutions, and misconceptions. Front. Ecol. Environ. 2011, 9, 27–36. [Google Scholar] [CrossRef] [Scilit]
- Shirzadi, M.; Tominaga, Y. Computational fluid dynamics analysis of pollutant dispersion around a high-rise building: Impact of surrounding buildings. Build. Environ. 2023, 245, 110895. [Google Scholar] [CrossRef] [Scilit]
- Ioannidis, G.; Li, C.; Tremper, P.; Riedel, T.; Ntziachristos, L. Application of CFD Modelling for Pollutant Dispersion at an Urban Traffic Hotspot. Atmosphere 2024, 15, 113. [Google Scholar] [CrossRef] [Scilit]
- Liu, S.; McKeen, S.; Hsie, E.; Lin, X.; Kelly, K.; Bradshaw, J.; Sandholm, S.; Browell, E.; Gregory, G.; Sachse, G.; et al. Model study of tropospheric trace species distributions during PEM-West A. J. Geophys. Res. Atmos. 1996, 101, 2073–2085. [Google Scholar] [CrossRef] [Scilit]
- Beevers, S.; Kitwiroon, N.; Williams, M.; Carslaw, D. One way coupling of CMAQ and a road source dispersion model for fine scale air pollution predictions. Atmos. Environ. 2012, 59, 47–58. [Google Scholar] [CrossRef] [Scilit]
- Choudhary, H.; Tarlo, S. Airway effects of traffic-related air pollution on outdoor workers. Curr. Opin. Allergy Clin. Immunol. 2014, 14, 106–112. [Google Scholar] [CrossRef] [Scilit]
- Rodrigues, V.; Augusto, B.; Oliveira, K.; Ascenso, A.; Rafael, S.; Nascimento, D.; Miranda, A.I. Setting up a CFD model to evaluate the impact of green infrastructures on local air quality. Air Qual. Atmos. Health 2024, 17, 2151–2167. [Google Scholar] [CrossRef] [Scilit]
- Miao, Y.; Liu, S.; Chen, B.; Zhang, B.; Wang, S.; Li, S. Simulating urban flow and dispersion in Beijing by coupling a CFD model with the WRF model. Adv. Atmos. Sci. 2013, 30, 1663–1678. [Google Scholar] [CrossRef] [Scilit]
- Abhijith, K.V.; Kumar, P.; Gallagher, J.; McNabola, A.; Baldauf, R.; Pilla, F.; Broderick, B.; Di Sabatino, S.; Pulvirenti, B. Air pollution abatement performances of green infrastructure in open road and built-up street canyon environments—A review. Atmos. Environ. 2017, 162, 71–86. [Google Scholar] [CrossRef] [Scilit]
- Baik, J.; Kim, J. On the escape of pollutants from urban street canyons. Atmos. Environ. 2002, 36, 527–536. [Google Scholar] [CrossRef] [Scilit]
- Li, Q.; Liang, J.; Wang, Q.; Chen, Y.; Yang, H.; Ling, H.; Luo, Z.; Hang, J. Numerical Investigations of Urban Pollutant Dispersion and Building Intake Fraction with Various 3D Building Configurations and Tree Plantings. Int. J. Environ. Res. Public Health 2022, 19, 3524. [Google Scholar] [CrossRef] [Scilit] [PubMed]
- Grell, G.; Peckham, S.; Schmitz, R.; McKeen, S.; Frost, G.; Skamarock, W.; Eder, B. Fully coupled “online” chemistry within the WRF model. Atmos. Environ. 2005, 39, 6957–6975. [Google Scholar] [CrossRef] [Scilit]
- Fast, J.; Gustafson, W.; Easter, R.; Zaveri, R.; Barnard, J.; Chapman, E.; Grell, G.; Peckham, S. Evolution of ozone, particulates, and aerosol direct radiative forcing in the vicinity of Houston using a fully coupled meteorology-chemistry-aerosol model. J. Geophys. Res. 2006, 111, D21305. [Google Scholar] [CrossRef] [Scilit]
- San José, R.; Pérez, J.L.; Balzarini, A.; Baró, R.; Curci, G.; Forkel, R.; Galmarini, S.; Grell, G.; Hirtl, M.; Honzak, L.; et al. Sensitivity of feedback effects in CBMZ/MOSAIC chemical mechanism. Atmos. Environ. 2015, 115, 646–656. [Google Scholar] [CrossRef] [Scilit]
- Zaveri, R.; Peters, L. A new lumped structure photochemical mechanism for large-scale applications. J. Geophys. Res. Atmos. 1999, 104, 30387–30415. [Google Scholar] [CrossRef] [Scilit]
- Zaveri, R.; Easter, R.; Fast, J.; Peters, L. Model for Simulating Aerosol Interactions and Chemistry (MOSAIC). J. Geophys. Res. 2008, 113, D13204. [Google Scholar] [CrossRef] [Scilit]
- Binkowski, F.; Shankar, U. The Regional Particulate Matter Model: 1. Model description and preliminary results. J. Geophys. Res. 1995, 100, 26191–26209. [Google Scholar] [CrossRef] [Scilit]
- Easter, R. MIRAGE: Model description and evaluation of aerosols and trace gases. J. Geophys. Res. 2004, 109, D20210. [Google Scholar] [CrossRef] [Scilit]
- Williams, J.; Landgraf, J.; Bregman, A.; Walter, H. A modified band approach for the accurate calculation of online photolysis rates in stratospheric-tropospheric Chemical Transport Models. Atmos. Chem. Phys. 2006, 6, 4137–4161. [Google Scholar] [CrossRef] [Scilit]
- Mlawer, E.; Taubman, S.; Brown, P.; Iacono, M.; Clough, S. Radiative transfer for inhomogeneous atmospheres: RRTM, a validated correlated-k model for the longwave. J. Geophys. Res. Atmos. 1997, 102, 16663–16682. [Google Scholar] [CrossRef] [Scilit]
- Lin, Y.; Farley, R.; Orville, H. Bulk Parameterization of the Snow Field in a Cloud Model. J. Clim. Appl. Meteorol. 1983, 22, 1065–1092. [Google Scholar] [CrossRef] [Scilit]
- Grell, G.; Dévényi, D. A generalized approach to parameterizing convection combining ensemble and data assimilation techniques. Geophys. Res. Lett. 2002, 29, 38-1–38-4. [Google Scholar] [CrossRef] [Scilit]
- National Centers for Environmental Prediction. NCEP GFS 0.25 Degree Global Forecast Grids Historical Archive; National Center for Atmospheric Research, Computational and Information Systems Laboratory: Boulder, CO, USA, 2015. [CrossRef] [Scilit]
- Maronga, B.; Gryschka, M.; Heinze, R.; Hoffmann, F.; Kanani-Sühring, F.; Keck, M.; Ketelsen, K.; Letzel, M.; Sühring, M.; Raasch, S. The Parallelized Large-Eddy Simulation Model (PALM) version 4.0 for atmospheric and oceanic flows: Model formulation, recent developments, and future perspectives. Geosci. Model Dev. 2015, 8, 2515–2551. [Google Scholar] [CrossRef] [Scilit]
- Schumann, U. Subgrid scale model for finite-difference simulations of turbulence in plane channels and annuli. J. Comput. Phys. 1975, 18, 376–404. [Google Scholar] [CrossRef] [Scilit]
- Dupont, S.; Brunet, Y. Coherent structures in canopy edge flow: A large-eddy simulation study. J. Fluid Mech. 2009, 630, 93–128. [Google Scholar] [CrossRef] [Scilit]
- Gery, M.; Whitten, G.; Killus, J.; Dodge, M. A photochemical kinetics mechanism for urban and regional scale computer modelling. J. Geophys. Res. 1989, 94, 12925–12956. [Google Scholar] [CrossRef] [Scilit]
- Krajzewicz, D.; Erdmann, J.; Behrisch, M.; Bieker, L. Recent Development and Applications of SUMO—Simulation of Urban Mobility. Int. J. Adv. Syst. Meas. 2012, 5, 128–138. [Google Scholar]
- San Jose, R.; Perez-Camanyo, J.L. High-Performance Computing Urban Air Pollution 3D Simulation with CFD PALM4U. In Environment and Sustainable Development; Ujikawa, K., Ishiwatari, M., Hullebusch, E.v., Eds.; Springer: Singapore, 2023; pp. 195–208. [Google Scholar] [CrossRef] [Scilit]
- San Jose, R.; Perez-Camanyo, J.L. Modelling effects of type of trees on urban air pollution with a computational fluid dynamics model. Euro-Mediterr. J. Environ. Integr. 2022, 7, 381–389. [Google Scholar] [CrossRef] [Scilit]
- Heus, T.; van Heerwaarden, C.; Jonker, H.; Pier Siebesma, A.; Axelsen, S.; van den Dries, K.; Geoffroy, O.; Moene, A.F.; Pino, D.; de Roode, S.R.; et al. Formulation of the Dutch Atmospheric Large-Eddy Simulation (DALES) and overview of its applications. Geosci. Model Dev. 2010, 3, 415–444. [Google Scholar] [CrossRef] [Scilit]
- Bździuch, P.; Bogacki, M.; Oleniacz, R. Street Canyon Vegetation—Impact on the Dispersion of Air Pollutant Emissions from Road Traffic. Sustainability 2024, 16, 10700. [Google Scholar] [CrossRef] [Scilit]

Disclaimer/Publisher’s Note: The statements, opinions and data contained in all publications are solely those of the individual author(s) and contributor(s) and not of MDPI and/or the editor(s). MDPI and/or the editor(s) disclaim responsibility for any injury to people or property resulting from any ideas, methods, instructions or products referred to in the content. |
© 2026 by the authors. Licensee MDPI, Basel, Switzerland. This article is an open access article distributed under the terms and conditions of the Creative Commons Attribution (CC BY) license.