


Abstract
Glioma is the most common primary malignant brain tumor in adults, and accurate determination of isocitrate dehydrogenase (IDH) mutation status is important for diagnosis, treatment planning, and prognostic assessment. Currently, definitive IDH status determination relies on molecular analysis of tumor tissue obtained through biopsy or surgical resection, motivating the development of accurate, interpretable, and non-invasive imaging biomarkers. This study proposes an explainable multimodal generative framework for IDH mutation prediction using multiparametric magnetic resonance imaging (MRI), radiomics, and clinical information. The framework employs a self-supervised 3D convolutional neural network (CNN) to learn imaging representations, a dedicated encoder for radiomic features, and late fusion to construct a unified multimodal representation. A Conditional Variational Autoencoder (CVAE) is used for minority-class feature-space augmentation, while a Generalized Additive Model with Interactions (GAMI-Net) provides intrinsically interpretable classification without relying on post hoc explanation methods. Experiments were conducted on 622 patients with diffuse glioma from the University of Texas Southwestern Medical Center, comprising a training cohort of 380 patients, a validation cohort of 96 patients, and a held-out temporal test cohort of 146 patients. On the temporal test cohort, the proposed framework achieved an area under the receiver operating characteristic curve (AUC) of 0.9519 (95% CI: 0.9158–0.9802), an accuracy of 87.7%, and a macro F1-score of 0.847, with higher discrimination than the evaluated DenseNet169-3D and ConvNeXt imaging-only baselines. Intrinsic explainability analysis identified contributions from imaging, radiomic, and clinical information, while global effect functions revealed nonlinear relationships between model features and predicted IDH mutation probability. External evaluation on an independent UCSD cohort showed lower discrimination (AUC = 0.675, 95% CI: 0.513–0.822), highlighting a substantial cross-institutional generalization gap. Overall, the findings demonstrate that the proposed framework combines strong internal temporal discrimination with intrinsic and generative interpretability, while the external results emphasize the need for further multi-center validation and improved robustness to domain shift before clinical deployment.
1. Introduction
Gliomas represent the most common primary malignant tumors of the central nervous system, and there is significant molecular and clinical heterogeneity. The recent progress in molecular pathology has led to the development of a molecular classification system for the diagnosis of glioma, taking the diagnosis away from a purely histological process. Isocitrate dehydrogenase (IDH) mutation status is one of the most significant markers in the diagnosis and prognosis of gliomas and for therapeutic decision making [1,2]. The overall survival period for patients with IDH-mutant glioma is typically longer than for patients with IDH-wild type gliomas, and the patients with IDH-mutant gliomas are likely to have a more gradual progression of the disease, better treatment response, and better prognosis. Therefore, it is crucial to correctly identify the mutation status of IDH in modern neuro-oncology [3].
In the present, the mutation status of IDH is determined by tissue biopsy or surgery to remove the tumor, followed by molecular and pathological analysis of the cancer’s tissue [4]. Some of these techniques can give certain diagnoses, but they are invasive, expensive, time consuming, and not always practical, due to the location of the tumor or the condition of the patient. In addition, biopsies only examine a small part of the tumor and may miss the heterogeneity of the tumor. Such restrictions have spurred significant research interest in finding non-invasive imaging biomarkers that could predict molecular properties directly from the routinely acquired MRI (magnetic resonance imaging).
Multiparametric MRI offers complementary structural and physiological information about gliomas by using a number of different imaging sequences, namely pre-contrast T1-weighted (T1w), post-contrast T1-weighted (T1w-CE), T2-weighted (T2w), and T2-weighted fluid-attenuated inversion recovery (T2w-FLAIR) [5]. Deep learning has shown great potential for learning intricate features from such modalities and has been used to predict molecular markers, including IDH mutation, MGMT promoter methylation, and 1p/19q co-deletion [6]. There are several neuro-oncology studies that have demonstrated high predictive performance using convolutional neural network (CNN) models, transformer-based models, and multimodal fusion networks. However, most current techniques are primarily concerned with accuracy in classification and have limited interest in the explainability.
One of the biggest challenges impeding the clinical use of artificial intelligence (AI) in medical imaging is the lack of interpretability. Transparency of reasoning to the radiologist and neuro-oncologist is required for clinical decision support systems to explain how the prediction is obtained, and if it is, why this prediction is a correct one and whether it is in line with known disease characteristics. Technology of explainable artificial intelligence (XAI) has thus gained more importance, including gradient-weighted Class Activation Mapping (Grad-CAM) [7], SHapley Additive exPlanations (SHAP) [8], and Local Interpretable Model-agnostic Explanations (LIME) [9], and attention visualization. However, these approaches are often used as a visualization tool after the fact which are not well quantified. Most studies only show qualitative heatmaps and do not assess if the areas of the images highlighted are anatomically relevant tumor structures. Consequently, the validity and usefulness of many of the existing explanations is questionable.
In current studies, there is also the lack of integrating heterogeneous clinical and imaging information. Demographic information (patient age, sex, and tumor site) is known to strongly correlate with the status of the IDH mutation, but most imaging-based models do not explicitly include these features, or they include them simply concatenated in a linear fashion. They are often not capable of representing the complex cross-modal relations and do not yield much insight into the relative importance of each modality for individual patients. Furthermore, uncertainty about predictions is not often measured and is critical for clinical decision support.
To address these challenges, we propose an explainable generative machine learning framework for non-invasive prediction of IDH mutation status from standard multimodal MRI radiomics. The proposed framework combines a Conditional Variational Autoencoder (CVAE) [10] with a Generalized Additive Model with Interactions (GAMI-Net) [11] to jointly address class imbalance, predictive performance, and model interpretability. The CVAE generates synthetic feature representations of the minority IDH-mutant class, mitigating data imbalance while preserving the underlying radiomic feature distribution. These synthetic samples are subsequently used to augment classifier training without requiring additional patient data.
Unlike conventional black-box models that rely on post hoc explanation methods, GAMI-Net provides intrinsic interpretability by decomposing predictions into additive feature contributions and learned pairwise interactions. Furthermore, the generative nature of the CVAE enables patient-specific counterfactual explanations, latent-space analysis, and population-level feature comparisons, providing clinically meaningful insights beyond conventional feature importance scores. These complementary explanations allow clinicians to understand not only which imaging characteristics influence prediction but also how radiomic features would change under alternative molecular states.
The proposed framework was evaluated on a retrospective cohort of 622 diffuse glioma patients from the University of Texas Southwestern Medical Center (UTSW) [12] using fixed training, validation, and temporally separated test cohorts to better reflect prospective clinical deployment. The proposed multimodal framework was compared with two state-of-the-art imaging-based deep learning models, DenseNet169-3D and ConvNeXt-Tiny, while its interpretability was assessed through global feature importance and nonlinear global effect analysis provided by the intrinsically interpretable GAMI-Net classifier.
The main contributions of this work are summarized as follows:
- We propose an explainable multimodal generative framework that integrates self-supervised 3D CNN representations, radiomics, and clinical information for non-invasive prediction of IDH mutation status from routine multiparametric MRI.
- We introduce a multimodal learning strategy that combines imaging, radiomics, and clinical representations through late feature fusion, enabling complementary information from multiple sources to be exploited within a unified feature space.
- We employ a Conditional Variational Autoencoder (CVAE) to learn the class-conditional distribution of the fused feature representation and generate realistic synthetic minority-class samples, thereby mitigating class imbalance through generative augmentation.
- We integrate a Generalized Additive Model with Interactions (GAMI-Net) as the final classifier, providing intrinsic explainability through additive feature contributions and pairwise interactions without relying on post hoc explanation methods such as SHAP or Grad-CAM.
- We demonstrate the effectiveness of the proposed framework on a held-out temporal test cohort, achieving superior predictive performance compared with DenseNet169-3D and ConvNeXt while providing transparent and clinically meaningful explanations through global feature importance and nonlinear effect analysis.
The remainder of this paper is organized as follows. The Literature Review presents recent advances in MRI-based IDH mutation prediction, multimodal learning, generative modeling, and explainable artificial intelligence. The Methodology describes the proposed framework, including the multimodal architecture, feature fusion strategy, Conditional Variational Autoencoder (CVAE), GAMI-Net classifier, and experimental design. The Results section reports the predictive performance and explainability analyses. The Discussion examines the clinical implications, limitations, and future research directions. Finally, the Conclusion summarizes the main findings and contributions of this study.
2. Literature Review
2.1. MRI-Based Prediction of IDH Mutation Status
The mutation of isocitrate dehydrogenase (IDH) is a major molecular marker in diffuse glioma and its presence is linked to tumor biology, prognosis, and response to therapy, so it was included in the World Health Organization (WHO) classification system for the disease in 2021. The traditional method of diagnosis, however, relies on tissue biopsy or surgical removal of the tumor, so many studies have focused on finding a way to assess IDH mutation status without these invasive procedures using MRI.
Multiparametric MRI (including T1-weighted (T1), contrast-enhanced T1-weighted (T1CE), T2-weighted (T2), and fluid-attenuated inversion recovery (FLAIR) sequences) can provide complementary information on tumor morphology, vascularity, and peritumoral edema. Initial studies used image assessment methods in a qualitative manner, while recent studies have been based on quantitative descriptors of shape, intensity, and texture extracted from images using radiomics and analyzed using machine learning classifiers such as logistic regression, support vector machines, random forests, and gradient boosting [13,14].
Recently, deep learning techniques, such as convolutional neural networks (CNN), transformers, and multimodal architectures, have shown promising results in predicting IDH using MRI images without relying on manual feature extraction and feature engineering [15,16]. Most of the current methods, however, focus on the predictive accuracy while using post hoc explainability methods including Grad-CAM and SHAP that can offer only partial insights into the biological basis of predictions. Moreover, the issue of class imbalance, explanation stability, and clinical interpretability are still present, which serves as a motivation to develop explainable and generative learning frameworks.
2.2. Radiomics and Machine Learning for Glioma Characterization
Radiomics has emerged as a powerful approach for quantitative analysis of medical images by converting tumor regions into high-dimensional feature representations [17,18]. Typical radiomic features include first-order intensity statistics, shape descriptors, and higher-order texture features that capture tumor heterogeneity. Combined with machine learning algorithms such as logistic regression, support vector machines (SVM), random forests, and gradient boosting [19], radiomics has demonstrated promising performance for predicting molecular biomarkers, tumor grade, and patient prognosis. Compared with deep learning approaches, radiomics requires smaller training datasets and provides features that are often easier to interpret clinically [20]. However, handcrafted feature engineering remains dependent on tumor segmentation quality, feature selection strategies, and dataset characteristics. In addition, class imbalance and limited model interpretability remain important challenges, motivating the integration of generative modeling and intrinsically interpretable classifiers.
2.3. Generative Models in Medical Imaging
Generative artificial intelligence has attracted increasing attention in medical imaging because of its ability to model complex data distributions and generate realistic synthetic samples. Generative adversarial networks (GANs) [21], variational autoencoders (VAEs) [22], and diffusion models have been successfully applied to MRI synthesis, image reconstruction, super-resolution, modality translation, and data augmentation. In neuroimaging, these models have primarily been used to compensate for limited training data or improve segmentation performance. However, their application to molecular biomarker prediction remains relatively limited. Furthermore, most existing studies employ generative models solely for data augmentation without exploiting the learned latent representations to provide clinically meaningful explanations. This represents an important opportunity for integrating generative modeling with explainable artificial intelligence to improve both predictive performance and clinical interpretability.
2.4. Explainable Artificial Intelligence in Neuro-Oncology
The growing adoption of artificial intelligence in medical imaging has highlighted the importance of explainability for clinical decision support. Explainable artificial intelligence (XAI) aims to increase transparency by providing insights into the reasoning behind model predictions. Widely used post hoc techniques include Gradient-weighted Class Activation Mapping (Grad-CAM), SHapley Additive exPlanations (SHAP), and Local Interpretable Model-agnostic Explanations (LIME), which identify influential image regions or input features after model training. Although these methods improve model interpretability, they do not alter the underlying prediction process and may generate explanations that are unstable or difficult to validate clinically. More recently, intrinsically interpretable models such as Generalized Additive Models (GAMs) and Generalized Additive Models with Interactions (GAMI-Net) have been proposed to provide transparent predictions by directly modeling feature contributions and interactions. Despite their advantages, these models remain underexplored in neuro-oncology and have rarely been combined with generative learning frameworks.
2.5. Research Gap and Motivation
Although considerable progress has been made in MRI-based prediction of glioma molecular biomarkers, several important limitations remain. Existing studies often prioritize predictive accuracy while relying on post hoc explanation techniques that provide limited insight into the underlying biological reasoning. Generative models are predominantly used for data augmentation rather than generating clinically meaningful explanations, and intrinsically interpretable learning algorithms have received relatively little attention in molecular glioma classification. Furthermore, few studies simultaneously address class imbalance, model transparency, and clinical plausibility within a unified framework. These limitations motivate the proposed approach, which combines a Conditional Variational Autoencoder (CVAE) with a Generalized Additive Model with Interactions (GAMI-Net) to jointly improve classification performance, generate clinically interpretable explanations, and provide patient-specific counterfactual reasoning for non-invasive IDH mutation prediction.
3. Materials and Methods
This study proposes an explainable multimodal generative framework for predicting isocitrate dehydrogenase (IDH) mutation status from multiparametric magnetic resonance imaging (MRI), radiomics, and clinical information. The MRI preprocessing pipeline is illustrated in Figure 1, while the overall proposed framework is presented in Figure 2. The framework comprises six main stages: (1) multimodal feature extraction through self-supervised MRI representation learning, radiomics encoding, and clinical feature integration; (2) multimodal late fusion to construct a unified feature representation; (3) class balancing using a Conditional Variational Autoencoder (CVAE); (4) intrinsically interpretable classification using a Generalized Additive Model with Interactions (GAMI-Net); (5) evaluation on a held-out temporal test cohort; and (6) explainability analysis through global feature importance and nonlinear effect visualization. The following subsections describe the study cohort, preprocessing pipeline, multimodal architecture, feature fusion strategy, Conditional Variational Autoencoder, GAMI-Net classifier, experimental design, and evaluation methodology.
Figure 1.
MRI preprocessing pipeline. Each subject underwent skull stripping using HD-BET, N4 bias field correction, rigid co-registration of all MRI contrasts to the T1-weighted contrast-enhanced (T1CE) image, non-linear registration to the MNI152 standard space, and z-score intensity normalization prior to radiomic feature extraction.
Figure 2.
Overview of the proposed multimodal generative framework for IDH mutation prediction. The framework integrates three complementary feature streams: (1) a self-supervised 3D CNN that learns latent imaging representations from tumor-centered multiparametric MRI, (2) a self-supervised multilayer perceptron (MLP) that encodes radiomic and morphological features, and (3) a clinical branch incorporating age and scanner strength. The resulting latent representations are concatenated through multimodal late fusion to form a unified feature vector, which is modeled by a conditional variational autoencoder (CVAE) for class-conditional synthetic minority sample generation. The balanced multimodal feature set is subsequently classified using a Generalized Additive Model with Interactions (GAMI-Net), providing intrinsically interpretable predictions through additive feature contributions and pairwise interaction effects.
3.1. Dataset Description
The University of Texas Southwestern Glioma (UTSW-Glioma) dataset [12] is a retrospective single-institution cohort consisting of 625 patients diagnosed with diffuse glioma between 2006 and 2023. For each patient, four pre-operative magnetic resonance imaging (MRI) sequences are provided in NIfTI format: pre-contrast T1-weighted (T1w), post-contrast T1-weighted (T1GD), T2-weighted (T2w), and T2-weighted Fluid-Attenuated Inversion Recovery (T2w-FLAIR). The dataset also includes structured clinical and molecular information comprising patient demographics, tumor type and grade, IDH mutation status, IDH testing method, MGMT promoter methylation status, 1p/19q co-deletion status, scanner manufacturer, scanner model, scanner field strength, and tumor segmentation availability.
Among the 625 patients, IDH mutation status is available for 622 (99.5%), including 176 IDH-mutant (28.3%) and 446 IDH-wild-type (71.7%) cases, resulting in a class imbalance ratio of approximately 2.53:1. tumor grades are predominantly grade 4 (67.0%), followed by grade 2 (16.2%) and grade 3 (15.6%). MRI acquisitions were performed using scanners from six manufacturers (Siemens, GE, Philips, Hitachi, Toshiba, and unreported systems) with field strengths ranging from 0.3 T to 3 T. Manual tumor segmentations were reported as available for 359 of the 625 patients (57.4%), while the remaining 266 patients (42.6%) did not have manually refined segmentation masks. The absence of a manual segmentation does not necessarily indicate the absence of an automatically generated segmentation.
Of the original 625 patients, three were excluded because of missing IDH mutation labels, resulting in a final analytical cohort of 622 patients. The cohort was divided into training (), validation (), and temporally held-out test () subsets.
Table 1 summarizes the demographic and molecular characteristics of the dataset.
Table 1.
Summary of the UTSW-Glioma dataset () and the final IDH prediction cohort ().
3.2. Preprocessing Pipeline
3.2.1. Clinical Data Preprocessing
The clinical stream incorporated two variables with established relevance to glioma characterization: patient age at imaging and scanner field strength. Age has consistently been associated with IDH mutation status, with IDH-mutant gliomas occurring more frequently in younger patients, while scanner field strength was included to account for potential variations in image acquisition.
Both variables were normalized to the range using MinMax scaling, with the scaling parameters estimated from the training set and subsequently applied to the validation and test cohorts to prevent information leakage. No missing values were present for either variable; therefore, no imputation was required. The resulting clinical feature vector consisted of two normalized features that were concatenated with the MRI and radiomics latent representations during multimodal late fusion.
3.2.2. MRI Preprocessing and Scanner Harmonization
The MRI preprocessing pipeline is illustrated in Figure 1. The preprocessing workflow consisted of the following steps:
- Skull stripping: Brain extraction was performed using HD-BET to remove non-brain tissue.
- Bias field correction: N4ITK bias field correction was applied to compensate for MRI intensity inhomogeneity.
- Co-registration: All four contrast volumes per patient were rigidly co-registered to the T1GD reference image using ANTs.
- MNI space alignment: Volumes were non-linearly registered to the MNI152 standard brain template at 1 mm isotropic resolution.
- Intensity normalization: Voxel intensities were z-score normalized per volume.
Given the 17-year acquisition span and multi-manufacturer heterogeneity (field strengths 0.3–3 T), scanner-induced batch effects were corrected using ComBat harmonization [23], treating scanner manufacturer and field strength as batch covariates. ComBat was applied to extracted volumetric features rather than raw voxel intensities to avoid over-correction of biologically meaningful signal. Tumor segmentation masks were used to define regions of interest for radiomic feature extraction and tumor-centered image cropping. Manual segmentation availability was reported for 359 patients in the original cohort, while 266 patients did not have manually refined masks.
The held-out temporal test cohort (2019–2023; ) was evaluated using automatically generated segmentation masks. Manually refined segmentations were confined to the earlier development period.
Consequently, segmentation source was temporally confounded with acquisition period, preventing a paired manual-versus-automatic segmentation comparison within the held-out temporal test cohort. The isolated effect of segmentation source on test performance could therefore not be quantified.
3.3. Radiomic Feature Extraction
Radiomic features were extracted from the preprocessed MRI volumes using PyRadiomics (version 3.0.1) [24], a standardized open-source library implementing the Image Biomarker Standardization Initiative (IBSI) feature definitions [25]. Feature extraction was performed on two contrast sequences known to carry complementary IDH-relevant information: the T1-weighted contrast-enhanced (T1CE) sequence, which reflects blood–brain barrier integrity and tumor enhancement patterns, and the T2-weighted (T2w) sequence, which captures peritumoral edema extent and infiltration.
3.3.1. Morphological Features
Ten hand-crafted morphological features were derived directly from the tumor segmentation mask, computed on resampled volumes prior to intensity normalization to preserve absolute volumetric measurements. These included total tumor volume, enhancing tumor volume, peritumoral edema volume, necrotic core volume, and their respective ratios to total tumor volume (enhancement ratio, edema ratio, and necrosis ratio). Two signal intensity features were additionally computed within each tumor subregion: the mean T1CE signal in the enhancing core (mean_t1ce_enhance), reflecting contrast uptake intensity, and the ratio of mean T2 signal to mean T1CE signal within the whole tumor (t2_t1ce_ratio), which captures the relative infiltrative burden relative to enhancement. A further feature (flair_t2_oedema) quantified the ratio of mean FLAIR to mean T2 signal within the peritumoral edema region. These features were selected based on established IDH imaging correlates: IDH-mutant gliomas are characterized by low or absent contrast enhancement, elevated T2 signal relative to T1CE, and more homogeneous signal distribution compared to IDH wild-type glioblastomas.
3.3.2. Texture and Shape Features
Radiomic texture and shape features were extracted from T1CE and T2 volumes using the whole-tumor binary mask (labels 1, 2, and 4 unified). The following feature classes were computed: first-order statistics, gray-level co-occurrence matrix (GLCM), gray-level run-length matrix (GLRLM), gray-level size-zone matrix (GLSZM), gray-level dependence matrix (GLDM), neighboring gray-tone difference matrix (NGTDM), and shape descriptors. Extraction parameters followed IBSI guidelines with a fixed bin width of 25 intensity units, no resampling (features extracted in native 1 mm isotropic space), and outlier removal at ±3 standard deviations. A total of 214 radiomic features were initially extracted across both contrasts.
3.3.3. Feature Selection and Preprocessing
Radiomic and morphological features were subjected to completeness filtering using exclusively the training cohort (). Features with non-missing values in more than 30% of training subjects (at least 115 patients) were retained. This threshold was selected to balance feature coverage with data quality, particularly because differences in tumor subregion delineation may affect the completeness of extracted features.
Following completeness filtering, missing values were imputed using the median of each feature calculated exclusively from the training cohort. The remaining features were then subjected to variance-based filtering, using a threshold of 0.01 to remove near-constant features. Both the imputation statistics and the retained feature indices were determined using training data only and subsequently applied unchanged to the validation and test cohorts.
Following feature selection, the imaging-derived feature set comprised 150 features per subject: 10 morphological descriptors and 140 radiomic texture and shape features, including 107 features extracted from T1CE and 33 from T2.
Two additional variables were incorporated into the clinical and acquisition-related stream: patient age at imaging and MRI scanner field strength. Consequently, the complete set of handcrafted imaging-derived and clinical/acquisition variables comprised 152 features per subject (150 imaging-derived features and 2 clinical/acquisition variables).
The IDH testing method was retained exclusively as descriptive metadata and was excluded from all predictive feature sets to avoid introducing a potential proxy for diagnostic era or molecular status.
All retained variables were normalized to the range using MinMax scaling. The scaling parameters were estimated exclusively from the training cohort (2006–2018, ) and applied without refitting to the validation and temporally held-out test cohorts.
To prevent information leakage, all data-dependent preprocessing operations, including completeness filtering, median imputation, variance-based feature selection, and normalization, were fitted exclusively on the training cohort. No information from the validation or test cohorts was used to determine feature inclusion or preprocessing parameters.
The resulting 150-dimensional imaging-derived feature vector was subsequently processed by the radiomics autoencoder to obtain a 64-dimensional latent representation. The two normalized clinical/acquisition variables were incorporated separately during multimodal late fusion, together with the 64-dimensional CNN imaging representation.
The resulting fused multimodal representation therefore comprised 130 features:
where , , and .
The complete feature extraction and selection procedure is summarized in Table 2.
Table 2.
Summary of handcrafted imaging-derived and clinical/acquisition feature groups before and after feature selection. Radiomic features were filtered using a completeness threshold of >30% and a variance threshold of 0.01.
3.4. Leakage Prevention and Training-Only Fitting
To prevent information leakage, all data-dependent preprocessing operations were fitted exclusively using the training cohort. In particular, missing-value imputation statistics, variance-based feature filtering, Min–Max scaling parameters, and ComBat harmonization parameters were estimated from the training data and then applied unchanged to the validation and temporal test cohorts. The self-supervised CNN and radiomics encoders were pretrained using training subjects only. The CVAE was fitted only to training representations, and synthetic samples were generated exclusively for augmentation of the training cohort. No synthetic observations were added to the validation or test cohorts. Model selection, early stopping, and decision-threshold selection were performed using the validation cohort; the temporal test cohort was accessed only for final locked evaluation.
IDH testing method was excluded from all predictive feature sets. Although available as dataset metadata, it may encode diagnostic era or other information related to molecular testing practice and could therefore act as a leakage-prone proxy. Scanner field strength was retained as an acquisition-related covariate and is specifically examined in the ablation analyses.
3.5. Proposed Explainable Generative Framework
The proposed framework integrates three complementary streams into a unified multimodal architecture, as illustrated in Figure 2. A compact 3D convolutional encoder (CNN3DEncoder, ∼250 K parameters) operating on tumor-centered crops extracts 64-dimensional imaging representations from four MRI contrasts (T1, T1CE, T2, and FLAIR). To maximize the utility of the limited training cohort (), the encoder is first pretrained in a self-supervised manner by reconstructing tumor-centered MRI crops using a paired decoder, thereby learning robust anatomical representations without requiring class labels. The pretrained encoder is subsequently fine-tuned for downstream classification using MixUp augmentation and cosine annealing with warm restarts.
In parallel, a radiomics multilayer perceptron (MLP) encoder projects handcrafted morphological and radiomic features into a second 64-dimensional latent representation through unsupervised reconstruction learning. Two normalized clinical variables (age and scanner strength) are incorporated alongside the imaging and radiomics embeddings. The three feature streams are concatenated to form a unified 130-dimensional multimodal representation consisting of 64 MRI latent features, 64 radiomics latent features, and 2 clinical features. To address class imbalance, a Conditional Variational Autoencoder (CVAE) learns the class-conditional distribution ∣ over the fused feature space. The CVAE models the joint distribution of multimodal features and generates synthetic IDH-mutant feature vectors that preserve the multivariate covariance structure of the original data. Synthetic samples are used exclusively to balance the training set prior to classifier training, while no clipping is applied to the generated features in order to preserve the natural dynamic range of the CNN latent representations.
Finally, the balanced multimodal feature set is used to train a Generalized Additive Model with Interactions (GAMI-Net), which provides intrinsically interpretable predictions by decomposing the decision function into additive univariate subnetworks and pairwise interaction terms without requiring post hoc explanation methods. By combining multimodal representation learning, class-conditional generative augmentation, and intrinsic interpretability within a unified framework, the proposed approach achieves strong predictive performance on the independent test cohort, with an area under the receiver operating characteristic curve (AUC) of 0.9519 (95% confidence interval: 0.9158–0.9802), while simultaneously providing transparent and clinically meaningful explanations of the model’s decision-making process.
3.6. 3D CNN Stream
The imaging branch operates on tumor-centered volumetric patches of size extracted from four co-registered MRI modalities (T1, T1CE, T2, and FLAIR). For each subject, the tumor centroid is identified from the available segmentation mask, and a fixed-size cubic patch is cropped to ensure that the network focuses on the lesion and its immediate surroundings while reducing irrelevant background information.
A lightweight three-dimensional convolutional neural network (CNN3DEncoder) is employed to learn compact imaging representations. The encoder follows a four-stage convolutional architecture with channel progression , incorporating residual blocks, batch normalization, and ReLU activation functions. The complete encoder contains approximately 250K trainable parameters, making it well suited for the relatively limited training cohort ().
Training is performed in two stages. First, the encoder is paired with a symmetric transposed-convolution decoder and pretrained in a self-supervised manner by minimizing the mean squared error (MSE) between the input and reconstructed tumor patches. This reconstruction task enables the encoder to learn anatomy-aware representations without requiring molecular labels. After pretraining, the decoder is discarded and the encoder is fine-tuned for downstream classification using MixUp augmentation (), cosine annealing with warm restarts, and early stopping based on the validation loss. Finally, global average pooling followed by a fully connected projection layer produces a 64-dimensional imaging representation,
which serves as the MRI feature embedding for multimodal fusion.
3.7. Radiomics Stream
The radiomics branch captures complementary quantitative information derived from handcrafted tumor descriptors. Features include tumor morphology, first-order intensity statistics, and higher-order texture descriptors, including Gray-Level Co-occurrence Matrix (GLCM), Gray-Level Size Zone Matrix (GLSZM), and Gray-Level Run Length Matrix (GLRLM) features extracted from T1CE and T2. Morphological signal-ratio descriptors additionally used T1CE, T2, and FLAIR where explicitly defined. Prior to encoding, missing values are imputed using median imputation, low-variance features are removed, and all variables are normalized using Min-Max scaling.
To obtain a compact representation, the radiomic feature vector is processed by a multilayer perceptron (MLP) autoencoder with architecture
Similar to the imaging branch, the radiomics encoder is pretrained in a self-supervised manner by reconstructing the original feature vector through a paired decoder using an MSE reconstruction objective. This unsupervised learning strategy preserves the intrinsic structure of the radiomic feature space while avoiding direct optimization towards the classification labels. The network is trained using AdamW optimization with cosine annealing for 200 epochs. The encoder outputs a compact 64-dimensional radiomics representation,
which complements the deep imaging features with explicit tumor morphology and texture information.
3.8. Clinical Stream
The clinical and acquisition-related branch incorporates two complementary variables: patient age at imaging and MRI scanner field strength. Patient age is a demographic characteristic associated with IDH mutation status, whereas scanner field strength is included as an acquisition-related covariate to account for potential differences in MRI acquisition characteristics.
Both variables are normalized to the interval using Min-Max scaling, with scaling parameters estimated exclusively from the training cohort and subsequently applied unchanged to the validation and test cohorts.
Unlike the imaging and radiomics branches, no additional encoder is employed because of the low dimensionality of these variables. Instead, the clinical and acquisition-related information is represented directly as
This compact representation provides complementary patient-level and acquisition-related information alongside the learned imaging and radiomics representations.
During multimodal late fusion, the two variables are concatenated with the 64-dimensional CNN embedding and the 64-dimensional radiomics embedding, producing a unified 130-dimensional feature representation.
The additive structure of GAMI-Net enables the individual contributions of patient age and scanner field strength to be examined explicitly, supporting the interpretation of their respective associations with predicted IDH mutation status.
Importantly, scanner field strength is interpreted as an acquisition-related covariate rather than a biological determinant of IDH mutation.
3.9. Multimodal Late Fusion
The imaging, radiomics, and clinical branches provide complementary representations of the tumor. The 64-dimensional CNN latent feature vector captures imaging characteristics learned directly from multiparametric MRI, while the 64-dimensional radiomics latent vector encodes handcrafted morphological and texture descriptors. Two normalized clinical variables (patient age and scanner field strength) provide additional demographic information.
The three feature streams are integrated through late fusion by simple feature concatenation,
where , , and . Consequently, the fused representation consists of 64 imaging features, 64 radiomics features, and 2 clinical variables.
Late fusion was selected because it allows each modality to be learned independently using its most appropriate self-supervised objective before multimodal integration. This strategy preserves the complementary information extracted by each branch while avoiding interference during feature learning. In addition, the fused representation maintains a clear correspondence between imaging, radiomics, and clinical features, which facilitates the intrinsic interpretability provided by the downstream GAMI-Net classifier.
The resulting 130-dimensional feature vector is subsequently used as input to the Conditional Variational Autoencoder (Section 3.10) for class-conditional synthetic augmentation. The balanced multimodal representation is then provided to the GAMI-Net classifier (Section 3.11) for final IDH mutation prediction.
3.10. Conditional Variational Autoencoder
The fused multimodal representation,
exhibits substantial class imbalance, with IDH wild-type tumors considerably outnumbering IDH-mutant tumors in the training cohort. Conventional oversampling techniques, such as Synthetic Minority Over-sampling Technique (SMOTE), generate synthetic samples through local linear interpolation and therefore do not adequately model the complex joint distribution of multimodal features. To overcome this limitation, we employ a Conditional Variational Autoencoder (CVAE) that learns the class-conditional distribution
thereby enabling the generation of synthetic feature vectors that preserve the multivariate covariance structure of each IDH class.
3.10.1. Network Architecture
The encoder is implemented as a multilayer perceptron (MLP) that estimates the approximate posterior
where the class label is represented as a one-hot vector () and concatenated with the fused feature vector before encoding. The encoder consists of fully connected layers with dimensions
followed by two independent linear layers that estimate the latent mean and log-variance . A latent representation
is subsequently sampled using the reparameterization trick.
The decoder mirrors the encoder and models the conditional likelihood
through fully connected layers
reconstructing the original multimodal feature vector from the latent representation and the conditioning label.
3.10.2. Training Objective
The CVAE is trained by optimizing the conditional evidence lower bound (ELBO), which balances accurate reconstruction of the input features with regularization of the learned latent distribution. The conditional ELBO is expressed as
where denotes the approximate posterior, denotes the conditional decoder distribution, and the latent prior is defined as
In practice, the network is optimized by minimizing the negative ELBO, implemented using a mean squared reconstruction error and a weighted Kullback–Leibler (KL) divergence:
A weighting coefficient of was adopted to balance reconstruction fidelity and latent-space regularization. The CVAE was optimized using AdamW with a learning rate of and weight decay of , together with cosine annealing.
The CVAE was trained for a fixed duration of 400 epochs without early stopping. Training and validation losses were monitored throughout optimization to assess convergence. The best validation loss recorded during training was 0.0171.
The reported training and validation curves correspond to the minimized CVAE loss, comprising the mean squared reconstruction error and the weighted Kullback–Leibler divergence. Consequently, decreasing loss values indicate improved optimization rather than a decrease in the ELBO.
3.10.3. Class-Conditional Feature Generation
After training, synthetic minority-class samples are generated by sampling
and decoding the latent representation while conditioning on the IDH-mutant class,
The number of generated samples is chosen to exactly compensate for the class imbalance in the training cohort, resulting in a balanced dataset containing 267 IDH wild-type and 267 IDH-mutant samples (534 samples in total).
Unlike conventional tabular augmentation methods, no clipping or bounding is applied to the generated feature vectors. Since the CNN latent features represent unconstrained continuous activations, restricting them to a predefined interval would artificially distort their underlying distribution and reduce the realism of the generated samples. The balanced multimodal feature set is subsequently used to train the GAMI-Net classifier.
3.10.4. Counterfactual Generation
The generative nature of the Conditional Variational Autoencoder (CVAE) enables the construction of patient-specific counterfactual representations in the multimodal feature space.
For each patient, the original 130-dimensional fused representation, comprising CNN-derived imaging features, radiomics embeddings, and clinical variables, is encoded into the CVAE latent space.
To generate a counterfactual representation, the latent representation is retained while the conditioning label is switched from IDH-wild-type to IDH-mutant, or vice versa. The decoder subsequently generates an alternative feature vector conditioned on the opposite molecular subtype.
The differences between the original and counterfactual feature vectors are examined to identify changes in the learned multimodal representations associated with the alternative IDH class.
Importantly, these counterfactuals are generated in the learned feature space rather than directly in MRI image space. Consequently, they should be interpreted as model-derived representations of alternative molecular conditions, rather than anatomically validated modifications of the original MRI scans.
This analysis provides complementary insights into the relationships learned by the generative model and addresses the following question:
“How would the patient’s multimodal feature representation differ if the tumor were conditioned on the opposite IDH mutation status?”
In addition, latent-space interpolation was performed to visualize gradual transitions between representations associated with IDH-wild-type and IDH-mutant tumors.
These analyses complement the intrinsic feature-level explanations provided by GAMI-Net while remaining exploratory, as the biological plausibility and clinical validity of the generated counterfactual representations have not been independently established.
3.11. GAMI-Net Classifier
The multimodal feature representations are classified using a Generalized Additive Model with Interactions (GAMI-Net) [11]. Unlike conventional black-box neural networks, GAMI-Net provides intrinsic interpretability by decomposing the prediction into additive contributions from individual features and a selected set of learned pairwise interactions. This structure enables direct examination of the model’s decision function without requiring post hoc explanation methods such as SHAP or LIME.
The predictive function can be expressed as
where denotes the fused multimodal feature vector, is the intercept, represents the learned nonlinear contribution of feature i, and models a selected pairwise interaction between features i and j. The set contains the feature interactions retained by GAMI-Net.
Each input feature is modeled using a dedicated neural subnetwork that learns its nonlinear contribution to the prediction, while additional subnetworks capture informative pairwise interactions.
The classifier was trained using AdamW optimization, cosine annealing, and early stopping based on validation performance.
To address class imbalance, the final GAMI-Net configuration combined CVAE-based minority-class augmentation with a class-weighted binary cross-entropy loss.
The CVAE generated 154 synthetic IDH-mutant feature representations, resulting in a balanced training set containing 267 IDH-mutant and 267 IDH-wild-type samples ().
Class weighting was additionally applied during classifier optimization in the final configuration.
The effects of alternative imbalance-handling strategies were investigated through ablation experiments, including training without resampling, class weighting alone, random oversampling, SMOTE, CVAE augmentation alone, and CVAE augmentation combined with weighted random sampling.
The final CVAE-augmented, class-weighted configuration achieved the highest AUC among the evaluated imbalance-handling strategies on the held-out temporal test cohort.
Beyond predicting IDH mutation status, GAMI-Net provides both global and patient-specific explanations through its learned additive feature contributions and pairwise interaction functions.
Because the fused representation preserves the origin of each feature, contributions can be grouped according to their respective information streams: CNN-derived imaging features, radiomics embeddings, and clinical/acquisition-related variables.
This enables the relative contributions of the three feature groups to be examined within the fitted predictive model.
Importantly, these contributions represent model-learned associations rather than causal relationships or independently validated biological mechanisms.
3.12. Explainability Analysis
3.12.1. Intrinsic Explanations
Global feature importance was derived directly from the GAMI-Net forward pass as normalized mean absolute subnetwork contributions across all test subjects:
At the patient level, the signed contributions are immediately available from the forward pass, providing individual-level attribution without additional computation. Partial dependence plots were generated for the top-ranked morphological features by evaluating over a grid of 100 equally spaced values with all other features held at their training set mean.
3.12.2. SHAP Comparison
Post hoc SHAP values were computed for the proposed GAMI-Net using KernelSHAP [8] with a single-sample background (training set mean) and 200 perturbation samples per test subject. TreeSHAP was applied to RF and GB baselines. Explanation consistency under input perturbation was quantified for all models producing feature-level attributions using the noise-perturbation stability metric:
where denotes the attribution of feature i for patient k under perturbation run r, computed across independent additive Gaussian perturbations (). The global consistency score is reported for each model.
3.12.3. Population-Level Generative Analysis
Population-level feature differences between IDH classes were quantified using the trained CVAE decoder. The feature delta was computed by decoding 500 samples from under each class label and taking the difference of means after inverse-transforming to original clinical units:
Generative saliency was computed as the Jacobian of the decoder with respect to the latent variable at , with per-feature saliency reported as the sum of absolute Jacobian values across latent dimensions.
3.13. Experimental Design
3.13.1. Data Partitioning
Experiments were conducted on the UTSW-Glioma dataset, comprising 622 adult patients with histopathologically confirmed diffuse glioma. Each subject included four co-registered MRI modalities (T1, T1CE, T2, and FLAIR), tumor segmentation masks, and corresponding molecular annotations, including IDH mutation status.
A fixed temporal partition was used. Patients acquired during 2006–2018 formed the development cohort, from which non-overlapping training () and validation () subsets were defined. Patients acquired during 2019–2023 formed the held-out temporal test cohort (). The validation cohort was used for hyperparameter optimization, early stopping, model selection, and decision-threshold selection. The temporal test cohort remained completely unseen until final evaluation.
No information from the temporal test cohort was used to estimate preprocessing parameters, perform feature selection or harmonization, train representation-learning models, generate synthetic samples, tune hyperparameters, select models, or determine classification thresholds. Because the development and temporal test cohorts were derived from the same UTSW institution, this evaluation represents internal temporal validation rather than external validation.
3.13.2. Comparison Methods
The proposed multimodal framework was compared with two deep learning baselines:
- DenseNet169-3D: A 3D DenseNet-169 operating directly on tumor-centered multiparametric MRI patches without radiomics, clinical information, self-supervised pretraining, or synthetic data augmentation [26].
- ConvNeXt: A 2D implementation based on the multimodal framework proposed by Du et al. [27]. Four MRI modalities were stacked as input channels, and patient-level predictions were obtained by averaging slice-level probabilities following the original implementation.
All models were trained and evaluated using the identical training, validation, and test partitions.
3.13.3. Ablation and Confounder Analyses
A predefined ablation analysis was designed to quantify the contribution of each component of the framework under the same training, validation, and temporal test partitions. The analysis includes age-only and clinical-only models; individual imaging and radiomics streams; imaging + radiomics fusion; the full multimodal model without age; and full-model variants without self-supervised pretraining, CVAE augmentation, or GAMI-Net. These experiments are intended to determine whether MRI and radiomic information provide predictive value beyond age and whether each architectural component contributes to performance.
3.13.4. Class-Imbalance and Synthetic-Data Comparisons
To evaluate the contribution of CVAE-based augmentation, seven class-imbalance handling strategies were compared using identical training, validation, and temporal test partitions: no resampling, class-weighted loss, random oversampling, SMOTE, CVAE augmentation alone, CVAE augmentation with class-weighted loss, and CVAE augmentation with weighted sampling.
The final proposed multimodal framework employed CVAE-based minority-class augmentation combined with a class-weighted classification loss. Specifically, 154 synthetic IDH-mutant feature vectors were generated using the CVAE, producing an augmented training set of 534 samples (267 IDH-mutant and 267 IDH-wild-type).
The class-weighted loss was applied during classifier training. All augmentation procedures were restricted to the training cohort, and model selection was performed using the validation cohort.
3.13.5. Statistical Analysis
Model performance was evaluated using the area under the receiver operating characteristic curve (AUC), accuracy, macro-averaged F1-score, sensitivity, and specificity. AUC was calculated directly from continuous patient-level prediction probabilities and was therefore independent of the classification threshold.
Decision thresholds for threshold-dependent metrics (accuracy, macro F1-score, sensitivity, and specificity) were selected exclusively using the validation cohort. For each model, the threshold that maximized Youden’s index on the validation cohort was subsequently fixed and applied unchanged to the held-out temporal test cohort. The temporal test cohort was not used for threshold selection or optimization.
Ninety-five percent confidence intervals (95% CIs) for AUC, accuracy, macro F1-score, sensitivity, and specificity were estimated using stratified bootstrap resampling of the fixed temporal test cohort. Resampling was performed at the patient level while preserving the IDH class distribution. For each bootstrap replicate, the previously selected validation-derived decision threshold was retained without re-optimization.
Pairwise differences in AUC between models evaluated on the same test subjects were assessed using the paired DeLong test. Because the same patients were used for all model comparisons, paired patient-level prediction probabilities were used in each statistical comparison. Where multiple pairwise comparisons were performed, both raw and multiplicity-adjusted p-values were reported. A two-sided p-value below 0.05 was considered statistically significant.
All preprocessing parameters, feature-selection procedures, representation learning, synthetic-data generation, hyperparameter optimization, early stopping, and decision-threshold selection were determined without access to the temporal test cohort. The held-out temporal cohort was accessed only after the complete modeling pipeline had been fixed and was used exclusively for final performance evaluation.
3.13.6. Grade and Segmentation Sensitivity Analyses
To investigate potential confounding by WHO tumor grade, grade-stratified analyses were performed on the held-out temporal test cohort. IDH mutation distributions and predictive performance were examined separately for WHO grades 2, 3, and 4.
For each grade, the number of IDH-mutant and IDH-wild-type patients was reported alongside classification performance metrics, including AUC, accuracy, and macro F1-score. Subgroup results were interpreted cautiously when the number of patients in either class was limited, particularly because small subgroups may produce unstable AUC estimates.
The influence of tumor segmentation source was also examined by reviewing the availability of manually refined and automatically generated segmentation masks across the study cohort.
In the original UTSW-Glioma dataset (), manually refined segmentations were available for 359 patients (57.4%), whereas 266 patients (42.6%) did not have manually refined masks.
All patients in the held-out temporal test cohort (2019–2023; ) were evaluated using automatically generated tumor segmentations. Manually refined segmentations were confined to the earlier development period.
Consequently, a direct comparison of classification performance using manually refined versus automatically generated segmentations could not be performed within the temporal test cohort.
Because segmentation source was associated with acquisition period, its independent effect on predictive performance could not be isolated from potential temporal and acquisition-related differences.
Therefore, the segmentation analysis was limited to documenting segmentation availability and reporting predictive performance using the automatically generated masks in the held-out test cohort.
The absence of a paired segmentation-source comparison was acknowledged as a limitation, and further evaluation using both manual and automatic segmentations from the same patients is required to quantify the sensitivity of the proposed framework to segmentation quality.
3.13.7. Counterfactual Evaluation
Patient-level counterfactuals are evaluated by encoding a test subject, retaining the latent representation, switching the class condition, and decoding the counterfactual fused representation. Representative IDH-wild-type-to-mutant and mutant-to-wild-type examples are reported together with the resulting change in classifier probability. Quantitative evaluation includes prediction-flip rate, change in predicted probability, proximity between factual and counterfactual representations, and plausibility relative to the real target-class training distribution. Because the CVAE operates in fused feature space, these counterfactuals are interpreted as feature-level rather than image-level counterfactuals.
3.13.8. External Validation Protocol
To assess cross-institutional generalizability, the proposed multimodal framework was independently evaluated on the UCSD-PTGBM cohort from the University of California San Diego (UCSD) [28].
The external cohort comprised 116 patients with known IDH mutation status, including 15 IDH-mutant and 101 IDH-wild-type cases. The available pre-operative MRI sequences included T1-weighted (T1), contrast-enhanced T1-weighted (T1CE), T2-weighted (T2), and fluid-attenuated inversion recovery (FLAIR) images.
The external evaluation was conducted using the predictive model trained exclusively on the UTSW-Glioma development cohort (2006–2018). The held-out UTSW temporal test cohort (2019–2023) was considered an internal temporal evaluation set and was not treated as an independent external cohort.
Before external evaluation, the trained model and all data-dependent preprocessing parameters were frozen. Feature selection, missing-value imputation, and normalization parameters were estimated exclusively from the UTSW training data and applied unchanged to the external cohort.
The external MRI data were processed using the same imaging preprocessing and radiomic feature extraction procedures as the UTSW cohort. Radiomic features were extracted from BraTS-format tumor segmentations using the corresponding tumor regions.
The clinical/acquisition stream incorporated patient age and MRI scanner field strength. For the external cohort, scanner field strength was fixed at 3 T, corresponding to the reported GE Discovery MR750 acquisition system.
No external IDH labels were used for model retraining, hyperparameter optimization, feature selection, preprocessing parameter estimation, or decision-threshold selection.
The decision threshold selected using the UTSW validation cohort was applied unchanged to the external cohort.
External predictive performance was evaluated using the area under the receiver operating characteristic curve (AUC), accuracy, macro F1-score, sensitivity, and specificity.
The corresponding 95% confidence intervals were estimated using 1000 iterations of stratified bootstrap resampling.
In addition, probability calibration was evaluated independently on the external cohort using the Brier score, calibration intercept, calibration slope, calibration-in-the-large, and calibration curves.
This evaluation was designed to assess the transportability of the frozen UTSW-trained framework to an independent institutional cohort without adaptation to external outcome labels.
3.13.9. Implementation Details
All experiments were implemented in PyTorch (version 2.5.1) and trained on a single NVIDIA Tesla V100 GPU (32 GB memory). Random seeds were fixed to ensure reproducibility. Trained model weights, fused feature representations, and subject-level predictions were retained for subsequent analysis and reproducibility.
Training and inference costs are recorded for the final revision using the same hardware and software environment. Table 3 is provided as a reporting template.
Table 3.
Approximate computational requirements of the proposed framework and baseline model. Training was performed on an NVIDIA Tesla V100-PCIE-32 GB GPU. Inference time is reported per patient. Peak GPU memory corresponds to training with a batch size of 4 for the 3D CNN and 64 for the tabular components.
4. Results
4.1. Dataset and Feature Extraction
Of the 625 patients in the UTSW-Glioma cohort, 622 (99.5%) had valid IDH labels and were included in the analysis. After applying the 30% completeness threshold and variance filter, the final feature matrix comprised 152 features per subject: 10 morphological features, 140 radiomic texture and shape features (across T1CE and T2), and 2 clinical variables (age at imaging and scanner field strength). IDH testing method was not used as a predictor. Scanner manufacturer was excluded after preliminary analysis revealed significant correlation with the temporal acquisition period (), which would confound the temporal train–test split. The training, validation, and test splits contained 380, 96, and 146 subjects, respectively, with class distributions of 113:267 (mutant:wild-type) in the training set and 35:111 in the test set.
4.2. Evaluation Metrics
Model performance was evaluated using five standard metrics. Let TP, TN, FP, and FN denote true positives, true negatives, false positives, and false negatives respectively, where the positive class corresponds to IDH-mutant status.
Accuracy measures the overall proportion of correctly classified subjects:
Recall (Sensitivity) measures the proportion of IDH-mutant cases correctly identified:
This metric is of primary clinical importance in IDH prediction: a missed IDH-mutant tumor (false negative) may lead to suboptimal treatment selection, as IDH-mutant gliomas respond differently to radiotherapy and chemotherapy than wild-type tumors.
Precision measures the proportion of IDH-mutant predictions that were correct:
F1-score is the harmonic mean of precision and recall, providing a balanced single-value summary that accounts for both false negatives and false positives:
The macro-averaged F1-score is reported to account for class imbalance (2.53:1 wild-type to mutant ratio).
Area under the ROC curve (AUC-ROC) is the primary ranking metric, as it is threshold-independent and robust to class imbalance. AUC measures the probability that the model assigns a higher IDH-mutant probability to a randomly chosen mutant subject than to a randomly chosen wild-type subject:
where and denote IDH-mutant and IDH-wild-type subjects, respectively.
All models were evaluated on the held-out temporal test cohort (). For each model, the optimal classification threshold was independently determined on the validation cohort by maximizing Youden’s index:
Here, m denotes the evaluated model. The resulting model-specific threshold was fixed and applied unchanged to the temporal test cohort for computing accuracy, macro F1-score, sensitivity, and specificity. This identical threshold-selection procedure was applied to the proposed framework and all baseline models.
AUC was calculated directly from continuous prediction probabilities and was independent of the classification threshold. AUC 95% confidence intervals were estimated using 1000-iteration stratified bootstrap resampling.
4.3. Classification Performance
Table 4 summarizes the predictive performance of all models on the independent test cohort (). The proposed multimodal framework achieved the best overall performance, with an AUC of 0.9519 (95% CI: 0.9158–0.9802), an accuracy of 87.7%, a macro F1-score of 0.847, and a sensitivity of 0.91 for detecting IDH-mutant tumors. In comparison, both imaging-only baselines demonstrated substantially lower discriminative performance, with AUCs of 0.8381 for DenseNet169-3D and 0.8273 for ConvNeXt, corresponding to absolute improvements of 0.114 and 0.125, respectively.
Table 4.
Performance comparison on the held-out temporal test cohort (; 35 IDH-mutant and 111 IDH-wild-type).
The confusion matrix of the proposed model is shown in Figure 3. Of the 146 test subjects, 128 were correctly classified, including 33 of the 35 IDH-mutant cases. Only two mutant tumors were incorrectly classified as wild-type, resulting in a sensitivity of 91%. Sixteen wild-type tumors were misclassified as mutant, reflecting the operating threshold selected on the validation set to maximize sensitivity while maintaining acceptable specificity.
Figure 3.
Confusion matrix of the proposed multimodal framework on the independent test cohort. The matrix summarizes the numbers of correctly and incorrectly classified IDH-wild-type (WT) and IDH-mutant gliomas, demonstrating the strong discriminative performance of the proposed framework.
The ROC curves of the proposed multimodal framework and the DenseNet169-3D and ConvNeXt-Tiny baselines are presented in Figure 4.
Figure 4.
Receiver operating characteristic (ROC) curves comparing the proposed multimodal framework with the DenseNet169-3D and ConvNeXt-Tiny baselines on the independent test cohort. The proposed framework achieved the highest discriminative performance (AUC = 0.952), substantially outperforming both imaging-only baselines (DenseNet169-3D: AUC = 0.838; ConvNeXt: AUC = 0.827). The diagonal dashed line represents the performance of a random classifier.
4.4. Ablation and Confounder Analysis
Table 5 reports the prespecified component and confounder ablations.
Table 5.
Ablation analysis of the proposed framework on the temporal test cohort (). AUC values are reported with 95% confidence intervals. Statistical comparisons against the full proposed model were performed using paired DeLong tests.
4.5. Class-Imbalance Strategy and Synthetic-Data Fidelity
Table 6 compares the predictive performance of different class-imbalance handling strategies on the held-out temporal test cohort.
Table 6.
Comparison of class-imbalance handling strategies on the held-out temporal test cohort (; 35 IDH-mutant and 111 IDH-wild-type patients).
CVAE augmentation alone achieved an AUC of 0.9413, which was lower than random oversampling (0.9465) and SMOTE (0.9444). These results indicate that CVAE augmentation alone did not outperform conventional resampling strategies.
However, combining CVAE augmentation with class-weighted loss yielded the highest observed AUC among the evaluated configurations. This combined strategy was used in the final proposed multimodal framework.
The findings therefore suggest that the benefit of CVAE augmentation depends on its combination with the classifier training strategy, rather than demonstrating that synthetic augmentation alone is superior to conventional oversampling.
The synthetic-data fidelity analysis revealed mixed results. The distributional fidelity of CVAE-generated IDH-mutant samples relative to real IDH-mutant training samples is summarized in Table 7. The mean absolute differences in feature means and standard deviations were 0.0286 and 0.0346, respectively, while the correlation-matrix similarity was 0.9464. The maximum mean discrepancy (MMD) was 0.0094, suggesting some agreement between the real and generated feature distributions under the evaluated kernel and preprocessing settings.
Table 7.
Distributional fidelity of CVAE-generated IDH-mutant samples relative to real IDH-mutant training samples.
However, the real-versus-synthetic discriminator achieved an AUC of 0.8644, substantially above the chance-level value of 0.5. This indicates that the generated observations remained distinguishable from real IDH-mutant samples, despite similarities in several summary statistics. Consequently, the CVAE did not fully reproduce the real minority-class feature distribution.
These findings suggest that the CVAE captured certain statistical characteristics of the minority class while retaining detectable distributional differences. Therefore, the generated samples should be regarded as approximate feature-level augmentations rather than statistically equivalent replacements for real patient observations.
4.6. Statistical Comparison and Confidence Intervals
Table 8 presents paired DeLong comparisons between the proposed multimodal framework and two deep-learning baselines using patient-level prediction probabilities from the same held-out temporal test cohort ().
Table 8.
Paired DeLong statistical comparison of the proposed multimodal model with deep-learning baselines on the held-out temporal test cohort ().
The proposed model achieved an AUC of 0.9519, compared with 0.8381 for DenseNet169-3D and 0.8273 for ConvNeXt-2D, corresponding to absolute AUC improvements of 0.1138 and 0.1246, respectively.
Statistical significance was evaluated using two-sided paired DeLong tests. Raw p-values were adjusted for the two comparisons using the Holm–Bonferroni procedure. The corresponding 95% confidence intervals for AUC differences, raw p-values, and adjusted p-values are reported in Table 8.
4.7. WHO Grade and Segmentation Sensitivity Analyses
To further assess the robustness of the proposed framework, we evaluated IDH mutation prediction performance across WHO tumor grades and examined the influence of segmentation source. Table 9 presents the grade-stratified results for the 143 test patients with available WHO grade information. Table 10 summarizes performance according to segmentation source, noting that all 146 patients in the held-out temporal test cohort were evaluated using automatically generated segmentations.
Table 9.
IDH mutation prediction performance stratified by WHO tumor grade on the held-out temporal test cohort. Grade information was available for 143 of the 146 test patients.
Table 10.
Model performance according to segmentation source in the held-out temporal test cohort (2019–2023, ).
4.8. Patient-Level Counterfactual Evaluation
To assess the behavior of the generative explanation mechanism at the patient level, we evaluated feature-space counterfactuals on the held-out temporal test cohort. Table 11 reports the prediction-flip rate, change in predicted IDH-mutant probability, factual–counterfactual distance, and target-class plausibility measured using maximum mean discrepancy (MMD).
Table 11.
Quantitative evaluation of feature-level CVAE counterfactuals on the temporal test cohort (). For each test subject, a counterfactual feature vector was generated by encoding under the true IDH class and decoding under the opposite class. Feature values are MinMax-scaled to prior to distance computation.
4.9. External Validation
The generalizability of the proposed multimodal framework was evaluated on the independent UCSD-PTGBM cohort [28] (), comprising 15 IDH-mutant and 101 IDH-wild-type patients.
The UTSW-trained model was applied without retraining or parameter adaptation. All preprocessing transformations, including missing-value imputation, variance-based feature selection, and feature scaling, were fitted exclusively on the UTSW training cohort (2006–2018) and subsequently applied unchanged to the external dataset.
Table 12 summarizes the external validation results.
Table 12.
External validation of the frozen UTSW-trained model on the UCSD-PTGBM cohort. The model was applied without retraining; all preprocessing parameters (imputation, variance threshold, scaling) were fitted exclusively on the UTSW training set (2006–2018) and applied unchanged to the external cohort, and 95% confidence intervals were estimated using 1000-iteration stratified bootstrap resampling.
The proposed framework achieved an external AUC of 0.675 (95% CI: 0.513–0.822), compared with 0.952 (95% CI: 0.916–0.980) on the held-out UTSW temporal test cohort.
This corresponds to an absolute AUC decrease of approximately 0.277, indicating reduced discriminative performance under external validation.
External accuracy was 0.707, with a macro F1-score of 0.553, sensitivity of 0.467, and specificity of 0.743.
These findings suggest that differences in patient characteristics, acquisition protocols, scanner configurations, and cohort composition may affect the transportability of the proposed framework.
4.10. Probability Calibration Analysis
In addition to discrimination-based evaluation, probability calibration was assessed to investigate the reliability of the predicted IDH-mutant probabilities.
Calibration was evaluated independently on the held-out temporal test cohort (2019–2023; ) and the external UCSD-PTGBM validation cohort (), using the continuous predicted probabilities generated by the final multimodal framework.
The evaluation included the Brier score, calibration intercept, calibration slope, calibration-in-the-large, and graphical calibration analysis.
4.10.1. Calibration Evaluation Procedure
The Brier score was calculated as the mean squared difference between the predicted IDH-mutant probabilities and the corresponding binary ground-truth labels:
where N denotes the number of patients, is the predicted probability of IDH mutation, and is the corresponding ground-truth label.
Lower Brier scores indicate better overall probability accuracy.
Calibration intercept and slope were estimated using logistic calibration regression:
where represents the calibration intercept and denotes the calibration slope.
Perfect calibration corresponds to and .
A negative calibration intercept indicates systematic overestimation of predicted probabilities, whereas a positive intercept suggests underestimation, conditional on the estimated calibration slope.
A calibration slope below unity indicates predictions that are excessively extreme, while a slope above unity suggests insufficient dispersion of predicted risks.
Calibration-in-the-large was additionally estimated using logistic regression with the calibration slope fixed at unity, thereby quantifying systematic shifts in predicted probabilities.
For numerical stability, predicted probabilities were clipped to the interval before applying the logit transformation.
Calibration curves were constructed using five quantile-based probability bins for each cohort.
Within each bin, the mean predicted probability was compared with the observed proportion of IDH-mutant patients.
The diagonal reference line represented perfect calibration.
All calibration assessments were conducted without retraining or recalibrating the original predictive model.
4.10.2. Quantitative Calibration Results
Table 13 presents the quantitative calibration results for both evaluation cohorts.
Table 13.
Probability calibration of the proposed multimodal framework on the held-out temporal test and external validation cohorts.
On the temporal test cohort, the proposed framework achieved an AUC of 0.9519 and a Brier score of 0.1217.
The calibration slope was 1.0154, close to the ideal value of unity, suggesting that the dispersion of predicted log-odds was approximately appropriate.
However, the calibration intercept was −1.4673, indicating systematic overestimation of IDH-mutant probabilities.
The mean predicted probability was 37.86%, compared with an observed IDH-mutant prevalence of 23.97%.
Calibration-in-the-large was −1.4514, further supporting the presence of systematic probability overestimation.
On the external UCSD-PTGBM cohort, the model achieved an AUC of 0.6752 and a Brier score of 0.1250.
The calibration intercept was −1.0712, and the slope was 0.7932, suggesting systematic probability overestimation and excessively dispersed predicted risks.
The mean predicted IDH-mutant probability was 24.98%, whereas the observed prevalence was 12.93%.
Calibration-in-the-large was −0.9089, indicating a systematic shift in the predicted probabilities.
4.10.3. Interpretation and Clinical Implications
Figure 5 illustrates the relationship between predicted IDH-mutant probabilities and observed mutation frequencies.
Figure 5.
Calibration curves of the proposed multimodal framework on the temporal test () and external validation () cohorts. Predicted IDH-mutant probabilities were grouped into five quantile-based bins per cohort. Each point represents the mean predicted probability and corresponding observed IDH-mutant frequency. The dashed diagonal indicates perfect calibration.
The temporal calibration curve generally remained below the perfect-calibration reference line, consistent with the negative calibration intercept and systematic probability overestimation.
The external calibration curve exhibited greater variability, reflecting the limited number of IDH-mutant patients () and the resulting uncertainty in bin-level observed frequencies.
The differences in calibration should be interpreted alongside the substantial variation in IDH-mutant prevalence between the temporal test cohort (23.97%) and external validation cohort (12.93%).
Although the proposed framework demonstrated strong discrimination on the temporal cohort, its predicted probabilities exhibited systematic overestimation in both evaluation cohorts.
The external cohort additionally demonstrated reduced discrimination and a calibration slope below unity, highlighting limitations in model transportability.
These findings demonstrate that discrimination alone is insufficient to establish the clinical reliability of individual-level probability estimates.
Consequently, the current framework should be regarded as a research-stage predictive model rather than a clinically validated probability estimator.
Further probability recalibration, larger multicenter external validation, and prospective evaluation are necessary before its predicted probabilities can be used for clinical decision-support applications.
4.11. CVAE Training and Augmentation
Figure 6 illustrates the training dynamics of the proposed CVAE over 400 epochs. Both the training and validation losses decreased progressively before stabilizing, indicating convergence of the minimized CVAE objective. The KL divergence initially increased and subsequently stabilized at approximately 0.041, indicating a non-zero contribution from latent-space regularization.
Figure 6.
CVAE training dynamics over 400 epochs. The left and middle panels show the training and validation losses, respectively, corresponding to the minimized negative-ELBO objective. Both losses decrease and stabilize during optimization. The right panel shows the KL divergence, which increases initially and subsequently stabilizes around 0.041, indicating continued latent-space regularization.
The lowest recorded validation loss was 0.0171, while the mean test reconstruction MSE was 0.0039. In preliminary experiments using , the KL divergence approached zero, suggesting possible posterior collapse. In contrast, the non-zero KL divergence observed with suggests that the latent representation remained active, although this observation alone does not establish that posterior collapse was completely avoided.
A total of 154 synthetic IDH-mutant feature vectors were generated to address class imbalance, resulting in an augmented training set of 534 feature vectors (267 IDH-mutant and 267 IDH-wild-type).
The augmented feature representations were subsequently used to train the final GAMI-Net classifier with a class-weighted classification loss. This combined CVAE augmentation and class-weighted loss strategy constitutes the final proposed model evaluated in Table 4 and corresponds to the configuration reported in Table 6.
The generated feature vectors had a mean value of 0.387 and ranged from −0.036 to 1.076.
Although the generated samples preserved several summary characteristics of the real minority-class distribution, the real-versus-synthetic discriminator achieved an AUC of 0.8644, indicating that real and synthetic observations remained distinguishable. Therefore, the fidelity results support partial distributional similarity rather than statistical equivalence between generated and real observations.
4.12. Explainability Results
4.12.1. Global Feature Importance
Figure 7 presents the global feature importance obtained from GAMI-Net for the Multimodal v3 model. Unlike post hoc explanation methods, GAMI-Net incorporates interpretability directly into its model structure through additive main-effect subnetworks and selected pairwise interactions. The reported importance values therefore quantify contributions learned directly by the predictive model rather than approximations obtained from an external surrogate explainer.
Figure 7.
Top 20 global feature importance values obtained from the GAMI-Net classifier for the Multimodal v3 model. Importance is quantified as the normalized mean absolute contribution of each GAMI-Net subnetwork, . Colors indicate the feature source: CNN-derived MRI latent dimensions (purple), radiomics-derived latent dimensions (red), and clinical variables (blue). Age was the most influential individual predictor, followed by CNN_38, Rad_35, CNN_14, and CNN_11.
Patient age was the most influential individual predictor, with a normalized importance of 0.043. This finding is consistent with the established association between age and IDH mutation status, with IDH-mutant gliomas occurring more frequently in younger patients. However, age was not overwhelmingly dominant: several imaging and radiomics latent dimensions showed contributions of comparable magnitude.
Among the CNN-derived imaging features, CNN_38 was the most influential latent dimension, with a normalized importance of 0.038, followed by CNN_14 (0.029) and CNN_11 (0.028). Additional CNN dimensions, including CNN_3, CNN_63, CNN_20, CNN_36, CNN_31, CNN_48, and CNN_12, were also represented among the 20 most influential features. These results indicate that the classifier uses information distributed across multiple components of the learned MRI representation rather than relying on a single imaging latent variable.
Radiomics-derived features also contributed substantially to the model. Rad_35 was the highest-ranked radiomics latent dimension, with a normalized importance of 0.030, followed by Rad_14 (0.021). Other radiomics dimensions represented among the 20 highest-ranked features included Rad_32, Rad_33, Rad_10, Rad_42, Rad_13, Rad_57, and Rad_62. The simultaneous presence of CNN-derived and radiomics-derived dimensions among the highest-ranked variables indicates that the classifier uses information from both learned MRI representations and quantitative radiomic representations.
The importance profile therefore shows that predictive contributions are distributed across clinical, CNN-derived, and radiomics-derived information. Age provides the largest individual contribution, but several CNN and radiomics latent dimensions have substantial importance values. This distribution should not, however, be interpreted as evidence that all modalities contribute equally or that multimodal fusion itself is responsible for the observed predictive performance. The independent contribution of each modality and model component is evaluated separately through the ablation analysis.
An additional advantage of this analysis is that the modality of origin of each latent dimension remains identifiable. Nevertheless, numerical latent dimensions such as CNN_38 or Rad_35 do not have an immediate anatomical or biological interpretation. Consequently, complementary analyses were performed to provide additional context for selected high-importance latent dimensions. CNN representations were examined using spatial attribution, whereas radiomics latent dimensions were related to their original quantitative descriptors through decoder-weight analysis.
4.12.2. Global Effect Analysis
Global feature importance quantifies the overall contribution of a variable but does not describe how changes in that variable influence the model output. Therefore, representative GAMI-Net global effect functions were examined to characterize the relationships learned between selected features and IDH mutation prediction. Figure 8 presents representative effects for clinical, CNN-derived, and radiomics-derived features.
Figure 8.
Representative GAMI-Net global effect functions for selected clinical, CNN-derived, and radiomics-derived features used for IDH mutation prediction. The horizontal axis represents the observed value of each feature, and the vertical axis represents its learned contribution to the model output. Positive contributions favor the IDH-mutant class, whereas negative contributions favor the IDH-wild-type class. The effect functions complement the global importance analysis by illustrating the direction and nonlinear form of the relationships learned by GAMI-Net.
Among the directly interpretable variables, Age exhibited the clearest relationship with the model output. Increasing age was associated with a progressively lower contribution towards the IDH-mutant class, whereas younger age contributed more strongly towards an IDH-mutant prediction. This learned relationship is consistent with the established epidemiological association between younger age and IDH-mutant gliomas [29]. This correspondence provides clinical context for the learned effect but should not be interpreted as evidence of a causal relationship between age and IDH mutation status.
The selected CNN latent dimensions exhibited structured nonlinear effects across their observed feature ranges. These dimensions represent compressed imaging information learned by the self-supervised 3D CNN encoder and do not have an immediate anatomical interpretation from their numerical labels alone. Their global effect functions nevertheless provide a direct view of how variation in the learned imaging representation changes its contribution to the GAMI-Net prediction. Additional spatial attribution analysis was therefore performed to investigate whether selected CNN dimensions were preferentially associated with particular tumor regions.
Representative radiomics latent dimensions similarly exhibited structured effects on the classifier output. Because these dimensions correspond to compressed representations learned from the original radiomic descriptors, their global effect functions describe the behavior of the learned latent representation rather than the effect of a single handcrafted radiomic feature. Decoder-weight analysis was therefore used as a complementary analysis to identify the original quantitative imaging descriptors most strongly associated with selected radiomics latent dimensions.
Overall, the representative global effect functions were generally smooth over their observed feature ranges. This facilitates interpretation because the direction and magnitude of the learned contributions can be inspected directly. However, smooth or monotonic effect functions should not by themselves be interpreted as evidence of biological validity, robustness, or causality; rather, they describe the functional relationships learned by GAMI-Net from the available data.
Together, the global feature importance and global effect analyses provide two complementary levels of intrinsic model interpretation. Global importance identifies which variables contribute most strongly to the classifier, whereas global effect functions describe how changes in selected variables alter their contribution to the model output. For directly interpretable variables such as age, these relationships can be compared with established clinical knowledge. For CNN and radiomics latent dimensions, additional grounding analyses are required to relate the abstract representations to interpretable imaging characteristics.
4.12.3. Clinical Grounding of Latent Dimensions
Although GAMI-Net provides intrinsic information about the importance and functional effects of individual features, the CNN and radiomics branches produce compressed latent representations whose numerical dimensions do not have an immediate clinical interpretation. To provide additional context for these representations, two complementary analyses were performed. Spatial attribution was used to examine the anatomical regions associated with selected CNN dimensions, while decoder-weight analysis was used to relate selected radiomics dimensions to their original quantitative imaging descriptors.
Spatial Grounding of CNN Latent Dimensions
Grad-CAM analysis was used to examine the spatial regions associated with selected CNN latent dimensions. Table 14 summarizes the overlap between thresholded Grad-CAM activation maps and tumor subregions for a representative IDH-wild-type case.
Table 14.
Spatial interpretation of selected CNN latent dimensions using Grad-CAM analysis on the AE-pretrained 3D CNN encoder for a representative IDH-wild-type patient (BT1121). Overlap denotes the fraction of the thresholded Grad-CAM activation map () overlapping each tumor subregion. Global-effect directions are reported where available from the GAMI-Net analysis.
The Grad-CAM analysis showed that several selected CNN dimensions exhibited preferential spatial localization within tumor-associated regions. CNN_31 and CNN_36 showed substantial overlap with the necrotic core, whereas CNN_38 and CNN_14 showed greater activation within the peritumoral edema region. CNN_20 exhibited activation across both edematous and necrotic regions. In contrast, CNN_11, CNN_3, and CNN_63 showed limited or non-specific localization within the tumor. These observations provide spatial context for otherwise abstract CNN latent variables and suggest that different dimensions capture information associated with different components of the tumor and surrounding tissue.
These findings should nevertheless be interpreted cautiously. Grad-CAM identifies spatial regions associated with network activation but does not establish that an individual latent dimension constitutes a specific anatomical detector. Furthermore, the quantitative overlap analysis reported here was obtained from a representative patient and therefore illustrates case-level spatial interpretability rather than population-level anatomical specificity. A systematic analysis across the complete test cohort would be required to determine whether these spatial associations are consistently reproduced across patients.
Grounding of Radiomics Latent Dimensions
The radiomics latent representation was examined using decoder weights to identify the original quantitative features most strongly associated with selected latent dimensions. For each selected dimension, the original feature with the largest absolute decoder loading was identified. The resulting mappings are summarized in Table 15.
Table 15.
Interpretation of selected radiomics latent dimensions through decoder-weight analysis. For each latent dimension, the original feature with the largest absolute decoder loading is reported. Global-effect directions correspond to the GAMI-Net effect analysis where available.
Decoder-weight analysis showed that selected radiomics latent dimensions were associated with recognizable quantitative imaging descriptors. For example, Rad_38 had its largest absolute decoder loading for T1CE_glcm_SumEntropy, a descriptor of T1CE texture heterogeneity, while Rad_35 was most strongly associated with T1CE_glrlm_RunLengthNonUniformity. Rad_14 was primarily associated with T1CE_firstorder_Maximum, and Rad_15 was associated with the enhancement ratio. Other selected latent dimensions were associated with descriptors of T2 intensity heterogeneity and T1CE texture structure.
These mappings provide a link between the compressed radiomics representation used by the classifier and the original quantitative imaging descriptors. However, each latent dimension may encode information from multiple input variables. Consequently, the feature with the largest absolute decoder loading should be interpreted as the strongest association within the decoder rather than as an exclusive semantic definition of that latent dimension.
Taken together, the spatial attribution and decoder-weight analyses provide additional grounding for the abstract representations used by GAMI-Net. The analyses suggest that selected CNN dimensions contain spatial information associated with tumor and peritumoral regions, while selected radiomics dimensions retain information related to identifiable quantitative imaging descriptors. These complementary analyses extend the intrinsic GAMI-Net explanations by connecting selected latent variables to their underlying imaging context, while avoiding the assumption that individual latent dimensions correspond uniquely to specific anatomical or biological biomarkers.
4.13. Limitations
Several limitations should be acknowledged.
First, although the primary UTSW analysis employed a fixed temporal split and an independent external cohort was additionally evaluated, model development relied on a retrospective, single-institution dataset. The substantial reduction in AUC from 0.9519 on the UTSW temporal test cohort to 0.6752 on the external UCSD cohort indicates limited cross-institutional generalizability. Differences in patient populations, IDH mutation prevalence, imaging acquisition protocols, and institutional characteristics may have contributed to this performance degradation; however, their individual effects were not isolated experimentally. Furthermore, the external cohort contained only 116 patients, including 15 IDH-mutant cases, limiting the precision of external performance estimates. Validation across larger, geographically diverse, and heterogeneous multi-center cohorts is therefore necessary before clinical deployment.
Second, subgroup analyses were constrained by small and highly imbalanced sample sizes. In particular, some WHO grade strata contained very few patients from one IDH class. Consequently, apparently high subgroup AUCs, including perfect discrimination in small strata, should be interpreted cautiously and should not be considered evidence of equivalent performance in larger grade-specific populations. Future investigations should include sufficiently powered grade-stratified evaluations to establish the robustness of predictive performance across different tumor grades.
Third, segmentation source was temporally confounded in the UTSW dataset. The held-out temporal test cohort contained exclusively automatically generated segmentations, whereas manually refined segmentations were confined to the development period. A direct within-test-cohort comparison of manual and automatic segmentations was therefore not possible, preventing the independent effect of segmentation quality on predictive performance from being quantified. Furthermore, segmentation errors may propagate into tumor morphology measurements, radiomic descriptors, and tumor-centered image representations. Future work should evaluate segmentation sensitivity using paired manual and automatic masks from the same patients and assess robustness to controlled segmentation perturbations.
Fourth, the CNN and radiomics branches produce latent representations whose individual dimensions do not have direct anatomical or biological interpretations. Although GAMI-Net provides intrinsic explanations of how these dimensions contribute to prediction, their underlying biological meaning remains uncertain. Moreover, the additive contributions learned by GAMI-Net describe associations within the predictive model and should not be interpreted as causal relationships between imaging characteristics and IDH mutation status. Combining intrinsic feature-level explanations with spatial localization, radiomic feature attribution, and representation-disentanglement techniques may improve the clinical interpretability of these learned representations.
Fifth, limitations remain regarding the fidelity and clinical interpretability of CVAE-generated samples. The CVAE operates on fused feature representations rather than directly on MRI volumes; consequently, generated samples and counterfactuals cannot be interpreted as anatomically realistic modifications of the original MRI scans. Although several statistical measures indicated partial agreement between real and generated minority-class feature distributions, the real-versus-synthetic discriminator achieved an AUC of 0.8644, substantially above the chance-level value of 0.5. This indicates that real and synthetic observations remained distinguishable and that the CVAE did not fully reproduce the original minority-class feature distribution. Therefore, generated representations should be regarded as approximate feature-space augmentations rather than statistically equivalent substitutes for real patient observations.
Moreover, CVAE augmentation alone achieved an AUC of 0.9413, compared with 0.9465 for random oversampling and 0.9444 for SMOTE. The highest observed AUC (0.9519) was obtained when CVAE augmentation was combined with class-weighted classification loss. However, SMOTE achieved higher accuracy and macro F1-score than this configuration. These findings indicate that the relative benefit of generative augmentation depends on the evaluation metric and accompanying training strategy, rather than demonstrating consistent superiority over conventional resampling methods. A matched comparison of synthetic-data fidelity between CVAE and SMOTE was not performed, limiting conclusions regarding their relative distributional realism. Future investigations should evaluate more expressive generative models, compare synthetic-data fidelity using consistent evaluation protocols, and investigate anatomically interpretable image-level generation while considering the risk of unrealistic or clinically misleading synthetic features.
Sixth, although probability calibration was evaluated on both the temporal and external cohorts, the resulting predictions exhibited systematic overestimation of IDH-mutant probabilities. On the temporal test cohort, the calibration intercept was −1.4673 and the calibration slope was 1.0154, with a Brier score of 0.1217. On the external cohort, the corresponding values were −1.0712, 0.7932, and 0.1250, respectively.
The negative calibration intercepts indicate a tendency toward overprediction of IDH-mutant risk, while the lower external calibration slope suggests that predictions were also more extreme than warranted by the observed outcomes. These findings are particularly relevant given the difference in IDH-mutant prevalence between the temporal cohort (23.97%) and the external cohort (12.93%). Furthermore, the small number of external IDH-mutant cases limits the stability of calibration estimates and calibration curves.
Although calibration was quantified, no post hoc probability recalibration was performed. Consequently, the predicted probabilities should not be interpreted as sufficiently validated estimates of individual clinical risk. Future work should investigate probability recalibration using independent calibration cohorts and evaluate calibration stability across institutions, acquisition protocols, and patient subgroups.
Finally, this study remains retrospective and focuses primarily on predictive discrimination, feature-level interpretability, and generative augmentation rather than prospective clinical utility. The reported performance does not establish readiness for clinical decision-making. Before deployment, further studies should assess robustness to acquisition and segmentation shifts, external probability recalibration, prospective predictive performance, and the clinical usefulness of the generated explanations in collaboration with radiologists and neuro-oncology specialists. In addition, the impact of model-assisted predictions on clinical decisions and patient outcomes remains to be established.
4.14. Clinical Translation and Workflow Integration
The proposed framework is intended as a research-stage decision-support approach for non-invasive IDH mutation prediction rather than as a replacement for histopathological or molecular testing. In a potential clinical workflow, routinely acquired preoperative T1, T1CE, T2, and FLAIR MRI sequences would first undergo the preprocessing pipeline used in this study, including skull stripping, N4 bias-field correction, multimodal registration, spatial normalization, intensity standardization, and tumor-region extraction. Imaging and radiomics representations could then be generated automatically and combined with the available clinical/acquisition covariates to estimate the probability of IDH mutation. Such a prediction could potentially provide complementary information during preoperative assessment while definitive molecular results are pending.
An important consideration for clinical implementation is the distinction between model development and patient-level inference. Self-supervised pretraining, CVAE optimization, and classifier training are performed offline and would not need to be repeated for each new patient. During inference, a new examination would require preprocessing, feature extraction, and forward evaluation using the trained models. The experiments reported in this study were conducted on an NVIDIA Tesla V100 GPU with 32 GB of memory. However, end-to-end processing time per patient, including image preprocessing and feature extraction, was not prospectively benchmarked. Therefore, future work should quantify processing time and computational requirements on hardware representative of a clinical environment.
Robustness to heterogeneous MRI acquisition protocols represents an important challenge for clinical translation. Differences between institutions may arise from scanner manufacturer, field strength, sequence parameters, spatial resolution, reconstruction procedures, and other acquisition characteristics. Although registration, spatial normalization, and intensity standardization were incorporated to reduce such variability, these preprocessing procedures cannot completely eliminate acquisition- or site-related domain shifts. This limitation is particularly relevant given the reduction in discrimination observed between the held-out temporal cohort and the external cohort. The external validation results therefore indicate that additional multicenter evaluation is required before the framework can be considered sufficiently robust for clinical deployment. Future work should investigate harmonization, domain-adaptation, and acquisition-robust representation-learning strategies across larger and more heterogeneous multicenter datasets.
Interpretability is another important requirement for clinical integration. Rather than providing only a binary prediction, GAMI-Net enables examination of the relative contributions and learned effect functions of variables involved in individual predictions. The complementary analyses performed in this study further provide spatial context for selected CNN-derived latent dimensions through Grad-CAM and relate selected radiomics latent dimensions to conventional quantitative imaging descriptors through decoder-weight analysis. In a future clinical decision-support interface, these outputs could potentially accompany the predicted IDH probability to provide clinicians with additional context regarding the factors contributing to the model output. Nevertheless, these model-derived explanations should not be interpreted as independently validated imaging biomarkers, and their clinical usefulness and comprehensibility require prospective assessment by neuroradiologists and other relevant clinical specialists.
Overall, translation of the proposed framework into clinical practice would require further multicenter and prospective validation, automated quality-control procedures, evaluation across heterogeneous MRI acquisition protocols, measurement of end-to-end computational requirements, and systematic assessment of the clinical utility of its explanations. Until these requirements are addressed, the proposed framework should be regarded as a research-stage approach for non-invasive IDH mutation prediction rather than a clinically deployable diagnostic system.
5. Conclusions
This study developed and evaluated an explainable multimodal generative framework for non-invasive prediction of IDH mutation status using multiparametric MRI, radiomics, and clinical/acquisition information. The proposed framework integrates self-supervised imaging representation learning, multimodal late fusion, a conditional variational autoencoder (CVAE) for class-conditional feature-space augmentation, and GAMI-Net for intrinsically interpretable classification.
On the held-out UTSW temporal test cohort (), the proposed framework achieved an AUC of 0.9519 (95% CI: 0.9158–0.9802), an accuracy of 87.7%, and a macro F1-score of 0.847. The framework demonstrated higher discrimination than the evaluated imaging-only DenseNet169-3D and ConvNeXt-Tiny baselines. However, ablation analyses revealed that substantial predictive information was already present in individual feature streams, particularly radiomic and clinical/acquisition information. Therefore, the observed performance should not be attributed exclusively to multimodal fusion or generative augmentation.
The explainability analyses demonstrated that GAMI-Net provides direct access to additive feature contributions and nonlinear relationships learned by the classifier. Complementary spatial-attribution and radiomics decoder analyses provided additional context for selected latent dimensions, while the CVAE supported minority-class augmentation and feature-space counterfactual generation. Nevertheless, these explanations reflect model-learned associations and do not establish the identified representations as independently validated anatomical or biological biomarkers.
Importantly, independent external validation revealed a substantial limitation in cross-institutional generalizability. The AUC decreased from 0.9519 on the UTSW temporal test cohort to 0.6752 (95% CI: 0.513–0.822) on the external UCSD cohort (). This performance reduction highlights the challenges of transferring models across institutions, patient populations, and imaging acquisition conditions.
Probability calibration analyses further identified systematic overestimation of IDH-mutant probabilities in both cohorts. The temporal and external Brier scores were 0.1217 and 0.1250, respectively, with negative calibration intercepts in both settings. The external calibration slope of 0.7932 additionally suggested overly extreme predictions, indicating that strong discrimination within the development institution does not necessarily translate into reliable probability estimates across institutions.
Taken together, these findings support the feasibility of combining multimodal representation learning, generative feature augmentation, and intrinsic interpretability for IDH mutation prediction, while highlighting important limitations in external generalization, probability calibration, and the clinical interpretability of learned representations.
Accordingly, the proposed framework should be regarded as a research-stage approach rather than a clinically deployable diagnostic system. Clinical translation will require validation across larger and more heterogeneous multi-center cohorts, improved robustness to acquisition and segmentation shifts, independent probability recalibration and validation, computational benchmarking, and prospective clinical evaluation.
Future work will also investigate image-level conditional generative models and methods for linking intrinsically interpretable latent representations more directly to spatial, radiological, and biologically meaningful tumor characteristics.
Author Contributions
Conceptualization, A.K. and M.A.A.; Methodology, A.K. and M.A.A.; Software, A.K.; Validation, A.K. and M.A.A.; Formal analysis, A.K.; Investigation, A.K.; Data curation, A.K.; Writing—original draft preparation, A.K.; Writing—review and editing, A.K. and M.A.A.; Supervision, M.A.A.; Funding acquisition, M.A.A. All authors have read and agreed to the published version of the manuscript.
Funding
This research was enabled in part by support provided by the Natural Sciences and Engineering Research Council of Canada (NSERC), funding reference number RGPIN-2024-05287.
Institutional Review Board Statement
Not applicable.
Informed Consent Statement
Not applicable.
Data Availability Statement
The data presented in this study were derived from the publicly available UTSW-Glioma dataset hosted by The Cancer Imaging Archive (TCIA). The dataset is available at https://www.cancerimagingarchive.net/collection/utsw-glioma/ (Accessed on 5 March 2026). The processed data and source code supporting the findings of this study are available from the corresponding author upon reasonable request.
Conflicts of Interest
The authors declare no conflicts of interest.
Abbreviations
The following abbreviations are used in this manuscript:
| AI | Artificial Intelligence |
| XAI | Explainable Artificial Intelligence |
| MRI | Magnetic Resonance Imaging |
| CNN | Convolutional Neural Network |
| 3D CNN | Three-Dimensional Convolutional Neural Network |
| MLP | Multilayer Perceptron |
| CVAE | Conditional Variational Autoencoder |
| VAE | Variational Autoencoder |
| GAMI-Net | Generalized Additive Model with Interactions |
| ELBO | Evidence Lower Bound |
| KL | Kullback–Leibler |
| MSE | Mean Squared Error |
| ROC | Receiver Operating Characteristic |
| AUC | Area Under the Receiver Operating Characteristic Curve |
| GLCM | Gray-Level Co-occurrence Matrix |
| GLRLM | Gray-Level Run Length Matrix |
| GLSZM | Gray-Level Size Zone Matrix |
| GLDM | Gray-Level Dependence Matrix |
| NGTDM | Neighboring Gray-Tone Difference Matrix |
| IBSI | Image Biomarker Standardization Initiative |
| T1 | T1-Weighted Magnetic Resonance Imaging |
| T1CE | Contrast-Enhanced T1-Weighted Magnetic Resonance Imaging |
| T2 | T2-Weighted Magnetic Resonance Imaging |
| FLAIR | Fluid-Attenuated Inversion Recovery |
| IDH | Isocitrate Dehydrogenase |
| WHO | World Health Organization |
| UTSW | University of Texas Southwestern Medical Center |
References
- Olar, A.; Wani, K.M.; Alfaro-Munoz, K.D.; Heathcock, L.E.; van Thuijl, H.F.; Gilbert, M.R.; Armstrong, T.S.; Sulman, E.P.; Cahill, D.P.; Vera-Bolanos, E.; et al. IDH mutation status and role of WHO grade and mitotic index in overall survival in grade II–III diffuse gliomas. Acta Neuropathol. 2015, 129, 585–596. [Google Scholar] [CrossRef] [Scilit] [PubMed]
- Louis, D.N.; Perry, A.; Wesseling, P.; Brat, D.J.; Cree, I.A.; Figarella-Branger, D.; Hawkins, C.; Ng, H.; Pfister, S.M.; Reifenberger, G.; et al. The 2021 WHO classification of tumors of the central nervous system: A summary. Neuro-Oncol. 2021, 23, 1231–1251. [Google Scholar] [CrossRef] [Scilit] [PubMed]
- Dang, L.; Yen, K.; Attar, E. IDH mutations in cancer and progress toward development of targeted therapeutics. Ann. Oncol. 2016, 27, 599–608. [Google Scholar] [CrossRef] [Scilit] [PubMed]
- Horbinski, C.; Kofler, J.; Kelly, L.M.; Murdoch, G.H.; Nikiforova, M.N. Diagnostic use of IDH1/2 mutation analysis in routine clinical testing of formalin-fixed, paraffin-embedded glioma tissues. J. Neuropathol. Exp. Neurol. 2009, 68, 1319–1325. [Google Scholar] [CrossRef] [Scilit] [PubMed]
- Hoffmann, E.; Masthoff, M.; Kunz, W.G.; Seidensticker, M.; Bobe, S.; Gerwing, M.; Berdel, W.E.; Schliemann, C.; Faber, C.; Wildgruber, M. Multiparametric MRI for characterization of the tumour microenvironment. Nat. Rev. Clin. Oncol. 2024, 21, 428–448. [Google Scholar] [CrossRef] [Scilit] [PubMed]
- Mathema, V.B.; Sen, P.; Lamichhane, S.; Orešič, M.; Khoomrung, S. Deep learning facilitates multi-data type analysis and predictive biomarker discovery in cancer precision medicine. Comput. Struct. Biotechnol. J. 2023, 21, 1372–1382. [Google Scholar] [CrossRef] [Scilit] [PubMed]
- Selvaraju, R.R.; Cogswell, M.; Das, A.; Vedantam, R.; Parikh, D.; Batra, D. Grad-cam: Visual explanations from deep networks via gradient-based localization. In Proceedings of the IEEE International Conference on Computer Vision, Venice, Italy, 22–29 October 2017; pp. 618–626. [Google Scholar]
- Lundberg, S.M.; Lee, S.I. A unified approach to interpreting model predictions. Adv. Neural Inf. Process. Syst. 2017, 30, 4765–4774. [Google Scholar]
- Ribeiro, M.T.; Singh, S.; Guestrin, C. “Why should i trust you?” Explaining the predictions of any classifier. In Proceedings of the 22nd ACM SIGKDD International Conference on Knowledge Discovery and Data Mining, San Francisco, CA, USA, 13–17 August 2016; pp. 1135–1144. [Google Scholar]
- Kim, J.; Kong, J.; Son, J. Conditional variational autoencoder with adversarial learning for end-to-end text-to-speech. In Proceedings of the International Conference on Machine Learning, PMLR, Virtual, 18–24 July 2021; pp. 5530–5540. [Google Scholar]
- Yang, Z.; Zhang, A.; Sudjianto, A. GAMI-Net: An explainable neural network based on generalized additive models with structured interactions. Pattern Recognit. 2021, 120, 108192. [Google Scholar] [CrossRef] [Scilit]
- Reddy, D.; Saadat, N.; Holcomb, J.; Wagner, B.; Truong, N.; Bowerman, J.; Hatanpaa, K.; Patel, T.; Pinho, M.; Yu, F.; et al. The University of Texas Southwestern Glioma MRI Dataset with Molecular Marker Characterization and Segmentations (UTSW-Glioma) (Version 1) [Data Set]. The Cancer Imaging Archive. 2026. Available online: https://www.cancerimagingarchive.net/collection/utsw-glioma/ (accessed on 5 March 2026).
- Suh, C.H.; Kim, H.S.; Jung, S.C.; Choi, C.G.; Kim, S.J. Imaging prediction of isocitrate dehydrogenase (IDH) mutation in patients with glioma: A systemic review and meta-analysis. Eur. Radiol. 2019, 29, 745–758. [Google Scholar] [CrossRef] [Scilit] [PubMed]
- Chang, K.; Bai, H.X.; Zhou, H.; Su, C.; Bi, W.L.; Agbodza, E.; Kavouridis, V.K.; Senders, J.T.; Boaro, A.; Beers, A.; et al. Residual convolutional neural network for the determination of IDH status in low-and high-grade gliomas from MR imaging. Clin. Cancer Res. 2018, 24, 1073–1081. [Google Scholar] [CrossRef] [Scilit] [PubMed]
- Zhang, B.; Chang, K.; Ramkissoon, S.; Tanguturi, S.; Bi, W.L.; Reardon, D.A.; Ligon, K.L.; Alexander, B.M.; Wen, P.Y.; Huang, R.Y. Multimodal MRI features predict isocitrate dehydrogenase genotype in high-grade gliomas. Neuro-Oncol. 2017, 19, 109–117. [Google Scholar] [CrossRef] [Scilit] [PubMed]
- Liang, S.; Zhang, R.; Liang, D.; Song, T.; Ai, T.; Xia, C.; Xia, L.; Wang, Y. Multimodal 3D DenseNet for IDH genotype prediction in gliomas. Genes 2018, 9, 382. [Google Scholar] [CrossRef] [Scilit] [PubMed]
- Zhou, M.; Scott, J.; Chaudhury, B.; Hall, L.; Goldgof, D.; Yeom, K.W.; Iv, M.; Ou, Y.; Kalpathy-Cramer, J.; Napel, S.; et al. Radiomics in brain tumor: Image assessment, quantitative feature descriptors, and machine-learning approaches. Am. J. Neuroradiol. 2018, 39, 208–216. [Google Scholar] [CrossRef] [Scilit] [PubMed]
- Lu, C.F.; Hsu, F.T.; Hsieh, K.L.C.; Kao, Y.C.J.; Cheng, S.J.; Hsu, J.B.K.; Tsai, P.H.; Chen, R.J.; Huang, C.C.; Yen, Y.; et al. Machine learning–based radiomics for molecular subtyping of gliomas. Clin. Cancer Res. 2018, 24, 4429–4436. [Google Scholar] [CrossRef] [Scilit] [PubMed]
- Pandey, D.; Niwaria, K.; Chourasia, B. Machine learning algorithms: A review. Mach. Learn 2019, 6, 916–922. [Google Scholar]
- Avanzo, M.; Wei, L.; Stancanello, J.; Vallieres, M.; Rao, A.; Morin, O.; Mattonen, S.A.; El Naqa, I. Machine and deep learning methods for radiomics. Med. Phys. 2020, 47, e185–e202. [Google Scholar] [CrossRef] [Scilit] [PubMed]
- Goodfellow, I.; Pouget-Abadie, J.; Mirza, M.; Xu, B.; Warde-Farley, D.; Ozair, S.; Courville, A.; Bengio, Y. Generative adversarial networks. Commun. ACM 2020, 63, 139–144. [Google Scholar] [CrossRef] [Scilit]
- Diederik, P.K.; Max, W. An introduction to variational autoencoders. Found. Trends Mach. Learn. 2019, 12, 307–392. [Google Scholar] [CrossRef] [Scilit]
- Orlhac, F.; Eertink, J.J.; Cottereau, A.S.; Zijlstra, J.M.; Thieblemont, C.; Meignan, M.; Boellaard, R.; Buvat, I. A guide to ComBat harmonization of imaging biomarkers in multicenter studies. J. Nucl. Med. 2022, 63, 172–179. [Google Scholar] [CrossRef] [Scilit] [PubMed]
- Van Griethuysen, J.J.; Fedorov, A.; Parmar, C.; Hosny, A.; Aucoin, N.; Narayan, V.; Beets-Tan, R.G.; Fillion-Robin, J.C.; Pieper, S.; Aerts, H.J. Computational radiomics system to decode the radiographic phenotype. Cancer Res. 2017, 77, e104–e107. [Google Scholar] [CrossRef] [Scilit] [PubMed]
- Zwanenburg, A.; Vallières, M.; Abdalah, M.A.; Aerts, H.J.; Andrearczyk, V.; Apte, A.; Ashrafinia, S.; Bakas, S.; Beukinga, R.J.; Boellaard, R.; et al. The image biomarker standardization initiative: Standardized quantitative radiomics for high-throughput image-based phenotyping. Radiology 2020, 295, 328–338. [Google Scholar] [CrossRef] [Scilit] [PubMed]
- Elyassirad, D.; Gheiji, B.; Vatanparast, M.; Ahmadzadeh, A.M.; Masoudi, M.; Gholami, M.; Moassefi, M.; Faghani, S. Predicting IDH mutation in glioma patients using deep learning algorithms with conformal prediction. J. Imaging Inform. Med. 2026, 39, 1217–1224. [Google Scholar] [CrossRef] [Scilit] [PubMed]
- Du, J.; Yang, L.; Zhang, D.; Wang, J.; Wu, S.; Liu, D.; Yi, H.; Liang, X.; Wang, X.; Shi, Q.; et al. A multimodal ConvNeXt-Tiny deep learning model for simultaneous prediction of IDH mutation and Ki-67 expression in gliomas. PLoS ONE 2026, 21, e0351757. [Google Scholar] [CrossRef] [Scilit] [PubMed]
- Gagnon, L.; Gupta, D.; Nguyen, U.; Correia de Verdier, M.; Saluja, R.; Mastorakos, G.; White, N.; Goodwill, V.; McDonald, C.R.; Beaumont, T.; et al. The University of California San Diego Post-Treatment Glioblastoma (UCSD-PTGBM) annotated multimodal MRI Dataset. Sci. Data 2026, 13, 183. [Google Scholar] [CrossRef] [Scilit] [PubMed]
- Ohgaki, H.; Kleihues, P. Epidemiology and etiology of gliomas. Acta Neuropathol. 2005, 109, 93–108. [Google Scholar] [CrossRef] [Scilit] [PubMed]
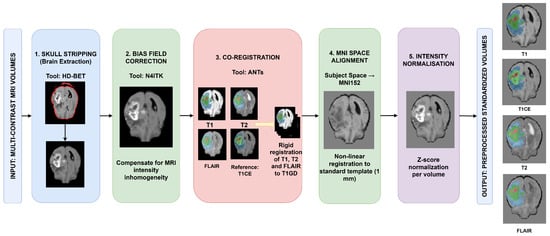
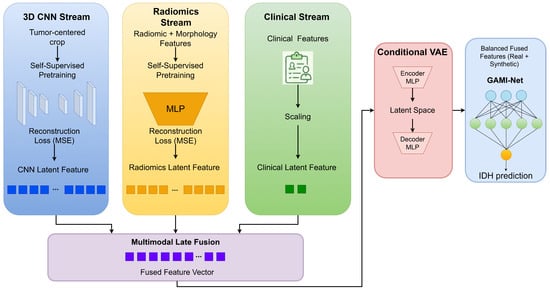
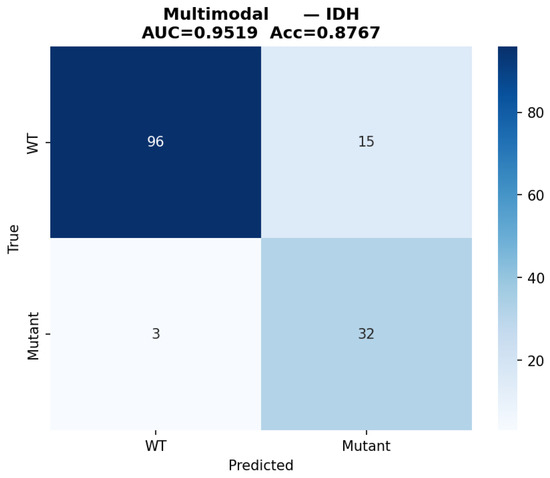
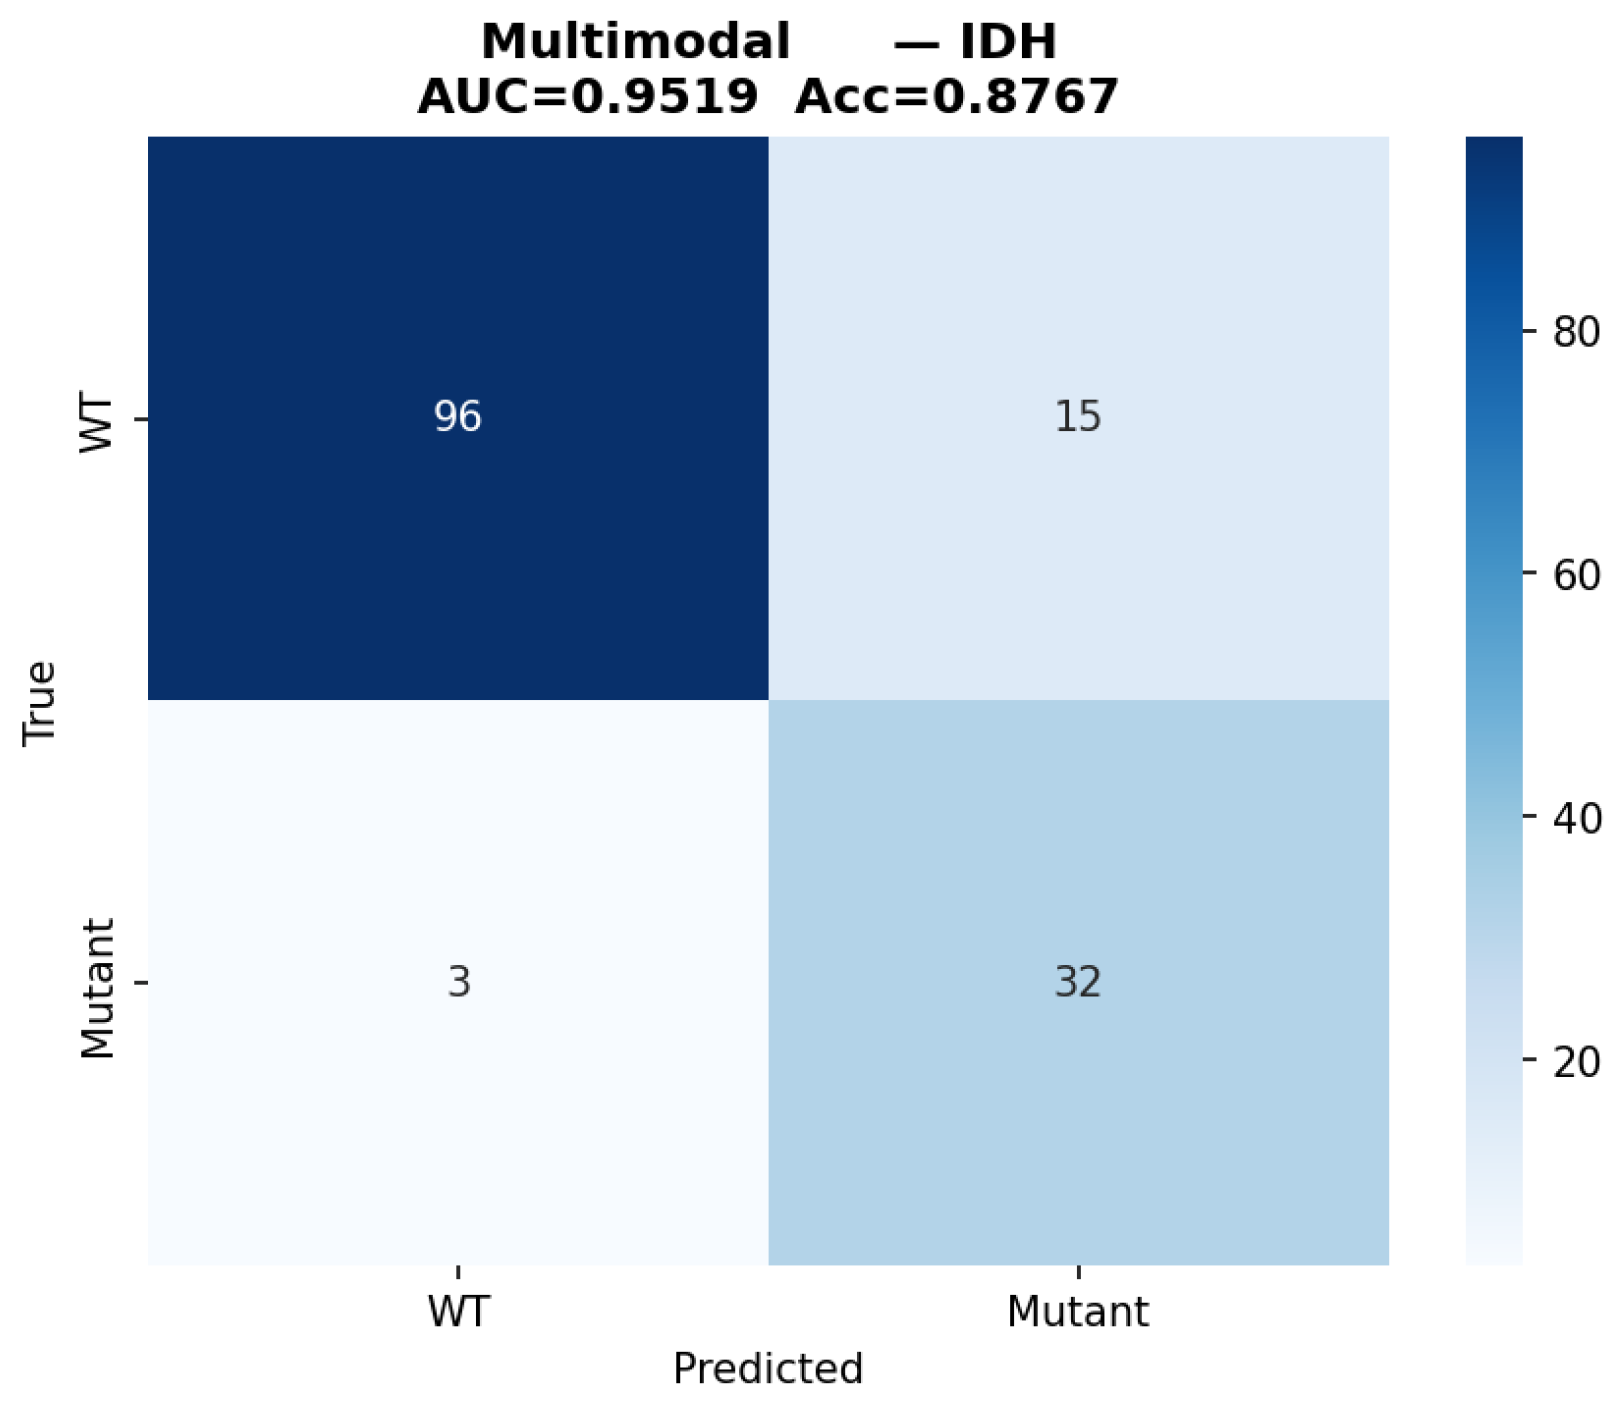
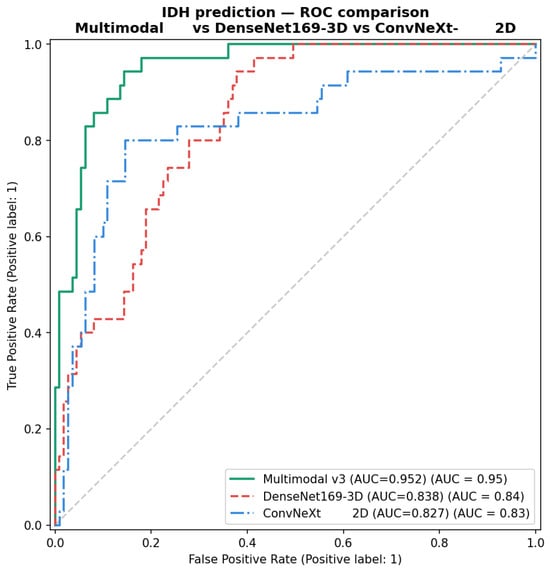
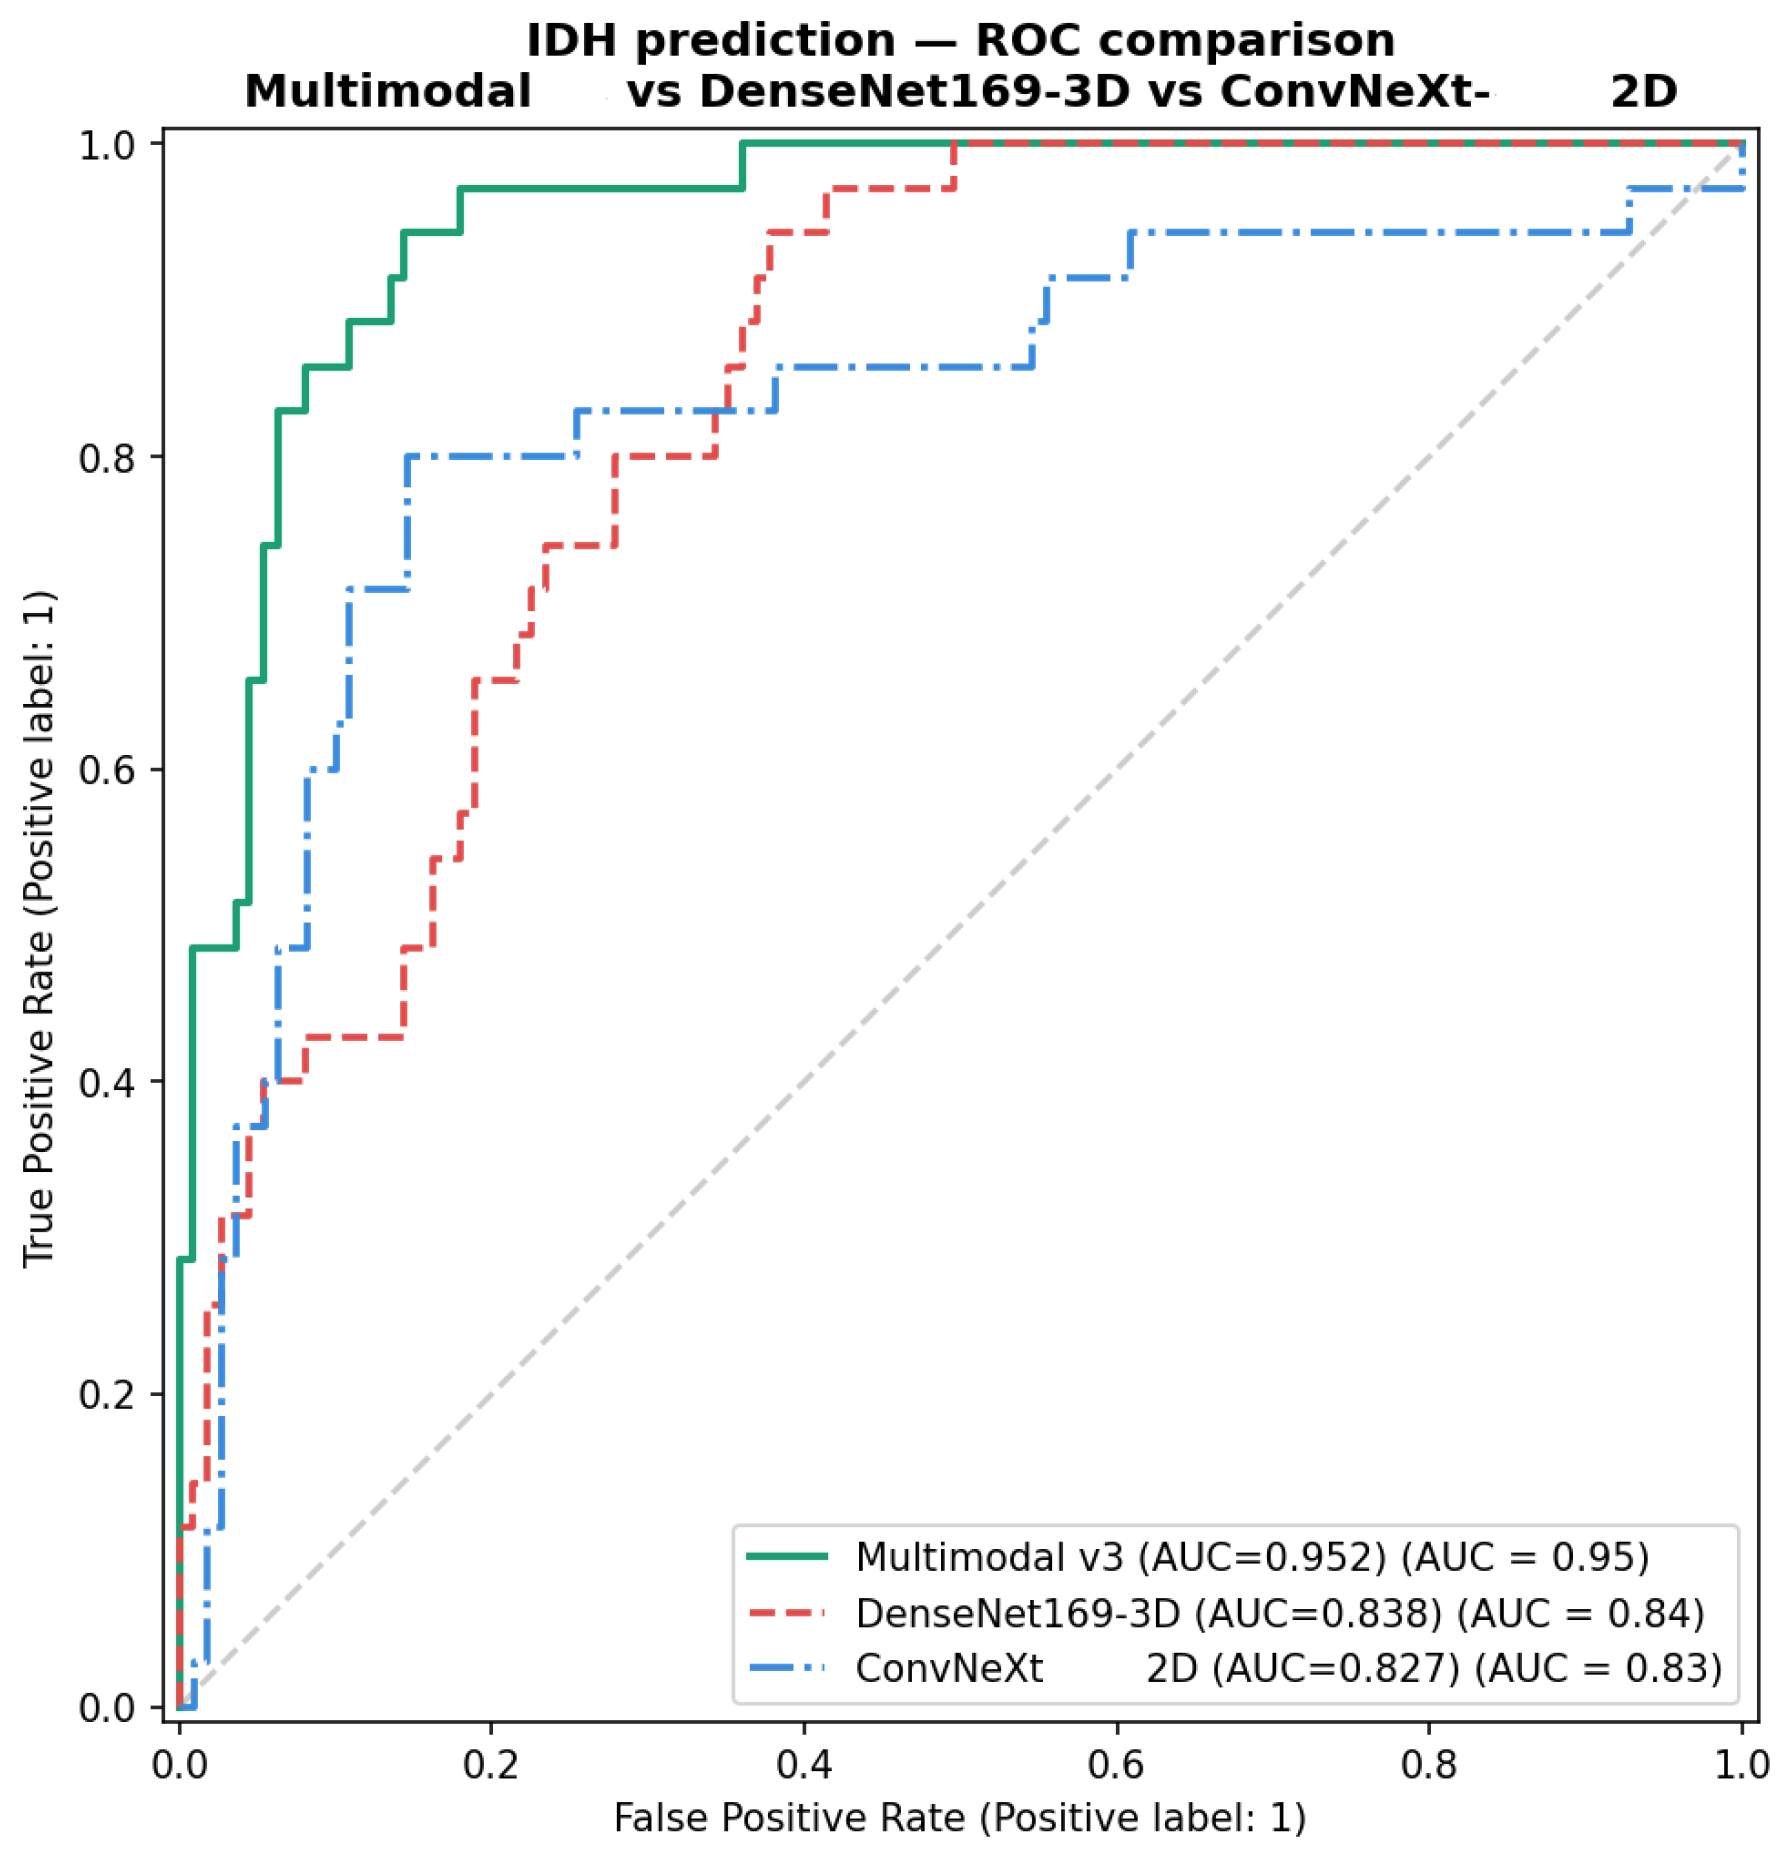
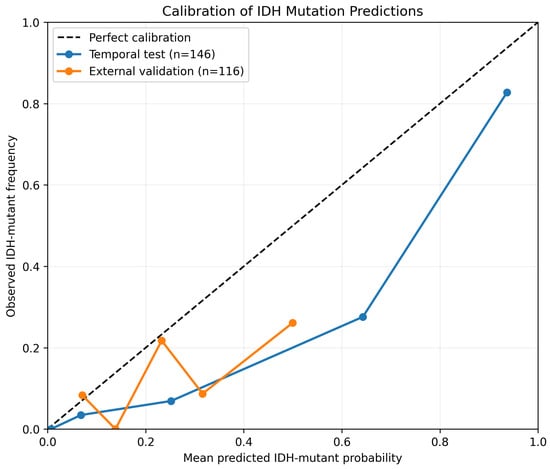
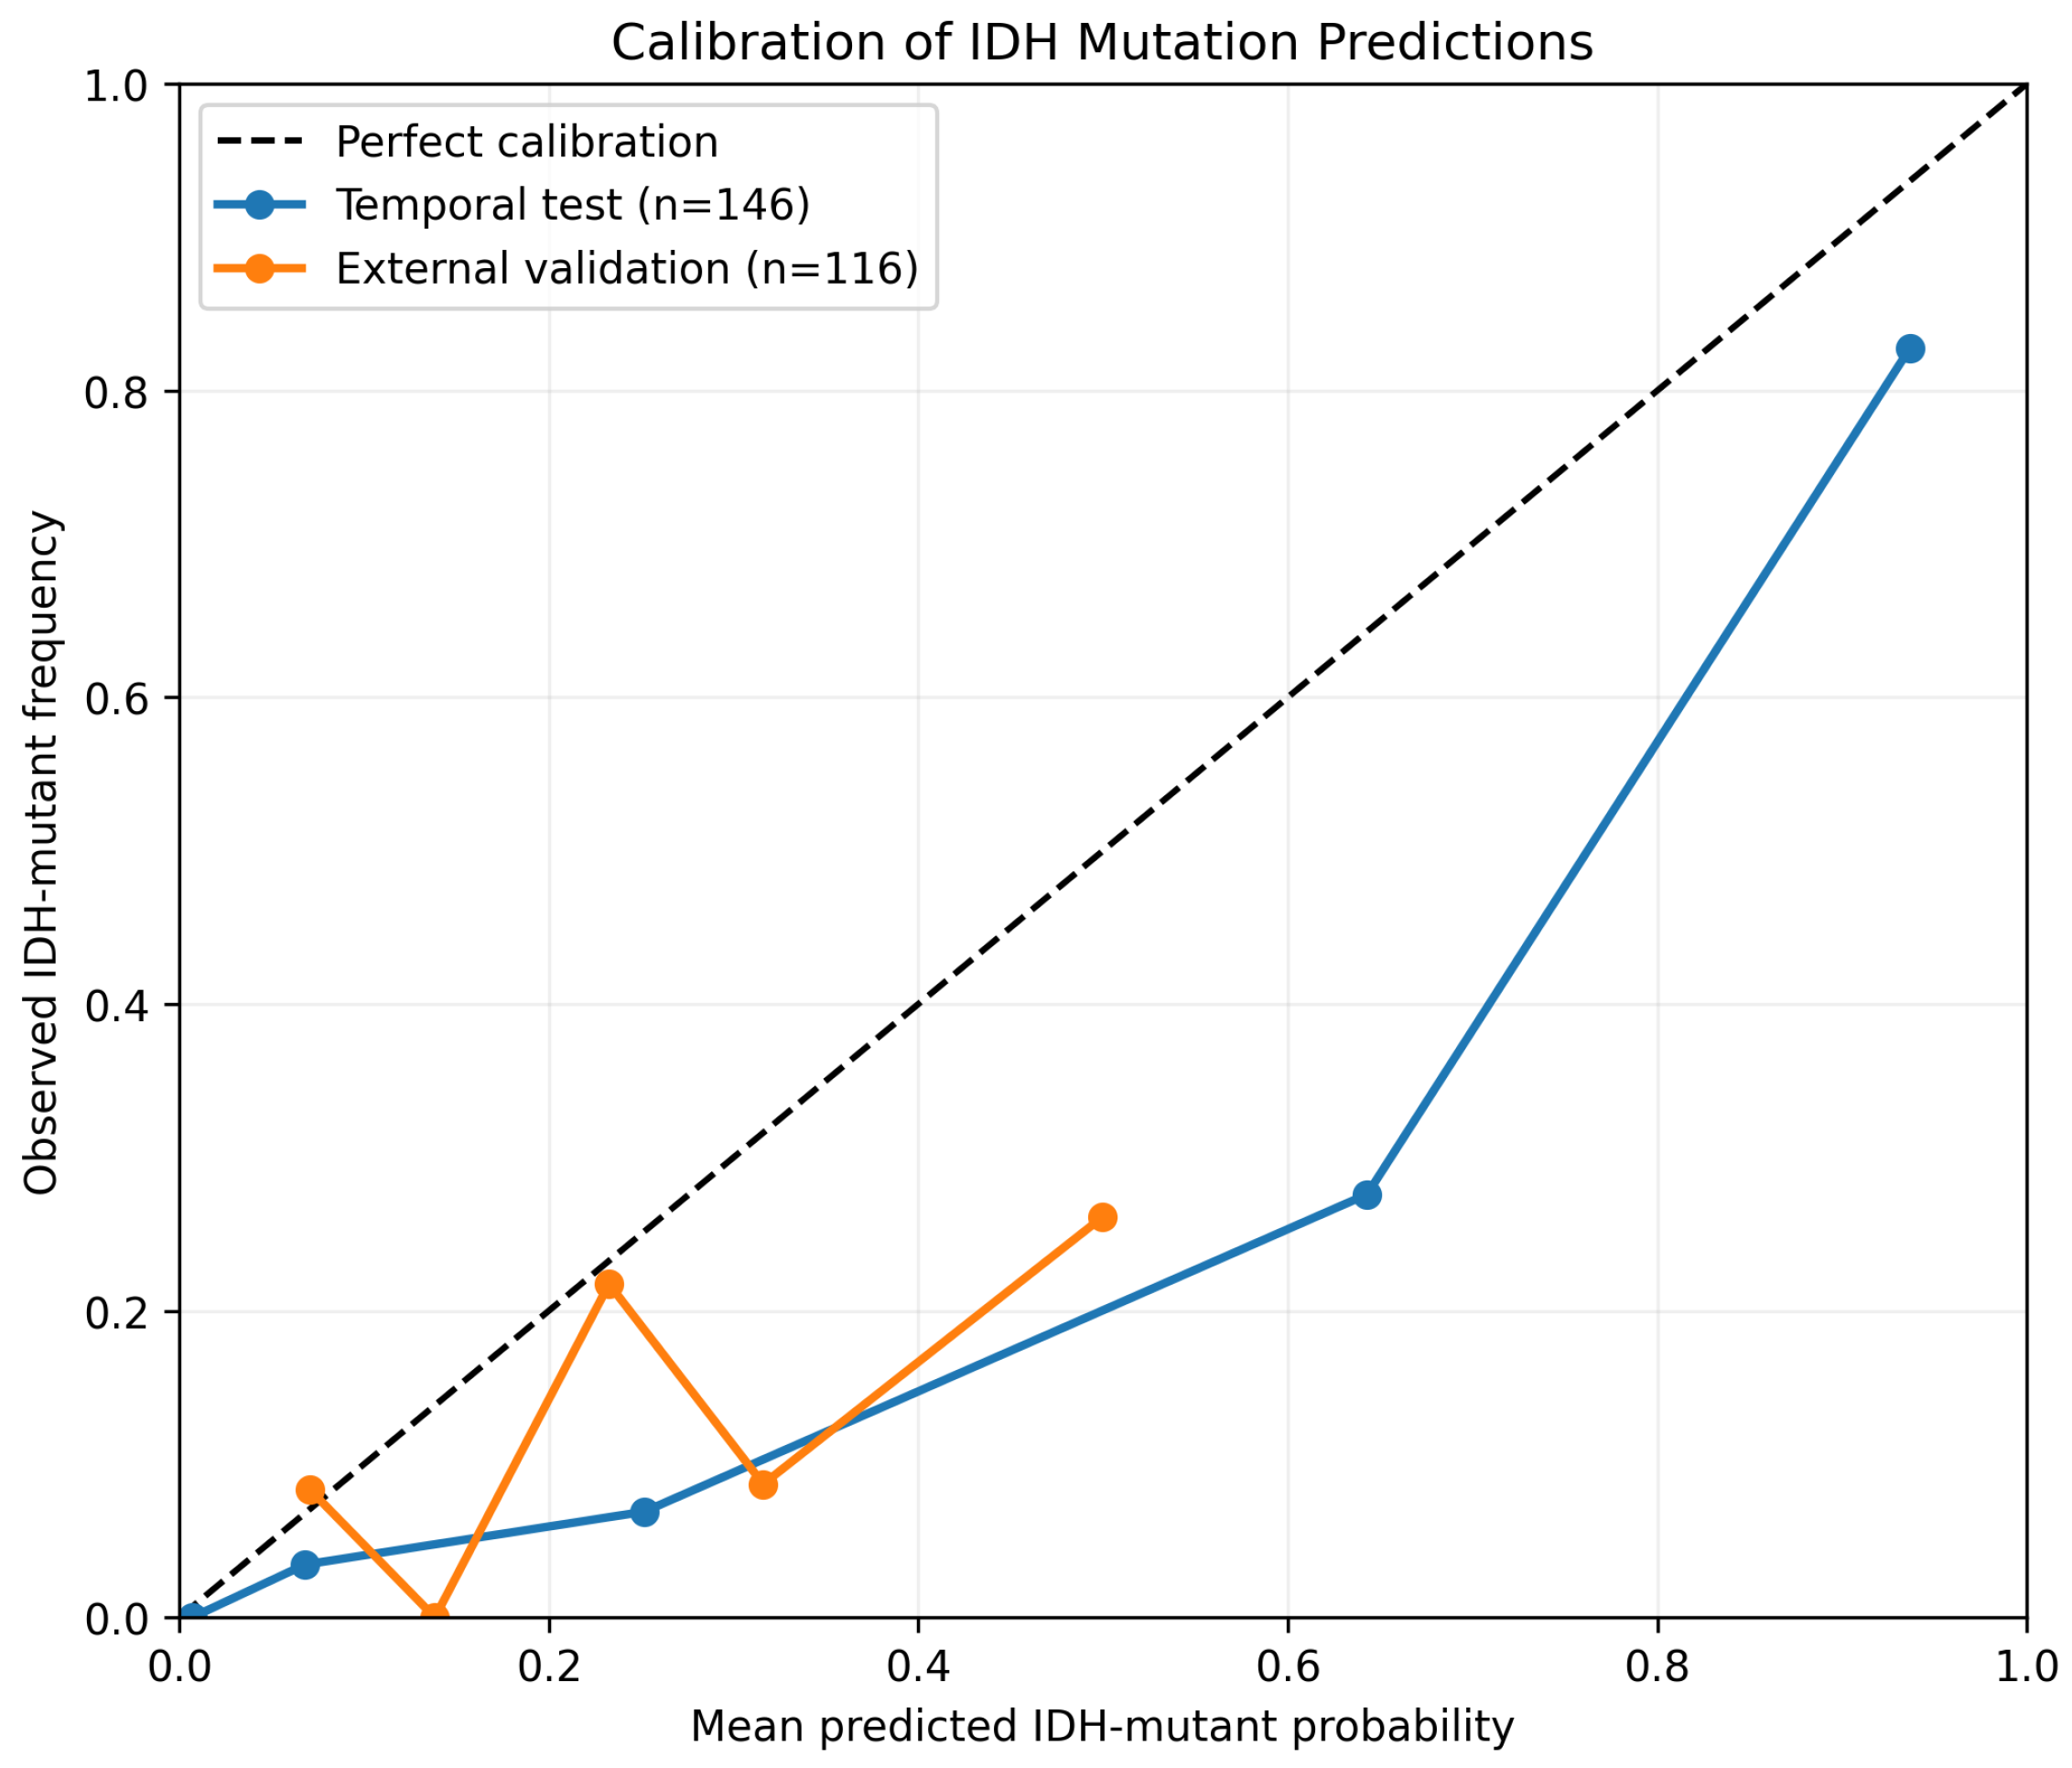
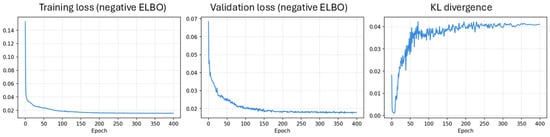
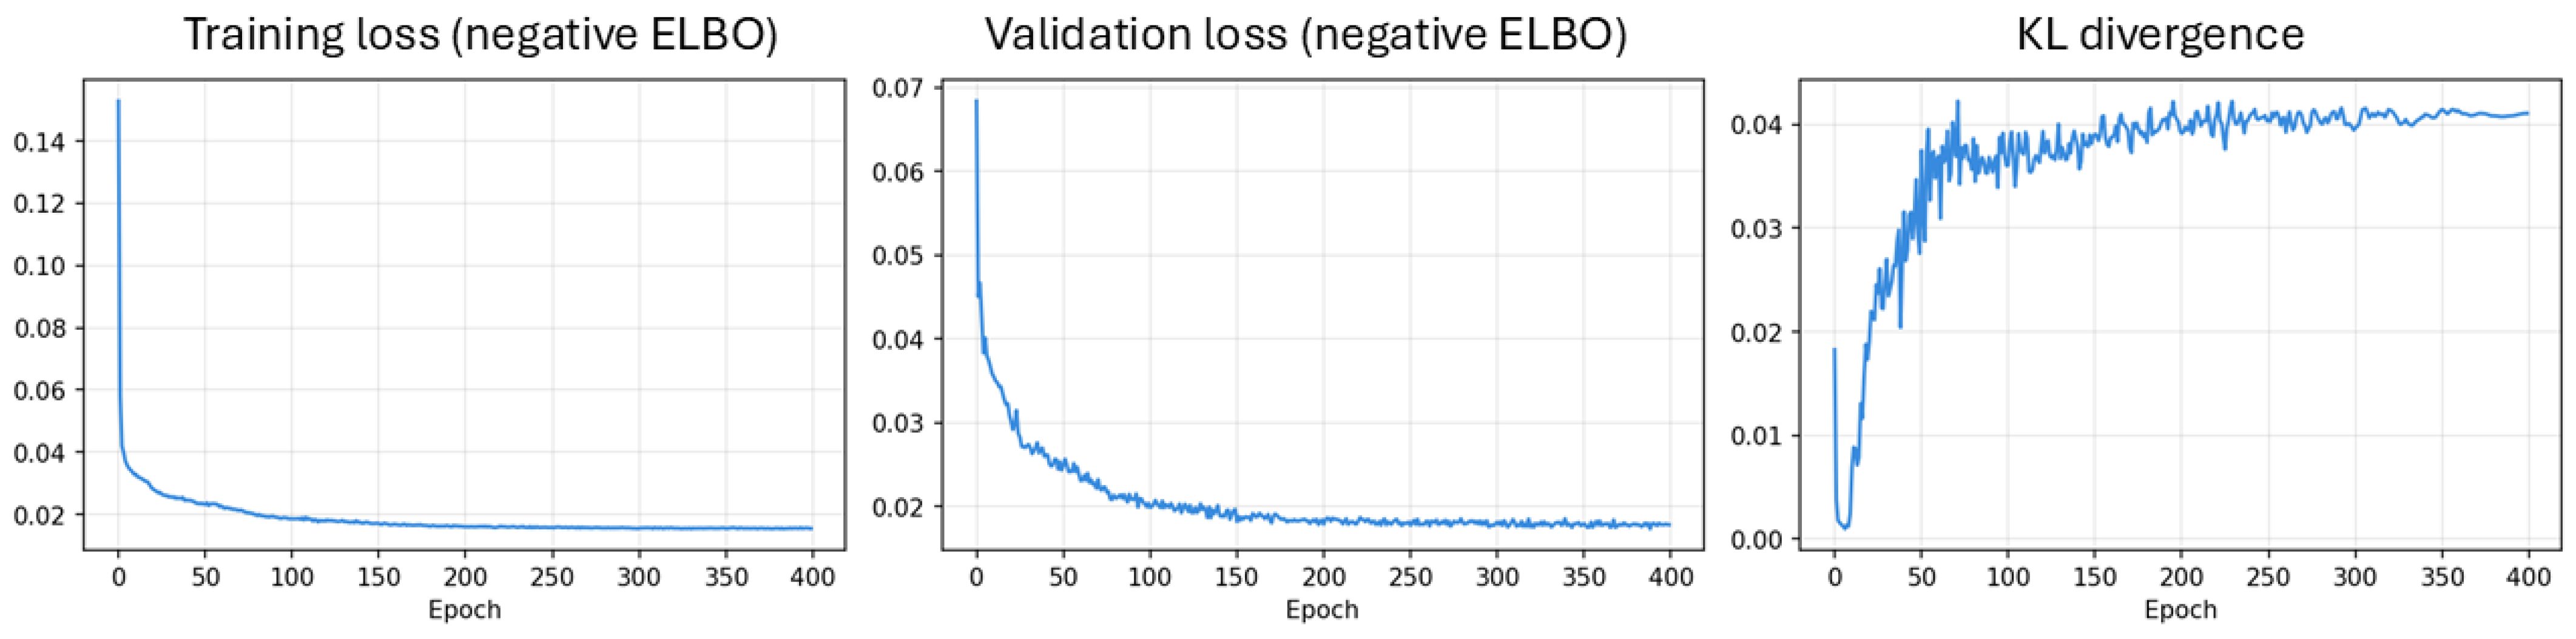
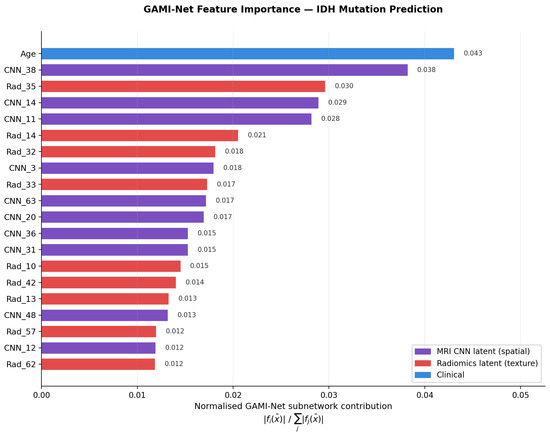
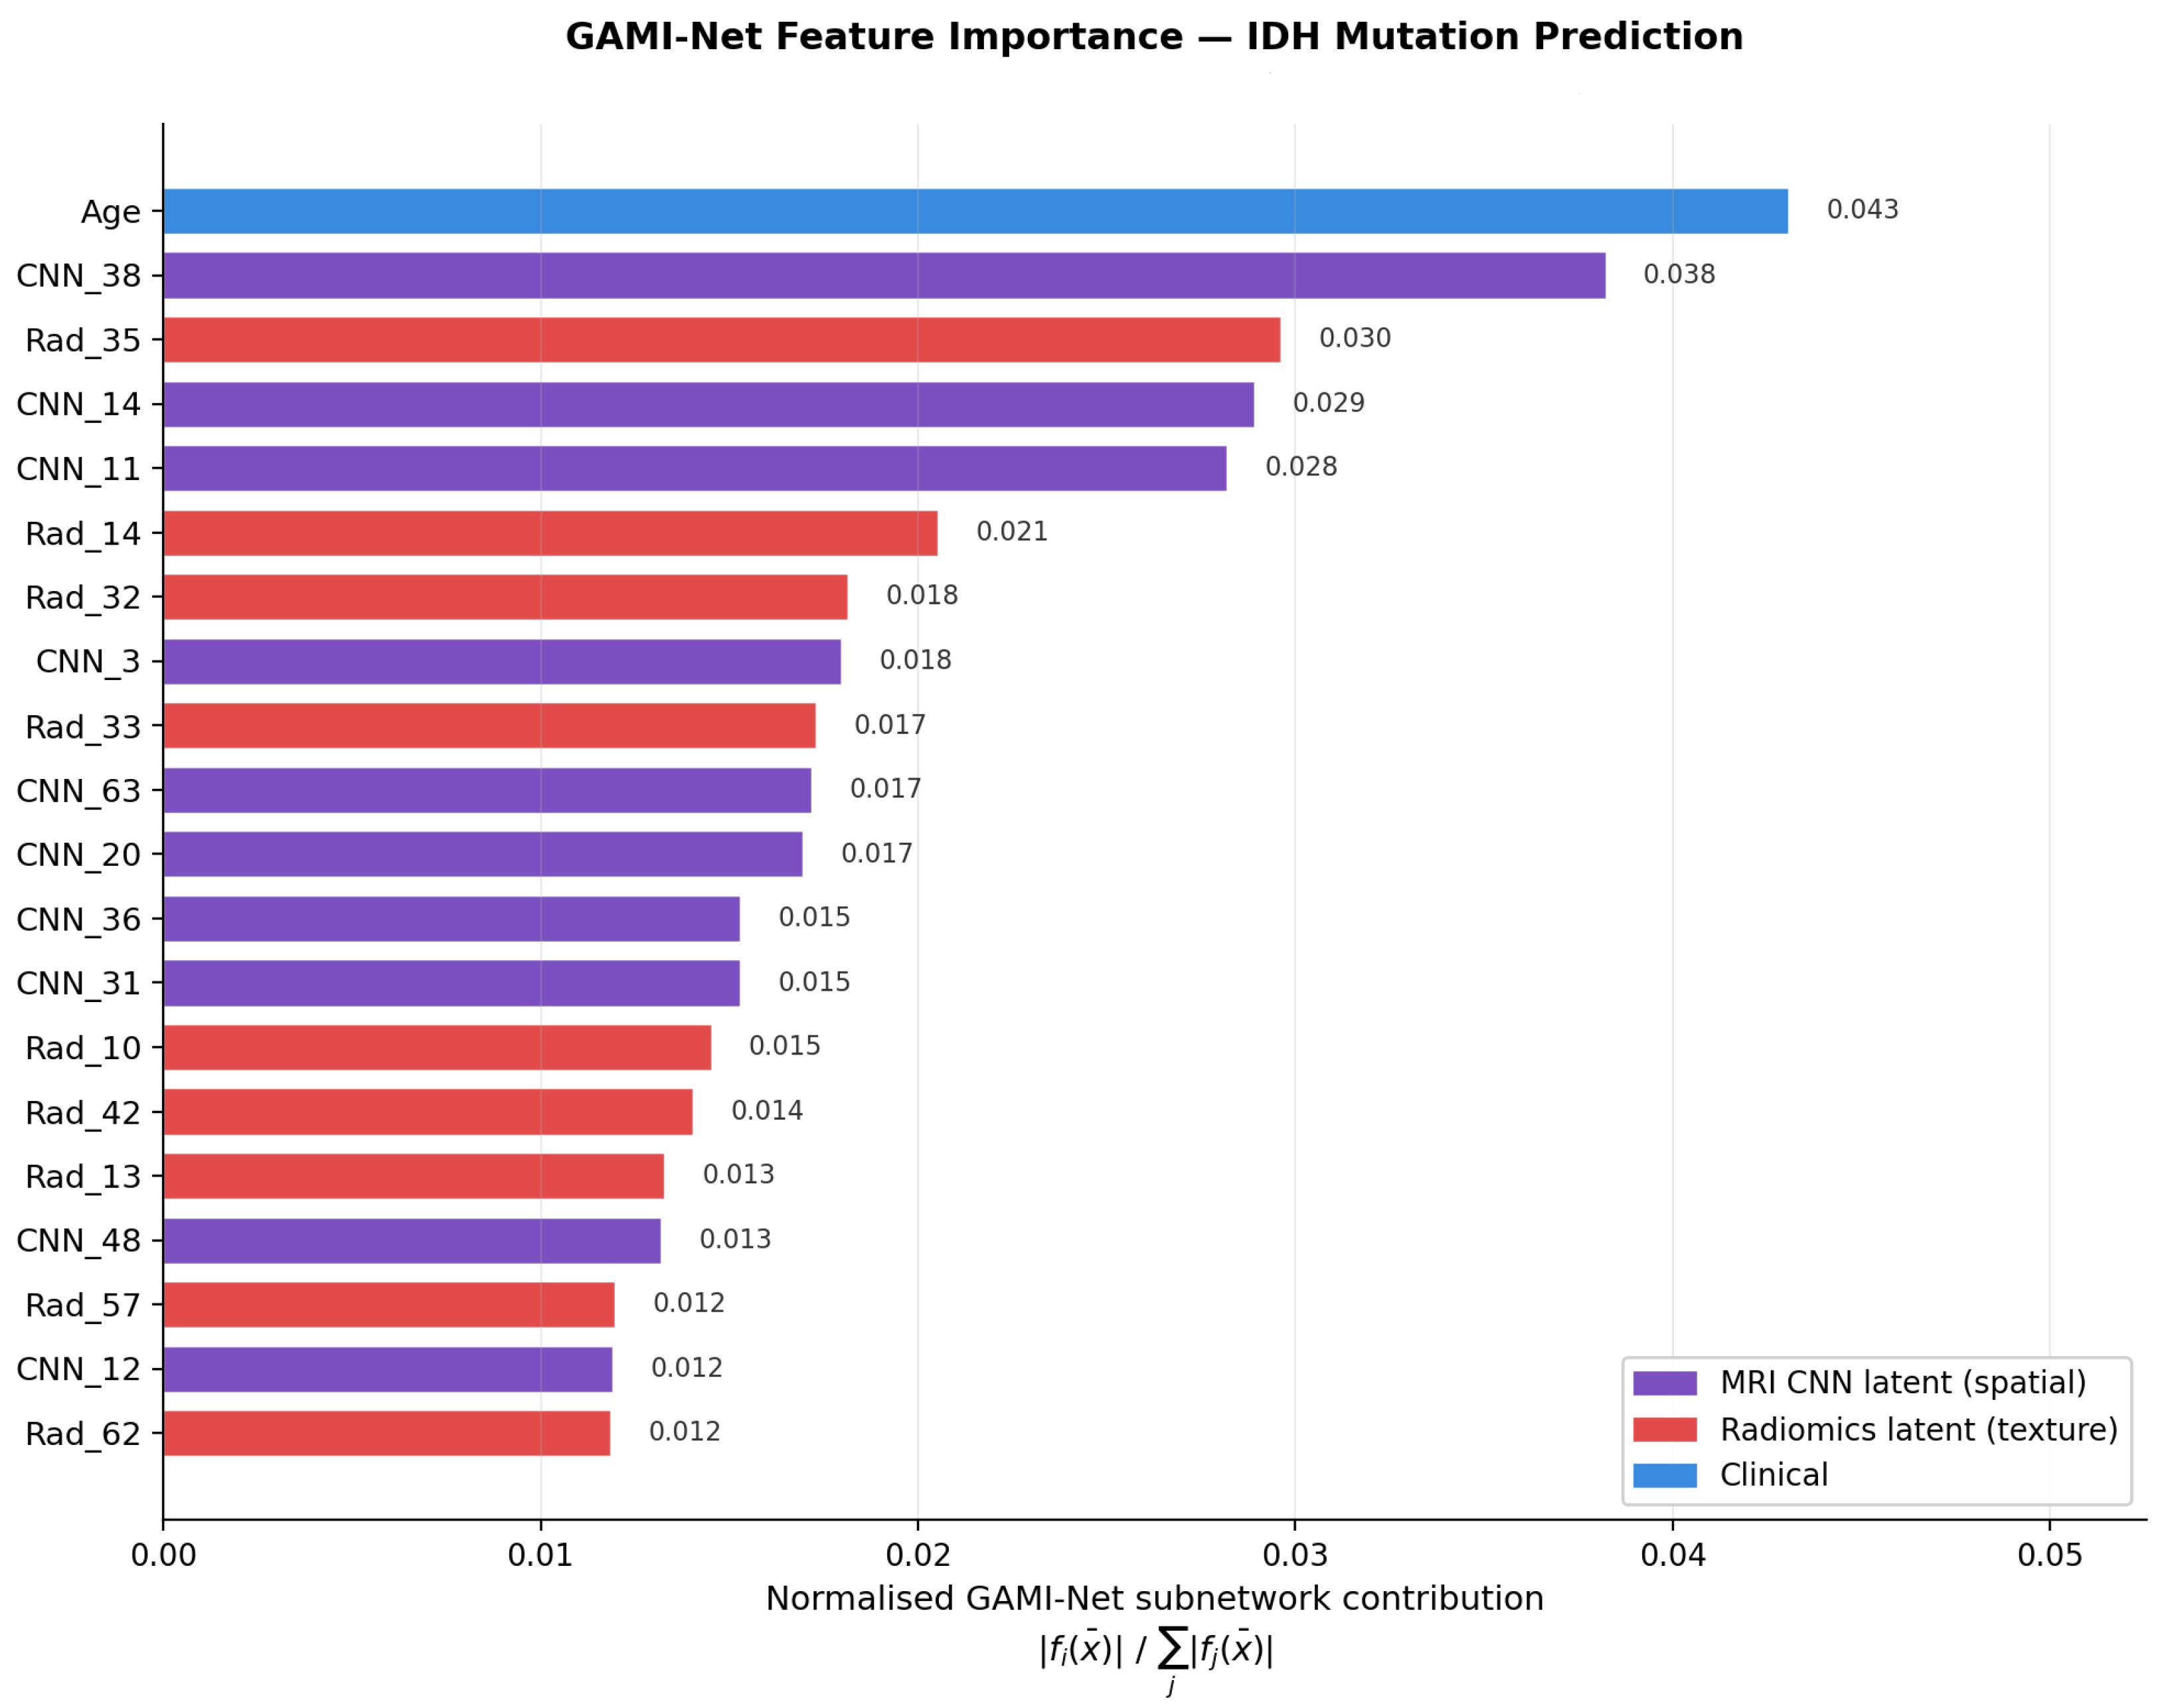
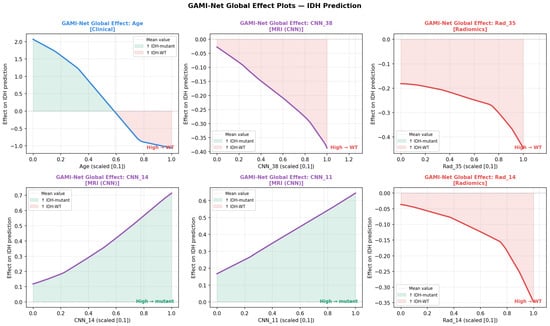
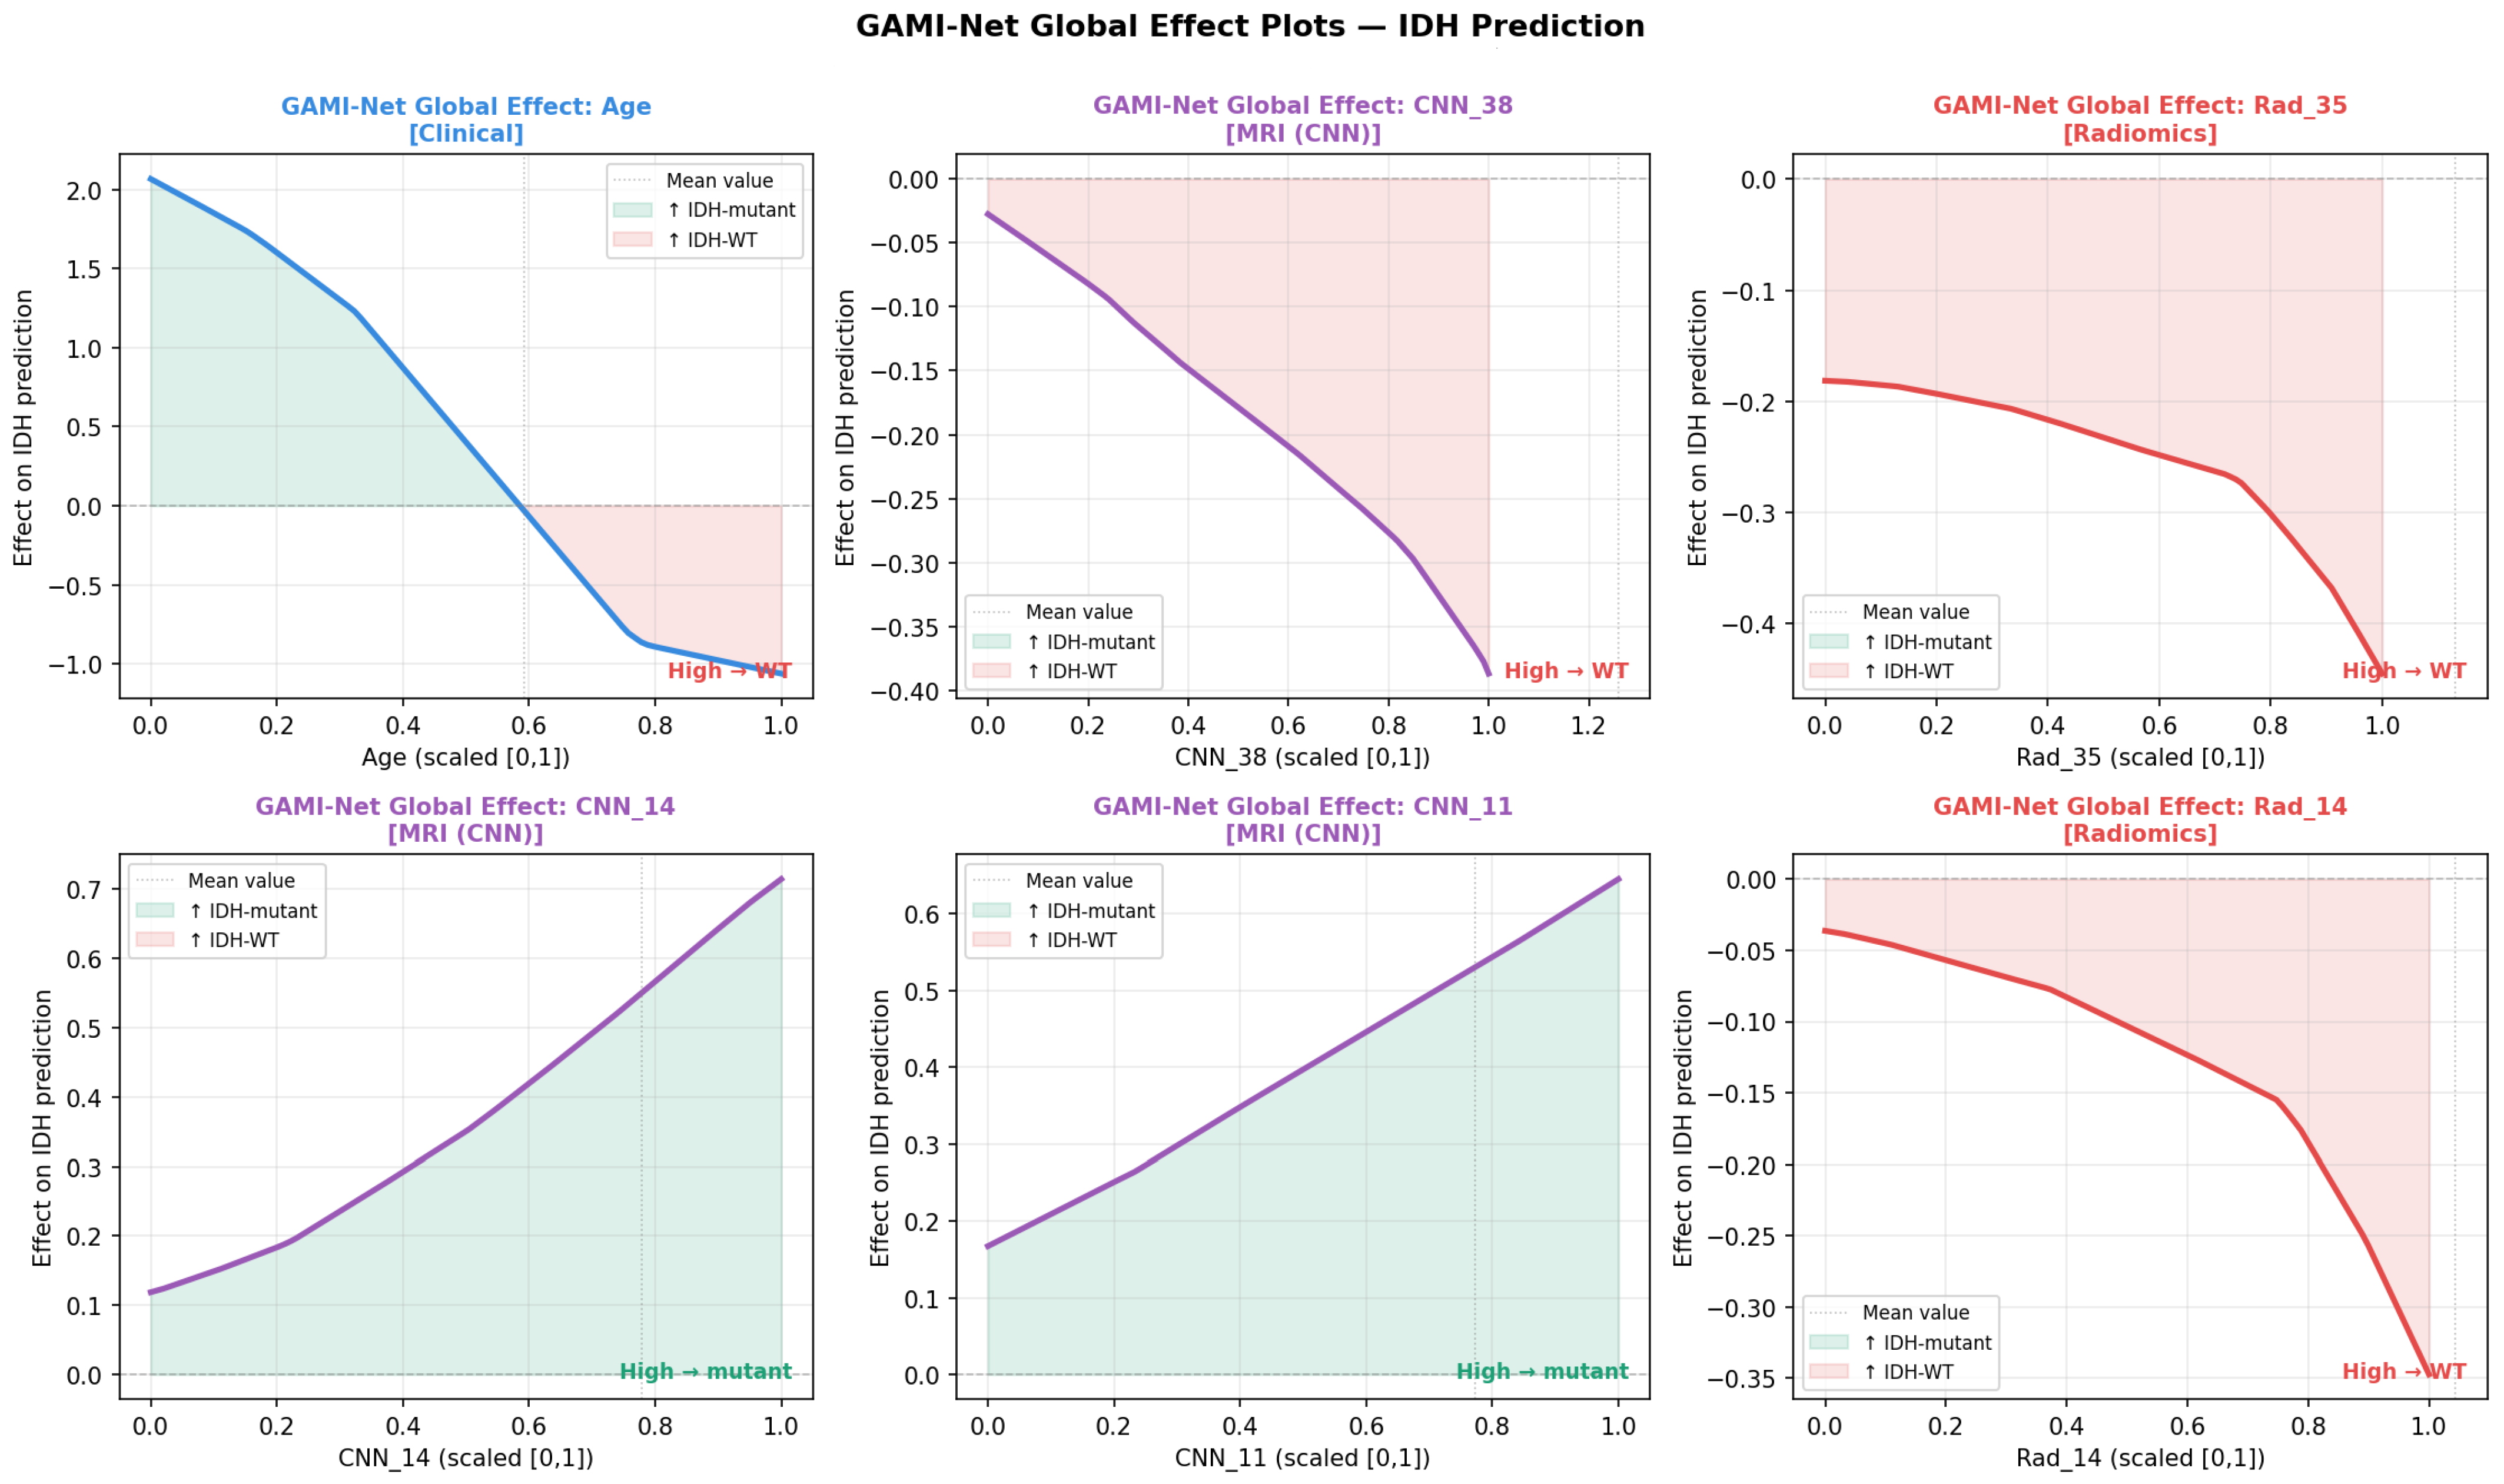

Disclaimer/Publisher’s Note: The statements, opinions and data contained in all publications are solely those of the individual author(s) and contributor(s) and not of MDPI and/or the editor(s). MDPI and/or the editor(s) disclaim responsibility for any injury to people or property resulting from any ideas, methods, instructions or products referred to in the content. |
© 2026 by the authors. Licensee MDPI, Basel, Switzerland. This article is an open access article distributed under the terms and conditions of the Creative Commons Attribution (CC BY) license.