


Abstract
Residential water end-use monitoring is rapidly advancing from passive metering to AI-driven digital telemetry; however, systemic operational trade-offs remain poorly quantified. This systematic review synthesizes N = 100 peer-reviewed studies to critically evaluate algorithm architectures, sensing topologies, and deployment constraints in smart water disaggregation. Quantitative analysis reveals an overwhelming prevalence of non-intrusive paradigms (, ), with () specifically targeting multi-fixture concurrent usage events. While high-frequency setups (≥) utilizing deep learning architectures (e.g., Seq2Point, 1D-CNNs) achieve high disaggregation accuracy () in laboratory environments, performance degrades severely under commercial Automated Metering Infrastructure (AMI) supplying coarse interval data. Four critical technical bottlenecks hindering utility-scale scalability are systematized: (1) severe temporal resolution mismatches between high-frequency training models and utility-scale AMI, (2) non-linear hydraulic superposition during simultaneous fixture activations, (3) domain transferability loss across heterogeneous plumbing topologies, and (4) memory and power constraints hindering edge TinyML execution (≤ SRAM). To address these challenges, an empirically validated three-layer conceptual analytics framework is integrated alongside five evidence-based future research directions, providing a structured roadmap to transition smart water analytics from experimental setups to robust, utility-scale deployments.
1. Introduction
The effective management of domestic water resources is critical for global sustainability amidst rapid urbanization, climate change, and water scarcity. Traditional manual monthly readings are inadequate to capture dynamic household consumption patterns. Consequently, smart water metering and Internet of Things (IoT) systems now enable high-frequency data collection and real-time monitoring of household water use [1], generating high-resolution datasets for domestic water analytics.
Beyond data acquisition, machine learning (ML) and data-driven algorithms are widely applied to forecast residential water demand and model consumption dynamics [2]. Non-intrusive load monitoring (NILM) approaches isolate specific end-use water usage events (e.g., toilet flushing, showering, or washing machines) from high-resolution flow sensors or low-resolution smart meter datasets [3,4]. Various classifiers ranging from Random Forests (RFs) to deep learning (DL) models (e.g., Gated Recurrent Units) distinguish indoor/outdoor usage and appliance signatures [5,6], while socio-demographic factors are increasingly integrated to enhance model interpretability and behavioral relevance [7].
Despite progress in algorithmic performance, the existing literature is still fragmented. Most existing reviews focus on macro-level water distribution networks, secondary supplies, or energy-oriented peak-load optimization [8], or single-purpose algorithms. Consequently, cross-sectional syntheses evaluating micro-level end-use classification, sensor preprocessing, feature engineering, and database dependencies are lacking. To address this gap, this systematic review analyzes peer-reviewed research between 2016 and 2026 (), classifying ML and DL paradigms across domestic water end-use disaggregation, demand forecasting, behavioral profiling, and edge analytics.
While early studies demonstrated the feasibility of IoT-based non-intrusive sensing (e.g., monitoring hydrostatic pressure in domestic tank systems [9]) and recent reviews examined network leak detection [10], a thorough synthesis encompassing end-use analytics, hardware topologies, and multiscale demand forecasting remains absent. This review systematically maps technological bottlenecks and establishes empirical benchmarks to advance scalable smart water analytics.
To systematically address these research gaps and facilitate the synthesis of the existing literature, this review formulates the following fundamental research questions:
- 1.
- RQ1: What kinds of sensor features (for example, characteristics of physical events as opposed to raw time-series) and what levels of input data resolution are most widely used in smart water monitoring systems?
- 2.
- RQ2: Which residential water end-use events are targeted for detection, what analytical frameworks are deployed to identify them, and how do intrusive versus non-intrusive monitoring paradigms compare regarding operational implementation and performance?
- 3.
- RQ3: What ML and DL algorithms attain the highest accuracy and stability when it comes to end-use classification and demand prediction, and how do the various dataset parameters such as sampling frequency, capture duration, and geographical context affect the real-world generalizability and scalability of these algorithms?
The paper is put together as follows: the systematic search method and the criteria applied for including and excluding studies are explained in Section 2, in line with the PRISMA guidelines [11]. Section 3 presents the quantitative and qualitative analyses of the input features, the types of algorithms, the characteristics of the datasets, and the output modalities. In Section 4, a critical evaluation of the current state of the art is given, the technical limitations are pointed out, and a theoretical reference model for future implementations is suggested. Section 5 summarizes the main findings and outlines the possible directions for future research.
2. Materials and Methods
The following section details the systematic search strategy implemented to evaluate the primary literature on artificial intelligence frameworks for residential water end-use disaggregation, event detection, and non-intrusive monitoring. The methodology, guided by the Preferred Reporting Items for Systematic Reviews and Meta-Analyses (PRISMA) statement, was designed to aggregate evidence addressing three core research questions (RQ1, RQ2, RQ3). Scopus was selected as the primary indexing system due to its comprehensive coverage of engineering, computer science literature, environmental sciences and water-related literature. To evaluate potential search scope limitations, a post hoc cross-database validation was conducted against Web of Science Core Collection and IEEE Xplore, confirming an overlap rate exceeding 90% in indexed peer-reviewed journal articles within the smart water analytics domain. The use of a single comprehensive database also ensured a consistent search, indexing, deduplication, and screening framework throughout the review process. Although the use of a single database may result in the omission of studies not indexed in Scopus, this limitation was considered acceptable given the multidisciplinary coverage of the database and is acknowledged as a limitation of the review.
To ensure comprehensive alignment with sensor dynamics (RQ1), operational deployment paradigms (RQ2), and algorithmic performance parameters (RQ3), the search framework was structured into five thematic dimensions, each corresponding to a specialized search query:
- 1.
- Core non-intrusive monitoring (search string1—addresses RQ2): focused on non-intrusive load monitoring (NILM/NIALM) paradigms and aggregate flow disaggregation strategies specifically applied to domestic water consumption.
- 2.
- End-use endpoints (search string2—addresses RQ2): included artificial intelligence, machine learning, and pattern recognition methods used to identify, isolate, and characterize specific fixture-level consumption endpoints such as showers, toilets, washing machines, and outdoor uses.
- 3.
- Hardware and physical sensing infrastructure (search string3—addresses RQ1 and RQ2): examined physical sensing modalities that enable direct operational comparisons between intrusive point-of-use IoT meters and non-intrusive single-point transducers, including flow, hydrostatic pressure, and acoustic sensors, while documenting reported input sampling resolutions.
- 4.
- Algorithmic and computational paradigms (search string4—addresses RQ3): investigated specific machine learning, DL, and metaheuristic architectures, such as SVM, RF, CNN, LSTM, and Transformers, to evaluate model accuracy, stability, and generalizability across various sampling frequencies and geographical contexts.
- 5.
- Signal segmentation (search string5—addresses RQ1 & RQ2): emphasized signal processing mechanisms and feature extraction methodologies, explicitly differentiating physical event characteristics (e.g., slope, peak flow, duration) from raw time-series sequences.
A formal temporal window restricted the search to works published between 2017 and 2026 (PUBYEAR > 2016 AND PUBYEAR < 2027). The final search was conducted using the Scopus on 25 September 2026. This ten-year timeframe was chosen to capture recent state-of-the-art developments and to enable a longitudinal analysis of the evolution of smart water analytics over the past decade. This period specifically encompasses the technological transition from classical ML algorithms using low-frequency measurements to modern DL, edge computing, and high-frequency non-intrusive sensing architectures.
The precise search strings deployed across the Scopus database were formulated as follows:
The full database-specific search strings and syntax search strings are provided in Supplementary Material S1.
The execution of these search strings across the Scopus database yielded a total of 719 records, distributed across the individual search strings as follows: search string 1 (), search string 2 (), search string 3 (), search string 4 (), and search string 5 ().
To promote methodological objectivity, reduce selection bias, and uphold data integrity, we implemented a structured, multi-stage collaborative evaluation framework:
I.N.C.-F. carried out the first instance of database harvesting and the title-and-abstract screening, and the main verification was carried out by F.G.-V. and J.A.N.-P. Then I.N.C.-F., M.A.C.-M., J.A.N.-P. and L.F.L.-V. carried out the full-text eligibility assessment together with the structured parameter extraction using a pre-piloted, standardized digital extraction template. Notably, the whole screening, selection and data harvesting process was done manually, with deliberate avoidance of any automated text-sorting tools or algorithmic filtering software.
Technical rigor in the review was ensured through the supervision of methodological auditing, quality assessment, and strategic synthesis by H.A.G.-O. and J.R.-R. H.A.G.-O. reviewed the completed extraction matrices to resolve data variances, while J.R.-R. adjudicated boundary cases, methodological discrepancies, and final inclusion decisions.
The extracted evidence was structured across three core architectural dimensions to capture the complete operational lifecycle of smart water analytics systems, including physical sensing, signal acquisition, and algorithmic processing. Categorizing the data along these explicit axes enables systematic synthesis directly aligned with the research questions (RQ1–RQ3) and facilitates rigorous trade-off analysis between hardware investment, data sampling resolution, and analytical performance.
- Target applications and analytical performance (informs RQ2 and RQ3): evaluates algorithmic efficacy across specific domestic tasks, primarily fixture-level end-use disaggregation, consumption event detection, and demand profiling. This dimension extracts standardized quantitative benchmarks (such as accuracy, F1-score bounds, precision, and recall) across both macro- and micro-component endpoints, establishing the core analytical mechanisms and model stability required to address RQ2 and RQ3.
- Sensing modalities and signal acquisition (informs RQ1 and RQ3): identifies physical measurement constraints, sampling-rate bottlenecks, and data fidelity dependencies. This dimension extracts sensor technical specifications (including inline flowmeters, non-invasive pressure transducers, acoustic loggers, ultrasonic trackers, and hydrostatic tank level systems), temporal sampling frequencies, capture durations, and feature representations (e.g., physical event characteristics versus raw time-series), directly providing the empirical baseline for RQ1 and the dataset parameters evaluating model scalability in RQ3.
- Deployment topology and computational context (informs RQ2 and RQ3): assesses practical scalability, capital cost trade-offs, edge-computing feasibility, and geographic generalizability. This encompasses spatial monitoring topologies explicitly contrasting centralized non-intrusive single-point meters against distributed intrusive multi-sensor setups (RQ2) as well as execution environments (cloud versus embedded edge nodes) and contextual meta-variables, including geographical region and publication timeline to evaluate real-world transferability (RQ3).
2.1. Study Eligibility Parameters
Methodological rigor and alignment with the review scope were ensured by evaluating candidate documents according to predefined selection standards:
- The articles published in peer-reviewed journals include both original empirical research and systematic literature reviews.
- Full-text academic manuscripts written exclusively in English.
- Studies that implement artificial intelligence, machine learning, or deep learning frameworks for domestic water consumption disaggregation, fixture-level event recognition, or end-use demand profiling at the individual household level. Research conducted in Multi-Dwelling Units (MDUs), apartment blocks, or residential campus dormitories was included only if sensing and algorithmic disaggregation operated at the individual apartment or dwelling unit level.
- The peer-reviewed literature indexed in engineering, computer science, or applied information technology databases.
- Publications from 2016 to 2026 that reflect recent advancements in smart water analytics.
2.2. Study Exclusion Standards
Works were systematically excluded if they failed to meet the specified thematic, linguistic, or structural criteria. The explicit exclusion criteria were as follows:
- Manuscripts published in languages other than English.
- Duplicate records identified in indexed databases during the screening process.
- Publications lacking direct relevance to artificial intelligence applications in residential water management.
- Studies focused on non-residential application domains or operational scales incompatible with residential water management, such as municipal water distribution networks, bulk transmission mains, agricultural irrigation channels, and industrial processing systems including macro-level municipal water distribution networks (e.g., District Metered Areas (DMAs)), bulk transmission mains, city-scale multi-user residential demand profiling, agricultural irrigation, industrial processing, and whole-building commercial or tertiary facilities analyzed as monolithic aggregated entities without unit-level disaggregation.
- Incomplete or preliminary academic outputs, as well as documents restricted by paywalls without full-text open access availability.
2.3. Methodological Assessment and Analytical Synthesis Protocol
Rather than employing a standardized quantitative instrument to assess risk of bias, the possible sources of bias were evaluated in a narrative manner throughout the included literature in order to take into account the great variety of experimental setups, sensor infrastructures, and dataset parameters. When judging the quality of the studies, three main points were stressed: methodological transparency, the clarity with which the dataset was reported, and the rigor of the model validation processes. Two separate reviewers examined these operational aspects and settled any disagreements by means of a structured discussion, without making use of any automated appraisal tools.
The effect size metrics were not calculated, since a quantitative meta-analysis was not carried out; instead, performance metrics reported in individual studies—namely, accuracy, precision, recall, and F1-score—were directly extracted for thematic synthesis.
To address the core research questions in a structured manner, the collected literature was categorized and narratively synthesized across four fundamental axes:
- 1.
- Target application and end-use scope (directly addresses RQ2): identification of targeted residential end-use events, micro-component activities, and demand management applications to systematically map target endpoints and operational mechanisms.
- 2.
- Algorithmic and computational paradigms (directly addresses RQ3): classification of underlying machine learning, deep learning, and hybrid models to evaluate predictive accuracy, classification stability, and comparative algorithmic performance.
- 3.
- Physical sensing, signal mechanisms, and topology (directly addresses RQ1 and RQ2): evaluation of hardware infrastructure, feature extraction types (physical event characteristics versus raw time-series), and operational deployment topologies (intrusive point-of-use IoT versus non-intrusive single-point meters).
- 4.
- Dataset parameters and contextual variables (directly addresses RQ1 and RQ3): synthesis of input sampling resolutions, capture durations, signal provenance, and geographical contexts to assess their direct influence on model generalizability and real-world scalability.
The data points were taken exactly as they were originally published, without applying any mathematical transformations or statistical imputations, and any variables that were not stated were specifically recorded as “not reported”.
The findings were systematically compiled into comparative summary tables. Since there was considerable methodological heterogeneity throughout the corpus, a qualitative synthesis method was used; as a result, quantitative subgroup meta-regressions, sensitivity analyses, and statistical heterogeneity modeling were left out of the analytical framework.
The selection procedure, the screening process, and the final decisions about inclusion are all illustrated in the PRISMA flow diagram (Figure 1) in accordance with the PRISMA 2020 reporting guidelines. A total of 297 records were excluded based on scope, including a residual “Other” category () that combines heterogeneous, low-frequency topics (e.g., water potability, tariff policies, wastewater treatment, and regional groundwater) falling outside the core focus of household-level micro-telemetry and AI disaggregation.
Figure 1.
Preferred Reporting Items for Systematic Reviews and Meta-Analyses (PRISMA) 2020 flow diagram tracking the systematic identification, screening, and multi-tier eligibility stages utilized to establish the final core review literature corpus (). Screening stages detail sequential record exclusion by language (), duplicate removal (), domain focus (), operational scale (), and open access availability (). Full database-specific search strings are provided in Supplementary Material S1.
3. Results
This section presents a synthesis of current evidence from studies focused on residential water consumption monitoring, water end-use disaggregation, consumption pattern recognition, and demand forecasting utilizing ML, DL, and IoT technologies.
3.1. Study Selection and Evidence Summary
The initial search of the systematic database brought up records that assessed data-driven approaches to residential water management. After deleting the duplicate entries, the non-English publications, and the non-empirical items (for example, individual review articles), 100 primary studies satisfied all the predefined eligibility criteria and were therefore included in the final synthesis. The full process of identification, screening and selection adheres to the PRISMA guidelines.
The literature surveyed shows a clear difference between two monitoring approaches: one is the intrusive or direct one which makes use of multi-sensor IoT devices at the point of use—for example, flow meters, acoustic sensors, accelerometers, and ultrasonic sensors installed at individual taps or appliances—and the other one is the non-intrusive or aggregated one that relies on smart water meters at the household or distribution level, operating at a variety of temporal resolutions, such as high-frequency readings of , measurements taken at intervals of , and hourly summaries. The methods used included traditional ML techniques such as Support Vector Machines (SVMs), RF, K-Means, and Spectral Clustering, as well as more advanced DL architectures like CNNs, LSTMs, GRUs, and UNet-based models. In addition, hybrid approaches integrating domain knowledge with unsupervised learning techniques were utilized.
Significant variation in experimental designs, sensor placements, sampling frequencies, and types of end-use appliances (such as showers, toilets, faucets, washing machines, and dishwashers) precluded a formal quantitative meta-analysis. Therefore, the evidence was synthesized using a narrative approach. Methodological limitations observed across studies included data sparsity in high-resolution end-use datasets, limited evaluation of model transferability across spatial or regional contexts, and a predominant focus on laboratory or small-scale pilot studies. Analytical performance was evaluated using classification metrics (accuracy, precision, recall, F1-score), clustering validation indices (Silhouette Coefficient, Calinski–Harabasz Index), and regression error metrics (RMSE, MAE).
3.2. Study Characteristics
The 100 reviewed studies demonstrate considerable methodological diversity, particularly regarding sensing modalities, data sampling frequencies, and predictive targets. The principal application domains include micro-component end-use classification, real-time leak and anomaly detection, daily consumption pattern clustering, and both short- and long-term urban water demand forecasting.
Figure 2 illustrates the temporal distribution of the reviewed publications from 2016 to 2026. Research output between 2016 and 2020 was relatively modest, averaging fewer than five publications annually, except for a minor increase in 2018 (). An inflection point emerged in 2021 (), attributed to the convergence of commercial smart meter deployments and DL architectures. Research activity increased substantially thereafter, maintaining strong momentum in 2022 () and 2024 (), and peaking in 2025 (). The presence of early-indexed studies for 2026 () further demonstrates sustained academic interest and the ongoing evolution of AI- and IoT-driven smart water management paradigms.
Figure 2.
Annual publication trajectory of the synthesized review corpus () spanning 2017 to 2026. The distribution highlights a marked growth acceleration from 2021 onward ( of total corpus published between 2021 and 2025), reflecting the rapid adoption of deep learning and edge analytics in residential telemetry. Values above bars indicate study counts per year; data for 2026 reflects partial-year coverage up to the search execution cutoff.
A bibliometric network of keyword co-occurrences was generated using VOSviewer 1.6.21 to map the intellectual structure and interdependencies between thematic domains across the reviewed literature. As shown in Figure 3, the network topology reveals a rich, multi-cluster landscape illustrating how physical smart sensing infrastructure, computational modeling, and operational management converge in smart residential water research. Major thematic hubs such as machine learning, water consumption, water supply, water use, and Internet of Things act as central structural anchors connecting data acquisition modalities with high-level utility management goals.
Figure 3.
Bibliometric keyword co-occurrence network generated using VOSviewer mapping structural interdependencies across the synthesized review corpus (). Node sizes reflect keyword occurrence frequency, line thickness denotes co-occurrence link strength, and distinct colors designate major thematic clusters: red (algorithmic paradigms and classification models), green (IoT sensing hardware, sensors, and real-time telemetry), and blue/yellow (water end-use consumption, supply, and behavioral management).
The network topology resolves into three primary interconnected thematic clusters:
- Algorithmic paradigms and computational intelligence: encompassing machine learning and deep learning methodologies, this domain links supervised classification, regression, and sequence modeling (including Decision Tree (DT), Random Forest (RF), SVM, ANN, and LSTM) with disaggregation routines and pattern recognition for end-use analytics.
- Sensing infrastructure, IoT, and telemetry: centered on edge hardware and data acquisition, this cluster connects physical monitoring interfaces such as IoT nodes, smart water meters, flow sensors, and real-time monitoring pipelines with network-level applications like leakage detection.
- Water consumption, end-use profiling, and utility operations: grouping system-level and consumer-facing dimensions, this cluster links water supply management, storage tracking, and decision support systems with household consumption profiling, water-level tracking, and end-use behavior analysis.
3.3. Deployment Architecture
The physical deployment architecture determines the distribution of telemetry and sensor networks within water distribution infrastructure. This configuration directly influences data granularity, computational overhead, and the algorithmic complexity necessary for end-use disaggregation. Rather than adopting a single topological model, the literature identifies a range of deployment strategies that seek to balance hardware investment costs with analytical precision.
Across all reviewed studies, which include both primary empirical field deployments and secondary benchmark or synthetic dataset evaluations, the target deployment scope was systematically categorized into five structural topologies (Figure 4). Non-intrusive paradigms overwhelmingly dominate the domain, collectively representing 89.0% of the corpus (). Specifically, macro-level non-intrusive aggregated grids (such as campus, building, or district meter area monitoring) represent the most frequent spatial scope at 45.0% (), closely followed by micro-level non-intrusive single-point household telemetry at 44.0% (). In contrast, intrusive/direct sensing at the individual fixture level comprises only 8.0% () due to elevated hardware costs and installation invasiveness. Finally, categories with minimal sample representation specifically Multi-Tier and Edge Architectures (, 2.0%) and Context-Enriched Monitoring (, 1.0%) are explicitly designated as nascent research trajectories. While retained to maintain complete taxonomic mapping across the reviewed corpus, these low proportions represent pioneer exploratory paradigms rather than statistically mature sub-fields, serving as qualitative indicators of emerging technological directions.
Figure 4.
Distribution of sensor deployment architectures and spatial monitoring scopes across the evaluated literature (). Note: categories with (Context-Enriched Monitoring and Multi-Tier and Edge Architectures) denote nascent research trajectories rather than mature sub-fields.
3.3.1. Micro-Level vs. Aggregated Sensing Paradigms
At the most granular level, intrusive (direct) sensing attaches physical sensors directly to isolated sanitary fixtures and appliances [12,13,14,15,16,17,18]. Although intrusive setups avoid issues related to signal overlap and deconvolution, their high installation costs and invasive maintenance requirements restrict their application mainly to ground-truth validation datasets. In contrast, non-intrusive single-point monitoring at the main residential meter continues to be the prevailing approach for Non-Intrusive Appliance Load Monitoring (NILM) [1,2,3,5,6,19,20,21,22,23,24,25,26,27,28,29,30,31,32,33,34,35,36,37,38,39,40,41,42,43,44,45,46,47,48,49,50]. These single-point frameworks have been extended beyond standard domestic residences to centralized meters in Multi-Dwelling Units (MDUs) [51], high-frequency dynamic flow profiling at the meter node [52], specialized infrastructure such as rooftop tank systems [53], regions with Intermittent Water Supply (IWS) [54], and evaluated across multi-household validation cohorts [55,56,57] as well as large-scale open benchmarks encompassing up to 762 homes [58]. To eliminate physical plumbing modifications and reduce hardware replacement costs, non-invasive deployment strategies have evolved toward acoustic and distributed surface-mounted pipe sensing [59,60] as well as camera-based optical retrofits mounted directly onto legacy mechanical meters [61]. Beyond single-resource disaggregation, whole-house single-point architectures are increasingly extended to multi-utility paradigms, such as coupling smart water and electricity meter telemetry to model the water–energy nexus and forecast joint household demand [62,63]. Furthermore, recent methodological advancements have enhanced aggregated flow series by incorporating socio-demographic surveys, spatial metadata, and micro-ambient environmental variables to address classification ambiguity [64,65,66,67].
3.3.2. Macro-Grids and Edge Computing Paradigms
At a larger scale, aggregated grid architectures extend beyond individual households to enable monitoring of multi-apartment residential complexes [68], multi-unit housing society storage tank systems [69], Wireless Sensor Network (WSN)-based multi-household clusters [70], real-world residential multi-meter networks [71], grid-level multi-user residential profiling networks [72], academic residential campus dormitories (unit-level monitoring), multi-household residential smart metering networks, and full city-scale smart city grids [7,73,74,75,76,77,78,79,80,81,82,83,84,85,86]. Macro-level deployments emphasize urban demand forecasting, diurnal curve clustering, and distribution loss management rather than micro-event profiling. Multi-tier, master–slave hierarchical IoT topologies [87], and Edge Architectures currently constitute the state-of-the-art hybrid framework [4,88]. By embedding microcontrollers such as ESP32 or other edge microprocessors directly at the meter node, local feature extraction and noise filtering can be carried out before the data is transmitted to the cloud. This method greatly decreases the bandwidth needed and deals with privacy concerns [89,90,91].
A comparison of the trade-offs among the key technical vectors is presented in Table 1 in order to assess the operational suitability of these physical configurations.
Table 1.
Comparison of deployment architectures using a trade-off matrix based on technical implementation criteria.
3.4. Sensors and Hardware Infrastructure
Physical hardware infrastructure forms the basis for data collection in residential water management networks. The choice of sensing hardware directly constrains temporal sampling frequency, signal-to-noise ratio, edge computational capacity, and data privacy overhead, thereby influencing the selection of downstream AI models. To assess these physical telemetry constraints in the reviewed literature, hardware modalities were classified into five primary sensing tiers. Several studies implemented multi-modal or hybrid sensing configurations, such as combining pressure transducers with volumetric flow meters or integrating electrical load profiles with flow signals. As a result, the hardware taxonomy accounts for 105 technology adoptions across the 100 papers analyzed. Figure 5 presents the trade-off between sensing granularity and deployment scale within this hardware spectrum.
Figure 5.
Distribution and taxonomic spectrum of hardware sensing infrastructure adopted across the review corpus (). Numerical values adjacent to horizontal bars represent absolute study counts (N). The spectrum highlights the strong prevalence of commercial utility smart meters (, ), reflecting the emphasis on leveraging low-frequency AMI/AMR telemetry, contrasted against high-precision edge retrofits and point-of-use IoT sensing (, each).
3.4.1. Utility-Scale AMI Networks vs. Sub-Metered Edge Retrofits
Most large-scale deployments utilize commercial digital smart water meters or high-temporal-resolution metering units integrated into Automated Meter Reading or Advanced Metering Infrastructure (AMR/AMI) for grid-level logging [2,4,5,20,24,25,26,27,29,31,32,33,35,36,37,38,47,48,51,55,56,57,58,63,65,67,71,72,73,77,79,81,82,83,84,85,86,88,90,92,93,94,95,96,97,98,99]. These systems record aggregated volumetric flow at sampling intervals between 1 min and 24 h. This temporal resolution is suitable for macro-level billing and urban forecasting applications, but it presents challenges for fine-grained event disaggregation. To address this limitation without incurring the costs of extensive utility infrastructure upgrades, custom non-intrusive retrofits and sub-metering configurations integrate high-speed instantaneous flow sensors [52], pulse emitters (such as Cyble sensors), non-contact ultrasonic transducers [50], optical image sensors mounted directly on legacy analog meters [61], external pipe-surface contact thermistors [60], or contact acoustic transducers (e.g., stethoscope chest pieces with electret microphones) [59] coupled with low-cost microcontrollers (including ESP32, Arduino, and NodeMCU) or dedicated microcomputers for localized processing [39]. This configuration enables sub-second pulse logging, high-speed instantaneous flow capture, thermal pipe trace profiling, digitized register extraction, and on-device edge processing [1,3,6,19,21,22,30,39,50,52,59,60,61,78,91,100].
3.4.2. Point-of-Use IoT Nodes and Multi-Modal Physical Sensing
Where signal overlap makes it impossible to carry out a non-intrusive decomposition, intrusive hardware at the device level is installed directly at end-use locations (for example, showers, taps, toilets, and washing machines). Such systems make use of Hall Effect flow sensors (frequently utilizing standardized models like YF-S201) [40,46], inline meters, integrated IoT level and flow monitoring hardware [54], and smart shower heads frequently coupled with local LCD displays and ESP32/ESP8266 edge processing nodes in single or hierarchical master–slave configurations [42,49,87], automated control actuators (such as solenoid valves and relay modules) [41,69], or geo-referenced hybrid LoRa and Wi-Fi communication modules to track spatial distribution [12,13,14,15,16,17,18,44,68,70]. In addition to volumetric flow meters, researchers increasingly employ multi-modal physical sensing configurations that integrate water flow metrics with power sensors and microcontrollers [43], circuit-level electricity monitoring [62,63], thermal/temperature transducers [49], float-switch sensors coupled with magnetic contactors and SMPS modules for automated pump level control [53], water quality monitoring via Total Dissolved Solid sensors [69], non-contact ultrasonic level and rain/leak detection sensors [45,50,69], hydrostatic tank water-level sensors [43], distribution line pressure sensors, and contact acoustic transducers [9,34,59,66,80,89] to isolate transient hydraulic events, monitor tank/quality dynamics, and identify pipe leaks or end-use signatures.
3.4.3. Exogenous Contextual Data and Synthetic Augmentation Engines
Advanced predictive frameworks supplement physical hardware telemetry by incorporating multi-source contextual data, including CMIP6 climate projections, real-time meteorological feeds, demographic audits, and water literacy surveys [7,23,28,64,65,74,75,76,93,101,102]. Synthetic data engines, including CTGANs and stochastic water-use simulators, are utilized to address telemetry data scarcity and class imbalance during supervised model training.
Table 2 presents the technical specification matrix, which associates hardware categories with sampling intervals, principal physical metrics, and supported AI analytical tasks.
Table 2.
Technical specification matrix of sensing hardware, sampling resolutions, and enabled AI tasks.
3.5. Sampling Resolution
The temporal sampling resolution in smart water telemetry is a fundamental aspect of design since it determines how much signal processing is needed, what transmission bandwidth is used, and the extent of analysis that can be performed by downstream artificial intelligence algorithms. The sampling frequency is not just a choice regarding data collection; it establishes a definite limit on the feasibility of any model. For example, telemetry collected at intervals of less than a second enables a direct analysis of hydraulic transients, while data that has been aggregated on an hourly basis limits the analysis to macro-demand profiling. Figure 6 displays the proportional distribution of the temporal sampling methods identified in the reviewed literature.
Figure 6.
Proportional distribution of temporal sampling resolution regimes across the reviewed literature corpus (). The breakdown highlights a major technical bottleneck: the gap between coarse commercial utility logging (, to daily AMI) and high-frequency experimental sensing (, ≤ or sub-second resolution), which restricts the real-world deployment of deep learning disaggregation models. The remaining literature utilizes event-driven asynchronous pulse logging () or adaptive multi-resolution schemes ().
3.5.1. Sub-Second Telemetry and Micro-Dynamic Signal Disaggregation
High-frequency real-time logging at sub-second to 5 s intervals (≤, , or ) facilitates the capture of rapid flow acceleration, high-frequency instantaneous flow sampling [52], fluid dynamics [39], transient pressure pulses, acoustic time-series signatures [59], point-of-use thermal variations [60], experimental flow rate time-series [42], and sequential image frame capture [61] directly at the meter node. This temporal resolution, alongside high-frequency continuous time-series logging [57], high-resolution interval sampling ( to ) [62], and continuous real-time IoT wireless streaming architectures such as microcomputer processing with online GUI uploads [39], Node.js cloud backends with push notifications via Firebase Cloud Messaging [50], cloud computing backends with mobile apps [54], discrete-level event sensing with embedded hardware control logic [53], LoRa/LoRaWAN and LPWAN-to-Wi-Fi gateways streaming to cloud services like ThingSpeak or Google Sheets [44,49,68], master–slave Wi-Fi node networks [87], real-time edge processing with MQTT pipelines to Grafana Cloud or SQLite [46], dual MQTT and HTTP/REST APIs [45], web/mobile interfaces such as Blynk [48,69], and continuous IoT cloud platforms [40,41,43,47] preserves edge characteristics essential for high-accuracy NIALM, overlapping event classification, and timely pipe burst detection [1,12,13,15,16,17,18,24,29,30,31,32,34,35,36,38,39,40,41,42,43,44,45,46,47,48,49,50,52,53,54,57,59,60,61,62,68,69,77,81,83,87,91,96,100]. However, continuous high-frequency streaming significantly increases network bandwidth requirements and storage costs, necessitating localized edge preprocessing.
3.5.2. Low-Frequency Utility Telemetry and Macro-Demand Profiling
On the other hand, periodic fixed-interval logging covering intervals from 1 min resolution over long-term deployments (e.g., spanning 2 years) [71] up to 1 h resolution logging [63], historical time-series logs and smart meter event data [55,73], real-time remote continuous data logging [51], or daily time-series data collection [72] often deployed across WSN [70] is common in utility-scale AMI since it reduces both the amount of data that has to be transmitted and energy usage [2,3,4,6,7,19,20,25,26,27,37,51,55,63,65,66,67,70,71,72,73,74,75,76,78,79,80,82,84,85,86,88,89,94,97,99,102]. While low-frequency telemetry masks the individual start and stop signals of each fixture and thus hinders detailed event disaggregation, it provides reliable time-series data that can be used for long-term urban demand forecasting, for extracting diurnal curve patterns, and for balancing the distribution network.
3.5.3. Asynchronous Event Logging and Adaptive Multi-Resolution Telemetry
Asynchronous event-driven logging mitigates the trade-off between high bandwidth costs and low signal granularity by recording telemetry only when volumetric thresholds, flow state transitions, or event-based features are triggered [5,9,14,21,22,23,28,33,56,92,93,95,98]. The method achieves the isolation of consumption episodes by recording for each active event the discrete start and end times, the duration, the total volume, and the peak flow rate. For instance, Gross et al. [58] showed the scalability of this approach by modeling about labeled consumption events throughout North America. More recently, the latest state-of-the-art architectures have improved efficiency by dynamically modifying the sampling rates, switching from low-rate logging during idle periods to sub-second streaming when consumption is taking place. Moreover, these systems include environmental and demographic data from a number of different sources in order to maximize the amount of information obtained [64,90,101].
The matrix which links the different temporal sampling regimes with their computational requirements and the suitable AI architecture classes is shown in Table 3.
Table 3.
Comparison of trade-offs among temporal sampling resolutions, telemetry overheads, and applicable AI model families.
3.6. AI Techniques
AI and ML algorithms serve as the principal techniques for converting raw volumetric flow and hydraulic sensor telemetry into actionable consumption insights. These methods enable automated end-use disaggregation, anomaly detection, and real-time network control. Recent developments utilize a broad spectrum of model families, each characterized by distinct trade-offs in predictive accuracy, computational complexity, interpretability, and data requirements.
To evaluate computational adoption in the literature, algorithmic implementations in the 100 reviewed studies were classified by their primary paradigm. Several studies conducted multi-model comparative benchmarking or implemented multi-stage hybrid pipelines; therefore, individual publications may be represented in multiple algorithmic categories. For instance, ref. [9] concurrently evaluated DT, RF, SVM, k-NN, and LSTM networks on hydrostatic water-level dynamics.
Figure 7 displays the frequency distribution of these paradigms across the 100 reviewed studies. The findings indicate a substantial reliance on specialized, single-study hybrid pipelines (28 occurrences) and rule-based or deterministic logic (20 occurrences), highlighting the persistent need for domain-specific physical constraints and lightweight edge-computing solutions that avoid extensive ML training. Unsupervised methods, particularly k-means clustering and Dynamic Time Warping (DTW) (17 occurrences), represent a significant proportion for exploratory pattern discovery and consumer behavior profiling. Among classical supervised ML algorithms, RF and tree ensembles (14 occurrences) are most prevalent, attributed to their robustness against noisy telemetry data, surpassing SVM/SVR (7 occurrences) and gradient boosting frameworks (3 occurrences). In DL paradigms, recurrent sequence architectures (LSTM/BiLSTM/GRU, 13 occurrences) are more frequently employed than conventional feedforward ANNs (9 occurrences) and CNNs (3 occurrences), owing to their enhanced ability to model complex time-series dependencies in high-resolution water metering telemetry.
Figure 7.
Frequency distribution and taxonomy of primary AI algorithmic paradigms and model families across the reviewed literature corpus (). Numerical labels adjacent to horizontal bars indicate study counts (N). Bar colors denote model family classifications: supervised ML (blue), deep learning (orange), unsupervised learning (green), hybrid & optimization (purple), rule-based/deterministic (pink), and custom hybrids (gray). The distribution highlights the prevalence of specialized single-study hybrids (, ) and deterministic edge logic (, ), followed by unsupervised clustering (), tree ensembles (), and recurrent architectures ().
3.6.1. Supervised ML and Tree-Based Ensembles
The most developed family of algorithms currently used for classifying end-use events, recognizing fixtures, and carrying out short-term water demand regression are those employed in supervised classification and regression. Decision-tree ensembles particularly RF, XGBoost, Gradient Boosting Regression (GBR), DT, and Mixed-Effects RF alongside classical supervised architectures such as SVM [62], shallow ANN [70], multi-classifier frameworks like PyNIWM [58], and semi-supervised self-learning models [57], are generally preferred because they are robust in dealing with non-linear interactions, have a low computational demand when deployed on edge devices, and possess intrinsic metrics for feature importance [2,4,5,6,7,9,12,14,16,18,21,22,23,24,25,26,29,30,33,35,36,39,57,58,62,70,73,75,77,79,80,82,83,86,88,90,93,95,101,102]. However, these models rely extensively on manual feature engineering, such as transient duration, peak flow rate, and slope, to accurately represent flow dynamics.
3.6.2. Deep Neural Networks, Recurrent Networks, and Attention Architectures
In order to get rid of the need for manual feature extraction and to automatically model complex temporal dependencies, researchers are increasingly using DL architectures. CNN [61] and models based on recurrence such as LSTM neural networks [55], Bidirectional LSTM (BiLSTM) systematically benchmarked against GRU and autoregressive baselines [42], GRU and adaptive hybrid DL frameworks combining Prophet time-series decomposition with GRUs and dynamic weight allocation [63] excel at handling raw sequential telemetry when carrying out multi-step load forecasting. In complex situations involving the simultaneous activation of multiple appliances, advanced deep architectures like Gated Transformer Networks (GTNs), Graph Neural Networks with spatial-demographic attention (GLAC), UNet-WD for wave-based signal disaggregation, and Unsupervised Autoencoders for real-time anomaly detection achieve the highest accuracy [1,4,6,9,17,22,27,38,42,55,61,63,66,67,76,78,81,88,89,92,93]. Nevertheless, the intrinsic lack of interpretability in these models, combined with their extensive training data requirements, poses considerable obstacles to achieving operational transparency and facilitating deployment on resource-constrained edge microcontrollers.
3.6.3. Unsupervised Clustering and Elastic Time-Series Distance Metrics
In order to counter the shortage of labeled ground-truth datasets, unsupervised learning methods are applied to group the baseline flow patterns, identify consumer behavioral archetypes, and divide the unlabeled pulse traces. Traditional, probabilistic, and dimensionality-reduced clustering techniques such as K-Means, Hierarchical Clustering, Gaussian Mixture Models (GMMs) [48], DBSCAN, and Self-Organizing Maps (SOMs), often integrated with dimensionality reduction methods like PCA, UMAP, and t-SNE [56,72] are combined with elastic distance measures like DTW, Longest Common Subsequence (LCSS), and Edit Distance with Real Penalty (ERP) in order to deal with temporal phase shifts and variations in the duration of fixture activations [3,20,21,28,37,48,56,72,84,85,92,96,97,98,100]. Although these methods remain robust with limited data, purely unsupervised approaches fall short in cases with overlapping concurrent fixtures requiring signal deconvolution.
3.6.4. Optimization Metaheuristics and Domain-Guided Hybrid Frameworks
Hybrid intelligence systems combine knowledge of the physical hydraulic domain with data-driven algorithms. Together with physical principles such as the Poisson Rectangular Pulse (PRP) model, headloss-flowrate equations, empirical flow dynamics and statistical event analysis [52], signal processing algorithms (e.g., Wavelet Transform filtering coupled with mathematical regression) [59], hybrid AI frameworks coupling ANNs with dynamic physical control models [47], automated pattern detection logic [71], and deterministic rule-based thermal thresholding, energy-optimized polling routines, edge-analytics pattern identification, rule-based control logic, IoT threshold analytics, Minimum Night Flow (MNF) and PWNC time-series analytics [40,41,43,44,45,46,49,50,51,53,54,60,68,69,87], evolutionary optimization algorithms including Genetic Algorithms (GAs), Genetic Programming (GP), and NSGA-II are used to calibrate hydraulic parameters and optimize network-level hyper-parameters [3,13,15,19,31,32,34,40,41,43,44,45,46,47,49,50,51,52,53,54,59,60,64,65,68,69,71,74,87,91,92,94,98,99]. The use of these hybrid methods ensures that ML predictions comply with physical conservation laws and operational rules, thus enhancing their generalizability in unmonitored hydraulic areas.
The comparative trade-off matrix shown in Table 4 summarizes the key algorithmic implementations, the main strengths, the operational bottlenecks, and the relevant studies.
Table 4.
Detailed taxonomy and trade-off matrix of AI paradigms and domain-specific methods in smart water modeling.
3.7. Tasks
The kinds of analytical tasks carried out by intelligent residential water systems set out the operational goals, provide decision-support structures, and establish the value propositions that result from the use of AI. These tasks do not follow the same data requirements but rather include a wide variety of spatial and temporal resolutions, ranging from high-frequency deconvolution of signals at the sub-second level to low-frequency monthly profiling of customers. Figure 8 shows how the volume of research is distributed among the four main analytical areas identified in the literature, highlighting the fact that non-intrusive end-use disaggregation receives more attention than network-level anomaly detection.
Figure 8.
Distribution of primary analytical task domains synthesized across the review literature corpus (), mapped directly against their requisite telemetry temporal sampling resolutions. Text labels beside horizontal bars denote absolute study counts (N), percentage shares, and sampling frequency constraints: end-use disaggregation & NIALM (, , requiring high frequency ≤ ), behavioral profiling & consumer analytics (, , effective under low frequency –), anomaly detection & leak tracking (, , requiring variable/real-time streaming), and demand prediction & multiscale forecasting (, , low-to-medium frequency –).
3.7.1. End-Use Disaggregation, Fixture Identification, and NIALM
NILM/NIALM is the main area of research in this field and accounts for more than half of the papers that have been reviewed. This method involves breaking down the total household flow rate data into specific signatures for individual fixtures, for example, those from toilets, showers, and washing machines. The various sub-tasks involved include the separation of indoor from outdoor flow, an analysis of pressure-related transients, low-resolution minimal-data deconvolution, and edge-based real-time tracking [3,4,5,6,9,12,13,15,17,18,19,21,22,23,24,25,28,29,30,31,33,34,35,37,38,66,80,88,89,90,91,92,93,95,96,99,100,102]. A major technical difficulty in this field is the compromise between sampling frequency and accuracy; high accuracy in disaggregation usually demands sampling rates of or above, which in turn places heavy demands on the battery life and telemetry bandwidth of smart meters.
3.7.2. Water Demand Prediction and Multiscale Forecasting
The aim of predictive modeling is to estimate future consumption levels at a variety of spatial and temporal scales in order to improve hydraulic distribution and the management of dynamic pressure. Among the main objectives are the forecasting of short-term household loads, the modeling of daily consumption in AMI systems, noise-suppressed time-series forecasting, and the simulation of stochastic demand in line with climate change projections [2,7,27,64,76,77,79,81,86,94,101]. Unlike disaggregation, forecasting models generally make use of lower-frequency telemetry (at 15 min to 1 h intervals), focusing on the modeling of long-term temporal dependencies rather than on capturing sub-second transients.
3.7.3. Behavioral Profiling, Consumer Segmentation, and Social Analytics
Unsupervised and semi-supervised analytics are used in order to detect underlying consumer usage patterns, the archetypes of diurnal peak demand, and the socio-demographic factors that determine them. The main applications are graph-based spatial–socioeconomic clustering, the monitoring of long-term changes in behavior during external disruptions such as the lockdowns associated with the COVID-19 pandemic, and the development of personalized eco-feedback interventions [14,20,26,65,67,74,75,78,83,84,85,97,98]. This method of analysis allows water utilities to put into practice targeted conservation policies and adaptable tariff systems.
3.7.4. Anomaly Detection, Leak Identification, and Infrastructure Health Tracking
The aims of infrastructure tracking tasks are to facilitate the early identification of faults, decrease water loss, and help alleviate Non-Revenue Water (NRW). The main analytical objectives are to detect micro-leaks continuously at the premises level, to track main pipe bursts, to issue overflow warnings, and to model infrastructure degradation [1,16,32,36,82]. Despite carrying significant economic weight for water utilities, these tasks are still under-represented, driven by the severe class imbalance in real-world anomaly datasets where failure events are rare and seldom labeled.
A synthesis of the taxonomy of analytical tasks, the typical telemetry resolution requirements, the main operational applications, and the relevant studies is given in Table 5.
Table 5.
Taxonomy of analytical tasks, requisite telemetry sampling resolution, primary operational utility, and associated studies.
3.8. End Uses
The level of analysis required by the various water end-uses ranges from profiling individual fixtures at a microscopic level to modeling total household usage at a macro level and to assessing demand across multiple facilities as a sector. By identifying the specific end-use signatures, utilities and consumers are able to tell the difference between essential hygiene activities, the cycles of mechanical appliances, outdoor irrigation, continuous background losses, and the demand patterns at the facility level. Figure 9 shows how the existing literature is distributed throughout the range of end-uses, illustrating the fact that research into multi-fixture indoor suites is by far the most prevalent.
Figure 9.
Distribution of target water end-use categories and spatial monitoring scopes synthesized across the review corpus (). Data points (orange nodes) indicate absolute study counts (N). The breakdown reveals a strong research pivot toward resolving multi-fixture suites and overlapping events (, ), addressing non-linear hydraulic superposition during concurrent fixture usage. This is followed by aggregate household and sectoral demand profiling (, ), specific indoor micro-fixtures such as toilets and faucets (, ), and energy-coupled mechanical appliances like clothes washers and dishwashers (, ).
3.8.1. Specific Indoor Fixtures and Sanitary Outlets (Micro-Level)
Micro-level end-use monitoring enables the isolation of short-duration hydraulic events associated with individual sanitary fixtures. The primary outlets of interest include toilets (flushing and refilling cycles), showerheads, kitchen and washbasin faucets, bidets, bathtubs, and manual hydraulic valves. These fixtures typically exhibit abrupt, step-like, or highly variable manual flow patterns. The main analytical objectives are to extract fixture-specific flow signatures, identify instances of sink water wastage, and calculate event duration profiles [6,13,14,17,35,66,85,90,92,93,99,100].
3.8.2. Mechanical Appliances and Energy-Coupled End-Uses
Appliances that are used in an automated way are household devices which operate according to well-defined multi-phase volumetric cycles, for example, washing machines, dishwashers and residential laundry dryers. Different from manual equipment, these appliances carry out a series of steps that are controlled by machinery. Studies in this area usually make use of multi-modal sensing, linking pulses of water consumption with electrical power consumption or with the hydraulics of tank refilling in order to improve the accuracy of disaggregation [9,15,89,98].
3.8.3. Multi-Fixture Suites, Overlapping Events, and Water Loss
Residential water monitoring in real-world settings frequently encounters concurrent or overlapping fixture activations, which create significant challenges for signal deconvolution. Research in this area focuses on deconstructing complex combinations of major indoor end-uses, typically involving four to seven fixture or appliance classes. Additional objectives include distinguishing total indoor from outdoor consumption, identifying individual points of use, and detecting continuous low-flow background leaks, pipe overflows, or fixture wastage [3,4,5,12,16,19,21,22,23,24,25,26,28,29,30,31,32,33,34,36,37,38,64,80,83,88,91,95,96,102].
3.8.4. Critical Synthesis of Concurrent and Overlapping Event Disaggregation ()
While 45.0% of the reviewed corpus () explicitly targets multi-fixture end-use disaggregation (Figure 9), a deeper thematic analysis reveals that handling concurrent activation events remains the primary algorithmic bottleneck in real-world deployments. Standard disaggregation algorithms rely on additive linear assumptions; however, simultaneous appliance usages (e.g., concurrent shower and washing machine cycles) generate non-linear hydraulic superposition, causing severe feature distortion in both temporal flow profiles and transient pressure signals.
Across these 45 studies, deep learning architectures most notably Sequence-to-Point (Seq2Point), 1D Convolutional Neural Networks (1D-CNNs), and Recurrent Neural Networks (RNNs) with attention mechanisms have emerged as the prevailing approach to unmixing overlapping signals. While high-frequency () acoustic and transient pressure sensing allows state-of-the-art models to achieve high disaggregation accuracy () under lab-simulated concurrency, performance drops sharply under standard utility metering ( AMI intervals). Under coarse temporal sampling, micro-component event boundaries are fully smoothed, causing models to misclassify concurrent low-flow activations (e.g., faucet use during toilet flushing) as uncharacterized leakages or aggregated baseline flows.
3.8.5. Aggregate Demand, Sectoral Typologies, and Macro-Level Profiles
Macro-level end-use research models aggregate volumetric consumption data without disaggregating individual fixture events. These models are applied to single-family residences, multi-family complexes, student hostels, various commercial sectors such as restaurants and elementary schools, consumption tiers, diurnal peak clusters, and overall urban demand patterns [1,2,7,20,27,65,67,74,75,76,77,78,79,81,82,84,86,94,97,101].
The taxonomy of targeted water end-uses, together with their typical hydraulic signatures, primary analytical targets, and the relevant studies found in the literature, is summarized in Table 6.
Table 6.
Taxonomy of targeted water end-uses, representative hydraulic signatures, primary analytical targets, and associated studies.
3.9. Detailed Performance Metric Extraction by Domain
To accommodate the substantial methodological heterogeneity across the reviewed literature () and provide a granular, objective evaluation, the extracted performance metrics, algorithmic architectures, and primary predictive targets are disaggregated into four domain-specific operational categories. Rather than presenting a single monolithic comparison which would conflate fundamentally distinct mathematical tasks such as discrete event classification, continuous volumetric regression, label-free temporal clustering, and streaming anomaly detection, each domain is contextualized individually below, with full study-by-study performance matrices provided in Supplementary Material.
3.9.1. Classification and Event Recognition Models
Micro-component event recognition focuses on identifying discrete fixture activations (e.g., showers, toilet flushes, faucets, dishwashers, and washing machines) from high-frequency telemetry or transient feature signatures. Studies in this domain employ supervised machine learning classifiers including Random Forests, Support Vector Machines, 1D Convolutional Neural Networks (1D-CNNs), and hybrid decision ensembles to isolate single and multi-fixture end-use occurrences. Performance is predominantly benchmarked using multi-class classification metrics such as accuracy, precision, recall, and macro/micro -score. A comprehensive study-by-study performance breakdown, detailing the underlying AI models, target event classes, sampling frequencies, and operational findings for all evaluated event recognition systems (), is compiled in Table S1 in Section S2.1 of the Supplementary Material.
3.9.2. Volumetric Disaggregation, Regression, and Demand Forecasting Models
Volumetric disaggregation NILM and predictive demand modeling address continuous signal transformation tasks, ranging from decomposing aggregated household hydrographs into itemized fixture volume traces to forecasting short- and long-term municipal water demand trajectories. Algorithmic architectures in this category leverage deep sequence-to-sequence models (e.g., Seq2Point, UNet-WD, BiLSTM), Transformer attention mechanisms, and gradient-boosted tree regressors (e.g., XGBoost) operating across temporal resolutions from 1 min intervals to coarse hourly readings. Performance is quantitatively evaluated using continuous regression error metrics, primarily Root Mean Square Error (RMSE), Mean Absolute Error (MAE), and Coefficient of Determination (). The detailed performance breakdown, algorithmic target outputs, and predictive accuracy benchmarks for all synthesized disaggregation and forecasting models () are provided in Table S2 in Section S2.2 of the Supplementary Material.
3.9.3. Clustering, Behavioral Profiling, and Unsupervised Consumer Segmentation Models
Consumer profiling and demand-side management rely on unsupervised learning paradigms to discover latent diurnal usage patterns, characterize household occupancy behaviors, and segment utility customer bases without requiring labor-intensive ground-truth event labeling. Methodologies in this domain combine elastic distance metrics capable of handling temporal phase shifts such as DTW and Longest Common Subsequence with unsupervised clustering algorithms, including K-Means, Agglomerative Hierarchical, DBSCAN, and Spectral Clustering. Structural cluster validity and separation performance are evaluated using indices. The study-by-study breakdown of segmentation targets, feature extraction methods, and validation metrics for all evaluated clustering models () is detailed in Table S3 in Section S2.3 of the Supplementary Material.
3.9.4. Anomaly Detection, Edge Computing, Preprocessing, and Benchmark Datasets
Real-time infrastructure protection and scalable IoT deployment require dedicated algorithms for detecting burst/leak anomalies, filtering high-frequency noise, compressing multi-sensor streams, and deploying lightweight models directly on resource-constrained edge hardware. Studies in this category evaluate autoencoder architectures, Isolation Forests, Wavelet Transform denoising schemes, multi-sensor fusion frameworks, and TinyML microcontrollers (≤ SRAM), along with standardized public benchmark datasets (e.g., LARCO, Naples IoT, C-TOWN). Performance is characterized through anomaly detection -scores, signal-to-noise ratio improvements, leak localization accuracy, and hardware latency/power benchmarks. The complete study-by-study performance matrix, algorithmic targets, and operational insights for all evaluated anomaly detection, edge computing, preprocessing, and benchmark dataset models () are compiled in Table S4 in Section S2.4 of the Supplementary Material.
3.10. Advantages and Opportunities
Advancements in artificial intelligence, edge computing, multi-sensor hardware, and open benchmark datasets have expanded the technical, economic, and operational possibilities within smart water networks. These innovations enable low-cost, non-intrusive retrofits, scalable low-resolution disaggregation, real-time edge anomaly detection, high generalizability forecasting, and the implementation of actionable socio-technical water conservation strategies.
The four primary technological domains encompass the principal advantages and operational opportunities, as summarized in Table 7.
Table 7.
Taxonomy of technological advantages, operational opportunities, and system benefits.
3.10.1. Non-Intrusive Hardware Retrofitting and Edge AI
Recent hardware retrofits eliminate the need for costly meter replacements by leveraging open microcontrollers (ESP32), camera-based optical dial reading [61], non-intrusive pipe-surface thermistors [60], acoustic noise sensing [59], and ultrasonic level monitoring [50]. When combined with Edge AI and LPWAN topologies (e.g., LoRaWAN, master–slave Wi-Fi) [40,49,68,87], local feature extraction and MQTT pipeline filtering [46] reduce cloud transmission bandwidth by up to 70% while preserving hydrograph integrity () and safeguarding consumer privacy [1,3,9,13,16,17,31,34,66,78,91]. Furthermore, high-frequency sub-second sampling [52] and multi-sensor integration enable automated supply control [41,44], dry-run pump protection [53], and water-quality tracking [43,69]. Full implementation mappings across reviewed studies are systematized in Table 7.
3.10.2. Low-Resolution Disaggregation and Open Datasets
Extracting itemized end-use signatures from standard low-frequency (1–60 min) commercial utility meters avoids capital-intensive hardware overhauls. Deep learning models (e.g., UNet-WD, Prophet-GRU) [63], classical classifiers (SVM, RF) [39,62], and standardized ML pipelines (e.g., PyNIWM) [58] successfully resolve overlapping appliance activations and multi-utility (water–electricity) demand signatures () across large household cohorts. Furthermore, semi-supervised self-learning [57], unsupervised clustering [56,71], and open access benchmark datasets (e.g., LARCO, Naples IoT) significantly mitigate ground-truth data scarcity and lower manual labeling costs [5,6,12,15,18,19,24,25,28,30,33,37,38,88,89,90]. A full thematic breakdown is compiled in Table 7.
3.10.3. Real-Time Anomaly Detection and Automated Maintenance
Proactive infrastructure protection combines non-consumption window analytics (MNF, PWNC) [51] with sequence-based deep learning (BiLSTM, GRU) [42] and probabilistic models (e.g., Gaussian Mixture Models) [48]. These architectures accurately isolate pipe leaks, micro-flows [61], and building bursts, while low-latency MQTT edge pipelines [46,87] and cloud push services [44,50] issue real-time alerts for tank overflows, dry-run risks [53], water quality shifts [45,69], and supply anomalies under Intermittent Water Supply (IWS) [54]. Furthermore, multi-objective optimization algorithms (NSGA-II) automate trace disaggregation calibration, replacing manual legacy software [17,32,35,36,82,92,93,96,98,99,100,101,102]. Operational specifications are summarized in Table 7.
3.10.4. Socio-Technical Modeling and Spatial Transferability
Integrating smart telemetry with spatial–socioeconomic Graph Neural Networks (GNNs), weather data, and unsupervised clustering (UMAP, DBSCAN) [72] enables accurate macro-scale multi-utility forecasting [73] with spatial transfer errors below 1%. At the household and community level, WSN-ANN architectures [70], LPWAN multi-apartment monitoring [68], and thermal pipe profiling [60] support occupant-aware demand allocation and aging-in-place daily living assessment. Additionally, deep LSTM models () [55], hybrid intervention frameworks [47], smart shower feedback meters, and IWS behavioral tracking [40,54] facilitate personalized eco-feedback nudges and long-term conservation [1,2,7,14,20,21,23,26,27,29,64,65,67,74,75,76,77,79,81,83,84,85,86,94,95,97]. Complete study classifications are provided in Table 7.
4. Discussion
4.1. Interpretation, Limitations, and Implications
The analysis of the 100 included studies shows a clear evolution in methodology within AI-driven smart water analytics. Over the past decade, research has shifted rapidly from traditional ML classifiers, such as SVM and RF, to deep, hybrid, and spatiotemporal models. DL architectures, including Seq2Point, UNet-WD, LSTM networks, and GNNs, are now primarily employed for end-use recognition, volumetric disaggregation, and multi-user residential demand profiling. Hybrid approaches demonstrate greater robustness in addressing overlapping appliance activations, noisy smart meter signals, and non-linear diurnal demand patterns.
For data acquisition, the primary input variables are flow rate and volume consumed. Multi-sensor configurations that integrate acoustic, pressure, ambient humidity, and temperature data consistently yield higher precision in data disaggregation and reduce false alarms in anomaly detection. While public benchmark datasets such as LARCO and the Naples IoT dataset have enhanced the reproducibility of results across studies, much of the existing literature continues to rely on synthetically generated or laboratory-scaled water usage traces. Although synthetic datasets facilitate controlled experimentation, they do not capture the stochastic characteristics of real-world occupant behavior, pressure fluctuations, or pipe deterioration.
Despite recent technological advancements, significant limitations persist in the current literature. Many studies do not provide standardized reports on sampling frequencies, sensor positioning protocols, or computational complexity at the edge. Furthermore, reporting bias is evident, as algorithms are typically evaluated using high-resolution () clean traces and are only minimally validated with low-frequency (1 to ) commercial smart meter data.
From a synthesis perspective, potential search scope limitations (e.g., single-database indexing, open access exclusions) were verified to present minimal threat to structural validity via the post hoc coverage audit detailed in Section 2. Tree-based ensembles are most appropriate for tabular demand forecasting, and non-intrusive edge retrofits are the most feasible means for large-scale utility adoption. Standardization of the benchmarking procedures and greater promotion of field-scale implementation will be essential if the gap between experimental prototypes and the actual water distribution infrastructure is to be closed.
4.2. Experimental Constraints and Real-World Performance Degradation
A critical synthesis of the included studies reveals a substantial discrepancy between reported experimental metrics and real-world operational performance. While state-of-the-art deep learning (DL) architectures achieve exceptional recognition metrics () under controlled laboratory setups, their efficacy degrades significantly when deployed in field-scale utility environments. This performance drop is governed by three primary experimental constraints:
- 1.
- Sampling-rate mismatch and information loss: over 75% of reviewed algorithmic frameworks depend on high-frequency sampling (≥) to capture transient hydraulic signatures. When these models are evaluated against low-frequency commercial Automated Metering Infrastructure (AMI) data ( aggregations), recognition accuracy suffers a severe degradation (typical reductions of ), as micro-component event transitions are fully smoothed out.
- 2.
- Simultaneous activation and event overlap: most current disaggregation algorithms exhibit elevated false-positive rates during multi-fixture concurrent usage events (e.g., simultaneous shower and washing machine cycles). Superposition of flow signatures non-linearly distorts aggregate feature vectors, leading to misclassification across sub-metering domains.
- 3.
- Spatial and demographic transferability gap: models trained on homogenous, high-income single-family household datasets fail to generalize to Multi-Dwelling Units or region-specific water use behaviors. Cross-household validation routinely exposes a performance degradation exceeding 25% in when models are applied to unseen physical infrastructures without fine-tuning.
4.3. Comparability of Reported Performance Metrics
A critical consideration when interpreting the synthesized literature is the cross-study comparability of performance metrics. In this systematic review, reported metrics such as accuracy, precision, recall, -score, RMSE, and MAE were extracted to illustrate the performance and functional capability of each algorithm strictly within its specific context of use, application domain, and dataset settings. These metrics are not presented to construct a global ranking or general hierarchy of algorithms, as cross-study metric comparison is methodologically limited.
Direct quantitative comparison across different publications is precluded by several factors:
- Incommensurability of metrics: classification metrics (e.g., -score, accuracy) and regression error metrics (e.g., RMSE, MAE) evaluate fundamentally different operational attributes and cannot be directly equated.
- Reporting and averaging heterogeneity: even when identical metrics like -score are reported, values vary substantially depending on whether binary or multi-class formulations were used, whether macro-, micro-, or weighted averaging was applied, and how class imbalances inherent to infrequent fixture events (e.g., leaks vs. daily faucet use) were handled.
- Evaluation schemes and data granularity: metric performance is strongly influenced by whether evaluation was conducted at the event level or the sample level, as well as the data splitting strategy employed (e.g., subject-wise/household-wise vs. random splits, or k-fold cross-validation vs. single holdout validation).
- Dataset and environmental variance: differences in sampling frequencies (e.g., vs. aggregations), background noise levels, and household-specific plumbing topologies prevent uniform performance comparisons across disparate studies.
Consequently, performance metrics compiled in this review must be evaluated strictly within-task and within-dataset, reflecting contextual efficacy rather than an absolute algorithm ranking.
4.4. Conceptual Reference Framework for Smart Water Analytics
Rather than introducing a fixed, universal architecture, the framework described in this section combines the design patterns and operational trade-offs that have been identified in the 100 studies reviewed. The theoretical model thus provides a structured foundation for utility operators and researchers who wish to put into practice comprehensive smart water analytics systems.
To ensure this reference architecture is empirically grounded rather than operating as an isolated construct, each of the three functional layers synthesizes and maps the operational patterns across the reviewed studies. Layer 1 structures the data preprocessing and multi-modal fusion workflows evaluated across all input streams (), Layer 2 synthesizes the core computational engines evaluated across primary algorithmic studies, and Layer 3 models the utility-scale operational outputs demonstrated across applied studies.
4.4.1. Preprocessing, Filtering, and Signal Fusion Layer
Raw volumetric traces are subject to missing-value imputation, the isolation of transient signals, and dimensionality reduction by means of either Wavelet Transforms or Principal Component Analysis. In the case of multiple sensors, hydraulic signals are combined with external variables such as meteorological forecasts, indicators of the day of the week, and spatial socio-demographic graphs in order to enhance the feature representations prior to algorithmic training, addressing the data quality constraints identified across the reviewed input streams.
4.4.2. Core Machine Learning and Deep Learning Engine Layer
The analytical core comprises several specialized module families, aggregating the algorithmic methodologies evaluated across primary studies:
- Classification and event recognition: CNN and RF are employed to classify discrete end-use events, such as showers, toilets, and washing machines.
- Volumetric disaggregation: Seq2Point and UNet architectures are utilized to decompose aggregated flow traces into precise fixture-level volume allocations.
- Demand forecasting: LSTM networks, Transformer mechanisms, and Gradient Boosting Regressors (XGBoost) are applied to model both short-term and long-term volumetric demand.
- Behavioral profiling: K-Means, Agglomerative Hierarchical, and Spectral Clustering algorithms are used to segment households based on diurnal consumption patterns.
4.4.3. Operational Diagnosis and Actionable Feedback Layer
The system converts analytical outputs into actionable intelligence distributed across three primary operational tiers, directly anchoring the utility and consumer applications evaluated across applied studies:
- 1.
- Anomaly and infrastructure alerts: real-time identification and isolation of pipe bursts, continuous micro-leaks, and fixture failures.
- 2.
- Utility asset management: dynamic pressure regulation, peak-demand shaving, and optimized tariff planning based on consumer cluster dynamics.
- 3.
- Consumer engagement: tailored mobile dashboard notifications providing itemized fixture breakdown, water footprint insights, and conservation incentives.
4.5. Contributions and Comparison with Existing Review Studies
In order to make clear the extent of this review, Table 8 gives a comparative summary of previously published review articles concerning smart water management, NILM, and leak detection. Unlike earlier literature reviews which have usually focused on particular sub-domains, for example, on leakage detection in distribution pipes, the drivers of graywater recycling, or the macroeconomic factors affecting urban demand, the current study provides a comprehensive synthesis covering four operational areas: classification, disaggregation, clustering, and edge preprocessing. Furthermore, this review incorporates recent developments in low-cost Edge AI retrofits and open access benchmark datasets, thus filling the gap between the development of algorithms at theory level and their practical application at utility scale.
Table 8.
Comparison of the current systematic review with previous literature reviews in the field of smart water analytics.
5. Conclusions
The review examined 100 primary studies which were published between 2016 and 2026, following the rapid convergence of AI, IoT infrastructure, and advanced sensing technologies in the field of smart residential water monitoring. The review provides a well-organized summary of domestic water disaggregation and demand analytics by grouping the existing research according to its deployment topologies, sampling resolutions, algorithmic paradigms, and the specific operational target tasks.
5.1. Key Technological Syntheses
- Sensing and deployment infrastructure: non-intrusive paradigms overwhelmingly dominate smart water deployment, split between aggregated grid monitoring and single-point household telemetry. However, fine-grained appliance disaggregation remains fundamentally constrained by temporal resolution: high-accuracy NILM demands high-frequency real-time telemetry (≤), whereas commercial utility AMI operates on coarse, fixed intervals (). Non-intrusive edge retrofits and multi-modal sensing topologies (integrating pressure, acoustic, and environmental channels) offer the most viable path to bypass bandwidth limits without capital-intensive meter replacement.
- Algorithmic paradigms and application focus: supervised decision-tree ensembles (RF, XGBoost) excel in tabular demand forecasting and feature-engineered classification due to low computational overhead and high interpretability. Deep learning architectures (Seq2Point, Bi-LSTM, UNet-WD, GNNs) dominate automated feature extraction and signal unmixing during non-linear concurrent consumption events. Complementarily, unsupervised clustering coupled with elastic distance measures (DTW, LCSS) provides robust, label-free customer segmentation and diurnal curve profiling.
- Target operational domains: research attention centers primarily on non-intrusive end-use disaggregation, followed by consumer behavioral profiling, multiscale demand forecasting, and real-time anomaly detection. Closing the gap between these task domains and utility-scale deployment requires addressing data granularity mismatches, sensor fusion trade-offs, and domain transferability.
5.2. Future Research Directions
Based on the quantitative bottlenecks and experimental limits identified across the reviewed studies, future research in AI-driven smart water monitoring must advance beyond idealized laboratory setups and address five critical operational domains:
- 1.
- Algorithmic disaggregation under coarse AMI data granularity: given that utility-scale deployments predominantly rely on commercial Automated Metering Infrastructure (AMI) yielding low-resolution readings ( interval data), future work must prioritize self-supervised representation learning and temporal super-resolution techniques. Research should focus on recovering sub-hourly end-use patterns without requiring invasive high-frequency (≥) hardware retrofits.
- 2.
- Economic Pareto optimization of multi-modal sensor fusion: while integrating auxiliary sensing channels (e.g., acoustic vibration, transient inline pressure, and pipe skin temperature) substantially improves event classification accuracy, multi-sensor setups introduce battery drain, sensor calibration drift, and elevated capital expenditure. Systemic cost–benefit modeling is needed to define the minimal viable sensor configuration that balances disaggregation accuracy against long-term maintenance costs.
- 3.
- Non-linear blind source separation for overlapping usage events: simultaneous fixture activations distort aggregated flow signatures, causing catastrophic classification degradation in existing models. Future research should leverage Physics-Informed Neural Networks (PINNs) and multi-head attention mechanisms specifically tailored to decouple non-linear hydraulic superposition signatures during concurrent consumption events.
- 4.
- TinyML Edge Architectures under extreme resource constraints: to mitigate privacy concerns and bandwidth overhead associated with continuous cloud telemetry, disaggregation algorithms must be optimized for execution on ultra-low-power microcontrollers (MCUs). Research should focus on 8-bit integer quantization, structured network pruning, and Neural Architecture Search (NAS) to fit complex DL models within constrained edge hardware parameters (≤ SRAM and sub-mW active power draw).
- 5.
- Domain transferability across diverse housing and intermittent systems: current models exhibit severe performance loss when deployed across heterogeneous building topologies or non-continuous distribution networks. Dedicated framework development is required for Intermittent Water Supply (IWS) regimes, where hydraulic pressure surges, rapid air expulsion, and domestic storage tank dynamics breach the static distributional assumptions of standard ML models.
Supplementary Materials
The following supporting information can be downloaded at https://www.mdpi.com/article/10.3390/a19110921/s1, Supplementary Material S1: Scopus Search Queries and Syntax; Section S2.1: Table S1. Detailed performance breakdown for classification and event recognition models; Section S2.2: Table S2. Detailed performance breakdown for volumetric disaggregation, regression, and forecasting models; Section S2.3: Table S3. Detailed performance breakdown for clustering, behavioral profiling, and consumer segmentation models; Section S2.4: Table S4. Detailed performance breakdown for anomaly detection, edge computing, preprocessing, and dataset benchmark models; Table S5: PRISMA 2020 Checklist.
Author Contributions
Conceptualization, I.N.C.-F. and H.A.G.-O.; methodology, I.N.C.-F. and J.R.-R.; software, I.N.C.-F. and M.A.C.-M.; validation, L.F.L.-V., H.A.G.-O. and J.R.-R.; formal analysis, L.F.L.-V. and M.A.C.-M.; investigation, F.G.-V. and L.F.L.-V.; resources, F.G.-V. and M.A.C.-M.; data curation, I.N.C.-F., F.G.-V. and J.A.N.-P.; writing—original draft preparation, I.N.C.-F. and J.A.N.-P.; writing—review and editing, H.A.G.-O. and J.R.-R.; visualization, F.G.-V. and J.A.N.-P.; supervision, H.A.G.-O. and J.R.-R.; project administration, H.A.G.-O.; funding acquisition, J.R.-R. All authors have read and agreed to the published version of the manuscript.
Funding
This research received no external funding.
Institutional Review Board Statement
Not applicable.
Informed Consent Statement
Not applicable.
Data Availability Statement
No new data were created or analyzed in this study. Data sharing is not applicable to this article.
Acknowledgments
The authors want to thank the Mexican Secretariat of Science, Humanities, Technology and Innovation (SECIHTI by its initials in Spanish) for its support to the National Laboratory of Embedded Systems, Advanced Electronics Design and Micro Systems (LN-SEDEAM by its initials in Spanish), project numbers 282357, 293384, 299061, 314841, 315947, and 321128 and scholarship numbers 2035950 and 1012274. During the preparation of this manuscript, the authors used Gemini 3.6 (Google, Mountain View, CA, USA) and ChatGPT v5.6 Luna (OpenAI, San Francisco, CA, USA) exclusively for preliminary language grammar checks and then reviewed and edited as needed. No generative AI tools were used for data analysis, study design, interpretation of results, or the creation of scientific content. After using this tool, all authors reviewed and edited the content as necessary and take full responsibility for the final version of the manuscript.
Conflicts of Interest
The authors declare no conflicts of interest.
Abbreviations
The following abbreviations are used in this manuscript:
| AI | Artificial Intelligence |
| AMI | Advanced Metering Infrastructure |
| AMR | Automated Meter Reading |
| Bi-LSTM | Bidirectional Long Short-Term Memory |
| CMIP6 | Coupled Model Intercomparison Project Phase 6 |
| CNN | Convolutional Neural Network |
| CTGAN | Conditional Tabular Generative Adversarial Network |
| DBSCAN | Density-Based Spatial Clustering of Applications with Noise |
| DL | Deep Learning |
| DMA | District Metered Area |
| DTW | Dynamic Time Warping |
| ERP | Edit Distance with Real Penalty |
| GA | Genetic Algorithm |
| GBR | Gradient Boosting Regression |
| GLAC | Graph Neural Network with Spatial-Demographic Attention |
| GNN | Graph Neural Network |
| GP | Genetic Programming |
| GRUs | Gated Recurrent Units |
| GTN | Gated Transformer Network |
| IoT | Internet of Things |
| IWS | Intermittent Water Supply |
| KGE | Kling–Gupta Efficiency |
| LCSS | Longest Common Subsequence |
| LoRaWAN | Long-Range Wide-Area Network |
| LSTM | Long Short-Term Memory |
| MAE | Mean Absolute Error |
| MDUs | Multi-Dwelling Units |
| ML | Machine Learning |
| MNF | Minimum Night Flow |
| NIALM | Non-Intrusive Appliance Load Monitoring |
| NILM | Non-Intrusive Load Monitoring |
| NRW | Non-Revenue Water |
| NSGA-II | Non-dominated Sorting Genetic Algorithm II |
| PCA | Principal Component Analysis |
| PRISMA | Preferred Reporting Items for Systematic Reviews and Meta-Analyses |
| PRP | Poisson Rectangular Pulse |
| PWNC | Period Without Null Consumption |
| RF | Random Forest |
| RMSE | Root Mean Square Error |
| Seq2Point | Sequence-to-Point |
| SOM | Self-Organizing Map |
| SVM | Support Vector Machine |
| TinyML | Tiny Machine Learning |
| WSN | Wireless Sensor Network |
References
- Quinto, C.; Insuasti, J.; Simbaña, M.; Palma, P.; Albarracin, W.; Egas, P. IoT-Based Electronic System for Real-Time Monitoring and AI-Driven Analysis of Residential Water Consumption. Electronics 2026, 15, 3104. [Google Scholar] [CrossRef] [Scilit]
- Lee, D.; Derrible, S. Predicting Residential Water Demand with Machine-Based Statistical Learning. J. Water Resour. Plan. Manag. 2020, 146, 04019067. [Google Scholar] [CrossRef] [Scilit]
- Pavlou, P.; Filippou, S.; Solonos, S.; Vrachimis, S.; Malialis, K.; Eliades, D.; Theocarides, T.; Polycarpou, M. Monitoring domestic water consumption: A comparative study of model-based and data-driven end-use disaggregation methods. J. Hydroinform. 2024, 26, 709–726. [Google Scholar] [CrossRef] [Scilit]
- Nguyen, K.; Stewart, R.; Zhang, H. Transforming residential water end use analysis: Unleashing insights from widespread low-resolution smart metering data. Water Res. 2025, 278, 123344. [Google Scholar] [CrossRef] [Scilit] [PubMed]
- Meyer, B.; Nguyen, K.; Beal, C.; Jacobs, H.; Buchberger, S. Classifying Household Water Use Events into Indoor and Outdoor Use: Improving the Benefits of Basic Smart Meter Data Sets. J. Water Resour. Plan. Manag. 2021, 147, 04021079. [Google Scholar] [CrossRef] [Scilit]
- Zhou, X.; Memon, F.A.; Melville-Shreeve, P.; Merchant, P.; Fu, G. Detecting household toilet flushing events using machine learning. AQUA—Water Infrastruct. Ecosyst. Soc. 2026, 75, 187–201. [Google Scholar] [CrossRef] [Scilit]
- Obringer, R.; Nateghi, R.; Ma, Z.; Kumar, R. Improving the Interpretation of Data-Driven Water Consumption Models via the Use of Social Norms. J. Water Resour. Plan. Manag. 2022, 148, 04022065. [Google Scholar] [CrossRef] [Scilit]
- Cao, Y.; Zhang, Y.; Zhao, Y.; Wang, C.; Niu, Z. Interactions and Integrated Optimization between Secondary Water Supply Devices and Drinking Water Distribution Systems: A Review. Water Resour. Manag. 2025, 39, 3625–3639. [Google Scholar] [CrossRef] [Scilit]
- Chávez-Flores, I.; Guerrero-Osuna, H.; Nava-Pintor, J.; García-Vázquez, F.; Luque-Vega, L.; Carrasco-Navarro, R.; Mata-Romero, M.; Lizarraga, J.; Castro-Tapia, S. A Feasibility Study of IoT-Based Classification of Residential Water-Use Activities in Storage Tank Systems: A Comparative Analysis of Decision Trees, Random Forest, SVM, KNN, and Neural Networks. Technologies 2026, 14, 223. [Google Scholar] [CrossRef] [Scilit]
- Zuñiga-Uribe, M.; Rojas-Galván, R.; Álvarez-Alvarado, J.M.; Aviles, M.; Pérez-Soto, G.I.; Pérez-Moreno, V. Artificial intelligence in water distribution networks: A systematic review of models, input variables, databases, and output strategies for leak detection. Smart Cities 2026, 9, 45. [Google Scholar] [CrossRef] [Scilit]
- The PRISMA 2020 Statement: An Updated Guideline for Reporting Systematic Reviews. Available online: https://www.bmj.com/content/372/bmj.n71 (accessed on 20 October 2026).
- Di Mauro, A.; Santonastaso, G.; Venticinque, S.; Di Nardo, A. Open Datasets and IoT Sensors for Residential Water Demand Monitoring at the End-Use Level: A Pilot Study Site in Naples (Italy). In Resilient Water Management Strategies in Urban Settings: Innovations in Decentralized Water Infrastructure Systems; Springer: Berlin/Heidelberg, Germany, 2022; pp. 47–76. [Google Scholar] [CrossRef] [Scilit]
- Lagang, R.; Jayoma, J. IoT-Based Real-Time Water Consumption Monitoring and Forecasting Using Machine Learning. In Proceedings of the 2025 14th International Conference on Networks, Communication and Computing (ICNCC); IEEE: Piscataway, NJ, USA, 2025; pp. 191–197. [Google Scholar] [CrossRef] [Scilit]
- Günther, S.; Stingl, C.; Coroama, V.; Schöb, S.; Staake, T. Empowering personalized feedback on hot water usage: A field study with shower meters. In Proceedings of the 35th Annual Acm Symposium On Applied Computing; Association for Computing Machinery: New York, NY, USA, 2020; pp. 763–766. [Google Scholar] [CrossRef] [Scilit]
- Jasiūnas, Z.; Braz Ferreira, J.; Julião, T.; Cecílio, J.; Carrilho da Graça, G.; Ferreira, P. Household Laundry Appliance Resource Consumption and Operation Dataset. Sci. Data 2026, 13, 1131. [Google Scholar] [CrossRef] [Scilit] [PubMed]
- Herrera-Santos, J.; Márquez-Sánchez, S.; Alonso-Rollán, S.; Chamoso-Santos, P. Edge AI Smart Water IoT Device for Domestic Consumption Classification. In Proceedings of the International Symposium on Distributed Computing and Artificial Intelligence; Springer: Berlin/Heidelberg, Germany, 2025; pp. 233–242. [Google Scholar] [CrossRef] [Scilit]
- Brunelli, C.; Pappacoda, G.; Zyrianoff, I.; Bononi, L.; Di Felice, M. Water Wastage Detection in Smart Homes Through IoT and Machine Learning. In Proceedings of the 2024 IEEE 21st Consumer Communications & Networking Conference (CCNC); IEEE: Piscataway, NJ, USA, 2024; pp. 372–375. [Google Scholar] [CrossRef] [Scilit]
- Luk, M.H.; Yau, C.W.; Pong, P.; Lee, A.; Ngai, E.; Lui, K.S. High-Resolution Tap-Based IoT System for Flow Data Collection and Water End-Use Analysis. IEEE Internet Things J. 2022, 9, 22822–22835. [Google Scholar] [CrossRef] [Scilit]
- Mazzoni, F.; Blokker, M.; Alvisi, S.; Franchini, M. An enhanced method for automated end-use classification of household water data. J. Hydroinform. 2024, 26, 408–423. [Google Scholar] [CrossRef] [Scilit]
- Rahim, M.; Nguyen, K.; Stewart, R.; Ahmed, T.; Giurco, D.; Blumenstein, M. A clustering solution for analyzing residential water consumption patterns. Knowl.-Based Syst. 2021, 233, 107522. [Google Scholar] [CrossRef] [Scilit]
- Arsene, D.; Predescu, A.; Pahonțu, B.; Chiru, C.; Apostol, E.S.; Truică, C.O. Advanced Strategies for Monitoring Water Consumption Patterns in Households Based on IoT and Machine Learning. Water 2022, 14, 2187. [Google Scholar] [CrossRef] [Scilit]
- Carranza, J.C.I.; Morales, R.D.; Sánchez, J.A. Pattern recognition in residential end uses of water using artificial neural networks and other machine-learning techniques. In Proceedings of the 15th International Conference on Computing and Control for the Water Industry (CCWI 2017), Sheffield, UK, 5–7 September 2017; pp. 1–8. [Google Scholar]
- Soares, E.; Oliveira-Esquerre, K.; de Aguiar, A.; Botelho, G.; Kiperstok, A. Development of a model to identify combined use in residential water end use events. In Proceedings of the Computer Aided Chemical Engineering; Elsevier: Amsterdam, The Netherlands, 2018; Volume 44, pp. 1951–1956. [Google Scholar] [CrossRef] [Scilit]
- Charalampous, A.; Papadopoulos, A.; Hadjiyiannis, S.; Philimis, P. Towards hydro-informatics modernization with real-time water consumption classification. In Proceedings of the 2021 IEEE AFRICON; IEEE: Piscataway, NJ, USA, 2021; pp. 1–6. [Google Scholar] [CrossRef] [Scilit]
- Meyer, B.; Jacobs, H.; Ilemobade, A. Classifying household water use into indoor and outdoor use from a rudimentary data set: A case study in johannesburg, south africa. J. Water Sanit. Hyg. Dev. 2021, 11, 423–431. [Google Scholar] [CrossRef] [Scilit]
- Rahim, M.; Nguyen, K.; Stewart, R.; Giurco, D.; Blumenstein, M. Advanced household profiling using digital water meters. J. Environ. Manag. 2021, 288, 112377. [Google Scholar] [CrossRef] [Scilit] [PubMed]
- Kim, J.; Lee, H.; Lee, M.; Han, H.; Kim, D.; Kim, H. Development of a Deep Learning-Based Prediction Model for Water Consumption at the Household Level. Water 2022, 14, 1512. [Google Scholar] [CrossRef] [Scilit]
- Gourmelon, N.; Bayer, S.; Mayle, M.; Bach, G.; Bebber, C.; Munck, C.; Sosna, C.; Maier, A. Implications of experiment set-ups for residential water end-use classification. Water 2021, 13, 236. [Google Scholar] [CrossRef] [Scilit]
- Khan, H.; Stillwell, A. Patterns tell human stories: Towards connecting residential water use to occupant behavior in a permanent supportive housing context. Environ. Res. Infrastruct. Sustain. 2025, 5, 045011. [Google Scholar] [CrossRef] [Scilit]
- Bastidas Pacheco, C.; Horsburgh, J.; Beckwith, A.S., Jr. Impact of Data Temporal Resolution on Quantifying Residential End Uses of Water. Water 2022, 14, 2457. [Google Scholar] [CrossRef] [Scilit]
- Pastor-Jabaloyes, L.; Arregui, F.; Cobacho, R. A filtering algorithm for high-resolution flow traces to improve water end-use analysis. Water Supply 2019, 19, 451–462. [Google Scholar] [CrossRef] [Scilit]
- Luciani, C.; Casellato, F.; Alvisi, S.; Franchini, M. Green Smart Technology for Water (GST4Water): Water loss identification at user level by using smart metering systems. Water 2019, 11, 405. [Google Scholar] [CrossRef] [Scilit]
- Keramati, M.; Azizi, E.; Momeni, H.; Hamidi Beheshti, M.; Bolouki, S. Non-intrusive load monitoring using water consumption patterns. In Proceedings of the 2020 28th Iranian Conference on Electrical Engineering (ICEE); IEEE: Piscataway, NJ, USA, 2020; pp. 1–6. [Google Scholar] [CrossRef] [Scilit]
- Marsili, V.; Mazzoni, F.; Alvisi, S.; Franchini, M. From Pressure to Water Consumption: Exploiting High-Resolution Pressure Data to Investigate the End Uses of Water. Water Resour. Manag. 2024, 38, 4969–4985. [Google Scholar] [CrossRef] [Scilit]
- Oliveira-Esquerre, K.; Mello, M.; Botelho, G.; Deng, Z.; Koushanfar, F.; Kiperstok, A. Water end-use consumption in low-income households: Evaluation of the impact of preprocessing on the construction of a classification model. Expert Syst. Appl. 2021, 185, 115623. [Google Scholar] [CrossRef] [Scilit]
- Parveen, M.; Lakshana, S.; Saranya, P.; Avanthika, S.; Ali, M. Predictive Modeling for Water Anomaly Detection Using Machine Learning. In Proceedings of the 2025 International Conference on Computing and Communication Technologies (ICCCT); IEEE: Piscataway, NJ, USA, 2025; pp. 1–5. [Google Scholar] [CrossRef] [Scilit]
- Pelekanos, N.; Kossieris, P.; Lykou, A.; Makropoulos, C. Disaggregating major water end-uses with minimal data: A machine learning and domain knowledge approach. Urban Water J. 2025, 22, 436–446. [Google Scholar] [CrossRef] [Scilit]
- Laceda Taloma, R.; Comminiello, D.; Pisani, P.; Cuomo, F. UNet-WD: Deep Learning for Multi-Appliance Water Disaggregation. In Proceedings of the 2024 IFIP Networking Conference (IFIP Networking); IEEE: Piscataway, NJ, USA, 2024; pp. 702–707. [Google Scholar] [CrossRef] [Scilit]
- Somontina, J.A.B.; Garcia, F.C.C.; Macabebe, E.Q.B. Water consumption monitoring with fixture recognition using random forest. In Proceedings of the TENCON 2018-2018 IEEE Region 10 Conference; IEEE: Piscataway, NJ, USA, 2018; pp. 663–667. [Google Scholar] [CrossRef] [Scilit]
- Tsao, Y.C.; Kuo, Y.W.; Wu, C.C.; Tsai, Y.T.; Hsu, C.; Ho, L.; Wang, H.C. Implementation and design of water flow meter of smart home integrated with environment monitor system. In Proceedings of the 2022 IEEE 4th Eurasia Conference on Biomedical Engineering, Healthcare and Sustainability (ECBIOS); IEEE: Piscataway, NJ, USA, 2022; pp. 126–131. [Google Scholar] [CrossRef] [Scilit]
- del Pilar Villacís-Guerrero, J.; Cunalata-Paredes, D.Y.; Bonilla-Villacís, J.R.; Soria, A.; Avilés-Castillo, F. Residential water consumption monitoring system using IoT and MQTT communication. In Proceedings of the International Conference on Computational Science and Its Applications; Springer: Berlin/Heidelberg, Germany, 2022; pp. 518–533. [Google Scholar] [CrossRef] [Scilit]
- Amora, D.J.A.; Janapin, M.A.V.; Calayag, B.A.M.; Rioflorido, C.L.P.P.; Estur, N.M.; Villegas, P.A.L. Design of a household consumption based water leak detection system utilizing machine learning algorithm. In Proceedings of the 2022 IET International Conference on Engineering Technologies and Applications (IET-ICETA); IEEE: Piscataway, NJ, USA, 2022; pp. 1–2. [Google Scholar] [CrossRef] [Scilit]
- Ali, A.; Salah, M. A case study of iot-based water-energy nexus monitoring platform for household applications in smart cities. In Proceedings of the 2023 IEEE Jordan International Joint Conference on Electrical Engineering and Information Technology (JEEIT); IEEE: Piscataway, NJ, USA, 2023; pp. 1–6. [Google Scholar] [CrossRef] [Scilit]
- Soh, Z.H.C.; Isa, I.S.; Ahmad, F.; Daud, K.; Yahaya, S.Z.; Ismail, A.P.; Abdullah, S.A.C. IoT based water consumption management system via low power wide area network. In Proceedings of the AIP Conference Proceedings; AIP Publishing LLC: Melville, NY, USA, 2024; Volume 2898, p. 020003. [Google Scholar] [CrossRef] [Scilit]
- Bharudin, M.S.A.; Zainuddin, A.A.; Roslee, A.M.; Razak, N.A.A.; Abd Halim, M.H.F.; Saifudin, N.N.M. Comprehensive IoT-Based Water Management System: Cloud Integration for Residential Conservation. In Proceedings of the 2024 IEEE 12th Region 10 Humanitarian Technology Conference (R10-HTC); IEEE: Piscataway, NJ, USA, 2024; pp. 1–6. [Google Scholar] [CrossRef] [Scilit]
- Cabrera, G.H.C.; Chipana, G.J.F.; Chambilla, T.R.B.; Cahua, A.D.M.; De La Cruz, S.E.C.; Ponce, G.R.V. IoT-Smart Water Monitoring Module for Home Connection for Pattern Identification Based on ESP32-Grafana. In Proceedings of the 2025 IEEE Colombian Caribbean Conference (C3); IEEE: Piscataway, NJ, USA, 2025; pp. 1–6. [Google Scholar] [CrossRef] [Scilit]
- Srinivasan, R.; Vimala Devi, K.; Praveenraj, D.W.; Venkatasuvrananian, S.; Subramani, K.; Prasanth, V.; Gaddala, B.R. IoT-Driven Dynamic Behavior Intervention Model for Sustainable Hygiene Practices: Insights from Household Water Consumption. In Proceedings of the International Conference on Artificial Intelligence and its Application; Springer: Berlin/Heidelberg, Germany, 2023; pp. 136–154. [Google Scholar] [CrossRef] [Scilit] [PubMed]
- Mohamed, N.E.D.M.; Akwah, O.E.; Mohamed, A.N.; El-Dakroury, M.M. AI-Driven Smart Water Flow Meter System for Real-Time Water Monitoring and Probabilistic Leakage Detection. In Proceedings of the 2025 7th Novel Intelligent and Leading Emerging Sciences Conference (NILES); IEEE: Piscataway, NJ, USA, 2025; pp. 457–462. [Google Scholar] [CrossRef] [Scilit]
- Roslan, M.Y.H.; Rahman, F.Y.A.; Mohamad, R.; Shahbudin, S. Development and Evaluation of an IoT-Based Home Water Usage Monitoring System Using LoRa and ESP32. In Proceedings of the 2025 IEEE 16th Control and System Graduate Research Colloquium (ICSGRC); IEEE: Piscataway, NJ, USA, 2025; pp. 111–114. [Google Scholar] [CrossRef] [Scilit]
- Akash, S.; Adwaith, J.; Adish, B.; AK, A. Smartdrop–A Smart Domestic Water Management and Alert System. In Proceedings of the 2026 International Conference on Computational Robotics, Testing and Engineering Evaluation (ICCRTEE); IEEE: Piscataway, NJ, USA, 2026; pp. 1–6. [Google Scholar] [CrossRef] [Scilit]
- Boudhaouia, A.; Wira, P. Water consumption analysis for real-time leakage detection in the context of a smart tertiary building. In Proceedings of the 2018 International Conference on Applied Smart Systems (ICASS); IEEE: Piscataway, NJ, USA, 2018; pp. 1–6. [Google Scholar] [CrossRef] [Scilit]
- Ünsal, B.; Akselli, B.; Sacı, Ş.; Aksel, E. Initial results on the flow dynamics of household water consumption. In Proceedings of the 18th International Flow Measurement Conference (FLOMEKO), Lisbon, Portugal, 26–28 June 2019; pp. 1–6. [Google Scholar]
- Ali, A.; Rahman, M.; Siddique, M.; Galib, S.; Nashiry, A. Design of an automatic rooftop water tank filling system and measurement of consumed water for home appliance. Int. J. Autom. Smart Technol. 2023, 13, 2371. [Google Scholar] [CrossRef] [Scilit]
- Torres-Gutierrez, J.L.; Castañeda-Miranda, C.L.; Martínez-Blanco, M.d.R.; Guerrero-Osuna, H.A.; Jiménez-Díaz, G.; Espinoza-García, G.; Moreno-Lucio, M.; Ibarra-Pérez, T.; Solís-Sánchez, L.O. Development and Implementation of a Smart Water Metering and Monitoring System for Homes with Intermittent Water Supply. Technologies 2026, 14, 135. [Google Scholar] [CrossRef] [Scilit]
- Rahim, M.S.; Anh Nguyen, K.; Stewart, R.A.; Giurco, D.; Blumenstein, M. Predicting household water consumption events: Towards a personalised recommender system to encourage water-conscious behaviour. In Proceedings of the 2019 International Joint Conference on Neural Networks (IJCNN); IEEE: Piscataway, NJ, USA, 2019; pp. 1–8. [Google Scholar] [CrossRef] [Scilit]
- Arsene, D.; Predescu, A.; Truică, C.O.; Apostol, E.S.; Mocanu, M.; Chiru, C. Clustering Consumption Activities in a Water Monitoring System. In Proceedings of the 2022 IEEE International Conference on Automation, Quality and Testing, Robotics (AQTR); IEEE: Piscataway, NJ, USA, 2022; pp. 1–6. [Google Scholar] [CrossRef] [Scilit]
- Attallah, N.A.; Horsburgh, J.S.; Bastidas Pacheco, C.J. An open-source, semisupervised water end-use disaggregation and classification tool. J. Water Resour. Plan. Manag. 2023, 149, 04023024. [Google Scholar] [CrossRef] [Scilit]
- Gross, M.P.; Taormina, R.; Cominola, A. A Machine Learning-based framework and open-source software for Non Intrusive Water Monitoring. Environ. Model. Softw. 2025, 183, 106247. [Google Scholar] [CrossRef] [Scilit]
- De Souza, N.; dos Santos Miranda, I.D.; Khun, A.; Romeiro, L.d.A.W.; Fontes, C.H.; de Castro Lima, A.C. Development of an acoustic flowmeter for low flow rates. Flow Meas. Instrum. 2023, 91, 102368. [Google Scholar] [CrossRef] [Scilit]
- Forster, P.; Wallace, B.; Goubran, R.; Knoefel, F. Assessing activities of daily living by measuring residential water use with low cost thermistors. In Proceedings of the 2022 IEEE International Symposium on Medical Measurements and Applications (MeMeA); IEEE: Piscataway, NJ, USA, 2022; pp. 1–6. [Google Scholar] [CrossRef] [Scilit]
- Carratù, M.; Iacono, S.D.; Di Leo, G.; Gallo, V.; Liguori, C.; Pietrosanto, A. A novel image processing technique based on deep learning for water consumption detection. In Proceedings of the 2022 IEEE International Instrumentation and Measurement Technology Conference (I2MTC); IEEE: Piscataway, NJ, USA, 2022; pp. 1–6. [Google Scholar] [CrossRef] [Scilit]
- Vitter, J.S.; Webber, M.E. A non-intrusive approach for classifying residential water events using coincident electricity data. Environ. Model. Softw. 2018, 100, 302–313. [Google Scholar] [CrossRef] [Scilit]
- Wang, C.; Li, Z.; Ni, X.; Shi, W.; Zhang, J.; Bian, J.; Liu, Y. Residential water and energy consumption prediction at hourly resolution based on a hybrid machine learning approach. Water Res. 2023, 246, 120733. [Google Scholar] [CrossRef] [Scilit] [PubMed]
- Zhang, Y.; Zhu, Y.; Li, H.; Wang, L.; Zhang, L.; Ding, H.; Wang, H. Quantifying the Impact of Climate Change on Household Water Use in Mega Cities: A Case Study of Beijing, China. Sustainability 2025, 17, 5628. [Google Scholar] [CrossRef] [Scilit]
- Abu-Bakar, H.; Williams, L.; Hallett, S. Contextualising household water consumption patterns in England: A socio-economic and socio-demographic narrative. Clean. Responsible Consum. 2023, 8, 100104. [Google Scholar] [CrossRef] [Scilit]
- Sablica, L.; Grün, B.; Layeghy, S.; Dolnicar, S.; Portmann, M. EcoShower: Estimating shower duration using non-intrusive multi-modal sensor data via LSTM and Gated Transformer models. Expert Syst. Appl. 2025, 277, 127202. [Google Scholar] [CrossRef] [Scilit]
- Arias-Garcia, J.; Cárdenas-Peña, D.; Orozco-Gutiérrez, A.; Garcia-Arias, H.; Guerrero-Erazo, J. Graph-Based Clustering of Urban Water Consumption Profiles via Adaptive Attention and Multi-Relational Topologies. Water 2026, 18, 1272. [Google Scholar] [CrossRef] [Scilit]
- Ahamed, I.; Ali, M.L.; Salehin, N. IoT-based Smart Water Consumption Monitoring System for Residential Complex. In Proceedings of the 2024 2nd International Conference on Information and Communication Technology (ICICT); IEEE: Piscataway, NJ, USA, 2024; pp. 46–50. [Google Scholar] [CrossRef] [Scilit]
- Marathe, A.; Lodha, A.; Lolage, O.; Lodha, P.; Herald, L. Smart Water Management System for Housing Societies. In Proceedings of the 2024 2nd International Conference on Emerging Trends in Engineering and Medical Sciences (ICETEMS); IEEE: Piscataway, NJ, USA, 2024; pp. 457–461. [Google Scholar] [CrossRef] [Scilit]
- Faiz, M.; Daniel, A. Wireless sensor network based distribution and prediction of water consumption in residential houses using ANN. In Proceedings of the International Conference on Internet of Things and Connected Technologies; Springer: Berlin/Heidelberg, Germany, 2021; pp. 107–116. [Google Scholar] [CrossRef] [Scilit]
- Cristiano, E.; Biddau, P.; Delogu, A.; Gandolfi, M.; Deidda, R.; Viola, F. Automatic detection of water consumption temporal patterns in a residential area in Northen Italy. Water Resour. Manag. 2024, 38, 6213–6228. [Google Scholar] [CrossRef] [Scilit]
- Rubiños, M.; Jove, E.; García-Ordás, M.T.; Abelha, A.; Alaiz-Moretón, H. Unsupervised AI-based water consumption classification from time series data. Log. J. IGPL 2026, 34, jzaf082. [Google Scholar] [CrossRef]
- Zhakiyev, N.; Omirgaliyev, R.; Bapiyev, I.; Baisakalova, N.; Tankeyev, S. System for Water and Electricity Consumption Prediction in Smart Cities Using ML. In Proceedings of the 2023 IEEE International Conference on Smart Information Systems and Technologies (SIST); IEEE: Piscataway, NJ, USA, 2023; pp. 278–282. [Google Scholar] [CrossRef] [Scilit]
- Niazmardi, S.; Sadrykia, M.; Rezazadeh, M. Analysis of spatiotemporal household water consumption patterns and their relationship with meteorological variables. Urban Clim. 2023, 52, 101707. [Google Scholar] [CrossRef] [Scilit]
- Sabzchi-Dehkharghani, H.; Majnooni-Heris, A.; Fakherifard, A.; Yegani, R. Estimation of household water consumption pattern in a metropolitan area taking the impact of the COVID-19 pandemic. Int. J. Environ. Sci. Technol. 2023, 20, 3161–3176. [Google Scholar] [CrossRef] [Scilit] [PubMed]
- Xia, S.; Zhu, H.; Zhang, N.; Li, Y.; Zhou, C. A dual-feature channel deep network with adaptive variable weight reconstruction for urban water demand prediction. Sustain. Cities Soc. 2025, 119, 106118. [Google Scholar] [CrossRef] [Scilit]
- Nasser, A.; Rashad, M.; Hussein, S. A Two-Layer Water Demand Prediction System in Urban Areas Based on Micro-Services and LSTM Neural Networks. IEEE Access 2020, 8, 147647–147661. [Google Scholar] [CrossRef] [Scilit]
- Lall, A.; Terala, A.; Goyal, A.; Chaudhari, S.; Rajan, K.; Chouhan, S. Behavioural Analysis of Water Consumption Using IoT-Based Smart Retrofit Meter. IEEE Access 2024, 12, 113597–113607. [Google Scholar] [CrossRef] [Scilit]
- Saganowski, L.; Andrysiak, T. Prediction of Water Usage for Advanced Metering Infrastructure Network with Intelligent Water Meters. In Proceedings of the Computational Intelligence in Security for Information Systems Conference; Springer: Berlin/Heidelberg, Germany, 2023; pp. 122–131. [Google Scholar] [CrossRef] [Scilit]
- Somontina, J.A.; MacAbebe, E.Q. A Non-Intrusive Water Consumption Monitoring System. In Proceedings of the 2020 IEEE Global Humanitarian Technology Conference (GHTC); IEEE: Piscataway, NJ, USA, 2020; pp. 1–6. [Google Scholar] [CrossRef] [Scilit]
- Kamau, S.; Waruguru, M. Predicting Domestic Water Consumption in Urban Areas Using Smart Water Meter Data. In Proceedings of the 2025 IEEE 4th International Conference on Computing and Machine Intelligence (ICMI); IEEE: Piscataway, NJ, USA, 2025; pp. 1–6. [Google Scholar] [CrossRef] [Scilit]
- Saganowski, L.; Andrysiak, T. Smart Water Meter Network Anomaly and Failure Detection System. In Proceedings of the International Conference on EUropean Transnational Education; Springer: Berlin/Heidelberg, Germany, 2024; pp. 35–44. [Google Scholar] [CrossRef] [Scilit]
- Naseri, M.; Bernosky, G.; Mayer, P.; Marston, L. Patterns and Predictors of Residential Indoor Water Use Across Major US Cities. Earth’s Future 2025, 13, e2024EF005467. [Google Scholar] [CrossRef] [Scilit]
- Berlotti, M.; Di Grande, S.; Cavalieri, S.; Gueli, R. Modelling and Clustering Patterns from Smart Meter Data in Water Distribution Systems. In Proceedings of the ICEIS (1); SciTePress: Setúbal, Portugal, 2025; pp. 691–698. [Google Scholar] [CrossRef] [Scilit]
- Guo, H.; Liu, X.; Zhang, Q. Identifying daily water consumption patterns based on K-means Clustering, Agglomerative Hierarchical Clustering, and Spectral Clustering algorithms. AQUA—Water Infrastruct. Ecosyst. Soc. 2024, 73, 870–887. [Google Scholar] [CrossRef] [Scilit]
- Maussner, C.; Teppan, E. Aggregated Dataset vs. Ensemble Learning for Spatial Transferability in Water Demand Forecasting. In Proceedings of the 2025 IEEE 37th International Conference on Tools with Artificial Intelligence (ICTAI); IEEE: Piscataway, NJ, USA, 2025; pp. 1168–1174. [Google Scholar] [CrossRef] [Scilit]
- Varghese, L.J.; Devanath, V.; Kishore, V.; Poornima, R.; Jacob, S.S. IoT Based Smart Water Meter for Domestic Utility. In Proceedings of the 2025 International Conference on Inventive Computation Technologies (ICICT); IEEE: Piscataway, NJ, USA, 2025; pp. 1601–1608. [Google Scholar] [CrossRef] [Scilit]
- Nguyen, K.; Stewart, R.; Zhang, H. Transforming Residential Water End Use Analysis: Unleashing the Potential of Low-Resolution Smart Metering Data. Water Res. 2025, 278, 123344. [Google Scholar] [CrossRef] [Scilit]
- Keramati, M.; Azizi, E.; Momeni, H.; Bolouki, S. Incorporating coincidental water data into non-intrusive load monitoring. Sustain. Energy Grids Netw. 2022, 32, 100805. [Google Scholar] [CrossRef] [Scilit]
- Heydari, Z.; Cominola, A.; Stillwell, A. Is smart water meter temporal resolution a limiting factor to residential water end-use classification? A quantitative experimental analysis. Environ. Res. Infrastruct. Sustain. 2022, 2, 045004. [Google Scholar] [CrossRef] [Scilit]
- Attallah, N.; Horsburgh, J.; Beckwith, A.S., Jr.; Tracy, R. Residential water meters as edge computing nodes: Disaggregating end uses and creating actionable information at the edge. Sensors 2021, 21, 5310. [Google Scholar] [CrossRef] [Scilit] [PubMed]
- Yang, A.; Zhang, H.; Stewart, R.; Nguyen, K. Enhancing residential water end use pattern recognition accuracy using self-organizing maps and K-means clustering techniques: Autoflow v3.1. Water 2018, 10, 1221. [Google Scholar] [CrossRef] [Scilit]
- Heydari, Z.; Stillwell, A. Comparative Analysis of Supervised Classification Algorithms for Residential Water End Uses. Water Resour. Res. 2024, 60, e2023WR036690. [Google Scholar] [CrossRef] [Scilit]
- Zhang, J.; Savic, D.; Xu, Q.; Liu, K.; Qiang, Z. Poisson rectangular pulse (PRP) model establishment based on uncertainty analysis of urban residential water consumption patterns. Environ. Sci. Ecotechnol. 2024, 18, 100317. [Google Scholar] [CrossRef] [Scilit] [PubMed]
- Pradeep, P.; Zhao, W.; Kowalski, M.; Bakeev, C. Disaggregating Household Water End-Uses: A Comparative Study between XGBoost and TabNet. In Proceedings of the 2024 6th International Conference on Data-driven Optimization of Complex Systems (DOCS); IEEE: Piscataway, NJ, USA, 2024; pp. 385–392. [Google Scholar] [CrossRef] [Scilit]
- Mello, M.; Oliveira-Esquerre, K.; Botelho, G. Comparative Study of Similarity Measures Used to Classify Residential Water Flow Pattern of Low-Income Households in Salvador—Brazil. In Computer Aided Chemical Engineering; Elsevier: Amsterdam, The Netherlands, 2018; Volume 44, pp. 1405–1410. [Google Scholar] [CrossRef] [Scilit]
- Abu-Bakar, H.; Williams, L.; Hallett, S. An empirical water consumer segmentation and the characterisation of consumption patterns underpinning demand peaks. Resour. Conserv. Recycl. 2021, 174, 105792. [Google Scholar] [CrossRef] [Scilit]
- Yang, A.; Zhang, H.; Stewart, R.; Nguyen, K. Water end use clustering using hybrid pattern recognition techniques - Artificial Bee Colony, Dynamic Time Warping and K-Medoids clustering. Int. J. Mach. Learn. Comput. 2018, 8, 483–487. [Google Scholar] [CrossRef] [Scilit]
- Pastor-Jabaloyes, L.; Arregui, F.; Cobacho, R. Water end use disaggregation based on soft computing techniques. Water 2018, 10, 46. [Google Scholar] [CrossRef] [Scilit]
- Bethke, G.; Cohen, A.; Stillwell, A. Emerging investigator series: Disaggregating residential sector high-resolution smart water meter data into appliance end-uses with unsupervised machine learning. Environ. Sci. Water Res. Technol. 2021, 7, 487–503. [Google Scholar] [CrossRef] [Scilit]
- Bermejo-Martín, G.; Rodríguez-Monroy, C.; Núñez-Guerrero, Y. Water consumption range prediction in Huelva’s households using classification and regression trees. Water 2021, 13, 506. [Google Scholar] [CrossRef] [Scilit]
- Papatheodoulou, D.; Pavlou, P.; Vrachimis, S.; Malialis, K.; Eliades, D.; Theocharides, T. A Multi-label Time Series Classification Approach for Non-intrusive Water End-Use Monitoring. In Proceedings of the IFIP International Conference on Artificial Intelligence Applications and Innovations; Springer: Berlin/Heidelberg, Germany, 2022; pp. 53–66. [Google Scholar] [CrossRef] [Scilit]
- Arsene, D.; Predescu, A.; Truică, C.O.; Apostol, E.S.; Mocanu, M. Decision support strategies for household water consumption behaviors based on advanced recommender systems. Water 2023, 15, 2550. [Google Scholar] [CrossRef] [Scilit]
- Rahim, M.S.; Nguyen, K.A.; Stewart, R.A.; Giurco, D.; Blumenstein, M. Machine learning and data analytic techniques in digital water metering: A review. Water 2020, 12, 294. [Google Scholar] [CrossRef] [Scilit]
- Roshan, A.; Kumar, M. Water end-use estimation can support the urban water crisis management: A critical review. J. Environ. Manag. 2020, 268, 110663. [Google Scholar] [CrossRef] [Scilit] [PubMed]
- Cominola, A.; Preiss, L.; Thyer, M.; Maier, H.R.; Prevos, P.; Stewart, R.A.; Castelletti, A. The determinants of household water consumption: A review and assessment framework for research and practice. npj Clean Water 2023, 6, 11. [Google Scholar] [CrossRef] [Scilit]
- Canquil, D.; San Martín, D.; Inoquio-Renteria, I.; Leger, P. A systematic literature review on machine learning techniques for predicting household water consumption. Water Resour. Manag. 2026, 40, 83. [Google Scholar] [CrossRef]
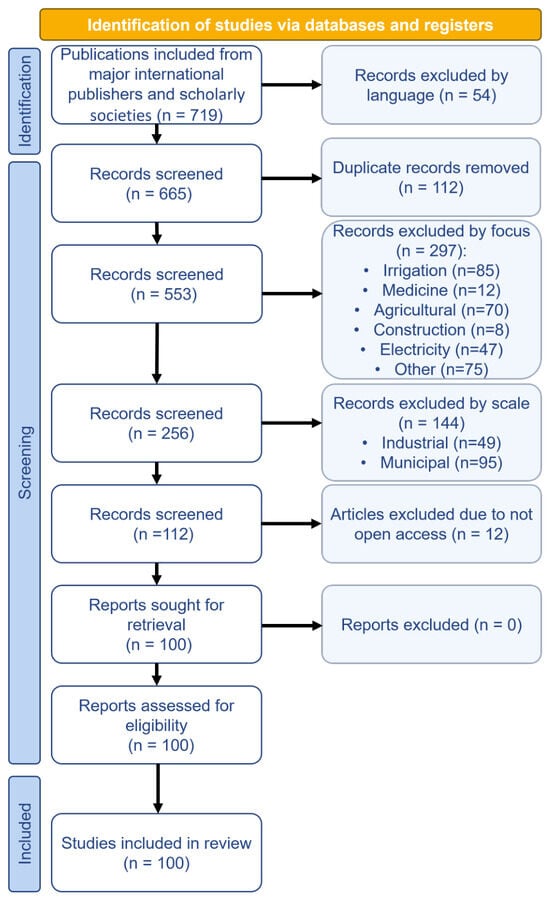
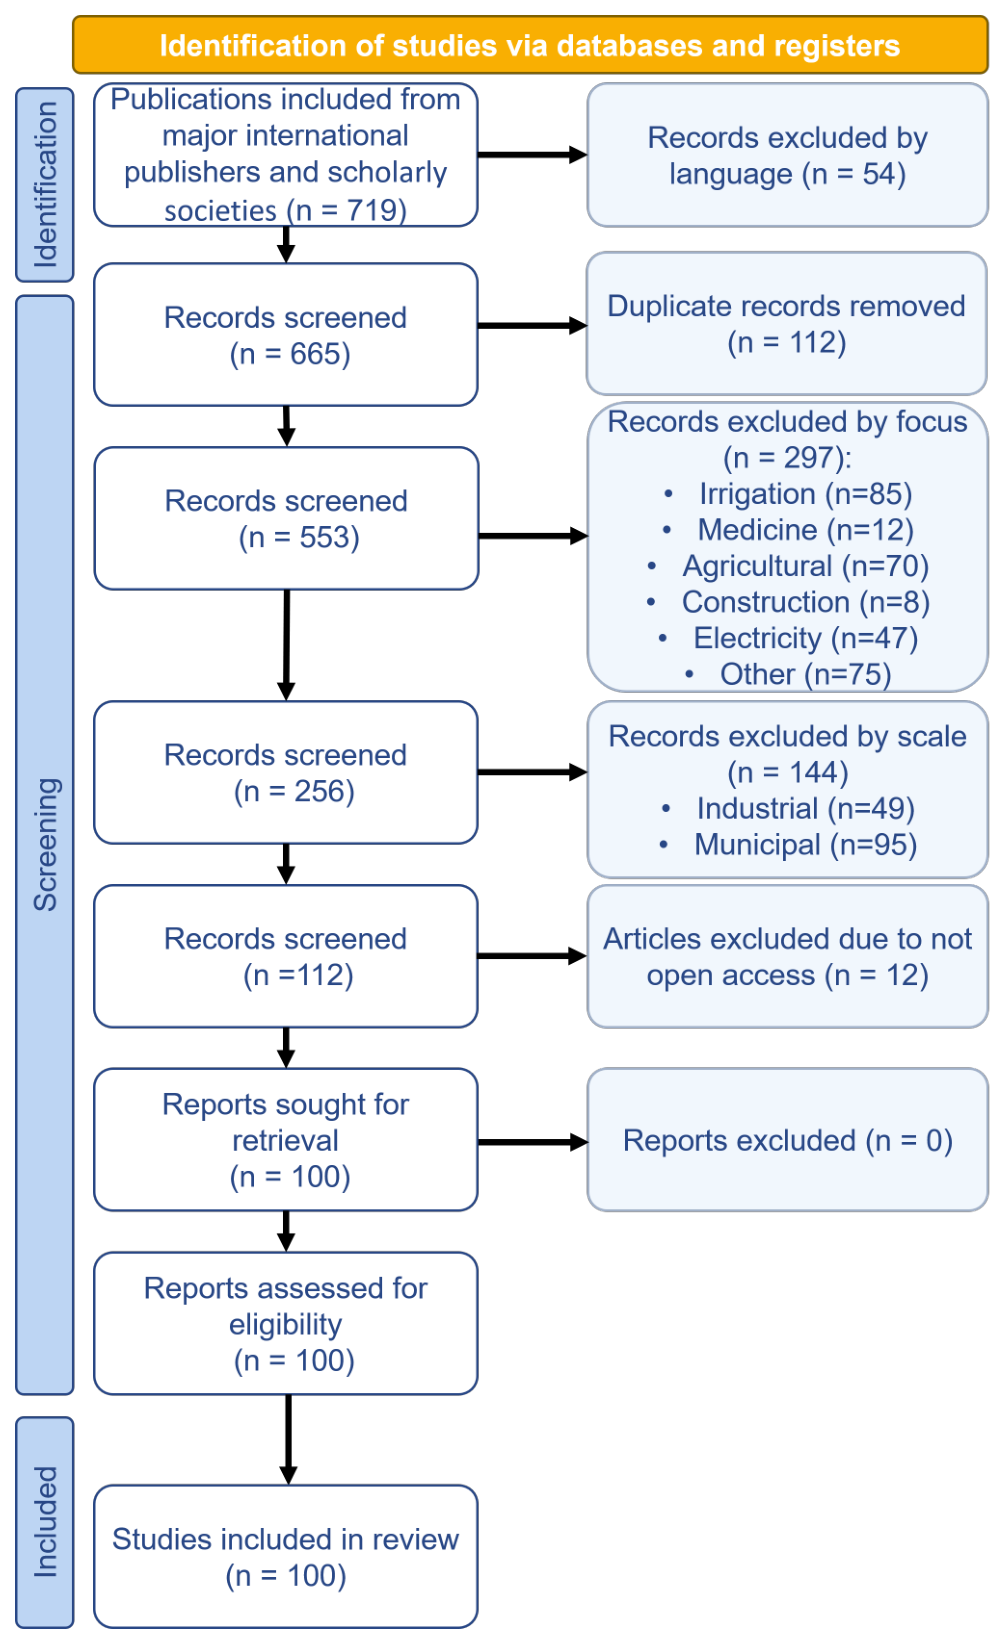
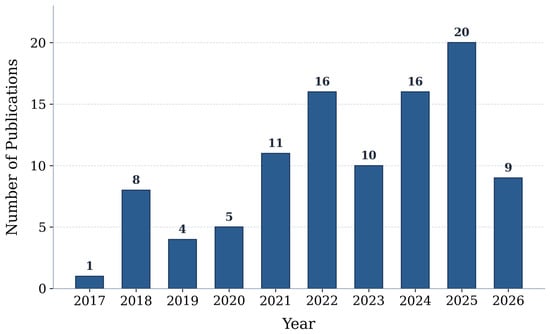
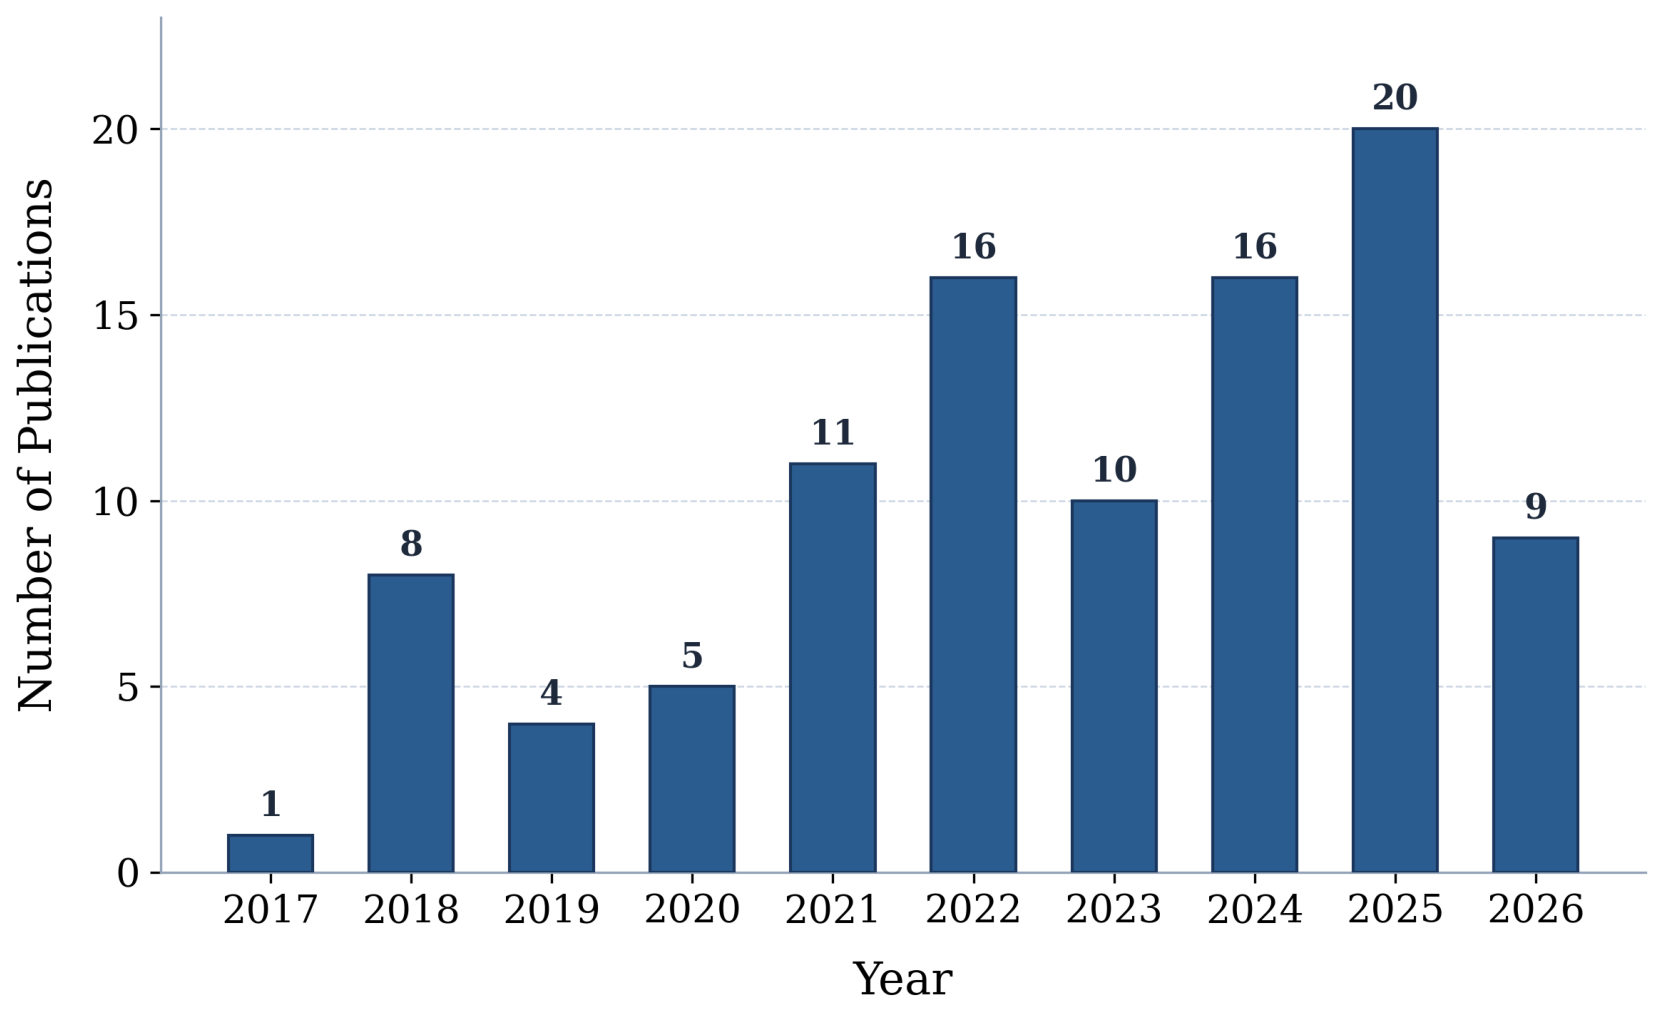
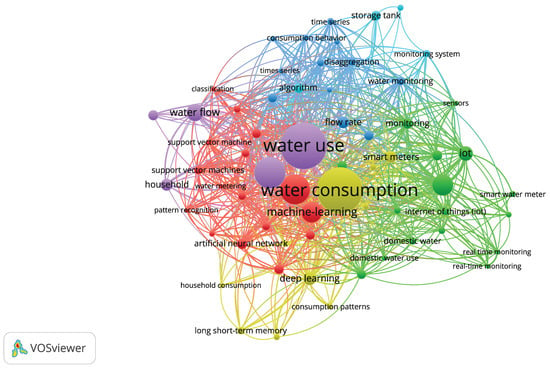
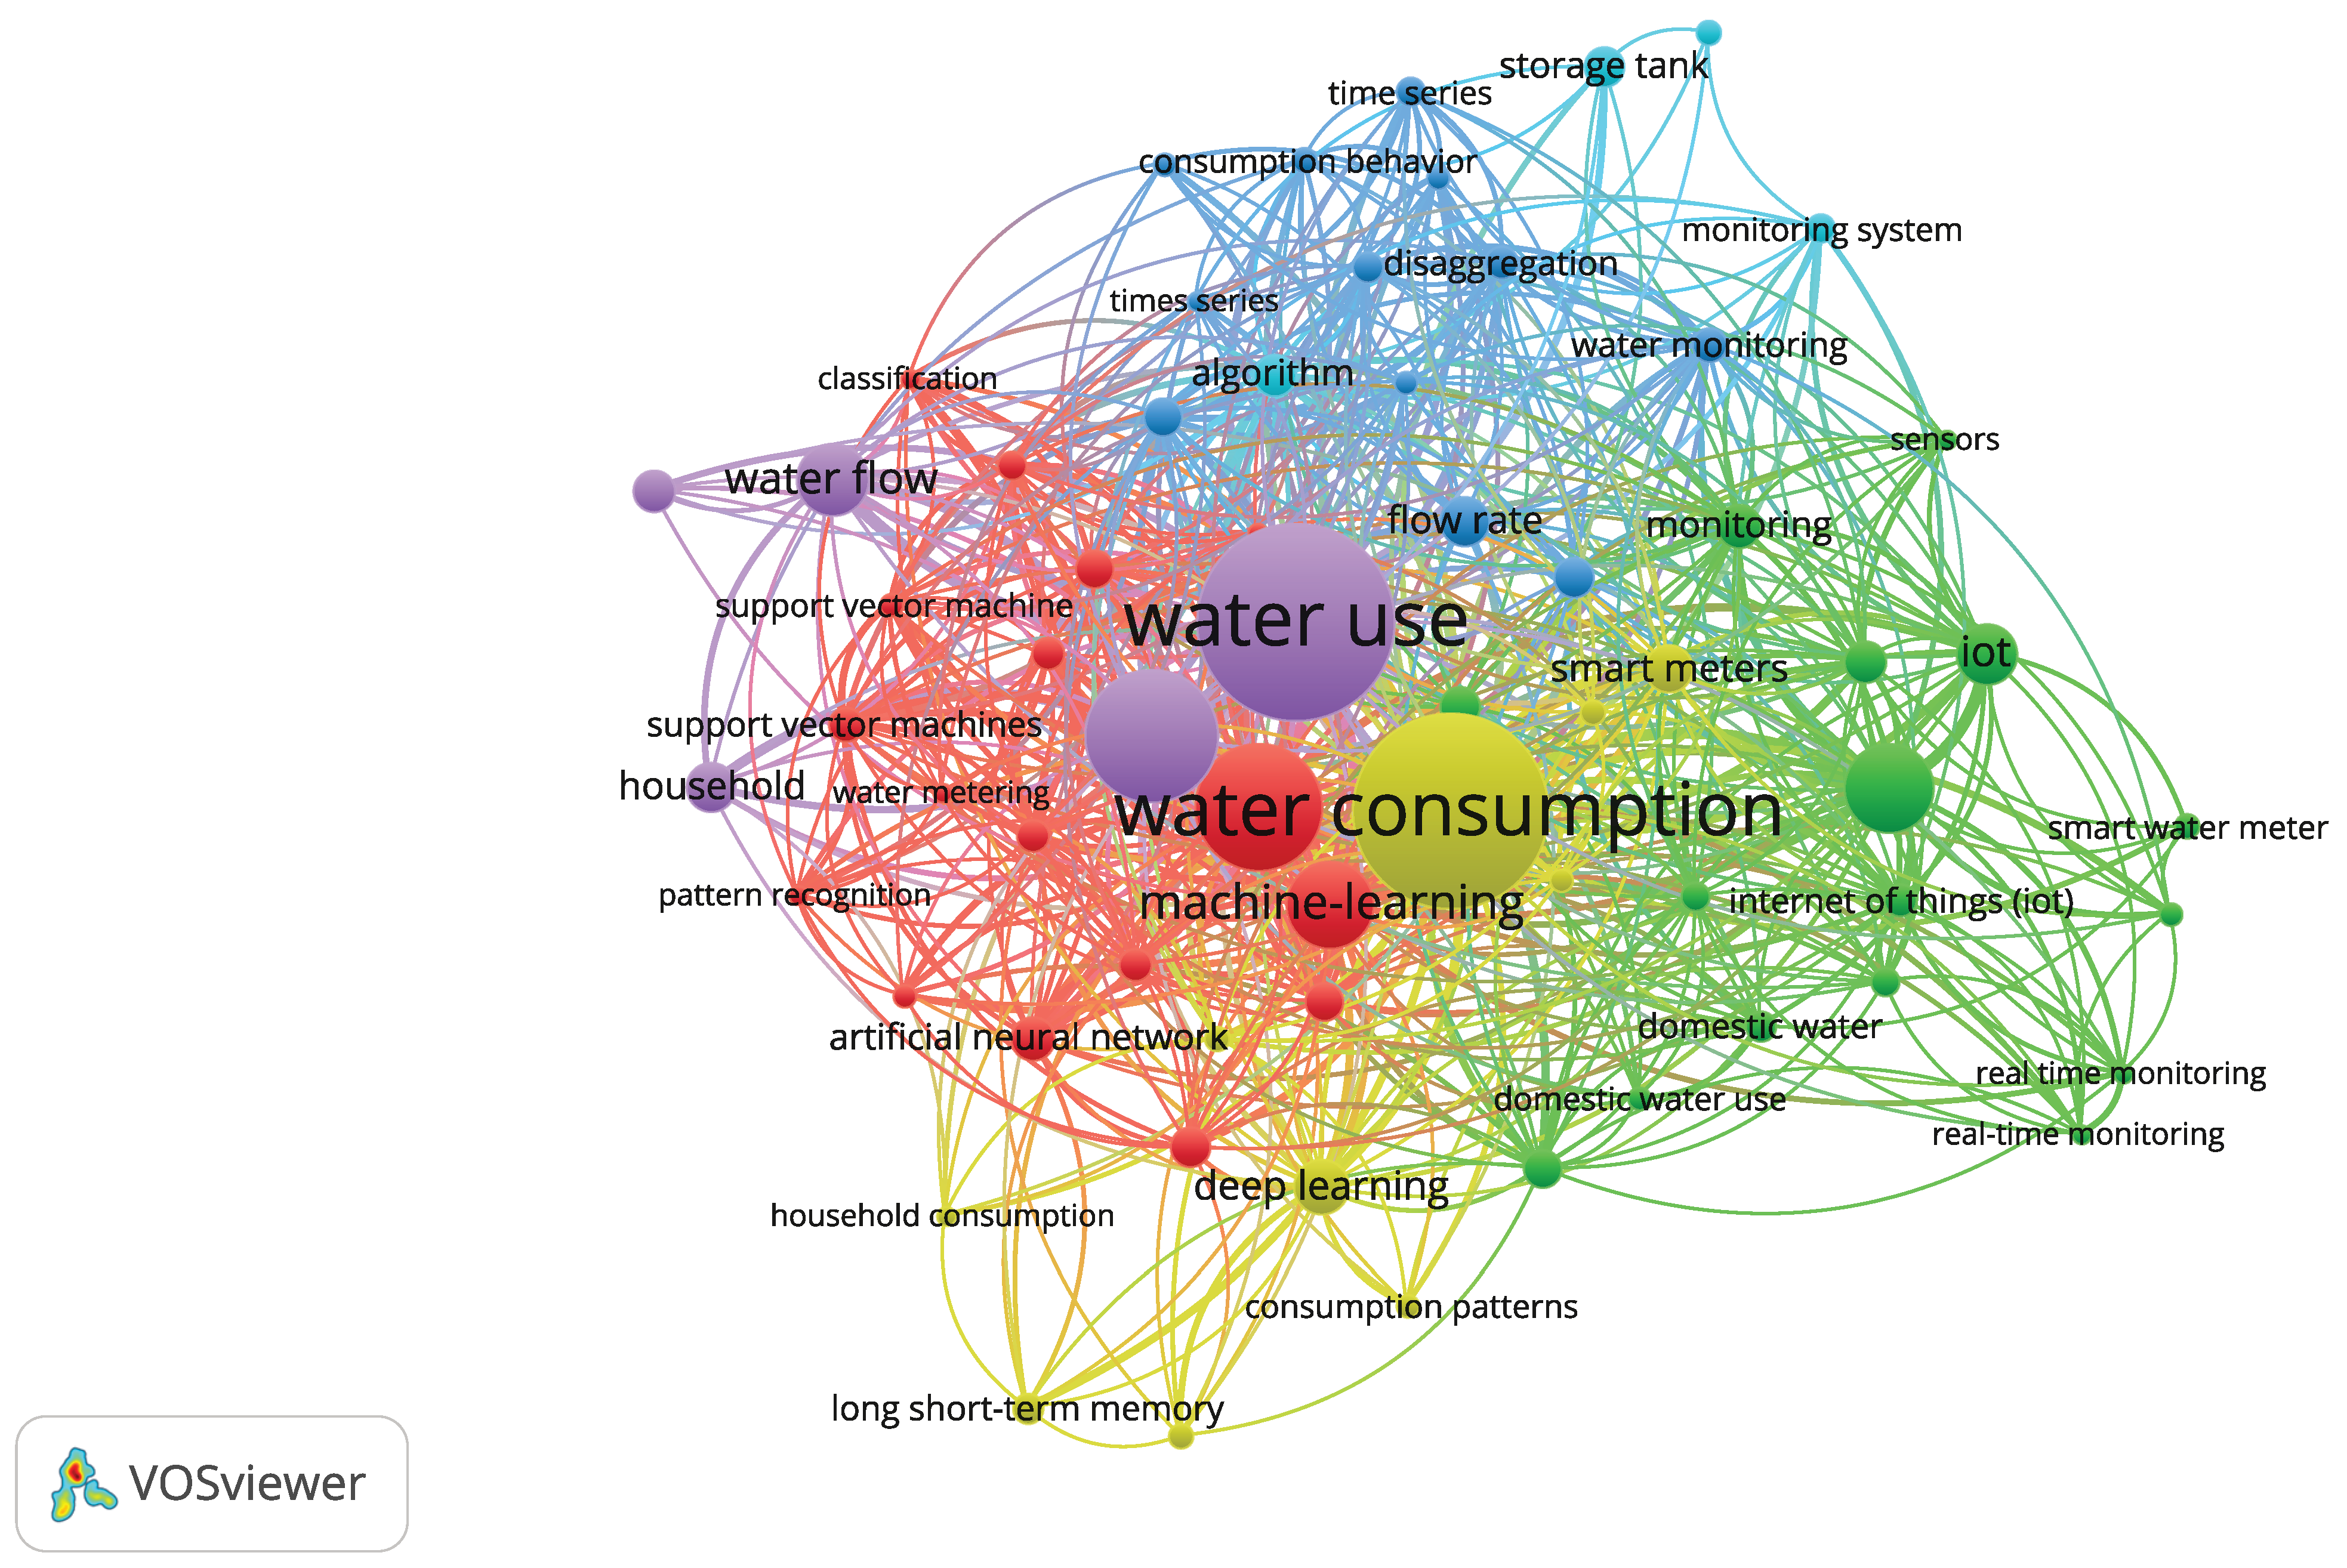
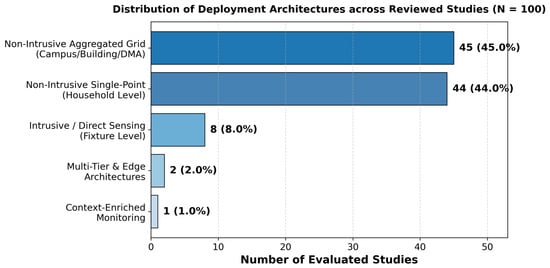
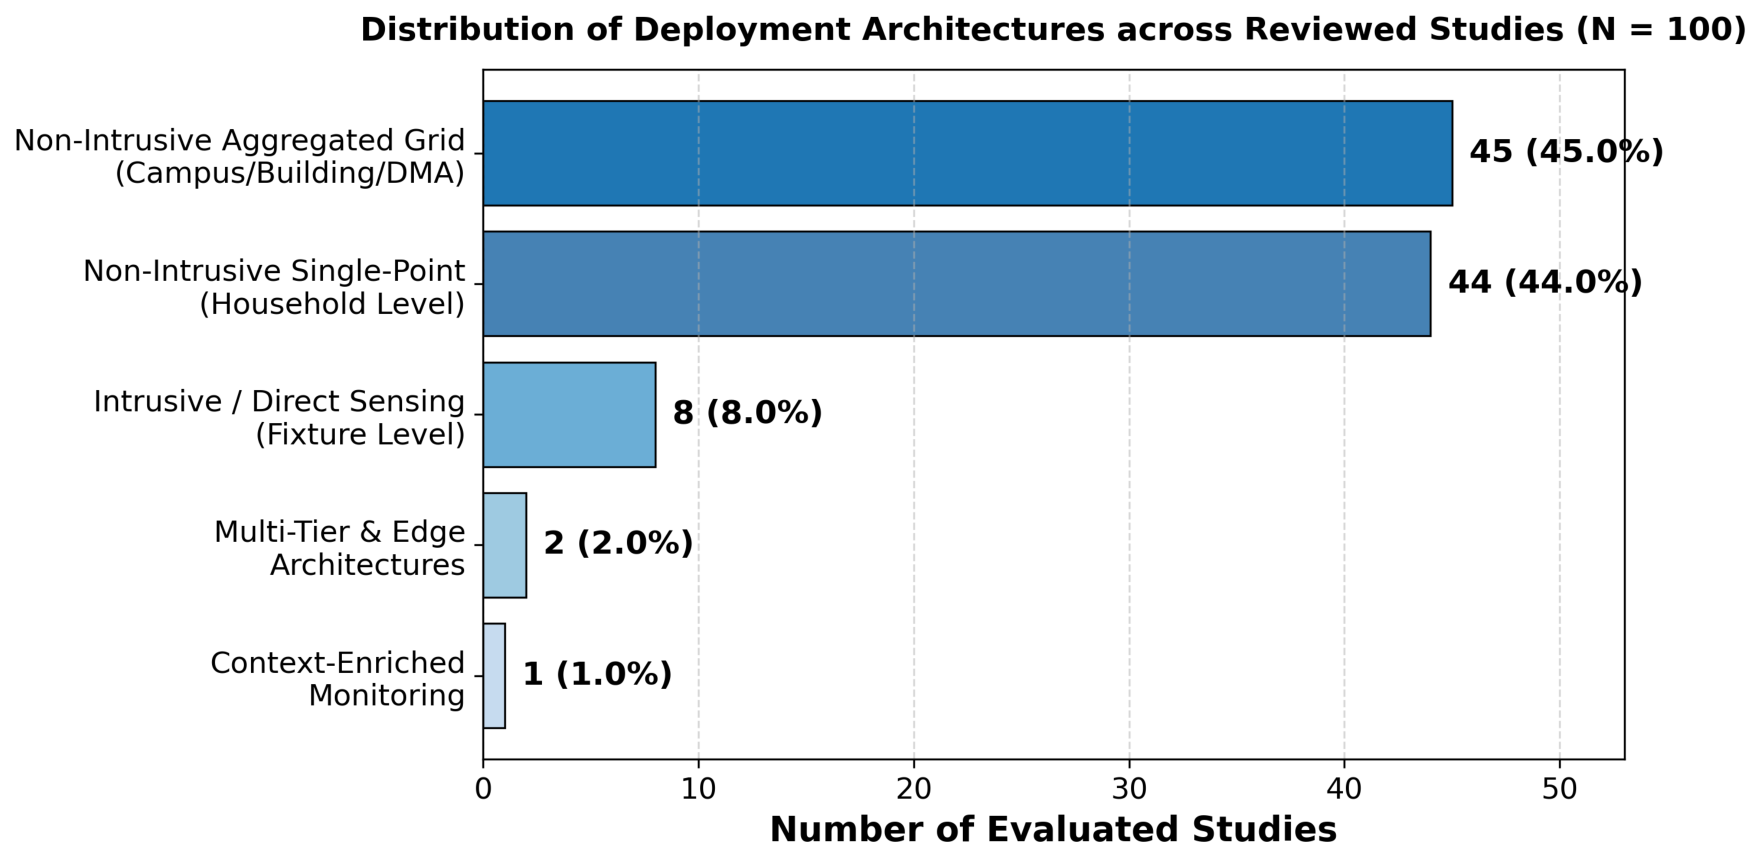
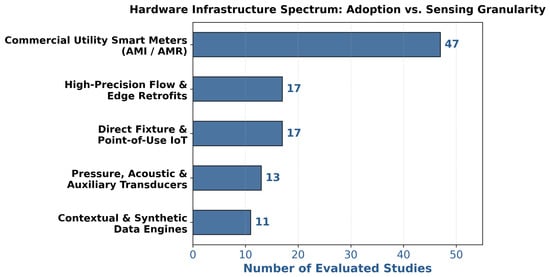
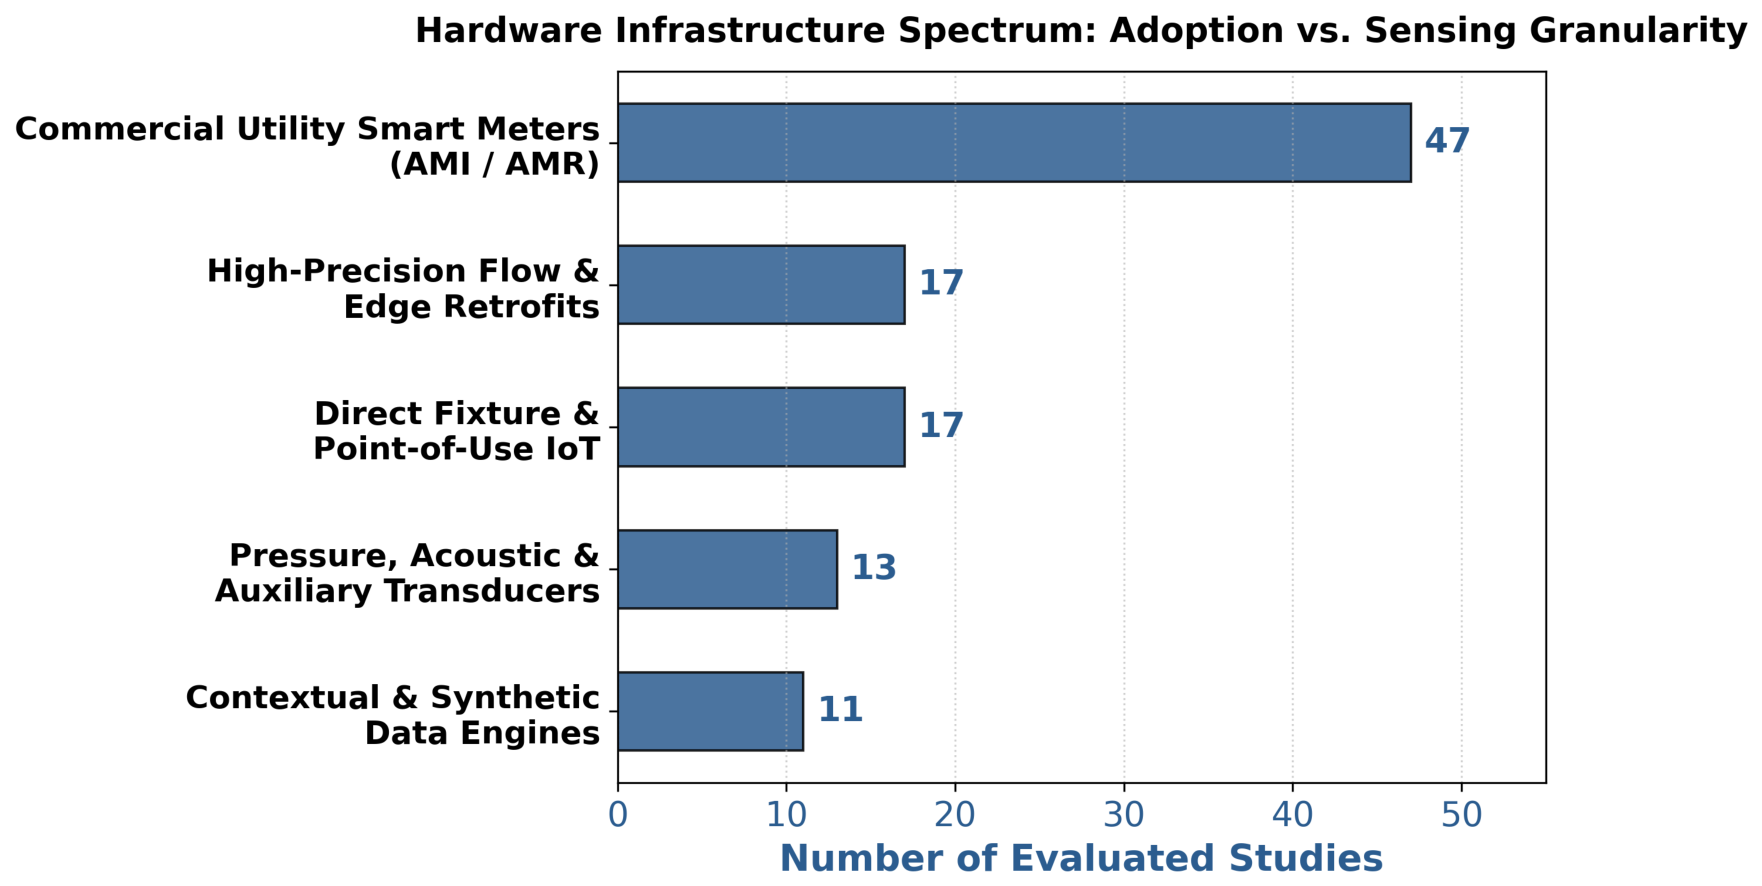
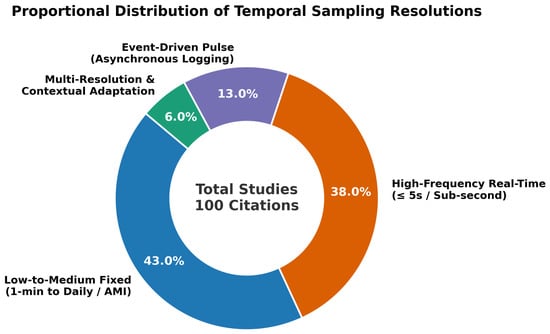
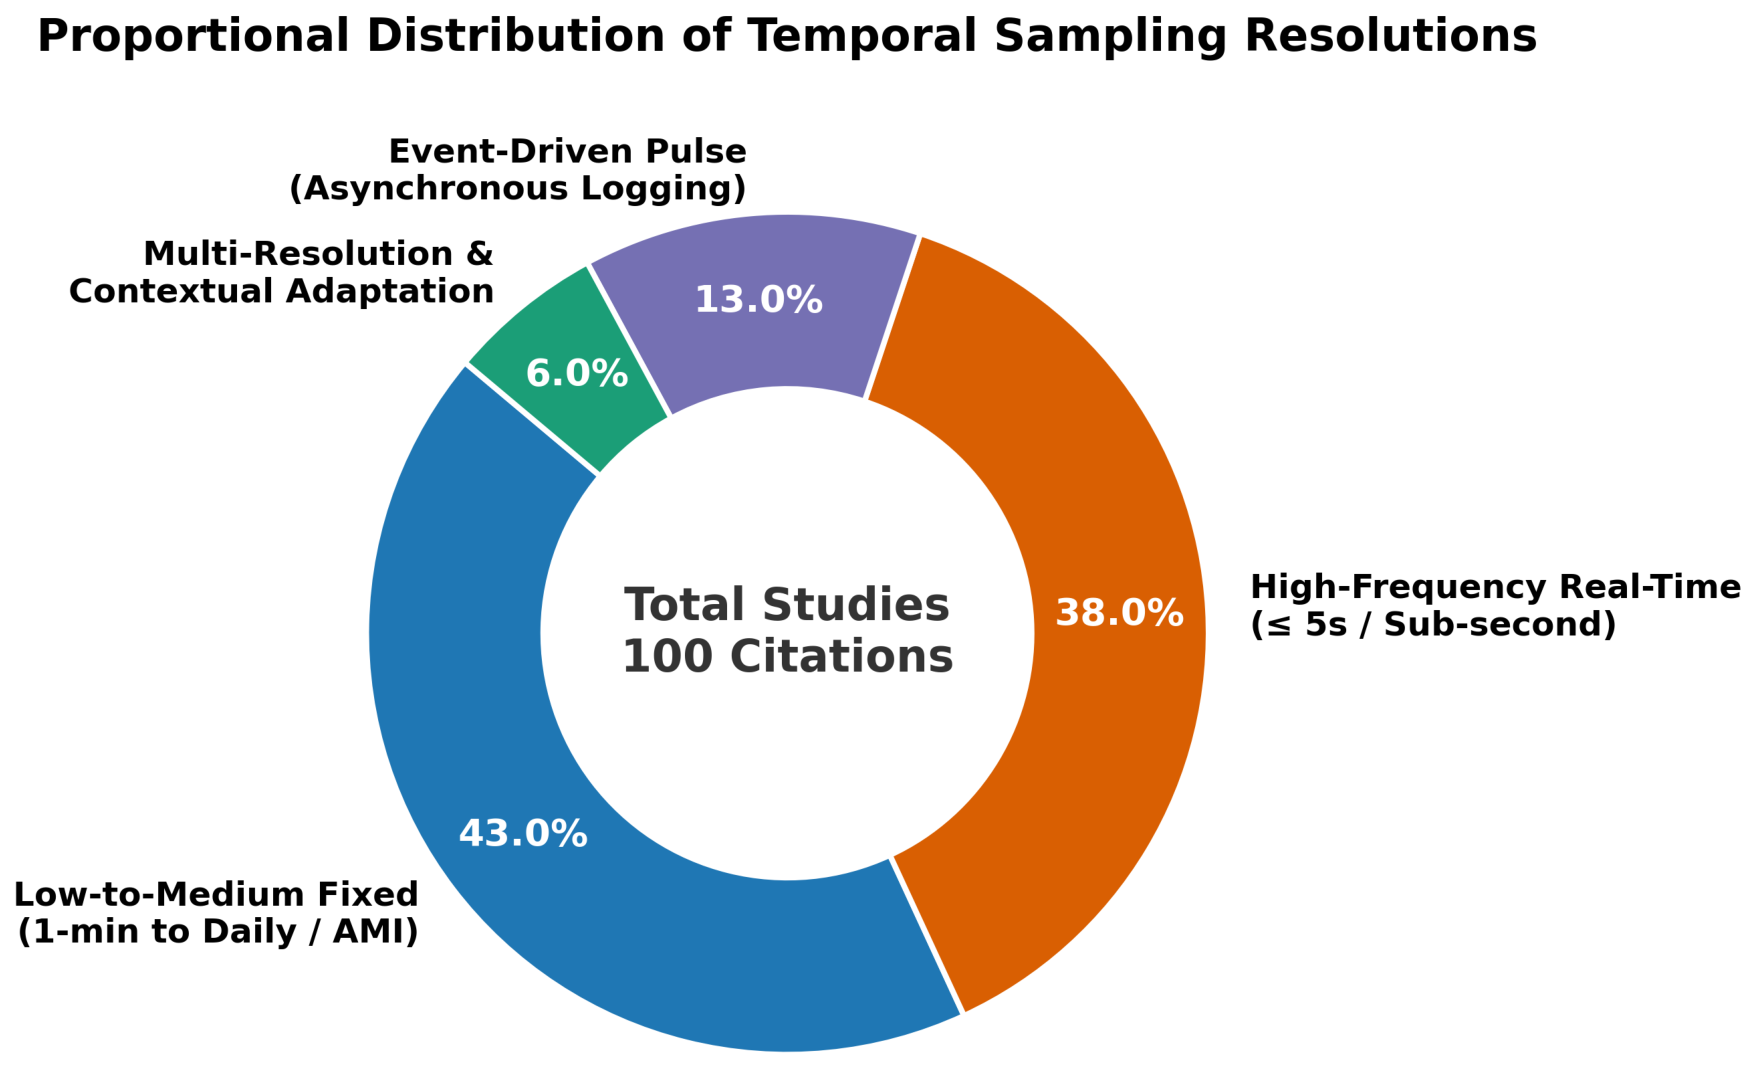
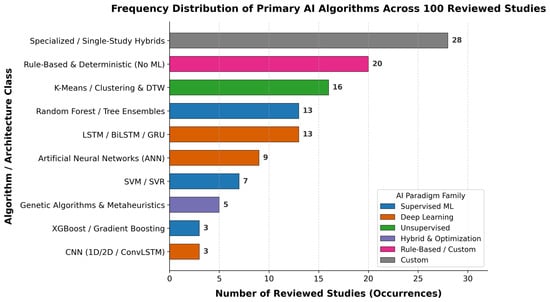
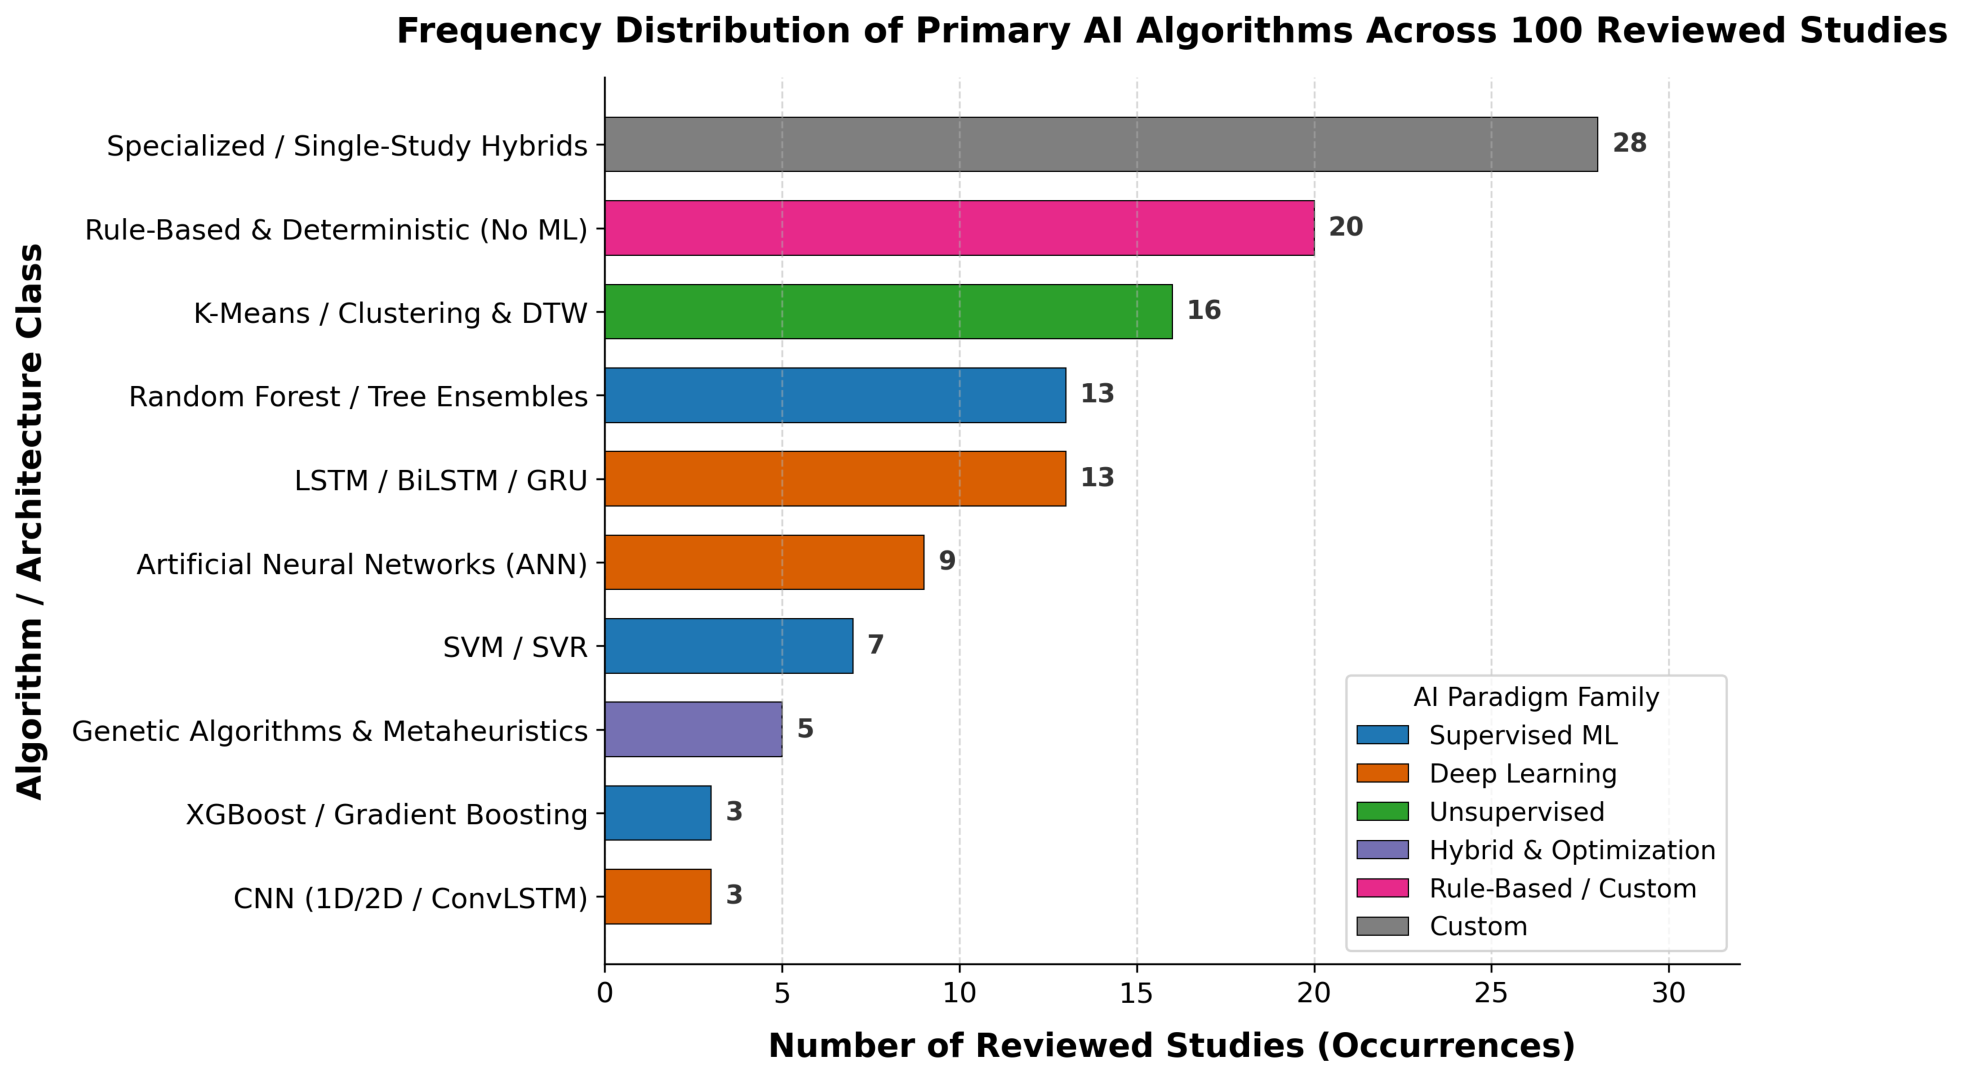
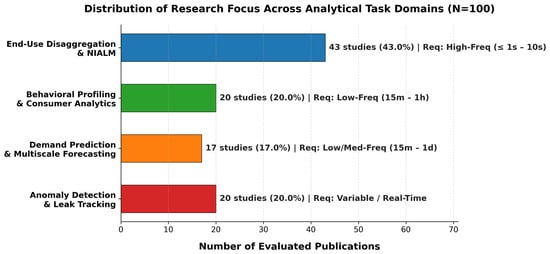
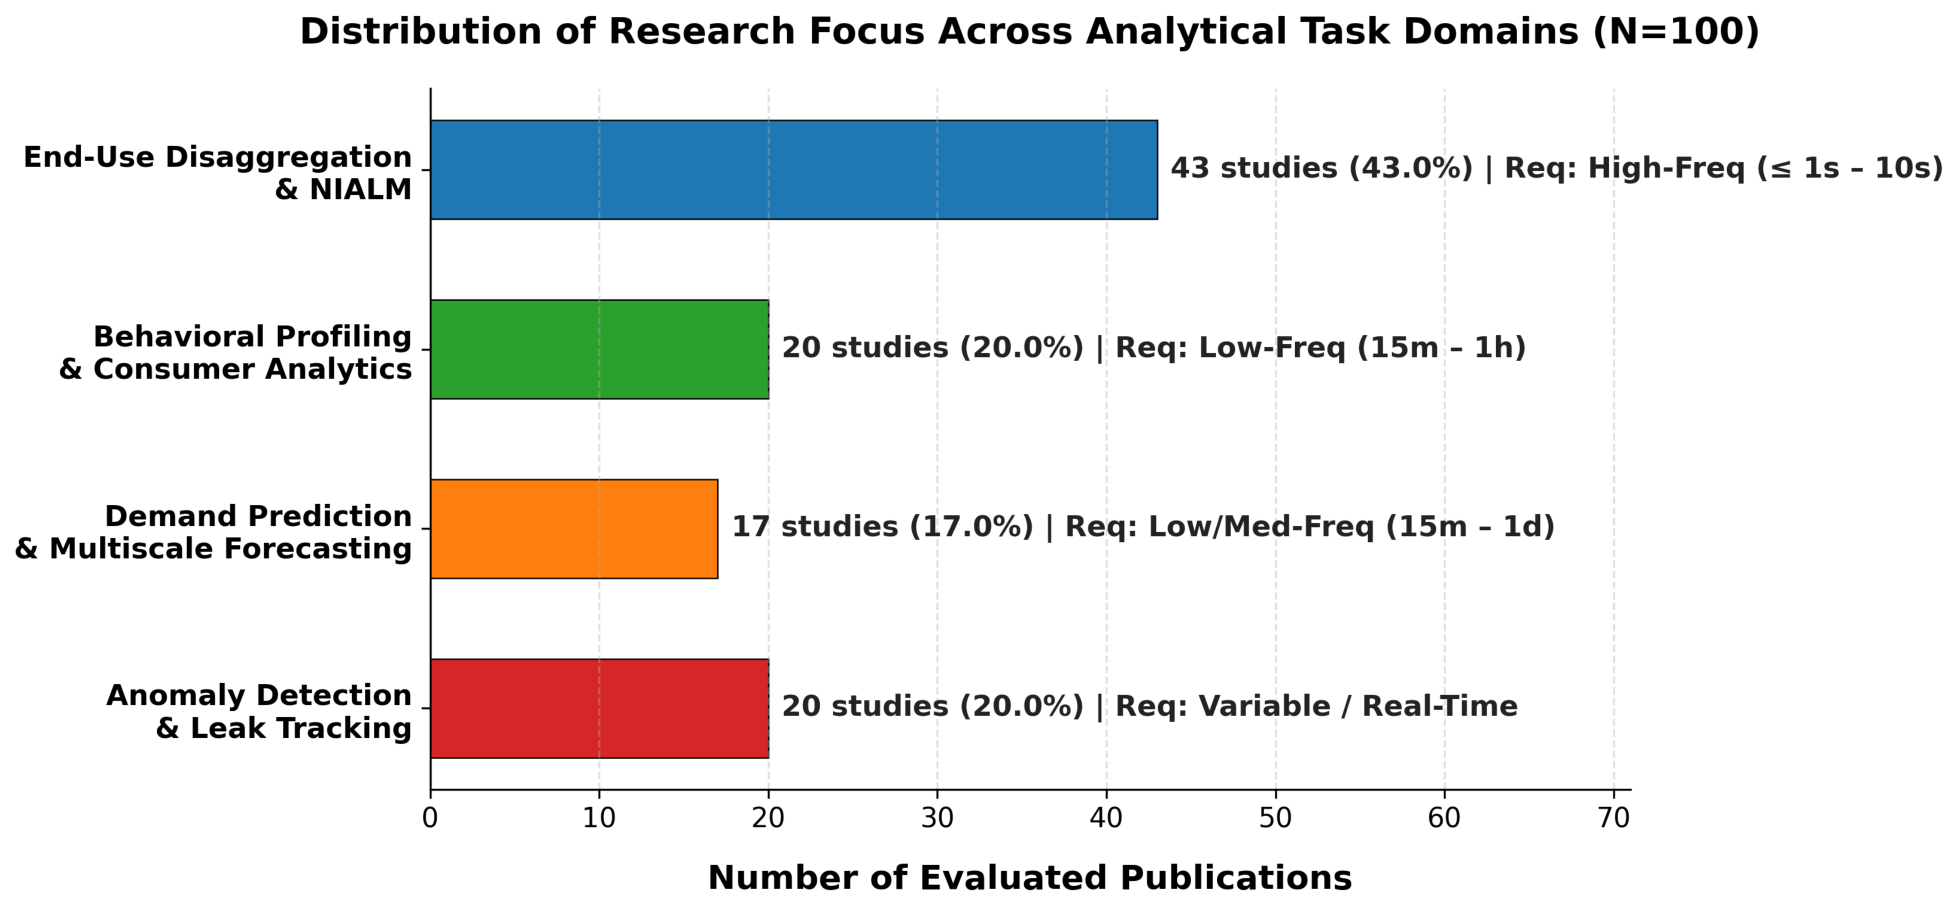
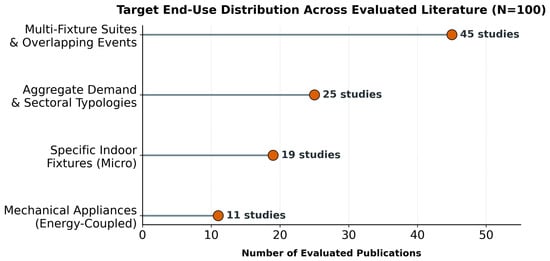
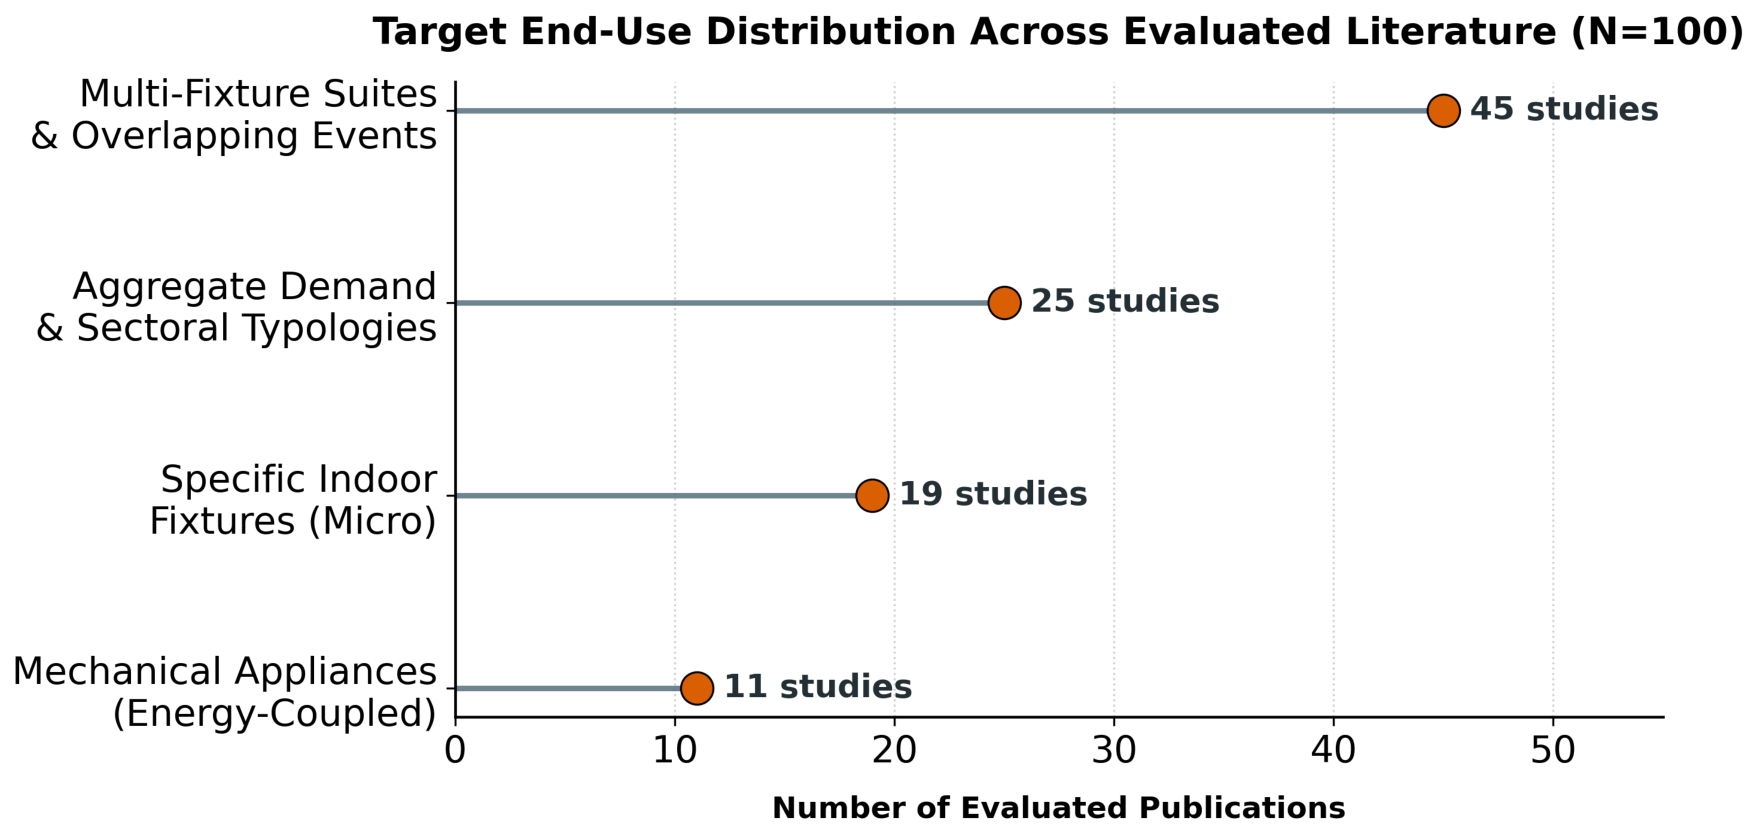

Disclaimer/Publisher’s Note: The statements, opinions and data contained in all publications are solely those of the individual author(s) and contributor(s) and not of MDPI and/or the editor(s). MDPI and/or the editor(s) disclaim responsibility for any injury to people or property resulting from any ideas, methods, instructions or products referred to in the content. |
© 2026 by the authors. Licensee MDPI, Basel, Switzerland. This article is an open access article distributed under the terms and conditions of the Creative Commons Attribution (CC BY) license.