


Abstract
High psychological stress and ineffective study habits induce academic pressure and low learning efficiency, respectively. When these psycho-behavioral dimensions compound poor performance, the student profile exhibits high vulnerability to dropout. In conventional frameworks, data limitations and unobserved behavioral patterns severely degrade detection accuracy. Therefore, scientific interest has migrated toward data-driven learning analytics frameworks oriented to automated risk-profile generation using multi-source educational indicators. In this paper, an interpretable-by-design automated dropout risk classification framework based on explicitly engineered academic and behavioral variables is presented. By using a Principal Component Analysis (PCA)-driven automatic labeling strategy, direct conversion of continuous indicators into discrete risk profiles is achieved. This methodology is implemented through a Deep Neural Network (DNN) that transforms the student dropout prediction task into a psycho-academic risk classification task. The proposed approach avoids information leakage and reliance on complex institutional records, exploiting latent nonlinear relationships in a manner fully compatible with standard administrative data. Compared to advanced ensemble-based architectures, this framework offers high robustness against overfitting and a compact design, achieving an overall accuracy of 99% in student risk classification.
1. Introduction
Academic dropout remains one of the most significant challenges faced by educational institutions worldwide due to its adverse consequences for students, universities, and society. Student attrition not only reduces graduation rates and institutional efficiency but also generates social and economic costs associated with reduced professional opportunities, lower productivity, and diminished educational investment returns. Consequently, the early identification of students at risk of dropout has become an important research topic in Educational Data Mining (EDM), Learning Analytics, and Artificial Intelligence (AI), where predictive models are increasingly employed to support timely intervention strategies and improve student retention [1,2,3].
Recent advances in Artificial Intelligence and Machine Learning have enabled the development of predictive systems capable of identifying students at risk before dropout occurs. Traditional approaches have employed statistical techniques and supervised learning algorithms such as Logistic Regression, Decision Trees, Random Forests, Support Vector Machines, K-Nearest Neighbors, AdaBoost, and XGBoost to model academic risk using demographic, academic, and behavioral information [1,4,5]. Several studies have demonstrated that ensemble methods frequently outperform individual classifiers due to their capability to capture nonlinear relationships among educational variables. In particular, stacking-based hybrid models have reported prediction accuracies exceeding 94%, highlighting the effectiveness of combining multiple learners to improve classification performance [4].
More recently, Deep Learning architectures have gained considerable attention in educational prediction tasks because of their ability to automatically extract complex latent representations from large-scale educational datasets. Neural networks, deep ensembles, and transformer-based models have shown promising results in academic success and dropout prediction. For instance, Zanellati et al. proposed a Feature Tokenizer Transformer (FTT) architecture for university dropout prediction and demonstrated superior predictive performance compared with conventional Random Forest models using data from more than 40,000 students [6]. Furthermore, systematic reviews have revealed a progressive transition from traditional statistical methods toward Deep Learning and hybrid AI frameworks motivated by their improved predictive capability and scalability [7].
In parallel, the growing adoption of predictive models in education has increased the demand for transparency and interpretability. Although many Machine Learning and Deep Learning models achieve high predictive accuracy, their black-box nature often limits practical adoption by educators and decision-makers. Recent studies have shown that explainable models facilitate the interpretation of risk predictions and provide valuable insights regarding academic performance, behavioral indicators, socioeconomic conditions, and psychological characteristics associated with student attrition [2,3,6].
Despite these advances, several limitations remain evident in the current literature. First, many predictive models rely primarily on academic and demographic variables while overlooking psycho-behavioral factors that have been repeatedly associated with student persistence. Second, most studies focus on institutional or administrative records, limiting the integration of stress, study habits, sleep quality, perceived academic pressure, and learning efficiency indicators. Finally, many reported solutions are evaluated using institution-specific datasets, reducing their generalizability across diverse educational environments [2,6,7].
More recently, a new research direction has explored alternative and nontraditional data sources for dropout prediction. These studies incorporate social media activity, digital footprints, textual content, multimedia information, and social network interactions to construct comprehensive digital profiles of students [8]. Such approaches attempt to capture psychological, social, and behavioral characteristics that may not be reflected in institutional records. The results suggest that multimodal information can provide valuable insights into student engagement, emotional states, and academic vulnerability, particularly during the early stages of the educational process.
Educational research has consistently shown that academic performance alone is insufficient to explain dropout behavior. Psychological stress, ineffective study habits, poor sleep quality, low learning efficiency, and excessive academic pressure can substantially affect student performance and increase the likelihood of academic disengagement. Consequently, integrating academic and psycho-behavioral dimensions into a unified predictive framework may provide a more comprehensive representation of student risk profiles and improve the reliability of dropout prediction systems [1,3,9].
Despite these advances, relatively few studies have focused on the integration of psycho-academic indicators such as stress levels, sleep behavior, study dedication, and academic performance into an automatic risk-profile generation framework specifically designed for deep learning classification. Most existing approaches either rely heavily on academic records or employ complex multimodal data sources that may not be readily available to educational institutions. Therefore, there remains a need for scalable, interpretable, and data-driven methodologies capable of identifying educational vulnerability using information that can be collected directly from students. Motivated by these observations, this study proposes a psycho-academic framework for academic dropout detection based on Deep Neural Networks (DNNs) and Explainable Artificial Intelligence techniques. The proposed methodology incorporates academic performance indicators together with psychological and behavioral variables, including stress level, study habits, study efficiency, sleep quality, and perceived academic pressure. An automatic risk-profile labeling strategy is first employed to generate dropout-related categories from psycho-academic characteristics. Subsequently, a Deep Neural Network model is trained to identify high-risk students.
The main contributions of this work can be summarized as follows:
- A preprocessing and feature extraction stage for educational data was developed, achieving the automatic labeling of risk profiles through Principal Component Analysis (PCA).
- The prediction of student vulnerability was formalized as a supervised classification problem by training a Deep Neural Network (DNN) with key psycho-academic indicators.
- The superiority of the model against networks and algorithms proposed in the state of the art was validated, consolidating a highly robust computational support system for the early detection of students at high risk of school dropout.
The remainder of this paper is organized as follows: Section 2 presents the related work on student dropout prediction and educational risk identification. Section 3 describes the proposed psycho-academic risk profiling methodology, feature engineering process, and Deep Neural Network architecture. Section 4 presents the experimental setup and obtained results. Section 5 discusses the implications of the findings and their relevance for educational intervention strategies. Finally, Section 6 concludes the paper and outlines future research directions.
2. Literature Review
Student dropout prediction has become one of the most active research topics within Educational Data Mining (EDM) and Learning Analytics (LA), motivated by the need to identify vulnerable students before academic failure becomes irreversible. Recent advances in machine learning have enabled the development of predictive systems capable of discovering complex relationships among academic, behavioral, demographic, and psychosocial variables, providing educational institutions with valuable tools for early intervention and student retention [4,8].
Traditional educational prediction models have primarily relied on academic indicators such as grades, course completion rates, examination scores, and prior educational achievement. These variables have consistently demonstrated strong predictive capabilities and remain among the most widely used predictors of student performance and dropout risk [10,11]. However, researchers have increasingly recognized that educational vulnerability is a multidimensional phenomenon influenced by behavioral, psychological, and contextual factors that cannot be fully captured through academic records alone [8].
One of the earliest and most interpretable approaches employed in educational prediction is Logistic Regression (LR). Logistic regression models the probability of a student belonging to a particular class through a sigmoid transformation of a linear combination of explanatory variables. The model is commonly expressed as
where p denotes the probability of dropout and represents the predictor variables [4]. Logistic regression has been widely applied in educational datasets due to its interpretability and computational efficiency, particularly when the objective is to identify the most influential factors associated with academic success and retention [12,13].
Another frequently adopted technique is the K-Nearest Neighbors (KNN) classifier, which assigns a class according to the behavior of neighboring observations in the feature space. The similarity between students is commonly measured using the Euclidean distance:
where x and y represent the feature vectors of two distinct student observations, and denote their respective values for feature i, and n represents the total number of features, allowing the classification of new observations according to the majority class among the k nearest neighbors [4]. KNN has demonstrated competitive performance in educational prediction tasks when adequate feature scaling and dimensionality reduction procedures are employed [4,14,15].
Tree-based approaches constitute another important family of predictive models. Decision Trees (DT) generate hierarchical decision structures by recursively partitioning the feature space according to impurity measures. Entropy is one of the most commonly used splitting criteria and is defined as
where denotes the probability associated with class i [4,16,17]. Decision Trees are attractive because they provide transparent decision rules and facilitate the interpretation of educational risk factors [16].
Probabilistic methods have also received considerable attention. In particular, Naive Bayes (NB) classifiers estimate the posterior probability of class membership using Bayes’ theorem:
where X represents the observed features and Y denotes the target class [4,18,19]. Despite their simplifying assumption of conditional independence among predictors, Naïve Bayes models frequently achieve competitive results in educational datasets while maintaining low computational complexity [12].
To overcome the limitations of individual decision trees, researchers have extensively explored Random Forest (RF) models. Random Forest constructs multiple decision trees from bootstrapped samples and combines their predictions through aggregation strategies. By introducing randomness into both sample selection and feature selection, RF reduces variance and improves generalization performance [20,21]. Several studies have reported that Random Forest consistently outperforms traditional classifiers in educational prediction tasks, particularly when heterogeneous academic and behavioral variables are considered [22,23,24].
Another widely adopted ensemble approach is Adaptive Boosting (AdaBoost), which iteratively combines weak learners to create a stronger classifier. The final prediction function can be represented as
where denotes the output of the m-th weak learner and represents its associated weight [25]. AdaBoost has shown strong predictive performance in educational environments by focusing subsequent learning stages on previously misclassified observations [25,26].
Among margin-based classifiers, Support Vector Machines (SVMs) have become one of the most successful methods for educational classification problems. A SVM seeks an optimal hyperplane that maximizes the separation margin between classes. The decision function is given by
where w denotes the weight vector, is the feature mapping function, and b represents the bias term [4,5]. Numerous studies have demonstrated the effectiveness of SVMs in student performance prediction, particularly when nonlinear kernels are employed to model complex educational relationships [5].
Beyond individual algorithms, recent research has increasingly focused on ensemble learning strategies, including Bagging, Boosting, and Stacking architectures. These approaches combine multiple predictive models to exploit complementary strengths while reducing the weaknesses of individual classifiers. Stacking methods employ a collection of base learners and a meta-learner to generate more robust predictions and have achieved state-of-the-art performance in several educational prediction scenarios [2].
The application of Artificial Neural Networks (ANNs) and Multilayer Perceptrons (MLPs) has been addressed for predicting student dropout [27]. However, existing models frequently employ relatively shallow architectures (shallow networks) fed by a limited set of input variables, achieving a modest discriminative capacity with area under the curve (AUC) values ranging between 0.795 and 0.839 [28,29]. Furthermore, when dealing with datasets featuring a marked class imbalance, conventional neural networks are highly susceptible to the accuracy paradox, where high overall performance conceals a poor detection rate for the minority class (at-risk students) [30]. To mitigate this weakness, several studies have resorted to synthetic oversampling techniques (such as SMOTE or ADASYN) or ensemble classifiers (Balanced Bagging), which improve metrics such as G-mean and UAR at the cost of increasing variance or incurring overfitting risks due to instance duplication [30]. Unlike these solutions that feed raw or synthetic feature vectors directly into the classifier [29,30], our proposal addresses the topological complexity of the input space prior to deep training by using PCA as a manifold orthogonal projector that filters structural noise and extracts the principal variance subspace from an expanded matrix of 23 multidimensional attributes. Thanks to this preprocessing, our model shifts the conventional event-estimation paradigm into a preventive detector that operates as a high- or low-psycho-academic-risk classifier.
3. Methods
3.1. Dataset Description
Data were collected through structured interviews administered to students from the Faculty of Economic and Business Sciences at a public university in Mexico. The faculty had a total population of 8500 students, of whom 4965 responded, resulting in a response rate of 48%. The sample consisted of students with a mean age of 18 years; in total, 49% of the participants were male and 51% were female. The target variable, student dropout, was used to identify dropout students (1) and non-dropout students (0), and was coded through consultation of administrative records with the support of the student services department.
Data collection was conducted using a questionnaire distributed via email. The instrument included academic, sociodemographic, behavioral, and contextual variables, such as admission scores, previous educational level, age at enrollment, grades obtained in three partial evaluations, and the number of courses enrolled during the most recent semester. In addition, behavioral and student well-being factors were incorporated, including weekly independent study hours, perceived stress level, and average daily sleep duration.
Data Preprocessing
Prior to the automatic risk-labeling stage, an exploratory correlation analysis was conducted to identify the variables most strongly associated with student dropout risk. The objective of this analysis was to determine which academic, behavioral, and demographic attributes contributed most significantly to the characterization of educational vulnerability and should therefore be incorporated into the risk-profile construction process.
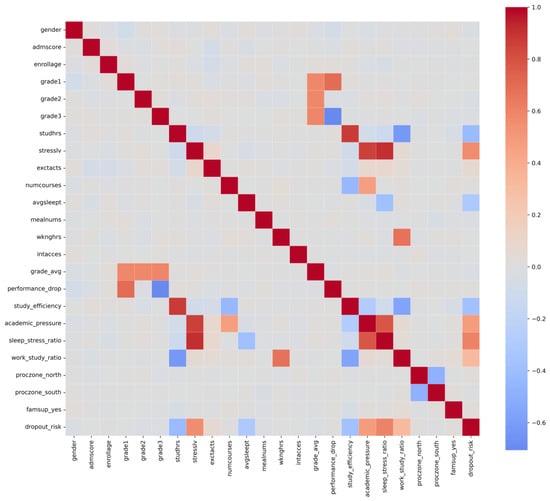
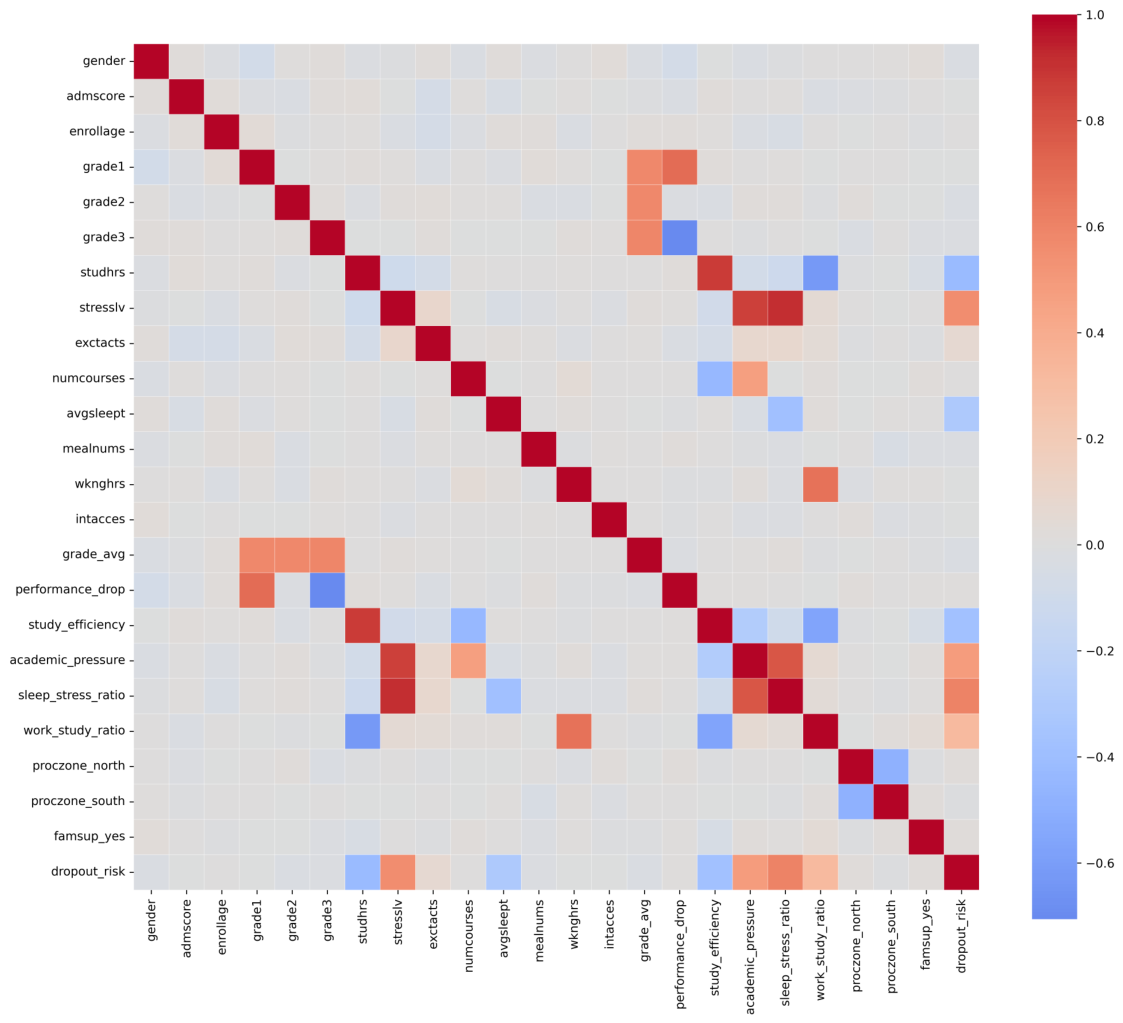
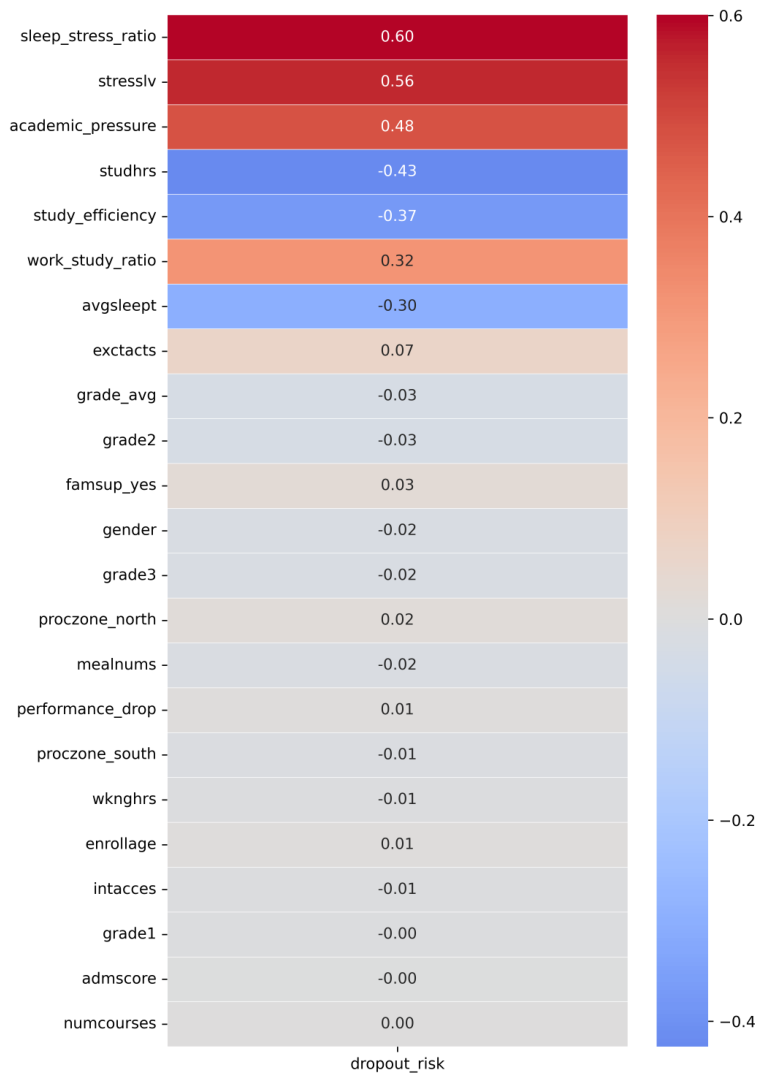
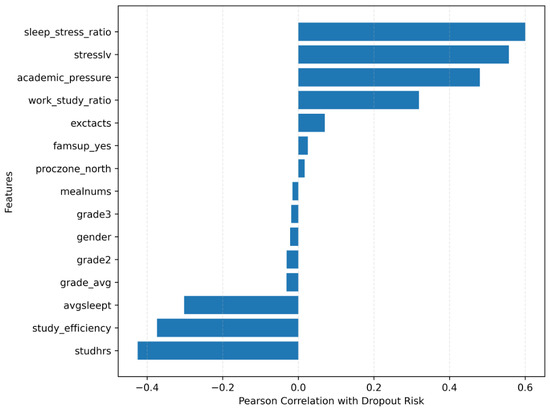
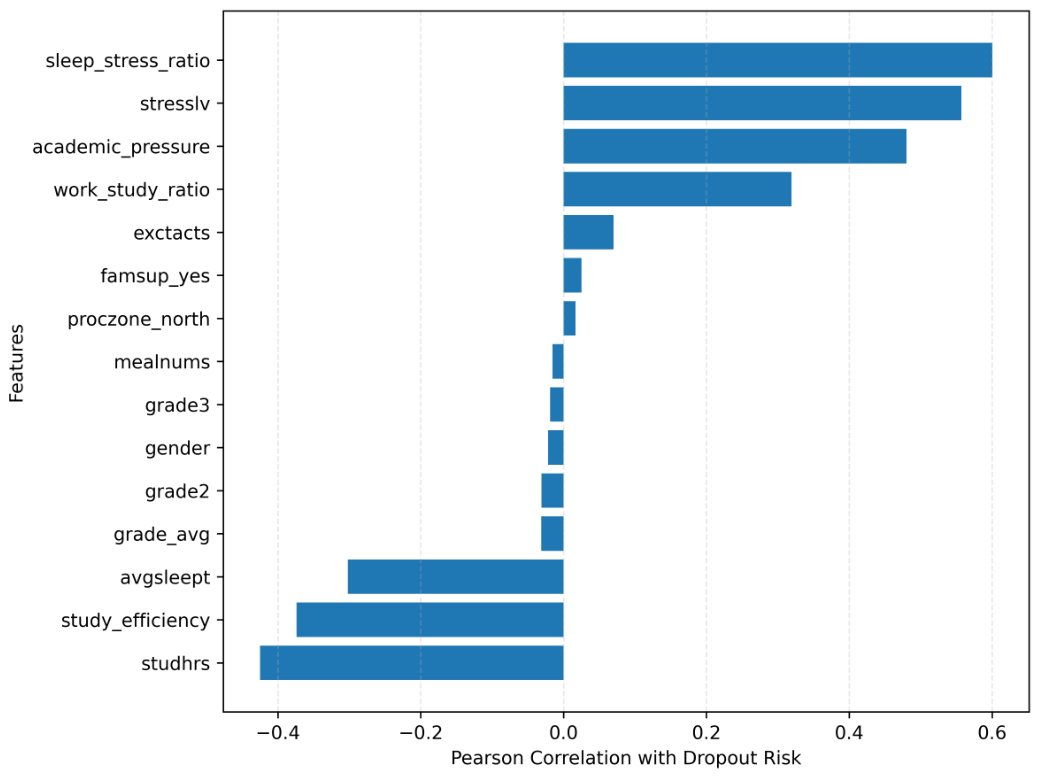
Figure 1 presents the complete correlation matrix among the original and engineered features. The analysis revealed that behavioral and psycho-academic variables exhibited considerably stronger relationships with dropout risk than demographic attributes and individual academic grades. In particular, the engineered feature sleep–stress ratio demonstrated the highest positive correlation with dropout risk (), followed by stress level () and academic pressure (). Conversely, study hours (), study efficiency (), and average sleep duration () exhibited negative correlations, indicating that greater academic engagement and healthier sleep habits are associated with lower dropout risk.
Figure 1.
Complete correlation matrix of the original and engineered features used for psycho-academic risk-profile construction.
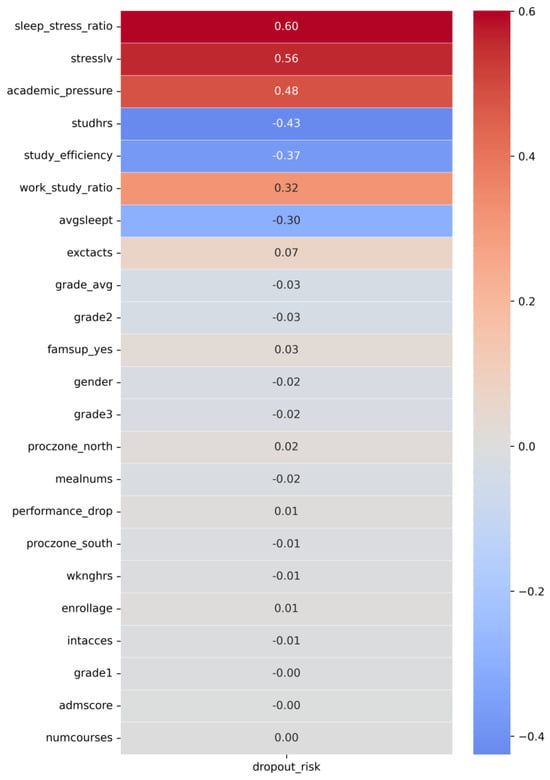
The correlation coefficients between each feature and the target risk variable are summarized in Figure 2, while Figure 3 presents the ranking of the most influential attributes. The obtained results indicate that variables describing student well-being, stress conditions, and study behavior provide a more discriminative representation of dropout vulnerability than demographic characteristics such as gender, geographical region, family support, enrollment age, or internet accessibility. Furthermore, individual academic grades and the overall grade average exhibited relatively weak linear relationships with the generated risk labels, suggesting that behavioral indicators capture earlier manifestations of educational risk than academic achievement alone.
Figure 2.
Correlation coefficients between the generated dropout-risk labels and the educational, behavioral, and demographic features.
Figure 3.
Ranking of the most influential features according to their Pearson correlation with dropout risk.
Based on these findings, a feature engineering stage was implemented to enrich the representation of student profiles. First, the average academic grade was computed from the three available academic evaluations. Subsequently, a set of derived features was generated to capture latent relationships among academic workload, stress conditions, study behavior, and personal well-being. These features included performance drop, study efficiency, academic pressure, the sleep–stress ratio, and the work–study ratio. The correlation analysis confirmed that several of these engineered variables provided stronger associations with dropout risk than the original attributes, highlighting the effectiveness of the feature engineering process. The mathematical formulations employed to compute these engineered indicators are detailed below:
After constructing the final feature matrix, an automatic labeling procedure based on a quantitative risk-score strategy, described in Algorithm 1, was applied. The proposed approach defines a Psycho-Academic Risk Profile by integrating academic performance indicators with behavioral and well-being factors. In this formulation, elevated stress levels, reduced sleep duration, limited study time, and poor academic performance contribute to higher risk scores, whereas healthier behavioral patterns and stronger academic engagement contribute to lower risk levels.
| Algorithm 1 Automatic Risk Labeling for Student Dropout Classification | |
Input: Academic grades , stress levels , study hours , and sleep duration | |
Output: Binary labels and risk scores | |
Feature Extraction and Preprocessing | |
▹ Invert variables where lower values indicate higher risk: | |
Risk Score Construction via PCA | |
▹ First principal component extracts the underlying risk profile | |
Threshold-Based Labeling | |
for to do | |
if then | |
▹ Assign student i to High-Risk group | |
else | |
▹ Assign student i to Low-Risk group | |
end if | |
end for | |
return and | |
The median value of the computed risk score was employed as the decision threshold to assign each student to either the High-Risk (1) or Low-Risk (0) category. This automatic labeling strategy enabled the transformation of continuous educational and behavioral indicators into a supervised learning target suitable for Deep Neural Network training. The adopted psycho-academic profile used for the binary labeling process is summarized in Table 1.
Table 1.
Psycho-Academic Risk Profile Used for Automatic Labeling.
3.2. Deep Learning Model
The proposed model consists of a DNN for the binary classification of student risk profiles into the High-Risk and Low-Risk classes. The training data included the labels obtained from the proposed automatic risk-labeling algorithm (Algorithm 1) together with the engineered academic and behavioral features extracted from each student record.
The training procedure is summarized in Algorithm 2. First, a stratified split was performed to divide the dataset into training and test subsets while preserving the class distribution. Next, a StandardScaler was fitted on the training set and subsequently applied to the test set to prevent information leakage and ensure feature normalization.
On the standardized inputs, the DNN was trained by minimizing the Binary Cross-Entropy (BCE) loss using the Adam optimizer. During training, an early stopping strategy was implemented to automatically terminate the optimization process when no improvement was observed in the validation performance for a predefined number of epochs.
The objective function employed is the Binary Cross-Entropy loss:
where is the probability estimated by the network through the sigmoid activation function, represents the binary labels generated by the automatic risk-labeling procedure (Algorithm 1), and m denotes the batch size.
| Algorithm 2 DNN Training for Student Risk Classification |
|
3.3. DNN Architecture
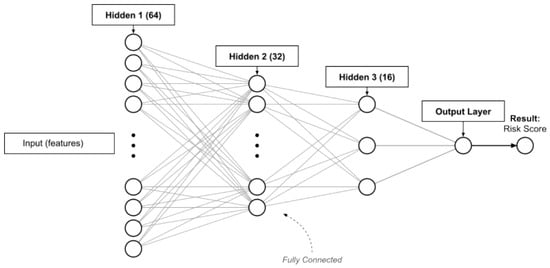
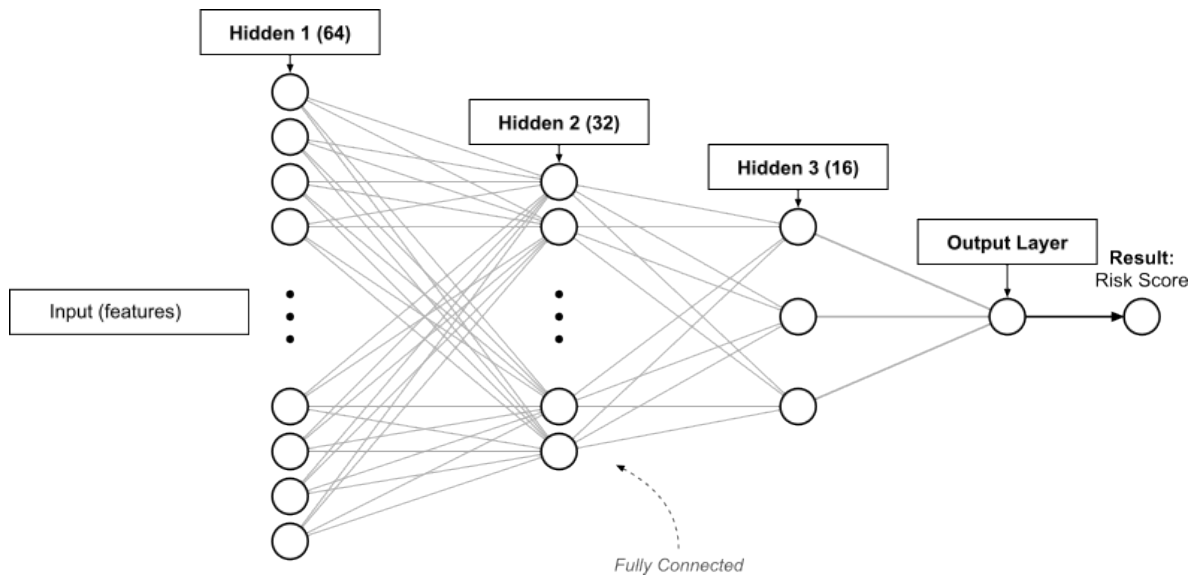
The proposed DNN architecture is illustrated in Figure 4. The model receives an input feature vector comprising 23 academic and behavioral attributes generated during the feature engineering stage. This set includes both the original variables and the derived descriptors obtained from the preprocessing pipeline, e.g., average academic grade, performance drop, study efficiency, academic pressure, the sleep–stress ratio, and the work–study ratio.
Figure 4.
The proposed DNN Architecture for Student Risk Assessment.
The network consists of three fully connected layers with 64, 32, and 16 neurons, respectively, using rectified linear unit (ReLU) activation functions. In order to provide proper generalization, the first two hidden blocks incorporate batch normalization layers followed by dropout regularization with rates of 0.30 and 0.20, whereas the third hidden layer is bounded by a dropout rate of 0.10. The final output layer is constituted by a single neuron with sigmoid activation, yielding the probability of belonging to the High-Risk class.
The system parameters and the detailed configuration of each layer, along with the corresponding number of trainable parameters, are summarized in Table 2 and Table 3. The proposed architecture is tailored to capture the nonlinear relationships among academic performance, stress levels, study habits, sleep patterns, and subsequent behavioral indicators inherently associated with student dropout risk. Furthermore, the combination of batch normalization, dropout, early stopping, and balanced class weights strikes an optimal trade-off between representational capacity and generalization, circumventing overfitting while sustaining high predictive performance.
Table 2.
System Parameters and Training Setup.
Table 3.
Layers and Computational Complexity of the Proposed DNN.
Regarding the computational complexity, the complete model requires 4545 parameters, of which 4353 are trainable and 192 correspond to non-trainable parameters inherently associated with the batch normalization layers. This compact architecture enables the network to learn the complex dropout-risk patterns without sacrificing computational efficiency and model stability, making it highly suitable for practical deployment.
3.4. Performance Metrics
To evaluate the performance of the proposed DNN model, the metrics Accuracy, Precision, Recall and F1-score were employed, defined as
where , , , and denote true positives, true negatives, false positives, and false negatives, respectively.
These metrics were selected because they provide a more informative evaluation than Accuracy alone. Precision measures the proportion of students predicted as belonging to the High-Risk group that are actually at risk, while Recall quantifies the ability of the model to identify students who truly belong to the High-Risk group. The F1-score, as the harmonic mean of Precision and Recall, provides a balanced assessment when both metrics are equally important. Together, these metrics provide a robust assessment of the proposed student dropout risk classification framework, where both minimizing false alarms and correctly identifying at-risk students are critical.
4. Results
For the preprocessing, feature engineering, visualization, and DNN training stages, the Python 3.11 libraries numpy, pandas, scikit-learn, tensorflow, keras, matplotlib, and seaborn were employed. The complete experimental pipeline included automatic risk-profile labeling, feature extraction, data standardization, DNN training, and performance evaluation using Precision, Recall, F1-score and Accuracy. The implemented methodology is described in the proposed framework shown in the developed Python pipeline.
4.1. Experiment One
As a first experiment, the proposed automatic risk-profile labeling strategy was evaluated using academic and behavioral indicators extracted from the student dataset. Following the implemented pipeline, the academic grades were averaged, and the features were standardized and inverted where lower values indicate higher vulnerability (i.e., low study hours, low sleep duration, and low grades). Principal Component Analysis (PCA) was then applied to project these features onto a single dimension, extracting the first principal component as a continuous risk score. The median value of this continuous component was utilized as the decision threshold to cleanly partition the student population into binary risk categories.
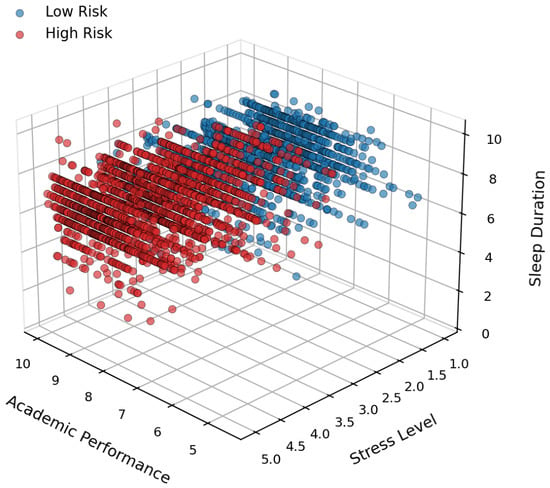
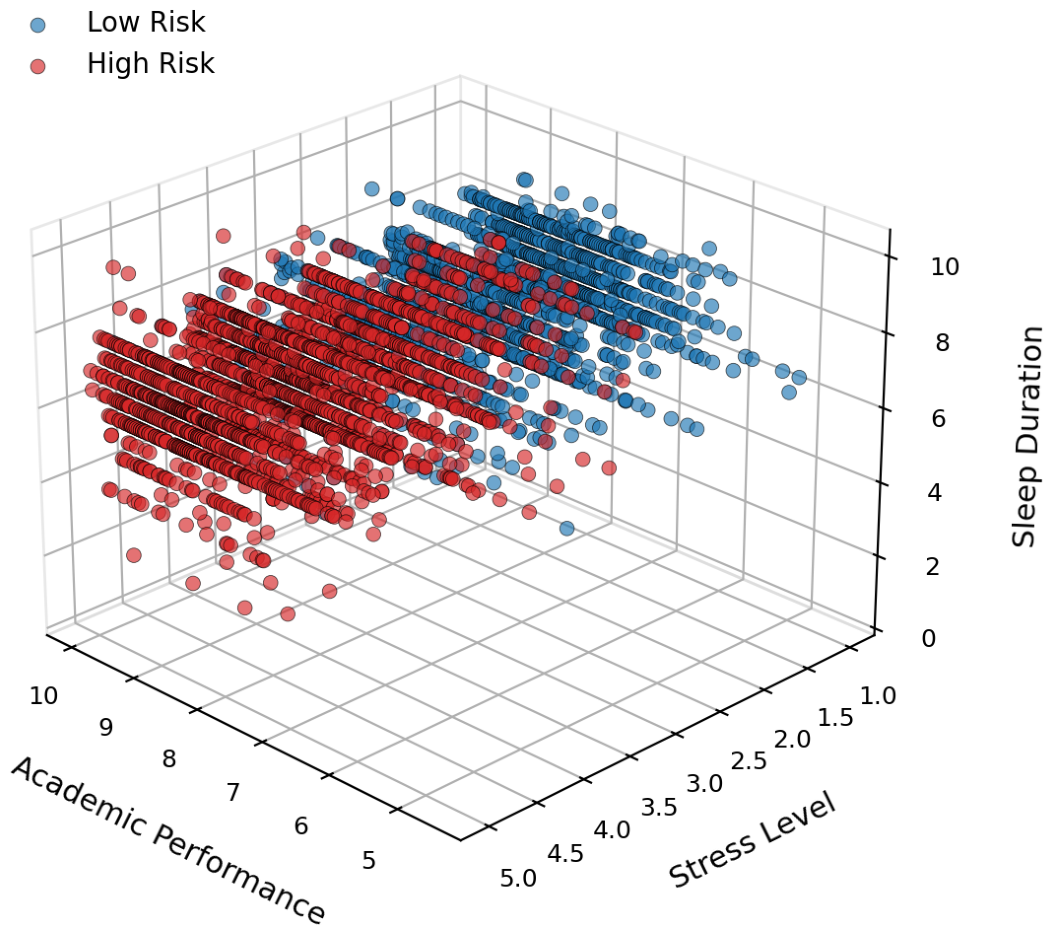
Figure 5 illustrates the three-dimensional distribution of the labeled student profiles considering the variables Academic Performance, Stress Level, and Sleep Duration as defined in the visualization script. Two well-defined groups can be observed corresponding to the Low-Risk and High-Risk classes. The Low-Risk class (represented by blue markers) is primarily concentrated in regions characterized by higher academic performance, lower stress levels, and adequate sleep duration. In contrast, the High-Risk class (represented by red markers) is predominantly distributed in regions associated with lower academic achievement, elevated stress, and reduced sleep time.
Figure 5.
Three-dimensional scatter plot of the automatically labeled student risk profiles based on academic performance, stress level, and sleep duration.
The visualization illustrates a distinct spatial distribution between both classes, demonstrating the effectiveness of the PCA-driven automatic labeling strategy. This clear separation is further validated by the continuous risk score density distribution, which exhibits a distinct threshold-based split at the median, separating low-vulnerability students from the high-risk group with minimal overlap. Furthermore, students with robust academic averages consistently align within the healthy behavioral clusters, reinforcing the empirical coherence of the proposed risk-profile generation methodology.
The observed geometric separation between both groups indicates that the selected academic and behavioral variables provide highly discriminative information for identifying student risk profiles. This result strongly supports the proposed labeling framework and confirms that the generated feature space is highly appropriate for subsequent supervised learning tasks using DNNs.
4.2. Experiment Two
In the second experiment, the automatically labeled student dataset obtained from the proposed risk-profile framework was employed to train and evaluate the DNN model. The DNN architecture consisted of multiple fully connected layers combined with Batch Normalization and Dropout regularization layers to improve generalization capability and reduce overfitting effects. The network was trained using the Adam optimizer and binary cross-entropy loss function.
The input feature vector included both original academic variables and engineered features derived from the preprocessing stage, such as average academic grade, study efficiency, academic pressure, the sleep–stress ratio, and the work–study ratio. The dataset was divided using an 80/20 stratified split strategy to preserve class balance during training and testing stages.
An optimal probabilistic decision threshold of 0.6343 was obtained from the Precision–Recall analysis by maximizing the F1-score criterion. This threshold enabled the model to achieve an exceptional balance between Precision and Recall while maintaining outstanding classification performance.
Table 4 presents the performance metrics of the proposed DNN model. The obtained results show an overall classification accuracy of 99%, with F1-score values of 0.99 for both classes. Specifically, the model achieved a precision of 0.98 and a perfect recall of 1.00 for Low-Risk students (support of 497), while yielding a perfect precision of 1.00 and a recall of 0.98 for the High-Risk class (support of 496). This indicates that the network was able to correctly identify the student risk profiles with a negligible rate of misclassification.
Table 4.
Performance Metrics of the Proposed DNN Model for Automatic Student Risk Classification.
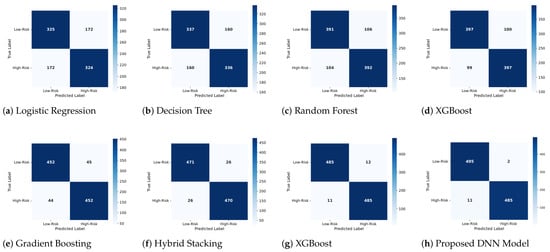
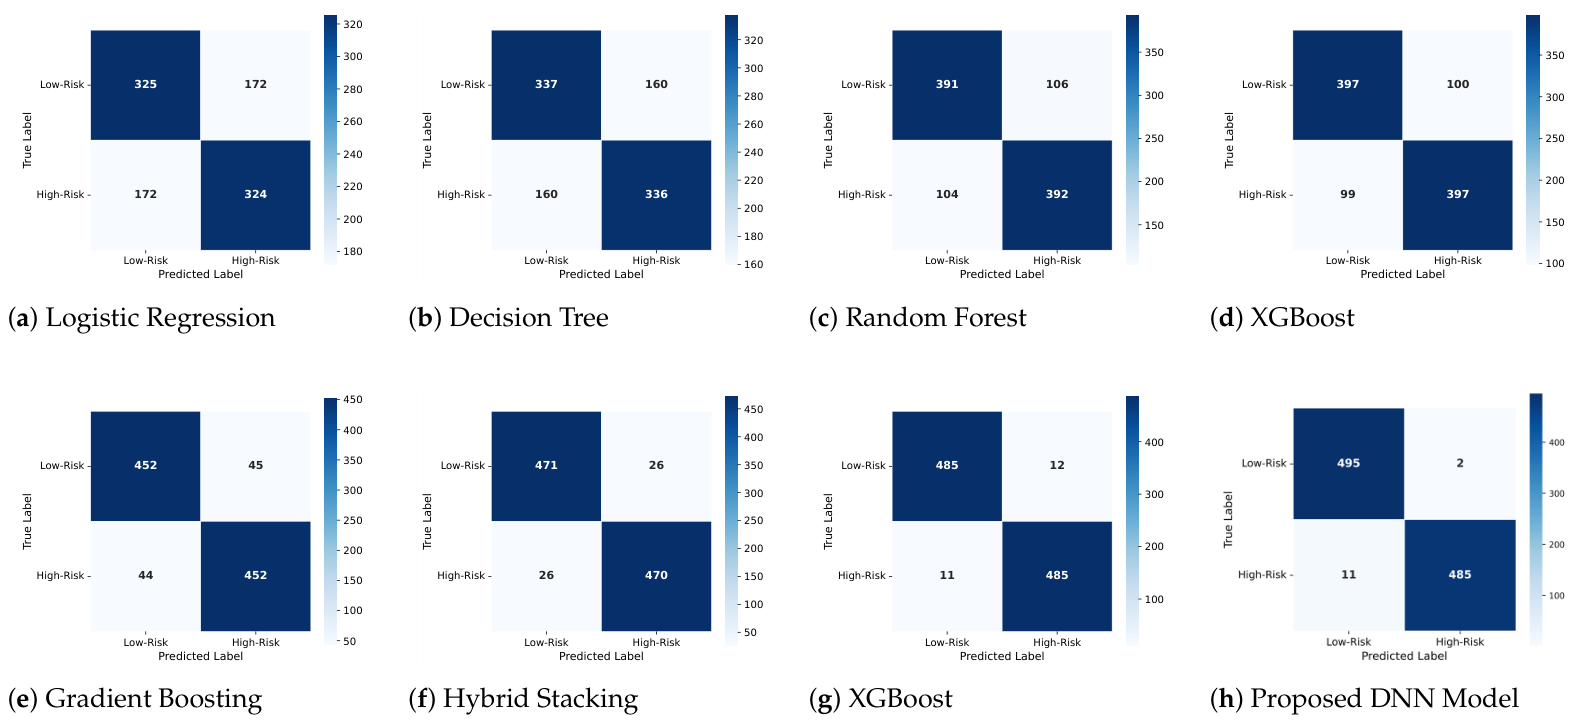
Figure 6 shows the confusion matrices of the proposed DNN model versus the models proposed in the literature. In the confusion matrix of the proposed model (Figure 6h), a strong concentration along the principal diagonal can be observed, where 495 Low-Risk and 485 High-Risk student profiles were correctly classified. The remarkably low number of misclassified samples consisting of only 2 false positives and 11 false negatives confirms the high robustness, predictive accuracy, and empirical effectiveness of the proposed classification framework.
Figure 6.
Confusion matrices of the baseline models reported in the literature versus the proposed DNN architecture.
Table 5 compares the performance of the proposed DNN model with several machine learning approaches reported in the literature for student dropout prediction, including the newly incorporated benchmarks from recent high-performing frameworks. All comparative evaluations were conducted under standardized conditions using an 80/20 stratified train–test split. The obtained results demonstrate that the proposed model significantly outperforms all comparative methods, achieving an accuracy of 99.0%, which is substantially higher than the performance reported for traditional machine learning, standalone boosting, and advanced ensemble-based architectures.
Table 5.
Performance Comparison Between the Proposed DNN Model and Related Student Dropout Prediction Approaches Reported in the Literature.
The proposed DNN model showed a clear advantage over conventional methods such as Decision Tree (67.8%) and Logistic Regression (65.4%), as well as baseline ensemble configurations like Random Forest (78.8%) and XGBoost (80.0%). Furthermore, the proposed architecture surpassed the hybrid stacking ensemble framework developed by Pek et al., which achieved a mean accuracy of 94.8% when utilizing a comprehensive combination of demographic and academic features. It also outperformed the state-of-the-art predictive models tailored for secondary education systems by Barboza et al., where highly optimized Gradient Boosting and XGBoost configurations reported accuracies of 97.27% and 97.65%, respectively.
This cross-study validation underscores the superior predictive capacity of our framework, showcasing the high effectiveness of the proposed feature engineering and automatic risk-labeling strategy. Among the comparative models, boosting and stacking ensemble configurations consistently achieved better performance than traditional individual classifiers, confirming their robustness in capturing nonlinear patterns associated with academic attrition. However, the proposed DNN model achieved the highest overall classification capability, proving that the curated psycho-academic and behavioral feature space provides a highly discriminative representation for risk-profile learning.
5. Discussion
Experimental results demonstrate the high effectiveness of the proposed DNN architecture for student dropout risk detection. By achieving an overall classification accuracy of 99.0% with an optimal probabilistic threshold of 0.6343 determined via F1-score maximization, the network exhibits an outstanding capacity to discern between low- and high-risk profiles. This robustness is corroborated by a detailed analysis of the confusion matrix on the test set (), where 495 low-risk and 485 high-risk student profiles are correctly classified. Restricting macrostructural classification errors to merely 2 false positives and 11 false negatives yields a perfect recall of 1.00 for the low-risk class and a perfect precision of 1.00 for the high-risk group. This minimized omission rate is critical in educational environments, guaranteeing that virtually no vulnerable student is overlooked while simultaneously preventing false alarms that could exhaust institutional intervention resources.
This remarkable classification capability is directly attributed to the success of the PCA-driven automatic labeling strategy and the feature engineering stage. Traditional approaches in the literature have primarily relied on static administrative or purely academic records, overlooking the multidimensional nature of educational vulnerability. By consolidating complex derived metrics from the interplay between personal well-being and academic workload, such as study efficiency, academic pressure, and the sleep–stress ratio, the proposed framework constructs a highly discriminative feature space. Projecting the first principal component from the PCA acts as a multidimensional noise reducer, extracting the underlying risk profile to yield an orthogonalized feature space. This setup optimizes the convergence of the sequential DNN, enabling the network to learn complex nonlinear relationships with near-perfect geometric separation.
It is essential to clarify that the relationship between the PCA-generated risk categories and actual administrative dropout operates methodologically as a statistical proxy. During training, the neural network does not causally model the historical event of attrition, but rather learns to classify a synthetic construct that clusters the critical behavioral precursors of the student (stress levels, sleep patterns, study dedication, and academic performance). Consequently, the exceptional classification performance obtained should be interpreted not as a prediction of the post-facto administrative act, but as the early and precise identification of a high-vulnerability profile that precedes dropout. This methodological distinction underscores the core purpose of the proposed framework: to diagnose latent risk in order to provide guidance departments with a critical temporal window to intervene before academic disengagement becomes irreversible.
A performance comparison between the developed architecture and alternative baseline methods reported in the literature demonstrates a statistically significant superiority. The proposed model outperforms conventional individual classifiers such as Decision Trees (67.8%) and Logistic Regression (65.4%), as well as robust ensemble-based schemes, including the hybrid stacking model (94.8%) and the optimized Gradient Boosting (97.27%) and XGBoost (97.65%) frameworks. While tree-based structures face limitations when processing high-density multidimensional educational matrices, the structural design of our DNN—comprising structured dense layers (64–32–16 neurons), batch normalization, dropout regularization, and balanced class weights—effectively circumvents overfitting without sacrificing model stability, establishing the framework as a highly scalable and reliable system.
From a practical deployment perspective, these results establish the proposed framework as an interpretable educational decision-support approach tailored to guide proactive and efficient intervention strategies for student retention. Minimizing false alarms to only 2 cases successfully prevents alert fatigue among educators and optimizes the allocation of limited institutional resources, ensuring support is directed strictly where needed. Concurrently, the reliable identification of 495 low-risk and 485 high-risk profiles provides guidance departments with the necessary temporal window to intervene before disengagement becomes irreversible. Furthermore, by correlating the optimal decision threshold of 0.6343 with the enriched engineered variables, the framework transcends classical black-box approximations. It allows administrators to diagnose the specific behavioral or psycho-academic causes driving each student’s vulnerability, translating probabilistic indicators into high-impact, personalized retention actions.
6. Conclusions
As a result of the generalization of the risk profiling concepts developed in this paper, the structure of an automated system based on DNNs for student dropout detection was introduced. The features of the proposed scheme have not been reported elsewhere in the literature, which establishes this approach as the first feasible solution that achieves multidimensional noise mitigation and the exploitation of psycho-behavioral variables through feature engineering and PCA-driven labeling, maintaining minimal implementation effort when compared to a conventional classifier. Educational vulnerability is converted into discrete risk profiles, providing a model free of overfitting degradation that achieves an accuracy of 99.0% on the test set.
This solution maintains a highly efficient architecture, compatibility with institutional records, and, by employing an interpretable decision-support approach, avoids the need for complex black-box models or intricate metaheuristic optimizations. Potential areas for future work include the study of these techniques in longitudinal analyses with new student cohorts, the expansion of the model toward multi-institutional environments, and the integration with large-scale educational informatics platforms. While validated on a single institutional dataset, testing with external data and deployment in real-time school environments remain essential future work.
Author Contributions
Conceptualization, J.A.D.-P.-F., J.E.N.-R., J.Y.S.-G., M.M.-A. and V.B.K.; methodology, J.A.D.-P.-F., J.E.N.-R., J.Y.S.-G. and M.M.-A.; software, J.A.D.-P.-F., J.E.N.-R., J.Y.S.-G. and M.M.-A.; validation, V.B.K., R.F.I.-H. and H.E.G.-V.; formal analysis, J.A.D.-P.-F., J.E.N.-R., J.Y.S.-G. and M.M.-A.; investigation, J.A.D.-P.-F., J.E.N.-R., J.Y.S.-G. and M.M.-A.; resources, V.B.K., R.F.I.-H. and H.E.G.-V.; data curation, V.B.K., R.F.I.-H. and H.E.G.-V.; writing—original draft preparation, J.A.D.-P.-F., J.E.N.-R., J.Y.S.-G. and M.M.-A.; writing—review and editing, V.B.K., R.F.I.-H. and H.E.G.-V.; visualization, V.B.K., R.F.I.-H. and H.E.G.-V.; supervision, V.B.K., R.F.I.-H. and H.E.G.-V.; project administration, V.B.K., R.F.I.-H. and H.E.G.-V.; funding acquisition, J.A.D.-P.-F., J.E.N.-R. and J.Y.S.-G. All authors have read and agreed to the published version of the manuscript.
Funding
This study was funded by Universidad Panamericana, Campus Guadalajara, Mexico. Grant: UP-CI-2025-GDL-04-EMP.
Institutional Review Board Statement
Integrity Code of the Universidad Panamericana, validated by the Social Affairs Committee and approved by the Governing Council through resolution CR 98-22, on 15 November 2022.
Data Availability Statement
The original contributions presented in this study are included in the article. Further inquiries can be directed to the corresponding author.
Conflicts of Interest
The authors declare no conflicts of interest.
References
- Singh, H.P.; Alhulail, H.N. Predicting Student-Teachers Dropout Risk and Early Identification: A Four-Step Logistic Regression Approach. IEEE Access 2022, 10, 6470–6482. [Google Scholar] [CrossRef] [Scilit]
- Goran, R.; Jovanovic, L.; Bacanin, N.; Stanković, M.S.; Simic, V.; Antonijevic, M.; Zivkovic, M. Identifying and Understanding Student Dropouts Using Metaheuristic Optimized Classifiers and Explainable Artificial Intelligence Techniques. IEEE Access 2024, 12, 122377–122400. [Google Scholar] [CrossRef] [Scilit]
- Barboza, A.; Huamani, J.; Santisteban, J.; Maculan, N.; Mauricio, D. Prediction and Explainability of School Dropout in Peru Using Machine Learning and Explainable Artificial Intelligence. IEEE Access 2026, 14, 43752–43771. [Google Scholar] [CrossRef] [Scilit]
- Pek, R.Z.; Özyer, S.T.; Elhage, T.; Özyer, T.; Alhajj, R. The Role of Machine Learning in Identifying Students At-Risk and Minimizing Failure. IEEE Access 2023, 11, 1224–1243. [Google Scholar] [CrossRef] [Scilit]
- Skittou, M.; Merrouchi, M.; Gadi, T. Development of an Early Warning System to Support Educational Planning Process by Identifying At-Risk Students. IEEE Access 2024, 12, 2260–2271. [Google Scholar] [CrossRef] [Scilit]
- Zanellati, A.; Zingaro, S.P.; Gabbrielli, M. Balancing Performance and Explainability in Academic Dropout Prediction. IEEE Trans. Learn. Technol. 2024, 17, 2086–2099. [Google Scholar] [CrossRef] [Scilit]
- Ziz, M.; Faris, S.; Mansouri, K. Toward a Systematic Review of Artificial Intelligence-Based Models for Predicting Academic Success in Higher Education. IEEE Access 2026, 14, 53267–53291. [Google Scholar] [CrossRef] [Scilit]
- Gorshkov, S.S.; Ignatov, D.I.; Chernysheva, A.Y. Predicting Student Dropout Through Text and Media Content Analysis of VKontakte Profiles. IEEE Access 2025, 13, 46732–46746. [Google Scholar] [CrossRef] [Scilit]
- Antonio Orozco Torres, J.; Santiago, A.M.; Manuel Villegas Izaguirre, J.; Hernández Garduza, S.; Amador García, M.; Falconi Alejandro, G. Multilayer Fuzzy Inference System for Predicting the Risk of Dropping Out of School at the High School Level. IEEE Access 2024, 12, 137523–137532. [Google Scholar] [CrossRef] [Scilit]
- Burgos, C.; Campanario, M.L.; Peña, D.d.l.; Lara, J.A.; Lizcano, D.; Martínez, M.A. Data mining for modeling students’ performance: A tutoring action plan to prevent academic dropout. Comput. Electr. Eng. 2018, 66, 541–556. [Google Scholar] [CrossRef] [Scilit]
- Cortez, P.; Silva, A. Using data mining to predict secondary school student performance. In Proceedings of the 5th Annual Future Business Technology Conference, Porto, Portugal, 9–11 April 2008. [Google Scholar]
- Agrawal, H.; Mavani, H. Student Performance Prediction using Machine Learning. Int. J. Eng. Res. Technol. (IJERT) 2015, 4, IJERTV4IS030127. [Google Scholar] [CrossRef] [Scilit]
- Nagy, M.; Molontay, R. Predicting Dropout in Higher Education Based on Secondary School Performance. In Proceedings of the 2018 IEEE 22nd International Conference on Intelligent Engineering Systems (INES); IEEE: New York, NY, USA, 2018; pp. 000389–000394. [Google Scholar] [CrossRef] [Scilit]
- Winarto, G.B.; Supriyadi, R.; Santoso Gunawan, A.A.; Syahputra, M.E. Machine Learning-Driven Predictions to Enhance Academic Performance in High School Students: Systematic Literature Review. In Proceedings of the 2024 International Conference on Informatics, Multimedia, Cyber and Information System (ICIMCIS); IEEE: New York, NY, USA, 2024; pp. 514–518. [Google Scholar] [CrossRef] [Scilit]
- Marius Profiroiu, C.; Cibu, B.; Delcea, C.; Cotfas, L.A. Charting the Course of School Dropout Research: A Bibliometric Exploration. IEEE Access 2024, 12, 71453–71478. [Google Scholar] [CrossRef] [Scilit]
- Quinlan, J.R. Induction of decision trees. Mach. Learn. 1986, 1, 81–106. [Google Scholar] [CrossRef] [Scilit]
- Vennelakanti, A.V.; Nayakawadi, R.; Kodam, V.; Suryanarayana, G.; Sallakunta, R.; Devulapalli, I. Predictive Modeling of Student Academic Performance in External Examinations. In Proceedings of the 2024 IEEE 6th International Conference on Cybernetics, Cognition and Machine Learning Applications (ICCCMLA); IEEE: New York, NY, USA, 2024; pp. 135–140. [Google Scholar] [CrossRef] [Scilit]
- Buschetto Macarini, L.A.; Cechinel, C.; Batista Machado, M.F.; Faria Culmant Ramos, V.; Munoz, R. Predicting Students Success in Blended Learning—Evaluating Different Interactions Inside Learning Management Systems. Appl. Sci. 2019, 9, 5523. [Google Scholar] [CrossRef] [Scilit]
- Al-Shabandar, R.; Hussain, A.J.; Liatsis, P.; Keight, R. Detecting At-Risk Students With Early Interventions Using Machine Learning Techniques. IEEE Access 2019, 7, 149464–149478. [Google Scholar] [CrossRef] [Scilit]
- Breiman, L. Bagging predictors. Mach. Learn. 1996, 24, 123–140. [Google Scholar] [CrossRef] [Scilit]
- Breiman, L. Random Forests. Mach. Learn. 2001, 45, 5–32. [Google Scholar] [CrossRef] [Scilit]
- Andreas, B.; Marco, G.; D., T.K.H.; Katja, T. Early Prediction of University Dropouts—A Random Forest Approach. J. Econ. Stat. (Jahrbuecher Fuer Natl. Stat.) 2020, 240, 743–789. [Google Scholar] [CrossRef] [Scilit]
- Chung, J.Y.; Lee, S. Dropout early warning systems for high school students using machine learning. Child. Youth Serv. Rev. 2019, 96, 346–353. [Google Scholar] [CrossRef] [Scilit]
- Lee, S.; Chung, J.Y. The Machine Learning-Based Dropout Early Warning System for Improving the Performance of Dropout Prediction. Appl. Sci. 2019, 9, 3093. [Google Scholar] [CrossRef] [Scilit]
- Freund, Y.; Schapire, R.E. A Decision-Theoretic Generalization of On-Line Learning and an Application to Boosting. J. Comput. Syst. Sci. 1997, 55, 119–139. [Google Scholar] [CrossRef] [Scilit]
- Brodersen, K.H.; Ong, C.S.; Stephan, K.E.; Buhmann, J.M. The Balanced Accuracy and Its Posterior Distribution. In Proceedings of the 2010 20th International Conference on Pattern Recognition; IEEE: New York, NY, USA, 2010; pp. 3121–3124. [Google Scholar] [CrossRef] [Scilit]
- Rastrollo-Guerrero, J.L.; Gómez-Pulido, J.A.; Durán-Domínguez, A. Analyzing and Predicting Students’ Performance by Means of Machine Learning: A Review. Appl. Sci. 2020, 10, 1042. [Google Scholar] [CrossRef] [Scilit]
- Vidal, J.; Gilar-Corbi, R.; Pozo-Rico, T.; Castejón, J.L.; Sánchez-Almeida, T. Predictors of University Attrition: Looking for an Equitable and Sustainable Higher Education. Sustainability 2022, 14, 10994. [Google Scholar] [CrossRef] [Scilit]
- Sandoval-Palis, I.; Naranjo, D.; Vidal, J.; Gilar-Corbi, R. Early Dropout Prediction Model: A Case Study of University Leveling Course Students. Sustainability 2020, 12, 9314. [Google Scholar] [CrossRef] [Scilit]
- Barros, T.M.; Souza Neto, P.A.; Silva, I.; Guedes, L.A. Predictive Models for Imbalanced Data: A School Dropout Perspective. Educ. Sci. 2019, 9, 275. [Google Scholar] [CrossRef] [Scilit]
- Psyridou, M.; Prezja, F.; Torppa, M.; Lerkkanen, M.K.; Poikkeus, A.M.; Vasalampi, K. Machine learning predicts upper secondary education dropout as early as the end of primary school. Sci. Rep. 2024, 14, 12956. [Google Scholar] [CrossRef] [Scilit] [PubMed]
- Liu, X.Y.; Wu, J.; Zhou, Z.H. Exploratory undersampling for class-imbalance learning. IEEE Trans. Syst. Man Cybern. Part B Cybern. 2009, 39, 539–550. [Google Scholar] [CrossRef] [Scilit] [PubMed]
- Nti, I.K.; Ramanayake, S. Explainable machine learning for student dropout prediction and tailored interventions in online personalized education. Discov. Artif. Intell. 2026, 6, 288. [Google Scholar] [CrossRef] [Scilit]
- Pedregosa, F.; Varoquaux, G.; Gramfort, A.; Michel, V.; Thirion, B.; Grisel, O.; Blondel, M.; Prettenhofer, P.; Weiss, R.; Dubourg, V.; et al. Scikit-learn: Machine Learning in Python. J. Mach. Learn. Res. 2011, 12, 2825–2830. [Google Scholar]
- Villar, A.; de Andrade, C.R.V. Supervised machine learning algorithms for predicting student dropout and academic success: A comparative study. Discov. Artif. Intell. 2024, 4, 2. [Google Scholar] [CrossRef] [Scilit]

Disclaimer/Publisher’s Note: The statements, opinions and data contained in all publications are solely those of the individual author(s) and contributor(s) and not of MDPI and/or the editor(s). MDPI and/or the editor(s) disclaim responsibility for any injury to people or property resulting from any ideas, methods, instructions or products referred to in the content. |
© 2026 by the authors. Licensee MDPI, Basel, Switzerland. This article is an open access article distributed under the terms and conditions of the Creative Commons Attribution (CC BY) license.