


Abstract
Many smart city and society applications such as smart health (elderly care, medical applications), smart surveillance, sports, and robotics require the recognition of user activities, an important class of problems known as human activity recognition (HAR). Several issues have hindered progress in HAR research, particularly due to the emergence of fog and edge computing, which brings many new opportunities (a low latency, dynamic and real-time decision making, etc.) but comes with its challenges. This paper focuses on addressing two important research gaps in HAR research: (i) improving the HAR prediction accuracy and (ii) managing the frequent changes in the environment and data related to user activities. To address this, we propose an HAR method based on Soft-Voting and Self-Learning (SVSL). SVSL uses two strategies. First, to enhance accuracy, it combines the capabilities of Deep Learning (DL), Generalized Linear Model (GLM), Random Forest (RF), and AdaBoost classifiers using soft-voting. Second, to classify the most challenging data instances, the SVSL method is equipped with a self-training mechanism that generates training data and retrains itself. We investigate the performance of our proposed SVSL method using two publicly available datasets on six human activities related to lying, sitting, and walking positions. The first dataset consists of 562 features and the second dataset consists of five features. The data are collected using the accelerometer and gyroscope smartphone sensors. The results show that the proposed method provides 6.26%, 1.75%, 1.51%, and 4.40% better prediction accuracy (average over the two datasets) compared to GLM, DL, RF, and AdaBoost, respectively. We also analyze and compare the class-wise performance of the SVSL methods with that of DL, GLM, RF, and AdaBoost.
1. Introduction
Smart cities and societies, also known as Artificially Intelligent cities [1], are characterized by their ability to allow us “to “engage” with our environments, analyze them, and make decisions, all in a timely manner” [2,3]. We “engage” with our environments using a range of sensors, including smartphones, the Internet of Things (IoT), cameras, GPS, social media, etc. [4]. The data produced by these sensors are analyzed for timely analysis and decision-making using a range of mathematical methods and simulations. Increasingly, artificial intelligence methods, particularly machine and deep learning methods, have become the methods of choice in smart city applications [5,6,7].
Many smart city and society applications, such as smart health (elderly care, medical applications), smart surveillance, sports, and robotics require recognition of node and user activities, a class of problems known as human activity recognition (HAR) [8,9,10]. The increasing importance of HAR is due to the many smart city applications that allow for the dynamic optimization of services based on the user location and the activity being carried out by the user at a particular time, which is made possible by smartphones, smartwatches, smart wearables, etc. Today’s smartphones, smartwatches, and other smart wearables are equipped with several sensors. Wearable sensors are small hardware devices. These could be standalone devices that people carry with them or wearables that may be embedded in smart devices, such as smartphones, smartwatches, etc. People carry these smart devices with them while performing daily activities, such as walking, running, standing, eating, etc. Sensors such as a gyroscope, accelerometer, global positioning system (GPS), microphone, magnetometer, and barometer can sense and record a user’s physical condition, location change, velocity change, elevation, and other characteristics and activities. Smartphones, smartwatches, smart healthcare bands, cameras, infrared devices, etc. can record various parameters that can help to understand our environment in a way that enhances our ability to make smart decisions. Therefore, HAR has become critical in a wide arrange of important application domains. For instance, it has been used for the elderly and in child care [11], to improve exercise performance in healthcare [12], to optimally recommend the mode of content delivery in distance learning [13], for entertainment, security, and surveillance applications [14], and to monitor social distancing for COVID-19 pandemic prevention [15].
The data used for human activity recognition include numerical data (e.g., location coordinates and magnetic field coordinates) and visual data, such as images and videos. A significant challenge in processing visual data for HAR requires extensive communication and computation resources in terms of CPU, storage, network bandwidth, specialized hardware, etc. [16] On the other hand, location coordinates data used for HAR are less resource-demanding than visual HAR data.
Machine learning plays a key role in developing our understanding of HAR data and applying the acquired knowledge to various application domains. The prediction accuracy of HAR algorithms has been significantly improved over the last decade due to the manufacturing of highly sophisticated, reliable, and accurate sensors and the development of specialized HAR methods that leverage machine learning and deep learning through the use of high-performance computing and big data technologies [17]. However, several challenges are still hindering the progress in improving HAR performance, mainly due to the emergence of fog and edge computing, which bring many new opportunities (low latency, dynamic and real-time decision making, etc.) but come with their challenges [18,19,20].
In this paper, we focus on addressing two important research gaps in HAR research. Firstly, most of the work on HAR is based on the use of a single classifier, such as neural networks, decision trees, bagging, and boosting. These classifiers can, individually, provide good performance for certain types of data patterns; however, they may fall short for specific other data patterns. Combining these classifiers’ prediction probabilities together in ensembles is known to have improved classification performance [21,22]. However, the selection of classifiers in ensembles requires a careful design process and is challenging. Secondly, data and the environment in which they are sensed change rapidly in real-world applications, and in these cases, frequent updates of the models are required based on the changing patterns in the data being sensed.
Accordingly, to address the above-mentioned challenges, in this paper, we propose a human activity recognition method based on Soft-Voting and Self-Learning (SVSL). SVSL uses two strategies to improve the overall performance of the HAR method. First, it combines the capabilities of Deep Learning (DL), Generalized Linear Model (GLM), and Random Forest (RF) classifiers using soft-voting. Secondly, the SVSL method is equipped with a self-training mechanism that generates training data and retrains itself. Soft-voting helps to enhance accuracy, while self-training helps to classify the most challenging data instances. We investigate the performance of our proposed SVSL method using a dataset that is publicly available on the UCI data repository, provided by Anguita et al. [23] The data contain six human activities related to lying, sitting, and walking. The results show that the proposed method provides 6.26%, 1.75%, 1.51%, and 4.40% better prediction accuracy (average over the two the datasets) compared to GLM, DL, RF, and AdaBoost, respectively. We also analyze and compare the class-wise performance of the SVSL methods with that of DL, GLM, RF, and AdaBoost, showing that SVSL produces a comparatively better classification for some activity classes, as DL, GLM, RF, and AdaBoost produce a higher number of misclassification instances (an observation that we plan to investigate further in the future, with the expectation of further success). We also show that the self-training mechanism of the proposed SVSL method increases the average prediction accuracy from 99.26% to 99.37% for dataset I, and 97.15%, to 97.59% for dataset II.
The rest of the paper is organized as follows. A review of the relevant literature is given in Section 2. The proposed SVSL method is described in Section 3. In Section 4, the proposed SVSL method is evaluated using the provided results. Finally, in Section 5, we conclude the paper and provide a direction for future work.
2. Literature Review
The most straightforward and practical application of human activity recognition (HAR) involves using wearable devices to track individuals while they perform their daily activities. Humans perform many exercises every day, such as walking, running, football games, dozing, and eating, and are constantly expanding these exercises. Therefore, these data have an enormous significance in educating us about different parts of human existence and what they mean in people’s lives. HAR has many applications and can be used in various domains, for example, smart cities [24], elderly and child care [11], physical rehabilitation [25], identifying criminal behavior and violence [26], real-time content delivery [13], surveillance [14], etc. The two types of sensors that are usually used for human activity recognition include visual sensors, such as cameras, which produce video as data, and non-visual sensors, such as accelerometers and gyroscope sensors, which generate numerical data. Machine learning strategies are on the leading edge and play a key role in HAR. Over time, these AI-based HAR techniques have improved the accuracy in prediction and working on complex information. RF, Support vector machine (SVM), decision tree, and DL are the most well-known decision-making strategies for HAR.
Palaniappan et al. [27] focused on recognizing strange human practices. Unusual exercises are sudden occasions that occur arbitrarily. Human practices can be perceived using a variety of methods. The most commonly used method is multi-class SVM. Palaniappan et al. [27] proposed a new plan to address human practices in the form of a state progress table. The changing table helps keep the classifier away from the states that are inaccessible from the current state. By staying away from unreachable states, the computational time for grouping is radically reduced compared to that using conventional methods.
Many classifiers face the constraints of a long training time and large feature vector size. Chaturmali and Rodrigo [28] proposed a method based on the SVM classifier, addressing the problems in human activity recognition using an existing spatio-temporal feature descriptor. A comparison of the system proposed in [28] with existing classifiers using two standard datasets shows that the system in [28] is much better in terms of computational time and either exceeds the existing recognition rates or is equal to it. Several other SVM-based methodologies have been proposed in the literature [29,30,31,32], referred to for further information.
Computing feature importance is a critical task in HAR problems, as it helps to decrease the features that do not hold any relevance, and removable features can increase classification performance. Uddin and Udiny [33] proposed a random forest-based feature importance method for HAR problems. The first step is to train a conventional RF algorithm on the HAR dataset to compute the feature importance. In the second step, the feature importance values are transferred to the directed RF algorithm. The authors used the directed RF algorithm because trees are not dependent on each other, and parallel computation decreases the training time and minimizes the prediction time. The algorithm developed only two ensembles and showed a high selectivity with a small sample. Further, this helped to maintain high prediction accuracy. In [33], five widely used HAR datasets were used, and the authors noted that the directed RF can find smaller feature sets while maintaining a high HAR accuracy.
Different functions exist for further improving the HAR prediction, including like, display, and circle [34,35,36]. In recent years, deep learning has rapidly grown in all application domains (natural science, computer science, multimedia, networking, security, finance, etc.) due to its ability to efficiently understand complex and non-linear data [30]. Human actions need to be accepted as a specific activity that helps to identify different types of human development and behavior. HAR uses information gathered from different types of sensors. Wang et al. [12] proposed a deep learning-based method that can perceive two different exercises and transitions between them. This has a very important practical use, particularly for medical care applications. In [12], the authors first designed a deep convolutional neural (CNN) model to extract distinguishing parameters from the sensed data. Then, to capture the conditions of two different exercises, a long transient memory network was used. This step improved the HAR accuracy for two exercise activities. With the fusion of CNN and LSTM, a model was introduced for wearable devices that can precisely deduce exercises and switching one exercise to another. With the fusion of CNN and a long transient memory network, a model was introduced for wearable devices that can precisely deduce one exercise and then switching to another successfully. The test results showed that the proposed method is highly accurate, with a correct classification rate of up to 95.87% and a correct classification rate for changes of over 80%, which is superior to comparable HAR models. Another deep LSTM neural network method for HAR is introduced in [37], where IMU sensor data are used.
DL techniques are used for the classification problem but perform very well for time-series problems too. Alawneh et al. [38] examined the pros and cons of time series data augmentation to enhance the accuracy of DL models for HAR from smartphone-based accelerometer data. Alawneh et al. critically analyzed Gated Recurrent Units, Long–Short Term Memory, and Vanilla and tested them using three publicly available HAR datasets. They used double cross arrangement information augmentation procedures and studied their effect on the accuracy of the objective model. The analysis proved that using gated intermittent units produces the best accuracy and preparation time results and enables long-transient memory processing. Furthermore, the results showed that the use of information extension essentially improves the quality of the acknowledgment. Similar to [8], Ronald et al. [39] focused on the importance of the low computational power of mobile devices while performing HAR using DL models. A very interesting framework of feature fusion is proposed by Chen et al. [40], where handcrafted features are fused with automatically generated features through DL for HAR.
HAR is of great importance when managing and controlling pandemics like that of COVID-19 today and in the future. Applications for contact tracing, social distancing, and information dissemination have grown significantly during COVID-19 to effectively manage and control the pandemic. Contact tracing applications help to determine the near history of an infected person, such as where the infected person went and whom the infected person met in the last week. On the other hand, social distancing applications assist in determining whether people follow social distancing guidelines. Location coordinates, proximity data, and HAR data play an important role in contact tracing and social distancing applications. Countries around the world have successfully used these applications. D’Angelo and Palmieri [41] introduced a human movement classifier based on convolutional deep neural networks to improve the exposure of COVID-19 to the above-stated applications. Specifically, the raw information from a cell phone’s accelerometer sensor was arranged to frame a picture, including some channels (HAR-images) used as fingerprints for progress action, which can be extrapolated to the following applications, constituting one of the contributions of the present study. The experimental results from examining anecdotal information revealed that HAR images are potent attractants for human action acceptance. The novel coronavirus devastated the world and forced researchers to find solutions for controlling and irradicating this infection. These researchers include virologists, clinical specialists, and doctors attempting to find answers and develop solutions to deal with the COVID-19 pandemic, for example, techniques that can improve the diagnosis of COVID-19, healing protocols, drugs, and vaccines.
The late progress in non-contact detection for improving medical care and regulating COVID-19 flare-ups is the motivation for this investigation. Khan et al. [42] attempted to explain an imaginative answer to the early analysis of COVID-19 signs, such as strange breathing rates, hacking, and other inevitable medical issues. To develop a compelling and practical arrangement of the existing phases, Khan et al. [42] identified the existing methods used for health monitoring based on human activity data. The paper presented data collection methods, data preprocessing and processing methods, data preparation, feature selection and extraction, and prediction methods for non-contact applications. The preliminary findings of Khan et al. [42] regarding COVID-19 manifestations and the observation of human practices and well-being during isolation play a critical role in determining how the infection will spread and with what intensity. There have been several advances in non-contact sensing to improve health care. As previously discussed, the study of D’Angelo and Palmieri [41] was also inspired by this, and their work has contributed to preventing the COVID-19 outbreak. This investigation aims to explain an imaginative answer to the early analysis of COVID-19 signs, such as abnormal breathing rates, hacking, and other underlying medical conditions. To obtain a feasible and achievable system based on the existing steps, we differentiate the current techniques used to examine humans’ function and well-being in a non-contact manner. This efficient audit presents the performance of information classification innovation, information preprocessing, information readiness, highlight extraction, order counting, and various non-contact detection steps. This examination proposes a non-contact detection phase for the early conclusion of COVID-19 side effects and the observation of human exercise and well-being during detachment or isolation periods. From the literature mentioned above, it is clear that there has been no work on the potential of soft-voting and self-learning mechanisms to improve HAR accuracy. In Table 1, we provide a comparative analysis of the HAR literature.
Table 1.
A Comparison of the Related Works.
3. Methodology
Machine learning is playing a significant role in understanding complex human activity patterns relating to the problems of HAR. In this paper, we propose a machine learning-based method that works in two phases. In the first phase of the method, the prediction probabilities are combined by soft voting. Later, the method is periodically capable of training itself. All the simulations are performed using R machine learning and a statistical platform. All the experiments are performed on the Dell Precision M4800 workstation with Intel Core i7 (Santa Clara, CA, USA), which has eight cores and 16 GB RAM. We used multiple cores for parallel processing to speed up the training of the models.
3.1. Datasets
We used two datasets in this paper. However, the main focus has been given to dataset-I. The dataset-I we used in this work is freely available on the UCI data repository. The dataset is recorded by conducting experiments on 30 people aged between 19 and 48 years old by Anguita et al. [23]. Six activities were performed by each person, including walking, walking up the stairs, walking down the stairs, standing, lying, and sitting. The training data consist of 7209 rows, and the testing dataset consists of 3090 rows. The data were sensed using the accelerometer and gyroscope sensors of the Samsung Galaxy S II smartphone. However, in this work, we only used the accelerometer data. The dataset contains 562 feature, subject, and activity vectors. The crucial aspect of this dataset is that it has a vast feature set, which can be challenging for machine learning algorithms from the perspective of training time, feature importance, and resource requirements, such as processors and RAM. Further, we used an HAR dataset-II to have more convincing evidence of the proposed method’s performance [43].
3.2. Proposed Method
HAR is a problem of great interest due to its wide array of applications, including healthcare, surveillance, adaptive content delivery, tracking, etc. Machine learning is at the forefront of it. We called our HAR method Soft-Voting and Self-Learning (SVSL). The idea is to use the power of combined decision-making rather than limiting it to a single classifier. For this purpose, we used soft voting, where we combined the prediction probabilities and took weighted probability as the deciding factor in SVSL.
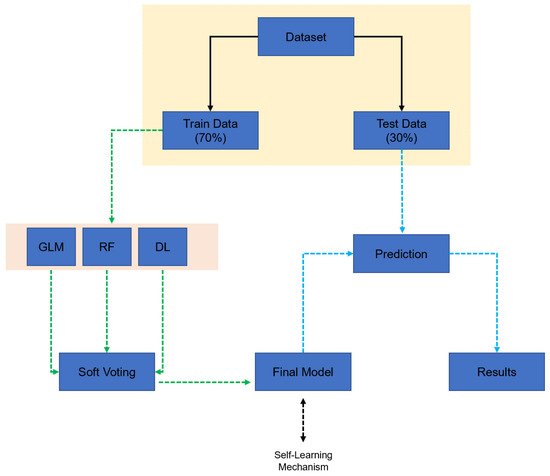
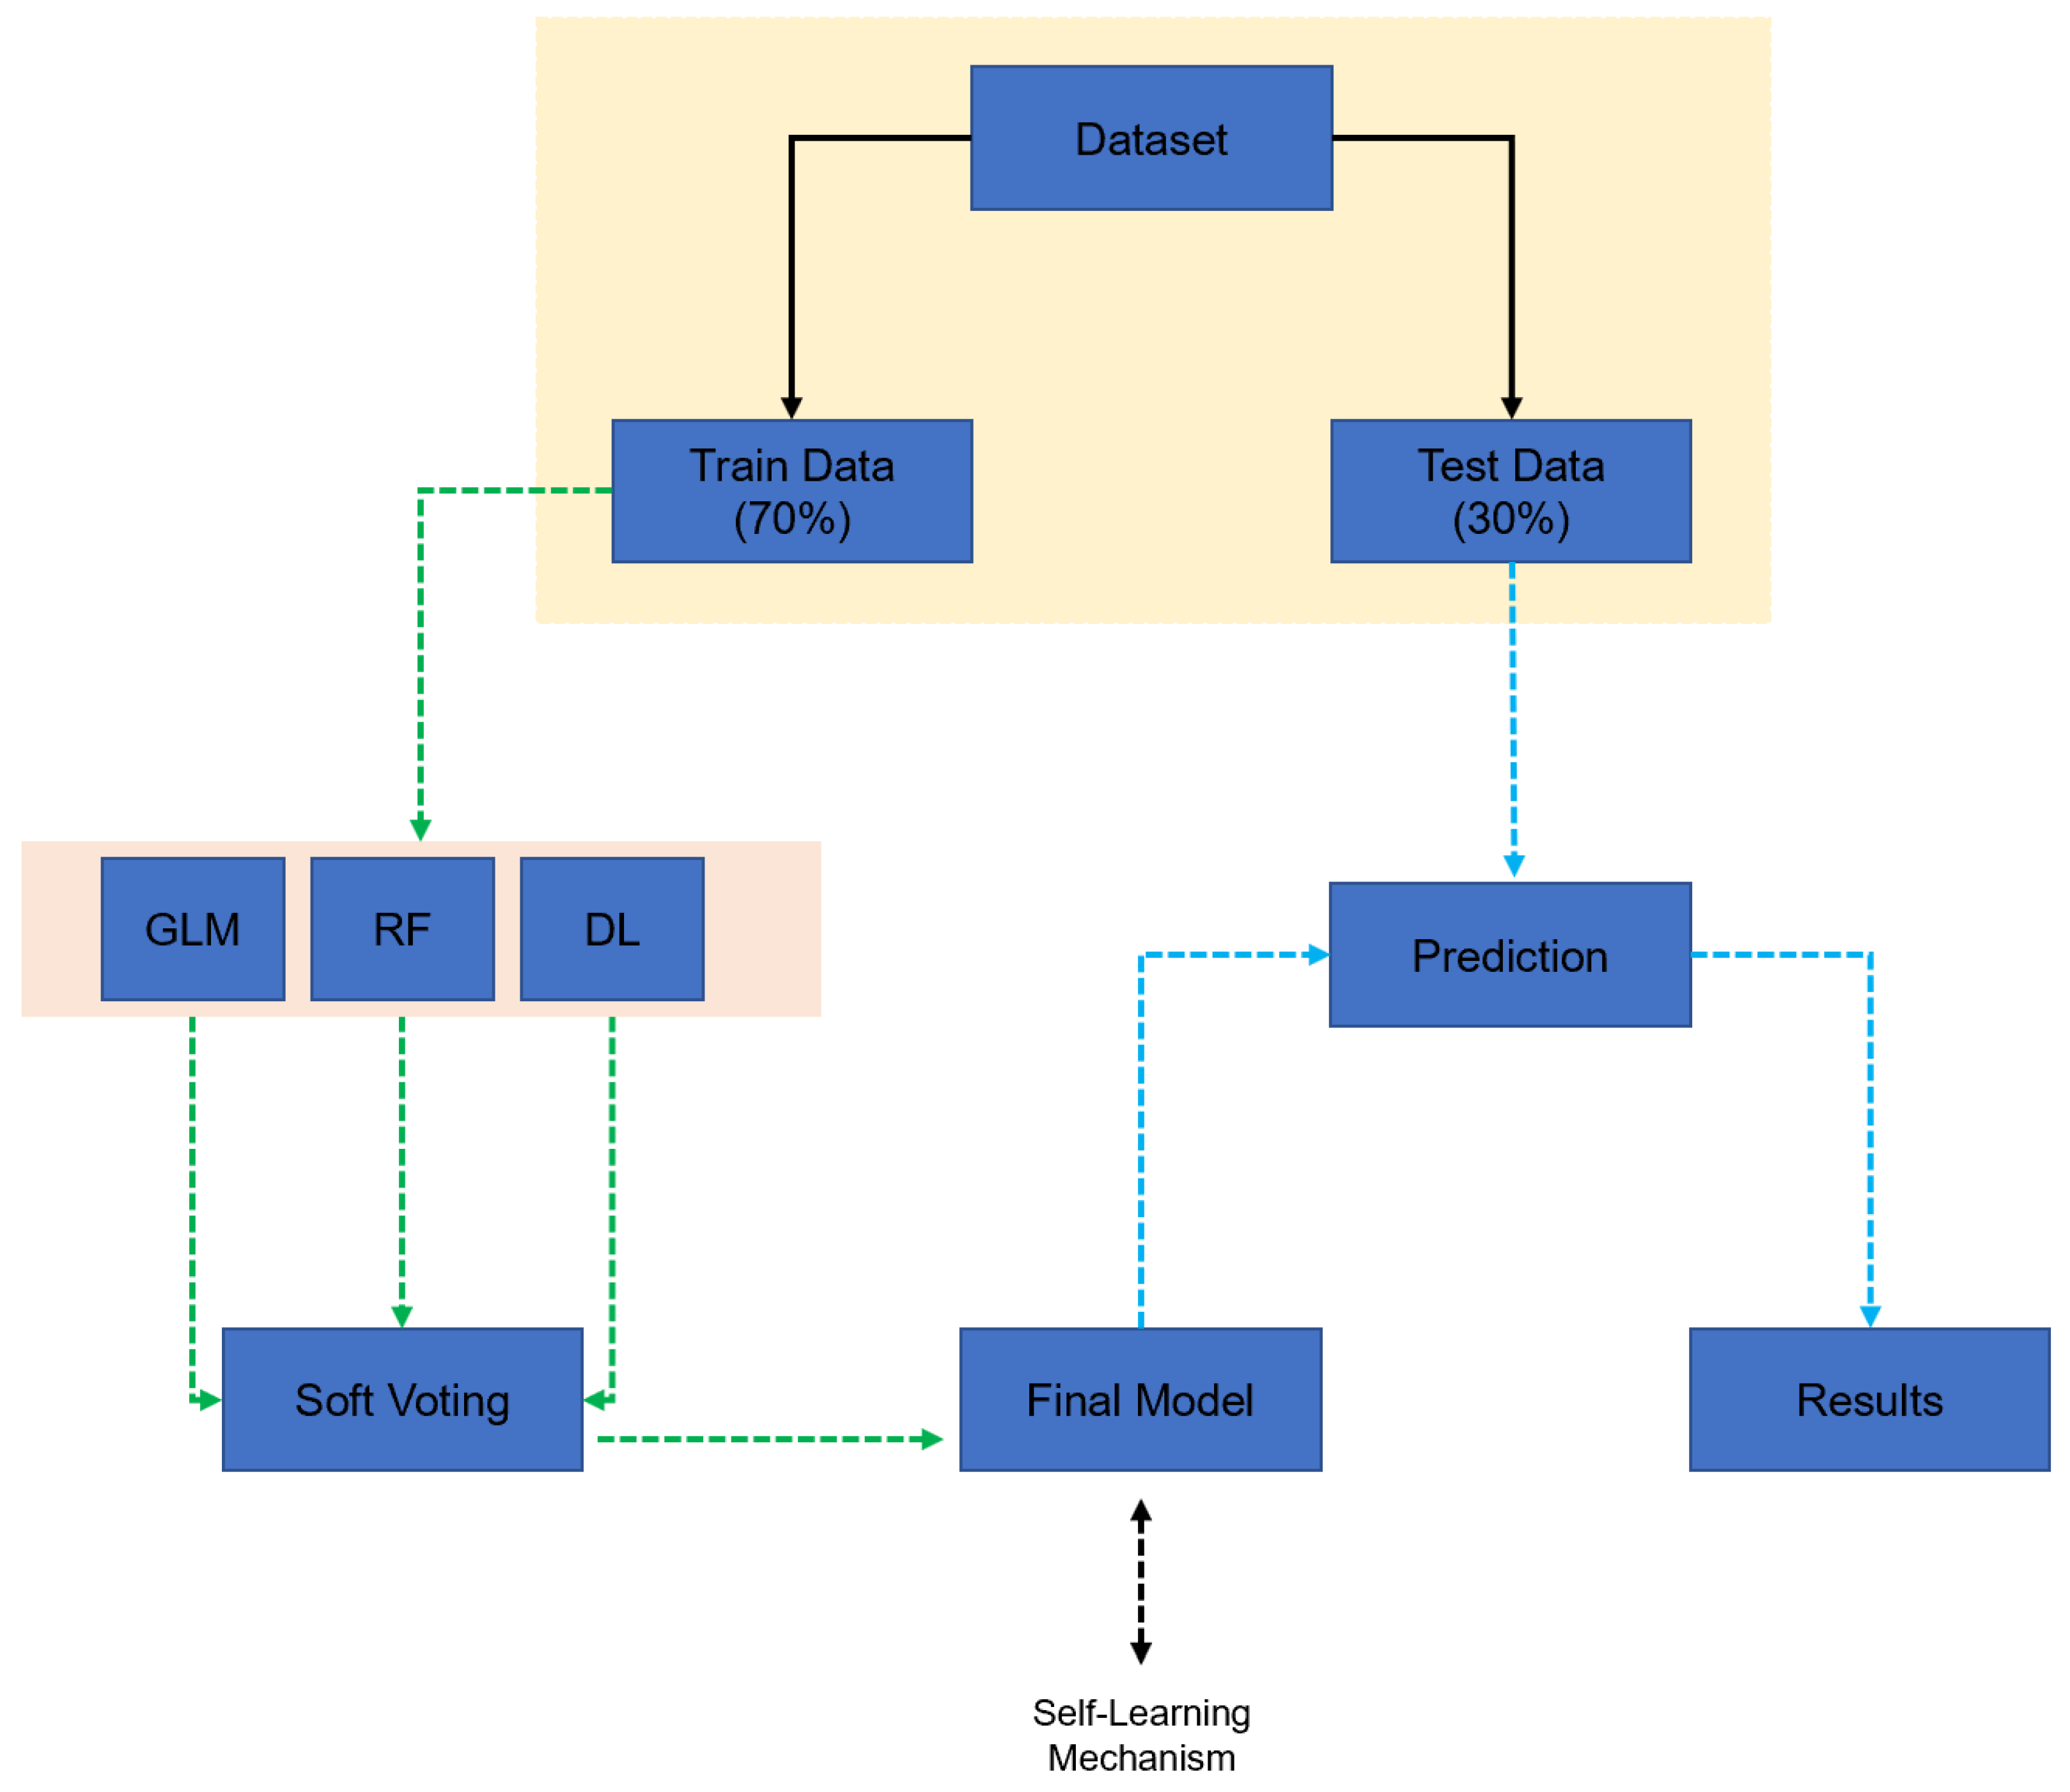
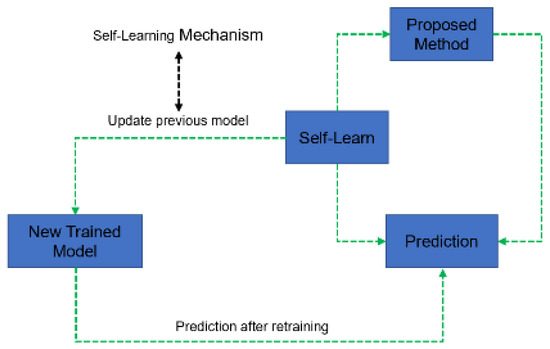
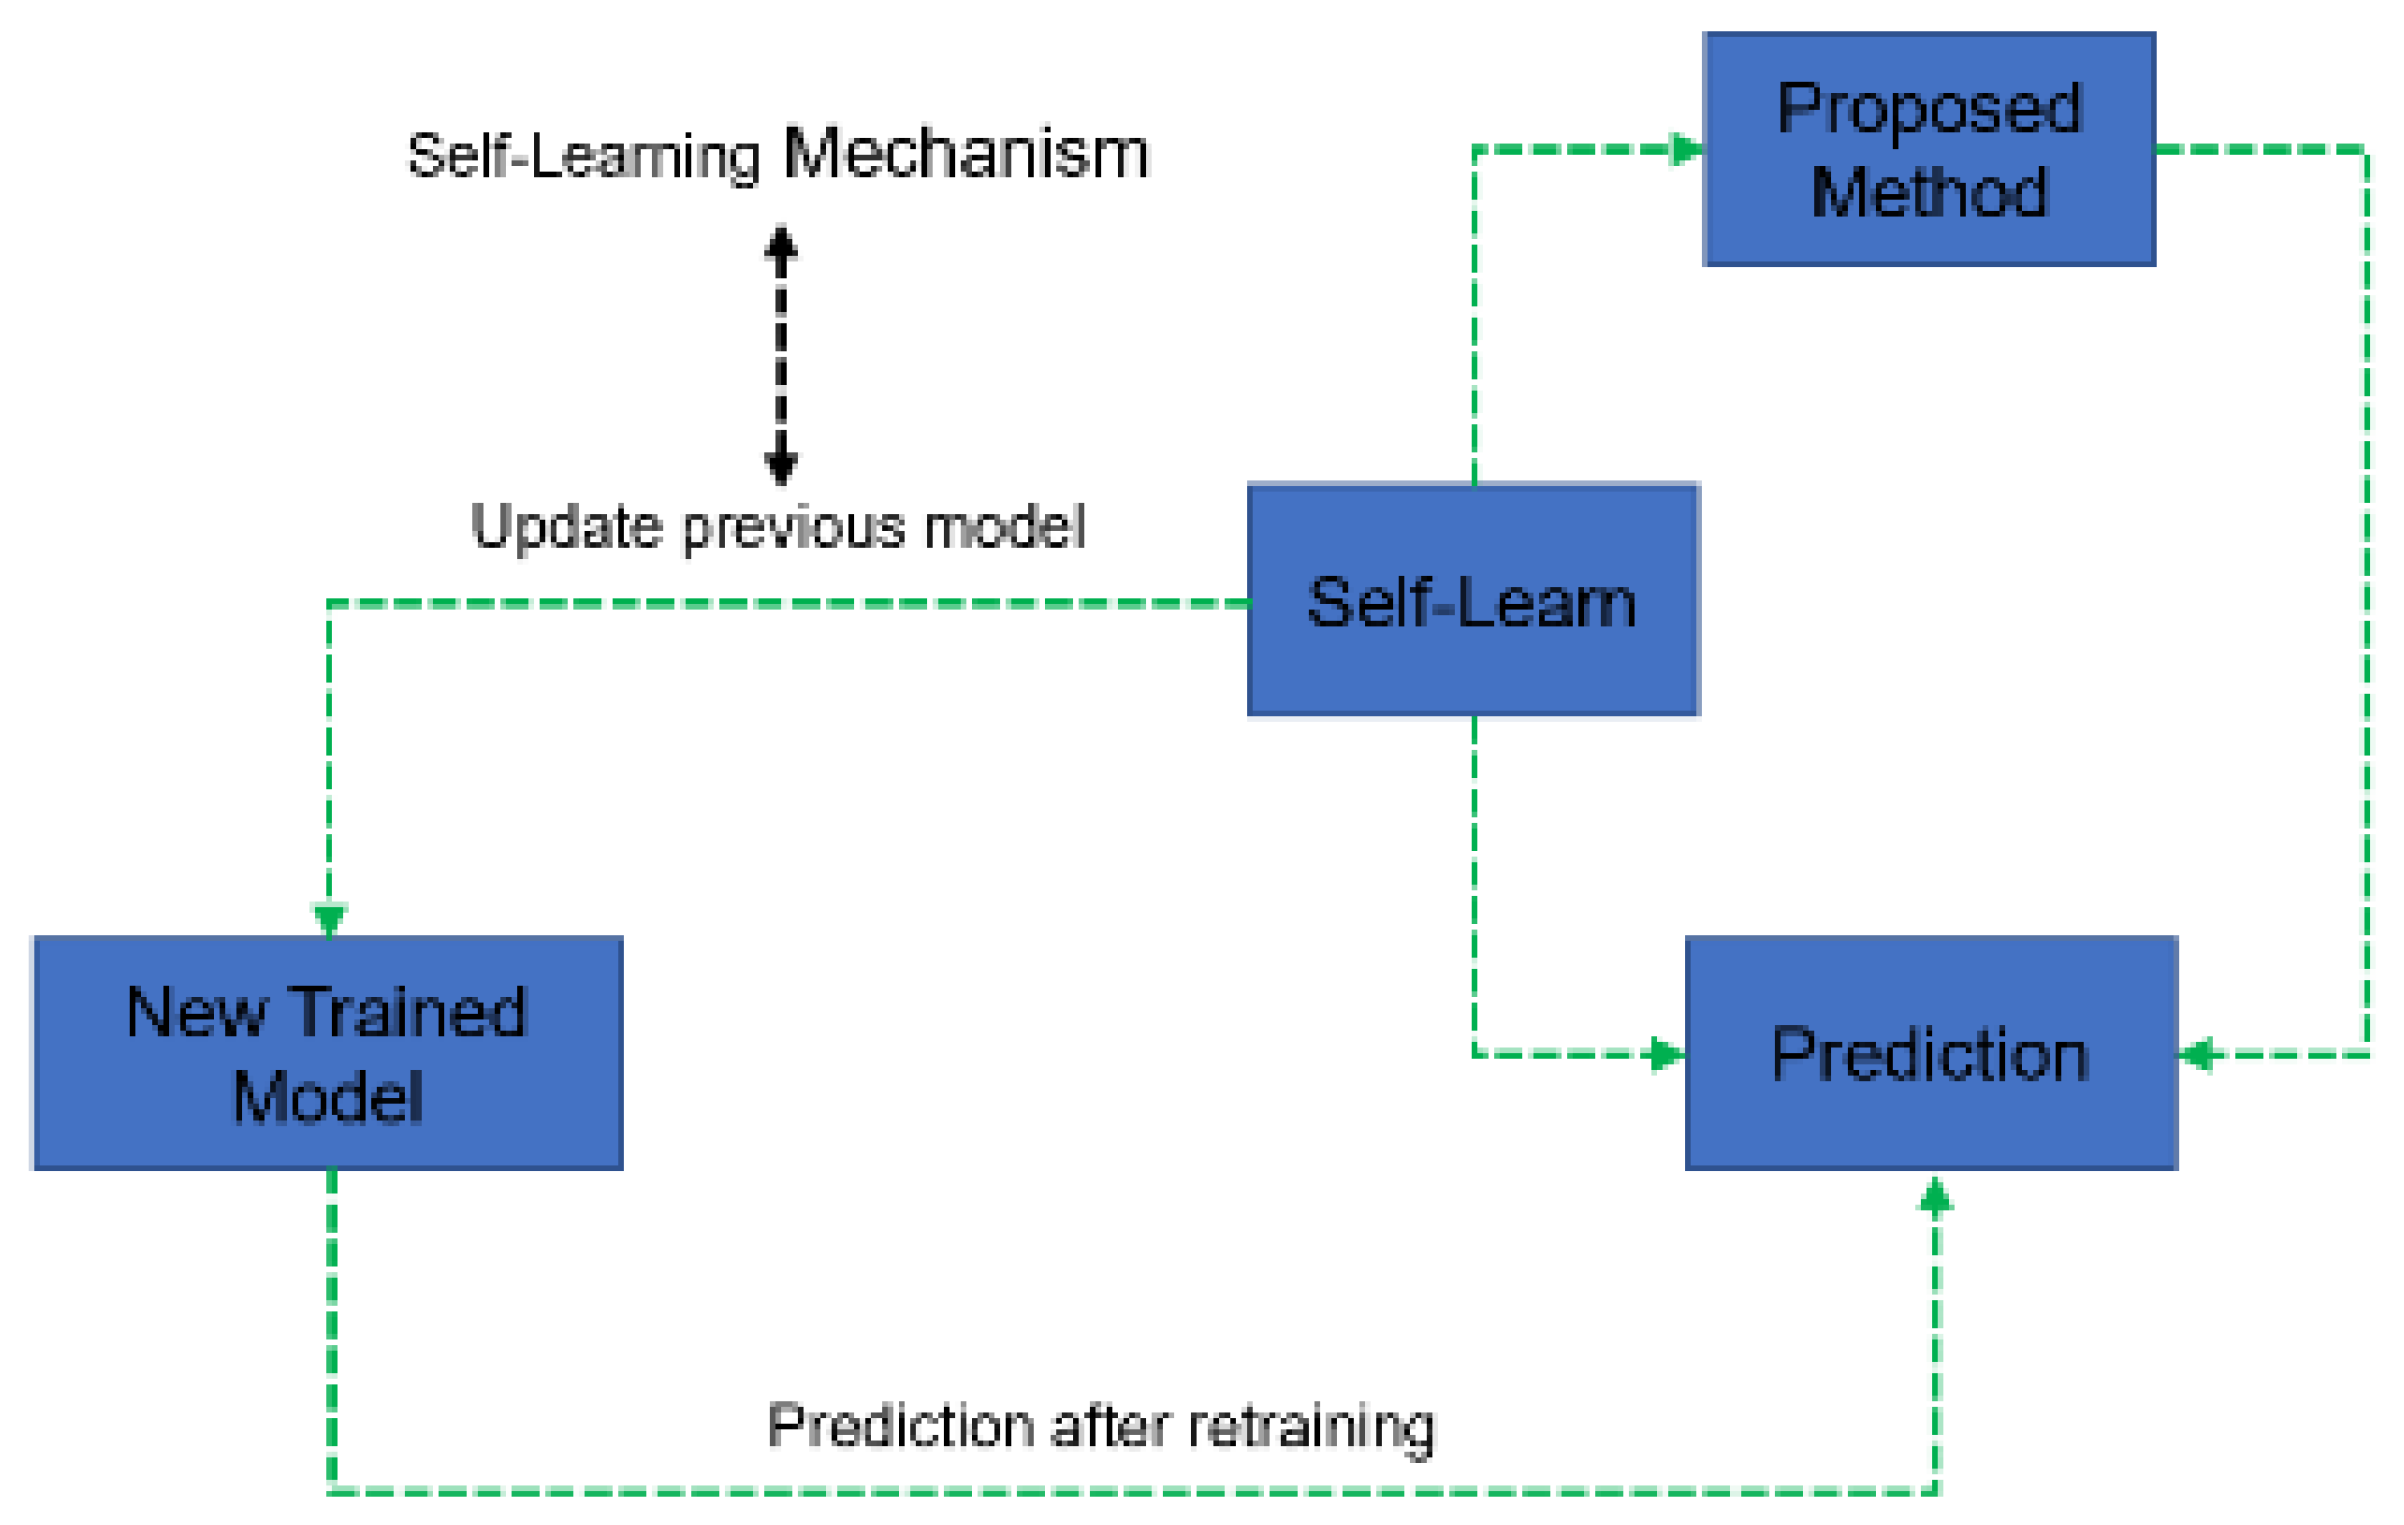
Further, to enhance the prediction accuracy, the SVSL method was integrated with a self-training mechanism. By self-training mechanism, we mean that the SVSL method trains itself again periodically, without the need for any data from the user side and any human interference. We believe that this trick could help us understand and correctly classify the data instances that are the most difficult to predict and efficiently accommodate dynamic environments. A functional block diagram of the SVSL method is shown in Figure 1, and the self-training process is shown in Figure 2. Further, for an in-depth understanding, the Algorithm 1, is given, which is self-explanatory.
Figure 1.
Workflow of the SVSL method.
Figure 2.
Self-training mechanism of the SVSL method.
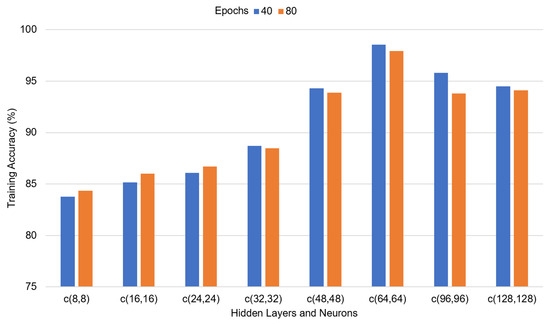
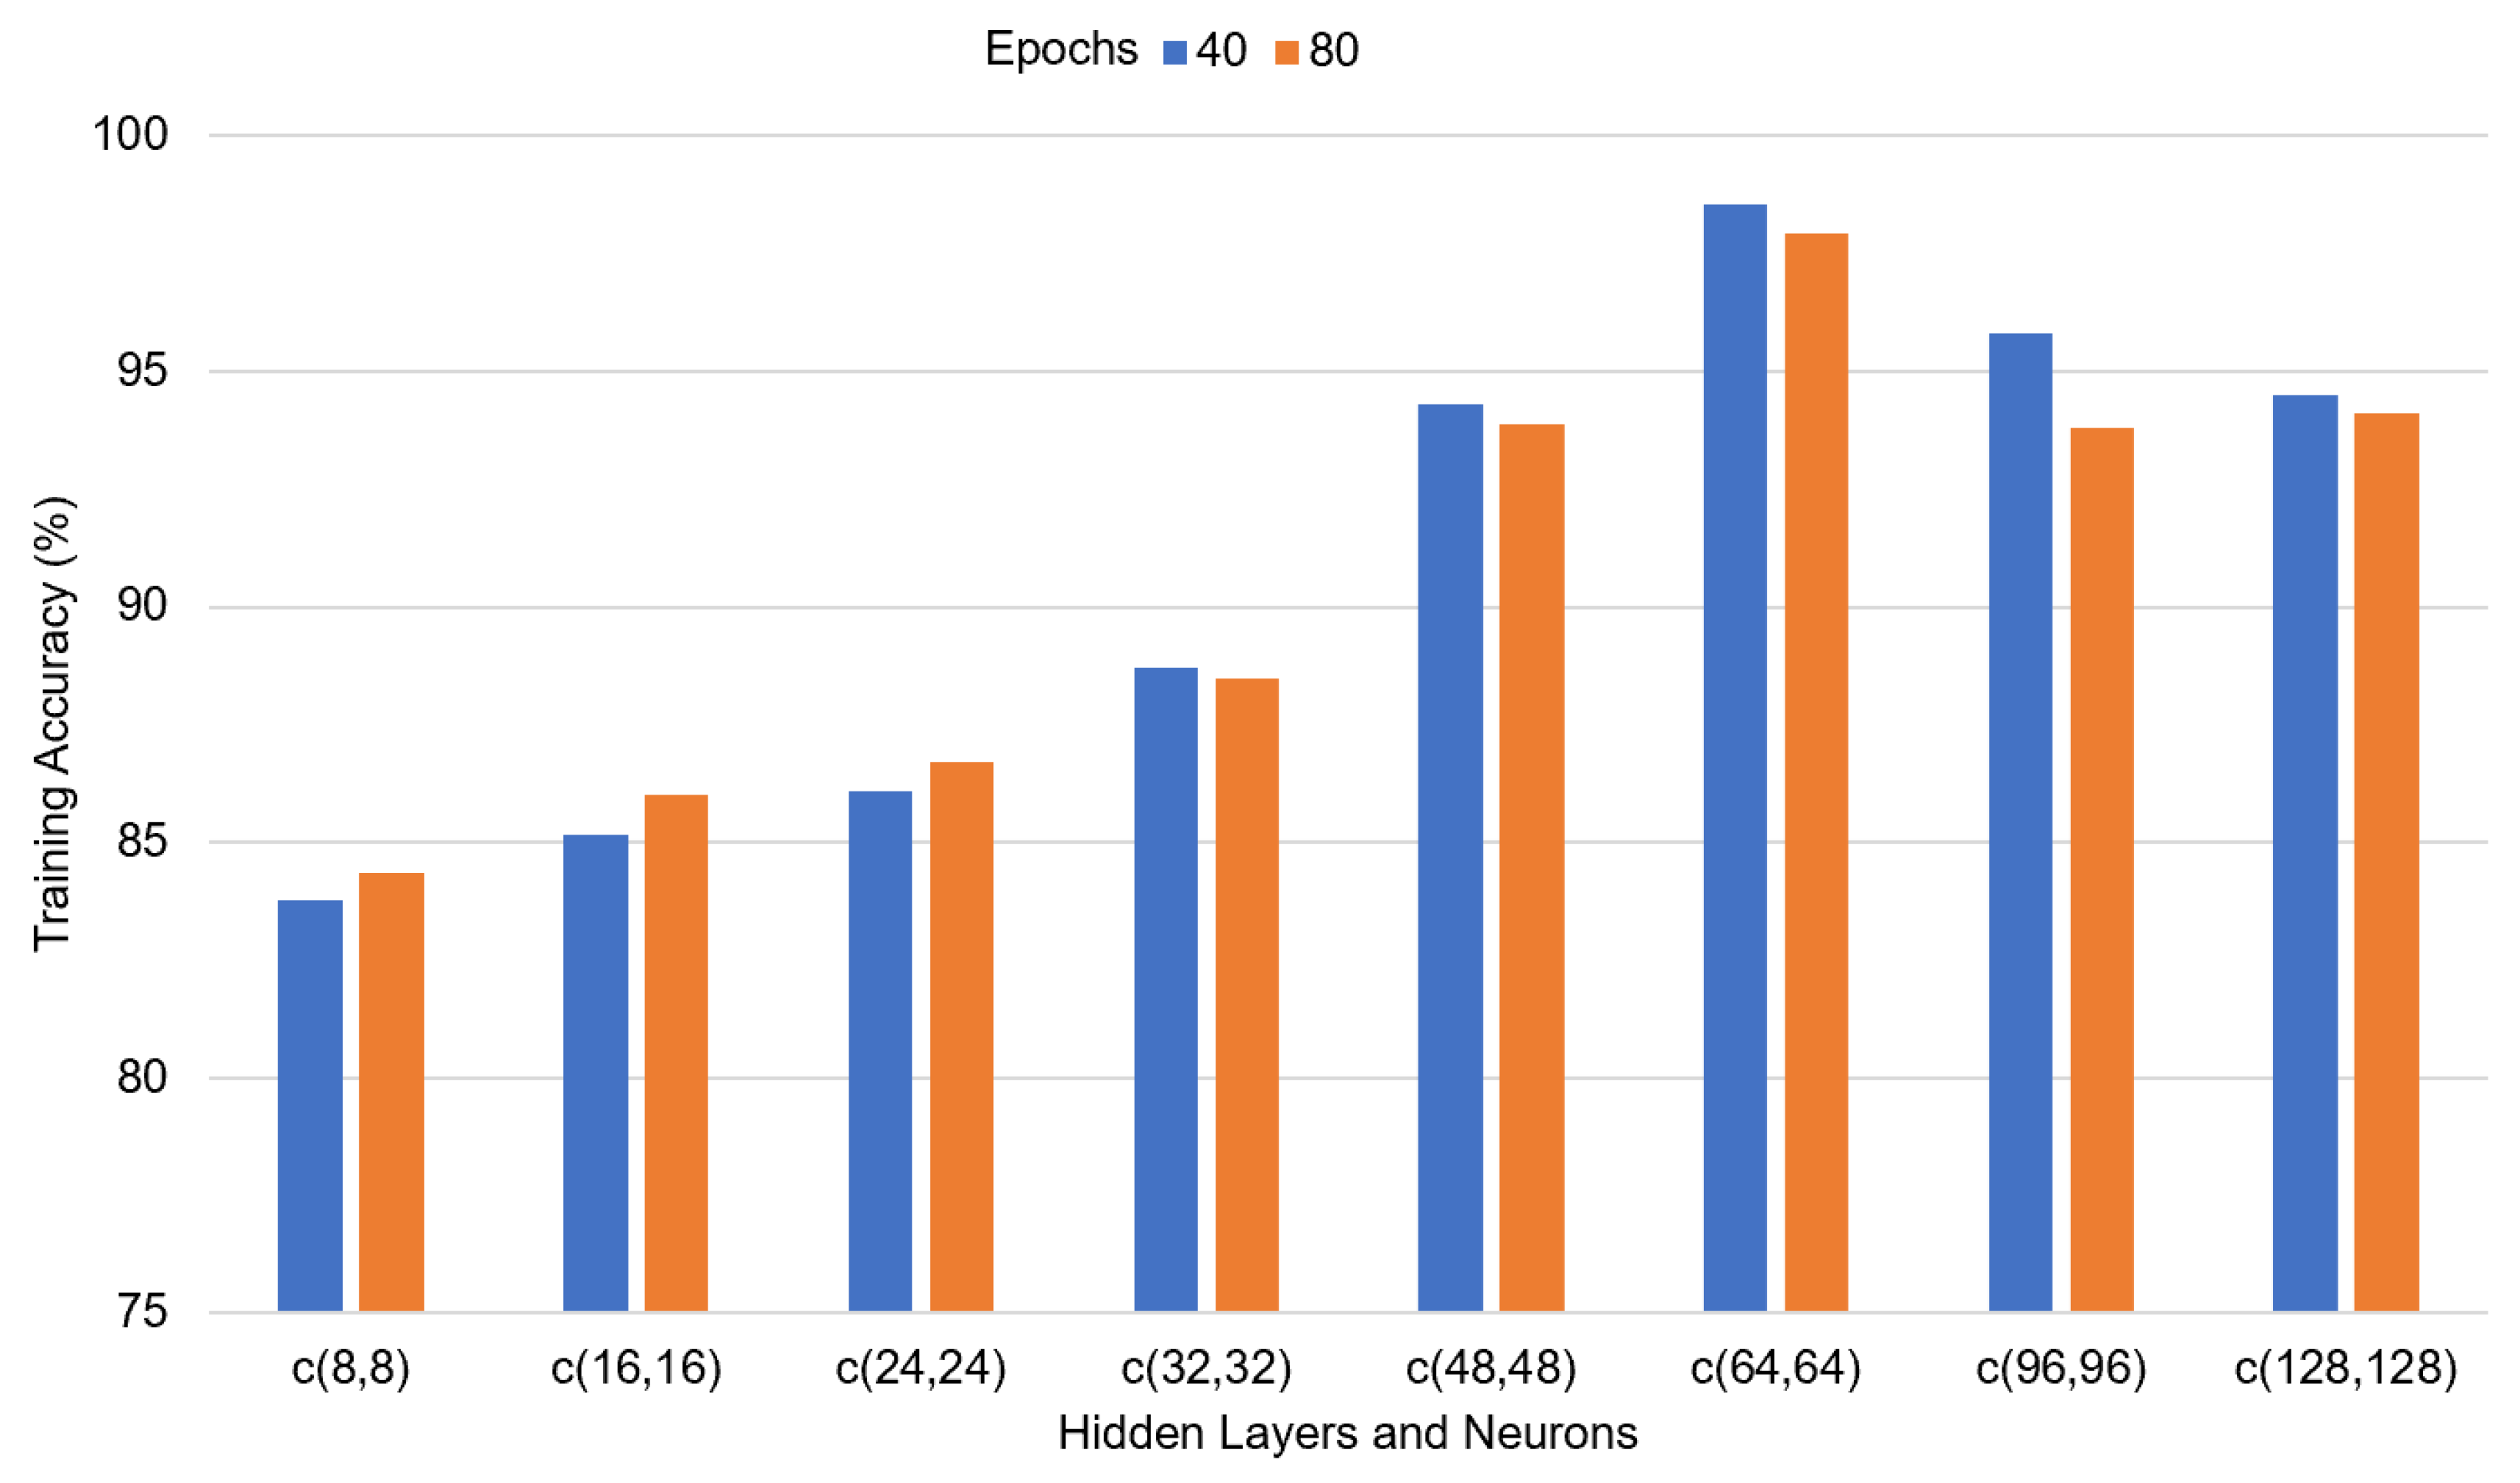
The SVSL works in two phases: (1) Soft-voting and (2) Self-training phases. Figure 1 depicts the processing steps of the SVSL method. First, we divided the dataset into training and test data by 0.7 and 0.3 ratios. First, DL, GLM, RF are trained separately. For DL, Tanh is used as an activation function. Figure 3 depicts that the model with 40 epochs and two hidden layers with 64 neurons each produced the best training results. Hence the model with these parameters is selected from the eight trained DL models.
Figure 3.
Prediction accuracy (%) of different DL models.
Then, using soft-voting, we obtained the final model ( using the formulation of soft-voting given in Equations (1)–(4), where the activity class is denoted by i = (Walking; Standing, etc.), the predicted class probabilities are denoted by ρ, and the classifiers used for voting are denoted by .
Once the is obtained, as given in Figure 1 and further in Algorithm 1, we use it to predict the activity class. is trained periodically from a buffered dataset, which is obtained autonomously from the predicted data. Buffered data are the saved data from the previous ten predictions from , which is updated periodically. The periodically trained model is used to predict human activity labels. Figure 2 depicts the self-training process, which is an iterative task. After every ten executions, is replaced by the retained .
| Algorithm 1. SVSL Method | |
| # 1. | Enter independent variables Input Data: d |
| # | Predicted Activity Label |
| 2. | Result: L |
| 3. | Begin |
| # | Predicted activity labels with RF, GLM, and DL trained models |
| 4. | |
| # | Use Soft Voting function to combine predicted probabilities |
| # | Obtain Final model and prediction |
| 5. | |
| 6. | End |
| # | Self-Train periodically with buffer datasets |
| 7. | |
| 8. | Update models at Step 4 |
| 9. | Move to Step 5 and repeat whole process again |
4. Results and Analysis
To evaluate the performance of the SVSL HAR method, we used the confusion matrix as a performance-measuring benchmark, which can be used to compute the prediction accuracy percentage, sensitivity, and specificity [44]. To demonstrate the validity of the performance of the SVSL method, we compared the results of four state-of-the-art classifiers: DL, GLM, RF, and AdaBoost. RF is based on bagging, which is an ensemble learning technique that can perform classification and regression. RF is a highly capable classifier that can handle high-dimensionality datasets, compute variable importance, and avoid overfitting [45]. However, RF is not very capable of performing regression tasks with good accuracy. GLM was proposed by John Nelder and Robert Wedderburn [46] in 1972. It is a linear regression generalization. It allows the linear model to include the dependent variable with the help of a linking function.
Furthermore, it enables the variance magnitude of every data instance to be its predicted value function. This paper used Feed Forward Deep Neural Networks, also known as a multi-layered perceptron, for DL [47]. They consist of an input layer (data), hidden layers (neurons), and an output layer. All three classifiers, RF, GLM, and DL, are implemented using the H2O deep learning library in R [48], which supports parallel and distributed programming. Further, we also compared results with a state-of-the-art boosting classifier known as AdaBoost as it falls in the Ensemble class of algorithms.
4.1. Dataset I
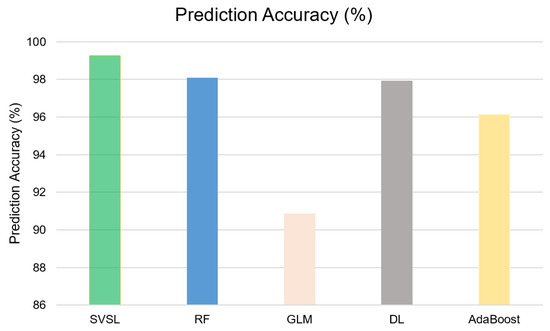
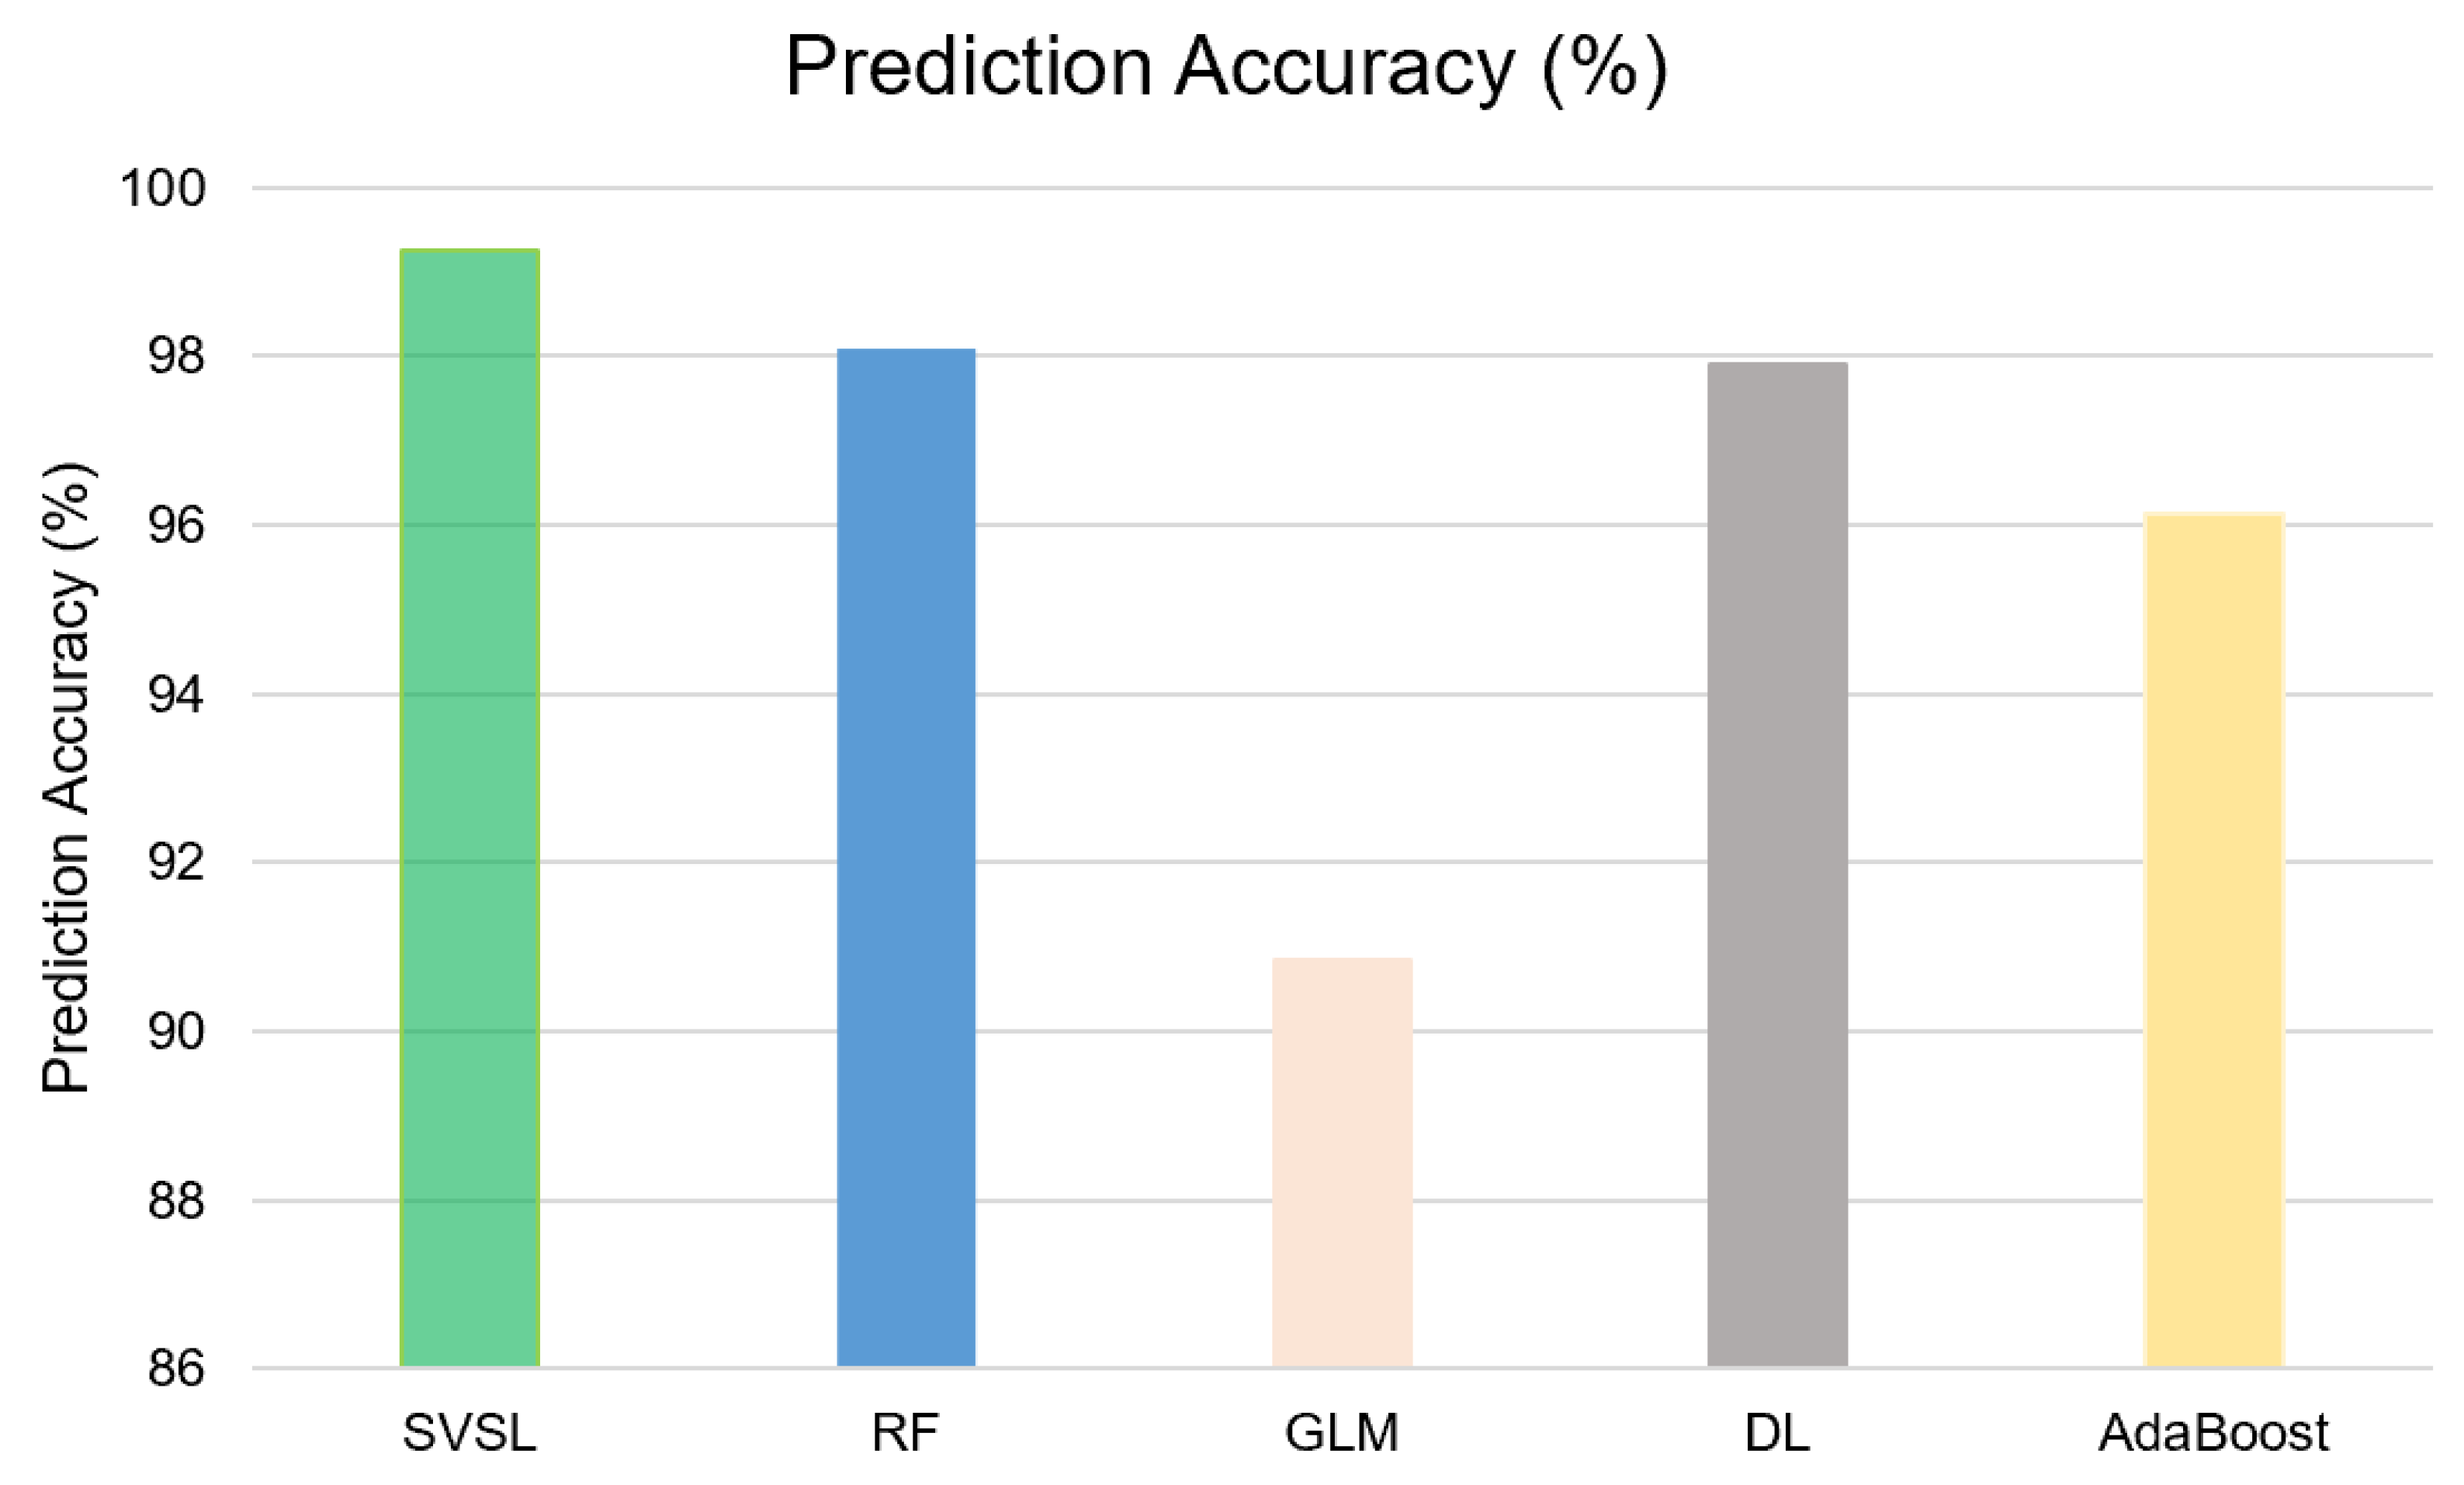
Figure 4 shows that the SVSL method achieved an average accuracy of 99.26%, which is better than that of the other three classifiers, RF, GLM, DL, and AdaBoost, with 98.09%, 90.84%, 97.90%, and 96.13%, respectively. Furthermore, the SVSL method showed a 0.14% gain with the self-training mechanism, which indicates that the SVSL method can correctly classify the most challenging data instances.
Figure 4.
Prediction accuracy (%) of the SVSL method, RF, GLM, DL, and AdaBoost.
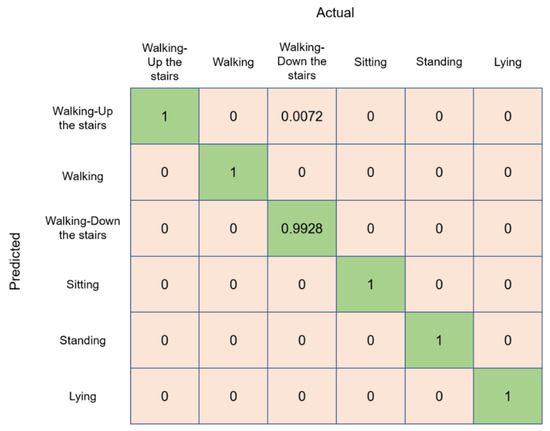
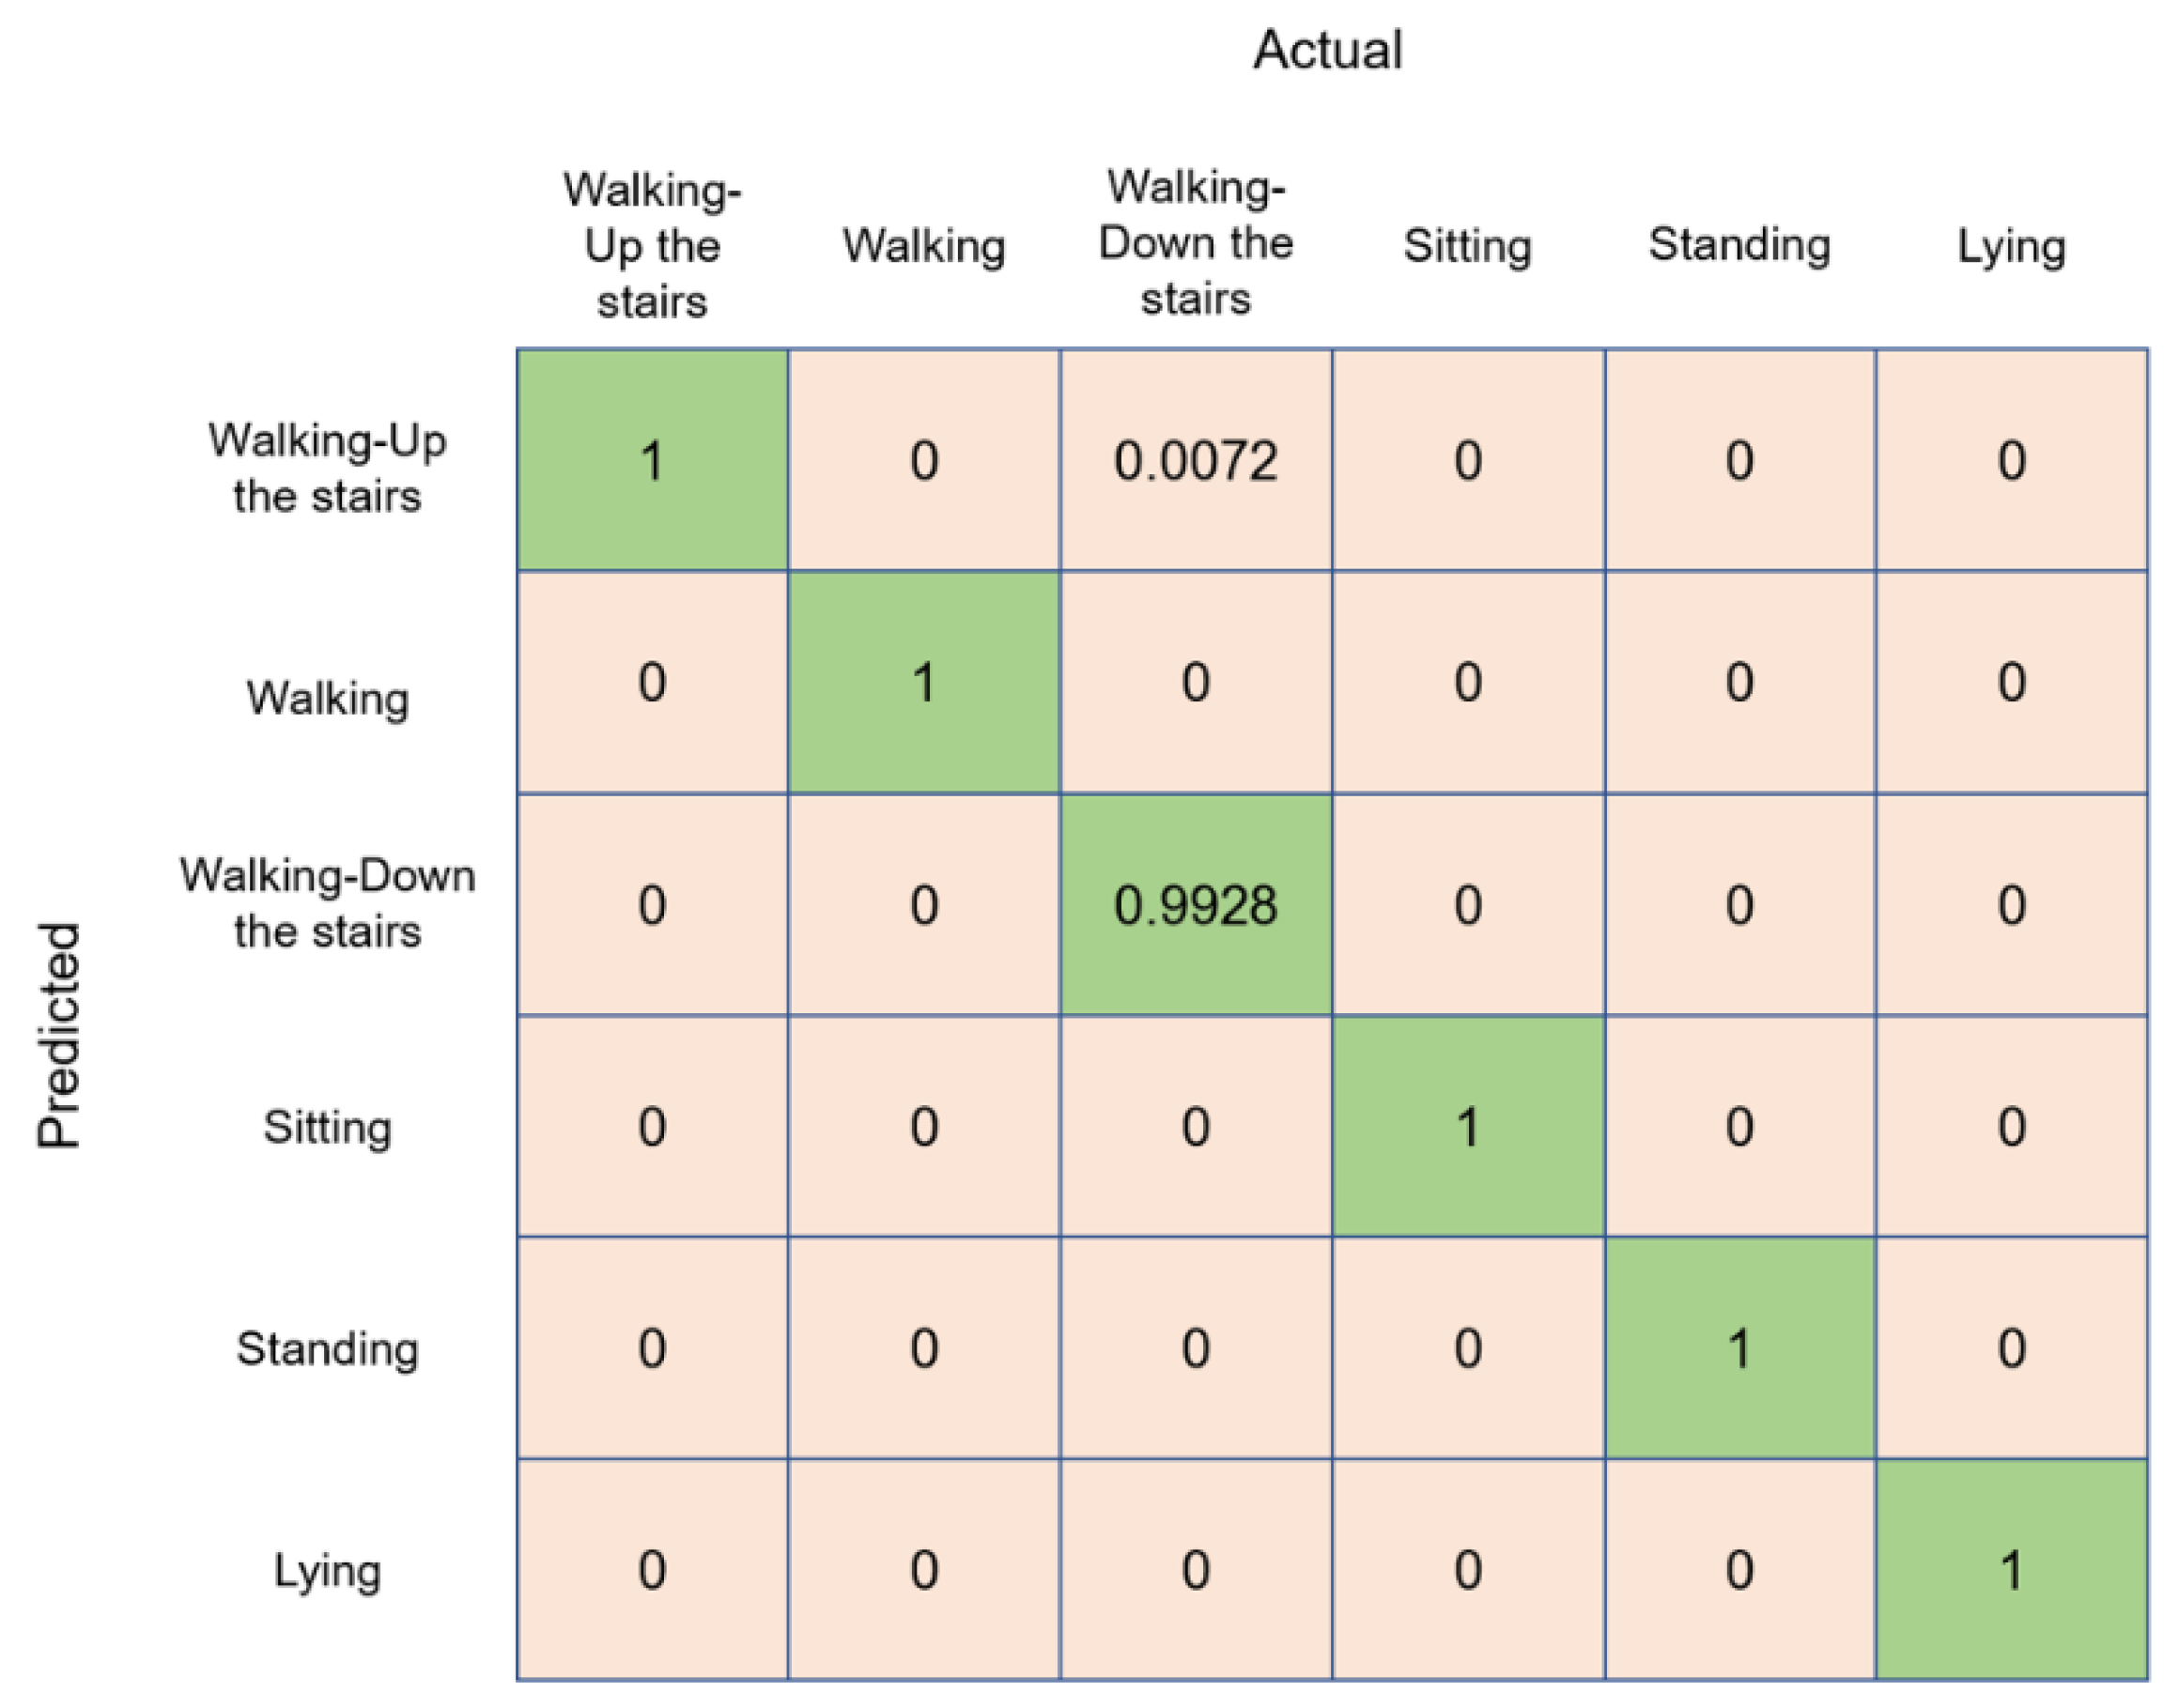
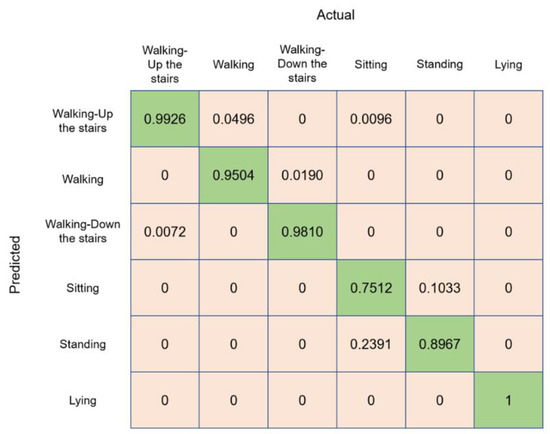
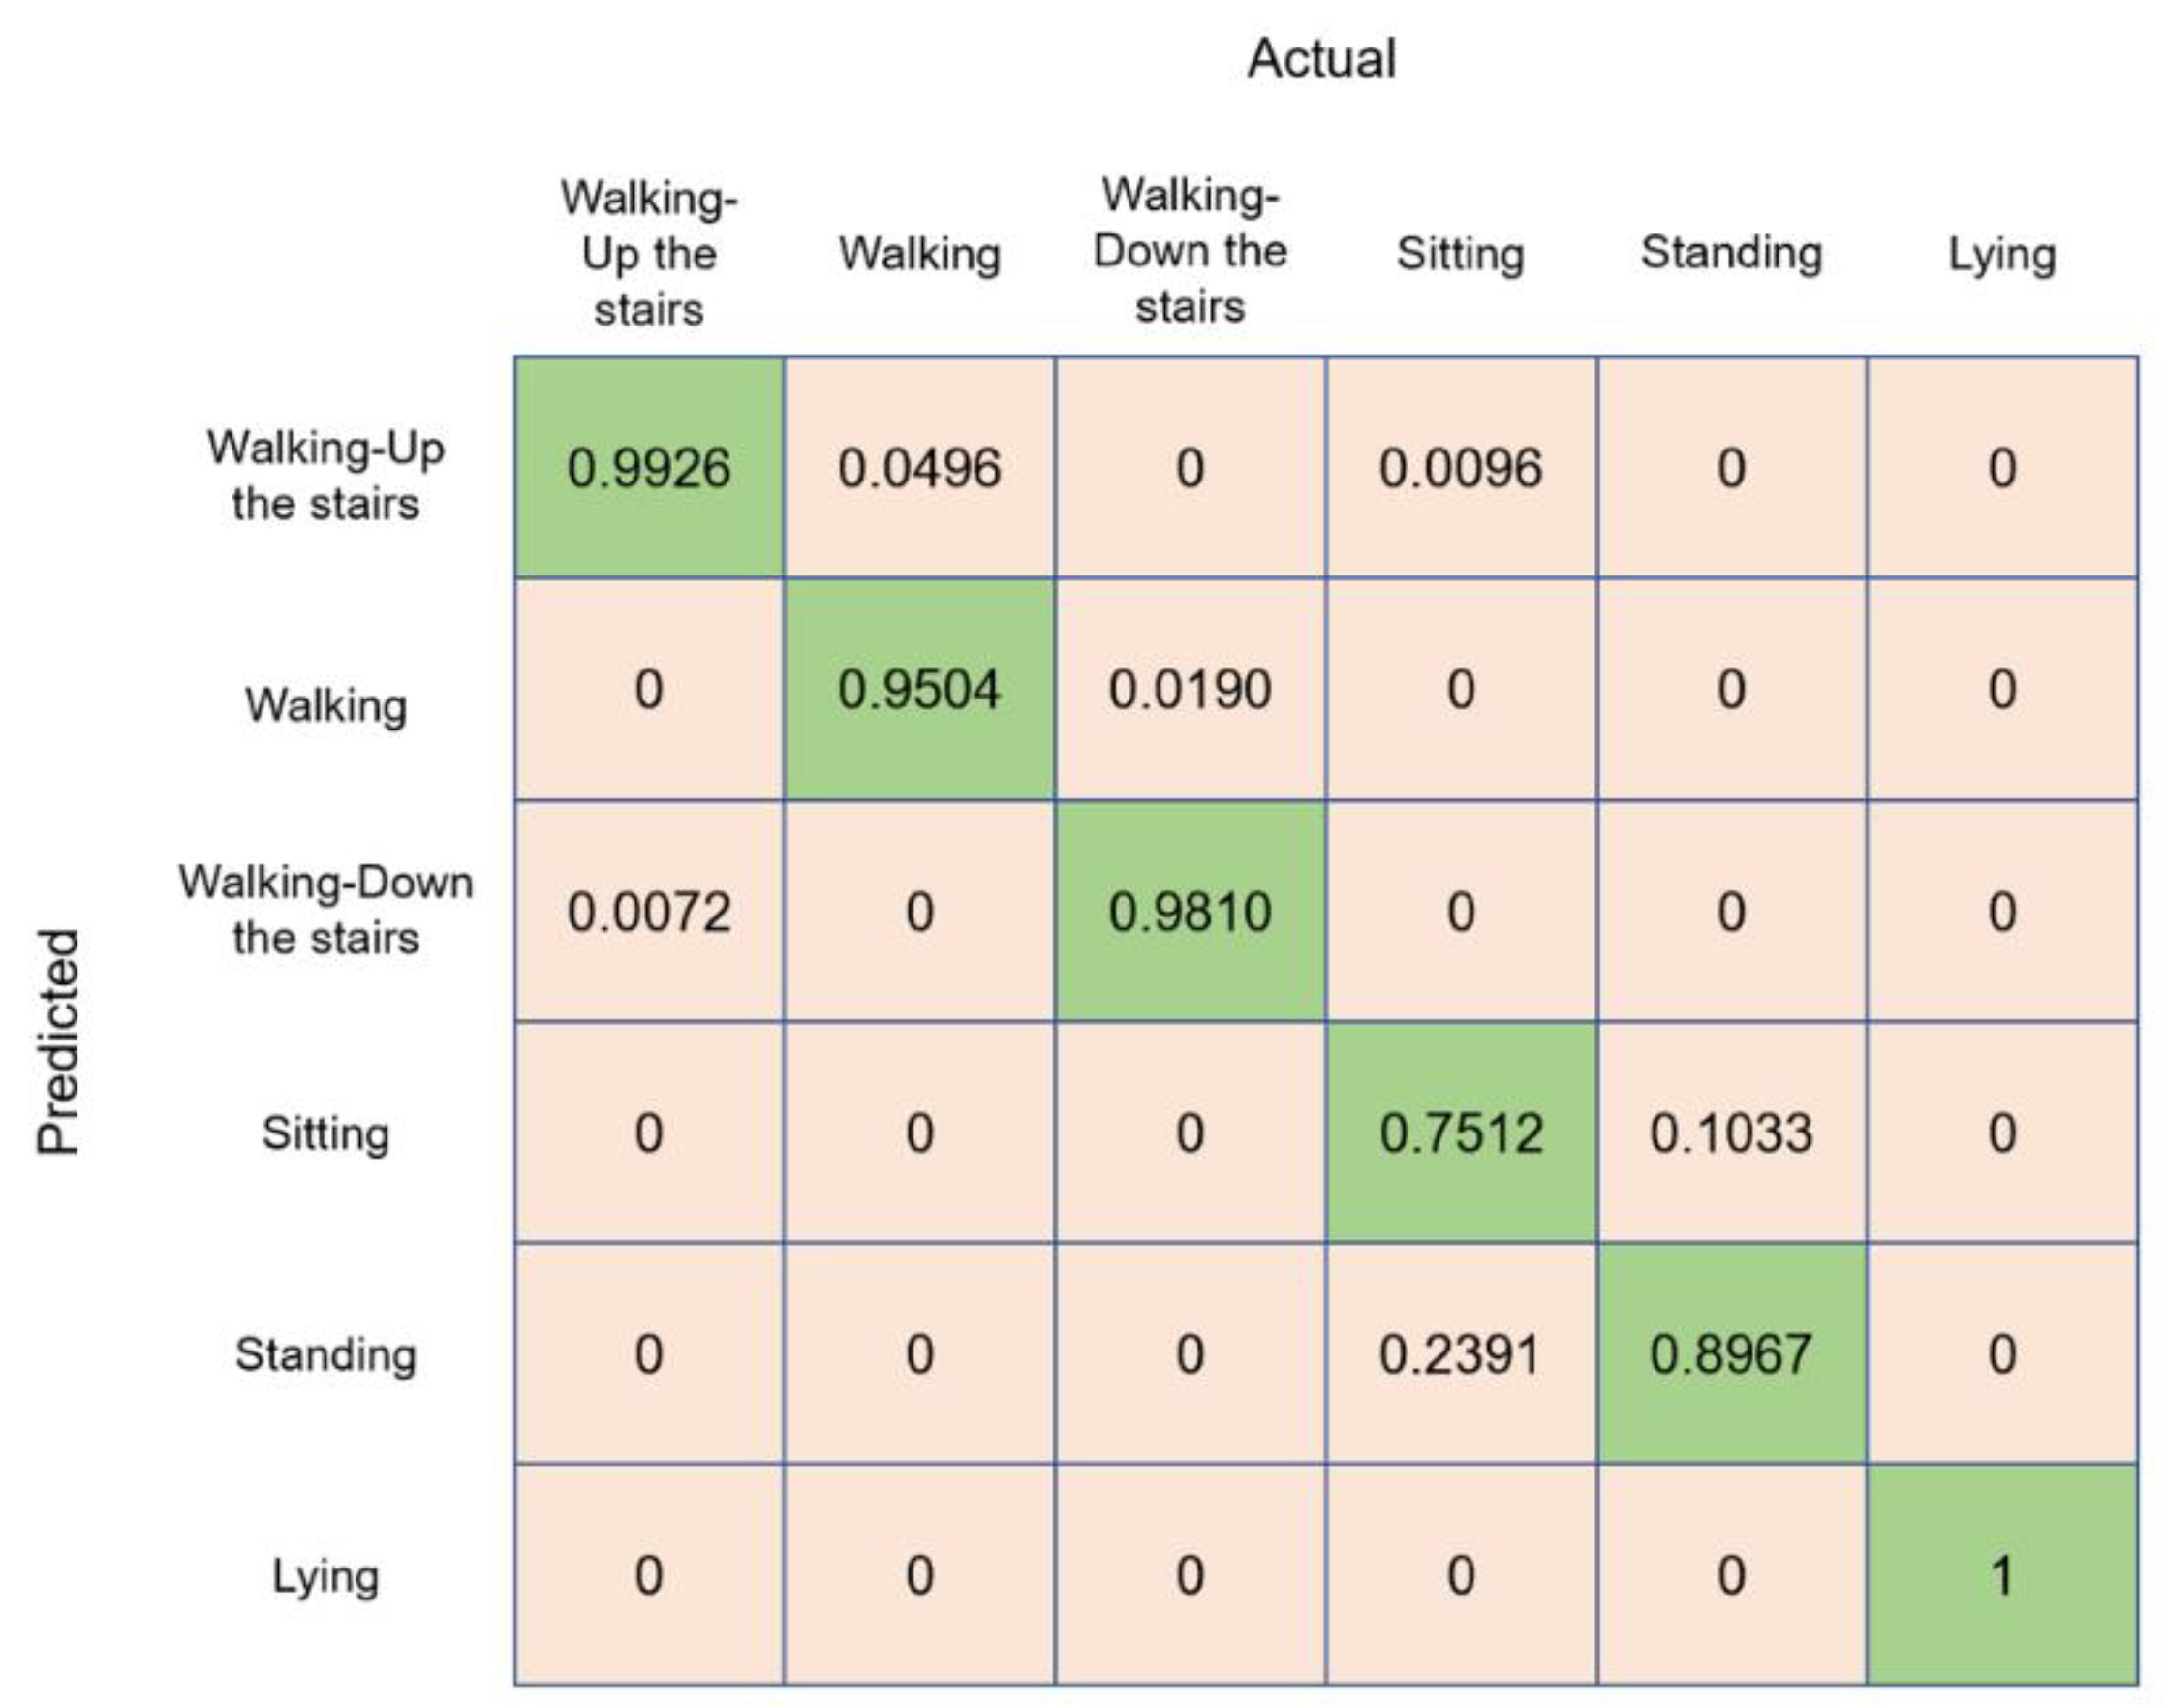
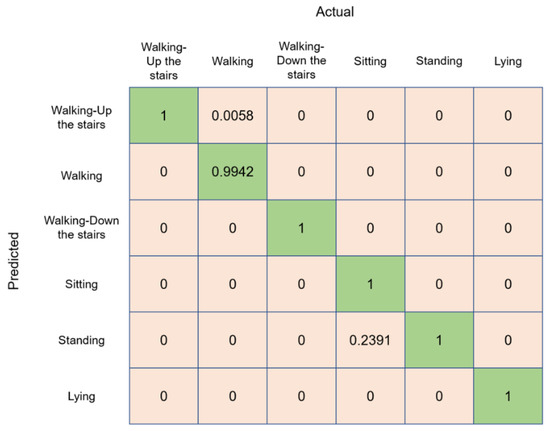
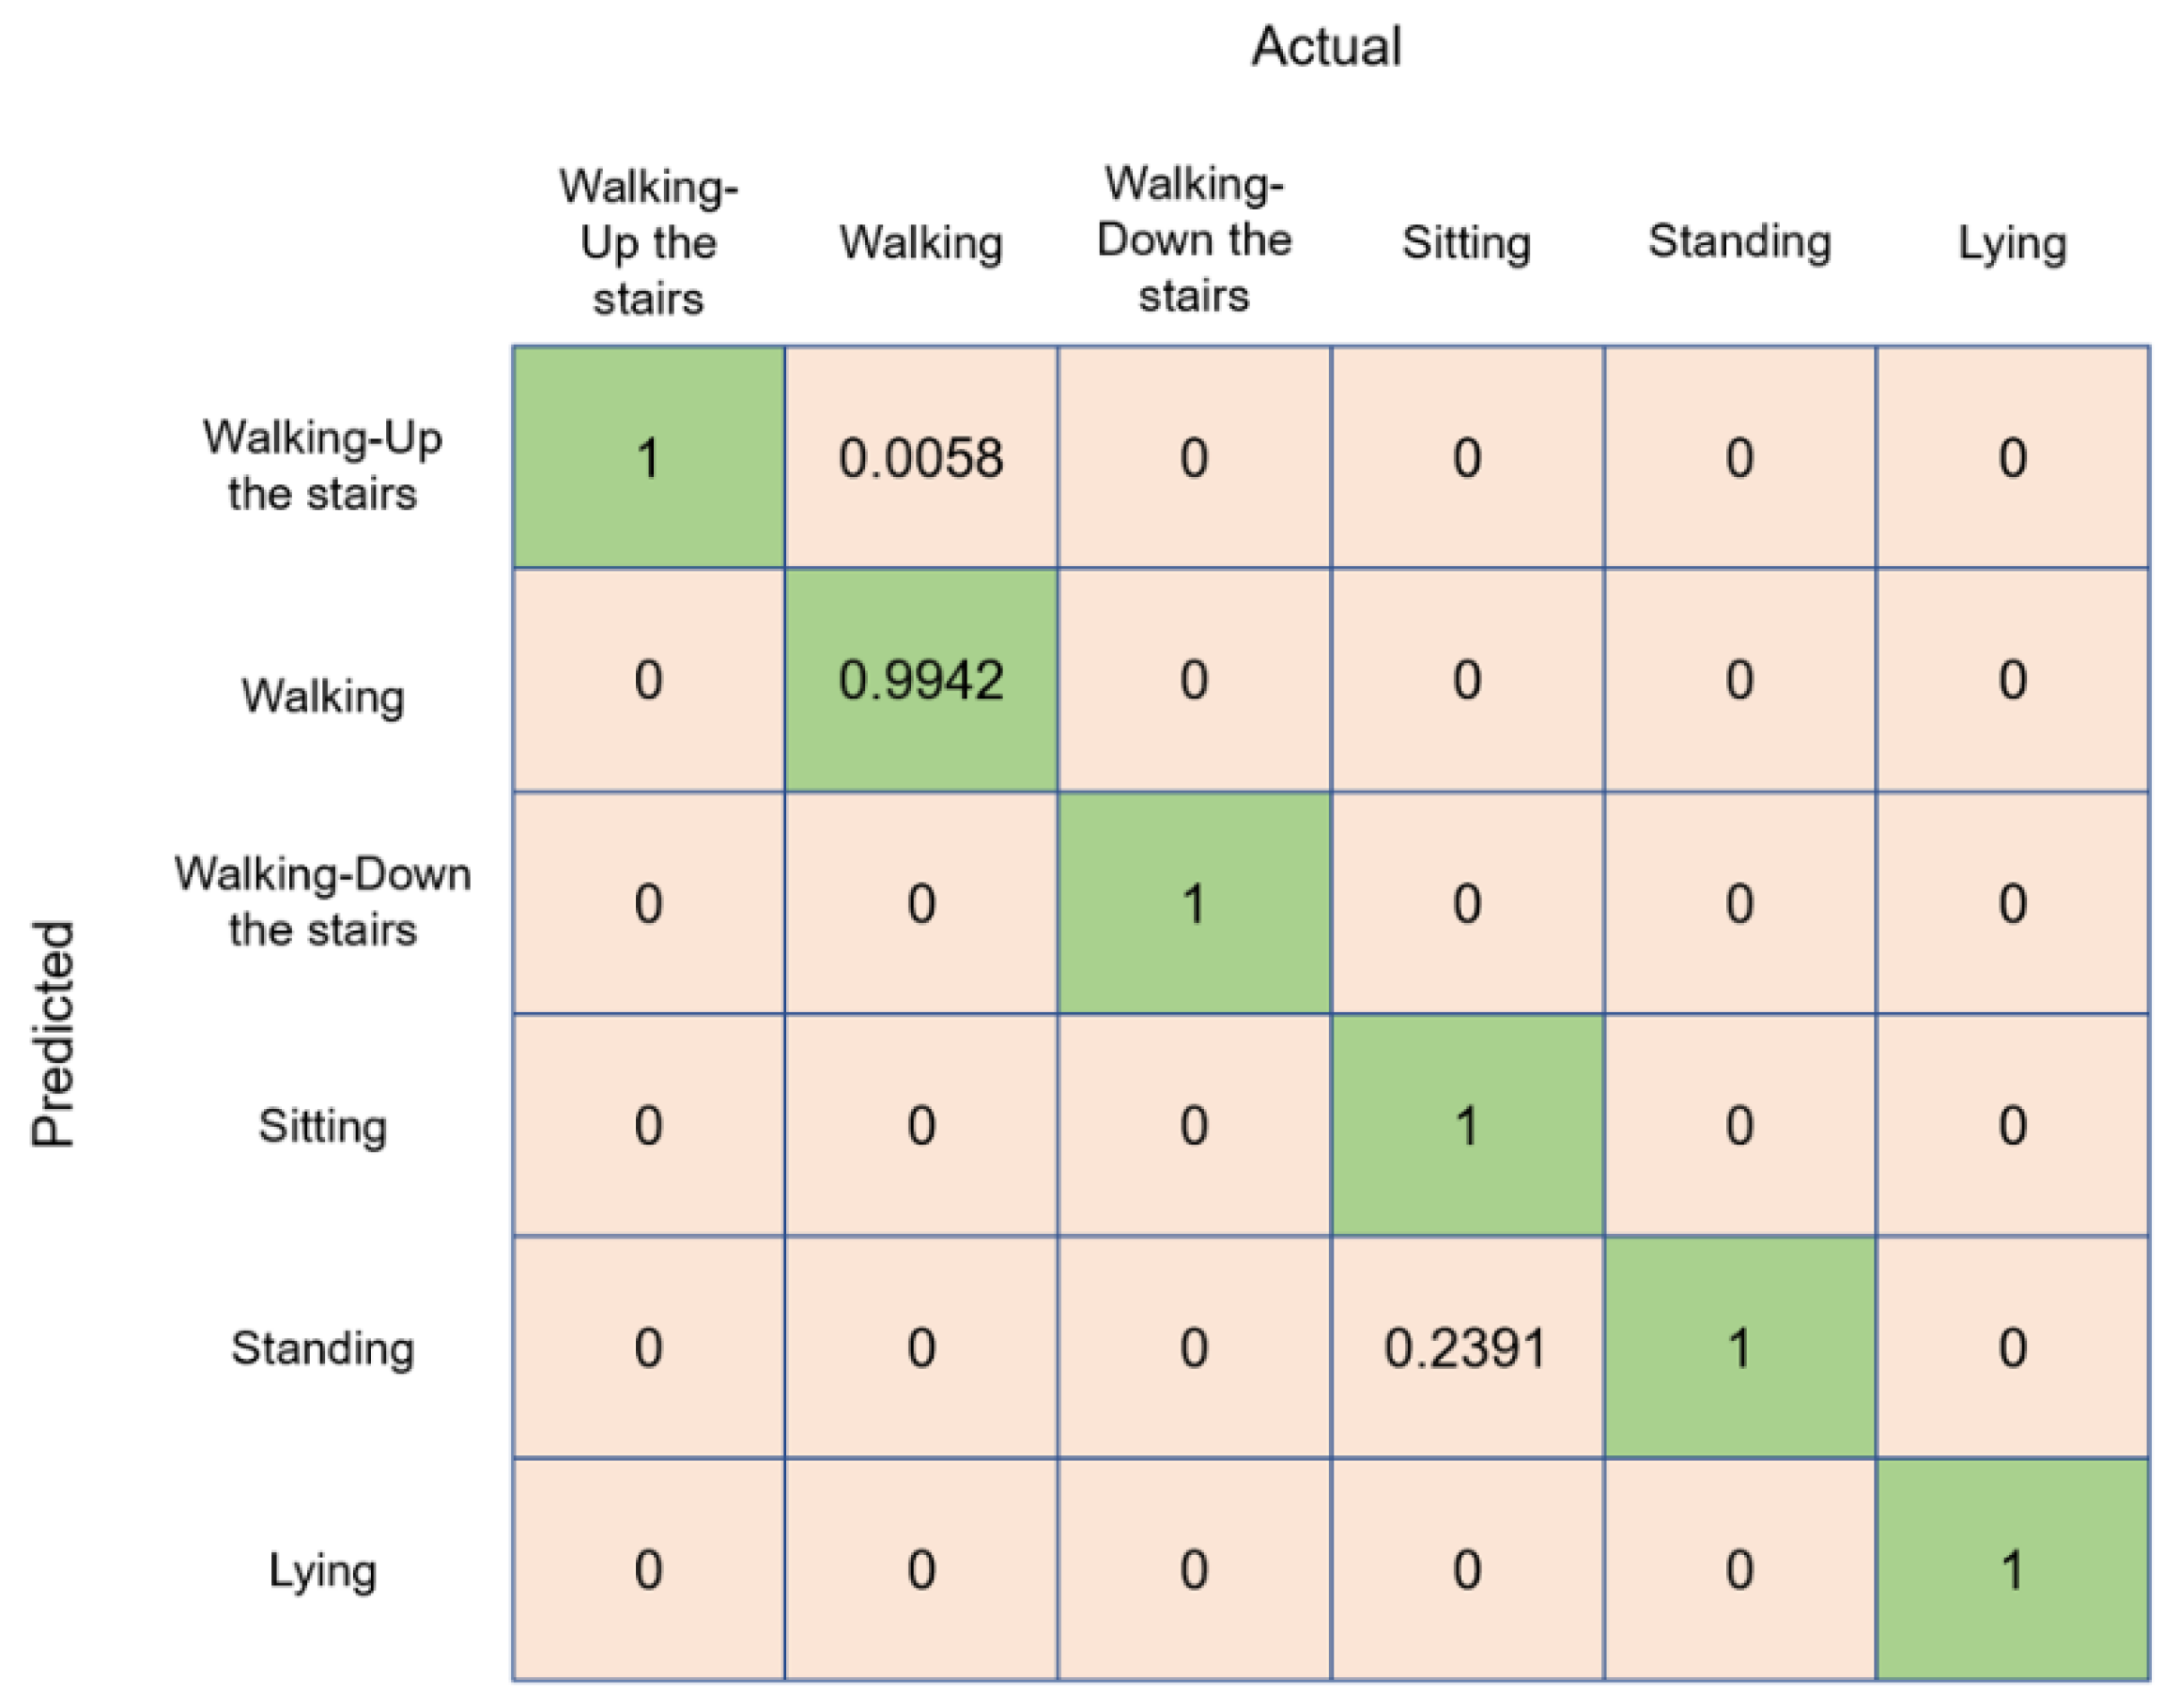
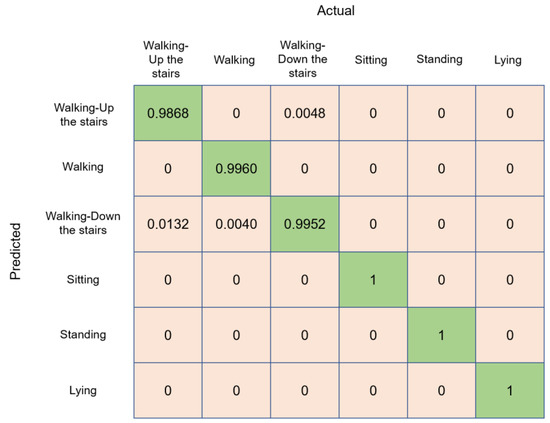
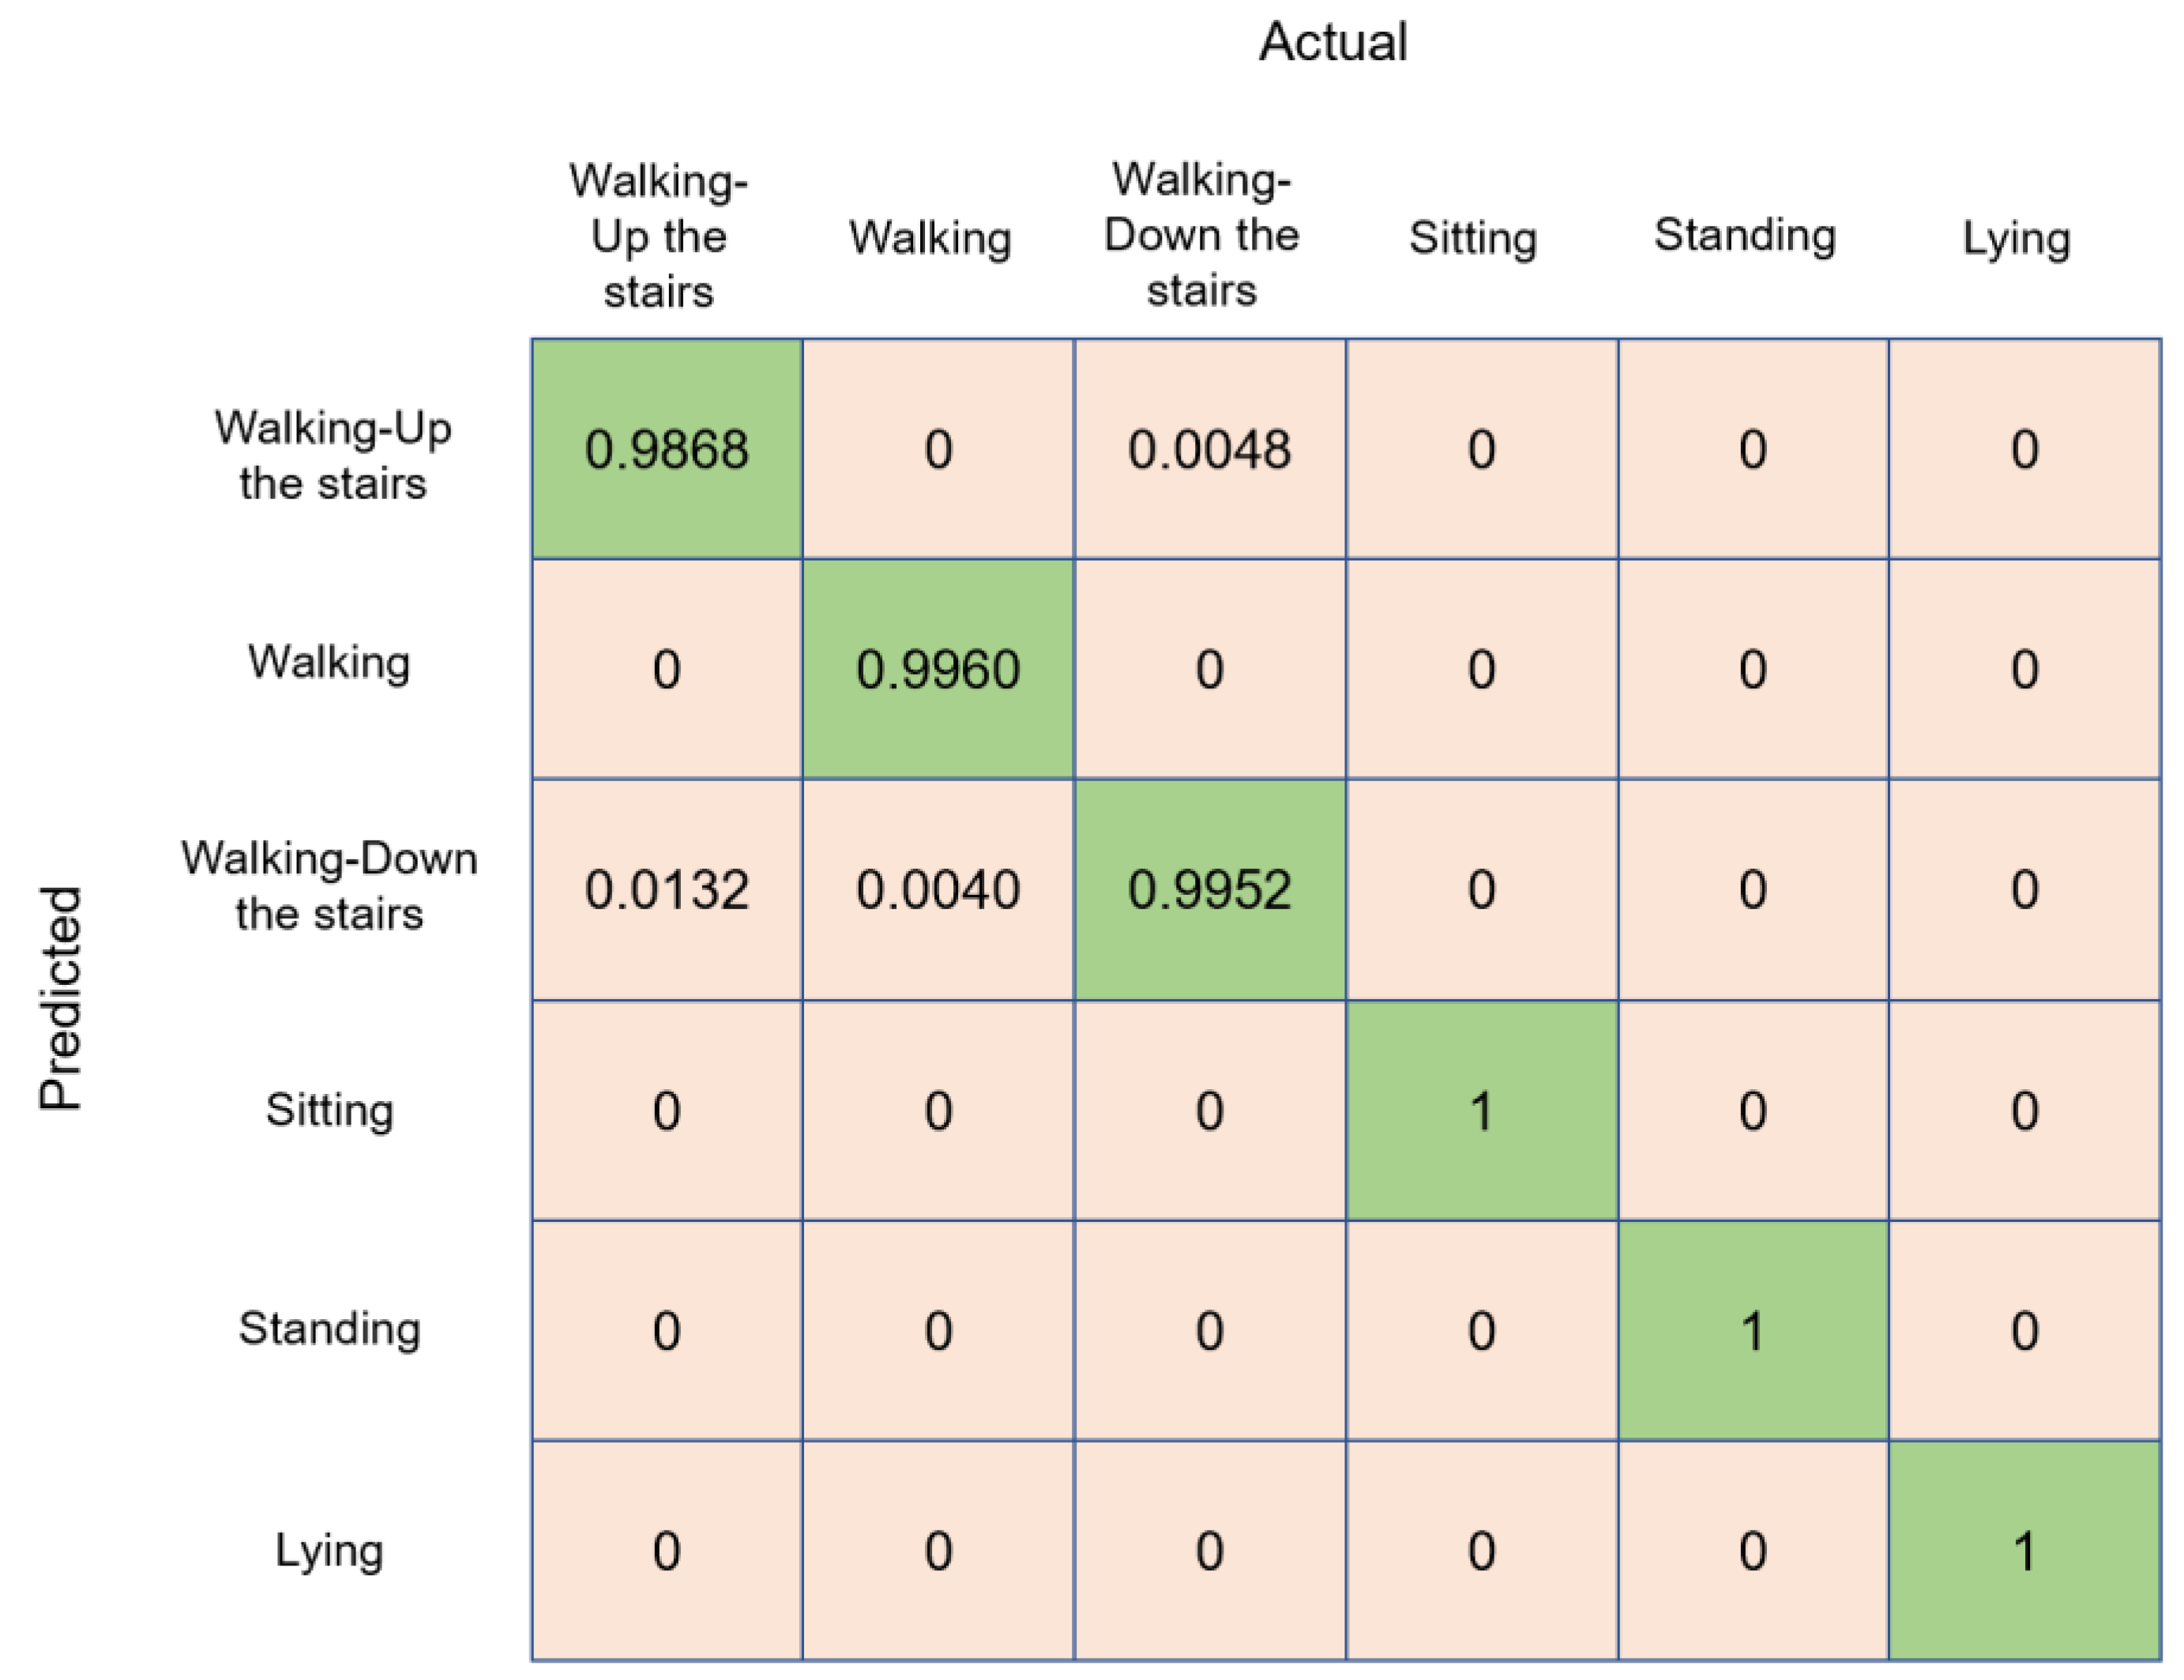
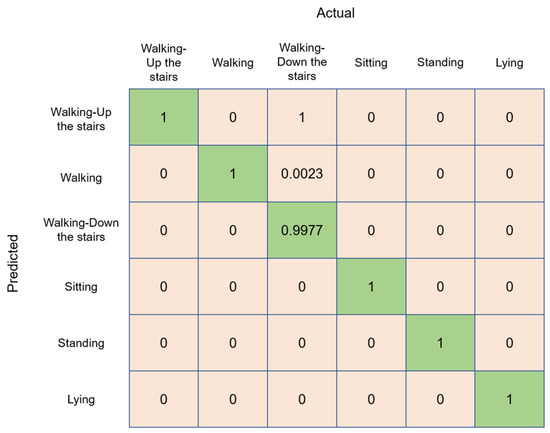
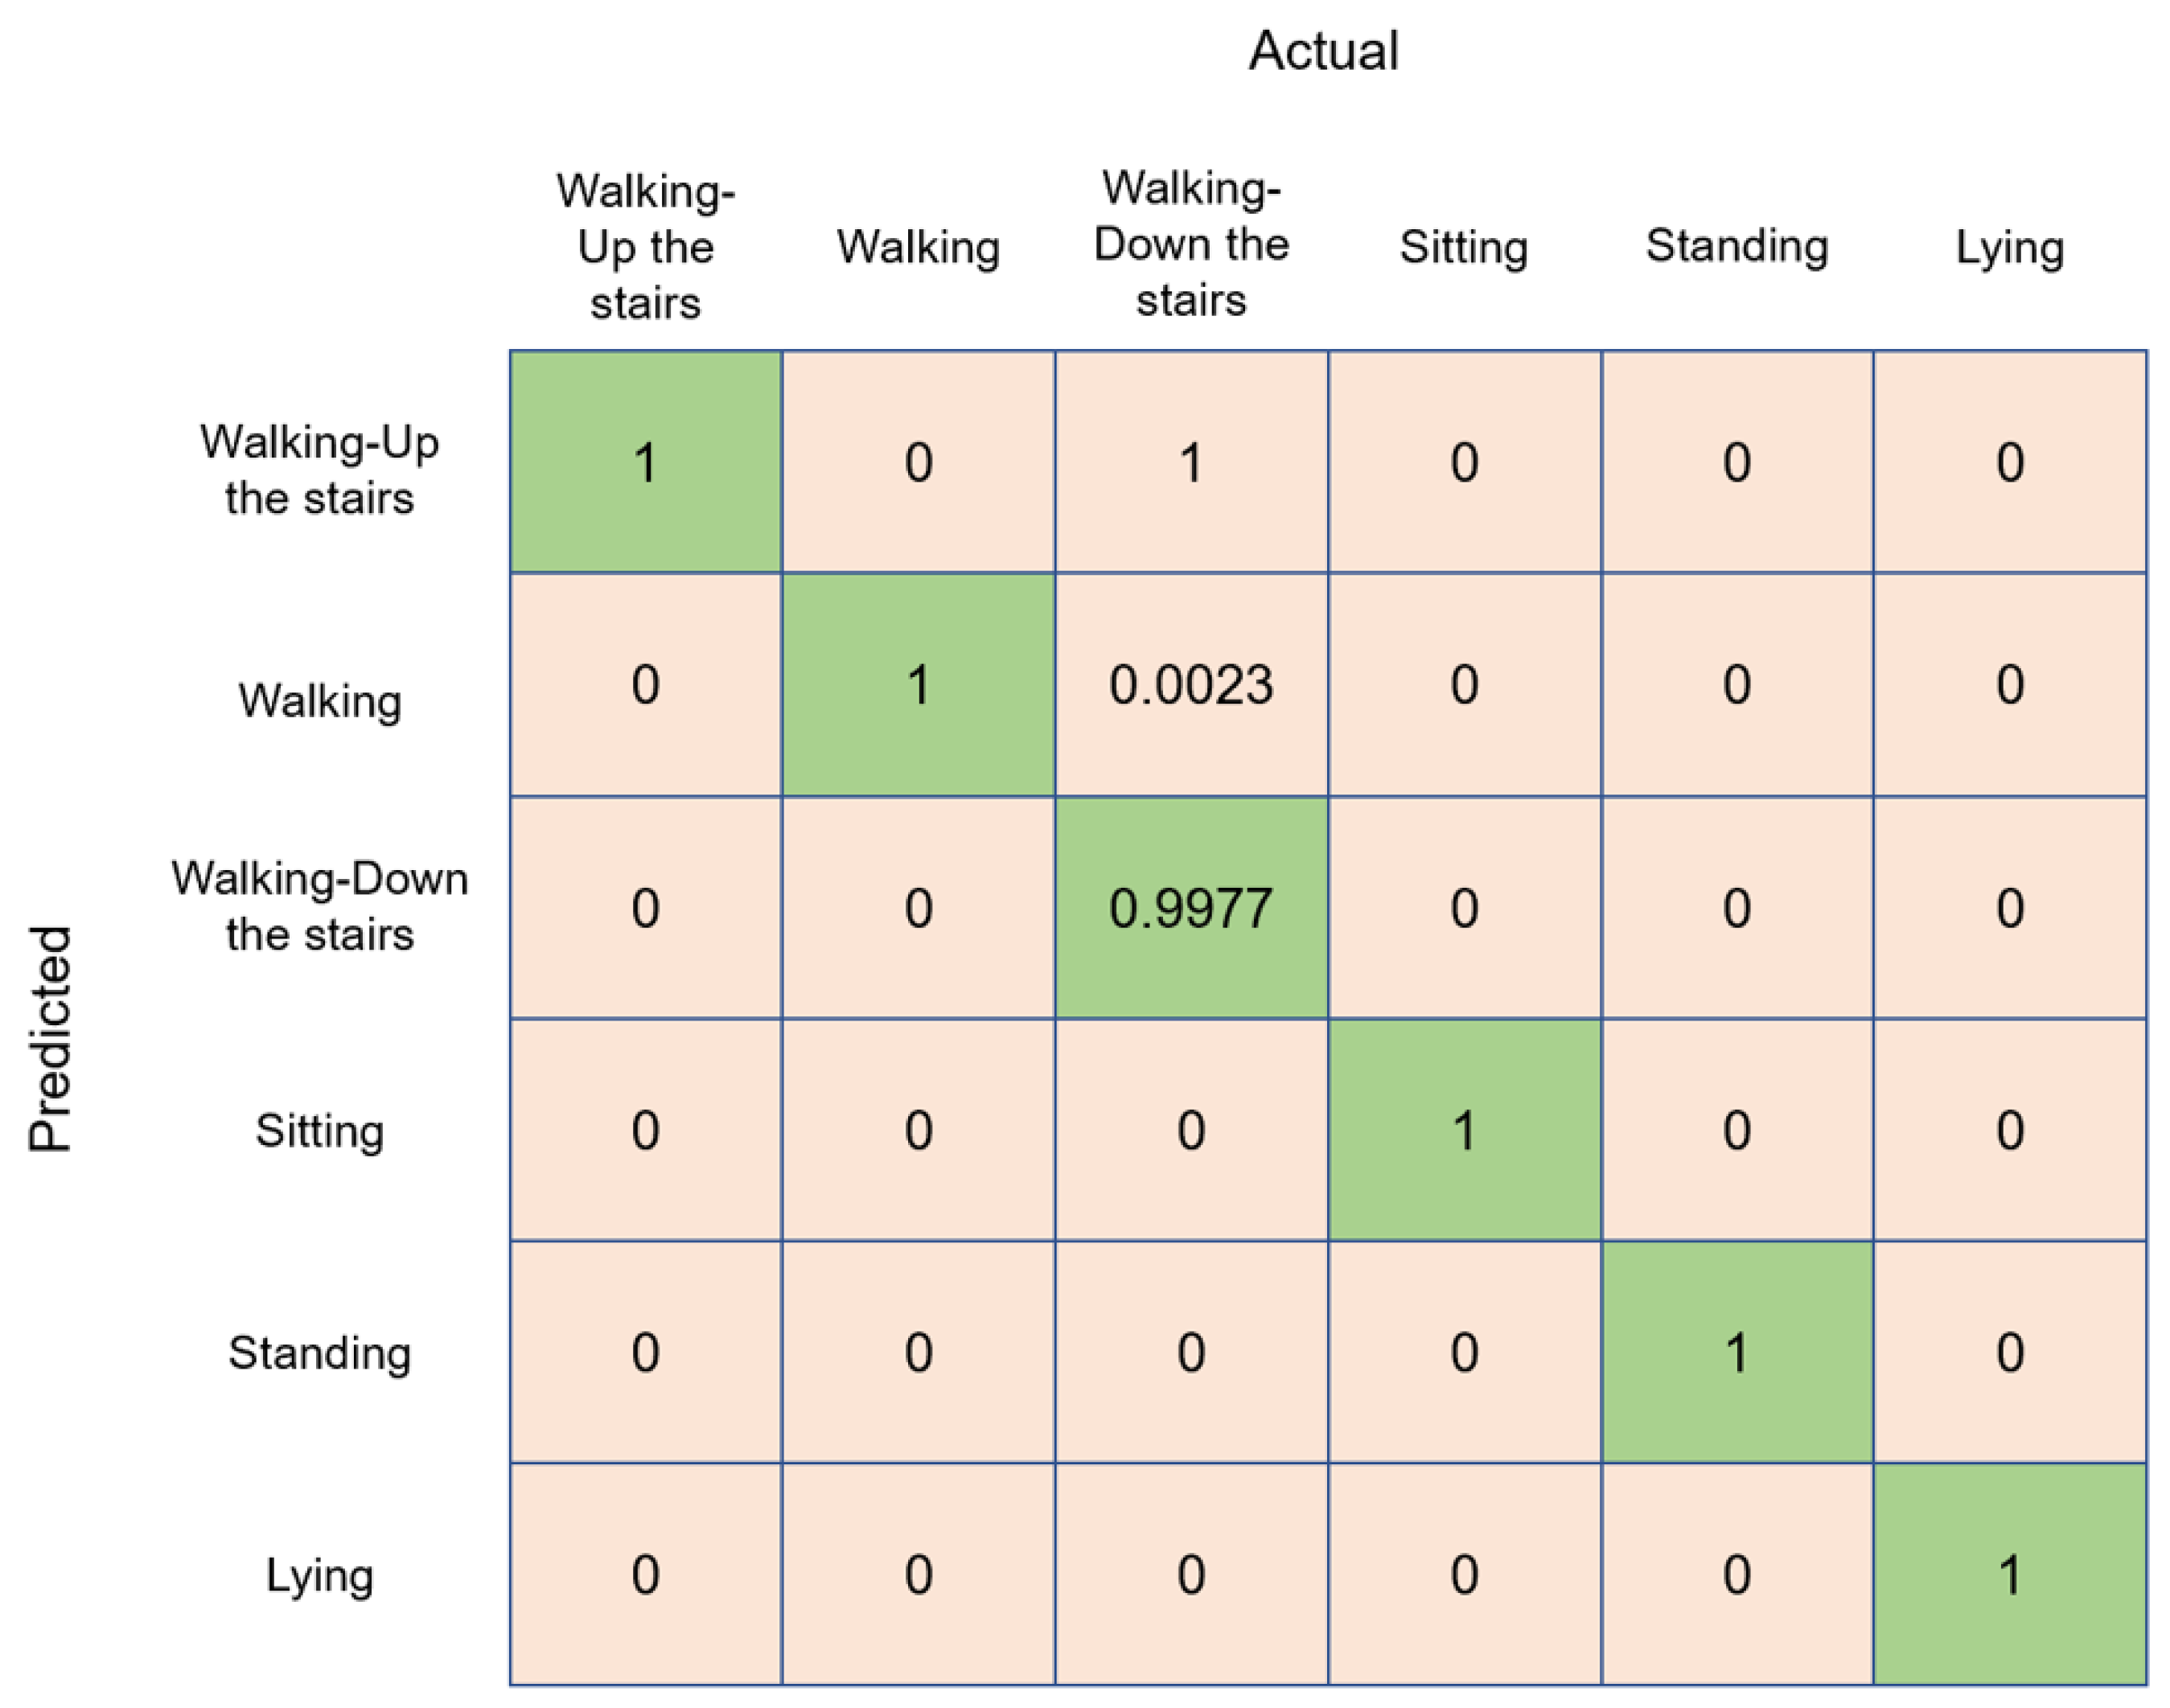
The normalized confusion matrices of the SVSL method, DL, GLM, RF, and AdaBoost are shown in Figure 5, Figure 6, Figure 7, Figure 8 and Figure 9. Each confusion matrix contains the sum of the rightly classified and misclassified classes. The diagonal of the matrix represents the rightly classified class details.
Figure 5.
Normalized confusion matrix for the deep learning (DL) algorithm.
Figure 6.
Normalized confusion matrix of the Generalized Linear Model (GLM).
Figure 7.
Normalized confusion matrix of Random Forest (RF).
Figure 8.
Normalized confusion matrix of the AdaBoost method.
Figure 9.
Normalized confusion matrix of the SVSL method.
Figure 5 depicts the conventional and normalized confusion matrix for the deep-learning classifier, as we know that the matrix values in the figure can be used to compute the percentage values of the class-wise prediction accuracy. The deep-learning classifier produced the highest class-wise accuracy of 100% for the walking down the stairs and lying activities. The lowest accuracy, 93.9%, produced by the deep-learning classifier was for the standing class. The deep-learning classifier produced accuracies of 99.6%, 98.5%, 98.30%, and 96.1% for the other four activities—walking, walking up the stairs, walking down the stairs, and sitting, respectively. It should be noted that, as shown in Figure 4, the deep-learning classifier produced an average accuracy of 97.90% for all the classes.
Figure 6 depicts the normalized confusion matrix for the GLM. Using the confusion matrix values in the figure to compute the percentage values of the class-wise prediction accuracy, we note that the GLM classifier produced the highest accuracy of 99.3% for the lying position. The lowest accuracy, 83.3%, was for the standing activity. The GLM classifier produced accuracies of 88.8%, 92.1%, 93.6%, and 88.4% for the other four activities—Walking Up the stairs, Walking, Walking Down the stairs, and Sitting, respectively. It should be noted that, as shown in Figure 4 the GLM classifier produced an average accuracy of 90.84% for all the classes.
Figure 7 depicts the conventional and normalized confusion matrix for the RF classifier. Using the confusion matrix values in the figure to compute the percentage values of the class-wise prediction accuracy, we note that the RF classifier produced the highest accuracy of 100% for the lying position. The lowest accuracy, 94.7%, was for the standing activity. The RF classifier produced accuracies of 98.5%, 99.2%, 99.5%, and 97.1% for the other four activities—walking up the stairs, walking, walking down the stairs, and sitting, respectively. It should be noted that, as shown in Figure 4, the RF classifier produced an average accuracy of 98.09% for all the classes.
Figure 8 depicts the normalized confusion matrix for the AdaBoost classifier. Using the confusion matrix values in the figure to compute the percentage values of the class-wise prediction accuracy, we note that the AdaBoost classifier produced the highest accuracy of 99.4% for the lying position. The lowest accuracy, 90.9%, was for the standing activity. The AdaBoost classifier had accuracies of 98.2%, 97.6%, 98.5%, and 92.2% for the other four activities—Walking Up the stairs, Walking, Walking Down the stairs, and Sitting, respectively. It should be noted that, as shown in Figure 4, the AdaBoost classifier produced an average accuracy of 96.13% for all the classes.
Figure 9 depicts the conventional and normalized confusion matrix for the SVSL method. Using the confusion matrix values in the figure to compute the percentage values of the class-wise prediction accuracy, we note that the SVSL method produced the highest accuracy of 100% for the lying position. The lowest accuracy, 98.3%, was for the standing position. The SVSL method produced accuracies of 99.1%, 99.6%, 99.8%, and 98.9% for the other four activities—walking up the stairs, walking, walking down the stairs, and sitting, respectively. It should be noted that, as shown in Figure 4, the SVSL method produced an average accuracy of 99.26% for all the classes.
The SVSL method performed better than all the other five classifiers: DL, GLM, RF, AdaBoost, and Stacking. The proposed method outperformed GLM and performed better than DL and RF, producing a prediction accuracy that was 8.24%, 1.36%, and 1.17% better, respectively, before the execution of the self-training mechanism. After self-training, the accuracy further increased, but very slightly. However, this topic requires further investigation. From Figure 4, Figure 5, Figure 6, Figure 7, Figure 8 and Figure 9 it can be seen that the SVSL method not only produced a better HAR accuracy, but it could also predict the classes of sitting and standing far more accurately than DL, GLM, and RF.
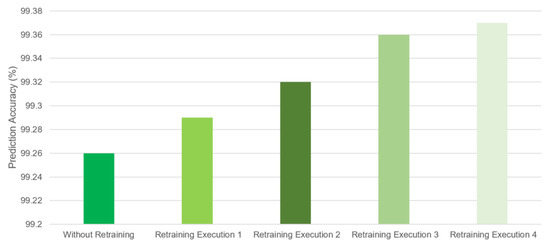
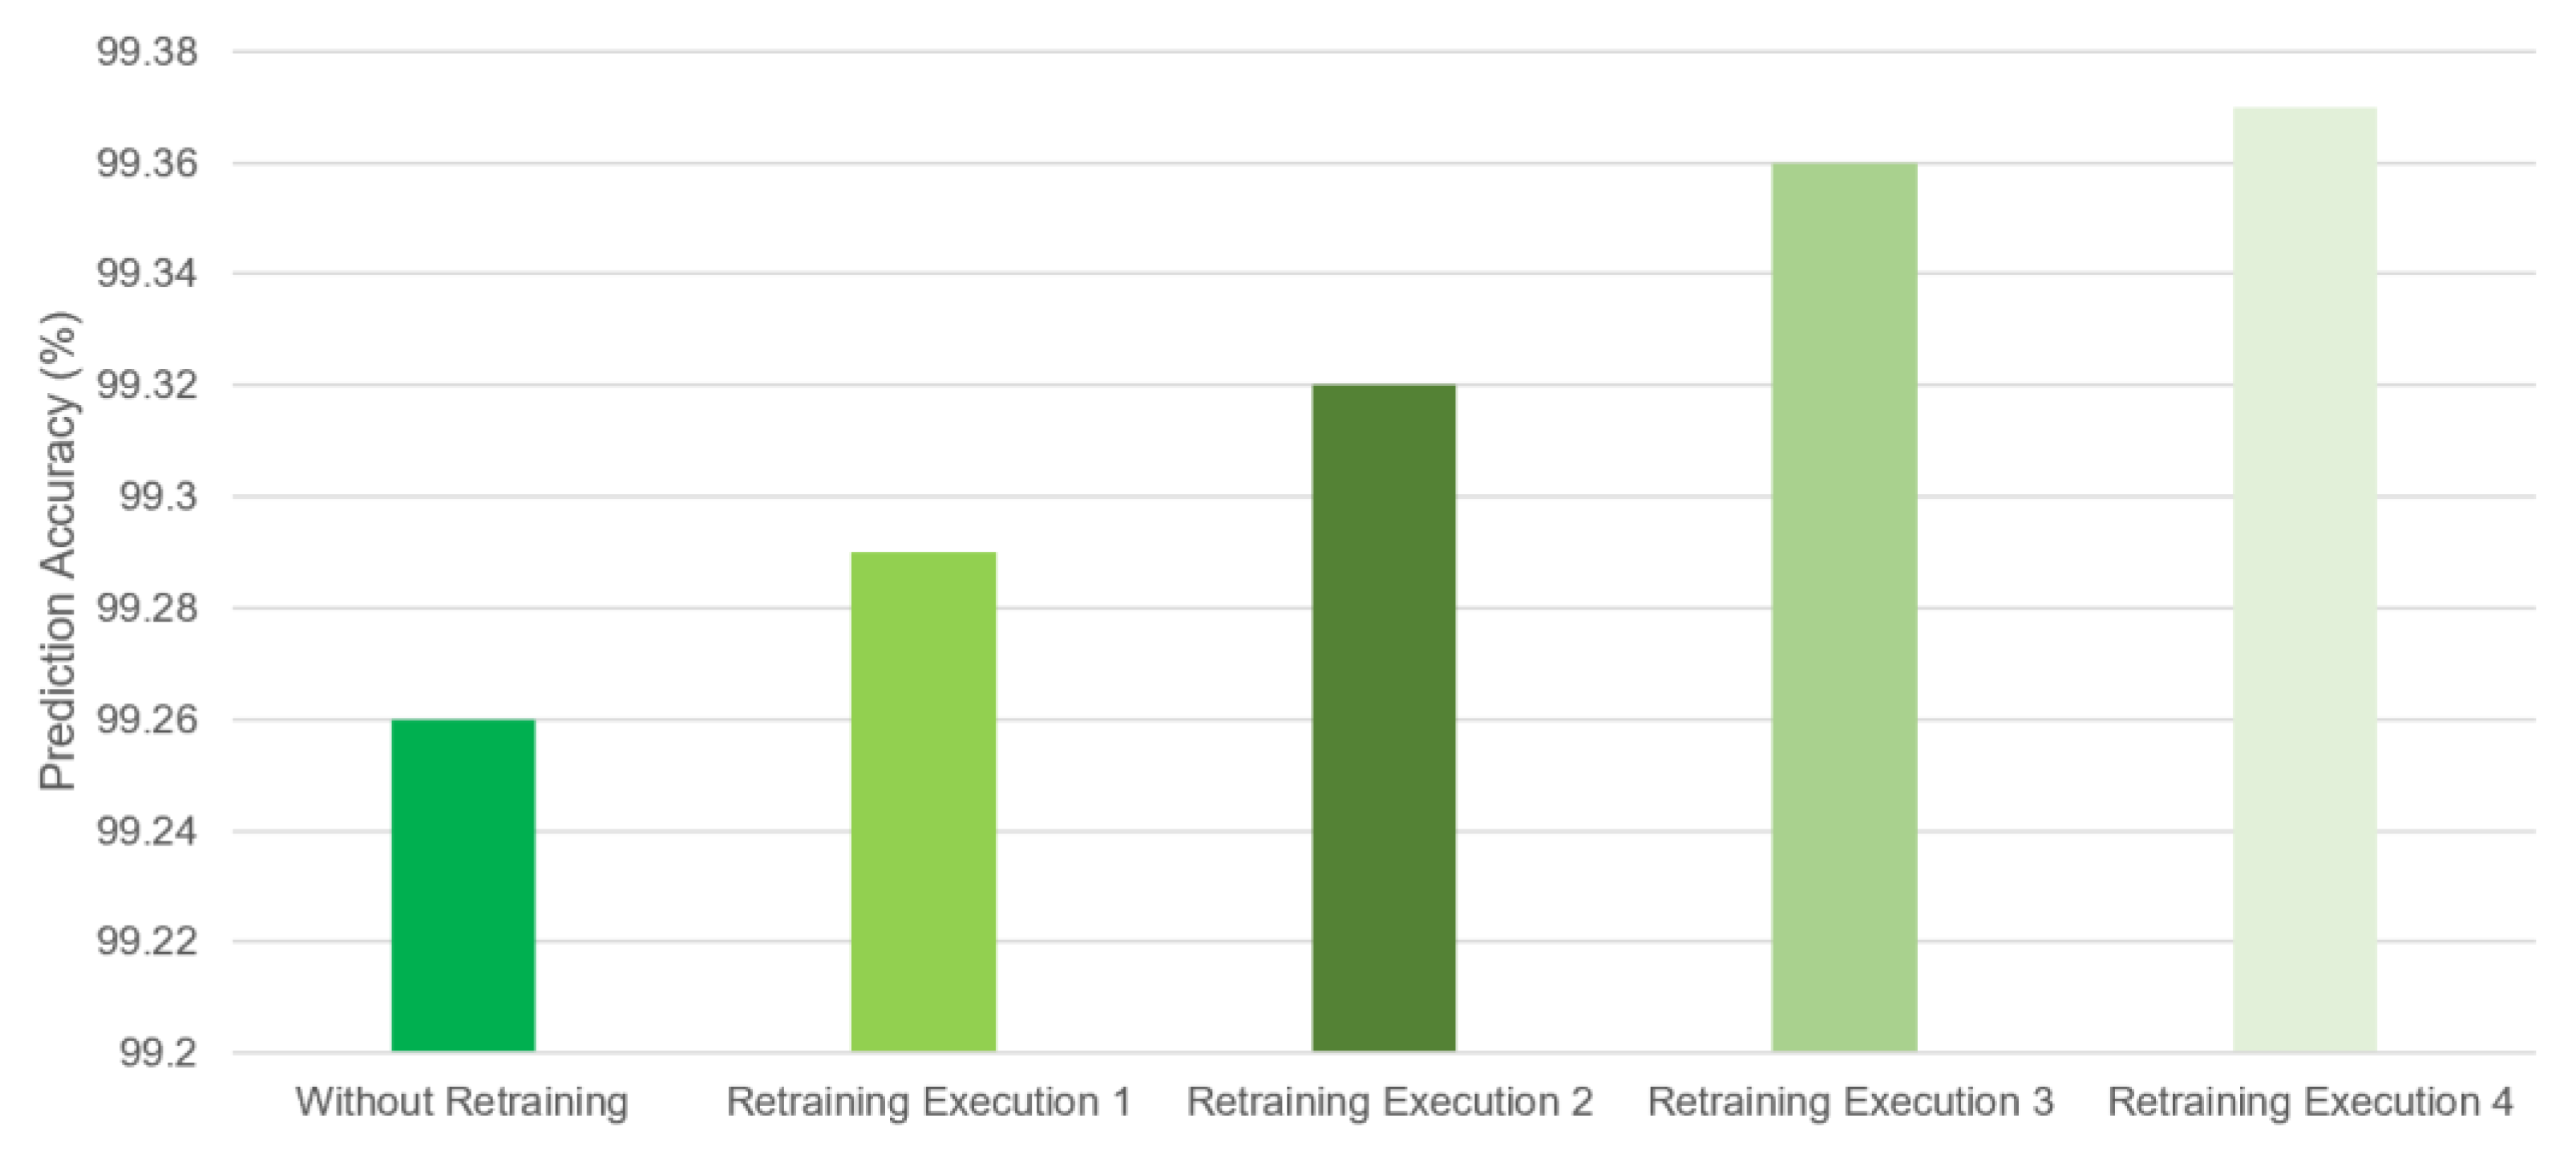
Figure 10 depicts the average accuracy gain after every self-training. Without retraining, the SVSL method produced an average accuracy of 99.26% for all the classes. The average accuracy of the SVSL method increased by 0.11% after five executions of the self-training mechanisms.
Figure 10.
Comparison of the SVSL method, with and without self-training mechanism.
4.2. Dataset II
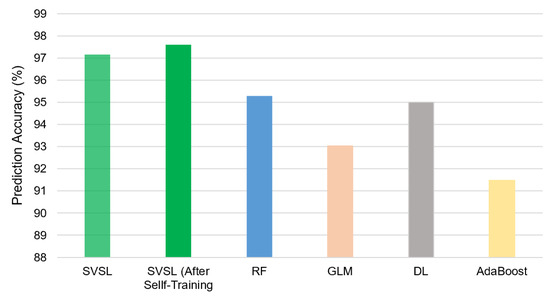
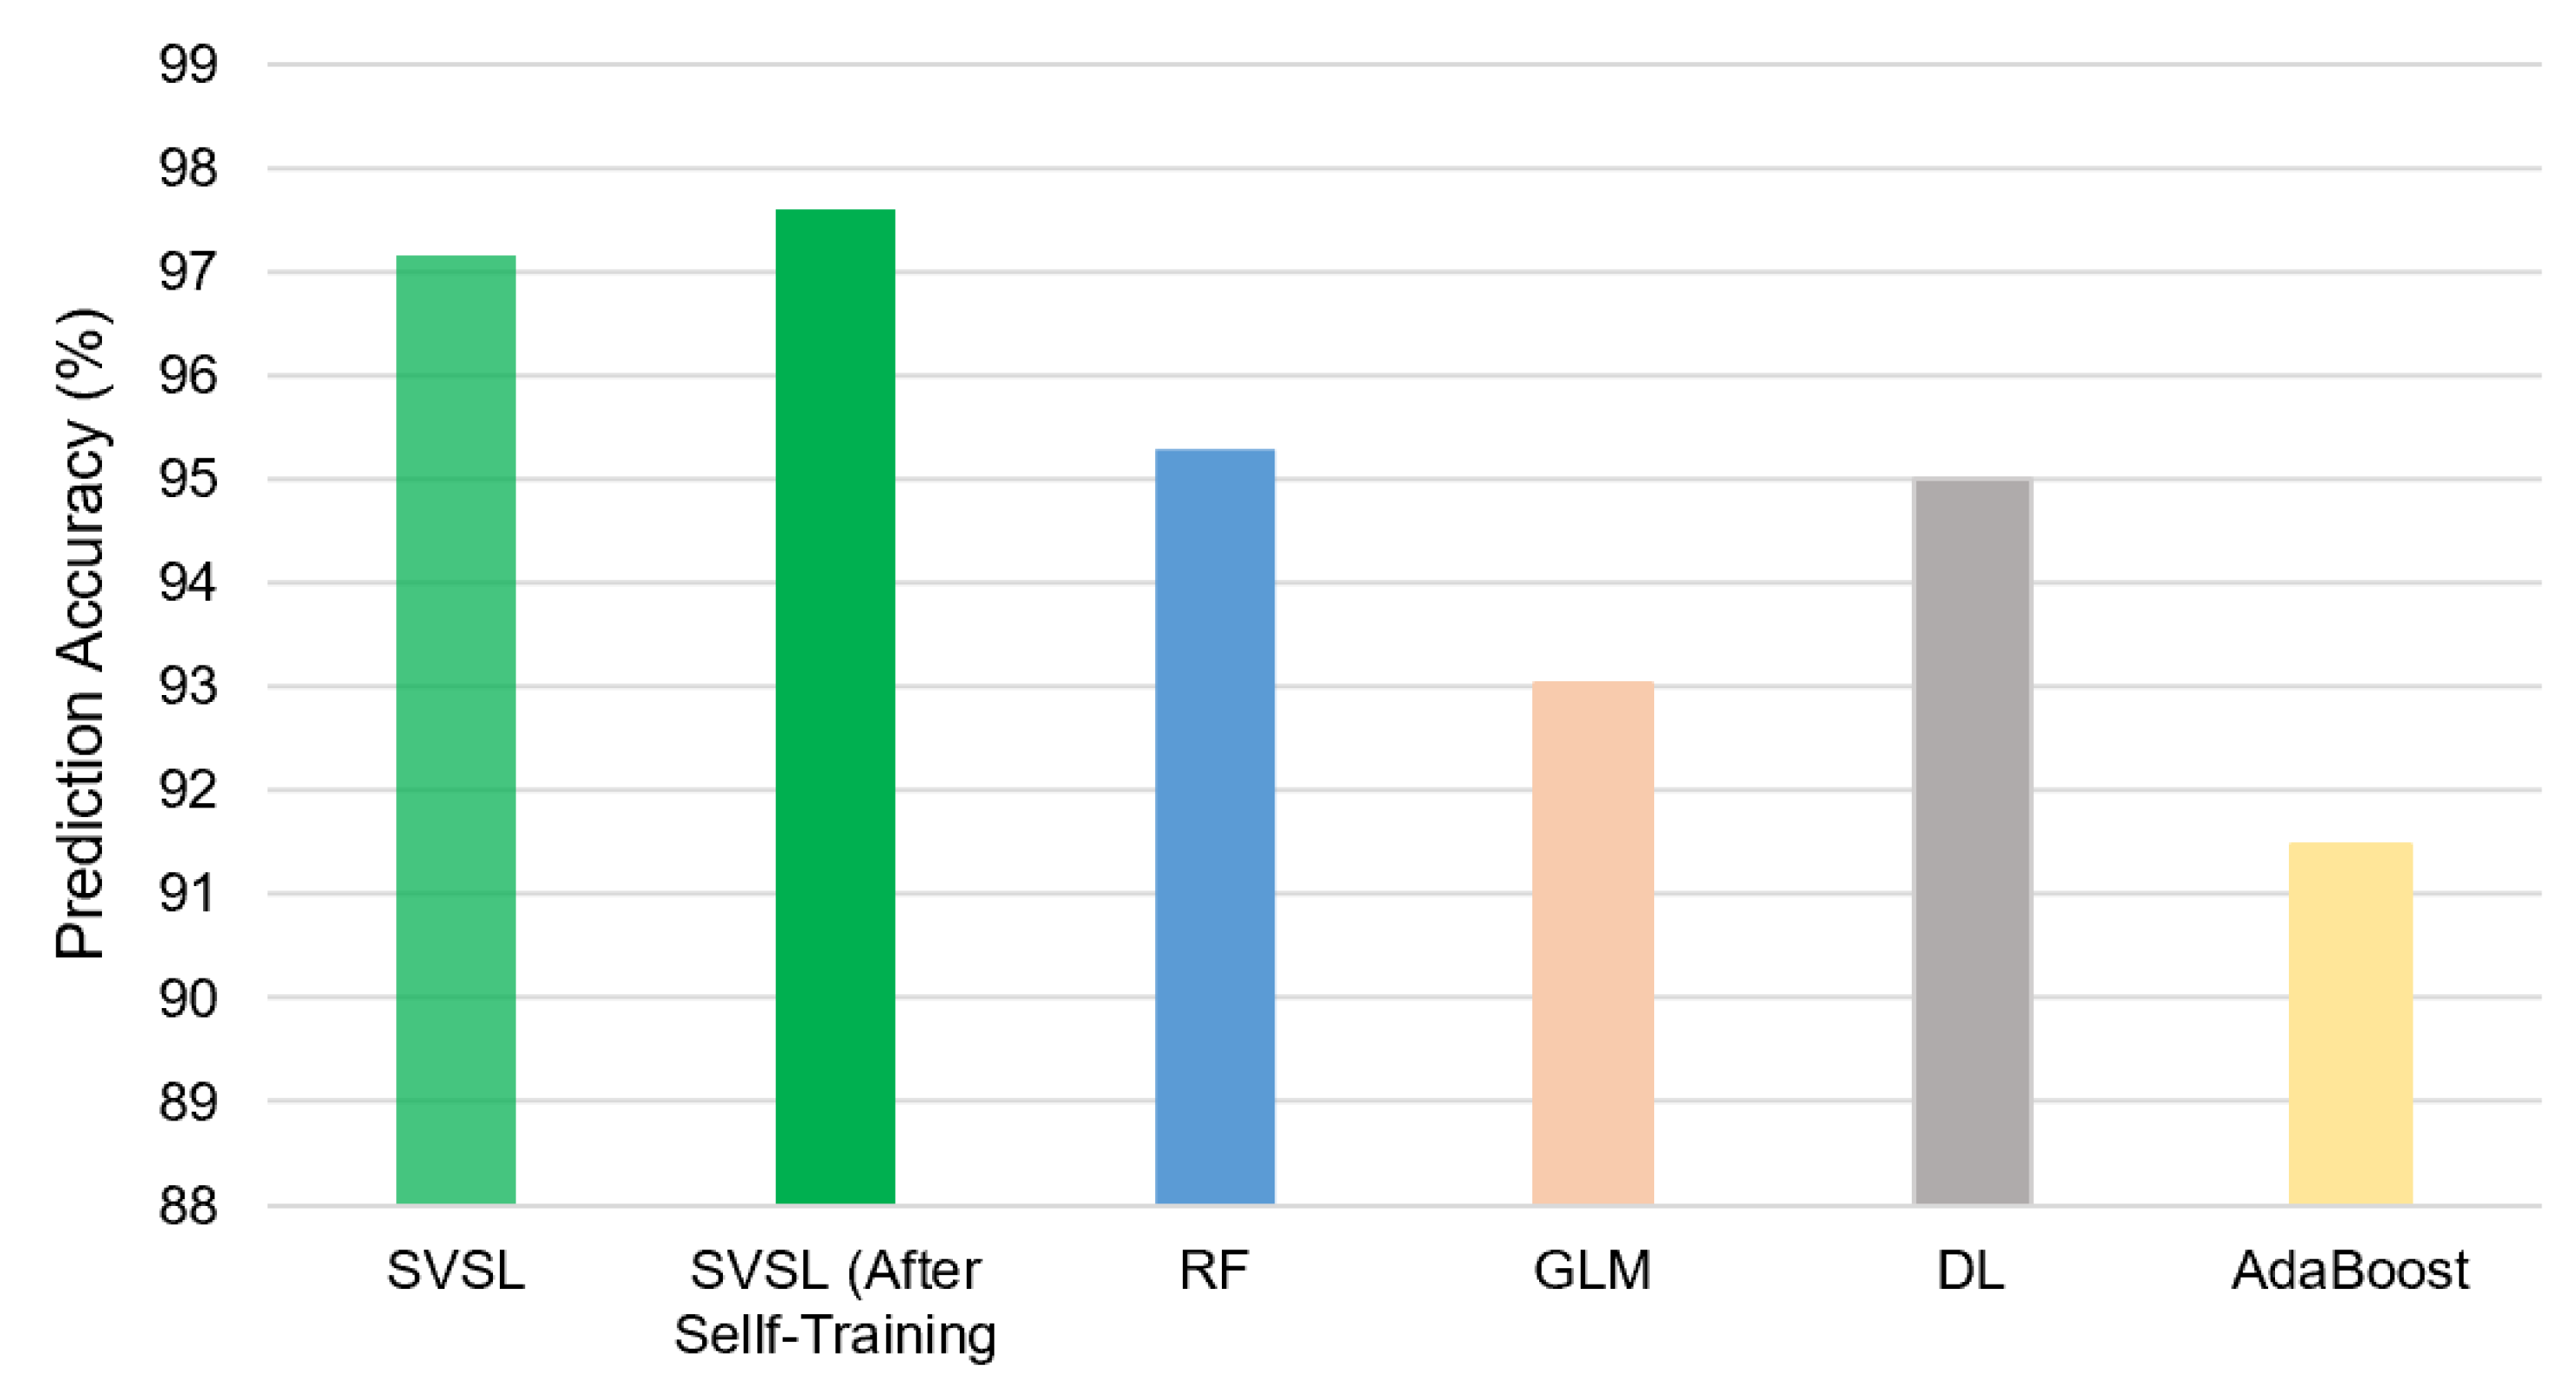
For giving more convincing evidence of the performance of the SVSL, we also tested it on another dataset [43]. We are keeping this subsection precise to avoid any further increase in paper length. Figure 11 shows that the SVSL and self-trained SVSL methods achieved an average accuracy of 97.15% and 97.59%, which is better than that of the other four classifiers, RF, GLM, DL, and AdaBoost, with 95.29%, 93.04%, 95.01%, and 91.47%, respectively. Furthermore, the SVSL method showed a 0.44% gain with the self-training mechanism, which indicates that the SVSL method can correctly classify the most difficult data instances.
Figure 11.
Prediction accuracy (%) of the SVSL methods, RF, GLM, DL, and AdaBoost.
4.3. Execution Time
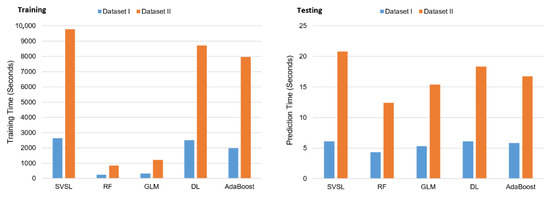
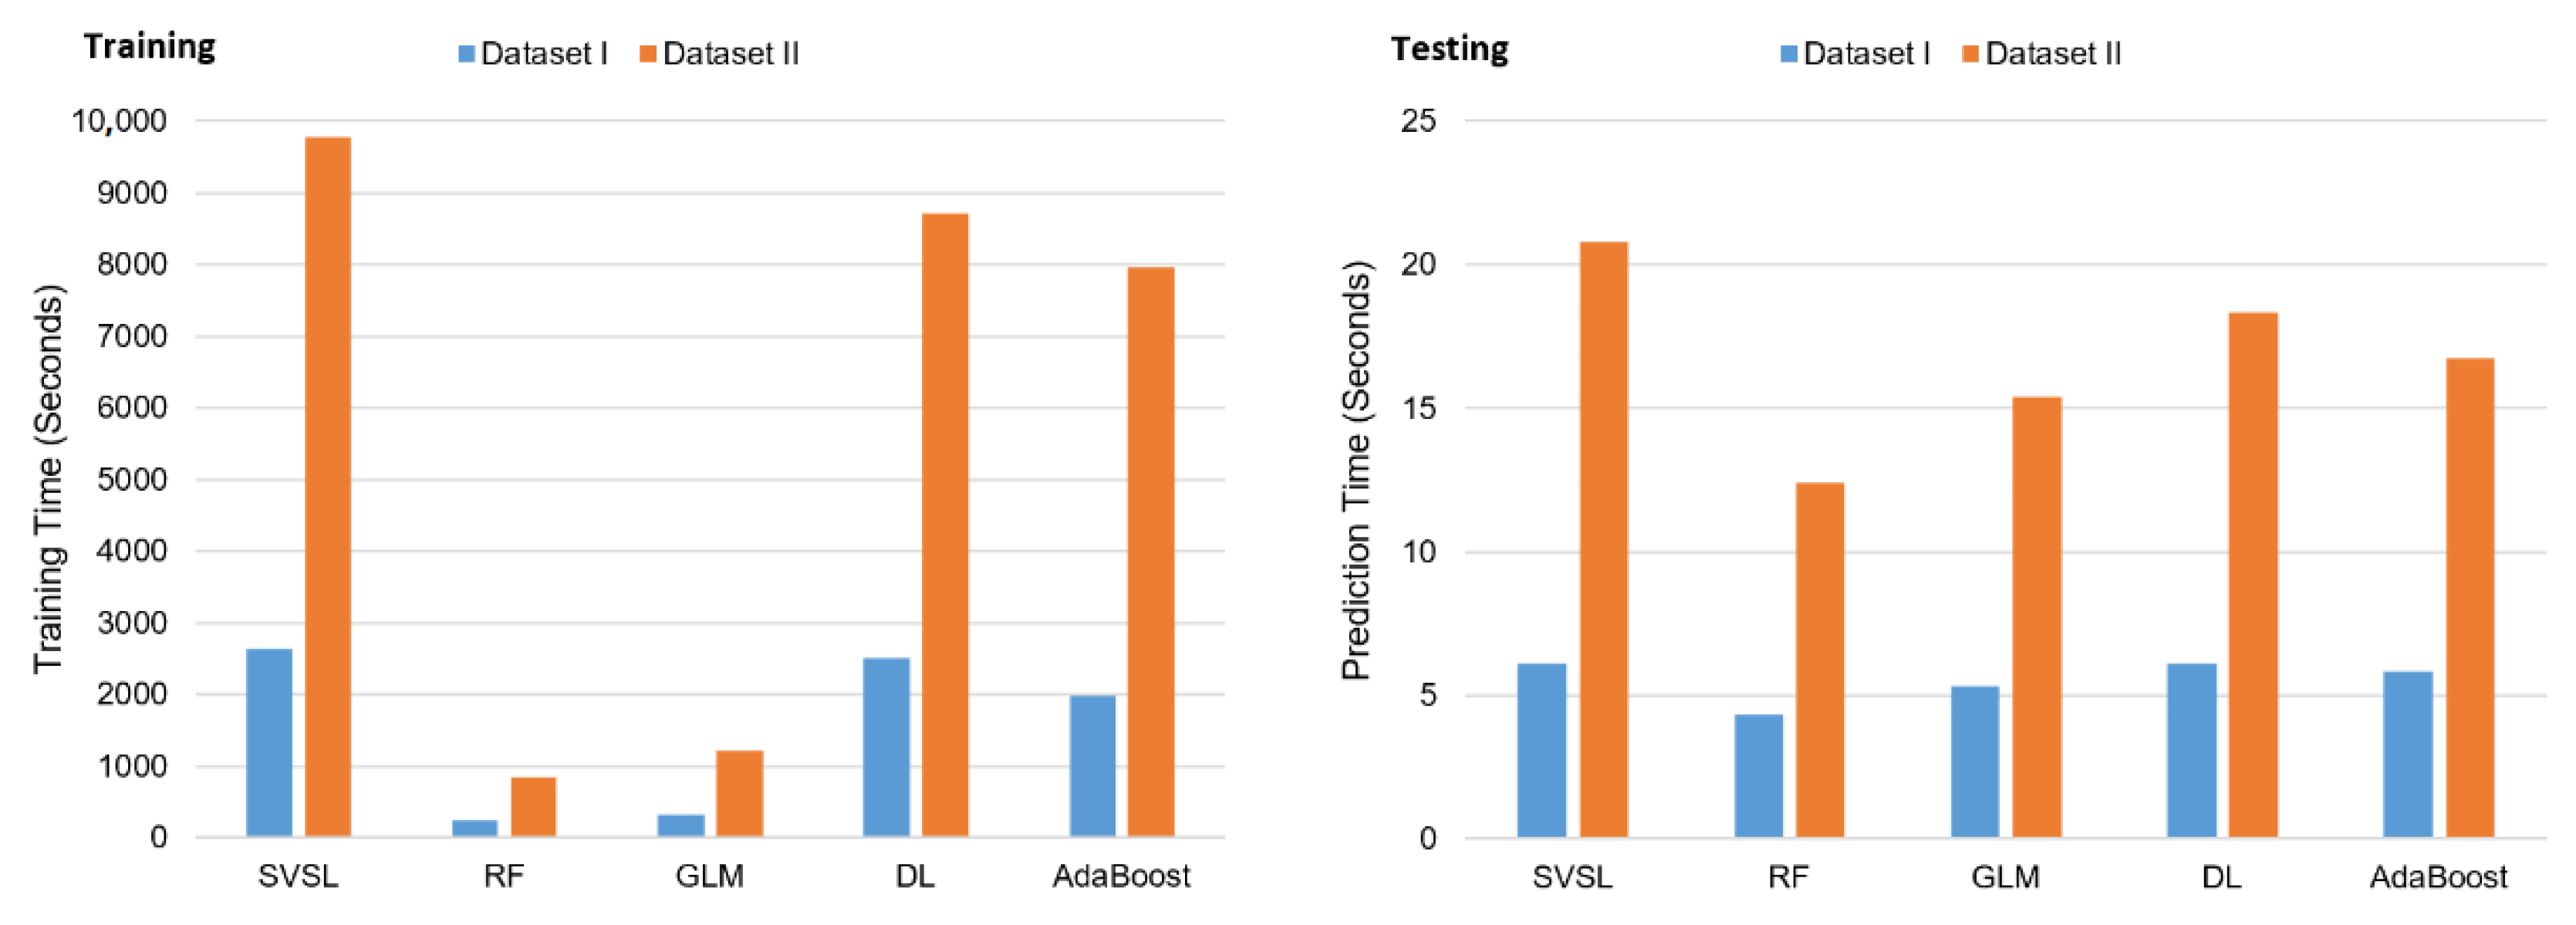
Figure 12 depicts the training and testing time of all the methods. The SVSL method consumed the maximum time in training time, which is 2640 and 9772 s for dataset-I and dataset-II. This is expected as it comprises multiple phases. The fastest training time is of RF, 245 and 849 s for dataset-I and dataset-II. Further, GLM, AdaBoost, and DL remain in second, third, and fourth position in terms of training time. Similar patterns are observed for the testing times as depicted in Figure 12. All these methods with their current testing performance cannot be applied to real-time applications. These can be used in applications where we need activity recognition periodically or in near real-time predictions.
Figure 12.
Training and testing times for all the methods in seconds.
5. Conclusions
With the exponentially growing number of smart devices today, we can sense and record data that we could not even imagine a decade ago. We can benefit from wearable devices and smartphones through sensing, storing, and processing the stored data. One of the important and popular uses of this type of data is in HAR. This is a problem of great interest due to its wide array of applications, which include but are not limited to healthcare, surveillance, adaptive content delivery, and tracking. The use of wearable technology is rapidly increasing, and its effects have been positively observed by users in relation to follow-up healthcare appointments.
In this paper, we identified crucial research gaps in the area of HAR and investigated them. Firstly, the individual classifiers belong to a particular family of algorithms, such as neural networks, decision trees, bagging, and boosting. However, each of them can perform efficiently for certain types of data patterns, with associated weaknesses. Secondly, data and the environment in which they are sensed are dynamic, and there is a need to frequently update the models according to the changing sensed data patterns.
In this paper, we addressed the problem of HAR. Machine-learning algorithms play a significant role in developing our understanding of HAR data and applying the acquired knowledge to various application domains. We proposed a Soft-Voting and Self-Learning (SVSL)-based HAR method, which uses a soft-voting and self-learning mechanism to classify human activities. The SVSL method produced better results for dataset-I than the four other state-of-the-art classifiers: DL, GLM, RF, and AdaBoost. SVSL outperformed GLM and AdaBoost by almost 9%, and 3% and had a prediction accuracy that was more than 1% higher than that of DL and RF, respectively. Similar prediction accuracy patterns have been seen for dataset-II. We also noticed that the SVSL method had an improved prediction accuracy for the classes where the other three state-of-the-art classifiers produced a higher misclassification. Further, the average accuracies for both datasets increased by 0.11% and 0.44% after five executions of the self-training mechanisms for the proposed method.
In the future, we plan to work toward enhancing the performance of the proposed method using additional diverse datasets. Additionally, we planned to develop an automated system to collect HAR data. This area has an enormous real-world application scope and must be exploited for the sake of better understanding human behaviors and our surroundings, which will enhance decision making.
Funding
This project was funded by the Deanship of Scientific Research (DSR) at King Abdulaziz University, Jeddah, Saudi Arabia, under Grant No. RG-1439-311-10. The authors, therefore, acknowledge with thanks DSR for technical and financial support.
Institutional Review Board Statement
Not applicable.
Informed Consent Statement
Not applicable.
Data Availability Statement
The dataset used in this work is publicly available and is provided by the UCI data repository.
Conflicts of Interest
The authors declare no conflict of interest.
References
- Yigitcanlar, T.; Butler, L.; Windle, E.; Desouza, K.C.; Mehmood, R.; Corchado, J.M. Can Building ‘Artificially Intelligent Cities’ Safeguard Humanity from Natural Disasters, Pandemics, and Other Catastrophes? An Urban Scholar’s Perspective. Sensors 2020, 20, 2988. [Google Scholar] [CrossRef] [Scilit]
- Mehmood, R.; See, S.; Katib, I.; Chlamtac, I. (Eds.) Smart Infrastructure and Applications: Foundations for Smarter Cities and Societies; Springer International Publishing: Berlin/Heidelberg, Germany, 2020; p. 692. [Google Scholar]
- Alotaibi, S.; Mehmood, R.; Katib, I.; Rana, O.; Albeshri, A. Sehaa: A Big Data Analytics Tool for Healthcare Symptoms and Diseases Detection Using Twitter, Apache Spark, and Machine Learning. Appl. Sci. 2020, 10, 1398. [Google Scholar] [CrossRef] [Scilit]
- Alomari, E.; Katib, I.; Mehmood, R. Iktishaf: A Big Data Road-Traffic Event Detection Tool Using Twitter and Spark Machine Learning. Available online: https://link.springer.com/article/10.1007%2Fs11036-020-01635-y (accessed on 8 July 2021).
- Batty, M. Artificial intelligence and smart cities. Environ. Plan. B Urban Anal. City Sci. 2018, 45, 3–6. [Google Scholar] [CrossRef] [Scilit]
- Yigitcanlar, T.; Corchado, J.M.; Mehmood, R.; Li, R.Y.M.; Mossberger, K.; Desouza, K. Responsible Urban Innovation with Local Government Artificial Intelligence (AI): A Conceptual Framework and Research Agenda. J. Open Innov. Technol. Mark. Complex. 2021, 7, 71. [Google Scholar] [CrossRef] [Scilit]
- Yigitcanlar, T.; Kankanamge, N.; Regona, M.; Ruiz Maldonado, A.; Rowan, B.; Ryu, A.; Desouza, K.C.; Corchado, J.M.; Mehmood, R.; Li, R.Y.M. Artificial intelligence technologies and related urban planning and development concepts: How are they perceived and utilized in Australia? J. Open Innov. Technol. Mark. Complex. 2020, 6, 187. [Google Scholar] [CrossRef] [Scilit]
- Bragança, H.; Colonna, J.G.; Lima, W.S.; Souto, E. A smartphone lightweight method for human activity recognition based on information theory. Sensors 2020, 20, 1856. [Google Scholar] [CrossRef] [Scilit] [PubMed]
- Gao, Z.; Liu, D.; Huang, K.; Huang, Y. Context-aware human activity and smartphone position-mining with motion sensors. Remote Sens. 2019, 11, 2531. [Google Scholar] [CrossRef] [Scilit]
- Jobanputra, C.; Bavishi, J.; Doshi, N. Human Activity Recognition: A Survey. Procedia Comput. Sci. 2019, 155, 698–703. [Google Scholar] [CrossRef] [Scilit]
- Ogbuabor, G.; La, R. Human Activity Recognition for Healthcare using Smartphones. In Proceedings of the 2018 10th International Conference on Machine Learning and Computing, Macau, China, 26–28 February 2018. [Google Scholar] [CrossRef] [Scilit]
- Wang, H.; Zhao, J.; Li, J.; Tian, L.; Tu, P.; Cao, T.; An, Y.; Wang, K.; Li, S. Wearable Sensor-Based Human Activity Recognition Using Hybrid Deep Learning Techniques. Secur. Commun. Netw. 2020, 2020, 2132138. [Google Scholar] [CrossRef] [Scilit]
- Mehmood, R.; Alam, F.; Albogami, N.N.; Katib, I.; Albeshri, A.; Altowaijri, S.M. UTiLearn: A personalised ubiquitous teaching and learning system for smart societies. IEEE Access 2017, 5, 2615–2635. [Google Scholar] [CrossRef] [Scilit]
- Htike, K.K.; Khalifa, O.O.; Ramli, H.A.M.; Abushariah, M.A.M. Human activity recognition for video surveillance using sequences of postures. In Proceedings of the The Third International Conference on e-Technologies and Networks for Development (ICeND2014), Beirut, Lebanon, 29 April–1 May 2014. [Google Scholar] [CrossRef] [Scilit]
- Alam, F.; Almaghthawi, A.; Katib, I.; Albeshri, A.; Mehmood, R. iResponse: An AI and IoT-Enabled Framework for Autonomous COVID-19 Pandemic Management. Sustainability 2021, 13, 3797. [Google Scholar] [CrossRef] [Scilit]
- Beddiar, D.R.; Nini, B.; Sabokrou, M.; Hadid, A. Vision-based human activity recognition: A survey. Multimed. Tools Appl. 2020, 79, 30509–30555. [Google Scholar] [CrossRef] [Scilit]
- Arfat, Y.; Usman, S.; Mehmood, R.; Katib, I. Big data for smart infrastructure design: Opportunities and challenges. In Smart Infrastructure and Applications Foundations for Smarter Cities and Societies; Springer: Cham, Switzerland, 2020; pp. 491–518. [Google Scholar]
- Janbi, N.; Katib, I.; Albeshri, A.; Mehmood, R. Distributed Artificial Intelligence-as-a-Service (DAIaaS) for Smarter IoE and 6G Environments. Sensors 2020, 20, 5796. [Google Scholar] [CrossRef] [Scilit]
- Mohammed, T.; Albeshri, A.; Katib, I.; Mehmood, R. UbiPriSEQ—Deep reinforcement learning to manage privacy, security, energy, and QoS in 5G IoT hetnets. Appl. Sci. 2020, 10, 7120. [Google Scholar] [CrossRef] [Scilit]
- ZadaKhan, W.; Ahmed, E.; Hakak, S.; Yaqoob, I.; Ahmed, A. Edge computing: A survey. Futur. Gener. Comput. Syst. 2019, 97, 219–235. [Google Scholar] [CrossRef] [Scilit]
- Dietterich, T.G. Ensemble methods in machine learning. In Lecture Notes in Computer Science (Including Subseries Lecture Notes in Artificial Intelligence and Lecture Notes in Bioinformatics); Springer: Berlin/Heidelberg, Germany, 2000; Volume 1857, pp. 1–15. [Google Scholar]
- Sagi, O.; Rokach, L. Ensemble learning: A survey. Wiley Interdiscip. Rev. Data Min. Knowl. Discov. 2018, 8, e1249. [Google Scholar] [CrossRef] [Scilit]
- Anguita, D.; Ghio, A.; Oneto, L.; Parra, X.; Reyes-Ortiz, J.L. A Public Domain Dataset for Human Activity Recognition Using Smartphones. In Proceedings of the 21st European Symposium on Artificial Neural Networks, Computational Intelligence and Machine Learning, Bruges, Belgium, 24–26 April 2013; pp. 24–26. [Google Scholar]
- Alam, F.; Mehmood, R.; Katib, I.; Albeshri, A. Analysis of Eight Data Mining Algorithms for Smarter Internet of Things (IoT). Procedia Comput. Sci. 2016, 98, 437–442. [Google Scholar] [CrossRef] [Scilit]
- Kańtoch, E. Human activity recognition for physical rehabilitation using wearable sensors fusion and artificial neural networks. In Proceedings of the 2017 Computing in Cardiology (CinC), Rennes, France, 24–27 September 2018. [Google Scholar] [CrossRef] [Scilit]
- Mai, D.; Hoang, K. Motorbike theft detection based on object detection and human activity recognition. In Proceedings of the 2013 International Conference on Control, Automation and Information Sciences (ICCAIS), Nha Trang, Vietnam, 25–28 November 2013. [Google Scholar] [CrossRef] [Scilit]
- Palaniappan, A.; Bhargavi, R.; Vaidehi, V. Abnormal human activity recognition using SVM based approach. In Proceedings of the International Conference on Recent Trends in Information Technology, ICRTIT 2012, Chennai, India, 19–21 April 2012; pp. 97–102. [Google Scholar] [CrossRef] [Scilit]
- Manosha Chathuramali, K.G.; Rodrigo, R. Faster human activity recognition with SVM. In Proceedings of the International Conference on Advances in ICT for Emerging Regions, ICTer 2012, Colombo, Sri Lanka, 12–15 December 2012; pp. 197–203. [Google Scholar] [CrossRef] [Scilit]
- Supriyatna, T.B.; Nasution, S.M.; Nugraheni, R.A. Human activity recognition using support vector machine for automatic security system. J. Phys. Conf. Ser. 2019, 1192, 012017. [Google Scholar] [CrossRef] [Scilit]
- Zheng, Y. Human Activity Recognition Based on the Hierarchical Feature Selection and Classification Framework. J. Electr. Comput. Eng. 2015, 34, 140820. [Google Scholar] [CrossRef] [Scilit]
- Kerboua, A.; Batouche, M.; Debbah, A. RGB-D & SVM action recognition for security improvement. In Proceedings of the Mediterranean Conference on Pattern Recognition and Artificial Intelligence, Tebessa, Algeria, 23–14 November 2016; pp. 137–143. [Google Scholar] [CrossRef] [Scilit]
- Subasi, A.; Dammas, D.H.; Alghamdi, R.D.; Makawi, R.A.; Albiety, E.A.; Brahimi, T.; Sarirete, A. Sensor based human activity recognition using adaboost ensemble classifier. Procedia Comput. Sci. 2018, 140, 104–111. [Google Scholar] [CrossRef] [Scilit]
- Uddin, M.T.; Uddiny, M.A. A guided random forest based feature selection approach for activity recognition. In Proceedings of the 2015 International Conference on Electrical Engineering and Information Communication Technology (ICEEICT), Savar, Bangladesh, 21–23 May 2015. [Google Scholar] [CrossRef] [Scilit]
- Balli, S.; Sağbaş, E.A.; Peker, M. Human activity recognition from smart watch sensor data using a hybrid of principal component analysis and random forest algorithm. Meas. Control 2019, 52, 37–45. [Google Scholar] [CrossRef] [Scilit]
- Nurwulan, N.R.; Selamaj, G. Random Forest for Human Daily Activity Recognition. J. Phys. Conf. Ser. 2020, 1655, 012087. [Google Scholar] [CrossRef] [Scilit]
- Bustoni, I.A.; Hidayatulloh, I.; Ningtyas, A.M.; Purwaningsih, A.; Azhari, S.N. Classification methods performance on human activity recognition. J. Phys. Conf. Ser. 2020, 1456, 12027. [Google Scholar] [CrossRef] [Scilit]
- Steven Eyobu, O.; Han, D.S. Feature Representation and Data Augmentation for Human Activity Classification Based on Wearable IMU Sensor Data Using a Deep LSTM Neural Network. Sensors 2018, 18, 2892. [Google Scholar] [CrossRef] [Scilit]
- Alawneh, L.; Alsarhan, T.; Al-Zinati, M.; Al-Ayyoub, M.; Jararweh, Y.; Lu, H. Enhancing Human Activity Recognition Using Deep Learning and Time Series Augmented Data. Available online: https://link.springer.com/article/10.1007/s12652-020-02865-4#citeas (accessed on 8 July 2021).
- Ronald, M.; Poulose, A.; Han, D.S. iSPLInception: An Inception-ResNet Deep Learning Architecture for Human Activity Recognition. IEEE Access 2021, 9, 68985–69001. [Google Scholar] [CrossRef] [Scilit]
- Chen, Z.; Xiang, S.; Ding, J.; Li, X. Smartphone sensor-based human activity recognition using feature fusion and maximum full a posteriori. IEEE Trans. Instrum. Meas. 2020, 69, 3992–4001. [Google Scholar] [CrossRef] [Scilit]
- D’Angelo, G.; Palmieri, F. Enhancing COVID-19 Tracking Apps with Human Activity Recognition Using a Deep Convolutional Neural Network and HAR-Images. Available online: https://link.springer.com/article/10.1007/s00521-021-05913-y (accessed on 8 July 2021).
- Khan, M.B.; Zhang, Z.; Li, L.; Zhao, W.; Hababi, M.A.M.A.; Yang, X.; Abbasi, Q.H. A Systematic Review of Non-Contact Sensing for Developing a Platform to Contain COVID-19. Micromachines 2020, 11, 912. [Google Scholar] [CrossRef] [Scilit]
- Weiss, G.M.; Yoneda, K.; Hayajneh, T. Smartphone and Smartwatch-Based Biometrics Using Activities of Daily Living. IEEE Access 2019, 7, 133190–133202. [Google Scholar] [CrossRef] [Scilit]
- Sokolova, M.; Lapalme, G. A systematic analysis of performance measures for classification tasks. Inf. Process. Manag. 2009, 45, 427–437. [Google Scholar] [CrossRef] [Scilit]
- Shaik, A.B.; Srinivasan, S. A brief survey on random forest ensembles in classification model. In Lecture Notes in Networks and Systems; Springer: Berlin/Heidelberg, Germany, 2019; Volume 56, pp. 253–260. [Google Scholar]
- Nelder, J.A.; Wedderburn, R.W.M. Generalized Linear Models. J. R. Stat. Soc. Ser. A 1972, 135, 370. [Google Scholar] [CrossRef] [Scilit]
- Terry-Jack, M. Deep Learning: Feed Forward Neural Networks (FFNNs). Medium.com. 2019. Available online: https://medium.com/@b.terryjack/introduction-to-deep-learning-feed-forward-neural-networks-ffnns-a-k-a-c688d83a309d (accessed on 15 June 2021).
- Candel, A.; Le Dell, E.; Parmar, V.; Arora, A. Deep Learning With H2O.; H2O.ai Inc.: Mountain View, CA, USA, 2018. [Google Scholar]

Publisher’s Note: MDPI stays neutral with regard to jurisdictional claims in published maps and institutional affiliations. |
© 2021 by the author. Licensee MDPI, Basel, Switzerland. This article is an open access article distributed under the terms and conditions of the Creative Commons Attribution (CC BY) license (https://creativecommons.org/licenses/by/4.0/).