


Abstract
The electrochemical and transport properties of Li-substituted layered NaMnO2 can depend on both composition and the specific Li/Mn arrangement. Here, first-principles calculations were used to compare three representative NaxLiyMn1-yO2 configurations: line (y = 0.17), honeycomb (y = 0.33), and non-honeycomb (y = 0.33). The lowest-energy Na-vacancy configurations at different Na contents were determined to evaluate the desodiation voltage, electronic structure, Na-ion in-plane migration and Li-ion interlayer migration. The average desodiation voltages are 3.85, 4.55, and 4.24 V for the line, honeycomb, and non-honeycomb configurations, respectively. The 0.31 V difference between the honeycomb and non-honeycomb configurations at the same Li concentration demonstrates that Li/Mn spatial distribution directly affects Na extraction. At x = 1, the calculated electronic structures indicate metallic behavior for the honeycomb configuration and semiconducting behavior for the line and non-honeycomb configurations. At x = 0.83, the Na-ion in-plane migration barriers are 0.58, 0.88, and 1.07 eV for the line, honeycomb, and non-honeycomb configurations, respectively. Li-ion interlayer migration barriers are generally lower in the Na-poor states, reaching 0.59, 0.36, and 0.38 eV at x = 0.17 for the line, honeycomb, and non-honeycomb configurations, respectively. These results show that the electrochemical and ion transport properties of Li-substituted NaMnO2 depend on the local Li/Mn arrangement, providing atomic-scale guidance for the design of layered Na-Li-Mn cathodes.
1. Introduction
Sodium-ion batteries (SIBs) have attracted considerable attention for large-scale energy storage because of the abundance and low cost of sodium resources [1,2,3,4,5,6,7]. Layered transition metal oxides (NaxTMO2) are promising cathode materials for SIBs due to their high capacities, facile synthesis, and tunable electrochemical properties [8,9,10,11,12]. According to the Delmas classification, NaxTMO2 compounds can adopt several structures, including O3, P3, O′3, and P2 phases [13]. Among these materials, layered Mn-based oxides have the characteristics of low cost, abundant Mn resources, and relatively high specific capacities. For example, NaMnO2 exhibits an initial discharge capacity of approximately 185 mAh/g between 2.0 and 3.8 V, corresponding to approximately 0.8 mol of Na ions reversibly extracted. However, its practical application is limited by instability upon exposure to water and complex phase transitions during cycling [14,15,16,17,18]. The Jahn–Teller (JT) distortion associated with high-spin Mn3+ (t2g3) (eg1) can contribute to structural changes and capacity loss. Considerable efforts have therefore been devoted to improving the stability of NaMnO2 through elemental doping, surface modification, and the construction of composite and nanostructured materials.
Li substitution has been investigated as a strategy for improving Mn-based layered cathodes, leading to a range of layered Na-Li-Mn oxides represented here by the general formula NaLiyMn1-yO2 (NLMO) [19,20,21,22,23,24,25,26]. Liu et al. reported P′2-Na0.67Li0.05Mn0.95O2 with a reversible capacity of 192.2 mAh/g. This material retained 90.3% of its capacity after 100 cycles and delivered 118.5 mAh/g at 1.0 A/g [27]. Li substitution has also been reported to improve the structural stability of NaLi0.2Mn0.8O2 by inhibiting detrimental structural transformations during cycling [28]. Another notable example is O3-NaLi0.33Mn0.67O2, which exhibits a reversible capacity of approximately 190 mAh/g, together with good water stability and limited voltage decay [29]. Despite these advances, previous studies have largely demonstrated the electrochemical benefits of Li substitution for individual compositions, whereas a systematic understanding of how Li content affects the intrinsic structural, electronic, and kinetic properties of NLMO cathodes remains limited. The role of Li concentration in determining these properties therefore requires further clarification.
Li content, however, is not the only structural factor governing the properties of NLMO cathodes. The spatial arrangement of Li and Mn within the transition metal (TM) layer can produce superstructures such as honeycomb, mesh and ribbon configurations [30]. Such cation ordering has been associated with TM ion migration, oxygen redox reversibility, and voltage hysteresis. Kim et al. further revealed Li/Mn superlattice ordering in P3-Na0.67Li0.2Mn0.8O2 and associated a higher degree of ordering with enhanced anionic redox capacity [31]. These findings motivate a comparison of different Li/Mn arrangements at fixed composition. In particular, examining their effects on electronic structure and ion migration can help clarify how local cation arrangement influences the properties of NLMO cathodes.
In this work, first-principles calculations are used to investigate the effects of Li concentration and Li/Mn spatial distribution on the structural, electrochemical, electronic, and ion transport properties of NaLiyMn1-yO2 (y = 0.17 and 0.33). We compare three representative NLMO configurations: line (y = 0.17), honeycomb (y = 0.33), and non-honeycomb (y = 0.33). The energetically favorable Li configurations and the lowest-energy Na-vacancy configurations at different Na contents are first determined. On this basis, the average desodiation voltage and electronic structure are evaluated, while Climbing-image nudged elastic band (CI-NEB) calculations are performed to examine Na-ion in-plane migration and Li-ion interlayer migration. By comparing structures with different Li/Mn arrangements, this work clarifies how composition and local cation arrangement affect the thermodynamic, electronic, and kinetic properties of Li-substituted NaMnO2 cathodes.
2. Computational Method
2.1. Calculation Method
First-principles calculations based on density functional theory (DFT) [32,33] were performed using the Vienna Ab initio Simulation Package (VASP) (v6.4.3) [34,35]. The projector augmented wave (PAW) [36,37] method was used to solve the Kohn–Sham equations, and the valence electron states were treated as Na-3s1, Li-2s1, Mn-3d64s1, O-2s22p4. The electron exchange-correlation functional was based on the generalized gradient approximation (GGA) [38] with Perdew–Burke–Ernzerhof (PBE) functional. Furthermore, in order to account for the strong on-site Coulomb repulsion of transition metals, the GGA + U [39] method was used. An effective Ueff parameter was set to 5.0 eV for Mn 3d electrons based on a previous report [16]. The plane-wave cutoff energy was set to 400 eV. We selected the Monkhorst-Pack k-point mesh [40] 5 × 3 × 5 for NaxLiyMn1-yO2 (x = 0, 0.17, 0.33, 0.5, 0.67, 0.83 and 1.0, y = 0.17 and 0.33). The convergence criteria for the total energy and atomic forces during relaxation were set to 1 × 10⁻⁴ eV per atom and 0.05 eV/Å, respectively. The climbing image nudged elastic band (CI-NEB) method [41] was used to optimize the Na and Li migration pathways and evaluate the corresponding energy barriers. The path is identified by using 3 intermediate images in Na in-plane and Li interlayer migration. The calculations are allowed to converge until the minimum force acting on each atom is 0.1 eV/Å. The transition state (TS) is calculated by getting the difference between the maximum value in the minimum energy path. DFT-D3 [42] has been taken into consideration for Van der Waals interactions, which is important for layered materials. In addition, spin polarized calculations were included throughout the whole study.
2.2. Average Desodiation Voltage
Electrode potential is one of the important parameters of battery performance. Theoretically, the average desodiation voltage can be calculated using the DFT total energy of the desodiation cathode and pure sodium metal. The desodiation reactions in the cathode NaxTMO2 can be expressed as follows:
According to the Nernst equation, the average desodiation voltage of NaxTMO2 with sodium concentration decreasing from x2 to x1 can be calculated as:
where V is the average voltage; and represent the DFT total energy of and , respectively. ENa is the DFT total energy of pure sodium metal (−1.31 eV); e is an electron charge (−1.60 × 10⁻¹⁹ C); x1 and x2 are chosen as series of combinations among 0, 0.17, 0.33, 0.50, 0.67, 0.83 and 1, corresponding to the removal of one Na atom from the structure.
3. Results and Discussion
3.1. Atomic Structures of Naliymn1-yo2 (Y = 0.17 and 0.33)
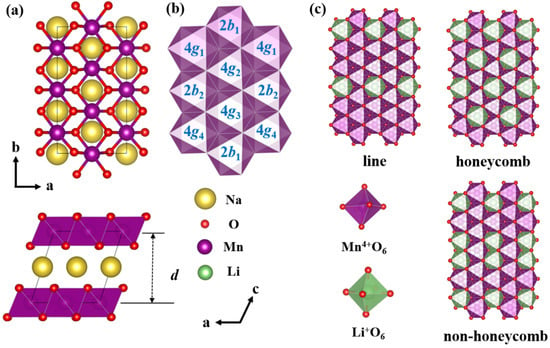
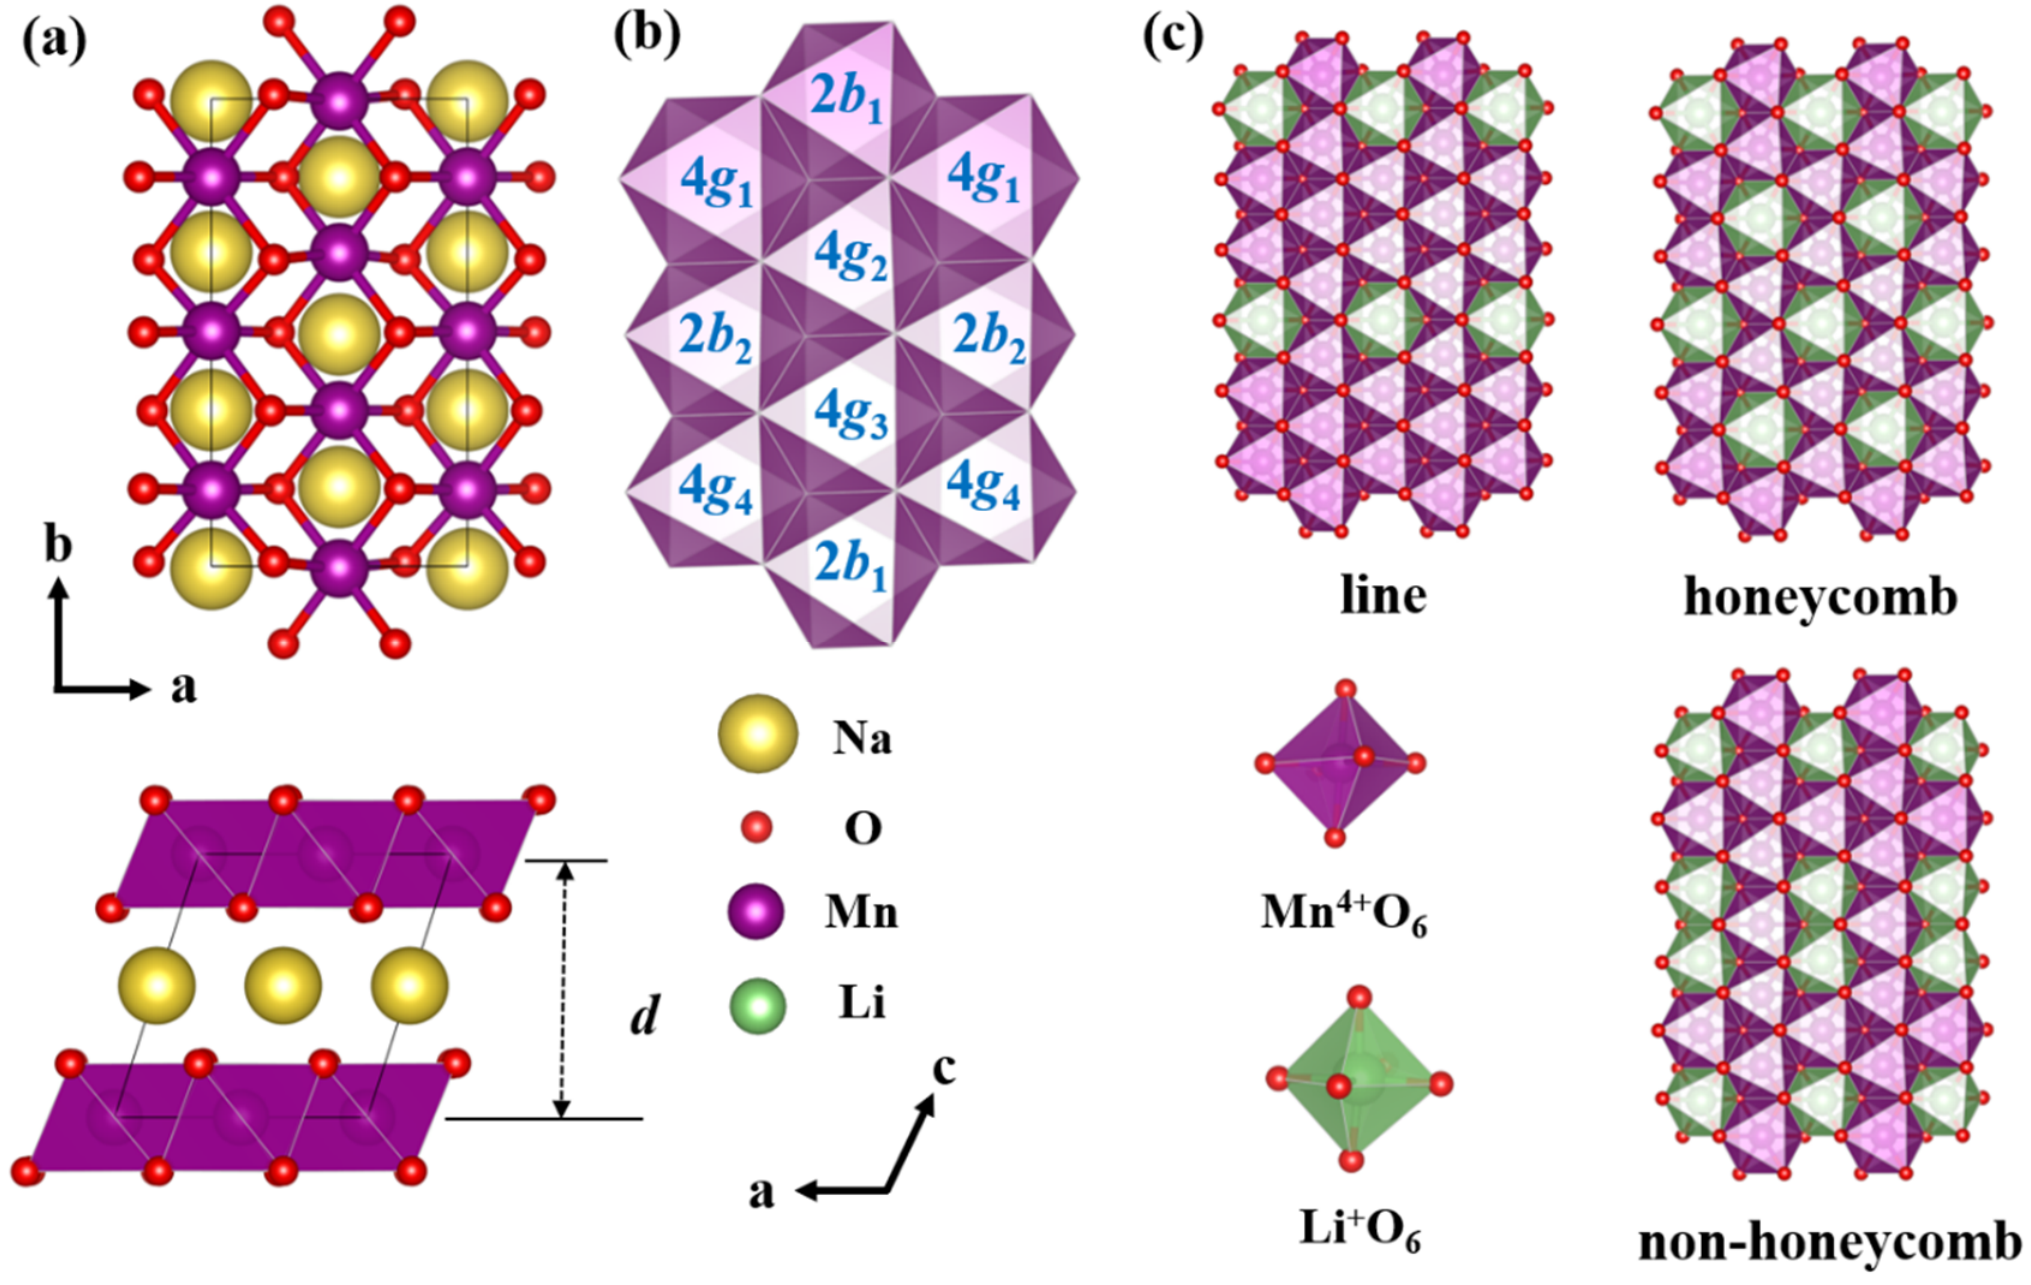
The Li concentration and substitution sites in the transition metal (TM) layer play important roles in determining the structural stability and electrochemical properties of NaLiyMn1-yO2 (NLMO) cathodes. To investigate the effects of Li content and Li/Mn distribution on the properties of NLMO cathodes, we constructed three NaLiyMn1-yO2 (y = 0.17 and 0.33) structures, including one NaLi0.17Mn0.83O2 structure and two NaLi0.33Mn0.67O2 structures. To construct NaLiyMn1-yO2 (y = 0.17 and 0.33), we employed NaMnO2 as the pristine structure and then replaced Mn atoms with Li ones. NaMnO2 is commonly described by two models, namely, the hexagonal structure with the Rm space group and the monoclinic structure with the C2/m space group. In order to precisely replace and reduce the complexity of Li distribution in the TM layer and Na distribution in the alkali metal (AM) layer, we chose the C2/m structure for the calculations of NaLiyMn1-yO2. The initial C2/m structure of NaMnO2 was obtained from the experimental report [14]. A 1 × 3 × 1 supercell was constructed by tripling the conventional cell along the b direction, yielding a 24-atom model containing six Na atoms, six Mn atoms, and twelve O atoms. The top and side views of the atomic structure of NaMnO2 (C2/m space group) are shown in Figure 1a. Within the C2/m structure, Mn atoms occupy the 2b and 4g sites, which can be further classified as 2b1, 2b2, 4g1, 4g2, 4g3, 4g4, as illustrated in Figure 1b.
Figure 1.
Atomic structure of (a) NaMnO2 (C2/m space group) and (c) line, honeycomb and non-honeycomb configurations of NaLiyMn1-yO2 (y = 0.17 and 0.33). (b) Mn Wyckoff positions corresponding to the 2b and 4g sites in the transition metal layer.
For the NaLi0.17Mn0.83O2 structure, one Mn atom in the TM layer was substituted by Li from the NaMnO2 structure, corresponding to a Li/Mn ratio of 1:5. The relative energies (ΔE) of Li substituting the 2b and 4g sites are listed in Table 1. The results show that Li substitution at the 4g site leads to the most stable configuration. The optimized 4g-substituted structure was selected as the low-energy state structure of NaLi0.17Mn0.83O2 and is labeled as the line configuration. Figure 1c shows the atomic structure of the line configuration.
Table 1.
The relative energy (ΔE) and interlayer spacing (d) of NaLiyMn1-yO2 (y = 0.17 and 0.33) with Li substitution at different sites.
For the NaLi0.33Mn0.67O2 structures, the crystal structure was obtained by substituting two Mn atoms with Li atoms in the TM layer. Considering the six available Mn sites, a total of 15 kinds of Li substitution configurations were constructed, including one 2b + 2b configuration (2b1 + 2b2), six 4g + 4g configurations (4g1 + 4g2, 4g1 + 4g3, 4g1 + 4g4, 4g2 + 4g3, 4g2 + 4g4, 4g3 + 4g4), and eight 2b + 4g configurations (2b1 + 4g1, 2b1 + 4g2, 2b1 + 4g3, 2b1 + 4g4, 2b2 + 4g1, 2b2 + 4g2, 2b2 + 4g3, 2b2 + 4g4), respectively. The relative energies of all configurations are summarized in Table 1. Among all the NaLi0.33Mn0.67O2 configurations considered, the 4g1 + 4g3 and 4g2 + 4g4 Li-substituted configurations have the lowest energies. On account of the structural symmetry, the two 4g + 4g cases are the same structures. Here, we chose the 4g1 + 4g3 Li-substituted configuration as the low-energy state structure. In this configuration, Li and Mn atoms form an ordered honeycomb-like arrangement within the TM layer, and therefore it is labeled as the honeycomb configuration. The atomic structure of the honeycomb configuration is shown in Figure 1c. The honeycomb-related data were previously reported in our 2024 study [43] and are included here as a reference for comparison with the newly investigated line and non-honeycomb configurations. Although the 2b1 + 2b2 Li-substituted configuration is the metastable structure due to its relatively higher energy with respect to the 4g1 + 4g3 one, it is actually the honeycomb structure in 2b1 + 2b2 configuration. Therefore, we chose the 4g1 + 4g4 configuration as an additional NaLi0.33Mn0.67O2 structure to investigate the influence of the Li substitution site. The structure is labeled as the non-honeycomb configuration, as shown in Figure 1c. The Li+O6 and Mn4+O6 octahedral structures formed in the TM layer after Li substitution are shown in Figure 1c. In addition, we defined the interlayer spacing (d) as the distance between two adjacent TM layers, as shown in Figure 1a. The interlayer spacing of the NaLiyMn1-yO2 (y = 0.17 and 0.33) configurations is evaluated and listed in Table 1. The interlayer spacing in all cases of NaLiyMn1-yO2 (y = 0.17 and 0.33) is slightly affected by the Li distribution, which ranges from 5.42 to 5.46 Å. Our previous comparison of O- and P-type honeycomb structures favored the O-type structures at the Na contents examined [43]. The line and non-honeycomb configurations are therefore investigated within the O-type framework to provide a consistent basis for comparison.
3.2. Average Voltage
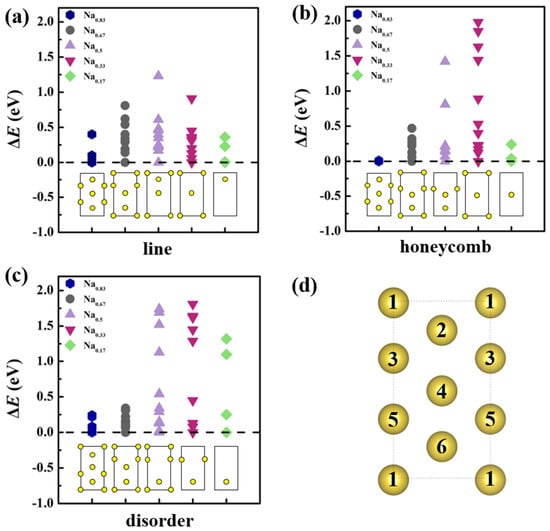
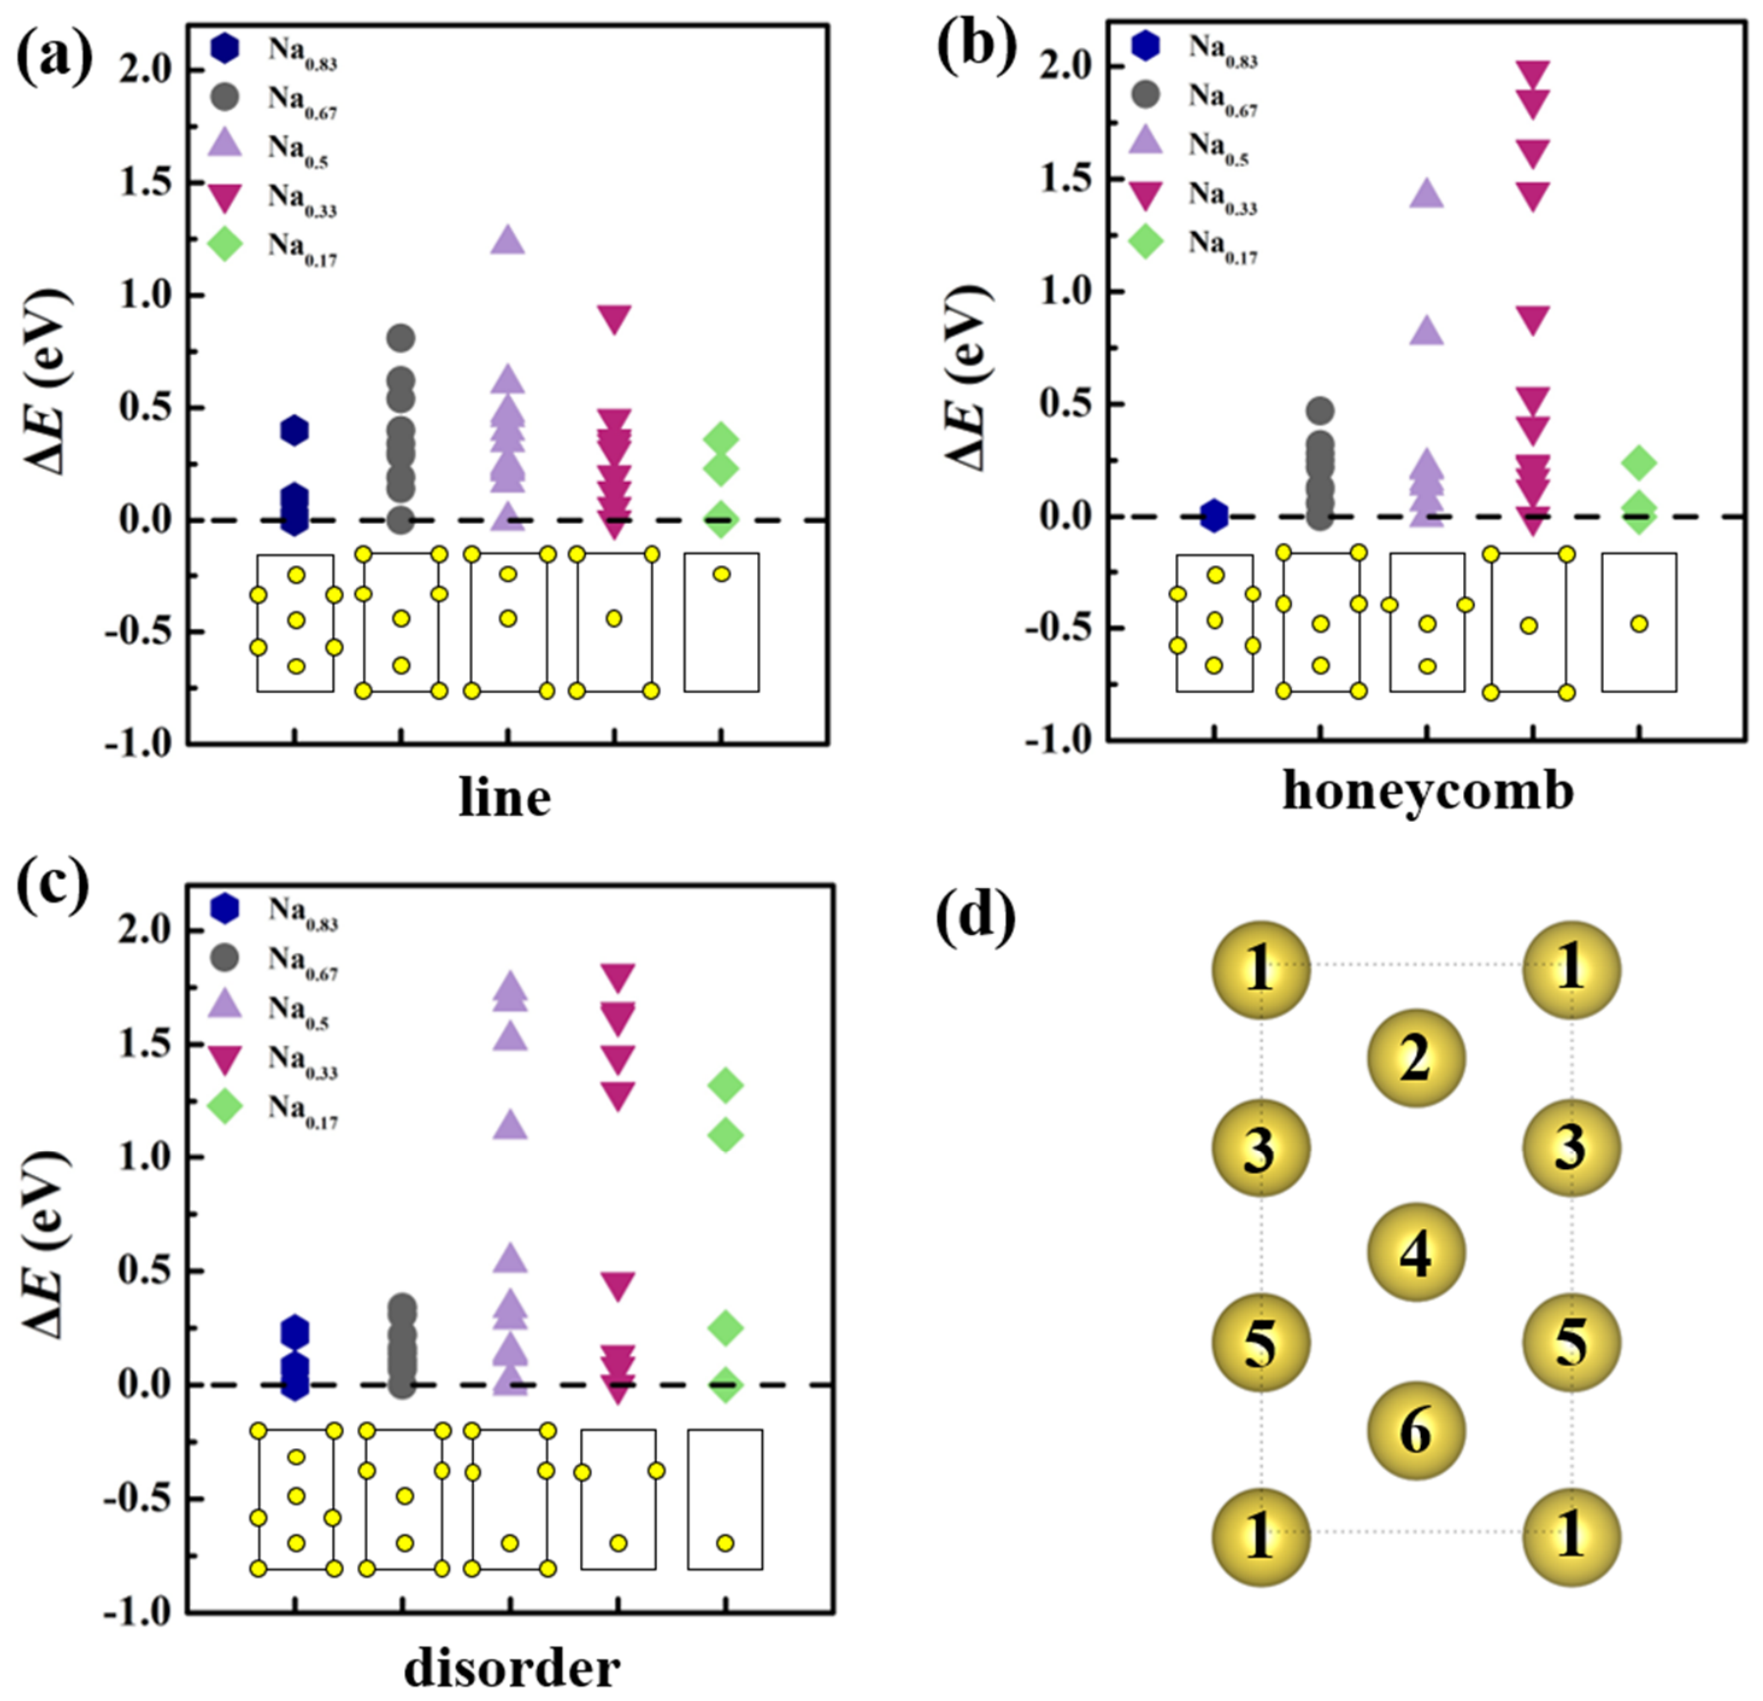
The desodiation voltage of layered sodium cathodes is intrinsically correlated with the relative thermodynamic stability of intermediate phases with varied Na contents. Therefore, determining the most stable Na vacancy configuration at each Na concentration is essential for accurately evaluating the electrochemical behavior of NaLiyMn1-yO2. For three NaLiyMn1-yO2 configurations, six Na atoms in the AM layer were labeled as Na1-Na6, as shown in Figure 2d.
Figure 2.
Relative energy (ΔE) of Na-ion-extracted configurations at different Na contents for the (a) line, (b) honeycomb and (c) non-honeycomb configurations of NaxLiyMn1-yO2 (x = 0.17, 0.33, 0.5, 0.67 and 0.83, y = 0.17 and 0.33). (d) The marked numbers of Na atoms are Na1 to Na6 in NaLiyMn1-yO2 (y = 0.17 and 0.33).
All the Na-ion-extracted configurations for the line, honeycomb and non-honeycomb configurations of NaLiyMn1-yO2 (y = 0.17 and 0.33) were generated by removing Na atoms from Na1-Na6, corresponding to Na contents of 0.83, 0.67, 0.5, 0.33, 0.17, and 0. All the Na-vacancy configurations for the line, honeycomb and non-honeycomb configurations of NaLiyMn1-yO2 (y = 0.17 and 0.33) were calculated after structural relaxation, and the total energies of all the cases were summarized in Tables S1–S3 (Supplementary Materials). Based on the calculated total energies, we obtained the lowest-energy states of Na-extracted configurations of each Na concentration for the line, honeycomb and non-honeycomb configurations of NaLiyMn1-yO2 (y = 0.17 and 0.33), as shown in Figure 2a–c. These results indicate that Li substitution configurations modify the local coordination environment and electrostatic interactions, resulting in different Na-vacancy arrangements during the charging process.
Based on the above low-energy structures, we calculated the desodiation voltages in six ranges of x2 → x1 for three systems according to Equation (2). The desodiation voltages (V) of NaxLiyMn1-yO2 (x = 0.17, 0.33, 0.5, 0.67, 0.83 and 1.0, y = 0.17 and 0.33) with the line, honeycomb and non-honeycomb systems are listed in Table S4 (Supplementary Materials). Because the intervals correspond to equal amounts of Na extraction, their arithmetic mean gives the full-range average voltage. We further calculated average desodiation voltages () within the entire range (x = 0–1) are listed in Table 2. According to Table 2, the average desodiation voltages of the line, honeycomb, and non-honeycombed configurations are 3.85, 4.55, and 4.24 V, respectively. The honeycomb configuration exhibits the highest average desodiation voltage (4.55 V), whereas the line system shows the lowest voltage (3.85 V). The difference in average desodiation voltage between the honeycomb and non-honeycomb configurations is particularly noteworthy because these two structures have the same Li content (y = 0.33). The 0.31 V difference demonstrates that the spatial distribution of Li atoms within the TM layer can regulate Na extraction thermodynamics. The approximately 0.31 V higher average voltage of the honeycomb configuration suggests a potential energy-density benefit if comparable reversible capacity can be achieved. However, a higher operating voltage also places greater demands on electrolyte oxidative stability. In contrast, the larger voltage difference (0.7 V) between the line and honeycomb configurations reflects the combined effects of Li concentration and Li/Mn distribution, since these two structures have different Li contents.
Table 2.
The average desodiation voltages () of NaLiyMn1-yO2 (y = 0.17 and 0.33) with the line, honeycomb and non-honeycomb systems.
3.3. Electronic Properties
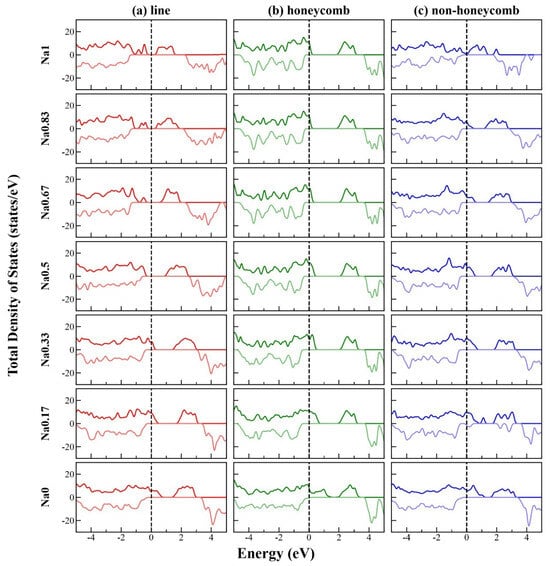
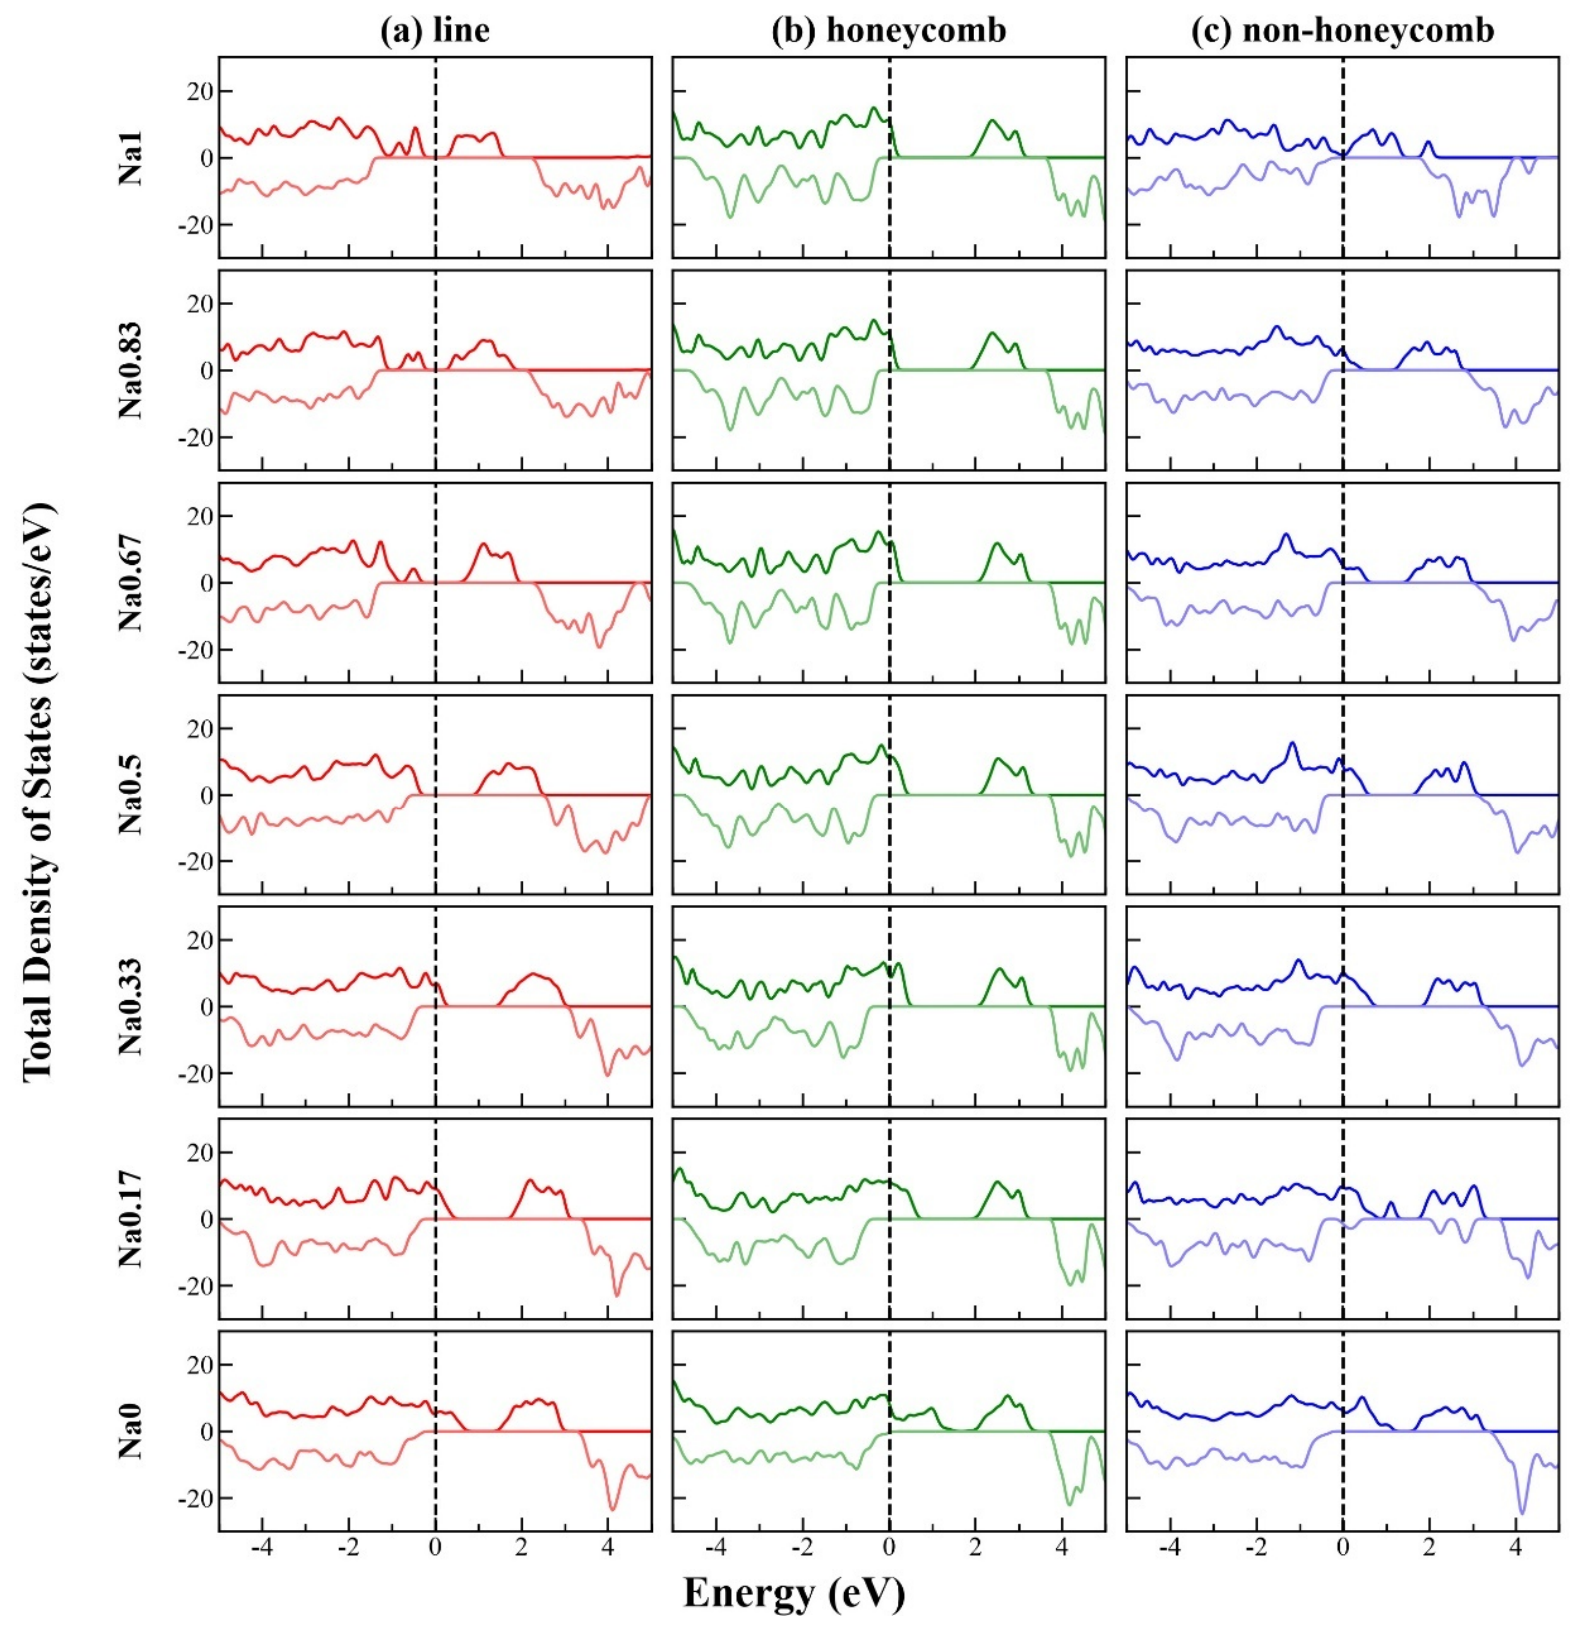
To compare the electronic structures of the selected configurations, we calculated their spin-polarized density of states (TDOS) for the line, honeycomb, and non-honeycomb configurations at different Na contents, as shown in Figure 3. We first compare the electronic structures of the three configurations in the Na-rich state (Na1). As shown in Figure 3, it can be clearly seen that the line and non-honeycomb configurations exhibit semiconducting characteristics, with negligible electronic states at the Fermi level, whereas the honeycomb configuration shows metallic character without an energy gap. This difference indicates that the electronic properties of NaLiyMn1-yO2 are strongly dependent on the Li substitution and Li/Mn distribution within the TM layer. Notably, the honeycomb and non-honeycomb configurations have the same Li concentration (y = 0.33), but exhibit distinctly different TDOS profiles around the Fermi level. Therefore, the different electronic behaviors between these two configurations cannot be attributed to the Li concentration alone, highlighting the important role of the spatial arrangement of Li and Mn atoms in determining the electronic structure.
Figure 3.
Spin-polarized total density of states (TDOS) at different Na contents for the (a) line, (b) honeycomb and (c) non-honeycomb configurations of NaxLiyMn1-yO2 (x = 0, 0.17, 0.33, 0.5, 0.67, 0.83 and 1, y = 0.17 and 0.33).
We then investigated the evolution of the electronic structure during the desodiation process. The TDOSs at different Na contents, namely Na1, Na0.83, Na0.67, Na0.5, Na0.33, Na0.17, and Na0, are presented in Figure 3. For all three configurations, the electronic states near the Fermi level evolve progressively with decreasing Na content. In particular, the density of unoccupied states near the Fermi level increases during the desodiation process, which reflects the continuous modification of the electronic structure associated with Na removal. Meanwhile, the differences among the three systems remain evident throughout the desodiation process, indicating that the electronic structure during Na extraction is strongly dependent on the Li/Mn distribution.
To further examine the charge-compensation mechanism during desodiation, we calculated the Mn-3d and O-2p projected density of states (PDOS) at different Na contents, as shown in Figures S1 and S2 (Supplementary Materials), respectively. The Mn-projected states exhibit changes in their energy distribution during Na extraction, while oxygen states evolve near the Fermi level. We further calculated the local magnetic moments of individual Mn atoms and the average oxygen local magnetic moments in the fully sodiated (x = 1) and fully desodiated (x = 0) states, as listed in Table 3 (Supplementary Materials). The corresponding oxygen local magnetic moments are provided in Table S5 (Supplementary Materials). High-spin Mn3+ (3d4) and Mn4+ (3d3) have nominal spin magnetic moments of approximately 4 and 3 μB, respectively. In the fully sodiated line configuration, Mn1, Mn2, and Mn5 have moments of approximately 3.93–3.94 μB, consistent with predominantly high-spin Mn3+ character, whereas Mn3 and Mn4 have smaller moments of 3.31–3.37 μB, consistent with predominantly Mn4+ character. For the fully sodiated honeycomb and non-honeycomb configurations, the Mn local magnetic moments range from 3.22 to 3.25 μB and from 3.21 to 3.32 μB, respectively (Table 3). These values are consistent with predominantly Mn4+ character, in agreement with the formal Mn valence of +4 in NaLi1/3Mn2/3O2. Upon complete Na removal, the Mn moments range from 3.29 to 3.47 μB for the honeycomb configuration and remain approximately 3.35 μB for the non-honeycomb configuration. Their broadly similar magnitudes before and after desodiation suggest that Mn retains predominantly Mn4+-like character, rather than undergoing a pronounced, systematic increase in oxidation state. In contrast, the average oxygen local magnetic moment changes substantially, from −0.10 to −0.55 μB for the honeycomb configuration and from −0.10 to −0.54 μB for the non-honeycomb configuration. Table S5 (Supplementary Materials) further shows that the oxygen moments in the fully desodiated honeycomb configuration span −0.32 to −0.85 μB, whereas those in the non-honeycomb configuration occupy a narrower range of −0.51 to −0.56 μB. Thus, although the average oxygen moments are similar, their site-resolved distributions differ between the two arrangements. Upon complete desodiation of the honeycomb configuration, the average local magnetic moment of oxygen changes from −0.10 to −0.55 μB, indicating stronger local spin polarization on oxygen. Together with the changes in O-projected states near the Fermi level, this result is consistent with oxygen participation in charge compensation. This interpretation is qualitatively consistent with the experimental findings of Wang et al. [29] for O3-NaLi0.33Mn0.67O2, which identified Mn4+ in the pristine material and oxygen involvement during charging.
Table 3.
Magnetic moment of each Mn atom and average O atoms (Oaverage) for the line, honeycomb and non-honeycomb configurations of NaxLiyMn1-yO2 (x = 0 and 1, y = 0.17 and 0.33).
It is particularly noteworthy that the honeycomb and non-honeycomb systems exhibit different electronic structures despite having the same Li concentration (y = 0.33). This observation is consistent with the difference in their average desodiation voltages discussed in Section 3.2, where the honeycomb and non-honeycomb systems show the average voltages of 4.55 and 4.24 V, respectively. Therefore, the influence of Li substitution on the electrochemical behavior cannot be described solely by its concentration. The spatial arrangement of Li and Mn atoms also plays an important role in regulating the electronic structure and the thermodynamic response during the desodiation process.
3.4. Kinetic Properties
Apart from the desodiation voltage and electronic properties, ion migration is another important factor affecting the electrochemical performance of layered cathode materials. In NaLiyMn1-yO2, Na-ion in-plane migration within the AM layer is closely related to Na-ion diffusion, whereas Li-ion interlayer migration from the TM layer to the AM layer may affect the structural stability during deep desodiation. Therefore, the migration behaviors of Na and Li ions were further investigated based on the lowest energy structures determined above.
3.4.1. Na-Ion In-Plane Migration
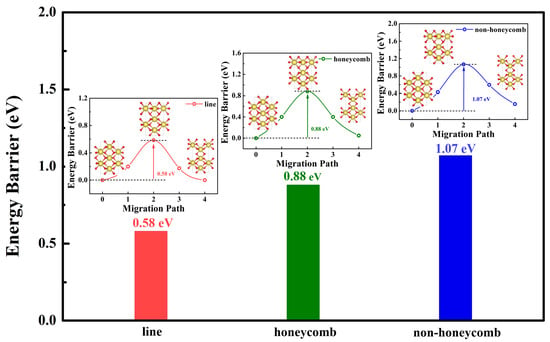
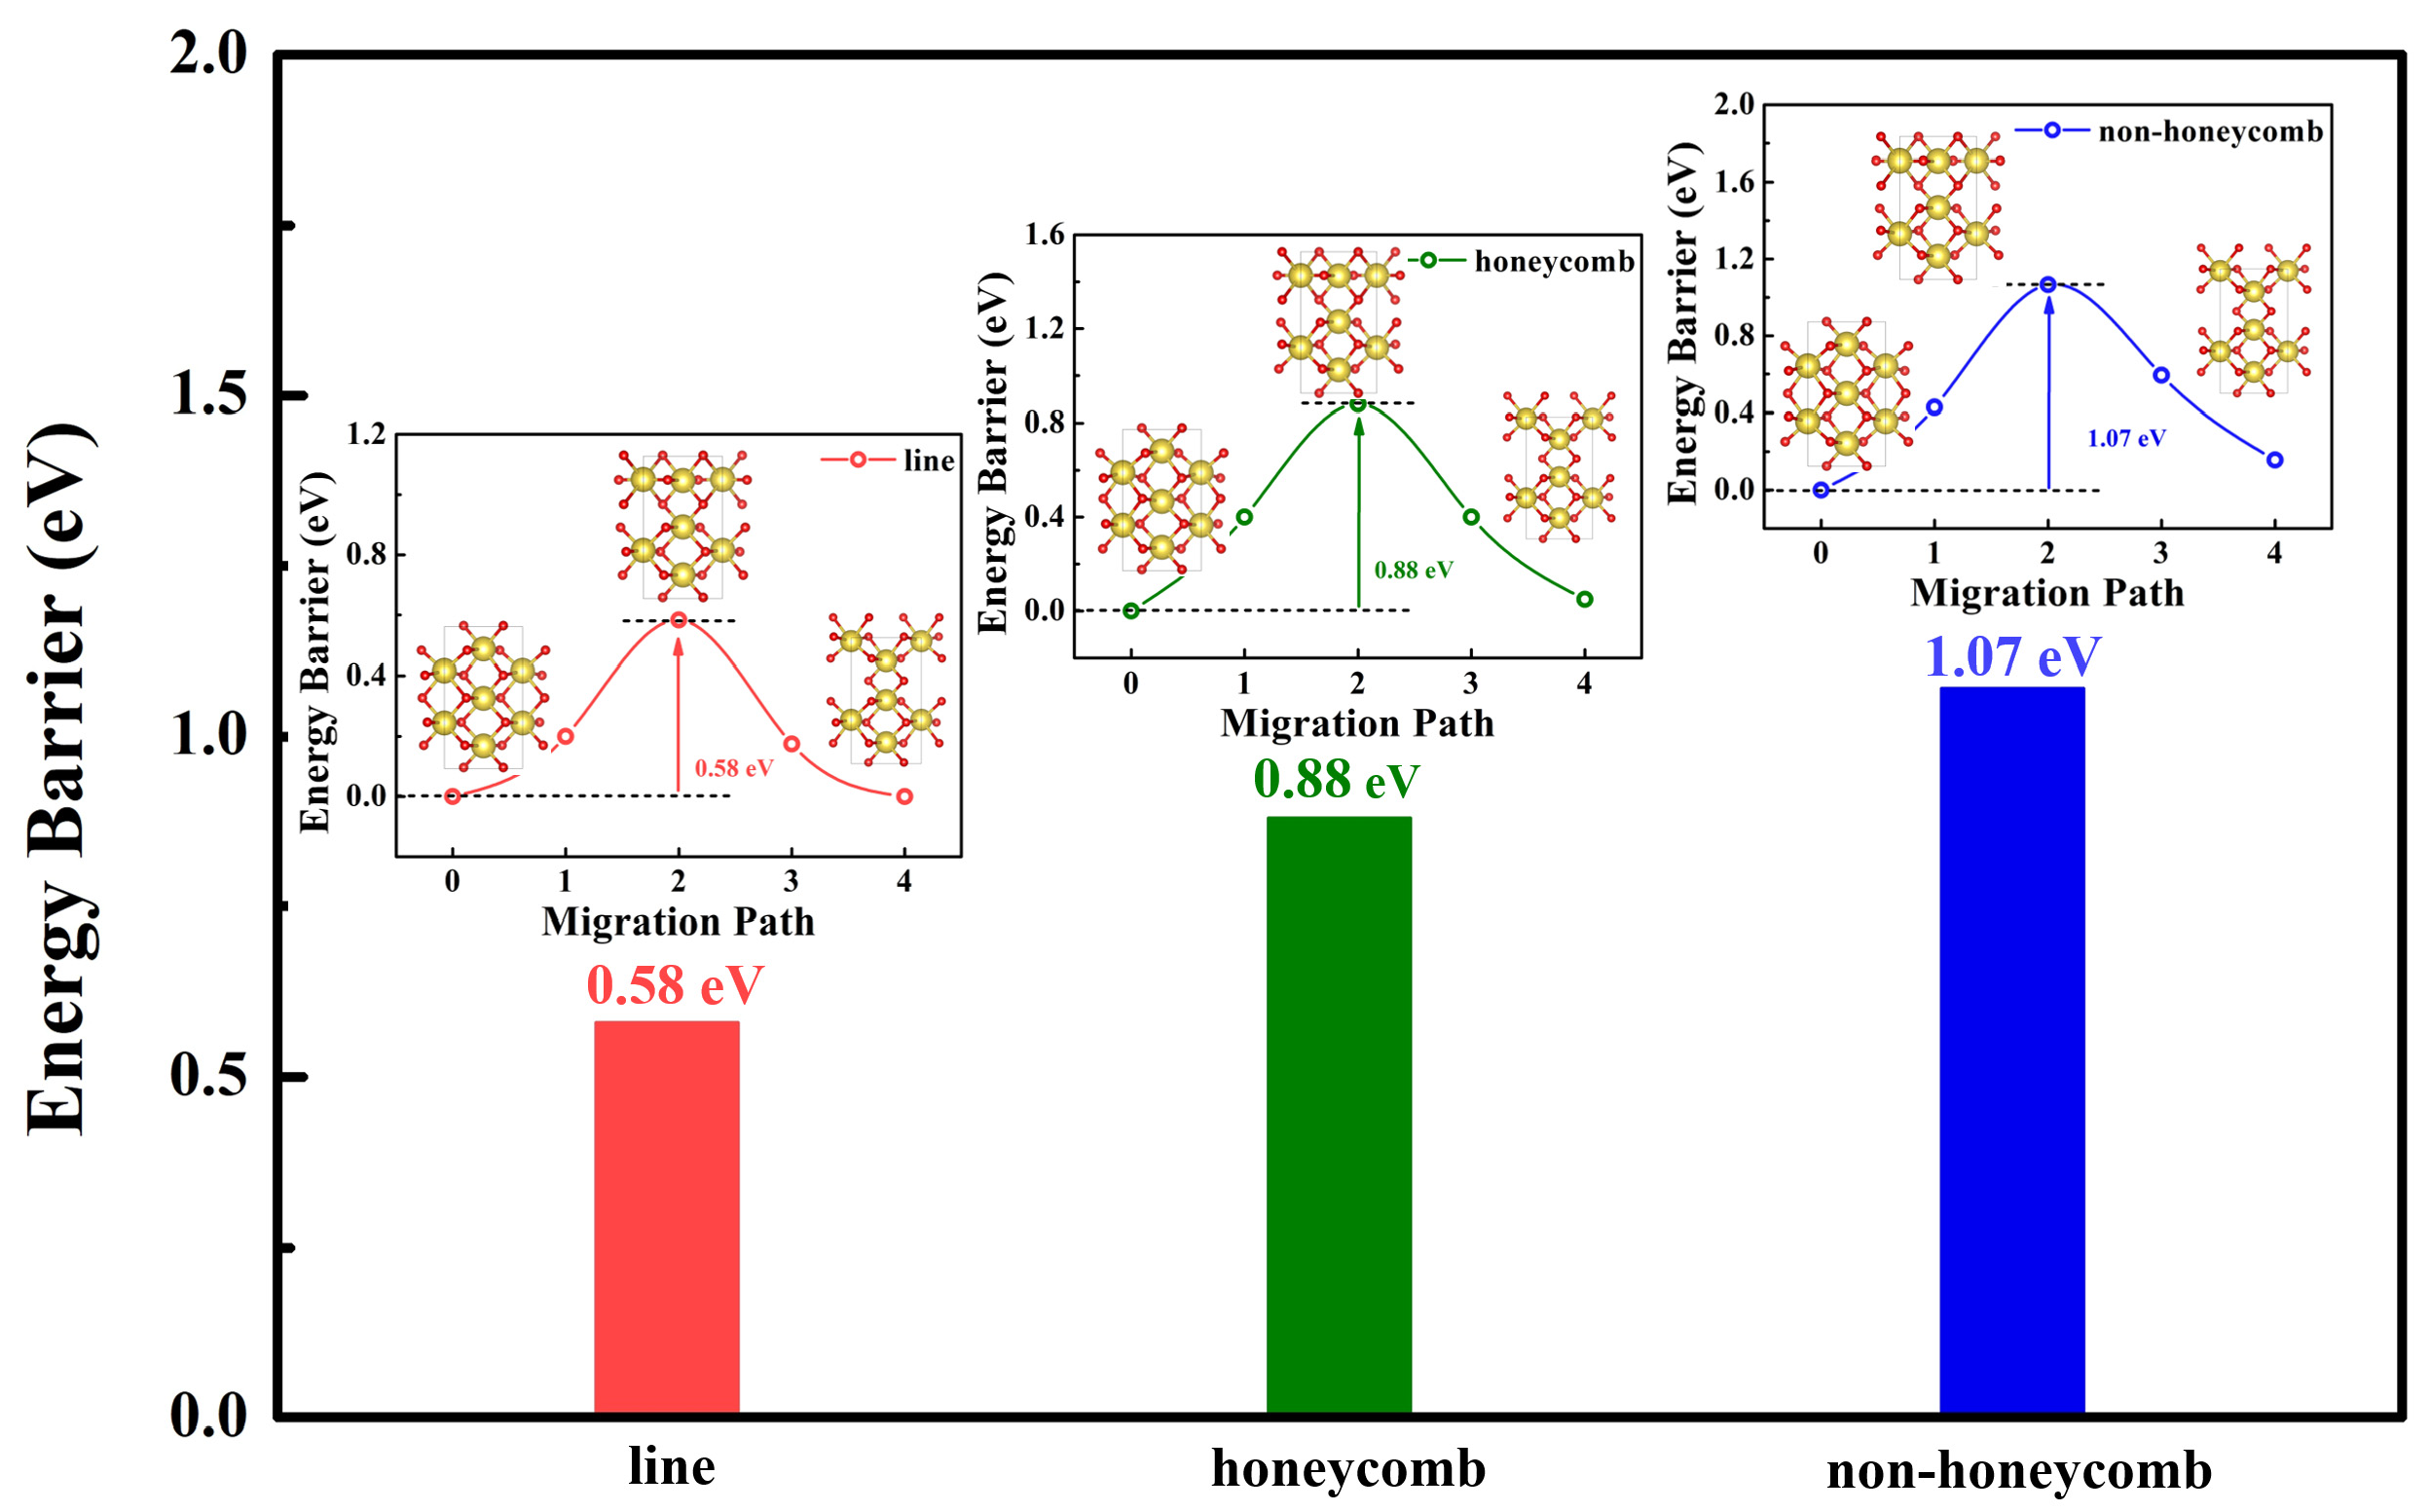
We first investigated the Na-ion in-plane migration in Na0.83LiyMn1-yO2 (y = 0.17 and 0.33) with the line, honeycomb and non-honeycomb systems. At this Na content, one Na vacancy is present in the AM layer, providing a representative configuration for evaluating Na-ion migration. Alternative Na-ion in-plane migration pathways were tested at x = 0.83. For each configuration, the pathway with the lowest barrier among those tested was selected for comparison. Figure 4 shows the calculated migration barriers and the corresponding energy profiles.
Figure 4.
The energy profiles and migration barrier of Na-ion in-plane migration in the line, honeycomb and non-honeycomb configurations of Na0.83LiyMn1-yO2 (y = 0.17 and 0.33).
As shown in Figure 4, the calculated Na-ion in-plane migration barriers for the line, honeycomb, and non-honeycomb configurations are 0.58, 0.88 and 1.07 eV, respectively. The line configuration exhibits the lowest migration barrier, whereas the non-honeycomb configuration shows the highest one. Since the line configuration has a lower Li concentration (y = 0.17) than the honeycomb and non-honeycomb configurations (y = 0.33), the difference between the line and the other two configurations reflects the combined effects of Li concentration and Li/Mn distribution. In contrast, the honeycomb and non-honeycomb configurations have the same Li concentration but different Li/Mn arrangements, and their migration barriers differ by 0.19 eV. For the pathways examined at x = 0.83, the 0.19 eV barrier difference between the honeycomb and non-honeycomb configurations indicates an arrangement-dependent difference at fixed Li content. The result demonstrates that the spatial distribution of Li and Mn can significantly influence Na-ion migration at a fixed Li concentration. The different Li/Mn arrangements modify the local coordination and electrostatic environment around the Na-ion migration pathway, thereby leading to different migration barriers.
3.4.2. Li-Ion Interlayer Migration
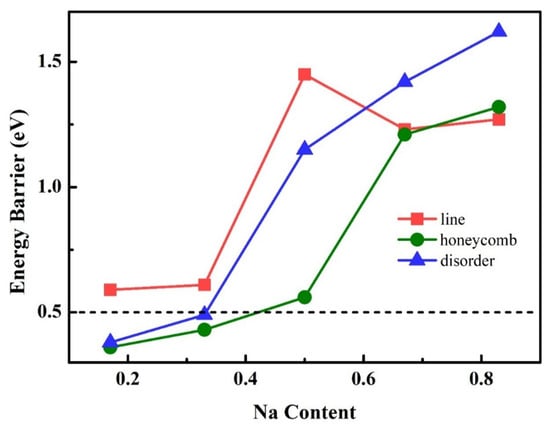
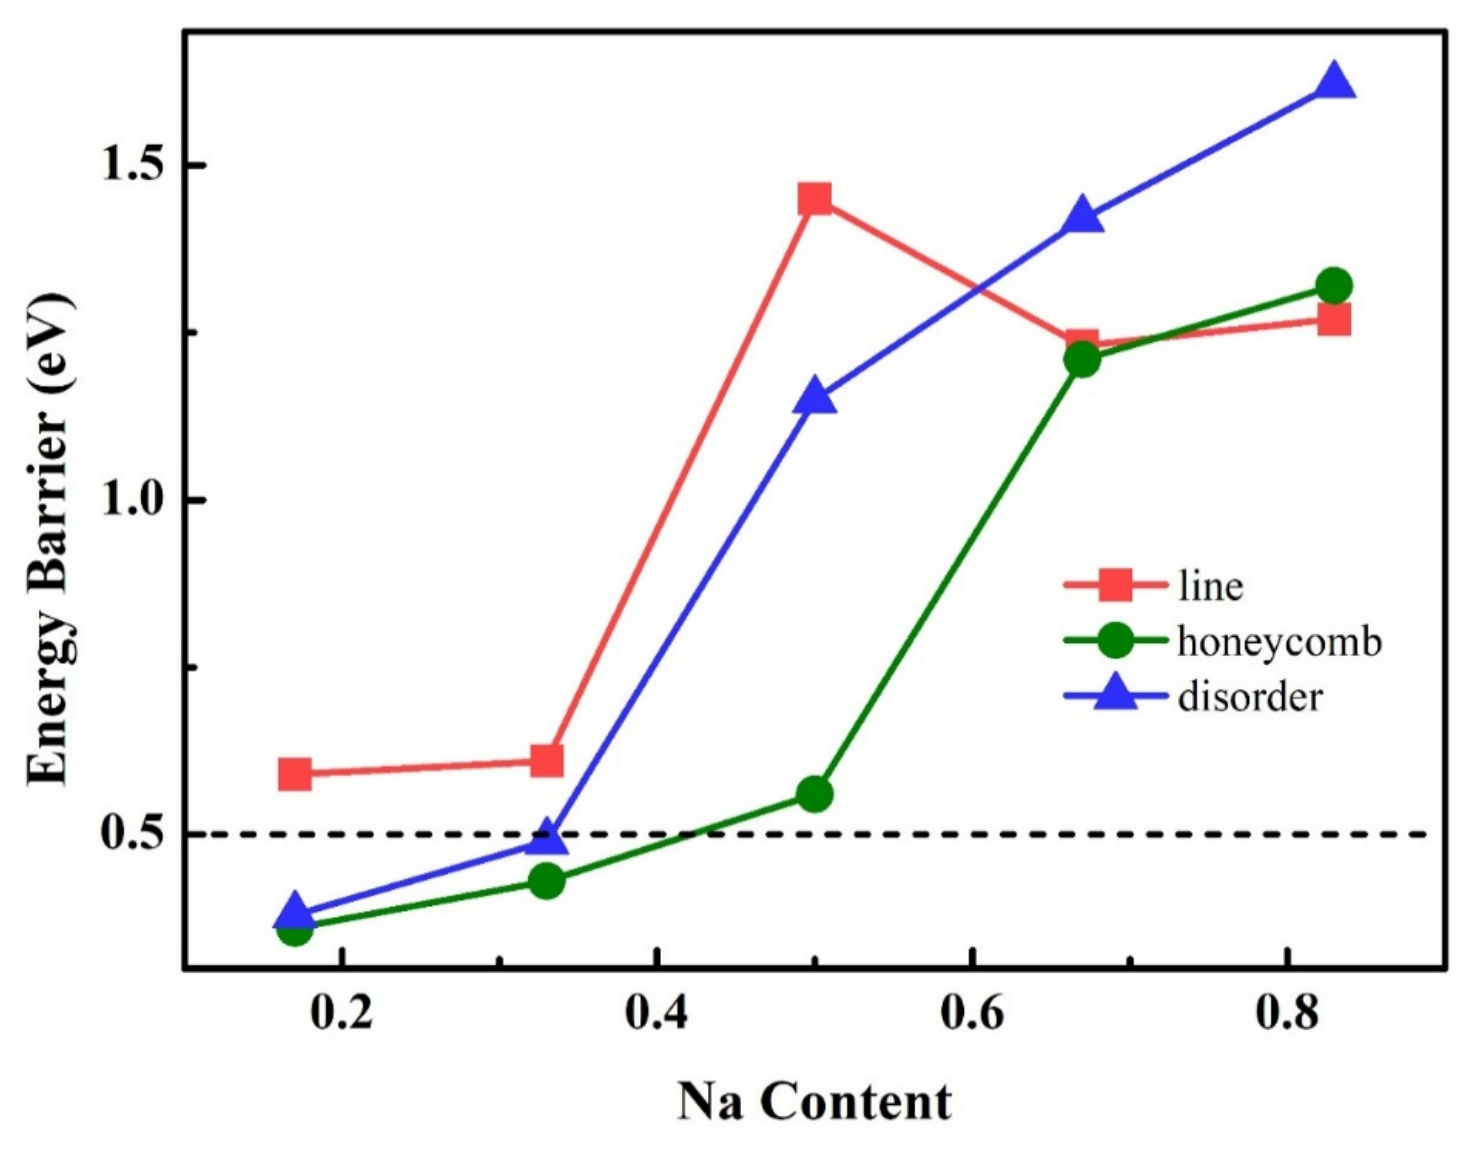
During the desodiation process, the formation of Na vacancies in the AM layer may provide accessible sites for Li migration from the TM layer to the AM layer. Such Li-ion interlayer migration may induce cation redistribution and consequently affect the structural stability of the cathode. Therefore, we calculated the Li-ion interlayer migration barriers at different Na contents for the line, honeycomb, and non-honeycomb configurations, as shown in Figure 5. The corresponding migration energy profiles are shown in Figures S3–S5 (Supplementary Materials). The total energies of the corresponding initial and final states are listed in Table S6 (Supporting Information). As shown in Figure 5, the Li-ion migration barriers exhibit a strong dependence on Na content. The migration barriers are generally higher in the Na-rich states and lower in the Na-poor states, although the line configuration exhibits a nonmonotonic dependence on Na content.
Figure 5.
The migration barrier of Li interlayer migration at different Na contents in NaLiyMn1-yO2 (y = 0.17 and 0.33) with the line, honeycomb and non-honeycomb configurations. The black dashed line represents an energy barrier of 0.5 eV. The interlayer Li-ion migration barriers for the honeycomb configuration were taken from Ref. [43].
To further distinguish the relative difficulty of Li-ion migration, we introduce an energy barrier of 0.5 eV as a reference, as indicated by the black dashed line in Figure 5. At a Na content of x = 0.17, the Li-ion interlayer migration barriers are 0.59, 0.36, and 0.38 eV for the line, honeycomb and non-honeycomb configurations, respectively. The barriers for the honeycomb and non-honeycomb configurations are both below 0.5 eV, whereas that for the line system is above 0.5 eV, which indicates that Li-ion interlayer migration is relatively easier in the honeycomb and non-honeycomb configurations than in the configurations under Na-poor conditions. For the pathways examined at this Na content, the honeycomb and non-honeycomb configurations have lower Li-ion migration barriers than the line configuration, by 0.23 and 0.21 eV, respectively. The honeycomb and non-honeycomb configurations have the same Li content (y = 0.33), and their calculated barriers differ by only 0.02 eV at x = 0.17, indicating numerically similar barriers for the two pathways examined.
4. Conclusions
In summary, the effects of Li substitution concentration and Li/Mn spatial distribution on the structural, electrochemical, and kinetic properties of three NaLiyMn1-yO2 (y = 0.17 and 0.33) systems, including line (y = 0.17), honeycomb (y = 0.33) and non-honeycomb (y = 0.33), were systematically investigated by using first-principles calculations. For each of the three systems, all Na-vacancy configurations in NaxLiyMn1-yO2 (x = 0, 0.17, 0.33, 0.5, 0.67 and 0.83, y = 0.17 and 0.33) were considered to determine the lowest-energy configuration at each Na content. We then calculated the average desodiation voltage, electronic structure, Na-ion in-plane and Li-ion interlayer migration barriers for the line, honeycomb and non-honeycomb systems. The average desodiation voltages are 3.85, 4.55 and 4.24 V for the line, honeycomb and non-honeycomb configurations, respectively. The differences involving the line configuration reflect simultaneous changes in Li content and arrangement and therefore cannot be assigned to Li content alone. Moreover, the honeycomb system exhibits a 0.31 V higher average desodiation voltage than the non-honeycomb system with the same Li concentration, demonstrating that the spatial distribution of Li and Mn within the TM layer can regulate the electrochemical properties. Furthermore, the electronic structure calculations show that the line and non-honeycomb systems exhibit semiconducting characteristics, whereas the honeycomb system shows metallic behavior in the fully sodiated state (x = 1). Notably, although the honeycomb and non-honeycomb configurations have the same Li concentration, they exhibit different total density of states, demonstrating that the electronic structure is sensitive to the spatial arrangement of Li and Mn in the TM layer. For the kinetic properties, Na-ion in-plane migration barriers are 0.58, 0.88, and 1.07 eV for the Na0.83LiyMn1-yO2 with line, honeycomb and non-honeycomb configurations, respectively. The line configuration has the lowest barrier and the non-honeycomb configuration the highest. The difference between the honeycomb and non-honeycomb configurations demonstrates an arrangement-dependent barrier difference at fixed Li content. Meanwhile, Li-ion interlayer migration barriers are generally lower in the Na-poor states, although the line configuration exhibits a nonmonotonic dependence on Na content. In particular, the honeycomb and non-honeycomb configurations have numerically similar Li-ion migration barriers of 0.36 and 0.38 eV, respectively, both below the 0.59 eV barrier of the line configuration.
Supplementary Materials
The following supporting information can be downloaded at: https://www.mdpi.com/article/10.3390/ma19224871/s1, Table S1. The energies of all Na-vacancy configurations for the line configuration of NaxLi0.17Mn0.83O2 (x = 0, 0.17, 0.33, 0.5, 0.67 and 0.83). Table S2. The energies of all Na-vacancy configurations for the honeycomb configurations of NaxLi0.33Mn0.67O2 (x = 0, 0.17, 0.33, 0.5, 0.67 and 0.83). The total energies listed in this table were taken from Ref. [43]. Table S3. The energies of all Na-vacancy configurations for the non-honeycomb configurations of NaxLi0.33Mn0.67O2 (x = 0, 0.17, 0.33, 0.5, 0.67 and 0.83). Table S4. The desodiation voltages (V) for the line, honeycomb and non-honeycomb configurations of NaxLiyMn1-yO2 (x = 0.17, 0.33, 0.5, 0.67, 0.83 and 1.0, y = 0.17 and 0.33). Table S5. Magnetic moment of each O atom for the line, honeycomb and non-honeycomb configurations of NaxLiyMn1-yO2 (x = 0 and 1, y = 0.17 and 0.33). Table S6. Total energies of the initial (ini) and final (fin) states for Li interlayer migration in the line, honeycomb and non-honeycomb configurations of NaxLiyMn1-yO2 (x = 0.17, 0.33, 0.5, 0.67 and 0.83, y = 0.17 and 0.33). Figure S1. Spin-polarized projected density of states (PDOS) of Mn at different Na contents for the (a) line, (b) honeycomb and (c) non-honeycomb configurations of NaxLiyMn1-yO2 (x = 0, 0.17, 0.33, 0.5, 0.67, 0.83 and 1, y = 0.17 and 0.33). Figure S2. Spin-polarized projected density of states (PDOS) of O at different Na contents for the (a) line, (b) honeycomb and (c) non-honeycomb configurations of NaxLiyMn1-yO2 (x = 0, 0.17, 0.33, 0.5, 0.67, 0.83 and 1, y = 0.17 and 0.33). Figure S3. The energy profiles of Li-ion interlayer migration for the line configuration of NaxLi0.17Mn0.83O2 (x = 0.17, 0.33, 0.5, 0.67 and 0.83). Figure S4. The energy profiles of Li-ion interlayer migration for the honeycomb configuration of NaxLi0.33Mn0.67O2 (x = 0.17, 0.33, 0.5, 0.67 and 0.83). Figure S5. The energy profiles of Li-ion interlayer migration for the non-honeycomb configuration of NaxLi0.33Mn0.67O2 (x = 0.17, 0.33, 0.5, 0.67 and 0.83).
Author Contributions
Validation, W.Q.; Investigation, W.Q.; Resources, W.Q.; Writing—original draft, W.Q.; Writing—review & editing, Y.X.; Visualization, Y.X.; Supervision, Y.X.; Funding acquisition, W.Q. All authors have read and agreed to the published version of the manuscript.
Funding
This work is supported by the Science and Technology Program Project of Jiujiang City (Study on the Lithium Doping-Superstructure Coupling Mechanism and Performance Optimization of Sodium-Ion Layered Manganese-Based Oxide Cathode Materials), PhD startup fund of Jiangxi Polytechnic University (JZBK25-2-10), and the Science and Technology Research Project of Jiangxi Provincial Department of Education (GJJ2504805).
Data Availability Statement
The original contributions presented in this study are included in the article/Supplementary Materials. Further inquiries can be directed to the corresponding author.
Conflicts of Interest
Author Yinjun Xiong was employed by the State Grid Jiangxi Electric Power Company Jiujiang Power Supply Company. The remaining author declares that the research was conducted in the absence of any commercial or financial relationships that could be construed as a potential conflict of interest.
References
- Cai, X.; Yue, Y.; Yi, Z.; Liu, J.; Sheng, Y.; Lu, Y. Challenges and industrial perspectives on the development of sodium ion batteries. Nano Energy 2024, 129, 110052. [Google Scholar] [CrossRef] [Scilit]
- Sandri, C.; Di Rienzo, R.; Deiaco, A.; Morelli, M.; Cristofoli, G.; Cazzanti, S.; Baronti, F.; Roncella, R.; Saletti, R. Sodium-ion batteries: A review of modeling, safety, and state estimation techniques. J. Energy Storage 2026, 163, 122120. [Google Scholar] [CrossRef] [Scilit]
- Wanison, R.; Syahputra, W.N.H.; Kammuang-lue, N.; Sakulchangsatjatai, P.; Chaichana, C.; Shankar, V.U.; Suttakul, P.; Mona, Y. Engineering aspects of sodium-ion battery: An alternative energy device for Lithium-ion batteries. J. Energy Storage 2024, 100, 113497. [Google Scholar] [CrossRef] [Scilit]
- Shi, C.; Wang, L.; Chen, X.; Li, J.; Wang, S.; Wang, J.; Jin, H. Challenges of layer-structured cathodes for sodium-ion batteries. Nanoscale Horiz. 2022, 7, 338–351. [Google Scholar] [CrossRef] [Scilit] [PubMed]
- Abraham, J.J.; Arro, C.R.A.; Tariq, H.A.; Kahraman, R.; Al-Qaradawi, S.; Al Tahtamouni, T.M.; Shakoor, R.A. Sodium and lithium incorporated cathode materials for energy storage applications—A focused review. J. Power Sources 2021, 506, 230098. [Google Scholar] [CrossRef] [Scilit]
- Li, P.; Wang, X.; Xu, W.; Zhou, Y.; Huang, L.; Chen, J. Research Progress on Optimization Strategies for Low-Temperature Performance of Sodium-Ion Batteries. Materials 2026, 19, 3634. [Google Scholar] [CrossRef] [Scilit] [PubMed]
- Alcantara, R.; Perez-Vicente, C.; Lavela, P.; Tirado, J.L.; Medina, A.; Stoyanova, R. Review and New Perspectives on Non-Layered Manganese Compounds as Electrode Material for Sodium-Ion Batteries. Materials 2023, 16, 6970. [Google Scholar] [CrossRef] [Scilit] [PubMed]
- Guo, Y.-J.; Jin, R.-X.; Fan, M.; Wang, W.-P.; Xin, S.; Wan, L.-J.; Guo, Y.-G. Sodium layered oxide cathodes: Properties, practicality and prospects. Chem. Soc. Rev. 2024, 53, 7828–7874. [Google Scholar] [CrossRef] [Scilit] [PubMed]
- He, S.; Zhang, R.; Han, X.; Zhou, Y.; Zheng, C.; Li, C.; Xue, X.; Chen, Y.; Wu, Z.; Gan, J.; et al. Unraveling 3d Transition Metal (Ni, Co, Mn, Fe, Cr, V) Ions Migration in Layered Oxide Cathodes: A Pathway to Superior Li-Ion and Na-Ion Battery Cathodes. Adv. Mater. 2025, 37, 2413760. [Google Scholar] [CrossRef] [Scilit] [PubMed]
- Jia, S.; Kumakura, S.; McCalla, E. Unravelling air/moisture stability of cathode materials in sodium ion batteries: Characterization, rational design, and perspectives. Energy Environ. Sci. 2024, 17, 4343–4389. [Google Scholar] [CrossRef] [Scilit]
- Li, Y.J.; Zhu, Y.F.; Chen, B.B.; Jia, X.B.; Xin, H.; Zhao, G.Z.; Zhu, G.; Dou, S.X.; Xiao, Y. Jahn-Teller Effect in Sodium Layered Oxide Cathodes: Inducement Mechanisms, Mitigation Strategies, and Rational Utilizations. Adv. Funct. Mater. 2025, 35, 2504096. [Google Scholar] [CrossRef] [Scilit]
- Zuo, W.; Qiu, J.; Liu, X.; Ren, F.; Liu, H.; He, H.; Luo, C.; Li, J.; Ortiz, G.F.; Duan, H.; et al. The stability of P2-layered sodium transition metal oxides in ambient atmospheres. Nat. Commun. 2020, 11, 3544. [Google Scholar] [CrossRef] [Scilit] [PubMed]
- Delmas, C.; Fouassier, C.; Hagenmuller, P. Structural classification and properties of the layered oxides. Phys. B+C 1980, 99, 81–85. [Google Scholar] [CrossRef] [Scilit]
- Manzi, J.; Paolone, A.; Palumbo, O.; Corona, D.; Massaro, A.; Cavaliere, R.; Muñoz-García, A.B.; Trequattrini, F.; Pavone, M.; Brutti, S. Monoclinic and Orthorhombic NaMnO2 for Secondary Batteries: A Comparative Study. Energies 2021, 14, 1230. [Google Scholar] [CrossRef] [Scilit]
- Matsumae, Y.; Suzuki, R.; Komiya, K.; Higuchi, M. Microwave synthesis of NaxMnO2 cathode materials for a sodium-ion battery. J. Ceram. Soc. Jpn. 2020, 128, 544–546. [Google Scholar] [CrossRef] [Scilit]
- Zheng, L.; Wang, Z.; Wu, M.; Xu, B.; Ouyang, C. Jahn–Teller type small polaron assisted Na diffusion in NaMnO2 as a cathode material for Na-ion batteries. J. Mater. Chem. A 2019, 7, 6053–6061. [Google Scholar] [CrossRef] [Scilit]
- Guo, S.; Yu, H.; Jian, Z.; Liu, P.; Zhu, Y.; Guo, X.; Chen, M. A High-Capacity, Low-Cost Layered Sodium Manganese Oxide Material as Cathode for Sodium-Ion Batteries. ChemSusChem 2014, 7, 2115–2119. [Google Scholar] [CrossRef] [Scilit] [PubMed]
- Ma, X.; Chen, H.; Ceder, G. Electrochemical Properties of Monoclinic NaMnO2. J. Electrochem. Soc. 2011, 158, A1307. [Google Scholar] [CrossRef] [Scilit]
- Huang, Y.; Zhu, Y.; Nie, A.; Fu, H.; Hu, Z.; Sun, X.; Haw, S.C.; Chen, J.M.; Chan, T.S.; Yu, S.; et al. Enabling Anionic Redox Stability of P2-Na5/6Li1/4Mn3/4O2 by Mg Substitution. Adv. Mater. 2022, 34, e2105404. [Google Scholar] [CrossRef] [Scilit] [PubMed]
- Li, S.; Xiao, Y.; Zhu, Y.-F.; Li, Y.-C.; Chen, T.; Wang, D.; Liu, Y.-H.; Liu, H.; Li, Y.; Li, C.; et al. A Li-substituted hydrostable layered oxide cathode material with oriented stacking nanoplate structure for high-performance sodium-ion battery. Chem. Eng. J. 2021, 412, 128719. [Google Scholar] [CrossRef] [Scilit]
- Li, Z.-Y.; Ma, X.; Sun, K.; He, L.; Li, Y.; Chen, D. Na2/3Li1/9[Ni2/9Li1/9Mn2/3]O2: A High-Performance Solid-Solution Reaction Layered Oxide Cathode Material for Sodium-Ion Batteries. ACS Appl. Energy Mater. 2021, 5, 1126–1135. [Google Scholar] [CrossRef] [Scilit]
- Liang, X.; Kim, H.; Jung, H.G.; Sun, Y.K. Lithium-Substituted Tunnel/Spinel Heterostructured Cathode Material for High-Performance Sodium-Ion Batteries. Adv. Funct. Mater. 2020, 31, 2008569. [Google Scholar] [CrossRef] [Scilit]
- Wang, C.; Liu, L.; Zhao, S.; Liu, Y.; Yang, Y.; Yu, H.; Lee, S.; Lee, G.-H.; Kang, Y.-M.; Liu, R.; et al. Tuning local chemistry of P2 layered-oxide cathode for high energy and long cycles of sodium-ion battery. Nat. Commun. 2021, 12, 2256. [Google Scholar] [CrossRef] [Scilit] [PubMed]
- Yang, L.; Li, X.; Ma, X.; Xiong, S.; Liu, P.; Tang, Y.; Cheng, S.; Hu, Y.-Y.; Liu, M.; Chen, H. Design of high-performance cathode materials with single-phase pathway for sodium ion batteries: A study on P2-Nax(LiyMn1−y)O2 compounds. J. Power Sources 2018, 381, 171–180. [Google Scholar] [CrossRef] [Scilit]
- Prosini, P.P.; Carewska, M.; Cento, C.; Tarquini, G.; Maroni, F.; Birrozzi, A.; Nobili, F. Tin-Decorated Reduced Graphene Oxide and NaLi0.2Ni0.25Mn0.75O2 as Electrode Materials for Sodium-Ion Batteries. Materials 2019, 12, 1027. [Google Scholar] [CrossRef] [Scilit] [PubMed]
- Zhan, W.; Wang, Y.; Wang, X.; Yang, H.; Feng, Q.; Wang, X. Mg/Li Co-Doping Activates Anionic Redox in Sodium-Ion Battery Layered Oxides. Materials 2026, 19, 2006. [Google Scholar] [CrossRef] [Scilit] [PubMed]
- Liu, Y.; Wang, C.; Zhao, S.; Zhang, L.; Zhang, K.; Li, F.; Chen, J. Mitigation of Jahn–Teller distortion and Na+/vacancy ordering in a distorted manganese oxide cathode material by Li substitution. Chem. Sci. 2021, 12, 1062–1067. [Google Scholar] [CrossRef] [Scilit] [PubMed]
- de la Llave, E.; Talaie, E.; Levi, E.; Nayak, P.K.; Dixit, M.; Rao, P.T.; Hartmann, P.; Chesneau, F.; Major, D.T.; Greenstein, M.; et al. Improving Energy Density and Structural Stability of Manganese Oxide Cathodes for Na-Ion Batteries by Structural Lithium Substitution. Chem. Mater. 2016, 28, 9064–9076. [Google Scholar] [CrossRef] [Scilit]
- Wang, Q.; Mariyappan, S.; Rousse, G.; Morozov, A.V.; Porcheron, B.; Dedryvère, R.; Wu, J.; Yang, W.; Zhang, L.; Chakir, M.; et al. Unlocking anionic redox activity in O3-type sodium 3d layered oxides via Li substitution. Nat. Mater. 2021, 20, 353–361. [Google Scholar] [CrossRef] [Scilit] [PubMed]
- Kang, S.; Lee, S.; Lee, H.; Kang, Y.-M. Manipulating disorder within cathodes of alkali-ion batteries. Nat. Rev. Chem. 2024, 8, 587–604. [Google Scholar] [CrossRef] [Scilit] [PubMed]
- Kim, E.J.; Maughan, P.A.; Bassey, E.N.; Clément, R.J.; Ma, L.A.; Duda, L.C.; Sehrawat, D.; Younesi, R.; Sharma, N.; Grey, C.P.; et al. Importance of Superstructure in Stabilizing Oxygen Redox in P3-Na0.67Li0.2Mn0.8O2. Adv. Energy Mater. 2021, 12, 2102325. [Google Scholar] [CrossRef] [Scilit]
- Liechtenstein, A.I.; Anisimov, V.I.; Zaanen, J. Density-functional theory and strong interactions: Orbital ordering in Mott-Hubbard insulators. Phys. Rev. B 1995, 52, R5467–R5470. [Google Scholar] [CrossRef] [Scilit] [PubMed]
- Neuhauser, D.; Baer, R.; Rabani, E. Communication: Embedded fragment stochastic density functional theory. J. Chem. Phys. 2014, 141, 041102. [Google Scholar] [CrossRef] [Scilit] [PubMed]
- Kresse, G.; Hafner, J. Ab initiomolecular-dynamics simulation of the liquid-metal–amorphous-semiconductor transition in germanium. Phys. Rev. B 1994, 49, 14251–14269. [Google Scholar] [CrossRef] [Scilit] [PubMed]
- Kresse, G.; Furthmüller, J. Efficiency of ab-initio total energy calculations for metals and semiconductors using a plane-wave basis set. Comput. Mater. Sci. 1996, 6, 15–50. [Google Scholar] [CrossRef] [Scilit]
- Blöchl, P.E. Projector augmented-wave method. Phys. Rev. B 1994, 50, 17953–17979. [Google Scholar] [CrossRef] [Scilit] [PubMed]
- Kresse, G.; Joubert, D. From ultrasoft pseudopotentials to the projector augmented-wave method. Phys. Rev. B 1999, 59, 1758–1775. [Google Scholar] [CrossRef] [Scilit]
- Perdew, J.P.; Burke, K.; Ernzerhof, M. Generalized Gradient Approximation Made Simple. Phys. Rev. Lett. 1996, 77, 3865–3868. [Google Scholar] [CrossRef] [Scilit] [PubMed]
- Anisimov, V.I.; Zaanen, J.; Andersen, O.K. Band theory and Mott insulators: HubbardUinstead of StonerI. Phys. Rev. B 1991, 44, 943–954. [Google Scholar] [CrossRef] [Scilit] [PubMed]
- Monkhorst, H.J.; Pack, J.D. Special points for Brillouin-zone integrations. Phys. Rev. B 1976, 13, 5188–5192. [Google Scholar] [CrossRef] [Scilit]
- Henkelman, G.; Uberuaga, B.P.; Jonsson, H. A climbing image nudged elastic band method for finding saddle points. J. Chem. Phys. 2000, 113, 9901–9904. [Google Scholar] [CrossRef] [Scilit]
- Moellmann, J.; Grimme, S. DFT-D3 Study of Some Molecular Crystals. J. Phys. Chem. C 2014, 118, 7615–7621. [Google Scholar] [CrossRef] [Scilit]
- Qin, W.; Li, M.; Sun, B.; Wu, M.; Liu, S.; Xu, B. Deep insight on Li interlayer migration in O3-type NaLi1/3Mn2/3O2 as a cathode material for Na-ion batteries. J. Chem. Phys. 2024, 161, 014702. [Google Scholar] [CrossRef] [Scilit] [PubMed]

Disclaimer/Publisher’s Note: The statements, opinions and data contained in all publications are solely those of the individual author(s) and contributor(s) and not of MDPI and/or the editor(s). MDPI and/or the editor(s) disclaim responsibility for any injury to people or property resulting from any ideas, methods, instructions or products referred to in the content. |
© 2026 by the authors. Licensee MDPI, Basel, Switzerland. This article is an open access article distributed under the terms and conditions of the Creative Commons Attribution (CC BY) license.