


Abstract
This study investigated the potential use of asphalt concrete produced with locally sourced limestone and granite aggregates as an impervious core material in rockfill dams. An independent laboratory program evaluated 16 mixture conditions comprising two aggregate types, asphalt cement contents of 6% and 7%, and nominal target air-void contents of 1–4%. Marshall, hydraulic-conductivity, and consolidated-undrained triaxial tests were conducted to characterize the mixtures. The reported hydraulic conductivity ranged from 2.9549 × 10⁻¹⁰ to 3.8887 × 10⁻⁵ cm/s, while effective cohesion and friction angle ranged from 165.7 to 540.3 kPa and 34.07° to 55.61°, respectively. Four core-property datasets corresponding to a 2% target air-void content were evaluated using two-dimensional GeoStudio analyses under steady-state and rapid-drawdown conditions. Steady-state seepage discharge ranged from 1.967 × 10⁻⁹ to 6.7191 × 10⁻⁶ m3/s, with downstream global factors of safety of 2.209–2.215. The upstream global factor of safety at Day 7 of rapid drawdown was 2.041 for all four datasets. The granite mixture containing 7% asphalt cement and a target air-void content of 2% (Granite AC7% AV2%) was subsequently selected as a representative, rather than optimal, core-property dataset for a separate steady-state geometry comparison. Relative to the conventional clay-core baseline, a 0.50-m-thick asphalt concrete core with shell slopes of 1 V:1.5 H and 1 V:1.4 H reduced the calculated embankment volume per unit dam length by 21.11% and 24.83%, respectively, with corresponding global factors of safety of 1.655 and 1.557. A supplementary rapid-drawdown assessment of the steepest alternative yielded an upstream global factor of safety of 1.473 at Day 6, the lowest among the reported daily results. The findings provide comparative laboratory data and case-specific numerical results for preliminary assessment of asphalt concrete dam cores. Hydraulic acceptance and field-scale suitability are not established, and further experimental verification and numerical sensitivity assessments remain necessary before application.
1. Introduction
Rockfill dams commonly incorporate an impervious core to control seepage through the embankment and maintain satisfactory hydraulic and structural performance. Compacted clay is a conventional core material, whereas asphalt concrete provides an alternative impervious-core system that has been applied in embankment dams [1]. The selection of a suitable core material depends on project-specific material availability, construction requirements, and the hydraulic and mechanical performance required for the dam. Asphalt concrete cores can exhibit very low hydraulic conductivity, substantial deformation capacity, and the ability to seal minor cracks under favorable stress and temperature conditions [2].
The hydraulic and mechanical performance of asphalt concrete cores depends on several interacting mixture variables, including asphalt cement content, aggregate gradation and mineralogy, filler content, density, and air-void content. Seo et al. [3] demonstrated that mixture composition and filler content strongly influence the volumetric, strength, and hydraulic properties of asphalt concrete developed for asphalt-core rockfill dams. Previous experimental studies have also shown that the stress–strain response of hydraulic asphalt concrete is sensitive to temperature, loading rate, and stress state [4,5,6,7]. Wang and Höeg [8] further demonstrated the importance of time-, stress-, and temperature-dependent behavior when defining material models for asphalt concrete cores. More recent investigations have addressed the influence of aggregate mineralogy on the performance degradation of hydraulic asphalt concrete under water exposure [9] and construction techniques for high asphalt concrete core rockfill dams under challenging geological conditions [10]. Collectively, these studies demonstrate that asphalt concrete intended for hydraulic structures cannot be evaluated solely using conventional pavement-mixture criteria; its hydraulic conductivity, deformation response, shear strength, and compatibility with adjacent dam zones must also be established.
Previous investigations have evaluated the use of asphalt concrete as an impervious core material in embankment dams [8,11,12]. Of particular relevance, Rewtragulapaibul et al. [11] investigated clay-core and asphalt concrete core embankments using laboratory characterization and GeoStudio numerical analyses. Their laboratory program primarily considered limestone-based asphalt concrete mixtures containing 6% asphalt cement and three nominal target air-void levels of 1%, 2%, and 3%. Their numerical investigation examined the effects of core material, core thickness, embankment slope, reservoir conditions, and surcharge loading. The present study builds upon this research direction but is based on an independent experimental program conducted by different laboratory personnel during a separate testing period, rather than reusing the experimental measurements reported in [11]. The current laboratory program extends the material-comparison scope to both limestone and granite aggregates, two asphalt cement contents (6% and 7%), and four nominal target air-void levels (1–4%), comprising 16 investigated mixture conditions. The resulting hydraulic conductivity, Marshall properties, and effective shear-strength parameters are evaluated across these conditions, and four selected laboratory-derived core-property datasets are incorporated into a common two-dimensional GeoStudio framework to compare their seepage and slope-stability responses. Alternative embankment configurations are also assessed in terms of calculated global stability and material quantities. Accordingly, the principal contribution of the present study is the generation and comparative evaluation of an independent, expanded experimental dataset and its application to preliminary dam-core material selection and embankment geometry assessment. The study does not claim novelty in the individual laboratory methods, the GeoStudio modeling approach, or the comparison between clay and asphalt concrete cores. Furthermore, because aggregate gradation and other mixture characteristics varied alongside the nominal target air-void levels, the observed differences should not be interpreted as independently isolated effects of aggregate mineralogy or air-void content.
The present study addresses this gap through complementary laboratory and numerical investigations. First, asphalt concrete mixtures were produced using locally sourced limestone and granite aggregates, asphalt cement contents of 6% and 7%, and target air-void contents of 1%, 2%, 3%, and 4%. Second, laboratory tests were conducted to characterize mixture density, hydraulic conductivity, Marshall stability and flow, and effective shear-strength parameters obtained from consolidated-undrained triaxial compression tests with pore-water-pressure measurements. Third, four asphalt concrete core-property datasets corresponding to limestone- and granite-based mixtures containing 6% and 7% asphalt cement at a target air-void content of 2% were evaluated using GeoStudio. Each dataset was analyzed under steady-state normal-reservoir and transient rapid-drawdown conditions using the same two-dimensional dam geometry, non-core material properties, and boundary conditions, resulting in eight numerical analyses. Finally, the granite mixture containing 7% asphalt cement and a target air-void content of 2% (Granite AC7% AV2%) was selected as a representative mixture for the preliminary embankment geometry comparison based on a combined consideration of its measured hydraulic conductivity and derived effective shear-strength parameters. This selection was intended to provide a consistent core-property dataset for comparing alternative geometries and should not be interpreted as demonstrating that this mixture is optimal for all hydraulic, mechanical, or construction conditions. These configurations comprised a conventional clay-core baseline and four asphalt concrete core alternatives with different transition-zone widths and shell slopes. Material quantities were calculated per unit length of dam to evaluate the potential reduction in total embankment volume. This integrated approach provides a broader assessment of the hydraulic, mechanical, stability, and material-efficiency implications of using asphalt concrete as an impervious core material in rockfill dams.
Accordingly, this study aims to assess whether asphalt concrete produced from locally available limestone and granite aggregates can exhibit hydraulic and mechanical properties compatible with its use as an impervious core in rockfill dams under the investigated laboratory and numerical conditions. The assessment focuses on (i) the observed relationships between aggregate type, asphalt cement content, target air-void content, and hydraulic conductivity; (ii) the shear-strength characteristics derived from triaxial testing; (iii) modeled seepage and slope-stability performance under normal-reservoir and rapid-drawdown conditions; and (iv) the effects of core type, transition-zone width, and shell slope on slope stability and embankment material quantities. Temperature-dependent behavior, seismic loading, long-term aging, and field-scale construction performance are outside the scope of the present investigation. Therefore, the relevance of the study to tropical regions is associated with the use of locally available construction materials and regional dam applications rather than with the direct simulation of tropical temperature or environmental exposure. The numerical findings are interpreted as comparative results for the specified two-dimensional dam geometry, material-property assignments, hydraulic boundary conditions, and loading scenarios. Accordingly, the calculated seepage discharges, factors of safety, and material-volume reductions are not presented as universally applicable design predictions. Further experimental verification and numerical sensitivity assessments are necessary before the findings can be extended to other dam configurations or field-scale applications.
2. Materials and Methods
2.1. Asphalt Cement Properties
The binder used in this study was penetration-grade AC 60/70 asphalt cement. According to the laboratory material records, the binder complied with the requirements of TIS 851-2561 [13]. The documented specification properties used to identify and verify the supplied binder are summarized in Table 1. These values were obtained from the material records and were not independently determined as part of the present experimental program.
Table 1.
Documented specification properties of the AC 60/70 asphalt cement used in this study.
2.2. Asphalt Concrete Mix Design
Asphalt concrete mixtures were proportioned using the Marshall mix design method, which is widely used for dense asphalt mixtures requiring low air-void contents [3,14]. Target air-void levels of 1%, 2%, 3%, and 4% were investigated at asphalt cement contents of 6% and 7% by mass of aggregate. Limestone and granite were selected as aggregate types representing construction materials commonly available in Thailand. The air-void contents of 1%, 2%, 3%, and 4% were specified as nominal target levels during mixture design. Accordingly, the AV1%–AV4% designations used throughout this study refer to the target mixture conditions rather than verified measured air-void contents for every individual specimen. Although air-void measurements are available in the laboratory records, a complete specimen-level correspondence between these records and the summarized Marshall results presented in Section 3.1 could not be established. Therefore, no unverified measured air-void values were assigned to the reported mixture conditions.
Aggregate gradation was controlled through hot-bin blending following recommendations for asphalt concrete cores in embankment dams [15]. The aggregate proportions were determined through an iterative trial-mixture process to obtain the specified target air-void levels while maintaining sufficient workability for specimen preparation. The resulting aggregate blend proportions for mixtures containing 6% and 7% asphalt cement are presented in Table 2 and Table 3, respectively. Because the aggregate blend proportions were adjusted among mixture conditions, the effects of aggregate gradation and target air-void content could not be independently isolated. The achieved air-void content can be calculated from the measured bulk specific gravity (Gmb) and maximum theoretical specific gravity (Gmm) as Va = 100(1 − Gmb/Gmm). However, the available records do not provide a complete, independently verifiable set of specimen-specific Gmb and Gmm values corresponding to the reported results. Consequently, deviations between achieved and nominal target air-void contents cannot be reliably quantified, and the observed differences are not attributed to independently measured air-void effects.
Table 2.
Aggregate blend proportions at an asphalt cement content of 6%.
Table 3.
Aggregate blend proportions at an asphalt cement content of 7%.
The mixture-preparation and Marshall-evaluation procedures were based on the applicable provisions of Department of Highways Standard No. DH-S 408/2532 and Department of Rural Roads Standard No. MTH 230-2563 [16,17]. These highway standards were used as reference procedures for aggregate selection and gradation, mixture-temperature control, job-mix formulation, and laboratory compaction. Requirements specifically related to pavement transportation, paving, surface smoothness, and in-place pavement density were not used as acceptance criteria for the asphalt concrete core mixtures. Marshall stability and flow were determined in accordance with ASTM D6927 [18]. Because the mixtures were developed for an impervious hydraulic core rather than a pavement surface layer, hydraulic conductivity and triaxial shear-strength testing were additionally conducted to evaluate their suitability for the intended application.
For each combination of aggregate type, asphalt cement content, and target air-void content, three Marshall specimens were prepared and compacted using 75 blows per face in accordance with ASTM D6926 [19]. The aggregate blend proportions were adjusted for each mixture series to obtain the target air-void contents of 1%, 2%, 3%, and 4%, as reported in Table 2 and Table 3. Separate compacted specimens representing each mixture condition were prepared for the hydraulic-conductivity tests. No additional reheating or post-compaction treatment was applied after specimen preparation.
The target air-void range of 1–4% was selected to represent dense asphalt concrete mixtures intended for impervious core applications, for which low hydraulic conductivity is a primary performance requirement [4,15].
2.3. Laboratory Testing Program
The laboratory testing program comprised hydraulic-conductivity tests, Marshall stability and flow tests, and consolidated-undrained triaxial compression tests. Hydraulic-conductivity testing was performed on separately prepared cylindrical asphalt concrete specimens representing the 16 investigated mixture conditions. The specimens were installed in rigid-wall metal permeameter cells equipped with bolted end plates, inlet and outlet ports, flexible tubing, and flow-control valves. The resulting hydraulic-conductivity measurements were reported in cm/s and are presented in Section 3.2. The available laboratory documentation identifies the general apparatus configuration but does not provide sufficient information to independently verify the applied hydraulic pressure or gradient, water temperature, specimen dimensions, saturation procedure and verification criteria, test duration, or criteria used to establish steady flow. These procedural details are therefore not inferred, and compliance with a specific hydraulic-conductivity testing standard is not claimed. The archived hydraulic-conductivity records include specimen-level results for the granite mixtures, with three measurements reported for each of the eight mixture conditions. Additional specimen-level records were identified for selected limestone mixtures. The reported mixture-level hydraulic-conductivity values were therefore interpreted as summaries of the available laboratory measurements rather than as evidence of a single test per mixture. However, the completeness of specimen-level replication could not be verified for every limestone mixture condition. Marshall stability and flow were determined in accordance with ASTM D6927 [18].
Consolidated-undrained (CU) triaxial compression tests were performed using a laboratory procedure based on ASTM D4767 [20], adapted for compacted asphalt concrete specimens. For each mixture condition, three specimens were tested under cell pressures of 3, 4, and 5 kgf/cm2 (approximately 294.2, 392.3, and 490.3 kPa), respectively, with a recorded back pressure of 2 kgf/cm2 (approximately 196.1 kPa). The corresponding nominal cell-pressure-minus-back-pressure differences were 1, 2, and 3 kgf/cm2 (approximately 98.1, 196.1, and 294.2 kPa). One specimen was tested at each pressure level. The archived laboratory worksheets document specimen dimensions, axial stress–strain measurements, pore-water-pressure readings, and instrument correction factors. The effective minor principal stress was calculated by subtracting the recorded pore-pressure increment from the nominal initial pressure difference, while the effective major principal stress was obtained by adding the measured deviator stress. The effective cohesion and friction angle were subsequently determined from the three effective-stress failure states for each mixture condition. Although the available worksheets provide the principal measurements used in these calculations, the test temperature, applied strain rate, and saturation-verification criteria were not explicitly documented. Accordingly, full compliance with all procedural requirements of ASTM D4767 could not be independently confirmed.
The effective major and minor principal stresses at failure were calculated as
and
For construction of the effective-stress failure envelope, the transformed stress variables were calculated as
and
The Mohr–Coulomb failure envelope in effective-stress space was expressed as
where σ1,f is the total major principal stress at failure, calculated as σ1,f = σ3 + qf; σ3 is the applied total cell pressure; u0 is the initial back pressure; and Δuf is the excess pore-water-pressure increment recorded during undrained shearing at failure relative to the initial back-pressure condition. Thus, the total pore-water pressure at failure is u0 + Δuf. The initial back pressure was approximately 196.1 kPa, and the nominal initial cell-pressure-minus-back-pressure differences were 98.1, 196.1, and 294.2 kPa. Accordingly, the effective minor principal stress at failure was calculated as σ′3,f = (σ3 − u0) − Δuf and the effective major principal stress as σ′1,f = σ′3,f + qf. Here, p′ is the average of the major and minor effective principal stresses at failure; tf is the radius of the effective-stress Mohr circle; c′ is the effective cohesion; and φ′ is the effective friction angle. The deviator stress at failure is qf = σ1,f − σ3 = σ′1,f − σ′3,f = 2tf. Linear regression of the three transformed failure states obtained for each mixture condition was used to determine its effective-stress failure envelope. Because only one specimen was tested at each confining pressure, the resulting shear-strength parameters represent estimates derived from three failure states, without independent replication at individual confining pressures.
The principal laboratory setups and specimen configurations used for the hydraulic-conductivity and consolidated-undrained triaxial tests are shown in Figure 1.
Figure 1.
Laboratory testing of the asphalt concrete mixtures: (a) multi-cell rigid-wall hydraulic-conductivity testing system; (b) compacted asphalt concrete specimens and rigid-wall permeameter cells; (c) specimen installation and preparation for consolidated-undrained triaxial testing; and (d) asphalt concrete specimen installed in the triaxial pressure cell.
Four core-material property datasets representing limestone- and granite-based asphalt concrete mixtures containing 6% and 7% asphalt cement at a target air-void content of 2% were selected for the numerical analyses. The assigned hydraulic conductivities were obtained from the laboratory measurements, while the effective shear-strength parameters were based on the CU triaxial results. The unit weights and retained model-input values are presented in Section 2.4.2 and Table 4.
Table 4.
Material properties assigned in the GeoStudio numerical models.
2.4. Numerical Modeling
Numerical analyses were performed using GeoStudio 2024.1.0 (version 24.1.0.1406; Seequent, Toronto, ON, Canada), with SEEP/W employed for finite-element seepage analysis and SLOPE/W employed for limit-equilibrium slope-stability analysis. The numerical investigation comprised two complementary stages. In the first stage, four asphalt concrete core-property datasets representing limestone- and granite-based mixtures containing 6% and 7% asphalt cement at a target air-void content of 2% were evaluated under steady-state normal-reservoir and transient rapid-drawdown conditions. Each core-property dataset was analyzed under both hydraulic conditions using the same baseline dam geometry, non-core material properties, and boundary conditions, resulting in eight numerical analyses. In the second stage, Granite AC7% AV2% was selected as the representative asphalt concrete core based on a combined consideration of hydraulic conductivity and the assigned effective cohesion and friction angle. This dataset was used in an additional comparison of five embankment configurations comprising a conventional clay-core baseline and four asphalt concrete core alternatives with different transition-zone widths and shell slopes. The second-stage analysis evaluated slope stability and material quantities per unit length of dam.
2.4.1. Model Geometry
The numerical model represented a two-dimensional cross-section based on the geometry of Khlong Yai Ki Dam. The modeled dam height was 19 m above the foundation rock. Throughout this study, the embankment shell slopes are expressed as vertical-to-horizontal ratios (V:H). For the first-stage comparison of the four asphalt concrete core-property datasets, the same baseline cross-section was maintained, with upstream and downstream shell slopes of 1 V:2 H and a 0.50-m-thick asphalt concrete core. A separate five-case geometry comparison was subsequently conducted. Design Case 1 represented the conventional clay-core baseline, with a trapezoidal clay core 3 m wide at the top and 14 m wide at the base and shell slopes of 1 V:2 H. Design Cases 2–4 incorporated a 0.50-m-thick asphalt concrete core, shell slopes of 1 V:1.5 H, and transition-zone widths of 2.0, 1.0, and 0.5 m, respectively. Design Case 5 incorporated the same 0.50-m-thick asphalt concrete core with a transition-zone width of 2.0 m and steeper shell slopes of 1 V:1.4 H. The actual dam has a crest length of approximately 84 m across the valley. Because the analyses were performed using a two-dimensional cross-section, the calculated material quantities were expressed as volumes per unit dam length (m3/m), rather than as total volumes for the entire dam.
2.4.2. Material Properties
Four asphalt concrete core-property datasets were assigned in the numerical analyses, representing granite- and limestone-based mixtures containing 6% and 7% asphalt cement at a target air-void content of 2%. The hydraulic-conductivity values assigned to the asphalt concrete cores were obtained from the laboratory tests conducted in this study and converted from cm/s to m/s for use in GeoStudio. The effective cohesion and effective friction angle were based on the consolidated-undrained triaxial tests incorporating pore-water-pressure measurements. The unit weights and the final shear-strength values shown in Table 4 represent the values recorded in the GeoStudio model-input datasets. The properties of the conventional clay core and the surrounding dam materials were adopted from the numerical model reported by Khalaj et al. [21]. The material properties assigned in the numerical models are summarized in Table 4.
The foundation, concrete plinth, and rockfill zones were represented using saturated-only material models. For the foundation, the horizontal hydraulic conductivity, kx, was 1.00 × 10⁻¹² m/s; the saturated volumetric water content was 0.50; the compressibility was 5.00 × 10⁻⁵ kPa−1; and the vertical-to-horizontal hydraulic-conductivity ratio, kᵧ/kx, was 0.025. For the concrete plinth, kx was 1.00 × 10⁻¹² m/s; the saturated volumetric water content was 0.10; the compressibility was 1.00 × 10⁻⁸ kPa−1; and kᵧ/kx was 1.00. For the rockfill, kx was 5.00 × 10⁻³ m/s; the saturated volumetric water content was 0.50; the compressibility was 5.00 × 10⁻⁵ kPa−1; and kᵧ/kx was 0.50.
2.4.3. Mesh Generation
The SEEP/W numerical models were discretized using an approximate global finite-element size of 0.25 m. The finite-element domains included the asphalt concrete core, filter, transition zones, rockfill shells, concrete plinth, and foundation. The same nominal global mesh size was adopted for the comparative numerical analyses. A supplementary mesh-sensitivity assessment was documented for the representative Granite AC7% AV2% model using nominal global element sizes of 0.50 and 0.25 m. The corresponding peak hydraulic gradients were approximately 29.51 and 34.26, respectively. Refinement increased the reported peak gradient by approximately 16.10% relative to the coarser-mesh result, demonstrating sensitivity of this local response to mesh resolution. The 0.25-m mesh was retained to provide greater spatial resolution, but the two-level comparison did not establish convergence or provide a reliable discretization-error estimate. The calculated local hydraulic gradients therefore remain subject to further mesh-refinement verification.
2.4.4. Hydraulic Boundary Conditions
For the normal-reservoir condition, the upstream boundary was prescribed as a constant total head corresponding to a model elevation of 15.0 m. A potential seepage-face boundary was applied along the downstream slope to permit free seepage discharge where the phreatic surface intersected the downstream boundary. The lower model boundary at the contact with the underlying bedrock was assigned a zero-flux condition (Q = 0), representing the negligible hydraulic conductivity of the foundation relative to the embankment materials.
The steady-state pore-water-pressure distribution was used as the initial hydraulic condition for the transient rapid-drawdown analysis. The upstream boundary was defined using a time-dependent total-head function, with the reservoir water level reduced linearly from 15.0 m to 8.0 m over seven days, corresponding to a drawdown rate of 1.0 m/day. This rate was selected as a prescribed numerical loading scenario informed by the Royal Irrigation Department (RID) dam-assessment manual [22], which identifies a rapid reservoir-level increase or decrease of 1.0 m/day as a condition warranting special dam inspection. The cited guidance establishes an operational inspection trigger rather than a universal design requirement or a verified site-specific drawdown rate. The downstream potential seepage-face boundary and zero-flux lower boundary were maintained throughout the drawdown period. The resulting transient pore-water-pressure distributions were used in the subsequent slope-stability analyses.
Supplementary numerical checks were documented for the representative Granite AC7% AV2% model. Transient simulations using time steps of 1.00, 0.50, and 0.25 days were compared in terms of pore-water-pressure and seepage-response histories. Smaller time steps provided greater temporal resolution, although quantitative time-step convergence could not be established from the available results. Inflow and outflow histories were also examined during the seven-day drawdown period. These records describe changes in the boundary-flow response but do not independently establish a quantitative mass-balance error or complete verification of numerical mass conservation.
Each of the four asphalt concrete core-property datasets was analyzed under two hydraulic conditions: (i) steady-state seepage at the normal reservoir level and (ii) transient seepage at Day 7 of rapid drawdown. The core-material comparison therefore comprised eight numerical cases. For each case, the pore-water-pressure distribution calculated in SEEP/W was transferred to SLOPE/W for the subsequent limit-equilibrium slope-stability analysis. The separate five-case geometry comparison was evaluated using the steady-state pore-water-pressure distribution corresponding to the normal reservoir level at a model elevation of 15.0 m, thereby providing a consistent hydraulic condition for comparing the effects of core type, transition-zone width, and shell slope. Supplementary rapid-drawdown stability results were also available for the conventional clay-core baseline and the Granite AC7% AV2% alternative with shell slopes of 1 V:1.4 H. These results covered Days 0–7 of the prescribed reservoir drawdown and were examined separately from the five-case steady-state geometry comparison. Comparable rapid-drawdown results were not documented for all five geometry configurations.
2.4.5. Slope-Stability Analysis
For each numerical analysis, the pore-water-pressure distribution calculated in SEEP/W was imported into the corresponding SLOPE/W model. Slope stability was evaluated using Bishop’s simplified method and the effective shear-strength parameters assigned to the embankment materials. The Entry and Exit slip-surface search was used to identify the minimum factors of safety for the upstream and downstream slopes under the specified hydraulic conditions. The minimum factor of safety obtained from this search is referred to in this study as the global factor of safety.
Additional analyses were performed using the Grid and Radius slip-surface search to examine selected circular slip surfaces intersecting the 0.50-m-thick asphalt concrete core. These analyses were conducted to evaluate potential core-crossing failure mechanisms that were not represented by the governing global critical slip surfaces. The factors of safety obtained for the selected core-intersecting slip surfaces were reported separately and were not interpreted as minimum global factors of safety. The archived SLOPE/W output also documents selected circular slip-surface geometries, including their center coordinates and radii, for the upstream and downstream slopes. These records provide additional traceability for the distinction between the global critical slip surfaces and the selected core-intersecting failure surfaces. The latter were evaluated as supplementary failure mechanisms and were not used to replace the minimum global factors of safety.
For the subsequent embankment-geometry comparison, the minimum global factor of safety was evaluated for the conventional clay-core baseline and the alternative asphalt concrete core configurations under the steady-state normal-reservoir condition. A factor of safety of 1.50 was adopted as a screening criterion for comparing the alternative geometries under the steady-state normal-reservoir condition, consistent with the minimum factor of safety recommended by U.S. Army Corps of Engineers (USACE) [23] for downstream slopes of new earth and rockfill dams under long-term steady-seepage conditions and with the static-stability guidance provided by U.S. Bureau of Reclamation (USBR) [24]. This criterion was used for comparative evaluation within the present study and should not be interpreted as replacing the complete set of project-specific design and regulatory requirements.
2.4.6. Methodology for Embankment Geometry and Material-Volume Comparison
An additional five-case comparative analysis was performed to evaluate the effects of replacing the conventional clay core with the selected Granite AC7% AV2% asphalt concrete core and reducing the embankment cross-section. The five design cases comprised the conventional clay-core baseline and four asphalt concrete core alternatives with different transition-zone widths and shell slopes, as described in Section 2.4.1.
The Granite AC7% AV2% dataset was selected as the representative asphalt concrete core for the geometry comparison based on its low measured hydraulic conductivity and its assigned effective shear-strength parameters. Its hydraulic conductivity was 3.6942 × 10⁻⁹ cm/s, compared with 1.0561 × 10⁻⁹ cm/s for Granite AC6% AV2%. The assigned effective cohesion was higher for Granite AC7% AV2%, whereas its effective friction angle was lower (Table 4). These differences represent a tradeoff rather than an unqualified strength advantage. The selected dataset was used consistently across the alternative asphalt-core geometries; its selection does not establish hydraulic acceptance or an overall optimum mixture. For each alternative geometry, the material-zone boundaries were revised, whereas the assigned material properties and water-level boundary conditions were maintained. The minimum global factor of safety was calculated under the steady-state normal-reservoir condition and compared with the adopted screening criterion of 1.50.
Material quantities were taken from the supplied model summaries and expressed as volumes per unit dam length (m3/m). For a two-dimensional cross-section, the volume per unit dam length is numerically equal to the corresponding material-zone area. The total embankment volume for each design case was calculated by summing the reported core, filter, transition, and rockfill quantities; the concrete plinth and foundation were excluded. Relative volumes and percentage reductions were recalculated from these totals. However, the reported core quantities could not be independently reconciled with the geometric dimensions available in the supplied documentation. The material-volume comparisons are therefore conditional on verification of the underlying material-zone areas.
The total embankment volume per unit dam length for design case j was calculated as
The volume of material zone i per unit dam length in design case j was calculated from its cross-sectional area as
The total volume of each design case relative to the conventional clay-core baseline was calculated as
The percentage reduction in total embankment volume relative to the baseline was calculated as
where Vtotal,j is the total embankment volume per unit dam length for design case j; Vcore,j, Vfilter,j, Vtransition,j, and Vrockfill,j are the corresponding material volumes per unit dam length; Vi,j and Ai,j are the volume per unit dam length and cross-sectional area, respectively, of material zone i in design case j; L is the unit dam length of 1 m; Vrelative,j is the total volume of design case j expressed as a percentage of the conventional clay-core baseline; Vbaseline is the total embankment volume per unit dam length of the conventional clay-core baseline; and Rj is the percentage reduction in total embankment volume of design case j relative to the baseline.
3. Results
3.1. Aggregate and Marshall Test Results
The aggregate blend proportions presented in Table 2 and Table 3 show that Hot Bin 1, representing aggregate smaller than 4.75 mm, constituted the largest individual hot-bin fraction in most mixtures. As the target air-void content increased from 1% to 4%, the Hot Bin 1 proportion decreased from 46% to 40% for the limestone mixtures containing 6% asphalt cement and from 50% to 46% for the corresponding granite mixtures. For mixtures containing 7% asphalt cement, the Hot Bin 1 proportion decreased from 46% to 35% for limestone and from 50% to 44% for granite. These changes were accompanied by adjustments among the coarser hot-bin fractions, although the direction and magnitude of the adjustments differed with aggregate type and asphalt cement content. The reported proportions represent the mixture-design records used to obtain the specified target air-void conditions and should not be interpreted as establishing an independent causal relationship between an individual hot-bin fraction and the resulting air-void content.
Three Marshall specimens were prepared for each mixture condition, and the values reported in Table 5 and Table 6 represent condition-level experimental summaries. The reported density ranged from 2.397 to 2.415 g/cm3, Marshall stability ranged from 10.32 to 11.21 kN, and Marshall flow ranged from 3.30 to 3.81 mm. Within each aggregate–binder combination, the reported Marshall flow values were identical across the four nominal target air-void levels, while Marshall stability exhibited relatively small variations. Specifically, the reported flow values were 3.30 mm for limestone mixtures containing 6% asphalt cement, 3.56 mm for granite mixtures containing 6% asphalt cement, 3.56 mm for limestone mixtures containing 7% asphalt cement, and 3.81 mm for granite mixtures containing 7% asphalt cement. This near-invariant behavior is unusual and warrants caution in interpretation. Verified specimen-level Marshall results matched to each target air-void condition in Table 5 and Table 6 are not available. Consequently, within-condition variability cannot be quantified for these tabulated results, and the repeated flow values across target levels cannot be conclusively attributed to specimen behavior, reporting precision, or transcription. The tabulated summaries therefore do not support statistical comparisons among the nominal target air-void levels. The reported flow values are retained without modification but are not interpreted as evidence that Marshall flow is insensitive to air-void content or mixture composition. Furthermore, because aggregate blend proportions were adjusted among mixture conditions, the individual effects of target air-void content and aggregate gradation cannot be isolated. An additional limitation is that the achieved air-void contents of the tested specimens could not be independently verified from the available volumetric records. Therefore, the differences in Marshall properties among the nominal target air-void categories cannot be attributed directly to differences in measured specimen porosity. The reported results are illustrated in Figure 2.
Table 5.
Density, Marshall stability, and flow of mixtures containing 6% asphalt cement.
Table 6.
Density, Marshall stability, and flow of mixtures containing 7% asphalt cement.
Figure 2.
Density (a), Marshall stability (b), and Marshall flow (c) versus target air-void content for limestone and granite asphalt concrete with 6% and 7% asphalt cement. Overlapping curves reflect identical reported values: granite AC6% and AC7% densities in (a), and granite AC6% and limestone AC7% flows (3.56 mm) in (c).
3.2. Hydraulic-Conductivity Results
The measured hydraulic-conductivity values ranged from 2.9549 × 10⁻¹⁰ to 3.8887 × 10⁻⁵ cm/s (Table 7 and Table 8), demonstrating substantial variation in hydraulic behavior among the investigated mixture conditions. Figure 3 presents the relationship between target air-void content and hydraulic conductivity on a logarithmic scale. The observed differences were associated with the combined variation in aggregate type, asphalt cement content, aggregate blend proportions, and target air-void content. Hydraulic conductivity increased monotonically with target air-void content in both granite mixture series and in the limestone series containing 7% asphalt cement. The limestone series containing 6% asphalt cement exhibited an overall increasing pattern, with a slight decrease between target air-void contents of 3% and 4%.
Table 7.
Hydraulic conductivity of mixtures containing 6% asphalt cement.
Table 8.
Hydraulic conductivity of mixtures containing 7% asphalt cement.
Figure 3.
Relationship between target air-void content and hydraulic conductivity for limestone- and granite-based asphalt concrete mixtures containing 6% and 7% asphalt cement. Symbols represent the reported condition-level values, while connecting lines are visual guides and do not imply fitted or monotonic relationships.
For mixtures containing 6% asphalt cement, the limestone mixtures exhibited an overall increase in hydraulic conductivity with increasing target air-void content. Hydraulic conductivity increased from 1.9219 × 10⁻⁷ cm/s at 1% target air-void content to 2.3508 × 10⁻⁶ cm/s at 2%, followed by a substantial increase to 3.8887 × 10⁻⁵ cm/s at 3%. At 4% target air-void content, hydraulic conductivity decreased slightly to 3.6102 × 10⁻⁵ cm/s, although it remained considerably higher than the values obtained at 1% and 2%. The granite mixtures containing 6% asphalt cement exhibited a clearer increasing pattern, with hydraulic conductivity increasing progressively from 2.9549 × 10⁻¹⁰ cm/s at 1% target air-void content to 1.0561 × 10⁻⁹, 8.1356 × 10⁻⁷, and 2.0835 × 10⁻⁵ cm/s at target air-void contents of 2%, 3%, and 4%, respectively.
For mixtures containing 7% asphalt cement, both aggregate types exhibited increasing hydraulic conductivity with increasing target air-void content. For the limestone mixtures, hydraulic conductivity increased from 2.3537 × 10⁻⁶ cm/s at 1% target air-void content to 3.5286 × 10⁻⁶, 1.3636 × 10⁻⁵, and 2.1993 × 10⁻⁵ cm/s at target air-void contents of 2%, 3%, and 4%, respectively. For the granite mixtures, hydraulic conductivity increased from 8.3933 × 10⁻¹⁰ cm/s at 1% target air-void content to 3.6942 × 10⁻⁹, 7.4553 × 10⁻⁶, and 2.9819 × 10⁻⁵ cm/s at target air-void contents of 2%, 3%, and 4%, respectively.
The measured hydraulic-conductivity values are compared directly among the investigated mixture conditions. No numerical hydraulic-conductivity acceptance threshold is adopted in this study. These comparisons characterize the reported laboratory results and the property contrasts used in the numerical analyses; they do not independently establish project-specific acceptance or field-scale hydraulic suitability of the mixtures.
The lowest hydraulic conductivity among all investigated mixtures was obtained for Granite AC6% AV1%, with a measured value of 2.9549 × 10⁻¹⁰ cm/s. Among the mixtures containing 7% asphalt cement, Granite AC7% AV1% exhibited the lowest hydraulic conductivity, with a value of 8.3933 × 10⁻¹⁰ cm/s. These results demonstrate that low hydraulic conductivity can be achieved using granite-based asphalt concrete mixtures. Although hydraulic conductivity generally increased with target air-void content, comparisons among the mixture conditions should also consider the accompanying differences in aggregate type, asphalt cement content, and aggregate blend proportions.
At the target air-void content of 2%, the hydraulic conductivity differed substantially among the four mixtures. Granite AC6% AV2% and Granite AC7% AV2% exhibited hydraulic conductivities of 1.0561 × 10⁻⁹ and 3.6942 × 10⁻⁹ cm/s, respectively, compared with 2.3508 × 10⁻⁶ and 3.5286 × 10⁻⁶ cm/s for Limestone AC6% AV2% and Limestone AC7% AV2%, respectively. The highest and lowest values differed by approximately 3.5 orders of magnitude. These differences indicate that the four mixture datasets provided substantially different hydraulic properties for the subsequent seepage analyses, although their effects on dam-scale seepage discharge also depend on the modeled geometry and hydraulic boundary conditions.
3.3. Triaxial Test Results and Effective Shear-Strength Parameters
Consolidated-undrained (CU) triaxial compression tests were conducted using three nominal cell-pressure-minus-back-pressure differences of 98.1, 196.1, and 294.2 kPa. These pressure differences corresponded to recorded cell pressures of approximately 294.2, 392.3, and 490.3 kPa, respectively, with a back pressure of approximately 196.1 kPa. For each mixture condition, three specimens were tested, with one specimen assigned to each pressure level. Table 9, Table 10, Table 11 and Table 12 present the pressure levels used in the reported calculations, deviator stress at failure, axial strain at failure, excess pore-water pressure at failure, effective cohesion, and effective friction angle for the limestone- and granite-based mixtures containing 6% and 7% asphalt cement. The mixture designations AV1–AV4 correspond to target air-void contents of 1–4%, respectively.
Table 9.
Consolidated-undrained triaxial compression test results and effective shear-strength parameters for limestone mixtures containing 6% asphalt cement.
Table 10.
Consolidated-undrained triaxial compression test results and effective shear-strength parameters for granite mixtures containing 6% asphalt cement.
Table 11.
Consolidated-undrained triaxial compression test results and effective shear-strength parameters for limestone mixtures containing 7% asphalt cement.
Table 12.
Consolidated-undrained triaxial compression test results and effective shear-strength parameters for granite mixtures containing 7% asphalt cement.
The effective principal stresses at failure were calculated using the excess pore-water-pressure values recorded during undrained shearing. Specifically, the effective minor principal stress was obtained by subtracting the recorded pore-pressure increment from the nominal initial cell-pressure-minus-back-pressure difference, and the effective major principal stress was obtained by adding the measured deviator stress. The transformed effective-stress variables and Mohr–Coulomb relationship defined in Equations (1)–(5) were then applied. Linear regression of the three transformed failure states for each mixture was used to determine the effective cohesion, c′, and effective friction angle, φ′. The archived specimen-level worksheets provide supporting axial stress–strain and pore-water-pressure records for the reported failure states. However, because only one specimen was tested at each confining pressure, the resulting shear-strength parameters represent estimates derived from three distinct failure states, without independent replication at individual pressure levels. Consequently, the fitted failure envelopes were used to characterize the investigated mixture conditions rather than to establish statistically verified differences in shear strength among mixtures. The resulting effective-stress failure envelopes are presented in Figure 4.
Figure 4.
Effective-stress Mohr–Coulomb failure envelopes obtained from the consolidated-undrained triaxial compression tests for (a) limestone mixtures containing 6% asphalt cement, (b) granite mixtures containing 6% asphalt cement, (c) limestone mixtures containing 7% asphalt cement, and (d) granite mixtures containing 7% asphalt cement. AV1–AV4 correspond to target air-void contents of 1–4%, respectively. Symbols represent the measured failure states, and lines represent the fitted effective-stress failure envelopes.
Across the 16 investigated mixtures, the deviator stress at failure ranged from 1225.4 to 3436.4 kPa, while the axial strain at failure ranged from 5.449% to 14.329%. The measured excess pore-water pressure at failure ranged from 5.099 to 141.608 kPa, indicating substantial variation in the pore-pressure response among the aggregate types, asphalt cement contents, and target air-void conditions.
The calculated effective cohesion ranged from 165.7 to 540.3 kPa, whereas the effective friction angle ranged from 34.07° to 55.61°. For the granite mixtures, c′ ranged from 165.7 to 476.5 kPa and φ′ ranged from 38.89° to 55.61°. For the limestone mixtures, c′ ranged from 294.9 to 540.3 kPa and φ′ ranged from 34.07° to 50.94°. These results demonstrate that the effective shear-strength parameters varied with the combined mixture composition and target air-void condition; therefore, the observed variation should not be attributed independently to a single mixture variable.
As an additional check, ordinary least-squares regressions were recalculated from the rounded failure-state values in Table 9, Table 10, Table 11 and Table 12 using the transformed effective-stress coordinates defined in Equations (3) and (4). Across the 16 mixture conditions, the coefficients of determination ranged approximately from 0.9866 to 0.99995, and the residual standard errors in the shear-stress coordinate ranged from 1.47 to 26.79 kPa. Each regression used three failure states to estimate a slope and an intercept, leaving only one residual degree of freedom. These diagnostics describe agreement with the fitted linear relationship; they do not establish experimental repeatability, validate the pore-pressure measurements, or quantify the full uncertainty of the derived strength parameters.
3.4. Numerical Analysis Results
The numerical investigation compared four asphalt concrete core-property datasets under two hydraulic conditions: steady-state seepage at the normal reservoir level and transient seepage at Day 7 of rapid drawdown. Table 13 summarizes the steady-state seepage discharge and the slope-stability results reported for the relevant downstream slope under steady-state conditions and upstream slope under rapid drawdown. Each core-property dataset therefore represents two numerical analyses, although the paired results are presented in a single row to facilitate comparison among the four asphalt concrete mixtures.
Table 13.
Summary of the GeoStudio seepage and slope-stability results for the four asphalt concrete core-property datasets.
The calculated steady-state seepage discharge ranged from 1.967 × 10⁻⁹ to 6.7191 × 10⁻⁶ m3/s. The Granite AC6% AV2% core produced the lowest seepage discharge, followed by Granite AC7% AV2%. The two limestone-based cores produced higher seepage discharges, with Limestone AC7% AV2% yielding the largest value. This ordering was consistent with the hydraulic-conductivity values assigned to the four asphalt concrete cores.
The global factor of safety for the downstream slope under the steady-state condition ranged from 2.209 to 2.215. At Day 7 of rapid drawdown, the upstream global factor of safety was 2.041 for all four core-property datasets. The identical reported rapid-drawdown global factors of safety indicate that differences among the four core-property datasets did not change the calculated minimum global factor of safety at the reported precision under the modeled conditions. This result should not be interpreted as demonstrating that core properties have no influence on slope stability under other hydraulic conditions or embankment configurations.
The factors of safety calculated for the selected slip surfaces passing through the asphalt concrete core ranged from 2.766 to 2.807 for the downstream slope under steady-state conditions and from 2.464 to 2.518 for the upstream slope under rapid drawdown. These values were higher than the corresponding minimum global factors of safety. The core-intersecting values represent selected Grid and Radius slip surfaces and should not be interpreted as minimum global factors of safety.
3.5. Embankment Geometry and Material-Volume Comparison
The results of the five-case embankment-geometry comparison are summarized in Table 14. The conventional clay-core configuration (Design Case 1) produced a global factor of safety of 2.142 under the steady-state normal-reservoir condition and required a total embankment volume of 874.0 m3/m. This configuration was adopted as the baseline for evaluating the alternative asphalt concrete core arrangements.
Table 14.
Embankment geometry, stability results, and calculated material quantities for the five design cases.
Replacing the conventional clay core with the 0.50-m-thick Granite AC7% AV2% asphalt concrete core and steepening the shell slopes to 1 V:1.5 H reduced the total embankment volume to 689.5 m3/m in Design Cases 2–4. This volume corresponds to 78.89% of the baseline and represents a reduction of 21.11%. Although the transition-zone width decreased from 2.0 m in Design Case 2 to 1.0 m in Design Case 3 and 0.5 m in Design Case 4, the total embankment volume remained unchanged because the reduction in transition-zone volume was offset by a corresponding increase in rockfill volume. All three configurations produced the same calculated global factor of safety of 1.655.
In the further geometry modification represented by Design Case 5, in which the shell slopes were steepened to 1 V:1.4 H while the transition-zone width was maintained at 2.0 m, the total embankment volume decreased to 657.0 m3/m. This value is 75.17% of the clay-core baseline and corresponds to the maximum volume reduction of 24.83% among the evaluated configurations. The global factor of safety decreased to 1.557 but remained above the adopted screening criterion of 1.50.
The reduction in total embankment volume was principally associated with replacing the 198 m3/m clay core with a 9 m3/m asphalt concrete core, together with substantial reductions in the filter and transition-zone volumes. Although the rockfill volume increased from 361 to 542 m3/m in Design Case 5, this increase was more than offset by reductions in the other material zones. Within the assumptions of the numerical model, Design Case 5 provided the greatest material-volume reduction among the evaluated configurations and exceeded the adopted steady-state screening factor of safety of 1.50. This result represents a comparative screening outcome for the modeled two-dimensional cross-section under steady-state normal-reservoir conditions. Supplementary rapid-drawdown results were available for the conventional clay-core baseline and Design Case 5, which incorporated the Granite AC7% AV2% core with shell slopes of 1 V:1.4 H. For the clay-core baseline, the upstream global factor of safety decreased to 2.051 at Day 7. For Design Case 5, the corresponding factor of safety decreased from 1.553 at Day 0 to 1.486 at Day 7; the lowest value among the reported daily results was 1.473 at Day 6. These supplementary results indicate that the steeper asphalt-core configuration exhibited a lower stability margin during the prescribed drawdown scenario. The remaining alternative geometries were not assessed under the same transient loading sequence, and seismic stability was not evaluated.
The representative pore-water-pressure distributions and corresponding global factors of safety for Design Cases 1, 2–4, and 5 are shown in Figure 5.
Figure 5.
Representative GeoStudio pore-water-pressure distributions and global factors of safety (F.S.) for the embankment-geometry under the steady-state normal-reservoir condition: (a) conventional clay-core baseline with shell slopes of 1 V:2 H (Design Case 1; F.S. = 2.142); (b) Granite AC7% AV2% asphalt concrete core with shell slopes of 1 V:1.5 H, representative of Design Cases 2–4 (F.S. = 1.655); and (c) Granite AC7% AV2% asphalt concrete core with shell slopes of 1 V:1.4 H (Design Case 5; F.S. = 1.557). In the lower panels, the colored bands represent pore-water-pressure ranges, the solid black lines primarily delineate the embankment geometry and material-zone boundaries, and the dashed blue lines indicate the phreatic surface.
3.6. Descriptive Statistical Analysis
Table 15 summarizes the descriptive statistics of the principal engineering properties obtained from the laboratory testing program. Density, Marshall stability, Marshall flow, hydraulic conductivity, effective cohesion, and effective friction angle were summarized using one value for each of the 16 investigated mixture conditions. Deviator stress, axial strain, and excess pore-water pressure at failure were summarized from the 48 triaxial specimens. The arithmetic mean, sample standard deviation, minimum, maximum, and range were calculated to characterize the observed variation.
Table 15.
Descriptive statistics of the principal engineering properties of the investigated asphalt concrete mixtures.
Density exhibited limited variation, ranging from 2.397 to 2.415 g/cm3, with a standard deviation of 0.007 g/cm3. Marshall stability and flow ranged from 10.32 to 11.21 kN and from 3.30 to 3.81 mm, respectively. In contrast, hydraulic conductivity ranged from 2.9549 × 10⁻¹⁰ to 3.8887 × 10⁻⁵ cm/s, spanning more than five orders of magnitude. The arithmetic mean and standard deviation of hydraulic conductivity are reported for descriptive consistency, but they should be interpreted cautiously because the observations were strongly right-skewed across several orders of magnitude.
For the consolidated-undrained triaxial tests, the deviator stress at failure ranged from 1225.4 to 3436.4 kPa, the axial strain at failure ranged from 5.449% to 14.329%, and the excess pore-water pressure at failure ranged from 5.099 to 141.608 kPa. The effective cohesion ranged from 165.7 to 540.3 kPa, whereas the effective friction angle ranged from 34.07° to 55.61°. These statistics describe the observed laboratory results across the investigated mixture conditions and specimens; they are not inferential comparisons among aggregate types, asphalt cement contents, or target air-void levels.
4. Discussion
The effective-stress strength envelopes were derived from three triaxial failure states for each mixture condition, with one specimen tested at each of the three confining pressures. Although these data allow the estimation of a three-point failure envelope, they do not provide within-pressure replication or an independent estimate of experimental repeatability. Consequently, the reported effective cohesion and friction-angle values should be regarded as estimates based on the available test conditions rather than statistically verified differences between mixtures. The descriptive statistics presented in Table 15 characterize variation across the investigated mixture conditions and specimens; they should not be interpreted as measures of within-condition experimental uncertainty. Additional replicate testing would be required to quantify the repeatability and uncertainty of the derived strength parameters.
The laboratory and numerical results showed that the engineering performance of the investigated asphalt concrete core mixtures varied with aggregate type, asphalt cement content, aggregate blend proportions, and target air-void content. The Marshall properties varied within comparatively narrow ranges, whereas hydraulic conductivity and the effective-stress shear-strength parameters exhibited substantially greater variation. These findings indicate that similar density and Marshall characteristics do not necessarily imply similar hydraulic or shear behavior. The relevant hydraulic and mechanical properties should therefore be evaluated together when selecting an asphalt concrete mixture for an impervious dam core.
Hydraulic conductivity varied from 2.9549 × 10⁻¹⁰ to 3.8887 × 10⁻⁵ cm/s, spanning more than five orders of magnitude. Both granite mixture series and the limestone series containing 7% asphalt cement exhibited increasing hydraulic conductivity with increasing target air-void content. The limestone series containing 6% asphalt cement showed an overall increasing pattern, with a slight decrease between target air-void contents of 3% and 4%. These patterns should be interpreted in relation to the combined variation in aggregate type, asphalt cement content, and aggregate blend proportions, because the aggregate blends were adjusted to obtain each target air-void condition. Aggregate packing and the continuity of interconnected voids can also influence fluid transmission through dense asphalt concrete [25,26]. Höeg [2] discusses hydraulic performance in relation to mixture design, compaction, and achieved air-void content; these considerations are not treated here as a universal numerical hydraulic-conductivity acceptance limit. Among the four mixtures with a target air-void content of 2%, the lowest hydraulic conductivity was obtained for Granite AC6% AV2% (1.0561 × 10⁻⁹ cm/s), followed by Granite AC7% AV2% (3.6942 × 10⁻⁹ cm/s), Limestone AC6% AV2% (2.3508 × 10⁻⁶ cm/s), and Limestone AC7% AV2% (3.5286 × 10⁻⁶ cm/s). These comparisons apply to the tested laboratory specimens. Because achieved air-void contents and complete hydraulic-test conditions could not be independently verified for all mixtures, the results do not establish field acceptance or hydraulic adequacy of a 0.50-m-thick core under the modeled gradients. Project-specific verification of core integrity, interfaces, and construction-scale hydraulic performance remains necessary.
The consolidated-undrained triaxial tests further demonstrated substantial variation in the mechanical response of the investigated mixtures. Across the 48 specimens, the deviator stress at failure ranged from 1225.4 to 3436.4 kPa, the axial strain at failure ranged from 5.449% to 14.329%, and the excess pore-water pressure at failure ranged from 5.099 to 141.608 kPa. The effective cohesion values ranged from 165.7 to 540.3 kPa, while the effective friction angles ranged from 34.07° to 55.61°. The variation in the fitted effective cohesion and friction angle across the mixture conditions indicates that neither parameter should be interpreted independently when characterizing shear resistance. Both effective-stress parameters, together with the applied stress level and pore-water-pressure response, should be considered when assigning properties for numerical analysis. This interpretation is consistent with previous studies identifying aggregate interlocking, gradation, temperature, and loading conditions as important controls on the mechanical behavior of hydraulic asphalt concrete [4,5,6,7].
The first stage of the GeoStudio analysis showed that the measured differences in hydraulic conductivity were reflected in the calculated steady-state seepage discharge. The discharge ranged from 1.967 × 10⁻⁹ m3/s for Granite AC6% AV2% to 6.7191 × 10⁻⁶ m3/s for Limestone AC7% AV2%. In contrast, the global factors of safety varied only slightly among the four core-property datasets. Under the steady-state condition, the downstream global factors of safety ranged from 2.209 to 2.215, whereas the upstream global factor of safety at Day 7 of rapid drawdown was 2.041 for all four datasets. This limited variation in the calculated global factors of safety is consistent with the observation that the governing critical slip surfaces developed mainly within the surrounding embankment materials and did not intersect the asphalt concrete core under the modeled conditions. The selected core-intersecting slip surfaces produced factors of safety from 2.464 to 2.807 and therefore did not govern the global minimum.
The numerical results provide insight into the different roles of hydraulic conductivity and embankment geometry in the performance of asphalt concrete core rockfill dams. The substantial contrast between the hydraulic conductivity of the asphalt concrete core and that of the surrounding materials causes a significant portion of the hydraulic head loss to occur across the relatively thin core. Consequently, a low seepage discharge may coexist with a relatively high local hydraulic gradient. This distinction is important because a low overall seepage rate does not, by itself, establish the adequacy of local hydraulic gradients or the integrity of the core–transition interfaces.
At the nominal 2% air-void target, the hydraulic conductivity of the four investigated asphalt concrete mixtures ranged from 1.0561 × 10⁻¹¹ to 3.5286 × 10⁻⁸ m/s, representing a difference of approximately 3.5 orders of magnitude. Under the same baseline embankment geometry and steady-state hydraulic boundary conditions, the corresponding calculated seepage discharge increased from 1.967 × 10⁻⁹ to 6.7191 × 10⁻⁶ m3/s. The close correspondence between these ranges indicates that the assigned core hydraulic conductivity was a major controlling parameter for the calculated seepage response in the investigated configurations. In contrast, the downstream global factors of safety remained within a narrow range of 2.209–2.215. This difference in sensitivity is consistent with the modeled critical slip surfaces developing mainly within the surrounding embankment materials rather than passing through the asphalt concrete core. Nevertheless, the numerical relationship between core hydraulic conductivity and seepage discharge is specific to the adopted geometry, material properties, and boundary conditions and should not be interpreted as a universally applicable proportional relationship.
Granite AC7% AV2% was selected as a representative core-property dataset for the subsequent embankment geometry comparison because it combined low hydraulic conductivity with higher assigned effective cohesion than Granite AC6% AV2%. However, its assigned effective friction angle was lower: 46.51° compared with 51.78° for Granite AC6% AV2% (Table 4). Higher cohesion therefore does not imply greater shear resistance at every effective normal stress. Using the assigned Mohr–Coulomb parameters, the two shear-strength envelopes intersect at an effective normal stress of approximately 514 kPa. This calculated intersection illustrates the stress-dependent tradeoff between cohesion and friction; it does not establish the stress range mobilized along the modeled slip surfaces. Granite AC6% AV2% also had the lower measured hydraulic conductivity. The selection of Granite AC7% AV2% consequently provided a consistent representative dataset for the geometry comparison, rather than demonstrating an overall optimum mixture. Using the selected dataset, replacing the conventional clay core with a 0.50-m-thick asphalt concrete core and adopting shell slopes of 1 V:1.5 H reduced the total embankment volume from 874.0 to 689.5 m3/m, corresponding to a reduction of 21.11%, while producing a global factor of safety of 1.655. Further steepening the shell slopes to 1 V:1.4 H reduced the total volume to 657.0 m3/m, or 24.83% below the clay-core baseline. The corresponding steady-state global factor of safety was 1.557, which exceeded the adopted steady-state screening criterion of 1.50. These results indicate a potential material-efficiency advantage for the asphalt concrete core within the analyzed two-dimensional cross-section under the modeled steady-state conditions. Nevertheless, the reduced stability margin associated with steeper shell slopes warrants further consideration under transient loading. Supplementary rapid-drawdown results were available for Design Case 5, whereas comparable assessments were not documented for the remaining asphalt-core geometries. Seismic stability was not evaluated, and further project-specific verification remains necessary.
The results should be interpreted within the limitations of the present study. The laboratory program was conducted using the investigated materials and preparation procedures, and the available condition-level Marshall summaries do not support independent inferential comparisons among all mixture factors. Furthermore, the target air-void contents were used to designate the mixture conditions, while independent verification of the achieved air-void contents was not available for all conditions. The numerical analyses were based on two-dimensional GeoStudio models with specified material properties, boundary conditions, and loading scenarios. A systematic sensitivity analysis of the adopted clay, transition, filter, rockfill, and foundation properties was not performed. The robustness of the calculated seepage discharges and factors of safety to uncertainty in these non-core material properties therefore remains unverified. A nominal global finite-element size of approximately 0.25 m was adopted for the numerical analyses. A supplementary two-level mesh-sensitivity comparison using 0.50-m and 0.25-m global element sizes revealed differences in the calculated hydraulic-gradient distributions, indicating that mesh independence had not been established. Additional comparisons using transient time steps of 1.00, 0.50, and 0.25 days documented differences in the temporal resolution of the calculated responses but did not establish quantitative time-step convergence. The available inflow and outflow histories also described the changing boundary-flow response during rapid drawdown; however, a numerical mass-balance error could not be independently quantified from these records. Consequently, although the supplementary analyses improve documentation of the numerical procedures and their sensitivity, the absolute numerical predictions remain subject to discretization and verification uncertainties. The results should therefore be interpreted primarily as comparative findings under the adopted modeling assumptions. The supplementary rapid-drawdown assessment of Design Case 5 further demonstrated the importance of evaluating transient stability when adopting steeper embankment slopes. The lowest upstream global factor of safety among the reported daily results was 1.473 at Day 6, compared with 1.486 at Day 7. Although the five-case geometry comparison was conducted under steady-state conditions, these supplementary results provide an additional indication of the potential sensitivity of the steepest alternative to reservoir drawdown. Equivalent transient assessments were not documented for all alternative geometries, and seismic loading was not considered. The steady-state material-volume reductions should therefore not be interpreted as demonstrating equivalent stability margins under all relevant loading conditions. The analyses also did not explicitly account for construction variability, temperature cycling, aging, creep, seismic loading, or three-dimensional effects. Future investigations should include replicated laboratory testing, verification of achieved air-void contents, systematic mesh-refinement and time-step sensitivity studies, quantitative water-balance checks, uncertainty assessment of material properties, evaluation of the remaining alternative embankment geometries under rapid drawdown and assessment of seismic loading, large-scale trial sections, and long-term field monitoring.
5. Conclusions
This study evaluated asphalt concrete produced with locally available limestone and granite aggregates for use as an impervious core material in rockfill dams. The laboratory program examined mixtures containing 6% and 7% asphalt cement at target air-void contents of 1–4%, and the measured properties were subsequently used in comparative seepage, slope-stability, and embankment-geometry analyses. The principal conclusions are as follows:
- The Marshall properties varied within relatively narrow ranges. Density ranged from 2.397 to 2.415 g/cm3, Marshall stability ranged from 10.32 to 11.21 kN, and Marshall flow ranged from 3.30 to 3.81 mm. These narrow ranges describe the reported summaries, but within-condition variability and statistical differences among mixture conditions could not be established.
- Hydraulic conductivity ranged from 2.9549 × 10⁻¹⁰ to 3.8887 × 10⁻⁵ cm/s and therefore varied by more than five orders of magnitude. Granite AC6% AV2% produced the lowest measured value among the four numerical-model datasets, at 1.0561 × 10⁻⁹ cm/s. Hydraulic conductivity generally increased with target air-void content, although the limestone mixtures containing 6% asphalt cement exhibited a slight decrease between target air-void contents of 3% and 4%. These patterns should be interpreted in relation to the combined variation in aggregate type, asphalt cement content, aggregate blend proportions, and target air-void content. These measurements provide a comparative dataset; hydraulic suitability for a dam core is not established by a conductivity threshold in this study.
- The consolidated-undrained triaxial tests produced deviator stresses at failure of 1225.4–3436.4 kPa, axial strains at failure of 5.449–14.329%, and excess pore-water pressures at failure of 5.099–141.608 kPa. Effective cohesion ranged from 165.7 to 540.3 kPa, and the effective friction angle ranged from 34.07° to 55.61°. These effective-stress parameters were derived from three distinct failure states per mixture condition, without independent replication at each confining pressure. Both the effective-stress parameters and the excess pore-water-pressure response should therefore be considered when assigning material properties for numerical analysis.
- For the four asphalt concrete core-property datasets, the calculated steady-state seepage discharge ranged from 1.967 × 10⁻⁹ to 6.7191 × 10⁻⁶ m3/s. The downstream global factors of safety under steady-state conditions ranged from 2.209 to 2.215, while the upstream global factor of safety at Day 7 of rapid drawdown was 2.041 for all four datasets. The selected core-intersecting slip surfaces produced factors of safety of 2.464–2.807 and did not govern the global minimum.
- In the geometry comparison, replacing the conventional clay core with a 0.50-m-thick Granite AC7% AV2% asphalt concrete core and adopting shell slopes of 1 V:1.5 H reduced the total embankment volume per unit dam length from 874.0 to 689.5 m3/m, corresponding to a reduction of 21.11%, while producing a global factor of safety of 1.655 under the steady-state normal-reservoir condition. Further steepening the shell slopes to 1 V:1.4 H reduced the total volume to 657.0 m3/m, corresponding to a reduction of 24.83%, with a global factor of safety of 1.557. Although both asphalt-core configurations exceeded the adopted steady-state screening criterion of 1.50, supplementary rapid-drawdown results were available only for the conventional clay-core baseline and Design Case 5, while seismic loading was not evaluated. The reported volume reductions therefore represent potential material-efficiency benefits within the analyzed two-dimensional cross-section, rather than demonstrated improvements in construction cost or overall dam safety. A supplementary rapid-drawdown assessment of Design Case 5 (1 V:1.4 H) yielded an upstream global factor of safety of 1.473 at Day 6, the lowest among the reported daily results, highlighting the importance of evaluating transient stability in addition to steady-state material-efficiency comparisons.
- Overall, the laboratory and numerical results provide a comparative basis for preliminary assessment of the investigated limestone- and granite-based asphalt concrete mixtures and the modeled rockfill-dam configurations. They do not establish hydraulic acceptance of the mixtures or field-scale design readiness. These findings are limited to the tested materials, laboratory procedures, two-dimensional dam cross-section, assigned material properties, and modeled hydraulic and loading conditions. Further verification of achieved air-void contents, replicated laboratory testing, numerical sensitivity and uncertainty analyses, construction-scale trials, and long-term field monitoring are necessary before project-specific implementation or broader generalization of the findings.
Author Contributions
Conceptualization, C.R. and S.J.; methodology, C.R., S.J. and T.W.; software, C.R. and T.W.; validation, C.R., S.J. and P.P.; formal analysis, C.R., S.J. and T.W.; investigation, C.R. and T.W.; data curation, C.R. and T.W.; writing—original draft preparation, C.R.; writing—review and editing, S.J., T.W. and P.P.; visualization, C.R. and T.W.; supervision, S.J.; project administration, S.J. All authors have read and agreed to the published version of the manuscript.
Funding
This research received no external funding.
Institutional Review Board Statement
Not applicable.
Informed Consent Statement
Not applicable.
Data Availability Statement
The data presented in this study are available from the corresponding author upon reasonable request.
Acknowledgments
The authors wish to acknowledge the Royal Irrigation Department of Thailand for providing data support and access to the licensed GeoStudio software (version 2024.1.0) used in this study.
Conflicts of Interest
The authors declare no conflicts of interest.
References
- International Commission on Large Dams (ICOLD). Asphalt Concrete Cores for Embankment Dams; Bulletin 179; CRC Press: Boca Raton, FL, USA, 2025. [Google Scholar]
- Höeg, K. Asphaltic Concrete Cores for Embankment Dams: Experience and Practice; Norwegian Geotechnical Institute: Oslo, Norway, 1993. [Google Scholar]
- Seo, J.W.; Park, D.W.; Le, T.H.M. Development of an Asphalt Concrete Mixture for Asphalt Core Rockfill Dam. Constr. Build. Mater. 2017, 140, 301–309. [Google Scholar] [CrossRef] [Scilit]
- Han, X.; Hu, Z.; Yu, L.; Pang, Y.; She, H.; Zhang, L.; Wang, X.; Qi, C. Dynamic Characteristics of Asphalt Concrete as an Impervious Core in Embankment Dams under Varying Temperatures and Stress States. Materials 2023, 16, 6529. [Google Scholar] [CrossRef] [Scilit] [PubMed]
- Tang, R.; Yu, Z.; Liu, G.; Li, F.; Tang, W. Uniaxial Dynamic Compressive Behaviors of Hydraulic Asphalt Concrete under the Coupling Effect between Temperature and Strain Rate. Materials 2020, 13, 5348. [Google Scholar] [CrossRef] [Scilit] [PubMed]
- Wang, W.; Hu, K.; Feng, S.; Li, G.; Höeg, K. Shear Behavior of Hydraulic Asphalt Concrete at Different Temperatures and Strain Rates. Constr. Build. Mater. 2020, 230, 117022. [Google Scholar] [CrossRef] [Scilit]
- Ning, Z.; Liu, Y.; Wang, Q.; Wang, W. Experimental Study on the Dynamic Compressive Behavior of Asphalt Concrete under Different Temperature. J. Vib. Shock 2021, 40, 243–250. [Google Scholar]
- Wang, W.; Höeg, K. Simplified Material Model for Analysis of Asphalt Core in Embankment Dams. Constr. Build. Mater. 2016, 124, 199–207. [Google Scholar] [CrossRef] [Scilit]
- Cai, X.; Li, F.; Li, K.; Ning, Z.; Dong, J. Performance Degradation Behavior and Service Life Prediction of Hydraulic Asphalt Concrete under Long-Term Water Immersion. Materials 2025, 18, 3706. [Google Scholar] [CrossRef] [Scilit] [PubMed]
- Li, H.; He, J.; Zhong, S.; Liu, L.; Yang, W. Experimental Study on Key Techniques for the Construction of High Asphalt Concrete Core Rockfill Dam under Unfavorable Geological Conditions. Buildings 2024, 14, 1968. [Google Scholar] [CrossRef] [Scilit]
- Rewtragulapaibul, C.; Jaritngam, S.; Wannawong, T.; Somchainuek, O. Comparison of Embankment Properties with Clay Core and Asphaltic Concrete Core. Appl. Sci. 2024, 14, 6555. [Google Scholar] [CrossRef] [Scilit]
- Guo, D.-H.; Sun, Y.; Gu, X.-B. Numerical Simulation of a 3D Seepage Field of an Asphaltic and Concrete Core Rockfill Dam in an Arid Area. Geofluids 2022, 2022, 7650527. [Google Scholar] [CrossRef] [Scilit]
- TIS 851-2561; Asphalt Cement for Use in Pavement Construction. Ministry of Industry: Bangkok, Thailand, 2018.
- Chen, Y.; Wang, H.; Xu, S.; You, Z. High Modulus Asphalt Concrete: A State-of-the-Art Review. Constr. Build. Mater. 2020, 237, 117653. [Google Scholar] [CrossRef] [Scilit]
- International Commission on Large Dams. Bituminous Cores for Fill Dams—State of the Art; Bulletin 84; ICOLD: Paris, France, 1992. [Google Scholar]
- DH-S 408/2532; Asphalt Concrete or Hot-Mix Asphalt. Ministry of Transport: Bangkok, Thailand, 1989.
- MTH 230-2563; Asphalt Concrete. Ministry of Transport: Bangkok, Thailand, 2020.
- ASTM D6927-22; Standard Test Method for Marshall Stability and Flow of Asphalt Mixtures. ASTM International: West Conshohocken, PA, USA, 2022. [Google Scholar] [CrossRef] [Scilit]
- ASTM D6926-20; Standard Practice for Preparation of Asphalt Mixture Specimens Using Marshall Apparatus. ASTM International: West Conshohocken, PA, USA, 2020. [Google Scholar] [CrossRef] [Scilit]
- ASTM D4767-11(2020); Standard Test Method for Consolidated Undrained Triaxial Compression Test for Cohesive Soils. ASTM International: West Conshohocken, PA, USA, 2020. [Google Scholar] [CrossRef] [Scilit]
- Khalaj, O.; Ayati Ahmadi, A.; Abedin Nejad, S.; Mašek, B.; Štadler, C.; Skála, J. Evaluation of the Effect of Varying the Angle of Asphaltic Concrete Core on the Behavior of the Meijaran Rockfill Dam. Coatings 2022, 12, 720. [Google Scholar] [CrossRef] [Scilit]
- Royal Irrigation Department (RID). Dam Assessment Manual by Condition Index Method; Dam Safety Division, Bureau of Water Management and Hydrology, Royal Irrigation Department: Bangkok, Thailand, 2018; p. 32. (In Thailand)
- U.S. Army Corps of Engineers. Slope Stability; Engineer Manual EM 1110-2-1902; Department of the Army: Washington, DC, USA, 2003. Available online: https://www.publications.usace.army.mil/Portals/76/Publications/EngineerManuals/EM_1110-2-1902.pdf (accessed on 4 November 2026).
- U.S. Bureau of Reclamation. Design Standards No. 13: Embankment Dams, Chapter 4—Static Stability Analysis; U.S. Department of the Interior: Denver, CO, USA, 2011. Available online: https://www.usbr.gov/tsc/techreferences/designstandards-datacollectionguides/finalds-pdfs/DS13-4.pdf (accessed on 4 November 2026).
- Vavrik, W.R.; Pine, W.J.; Huber, G.A.; Carpenter, S.H.; Bailey, R. The Bailey Method of Gradation Evaluation: The Influence of Aggregate Gradation and Packing Characteristics on Voids in the Mineral Aggregate. J. Assoc. Asph. Paving Technol. 2001, 70, 132–175. [Google Scholar]
- Roberts, F.L.; Kandhal, P.S.; Brown, E.R.; Lee, D.Y.; Kennedy, T.W. Hot Mix Asphalt Materials, Mixture Design, and Construction, 2nd ed.; National Asphalt Pavement Association Research and Education Foundation: Lanham, MD, USA, 1996. [Google Scholar]
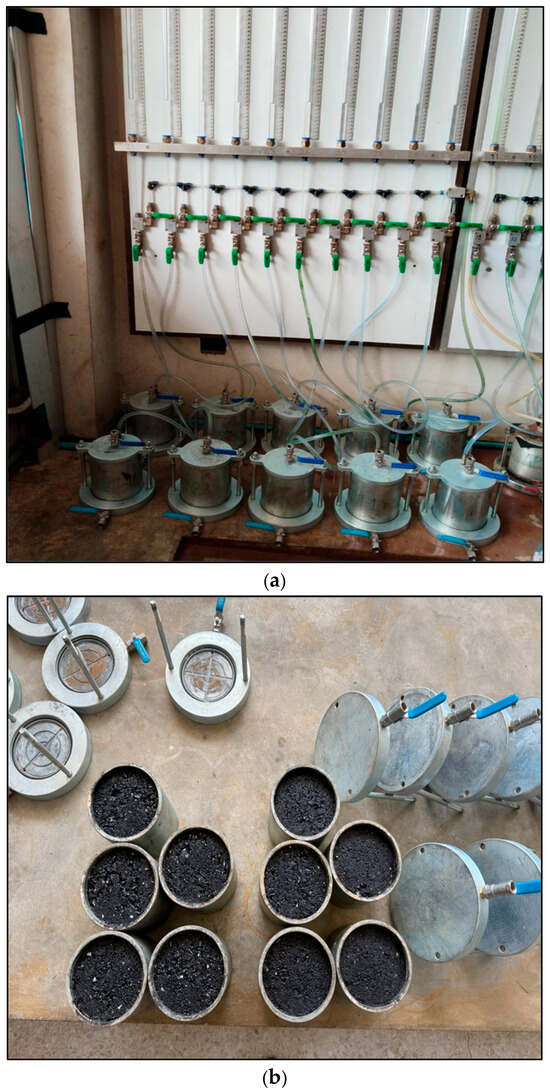
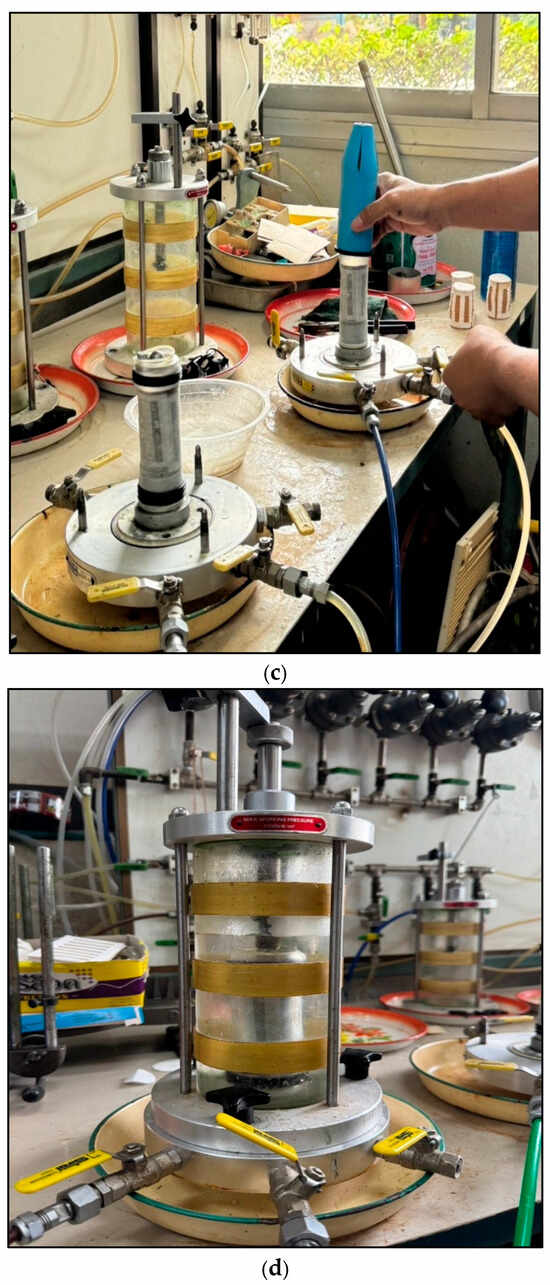
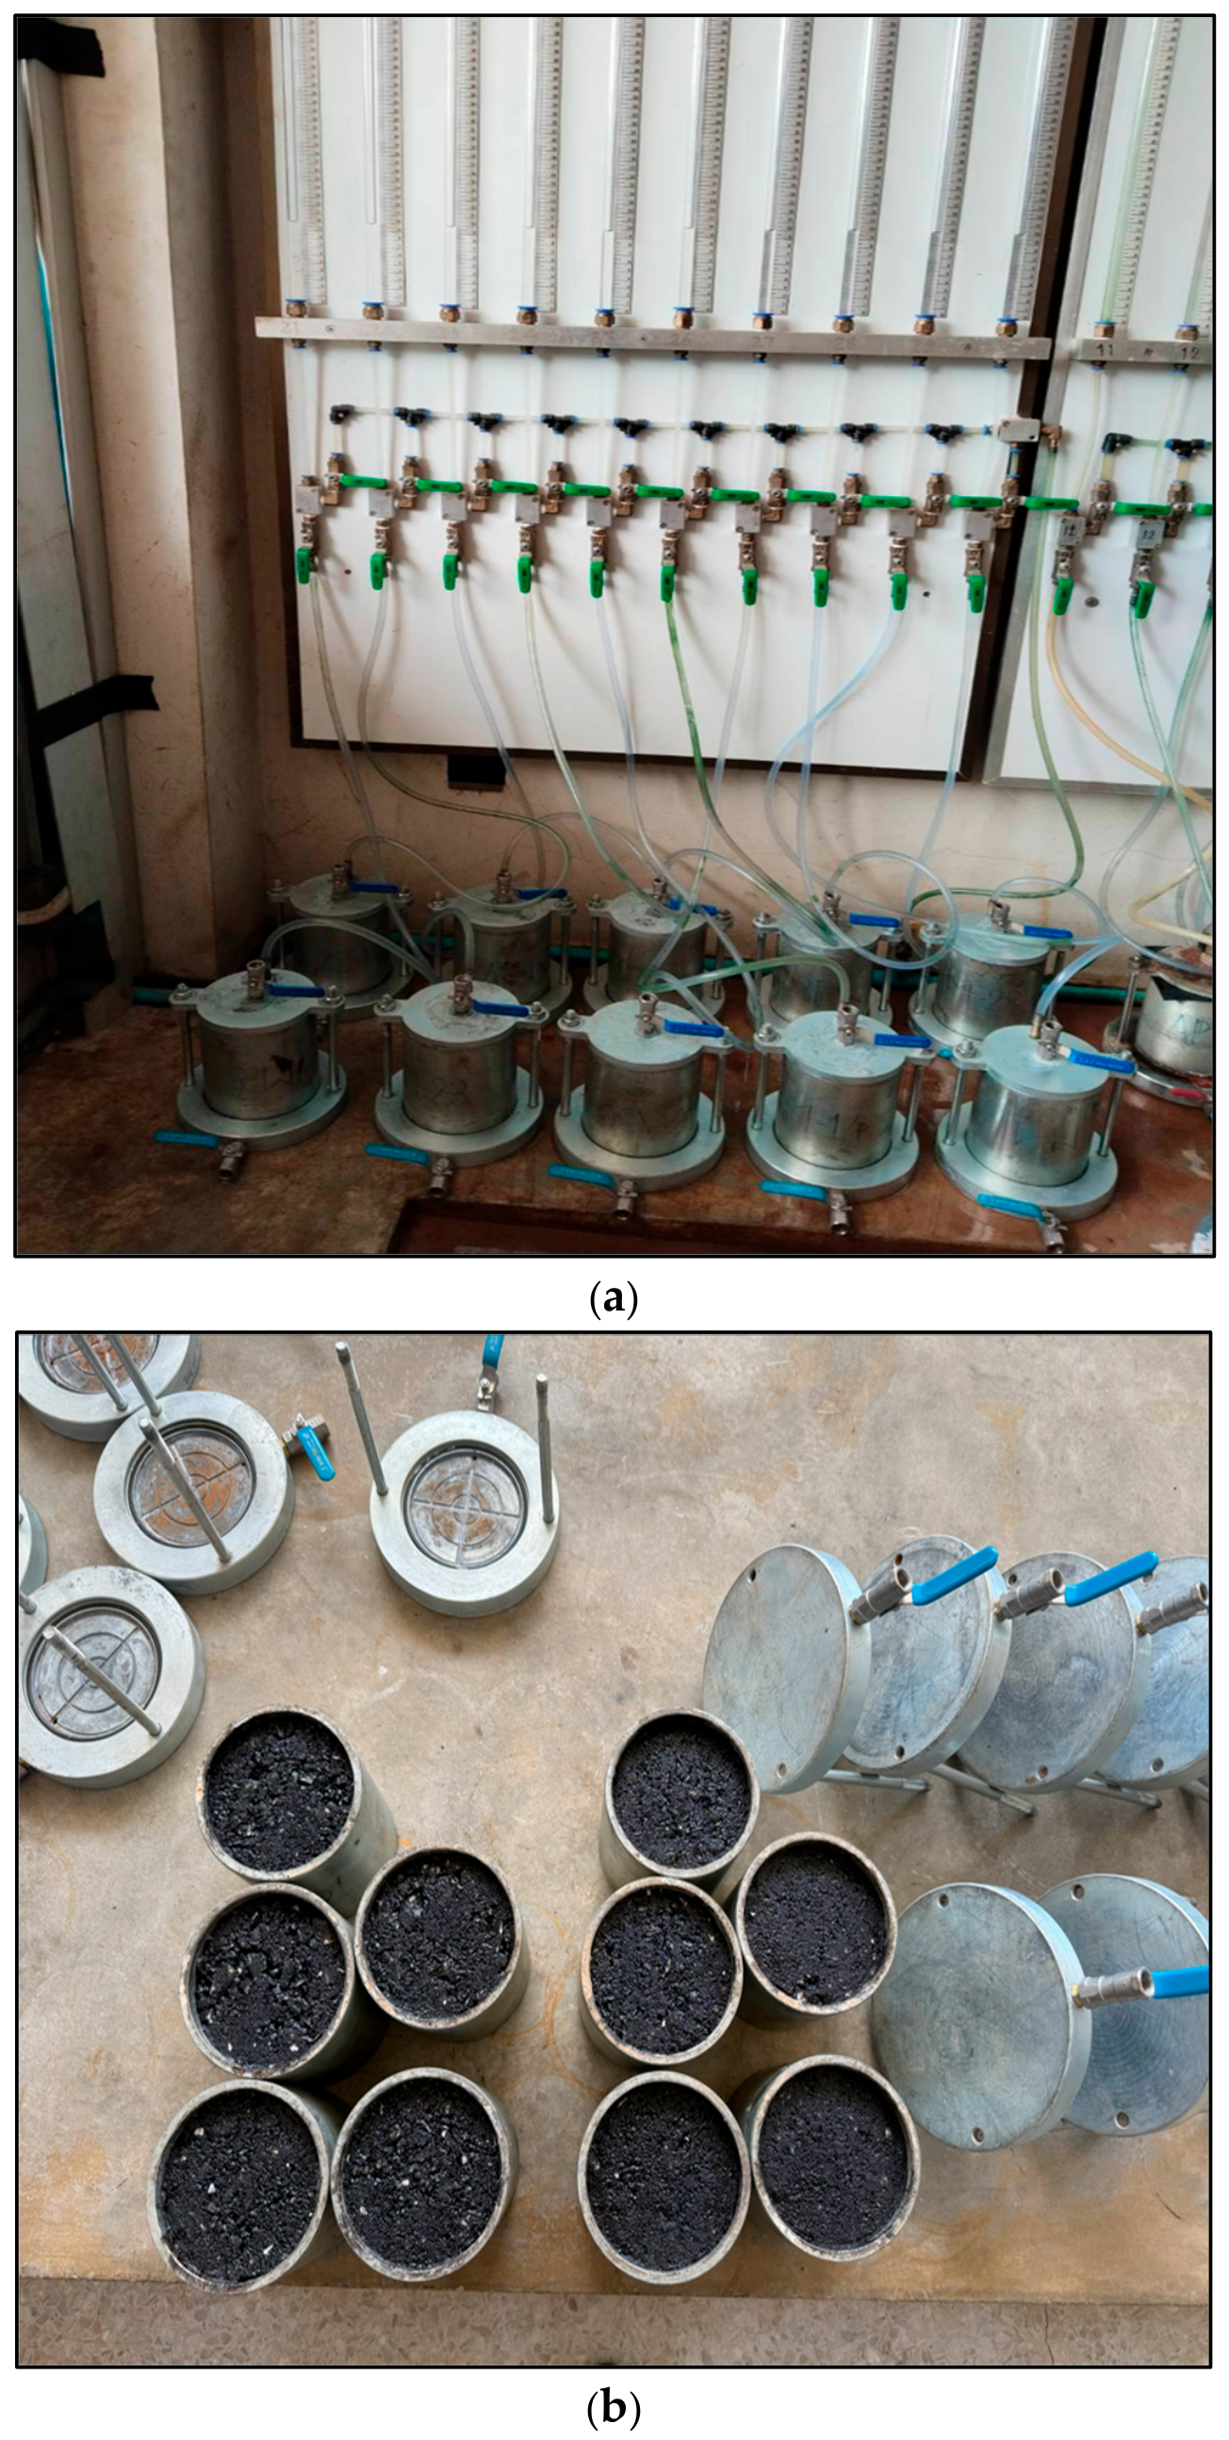
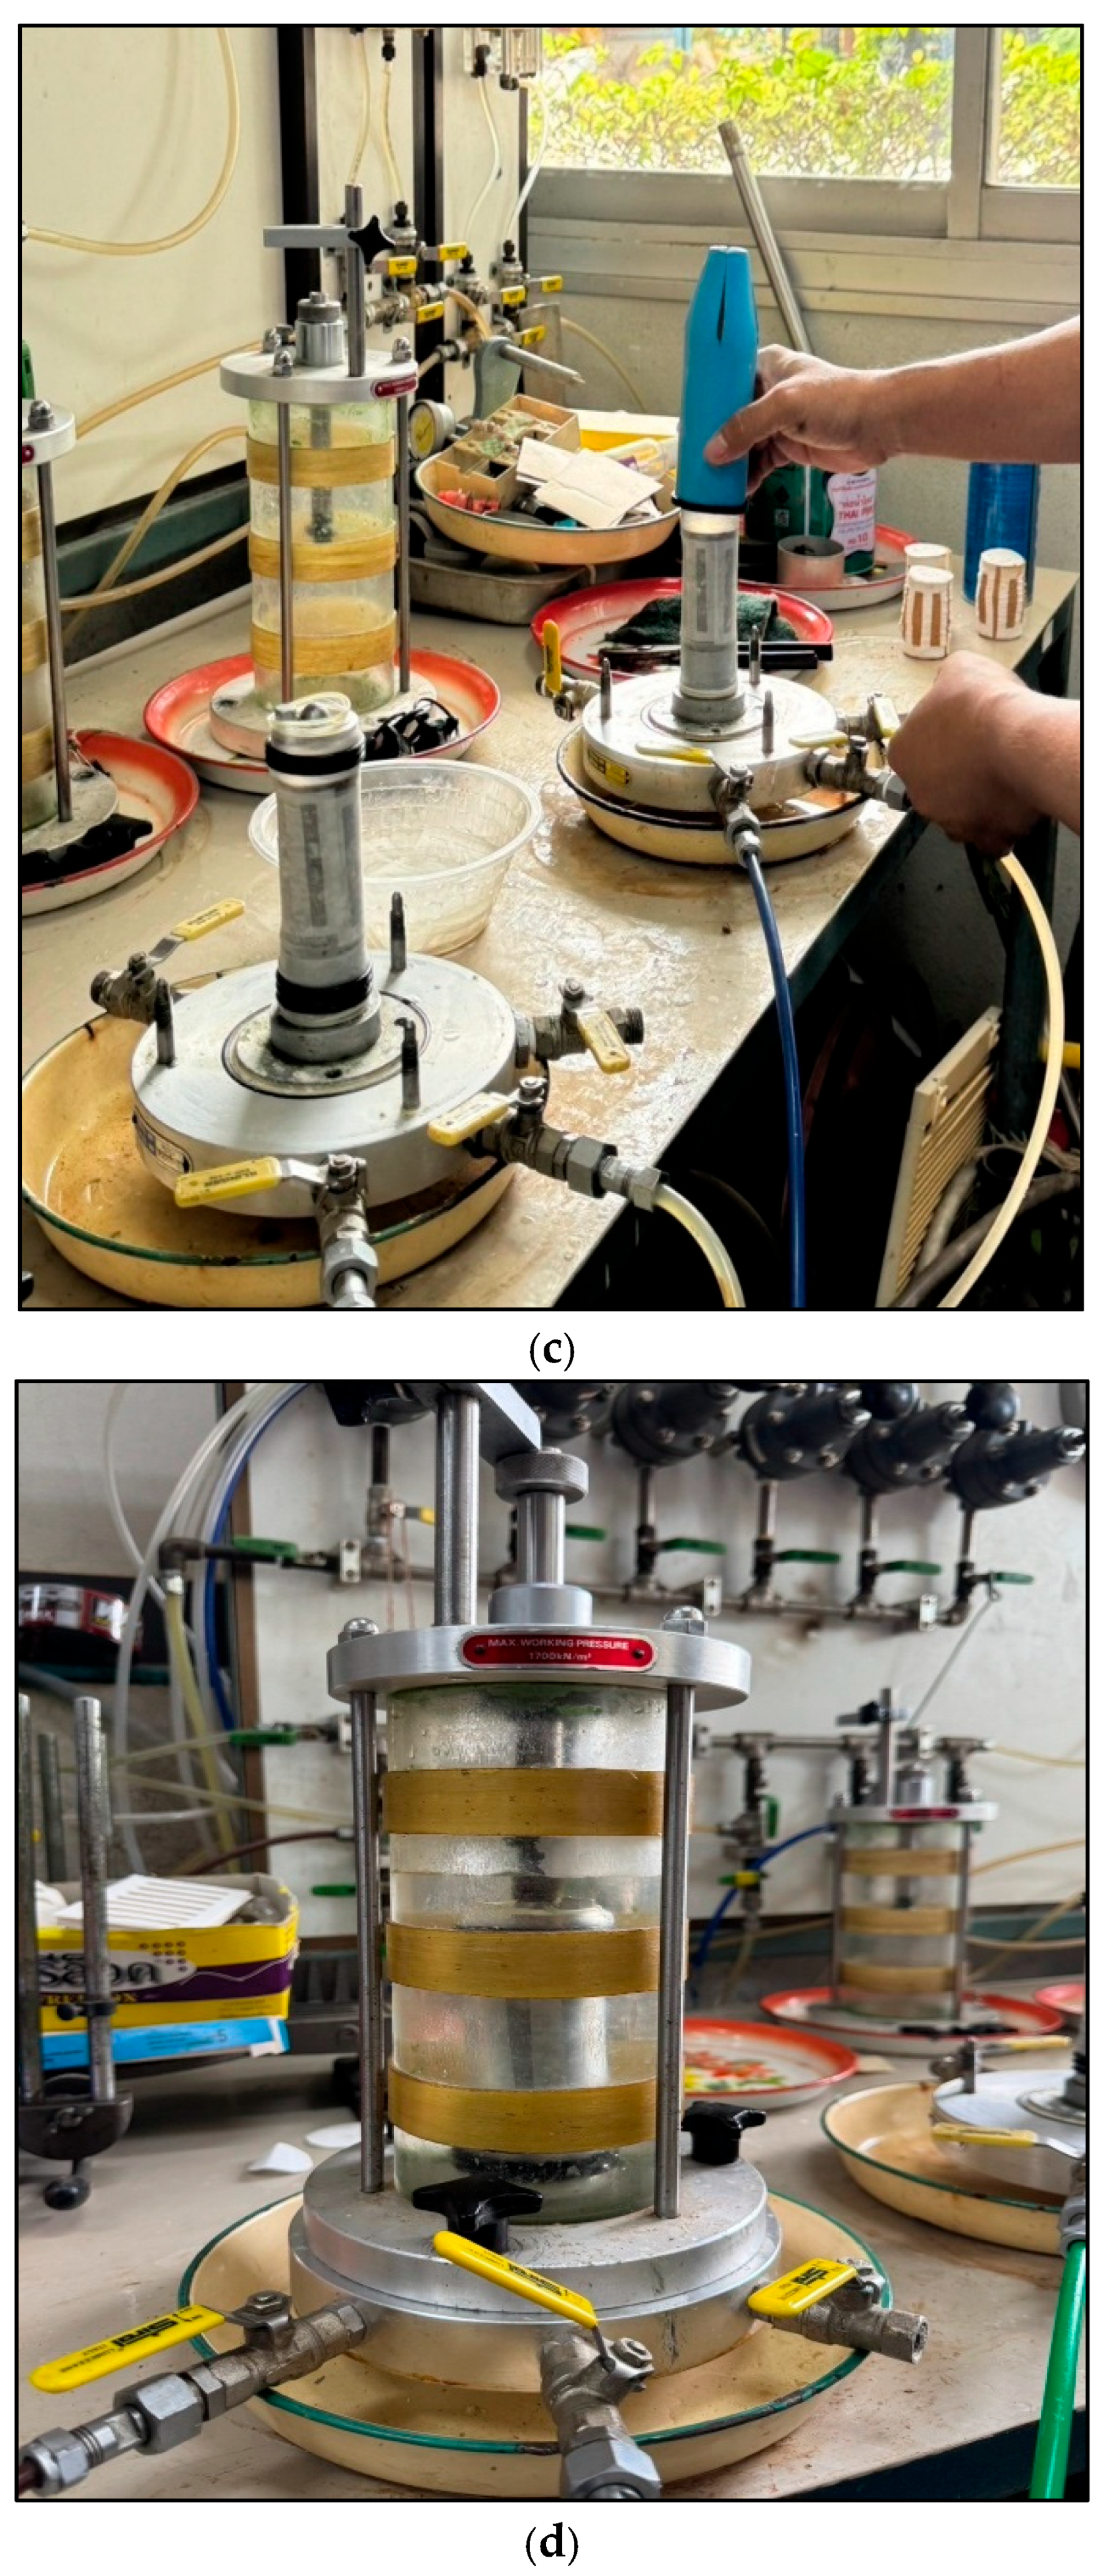
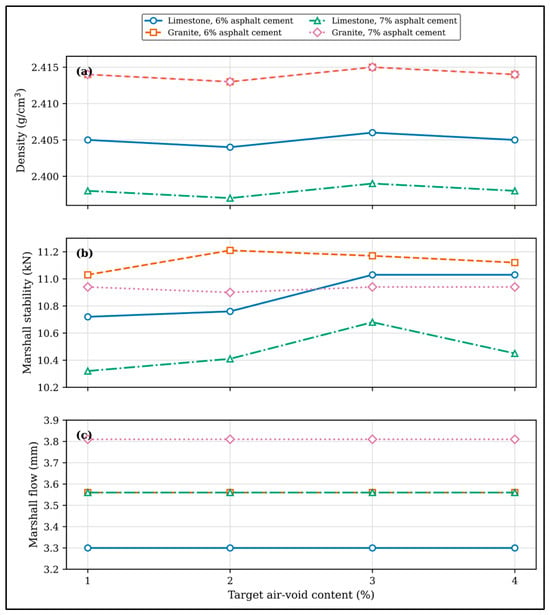
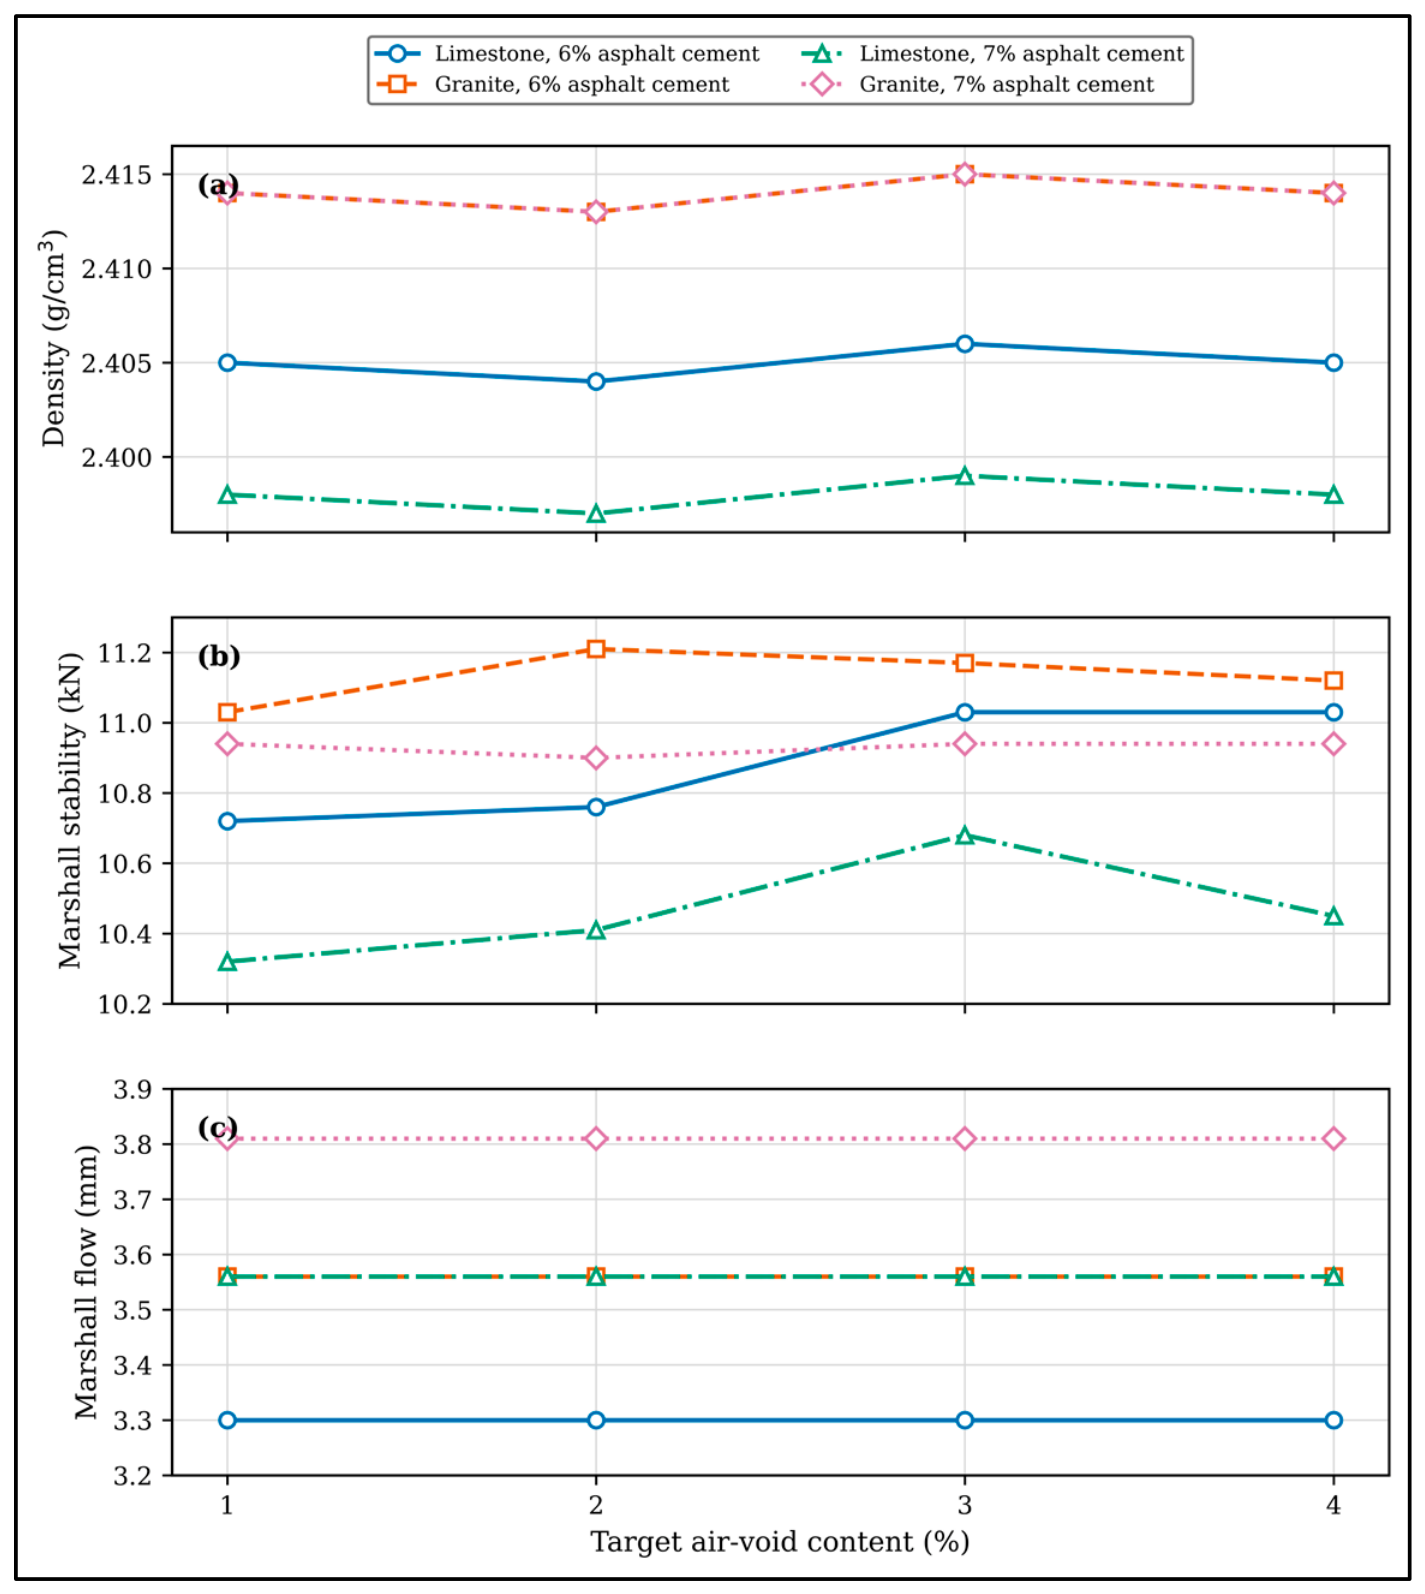
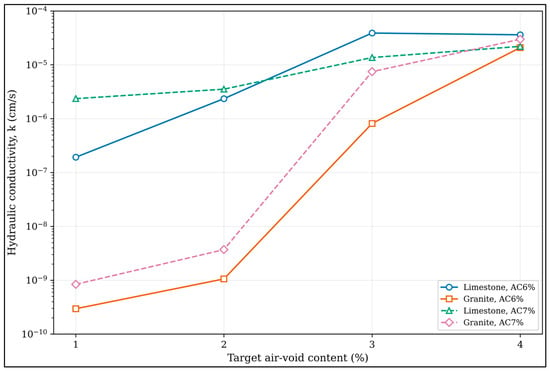
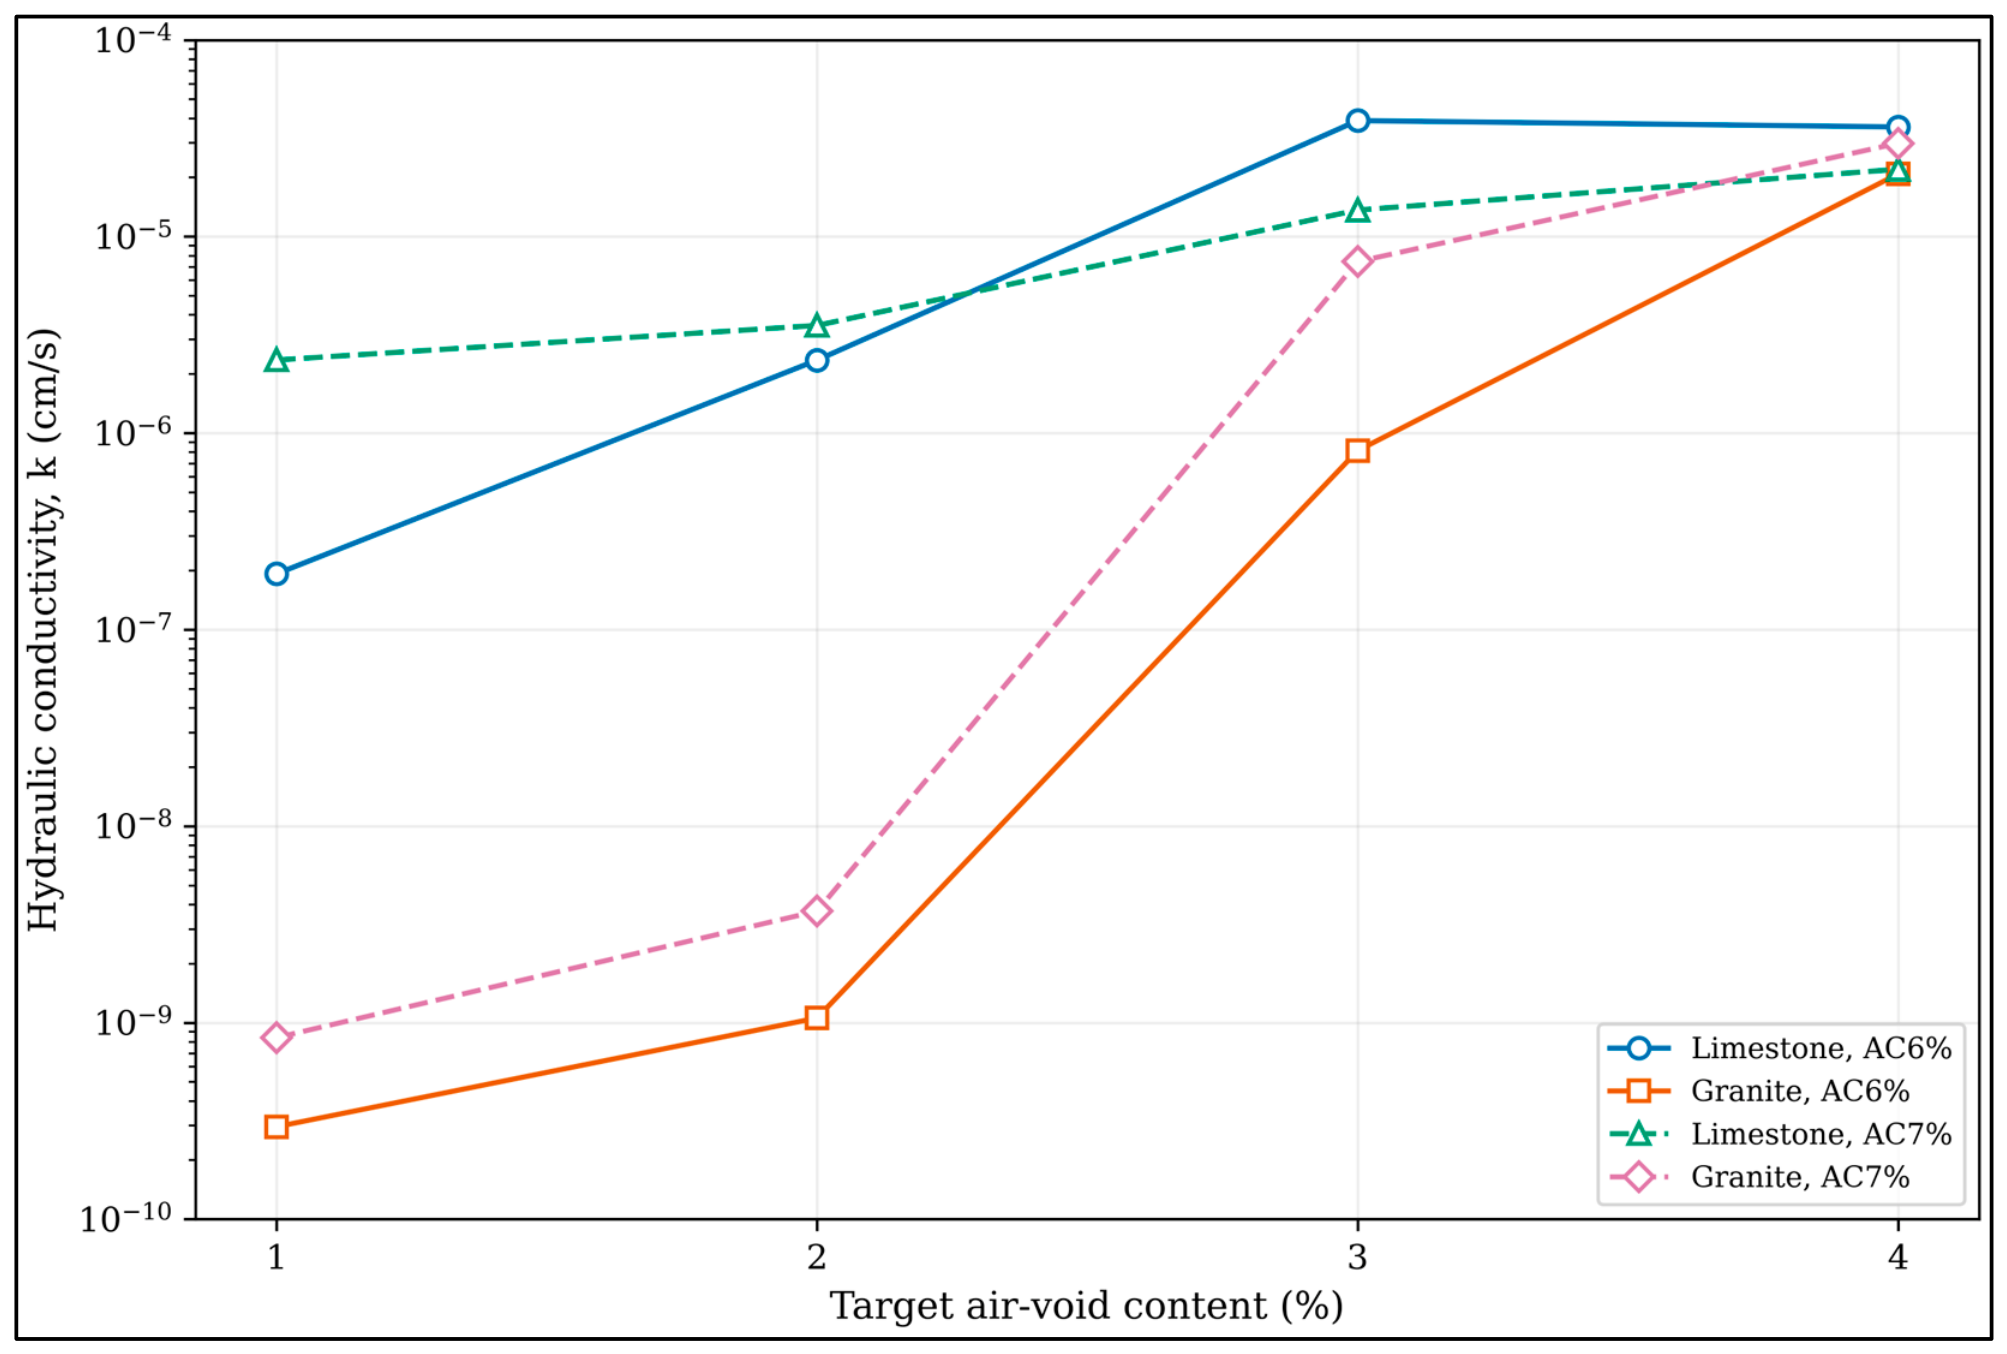
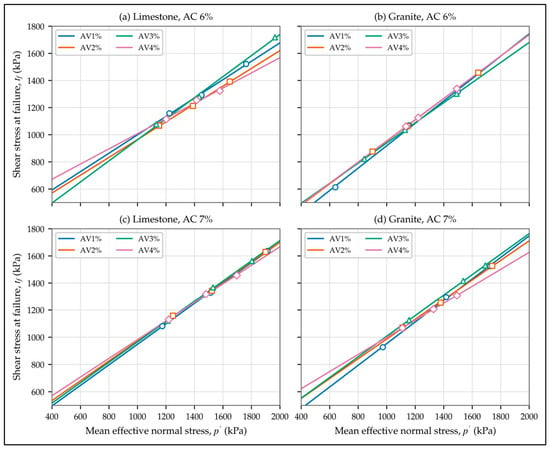
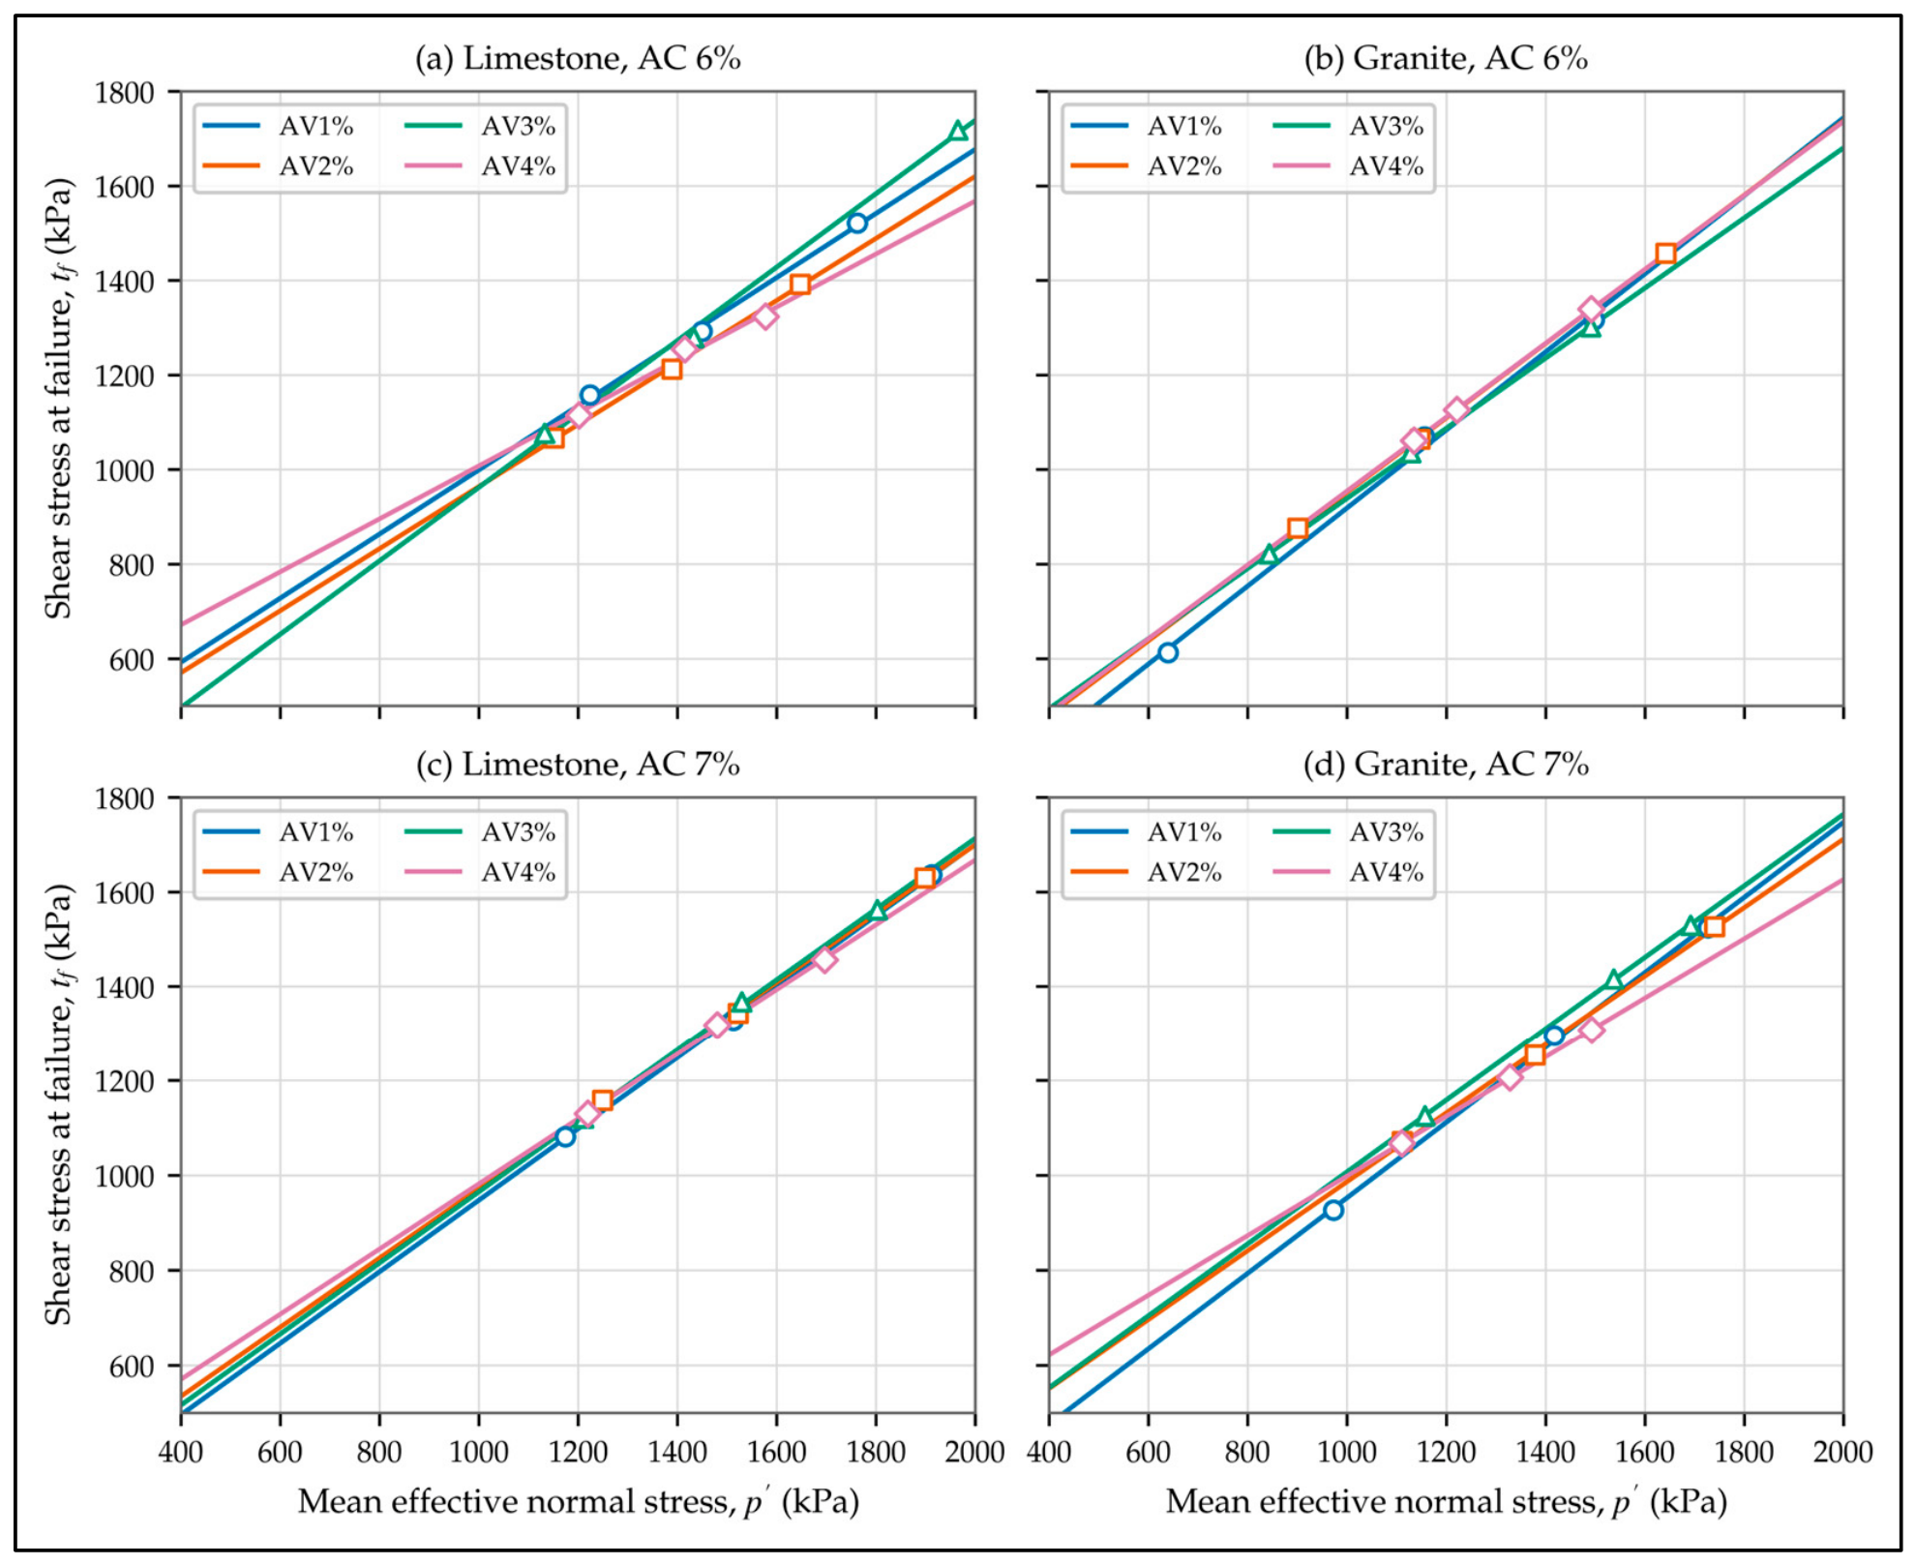
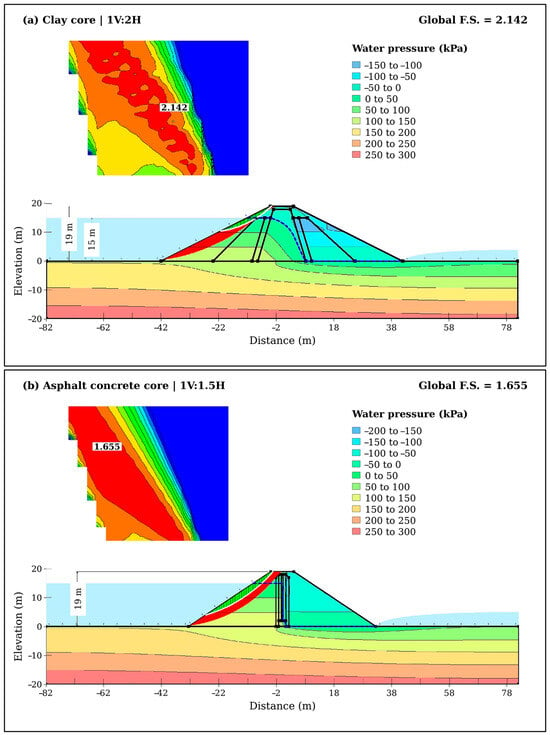
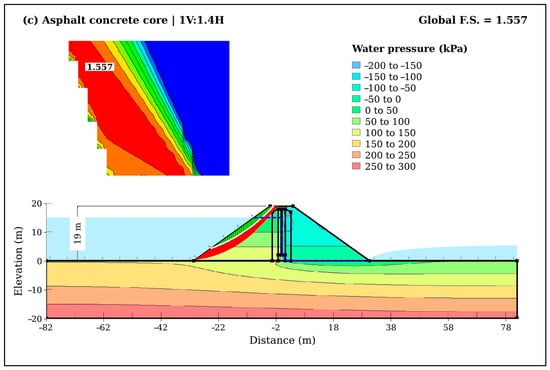
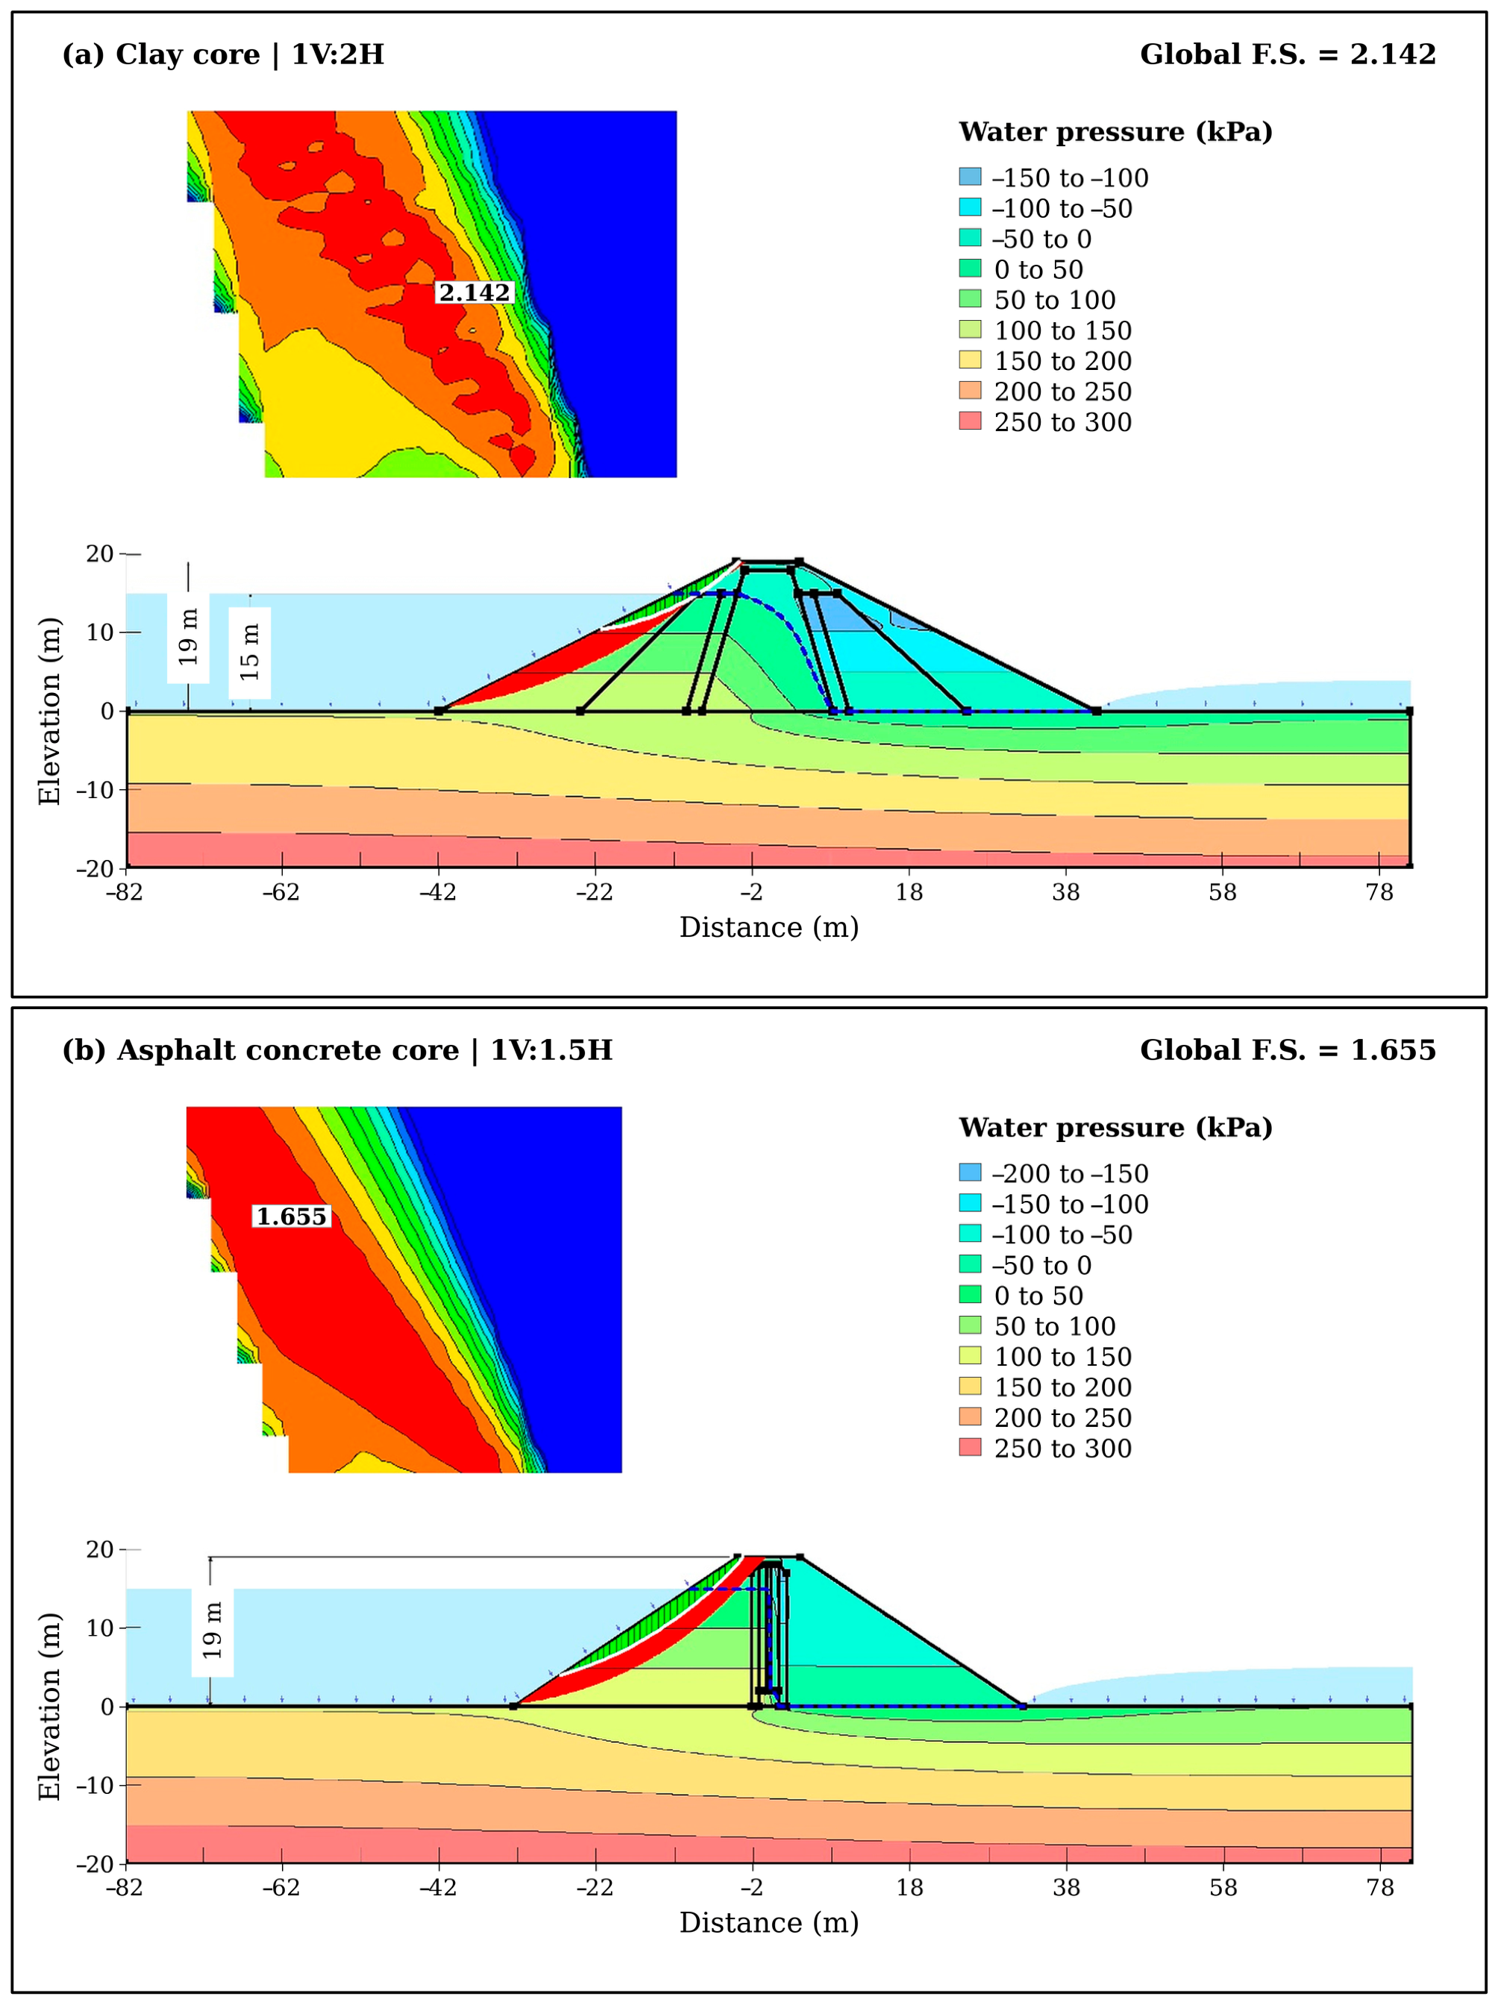
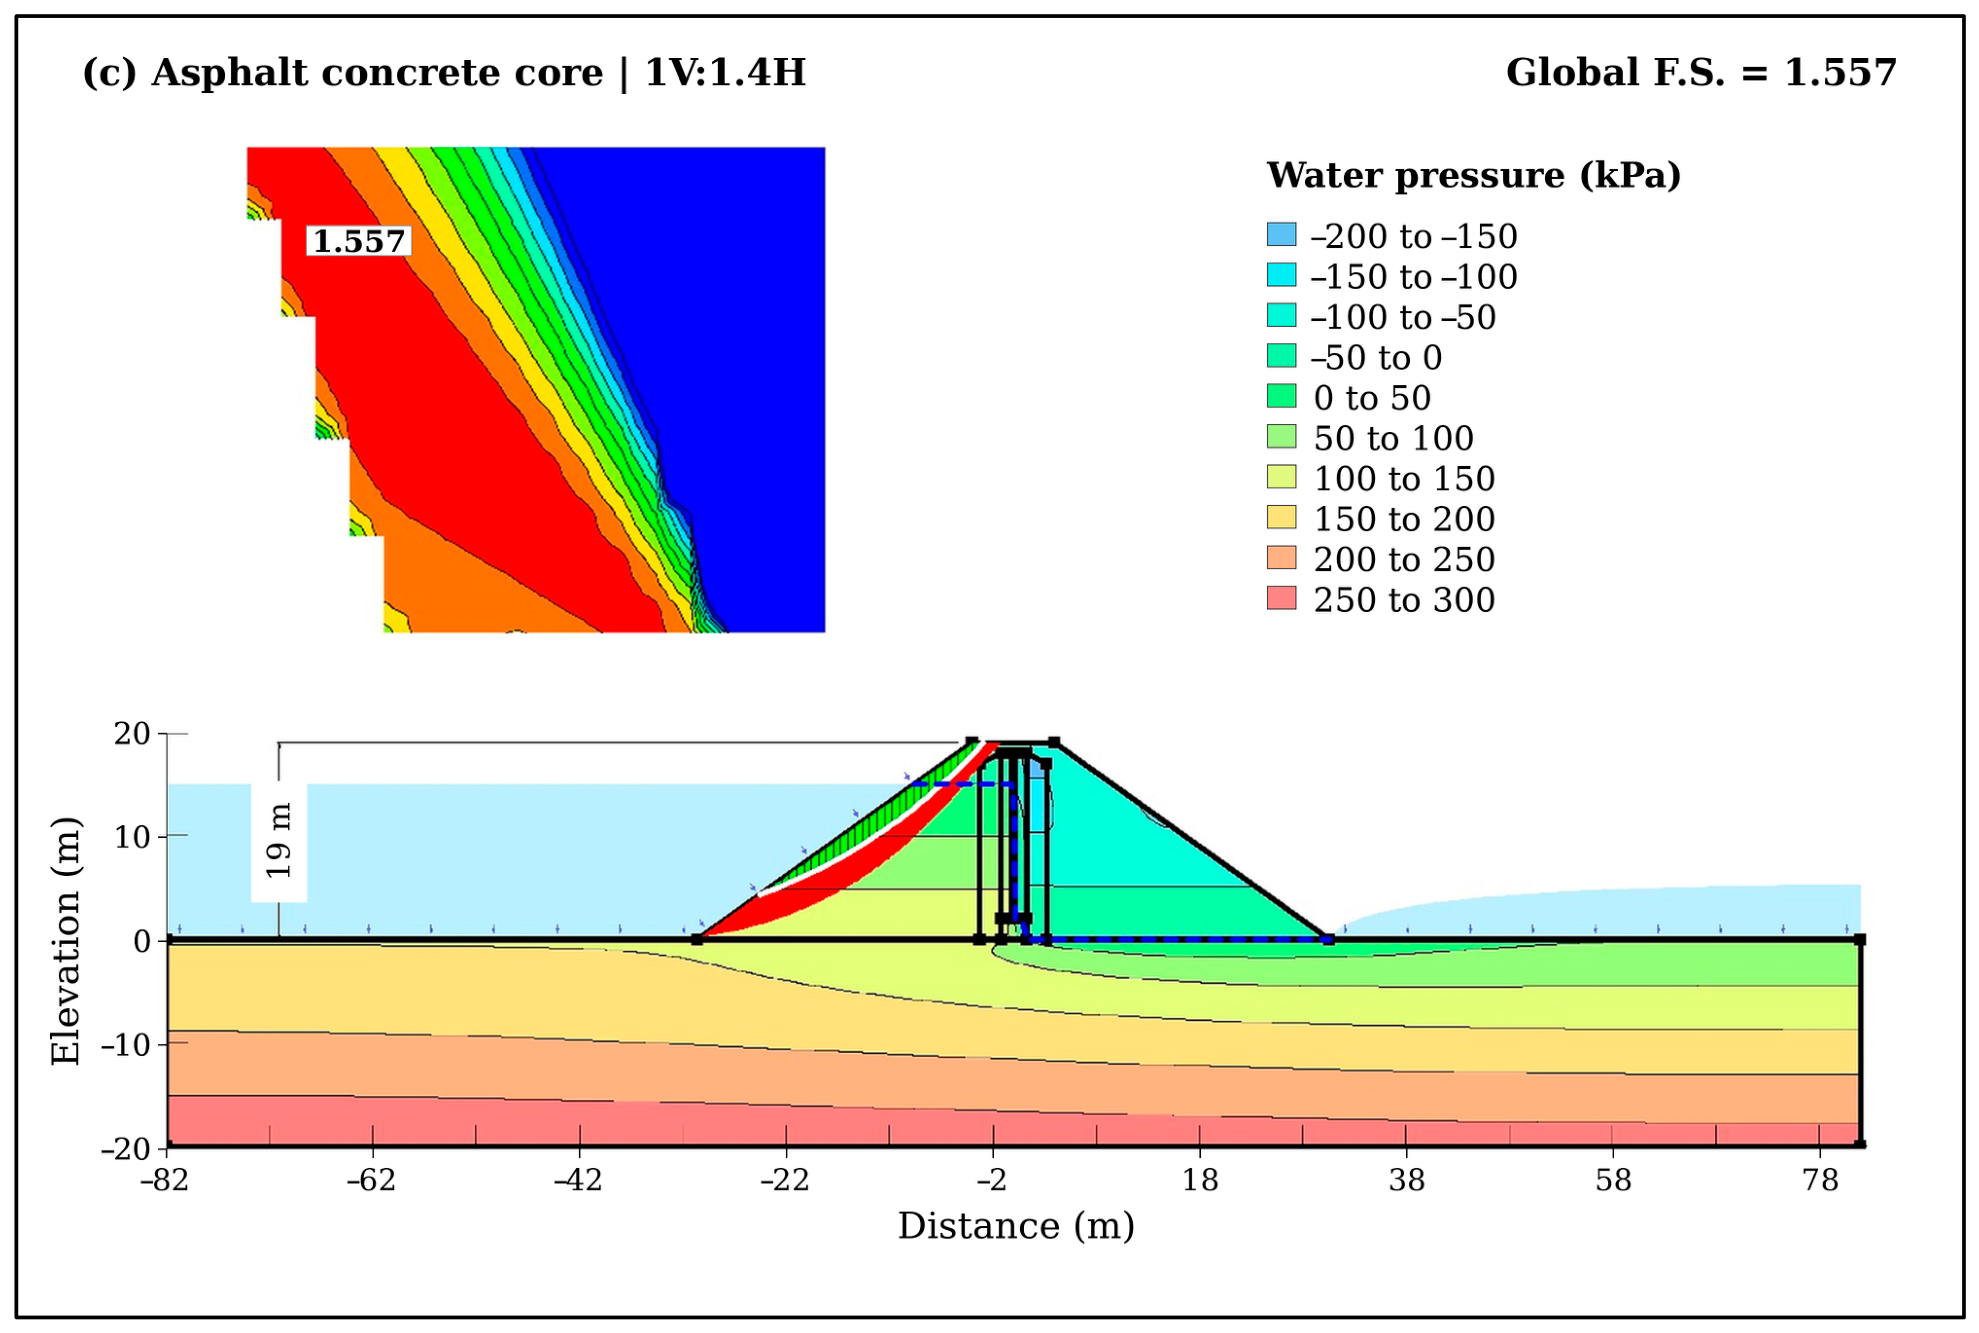

Disclaimer/Publisher’s Note: The statements, opinions and data contained in all publications are solely those of the individual author(s) and contributor(s) and not of MDPI and/or the editor(s). MDPI and/or the editor(s) disclaim responsibility for any injury to people or property resulting from any ideas, methods, instructions or products referred to in the content. |
© 2026 by the authors. Licensee MDPI, Basel, Switzerland. This article is an open access article distributed under the terms and conditions of the Creative Commons Attribution (CC BY) license.