


Abstract
NdGaO3 is an orthorhombic perovskite substrate whose response to swift heavy ions remains insufficiently understood. Here, (001)- and (110)-oriented single-crystal wafers were irradiated with 147 MeV 84Kr15+ ions to 1 × 10¹³ ions/cm2 and examined by symmetric Cu Kα X-ray diffraction. Peak shifts were evaluated using a two-parameter strain/sample-displacement model; PDXL was used for phase identification and diagnostic whole-pattern fitting, while SRIM and NIST attenuation data were used to compare the ion range with the absorption-weighted X-ray depth. Irradiation strongly reduced and broadened the principal reflections and enhanced diffuse scattering near 2θ ≈ 30°. Corrected normal strains were 0.30% for (001) and 1.20% for (110). Reflection-specific apparent microstrains were 0.29–0.61% and 0.69–1.31%, respectively. A broad component already present in the Pristine (110) profile increased in fitted area by approximately 63% after irradiation. Full orthorhombic-cell and Williamson–Hall outputs from unconstrained powder-profile fitting are mathematically underdetermined for these highly oriented wafers and were not used quantitatively. Attenuation calculations establish strong overlap between the probed depth and the SRIM-defined modified region, although depth gradients in crystallinity prevent unique assignment of residual Bragg intensity. The results demonstrate pronounced anisotropic disorder without additional crystalline phases.
1. Introduction
Neodymium gallate (NdGaO3) is a rare-earth gallate with a distorted GdFeO3-type perovskite structure. At room temperature, it crystallizes in the orthorhombic Pbnm setting of space group No. 62 (equivalent to the alternative Pnma setting), with four formula units per unit cell [1,2,3,4,5,6]. The framework consists of corner-sharing GaO6 octahedra, and the departure from the ideal cubic perovskite structure is governed mainly by cooperative octahedral tilting and displacements of Nd ions within the interoctahedral cavities [1,7,8]. These distortions give rise to pronounced crystallographic anisotropy and influence the thermal, optical, dielectric, and lattice-dynamic properties of the material [7,8,9,10,11,12,13,14].
NdGaO3 is widely used as a single-crystal substrate for the epitaxial growth of high-temperature superconductors and other functional oxides, including manganites, nickelates, ferroelectrics, and oxide heterostructures [15,16,17,18,19,20,21,22]. Its technological importance is associated with the availability of high-quality oriented crystals, favorable lattice matching with many perovskite films, and the possibility of obtaining chemically controlled and atomically smooth (001)- and (110)-oriented surfaces [6,7,8]. Surface termination is particularly important because it affects nucleation, interfacial stoichiometry, strain accommodation, and electronic transport in epitaxial heterostructures [18,19,20,21]. Consequently, accurate knowledge of the substrate structure and lattice parameters is essential for evaluating lattice mismatch and strain in coherently grown layers [6].
The room-temperature lattice parameters reported for NdGaO3 vary slightly among diffraction studies because the derived values can be affected by sample alignment, instrumental geometry, crystal stoichiometry, and structural defects [1,6,9]. Using a high-resolution modified Bond method, Schmidbauer et al. determined the absolute lattice parameters as a = 5.428410(54) Å, b = 5.498407(55) Å, and c = 7.708878(95) Å [6]. These values provide a particularly reliable reference for strain analysis in single crystals and epitaxial films. For comparison with routine phase-identification measurements, the ICDD PDF card 00-069-0263 lists the orthorhombic Pbnm phase with a = 5.42554 Å, b = 5.49173 Å, c = 7.70441 Å, and V = 229.55 Å3 [23]. The difference between database and high-precision values illustrates why the selected reference dataset and possible systematic angular errors must be considered when small irradiation-induced lattice changes are evaluated.
The physical properties of NdGaO3 are strongly direction dependent. Anisotropic thermal expansion has been observed along the orthorhombic axes [9,14,16], while the sound velocity and thermal conductivity also reflect the distorted crystal framework [10]. Optical investigations have shown that NdGaO3 possesses anisotropic refractive and dielectric behavior [11,12,13]. In particular, generalized spectroscopic ellipsometry performed on (001)-, (101)-, and (110)-oriented single crystals established the complex dielectric functions along the a, b, and c directions over the photon-energy range of 0.73–9.0 eV [11]. The lowest band-to-band transition energies were determined as 6.46(6), 6.29(5), and 6.77(7) eV for polarization along the a, b, and c axes, respectively [11]. These results identify NdGaO3 as an ultrawide-bandgap oxide and demonstrate that crystallographic orientation must be considered when interpreting its optical response [11]. NdGaO3 is generally considered thermally stable over a wide temperature range, with no pronounced structural discontinuities. Nevertheless, Berkstresser et al. [24] reported a second-order phase transition at approximately 1220 K using differential thermal analysis (DTA). Furthermore, Savytskii et al. [25,26] observed a thermal anomaly near 200 K in NdGaO3 single crystals, evidenced by anomalies in the dielectric loss tangent, magnetic susceptibility, and thermal expansion coefficient. To clarify the crystal symmetry and investigate the structural anomaly near 200 K, IR, Raman and even temperature-dependent polarized Raman spectroscopy was performed on a NdGaO3 single crystal [8,27]. The interpretation of the spectra is particularly challenging because NdGaO3 adopts a strongly distorted orthorhombic perovskite structure (Pbnm), in which cooperative rotations and tilts of the GaO6 octahedra substantially increase the number of Raman-active lattice vibrations. Nevertheless, 18 well-resolved phonon modes were successfully identified and assigned to the Pbnm symmetry: seven A1g, four B1g, four B2g, and three B3g modes [8]. Table 1 presents a comprehensive overview of the experimental data reported for NdGaO3 in the literature [1,2,8,9,12,25,26,27]. By consolidating the fundamental structural, dielectric, and physicochemical characteristics, the table establishes a coherent basis for understanding the interplay between the intrinsic properties of NdGaO3 and its behavior in functional and technological applications.
Table 1.
Representative structural and physicochemical properties of NdGaO3 reported in the literature.
The pronounced anisotropy and high structural quality of NdGaO3 also make it a useful model system for investigating radiation-induced modifications in complex oxides. When a swift heavy ion penetrates a solid, a major fraction of its kinetic energy may be deposited through electronic stopping. The subsequent transfer of energy from the excited electronic subsystem to the lattice can generate highly localized structural disorder, residual stress, defect-rich regions, and, when the deposited energy exceeds the relevant damage threshold, latent ion tracks or partial amorphization [28,29,30,31,32,33]. The final damage morphology depends on the electronic energy-loss density, ion velocity, thermal and elastic properties of the target, defect-recovery kinetics, and crystallographic structure [33,34,35].
Despite the extensive literature on the pristine crystal structure, substrate preparation, interfacial behavior, and optical properties of NdGaO3 [15,16,17,18,19,20,21], systematic studies of high-energy-ion-induced structural modifications in oriented NdGaO3 single crystals remain limited. This lack of data is important because irradiation-induced changes in lattice spacing, microstrain, mosaicity, crystalline fraction, or surface-layer disorder may affect the reliability of NdGaO3-based substrates and devices operating in radiation environments. Comparison of different orientations is particularly relevant for an orthorhombic material because the response measured by symmetric X-ray diffraction is tied directly to the lattice planes parallel to the sample surface.
A further methodological issue concerns the interpretation of symmetric θ–2θ scans from oriented single crystals. Whole-pattern fitting and Rietveld-type approaches are most robust when numerous independent reflections are available, whereas a flat oriented crystal generally produces only a restricted family of predominantly symmetric reflections. Under these conditions, simultaneous refinement of all orthorhombic unit-cell parameters is mathematically underdetermined and can yield strongly correlated or nonphysical values. Conversely, calculations based on only one or two peak positions do not use the complete diffraction-profile information and may be sensitive to sample displacement, peak asymmetry, diffuse-scattering tails, and weak-reflection uncertainties. Accordingly, the present analysis assigns distinct roles to the two approaches: selected reflections are used for quantitative orientation-specific lattice metrics, whereas PDXL is retained for phase identification and diagnostic assessment of overall profile evolution.
In this work, the structural response of (001)- and (110)-oriented NdGaO3 single crystals irradiated with 147 MeV Kr ions to a fluence of 1 × 10¹³ ions cm−2 is investigated. The objectives are to (i) determine the magnitude and anisotropy of irradiation-induced changes in interplanar spacing; (ii) separate directional lattice strain from geometric sample-displacement effects; (iii) estimate the apparent microstrain of the residual crystalline component; (iv) define the valid and invalid uses of PDXL/WPPF outputs for highly oriented wafers; (v) distinguish irradiation-enhanced diffuse scattering from a pre-existing broad background component; and (vi) evaluate the overlap between the absorption-weighted Cu Kα information depth and the SRIM-calculated ion-modified region [36,37,38,39,40].
2. Materials and Methods
2.1. Samples and Irradiation Conditions
Commercial NdGaO3 single-crystal substrates with (001) and (110) surface orientations were supplied by Kinheng Crystal Material (Shanghai) Co., Ltd., China. The starting wafers had a diameter of 1 inch, a thickness of 0.5 mm, and double-side-polished flat surfaces.
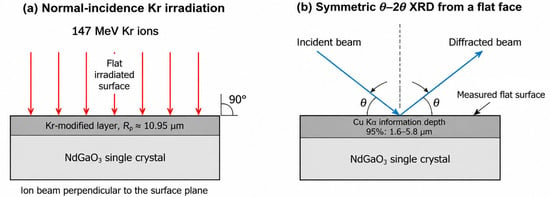
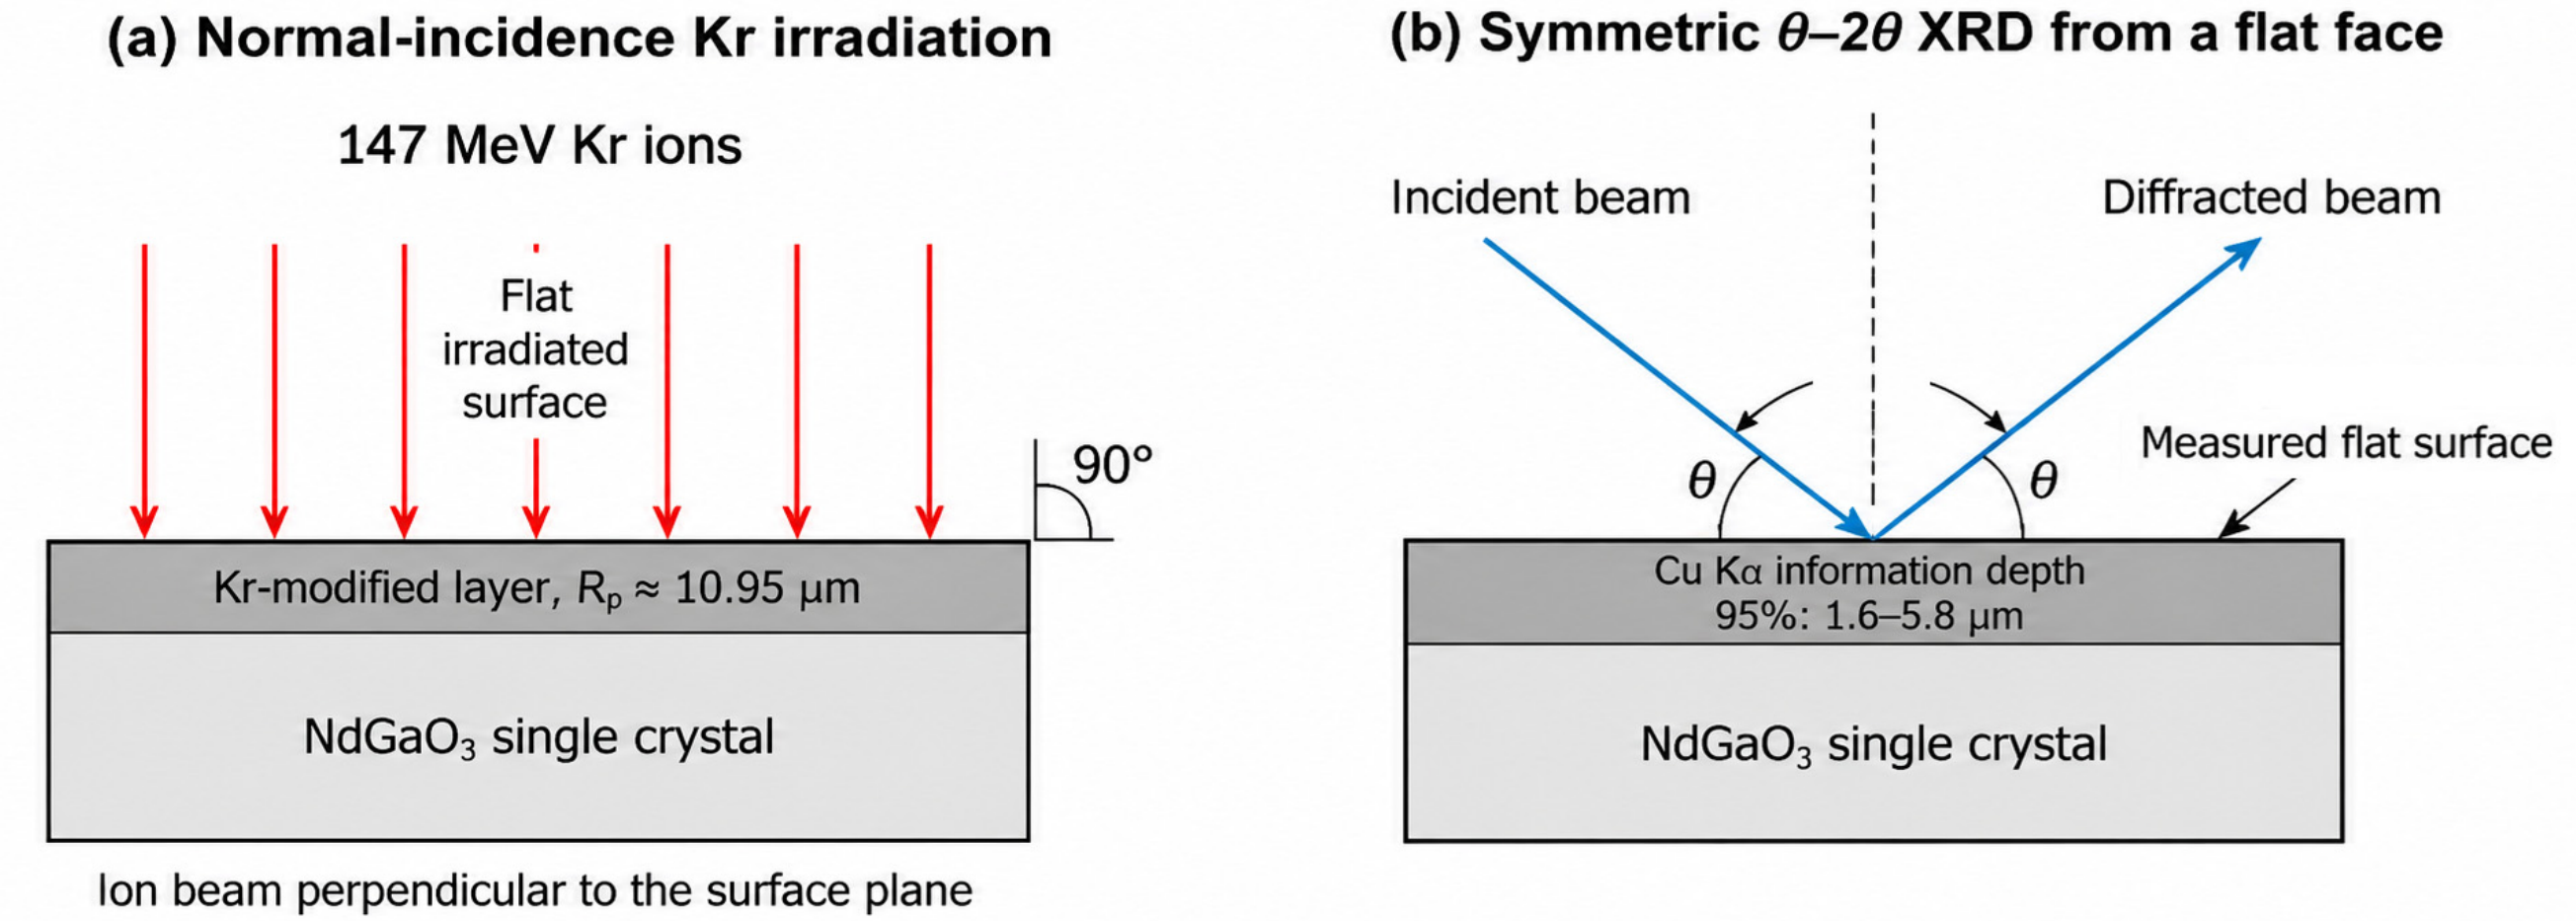
The NdGaO3 samples were irradiated with 84Kr15+ ions at an energy of 1.75 MeV per nucleon, corresponding to a total ion energy of approximately 147 MeV. Irradiation was performed using the DC-60 heavy-ion accelerator at the Institute of Nuclear Physics, Astana, Kazakhstan, which has been extensively employed in our previous studies on radiation-induced pro-cesses and defect evolution in a variety of functional and structural materials [41,42,43,44,45]. The total fluence was 1 × 10¹³ ions cm−2, and the ion-beam current density was maintained within the range of 25–30 nA cm−2. The beam was incident at 90° to the sample surface, i.e., normal to the irradiated plane (Figure 1a). The total fluence was used as the principal irradiation-dose parameter; no model-based conversion of current density into beam-heating or annealing corrections was introduced.
Figure 1.
Experimental geometry. (a) Normal-incidence irradiation of the flat NdGaO3 surface by 147 MeV Kr ions. (b) Symmetric θ–2θ XRD measurement from a flat face.
2.2. X-Ray Diffraction Measurements
Structural characterization was performed using a Bruker D6 PHASER X-ray diffractometer (Bruker AXS GmbH, Karlsruhe, Germany) equipped with a Cu-anode source operated at 40 kV and 15 mA. Measurements employed the stored Coupled TwoTheta/Theta method in symmetric θ–2θ geometry, Continuous PSD fast scan mode, and an SSD160 detector operated in one-dimensional pulse-height-analysis (PHA) mode. PHA energy discrimination was used to suppress the Cu Kβ contribution. The flat specimens were spun about the surface normal during acquisition; for an oriented single crystal, this rotation averages azimuthal surface and mounting inhomogeneity but does not produce powder averaging. The Pristine and Kr-irradiated faces were measured after flipping and remounting each specimen. Acquisition and export parameters are summarized in Table 2.
Table 2.
XRD acquisition and data-export parameters.
2.3. PDXL Phase Identification and Diagnostic Whole-Pattern Fitting
Phase identification, background modelling, and diagnostic whole-pattern profile fitting were performed using the Rigaku PDXL software package (Rigaku Corporation, Tokyo, Japan). The software accounts for the measured background, peak positions and shapes, the Cu Kα1/Kα2 doublet, profile asymmetry, and preferred orientation. These capabilities were used to identify crystalline phases and to inspect the global degradation of the diffraction profiles after irradiation.
The full orthorhombic-cell parameters and Williamson–Hall domain-size/microstrain outputs from unconstrained PDXL fitting were not treated as quantitative structural observables. Symmetric scans of the present highly oriented wafers contain only 00L or hh0 specular families and lack the independent asymmetric reflections required to determine a, b, c, and V simultaneously. The numerical instability is directly demonstrated by nonphysical outputs for the narrow Pristine (110) pattern, including a coherent-domain size of 14.21 Å and a Williamson–Hall microstrain of 7.1%. Complete PDXL outputs are retained in Supplementary Table S1 for transparency, but the quantitative strain analysis in the main text is based on direction-specific indexed reflections.
2.4. Manual Determination of Direction-Specific Structural Parameters
Interplanar spacings were calculated using Bragg’s law [46]:
For an orthorhombic unit cell,
For the (001) orientation, symmetric (00L) reflections directly determine the out-of-plane lattice parameter:
The principal estimate of was obtained from the 004 and 006 reflections. The region near , where the closely spaced 002 and 110 contributions may overlap, was used only for diagnostic purposes. For the (110) orientation, the primary directly measurable parameter is
Independent determination of (a) and (b) from the symmetric 110 and 220 reflections is not possible without additional asymmetric reflections. Therefore, the manual analysis of the (110)-oriented samples was restricted to and was not intended to reconstruct the complete three-dimensional orthorhombic unit cell independently.
2.5. Separation of Lattice Strain and Effective Sample Displacement
When a sample is flipped and remounted, the observed peak shift may contain both a strain-related contribution and a geometric contribution arising from displacement of the measured surface relative to the focusing circle. In the linear approximation,
where is the average normal strain, h is the surface displacement, and R is the goniometer radius; all angular quantities are expressed in radians. For each crystallographic orientation, two available reflections were used to solve the resulting system of equations for and the dimensionless parameter h/R.
Because the system contains two equations and two unknowns, the procedure has no internal degrees of freedom. It should therefore not be regarded as an independent metrological calibration, but rather as a physically motivated sensitivity analysis of the effect of sample remounting. The key result is that a non-zero strain contribution remains after inclusion of the geometric term and retains a pronounced orientation dependence.
2.6. Bragg-Peak Broadening and Microstrain
In the absence of a separate instrumental standard, the width of the corresponding Pristine reflection was used as an experimental baseline that includes both instrumental broadening and the initial mosaic spread:
where the full width at half maximum, , is expressed in radians. The apparent microstrain associated with an individual reflection was estimated as
whereas the equivalent coherent-scattering length scale of the residual Bragg component was calculated as
with (K = 0.9). These quantities are regarded as apparent values because the contributions of finite domain size, mosaicity, strain gradients, and instrumental broadening were not fully separated.
The manual approach has three fundamental limitations. First, it determines only cout for the (001) orientation and d110 for the (110) orientation rather than the complete orthorhombic unit cell. Second, it relies on the positions and local widths of selected reflections and therefore does not account for the complete profile shape, peak asymmetry, or extended diffuse-scattering tails. Third, the analysis is based on only two or three reflections and is consequently sensitive to poor counting statistics, peak overlap, and the selected local background. These limitations are explicitly acknowledged; they justify using PDXL for phase and profile diagnostics, but they do not validate unconstrained PDXL full-cell or Williamson–Hall parameters as quantitative single-crystal constants.
2.7. Diffuse Scattering and Short-Range Correlation Length
The broad contribution near 2θ ≈ 30° was not treated as a conventional Bragg reflection. Because a broad maximum is already present in the Pristine (110) profile, the Pristine and Kr-irradiated (110) data were fitted over 25–40° using the same linear-background-plus-Gaussian model. The comparison was based on the fitted center, FWHM, and integrated Gaussian area. For the (001) Pristine profile, the long tails of the intense 00L reflections and periodic PSD-related modulation prevented a stable equivalent baseline separation; consequently, only the characteristic width of the broad component in the Kr-irradiated (001) profile was reported. The magnitude of the scattering vector was calculated as
For a profile width , expressed in radians, the corresponding broadening in reciprocal space was approximated as
The resulting ξ value is a descriptive correlation length for the broad component and must not be interpreted as a crystallite size, a coherent-domain size of the original single crystal, or a direct measure of amorphous volume fraction.
2.8. SRIM Simulations and XRD Information Depth
SRIM-2013.00 calculations were performed for Kr in an Nd–Ga–O target with a density of 7.57 g cm−3 and atomic composition Nd:Ga:O = 20:20:60. The supplied file is a SRIM stopping/range table, not a TRIM displacement-damage simulation. Therefore, Quick Kinchin–Pease versus Full Cascade settings, the number of simulated collision histories, and threshold displacement energies for Nd, Ga, and O do not enter the reported Se, Sn, Rp, or straggling values. The quoted Se = 19.84 keV/nm and Sn = 0.05151 keV/nm are the tabulated entrance values at the incident energy of 147 MeV; they are not depth-averaged values or maxima. The available output does not contain a depth-resolved stopping or vacancy-production profile. The principal parameters are summarized in Table 3.
Table 3.
Irradiation parameters and SRIM-2013.00 stopping/range results [37].
Because no depth-resolved Se(z), vacancy, or dpa profile was generated, the SRIM results are used only to establish the incident stopping regime and the characteristic projected range/straggling envelope. No depth-dependent defect concentration is inferred from the single entrance stopping value.
In symmetric geometry, the contribution from a layer located at depth z is attenuated according to
where is the linear X-ray attenuation coefficient. The depth containing a fraction p of the total diffraction signal is therefore given by
The linear attenuation coefficient was calculated using the mixture rule
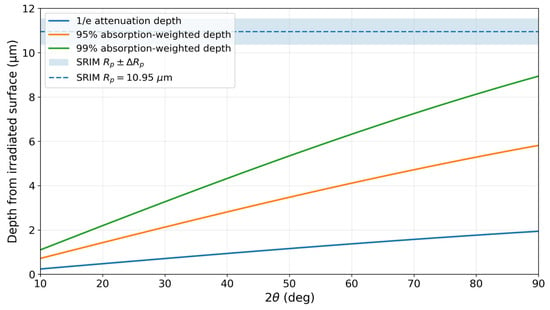
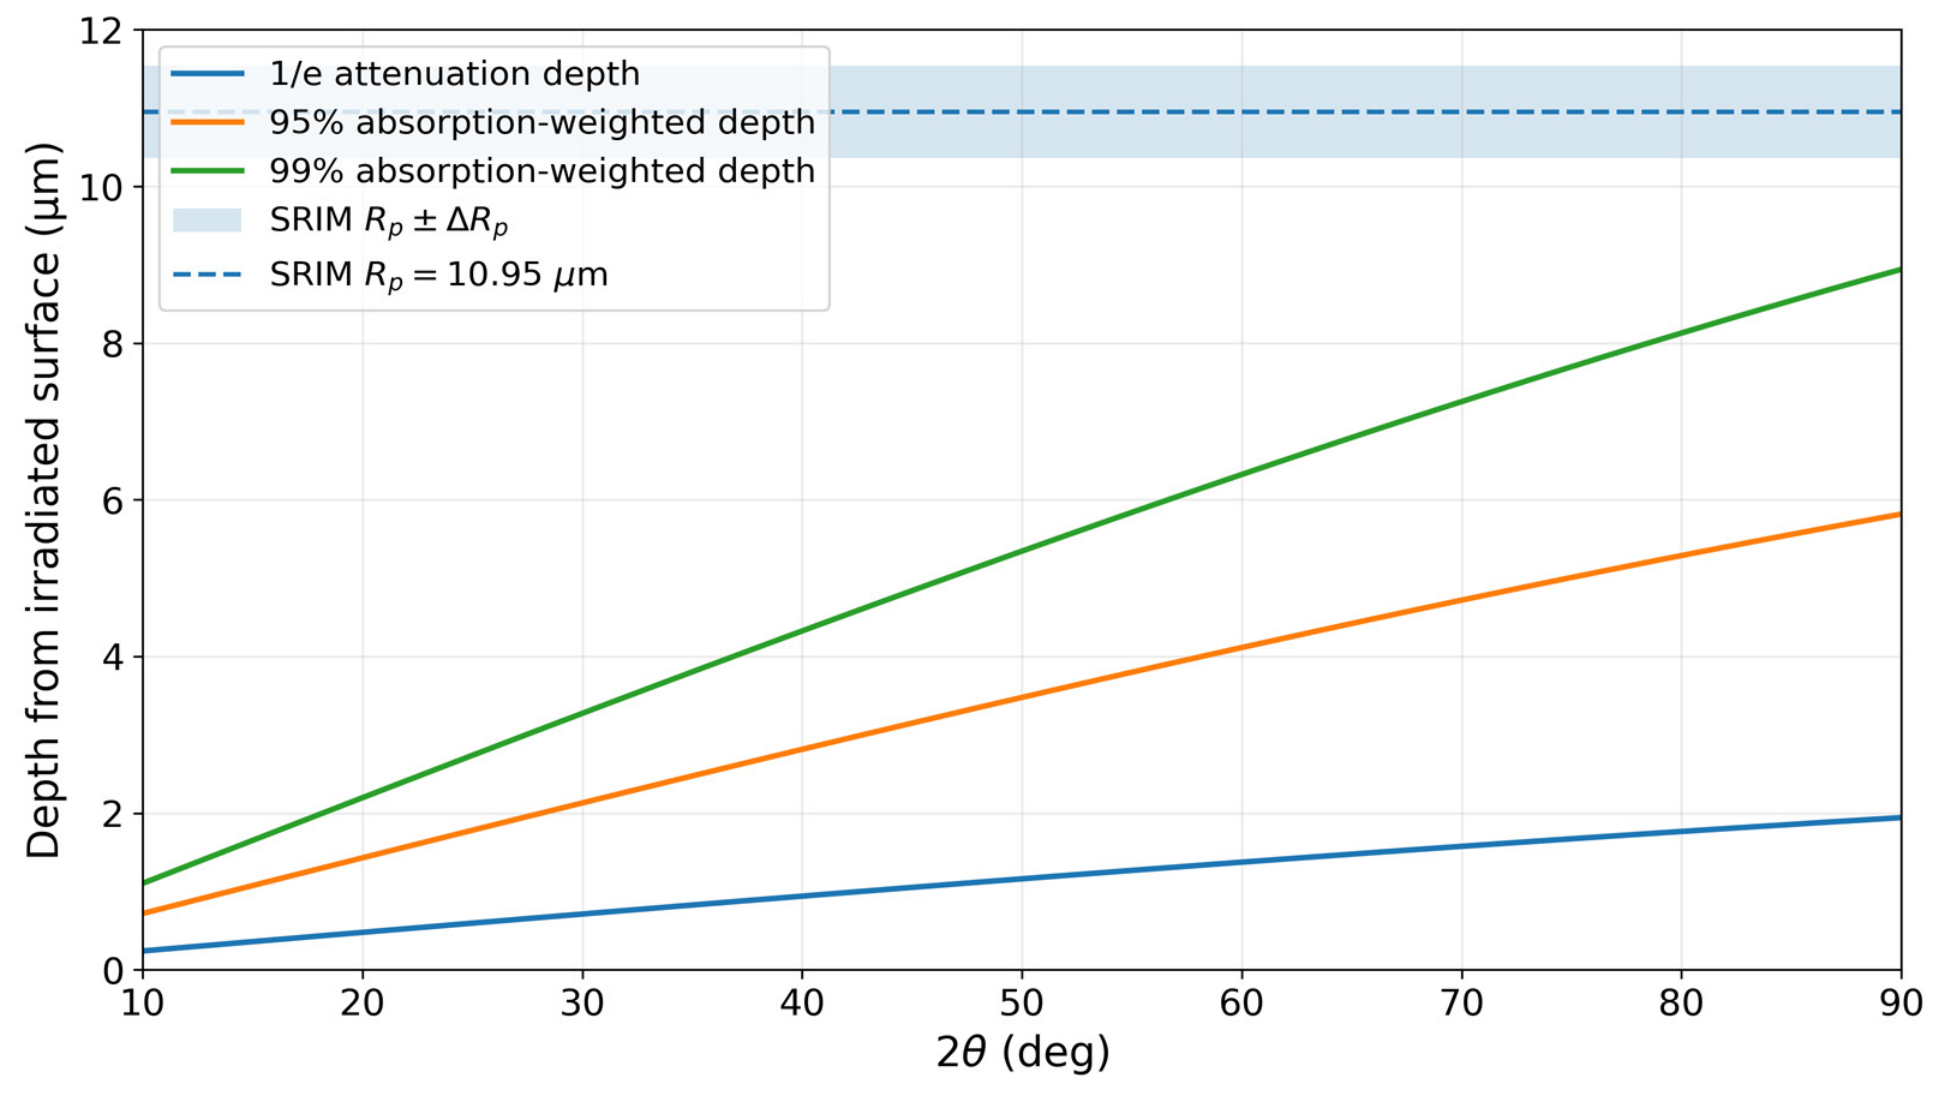
where ρ is the density of NdGaO3, w_i is the mass fraction of element i, and (μ/ρ)_i is its mass attenuation coefficient. The mass fractions were taken from the stoichiometric composition used in the SRIM target, and the elemental coefficients were interpolated at the Cu Kα photon energy (8.048 keV) from the NIST tables [47]. The complete calculation is shown in Table 4 and Figure 2.
Table 4.
Calculation of the NdGaO3 mass and linear attenuation coefficients at the Cu Kα photon energy.
Figure 2.
Calculated absorption-weighted Cu Kα XRD information depth in NdGaO3 using NIST attenuation coefficients [47], compared with the SRIM projected range and longitudinal straggling of 147 MeV Kr ions [37]. The attenuation curves do not include a depth-dependent crystalline fraction.
The weighted mass attenuation coefficient is therefore (μ/ρ)NdGaO3 = 240.57 cm2 g−1, and multiplication by ρ = 7.5700 g cm−3 gives μ = 1.821 × 103 cm−1.
The calculated depths in Table 5 describe absorption weighting for a depth-independent diffracting fraction. They establish that the measurement is strongly surface weighted and that its nominal information depth overlaps the SRIM-defined ion-modified region. They do not, by themselves, uniquely determine the depth origin of the residual Bragg intensity, because the crystalline fraction and strain may vary strongly with depth; a highly disordered surface layer can attenuate the beam while contributing little coherent Bragg scattering.
Table 5.
Calculated absorption-weighted information depth of the Cu Kα diffraction signal in NdGaO3.
2.9. Bounding Sensitivity Estimate of Geometrical Track Overlap
For sensitivity analysis, the single-impact Poisson model proposed by Gibbons [48] was employed:
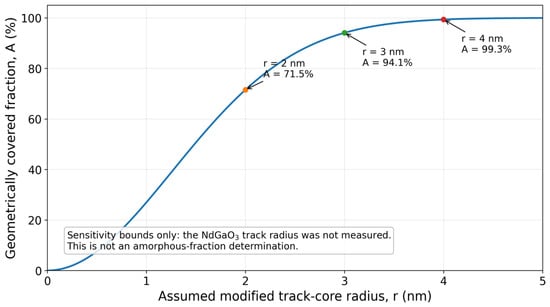
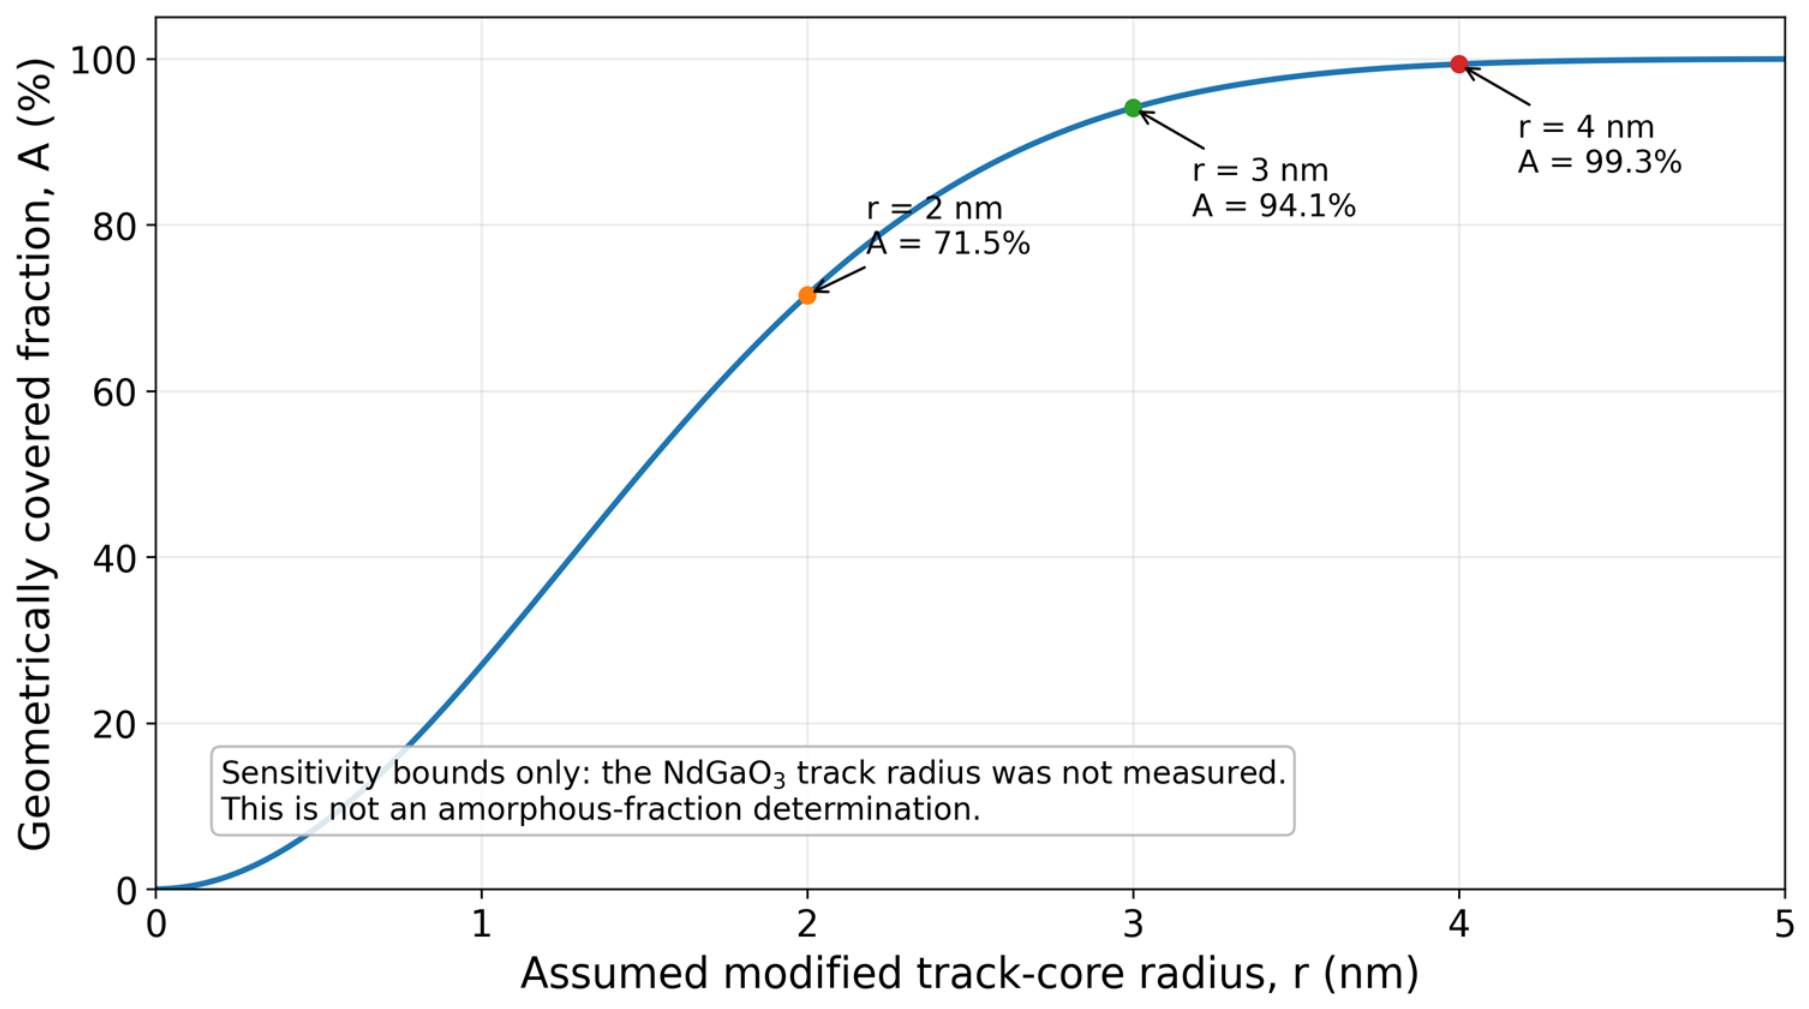
where A is the geometrically covered fraction, r is an assumed radius of a modified track core, and Φ is the fluence. Because the latent-track radius in NdGaO3 has not been measured directly, the calculations for r = 2–4 nm define only lower-to-upper geometrical overlap scenarios. They are not used to infer an experimental track radius, an amorphous volume fraction, or a depth-dependent damage profile.
3. Results
3.1. Phase Identification and Initial Structural State
PDXL identified only crystalline NdGaO3 in all four datasets; no additional sharp reflections attributable to secondary crystalline phases appeared after irradiation.
The “100% NdGaO3” value reported by PDXL represents normalization among the crystalline phases included in the fitting model and must not be interpreted as a measurement of the total crystalline fraction. In particular, this value does not exclude an amorphous or strongly disordered component, which contributes predominantly to diffuse scattering rather than to indexed Bragg reflections.
Owing to the metrically pseudocubic character of orthorhombic NdGaO3, the interplanar spacings d002 = c/2d and d110 = (a−2 + b−2)−1/2 are nearly identical. According to the reference data, the corresponding CuKα1 peak positions are 2θ = 23.070° for 002 and 23.025° for 110, while the higher-order 004 and 220 reflections occur at 47.147° and 47.051°, respectively [10,23]. Therefore, the low-angle reflections cannot be assigned solely from their 2θ positions. In the present work, however, the 002 and 110 peaks were not treated as overlapping components of the same diffraction profile because they were recorded from separate, supplier-specified (001)- and (110)-oriented single-crystal substrates. In symmetric θ–2θ geometry, the scattering vector is parallel to the surface normal; consequently, the specular reflection families are 00L for the (001) surface and hh0 for the (110) surface. The assignments were additionally verified by the corresponding higher-order reflection sequences and by the agreement of the calculated and d110 values with the reference data. Thus, the near coincidence of the peak positions reflects the pseudocubic metric of NdGaO3 rather than mixed orientation or incorrect indexing.
For the Pristine (001) surface, the manual calculation based on the 004 and 006 reflections yielded cout = 7.6995 Å, differing from the reference-card value by only −0.07%. For the Pristine (110) surface, d110 = 3.8556 Å was obtained, compared with d110,PDF ≈ 3.860 Å. This agreement confirms the reflection assignment, the crystallographic orientation of the measured flat surfaces, and the high degree of long-range order in the initial state.
3.2. XRD Patterns of the (001)- and (110)-Oriented Samples
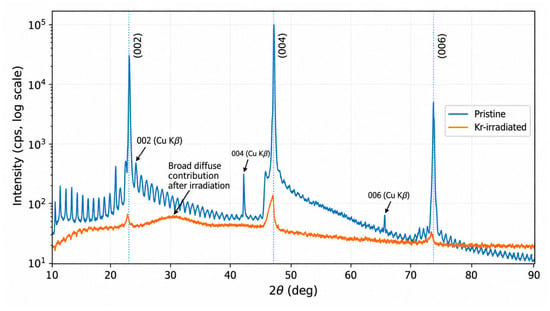
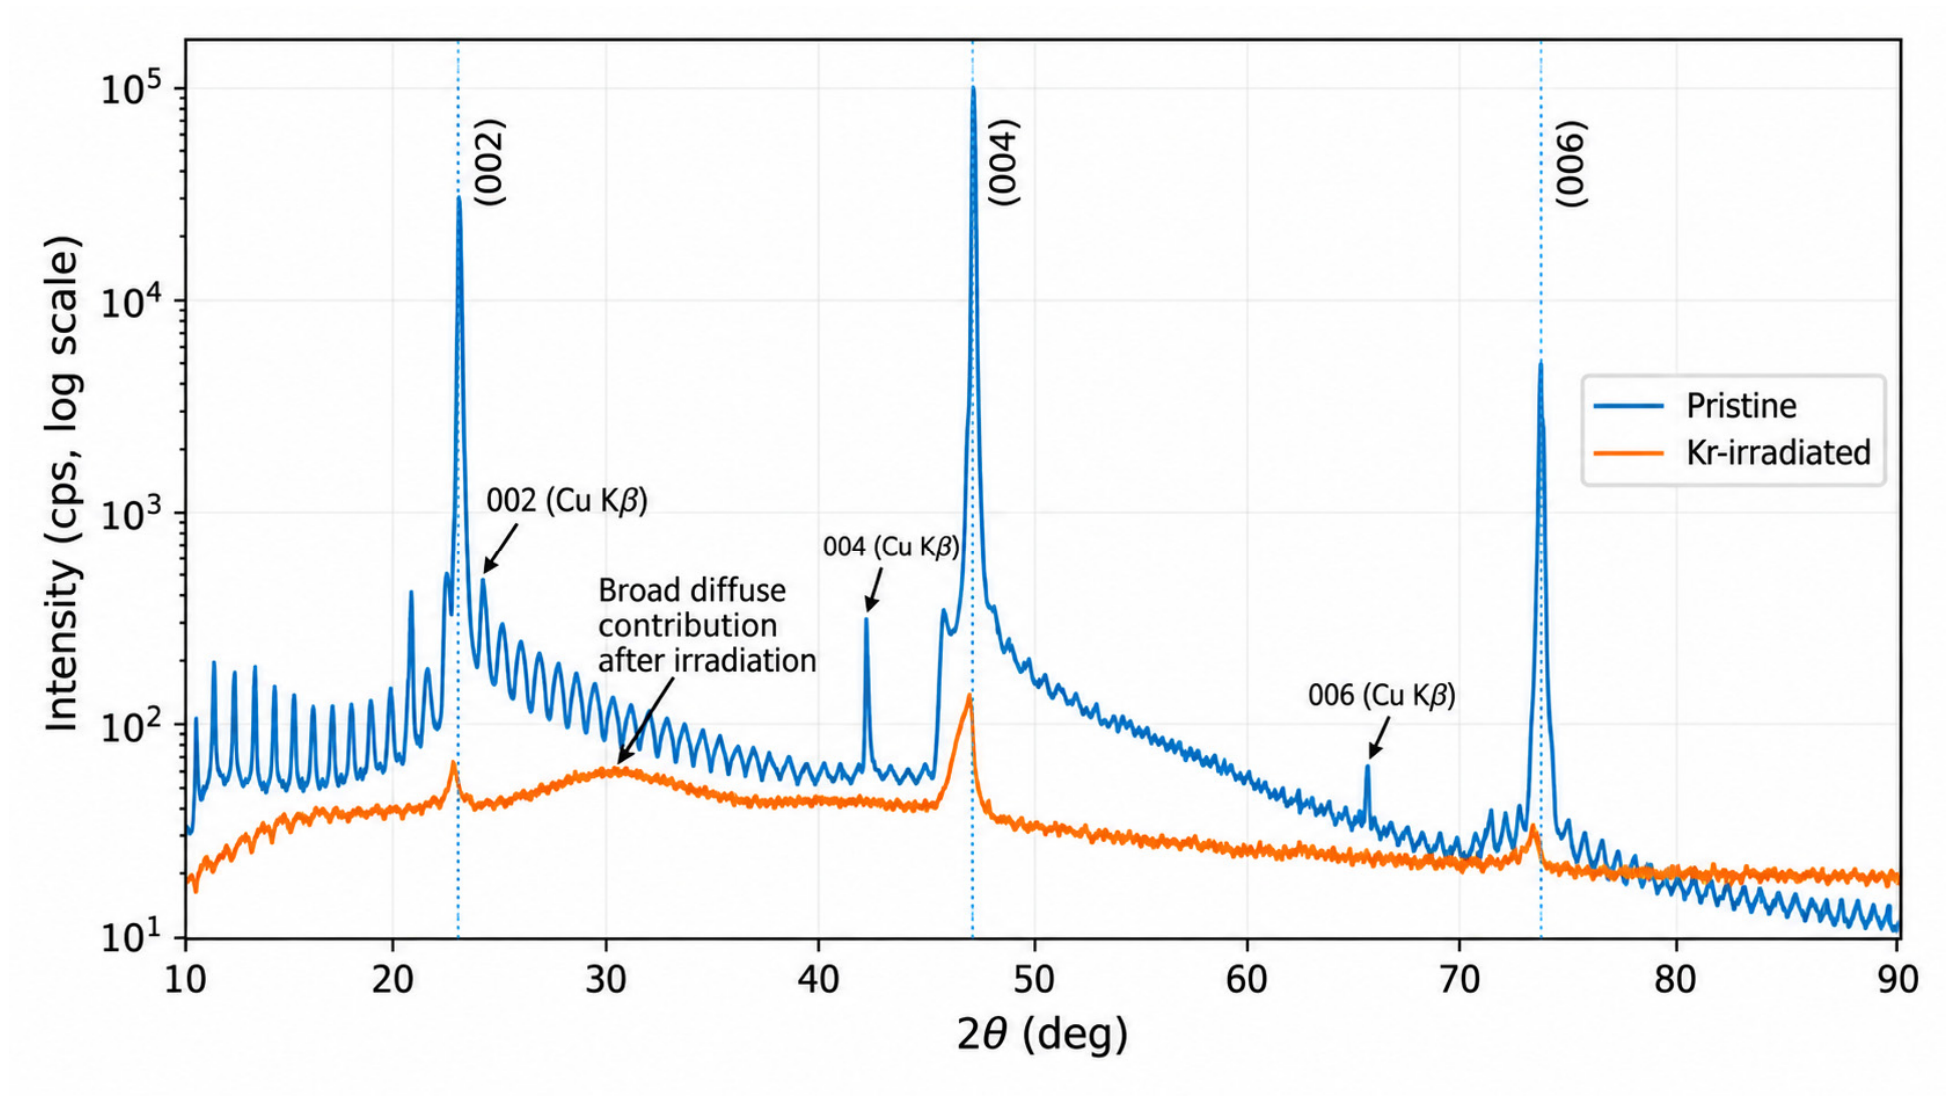
The Pristine (001) pattern is dominated by intense and narrow 002, 004, and 006 reflections. Following Kr-ion irradiation, the principal Bragg intensities decrease by several orders of magnitude, the residual reflections broaden, and an additional broad diffuse contribution becomes apparent near 2θ ≈ 30° (Figure 3). The persistence of weak 004 and 006 reflections demonstrate that some oriented coherent scattering remains after irradiation, although its exact depth distribution cannot be established from attenuation alone.
Figure 3.
Symmetric XRD patterns of (001)-oriented NdGaO3 measured from the Pristine and Kr-irradiated surfaces. The principal 002, 004, and 006 specular reflections are indicated. Weak secondary peaks near and are attributed to residual Cu Kβ contributions from the corresponding intense 002, 004, and 006 reflections and are not associated with secondary crystalline phases.
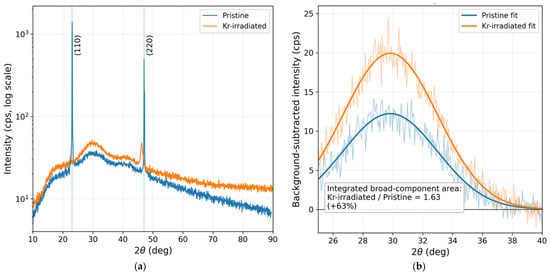
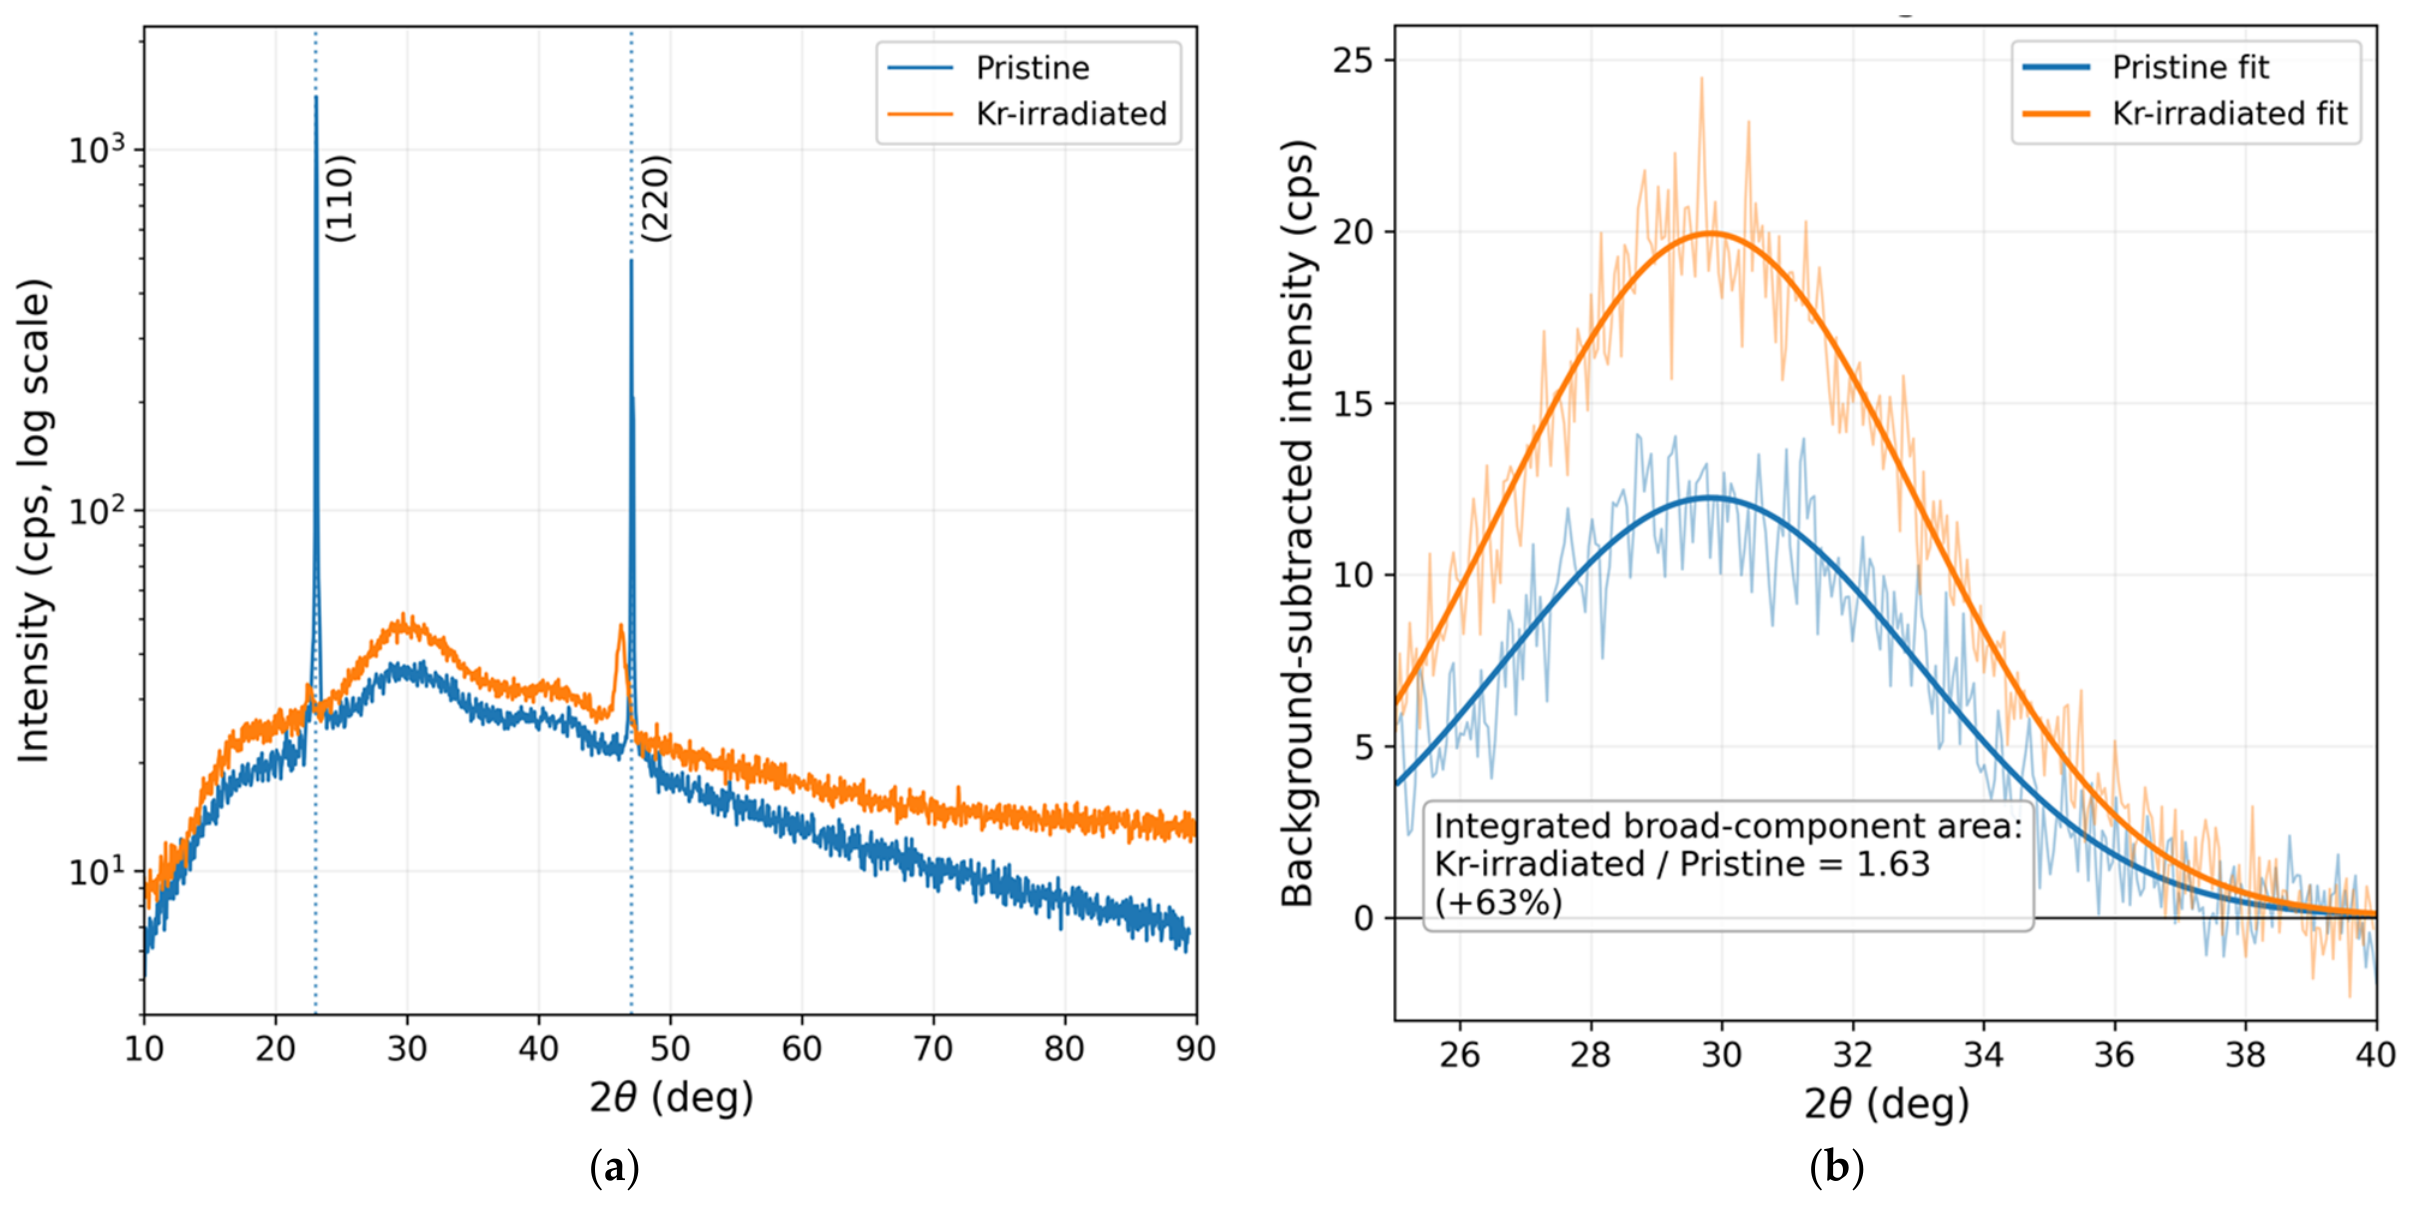
For the Pristine (110) surface, narrow 110 and 220 reflections dominate the diffraction pattern. A broad component centered near 30° is present before irradiation and is enhanced in the Kr-irradiated profile; therefore, it is not described as a wholly radiation-created halo. Under the identical linear-background-plus-Gaussian treatment, the integrated broad-component area increases by approximately 63%, while its fitted center and width remain nearly unchanged (Figure 4). The residual 110 and 220 reflections become markedly weaker and broader after irradiation.
Figure 4.
NdGaO3 (110) profiles. (a) Symmetric θ–2θ patterns for the Pristine and Kr-irradiated surfaces. (b) Identical linear-background-plus-Gaussian fits of the broad component over 25–40°. Blue curves correspond to the Pristine sample and orange curves to the Kr-irradiated sample. The lighter thin curves represent the background-subtracted experimental data, whereas the darker smooth curves represent the corresponding fitted Gaussian components. The fitted integrated area increases by approximately 63% after irradiation, demonstrating irradiation-enhanced diffuse scattering rather than the formation of a wholly new halo.
The Pristine (001) scan also contains fine, nearly periodic intensity modulations and extended tails around the very intense single-crystal reflections. Their approximately regular angular spacing (about 0.85–0.95°), lack of correspondence with the allowed NdGaO3 reference reflections, concentration in the highest-intensity Pristine profile, and the use of Continuous PSD fast acquisition indicate an instrument/profile origin consistent with detector-channel stitching or related PSD response rather than additional crystalline phases. These features were not indexed and were excluded from all local Bragg-peak and diffuse-component fits. Because no empty-holder or detector-calibration scan was acquired, this assignment is stated as an instrumental-consistency interpretation rather than a uniquely proven mechanism.
Several weak narrow features in the Pristine (001) diffraction pattern were additionally examined to clarify their origin. The sharp peaks observed at and are quantitatively consistent with residual contributions associated with the exceptionally intense specular 002, 004, and 006 reflections, respectively. Using the experimentally measured positions of the corresponding reflections and λKβ = 1.39225 Å, the calculated Cu Kβ positions are approximately and , in agreement with the observed secondary maxima within approximately . The presence of weak residual Cu Kβ intensity is consistent with the use of electronic pulse-height analysis (PHA) discrimination rather than a crystal monochromator and becomes particularly evident because of the exceptionally high intensity of the pristine single-crystal reflections. These peaks were therefore not assigned to additional NdGaO3 phases and were excluded from all quantitative strain and peak-broadening analyses. In addition to the isolated residual Cu Kβ peaks discussed above, the Pristine (001) scan exhibits a series of weak quasi-periodic intensity modulations and extended tails surrounding the exceptionally intense 002, 004, and 006 specular reflections. These features were carefully examined but were not assigned to crystallographic reflections. Their approximately regular angular spacing does not follow the non-equidistant reflection positions expected from the orthorhombic NdGaO3 reference pattern, and such a dense sequence of off-specular hkl reflections is incompatible with the symmetric geometry of a highly oriented (001) single crystal. Moreover, their amplitude closely follows the intensity envelope of the major specular peaks and becomes strongly suppressed in the much lower-intensity Kr-irradiated pattern. Taken together with the continuous one-dimensional PSD acquisition mode used in the present measurements, these observations indicate that the fine oscillatory modulation and extended tails are predominantly instrumental/profile-response features associated with the exceptionally high count rates of the Pristine single-crystal reflections. Consequently, these structures were not indexed and were excluded from all peak-position, FWHM, strain, and microstrain analyses.
3.3. Bragg-Peak Shifts and Separation of Strain and Remounting Contributions
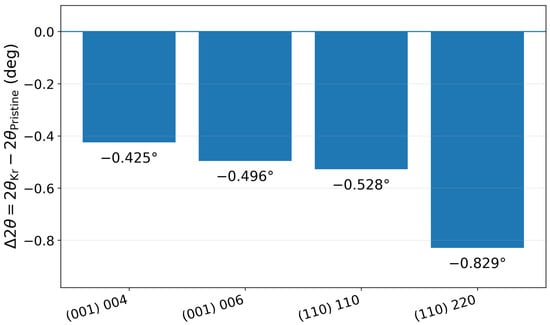
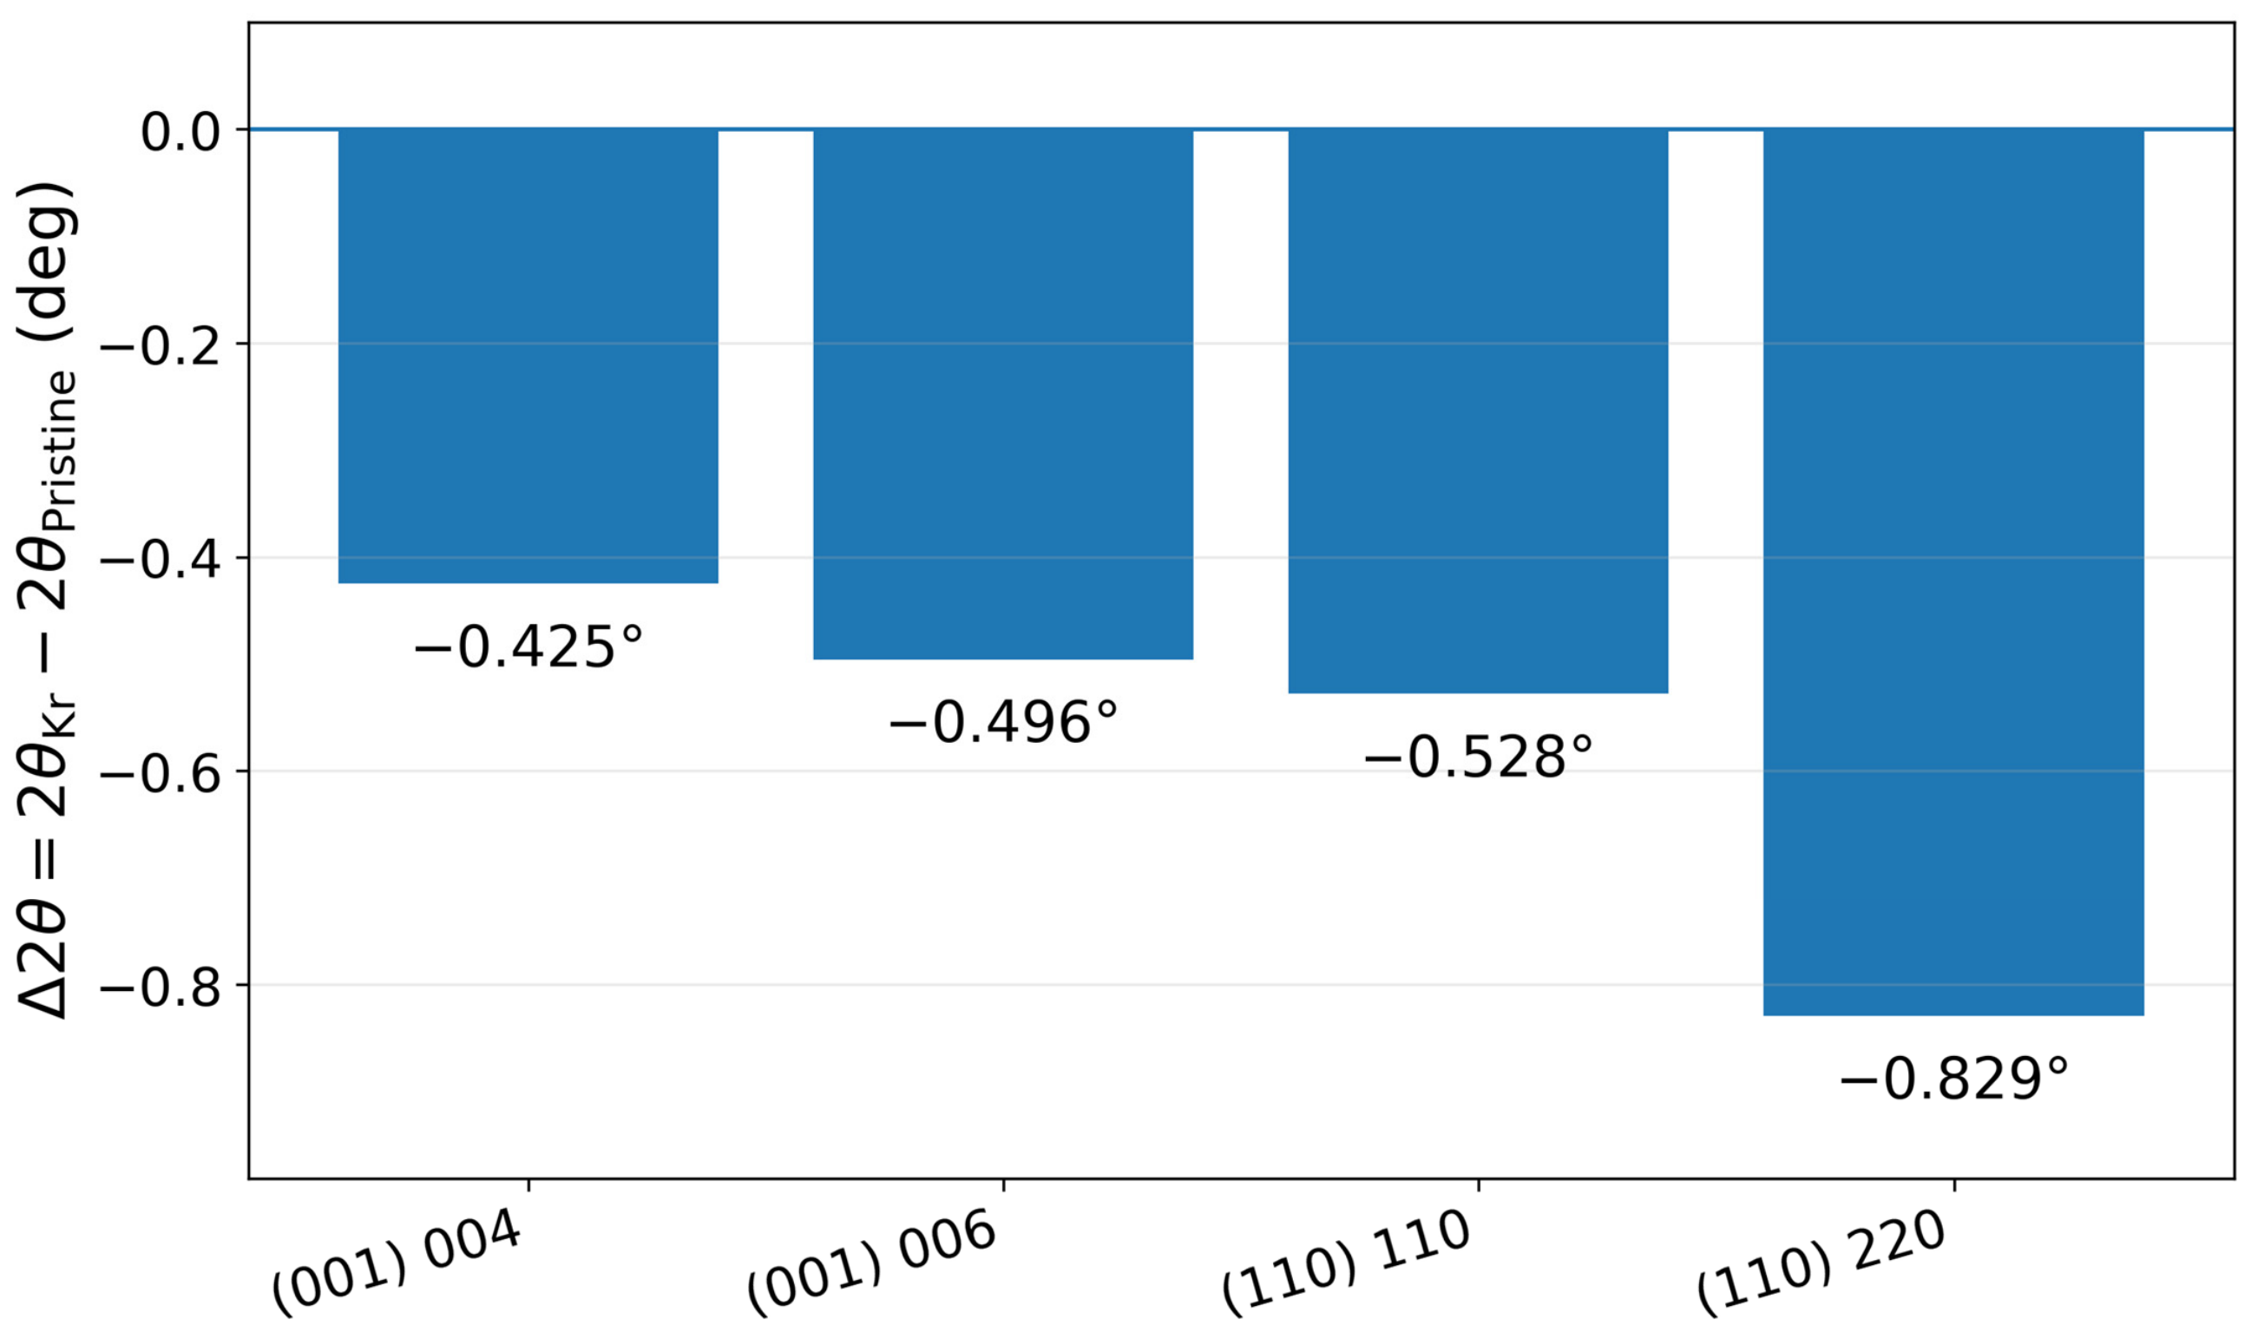
All selected residual reflections shift toward lower diffraction angles after irradiation, corresponding to an increase in the associated interplanar spacings. Because the Pristine and Kr-irradiated surfaces were measured after flipping and remounting the specimens, the raw angular displacement contains both a structural contribution and a geometric sample-displacement contribution. The two-parameter results are summarized in Table 6.
Table 6.
Bragg-peak positions before and after irradiation and results of the strain–displacement separation.
If the peak shifts were caused solely by an identical sample-height error, their angular dependence would follow the cosθ term in the displacement correction. The experimental reflection pairs do not follow this behavior; most notably, the higher-angle 220 reflection of the (110) specimen shifts more strongly rather than weaklier (Figure 5). After inclusion of both geometric and strain terms, a positive lattice strain remains for both orientations. The corrected strain for (110), approximately 1.20%, is about four times larger than that for (001), approximately 0.30%.
Figure 5.
Observed Bragg-peak shifts after irradiation with 147 MeV Kr ions. Negative values denote displacement toward lower diffraction angles.
3.4. Scope of PDXL Results and Direction-Specific Manual Parameters
PDXL consistently identified the orthorhombic NdGaO3 phase and provided a useful diagnostic representation of background and profile evolution. However, the unrestricted full-cell and Williamson–Hall outputs fail internal physical-plausibility checks for the highly oriented specimens. Most clearly, the Pristine (110) pattern, which contains narrow intense Bragg reflections, was assigned D = 14.21 Å and εWH = 7.1%; these values cannot describe the coherent-domain size or microstrain of a high-quality single crystal.
Compensating changes in the refined a and b parameters can preserve a plausible d110 or cell volume while individual constants deviate strongly from accepted NdGaO3 values. This is evidence of parameter covariance and mathematical underdetermination, not an integral quantitative measurement of a physically strained three-dimensional unit cell. Accordingly, the complete unconstrained PDXL outputs are reported only in Supplementary Table S1 and are excluded from the quantitative conclusions.
Table 7 therefore compares the direction-specific manual metrics with reference values and explicitly states the restricted role of PDXL. The quantitative structural conclusions rely on cout for (001), d110 for (110), and the two-reflection strain/displacement separation. The numerical agreement between the corrected cout and the fitted PDXL c for the irradiated (001) surface is noted only as qualitative consistency and is not treated as an independent validation of the full-cell refinement.
Table 7.
Direction-specific manual lattice metrics, reference comparison, and the restricted analytical role of PDXL.
In this sense, manual and automated analyses remain complementary only at different analytical levels: the manual method provides the physically constrained direction-specific observables, whereas PDXL provides phase identification and diagnostic whole-profile visualization.
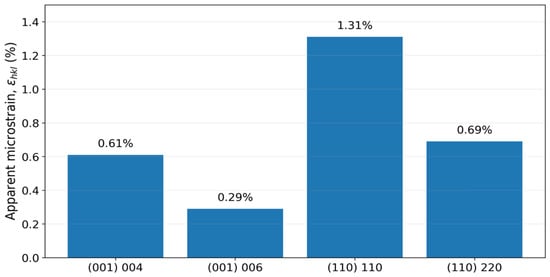
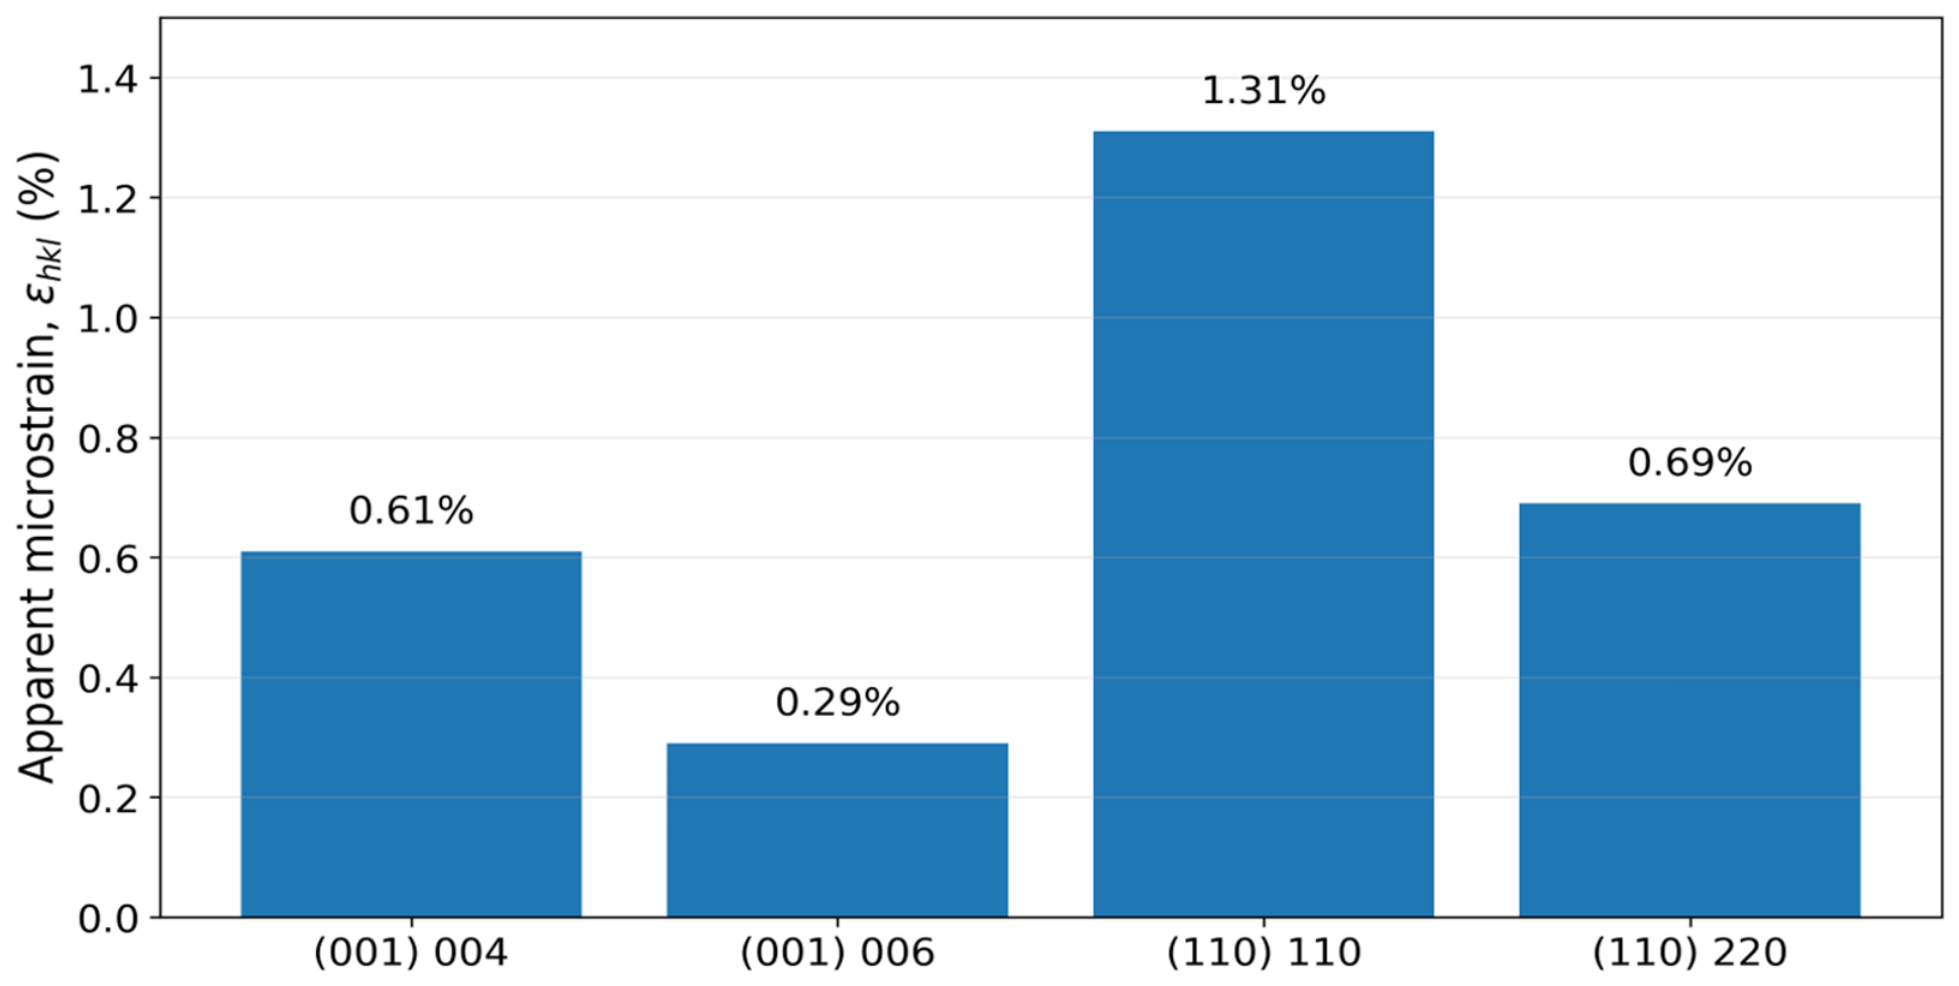
3.5. Broadening of the Residual Bragg Reflections and Apparent Microstrain
After quadratic subtraction of the corresponding Pristine peak width, the apparent microstrain was 0.61% from 004 and 0.29% from 006 for the (001) orientation, with associated coherent-scattering length scales of approximately 143 and 199 Å. For the (110) orientation, the values were 1.31% from 110 and 0.69% from 220, with corresponding length scales of approximately 120 and 145 Å (Table 8 and Figure 6). These are reflection-specific apparent quantities: finite coherent length, mosaicity, strain gradients, and residual instrumental effects are not fully separated.
Table 8.
Reflection-specific apparent microstrain and coherent-scattering length scale of the residual Bragg component.
Figure 6.
Reflection-specific apparent microstrain estimated from the residual Bragg reflections after quadratic subtraction of the corresponding Pristine peak widths. No PDXL Williamson–Hall values are included because those outputs are underdetermined for the present oriented single crystals.
3.6. Baseline-Controlled Diffuse Scattering and Short-Range Order
For the Kr-irradiated (001) profile, the broad component is centered at approximately 30.22° with an FWHM of 5.74°, corresponding to a descriptive correlation length ξ ≈ 15.9 Å. A stable equivalent broad-component fit was not extracted from the Pristine (001) profile because the result is strongly coupled to the long tails and periodic PSD-related modulation. For the (110) orientation, identical linear-background-plus-Gaussian fits give centers of 29.82° and 29.83° and FWHM values of 7.46° and 7.45° for the Pristine and Kr-irradiated profiles, respectively. The corresponding integrated Gaussian area increases by a factor of 1.63 after irradiation, while ξ remains approximately 12.3 Å (Table 9). Thus, the principal irradiation effect is an increase in the amplitude of a pre-existing broad component rather than the appearance of a uniquely new halo.
Table 9.
Baseline-controlled parameters of the broad diffuse-scattering component.
Formal application of the Scherrer equation to this broad component would yield an ångström-scale length similar to the nonphysical PDXL “crystallite-size” outputs. Such a value is not a crystallite size of the single crystal. It is retained only as a reciprocal-space correlation scale, and neither its magnitude nor the broad-component area is converted into an amorphous fraction.
3.7. Absorption-Weighted XRD Depth Relative to the Ion-Modified Region
Across the measured angular range, the calculated 95% absorption-weighted depth does not exceed 5.82 μm and the 99% depth does not exceed 8.95 μm, both below the projected Kr range Rp = 10.95 μm (Table 10 and Figure 7). This demonstrates that the experiment is strongly weighted toward depths lying within the nominal SRIM range. However, attenuation alone cannot establish the unique origin of the residual Bragg peaks: if the near-surface crystalline fraction is severely reduced, coherent Bragg scattering can be disproportionately weighted toward deeper, less damaged portions of the still ion-modified region. The calculation therefore establishes depth overlap and surface weighting, not an exclusive depth assignment.
Table 10.
Bounding single-impact Poisson sensitivity estimate of geometrical track overlap at Φ = 1 × 10¹³ ions cm−2 [48].
Figure 7.
Bounding sensitivity estimate of geometrical track overlap at Φ = 1 × 10¹³ ions cm−2 using the single-impact model [48]. The track-core radius was not measured in NdGaO3, and the calculation is not an amorphous-fraction determination.
3.8. Bounding Sensitivity Estimate of Track Overlap
For assumed radii of 2, 3, and 4 nm, the model gives geometrically covered fractions of 71.5%, 94.1%, and 99.3%, respectively. These numbers only bound the overlap expected for hypothetical radii. They are not compared directly with a measured amorphous fraction and do not establish that NdGaO3 contains tracks of any particular radius. Direct TEM, SAXS, or another track-sensitive measurement would be required to select among these scenarios.
4. Discussion
4.1. Adequacy of the Measurement Geometry and Physical Meaning of h/R
Symmetric XRD measurements from flat surfaces are well suited for determining whether an oriented crystalline component remains and for evaluating changes in interplanar spacing along the surface normal. The agreement of the Pristine reflections with the reference card, together with the consecutive 00L and hh0 reflection series, confirms the intended orientations. At the same time, this geometry does not provide enough independent reflections for rigorous three-dimensional refinement of the orthorhombic unit cell.
The fitted values h/R = 2.64 × 10⁻³ for (001) and 2.22 × 10⁻³ for (110) are effective geometric parameters rather than physical thicknesses of a swollen layer. Under the illustrative assumption R = 200 mm, they correspond to h ≈ 0.53 and 0.44 mm, respectively. These displacements are larger than a typical fine alignment error, but they can collectively include differences in specimen seating after flipping, mounting-layer thickness, slight non-parallelism of the opposite faces, and a change in the mean reflecting plane. Because the absolute height was not measured independently for either mounting, h must not be interpreted as radiation-induced swelling. Its role is to remove a common geometric contribution and test whether the orientation-dependent structural trend remains.
After this correction, the strain remains positive, with εcorr,(110) ≈ 1.20% being approximately four times εcorr,(001) ≈ 0.30%. The observed anisotropy therefore cannot be reduced to a single sample-height error.
4.2. Distinct Roles and Limitations of Manual Analysis and PDXL
The revised analysis assigns asymmetric roles to the two methods. The manual reflection-specific approach is used quantitatively because the symmetric geometry directly constrains cout for (001) and d110 for (110). Its limitations remain substantial: only a few reflections are available, local profile fitting is sensitive to weak-signal statistics and background choice, and the method cannot reconstruct the full strain tensor or complete orthorhombic cell.
PDXL remains valuable for phase identification, Cu Kα1/Kα2-aware profile representation, and visualization of the global loss of sharp Bragg intensity. It is not, however, a quantitatively valid source of unrestricted a, b, c, V, coherent-domain size, or Williamson–Hall microstrain for the present highly oriented wafers. The extreme Pristine (110) outputs demonstrate that the fitted parameters compensate for one another and for non-Bragg profile contributions.
Consequently, the phrase “effective structural parameters” has been removed as a justification for quantitative use. The complete PDXL numerical outputs are preserved in the Supplementary Materials solely for transparency and reproducibility. The main conclusions are based on indexed peak positions, the explicit sample-displacement correction, and reflection-specific broadening.
The apparent agreement between the corrected manual cout = 7.722 Å and the fitted PDXL c ≈ 7.72 Å for the irradiated (001) surface is treated only as qualitative consistency. It cannot validate the remaining full-cell or Williamson–Hall outputs because the covariance matrix and independent asymmetric reflections required for such validation are unavailable.
4.3. Damage Mechanism Under Dominant Electronic Stopping
The entrance stopping-power ratio Se/Sn ≈ 385 demonstrates that initial energy deposition at the irradiated surface is dominated by electronic rather than nuclear stopping. The combined observations—loss of Bragg intensity, strong broadening of residual reflections, enhanced diffuse scattering, and positive direction-specific strain—are consistent with severe electronic-energy-loss-driven disorder and stressed crystalline regions, as commonly observed for swift heavy ions in complex oxides [28,33,36,49,50,51,52,53].
They do not, on their own, constitute direct microscopy of latent tracks or a quantitative measurement of an amorphous fraction.
The absence of additional crystalline phases does not imply the absence of chemical point defects. Oxygen vacancies, interstitial species, local coordination changes, and rotations of the GaO6 octahedra can preserve the average NdGaO3 phase assignment without producing separate sharp reflections. Direct identification of such defects would require complementary Raman spectroscopy, XPS/XANES, EPR, or TEM measurements.
4.4. Strain Anisotropy and Relation to the Known Lattice Anisotropy
Published data demonstrate strongly anisotropic lattice compliance in NdGaO3. High-temperature XRD and synchrotron studies show that expansion along the orthorhombic b direction is substantially weaker than along a and c [9,14]. This intrinsic anisotropy establishes that the lattice does not relax isotropically, but thermal-expansion coefficients cannot be mapped directly onto swift-ion-induced strains because the latter arise from highly localized electronic excitation and defect generation rather than homogeneous heating.
Although the incident electronic stopping is determined primarily by the ion–target combination, the subsequent atomic relaxation occurs within a direction-dependent Pbnm network of tilted GaO6 octahedra and inequivalent oxygen sites. Irradiation-induced point defects and locally disordered regions can therefore generate anisotropic displacement and stress fields. The (001) scan mainly probes the c-axis projection, whereas d110 couples the responses of the orthorhombic a and b directions. Direction-dependent changes in Ga–O–Ga angles, cooperative octahedral rotations, interstitial/vacancy relaxations, and the projection of oxygen-sublattice displacements onto [001] and [110] provide a physically plausible basis for ε110 ≈ 4ε001. The difference is interpreted as anisotropic lattice relaxation, not as evidence that four times more electronic energy was deposited in the (110) specimen.
This microscopic interpretation remains a structural hypothesis. Reciprocal-space maps, rocking curves, and asymmetric reflections would be required to determine the complete strain tensor, while polarized Raman spectroscopy and cross-sectional TEM or small-angle scattering would be required to test octahedral-displacement and track-morphology scenarios directly.
4.5. Depth Weighting and the Origin of Residual Bragg Scattering
Comparison of the SRIM range with the absorption-weighted X-ray information depth shows substantial overlap between the region sampled by Cu Kα diffraction and the nominal ion-modified layer. Nevertheless, the standard attenuation expression assumes that the diffracting fraction is independent of depth. In reality, the local crystalline fraction, mosaicity, and strain are expected to vary through the damaged region. A highly disordered near-surface zone may contribute strongly to attenuation but weakly to coherent Bragg scattering, thereby shifting the surviving Bragg contribution toward deeper and less damaged portions of the ion-affected layer.
Accordingly, the residual reflections are not assigned exclusively to either a homogeneous damaged surface layer or an unaffected bulk substrate. The defensible conclusion is that the experiment is strongly surface weighted, that its nominal absorption depth lies within the SRIM range, and that the residual Bragg peaks likely integrate a depth-dependent surviving crystalline fraction. The several-orders-of-magnitude intensity loss still demonstrates a major reduction in long-range coherent order, but the depth profile of that reduction cannot be reconstructed from the present θ–2θ data alone.
4.6. Experimental and Modelling Limitations
The principal experimental limitations are the absence of an empty-holder/background scan and detector calibration scan, the lack of independently recorded numerical divergence- and anti-scatter-slit openings in the exported metadata, and the availability of only one scan per measured face. Although the same stored method, detector mode, tube settings, and sample spinning were used for all four profiles, these limitations prevent a unique attribution of every broad or periodic profile feature. The periodic modulation in the Pristine (001) scan is therefore excluded from indexing rather than assigned a structural origin.
The structural analysis is further limited by the absence of asymmetric reflections, reciprocal-space maps, an independent instrumental broadening standard, and direct measurement of the specimen height after remounting. The available SRIM file is a stopping/range summary rather than a full depth-resolved cascade calculation, and the Gibbons analysis uses hypothetical track radii. These restrictions are now incorporated explicitly into the interpretation and prevent claims of a complete strain tensor, quantitative amorphous fraction, measured track radius, or uniquely resolved depth origin of the residual Bragg intensity.
5. Conclusions
Irradiation of (001)- and (110)-oriented NdGaO3 single crystals with 147 MeV 84Kr15+ ions to 1 × 10¹³ ions cm−2 causes a pronounced, orientation-dependent degradation of coherent diffraction. PDXL identifies only the orthorhombic NdGaO3 phase, with no additional crystalline products; however, unconstrained reconstruction of the complete orthorhombic cell and Williamson–Hall parameters from the highly oriented θ–2θ profiles is mathematically underdetermined. The resulting full-cell volumes, domain sizes, and PDXL microstrains are therefore not interpreted as quantitative single-crystal observables.
After explicit separation of the strain and remounting contributions, the normal strain is approximately 0.30% for (001) and 1.20% for (110). Reflection-specific apparent microstrains are 0.29–0.61% and 0.69–1.31%, respectively, confirming a stronger structural response along the (110) normal. This anisotropy is attributed to direction-dependent relaxation of defect and stress fields within the tilted GaO6 framework rather than to a corresponding difference in the incident electronic stopping. The broad component near 30° is not wholly created by irradiation in the (110) specimen: identical baseline-controlled fits show that it is already present in the Pristine profile and its integrated area increases by approximately 63% after irradiation.
SRIM-2013.00 gives an entrance electronic stopping of 19.84 keV nm−1 and a projected range of 10.95 μm. The Cu Kα attenuation calculation shows that the experiment is strongly weighted to depths overlapping this ion-modified region. Nevertheless, depth-dependent loss of crystallinity can bias residual Bragg scattering toward deeper, less damaged material, so attenuation alone does not provide a unique depth assignment. The Gibbons calculation is retained strictly as a bounding sensitivity test because the NdGaO3 track radius is unmeasured. Overall, the data establish substantial irradiation-induced loss of long-range order and robust crystallographic anisotropy while defining the quantitative limits of both manual and automated diffraction analysis.
Supplementary Materials
The following supporting information can be downloaded at https://www.mdpi.com/article/10.3390/ma19184022/s1.
Author Contributions
Conceptualization, Z.T.K. and A.I.P.; methodology, Z.T.K.; software, A.K. and M.K.; validation, Z.T.K., M.S.T., M.K., S.K., V.B. and A.I.P.; formal analysis, A.B. and M.K.; investigation, Z.T.K. M.K., S.K., V.B. and A.I.P.; data curation, A.B. and A.M.Z.; writing—original draft preparation, Z.T.K. and M.S.T.; writing—review and editing, Z.T.K.; visualization, A.M.Z. and A.K. All authors have read and agreed to the published version of the manuscript.
Funding
This research was funded by the Science Committee of the Ministry of Science and Higher Education of the Republic of Kazakhstan (grant number AP23488995). In addition, M.K and A.I.P. were supported by EUROfusion Enabling Research Project ENR-MAT.02.ISSP-UL-“New dielectric functional materials and interfaces (DFMI)—Theoretical and Experimental analysis.” This work has been carried out within the framework of the EUROfusion Consortium, funded by the European Union via the Euratom Research and Training Programme (Grant Agreement No 101052200—EUROfusion). Views and opinions expressed are however those of the authors only and do not necessarily reflect those of the European Union or the European Commission. Neither the European Union nor the European Commission can be held responsible for them.
Data Availability Statement
The original contributions presented in this study are included in the article. Further inquiries can be directed to the corresponding authors.
Conflicts of Interest
The authors declare no conflicts of interest.
Abbreviations
The following abbreviations are used in this manuscript:
| Abbreviation | Definition |
| XRD | X-ray diffraction |
| PDXL | Rigaku powder diffraction analysis software package |
| WPPF | Whole-powder-pattern fitting |
| SRIM | Stopping and Range of Ions in Matter |
| FWHM | Full width at half maximum |
| WH | Williamson–Hall |
| TEM | Transmission electron microscopy |
| SAXS | Small-angle X-ray scattering |
| NIST | National Institute of Standards and Technology |
References
- Vasylechko, L.; Akselrud, L.; Morgenroth, W.; Bismayer, U.; Matkovskii, A.; Savytskii, D. The Crystal Structure of NdGaO3 at 100 K and 293 K Based on Synchrotron Data. J. Alloys Compd. 2000, 297, 46–52. [Google Scholar] [CrossRef] [Scilit]
- Geller, S. Crystallographic studies of perovskite-like compounds. IV. Rare earth scandates, vanadites, galliates, orthochromites. Acta Crystallogr. 1957, 10, 243–248. [Google Scholar] [CrossRef] [Scilit]
- Senyshyn, A.; Trots, D.M.; Engel, J.M.; Vasylechko, L.; Ehrenberg, H.; Hansen, T.; Berkowski, M.; Fuess, H. Anomalous Thermal Expansion in Rare-Earth Gallium Perovskites: A Comprehensive Powder Diffraction Study. J. Phys. Condens. Matter 2009, 21, 145405. [Google Scholar] [CrossRef] [Scilit]
- Ubizskii, S.B.; Vasylechko, L.O.; Savytskii, D.I.; Matkovskii, A.O.; Syvorotka, I.M. The crystal structure and twinning of neodymium gallium perovskite single crystals. Supercond. Sci. Technol. 1994, 7, 766–772. [Google Scholar] [CrossRef] [Scilit]
- Marti, W.; Fischer, P.; Altorfer, F.; Scheel, H.J.; Tadin, M. Crystal structures and phase transitions of orthorhombic and rhombohedral RGaO3 (R = La, Pr, Nd) investigated by neutron powder diffraction. J. Phys. Condens. Matter 1994, 6, 127–135. [Google Scholar] [CrossRef] [Scilit]
- Schmidbauer, M.; Kwasniewski, A.; Schwarzkopf, J. High-Precision Absolute Lattice Parameter Determination of SrTiO3, DyScO3 and NdGaO3 Single Crystals. Acta Crystallogr. B 2012, 68, 8–14. [Google Scholar] [CrossRef] [Scilit]
- Podlesnyak, A.; Rosenkranz, S.; Fauth, F.; Marti, W.; Furrer, A.; Mirmelstein, A.; Scheel, H.J. Crystal-Field and Magnetic Properties of the Distorted Perovskite NdGaO3. J. Phys. Condens. Matter 1993, 5, 8973–8982. [Google Scholar] [CrossRef] [Scilit]
- Kamishima, O.; Koyama, H.; Takahashi, R.; Abe, Y.; Sato, T.; Hattori, T. Raman Study on Symmetry Analysis in NdGaO3. J. Phys. Condens. Matter 2002, 14, 3905–3919. [Google Scholar] [CrossRef] [Scilit]
- Senyshyn, A.; Vasylechko, L.; Knapp, M.; Bismayer, U.; Berkowski, M.; Matkovskii, A. Thermal Expansion of the Perovskite-Type NdGaO3. J. Alloys Compd. 2004, 382, 84–91. [Google Scholar] [CrossRef] [Scilit]
- Krivchikov, A.I.; Gorodilov, B.Y.; Kolobov, I.G.; Érenburg, A.I.; Savitskiĭ, D.I.; Ubizskiĭ, S.B.; Syvorotka, I.M.; Vasilechko, L.O. Structure, Sound Velocity, and Thermal Conductivity of the Perovskite NdGaO3. Low Temp. Phys. 2000, 26, 370–374. [Google Scholar] [CrossRef] [Scilit]
- Traouli, Y.; Kilic, U.; Korlacki, R.; Hilfiker, M.; Mock, A.; Schubert, E.; Schubert, M. Electronic Band Structure, Band-to-Band Transitions, and Anisotropic Dielectric Functions of Orthorhombic NdGaO3. J. Appl. Phys. 2026, 139, 135703. [Google Scholar] [CrossRef] [Scilit]
- Reshak, A.H.; Piasecki, M.; Auluck, S.; Kityk, I.V.; Khenata, R.; Andriyevsky, B.; Cobet, C.; Esser, N.; Majchrowski, A.; Świrkowicz, M.; et al. Effect of U on the Electronic Properties of Neodymium Gallate (NdGaO3): Theoretical and Experimental Studies. J. Phys. Chem. B 2009, 113, 15237–15242. [Google Scholar] [CrossRef] [Scilit]
- Zhang, Z.M.; Choi, B.I.; Flik, M.I.; Anderson, A.C. Infrared Refractive Indices of LaAlO3, LaGaO3, and NdGaO3. J. Opt. Soc. Am. B 1994, 11, 2252–2257. [Google Scholar]
- Chaix-Pluchery, O.; Chenevier, B.; Robles, J.J. Anisotropy of Thermal Expansion in YAlO3 and NdGaO3. Appl. Phys. Lett. 2005, 86, 251911. [Google Scholar] [CrossRef] [Scilit]
- Koren, G.; Gupta, A.; Giess, E.A.; Segmüller, A.; Laibowitz, R.B. Epitaxial Films of YBa2Cu3O7−δ on NdGaO3, LaGaO3, and SrTiO3 Substrates Deposited by Laser Ablation. Appl. Phys. Lett. 1989, 54, 1054–1056. [Google Scholar] [CrossRef] [Scilit]
- Sasaura, M.; Miyazawa, S.; Mukaida, M. Thermal Expansion Coefficients of High-Tc Superconductor Substrate NdGaO3 Single Crystal. J. Appl. Phys. 1990, 68, 3643–3644. [Google Scholar] [CrossRef] [Scilit]
- Leca, V. Termination Control of (001) and (110) NdGaO3 Single-Crystal Substrates by Selective Chemical Etching. Crystals 2022, 12, 1791. [Google Scholar] [CrossRef] [Scilit]
- Ohnishi, T.; Takahashi, K.; Nakamura, M.; Kawasaki, M.; Yoshimoto, M.; Koinuma, H. A-Site Layer Terminated Perovskite Substrate: NdGaO3. Appl. Phys. Lett. 1999, 74, 2531–2533. [Google Scholar] [CrossRef] [Scilit]
- Cavallaro, A.; Harrington, G.F.; Skinner, S.J.; Kilner, J.A. Controlling the Surface Termination of NdGaO3 (110): The Role of the Gas Atmosphere. Nanoscale 2014, 6, 7263–7273. [Google Scholar] [CrossRef] [Scilit]
- Gunkel, F.; Skaja, K.; Shkabko, A.; Dittmann, R.; Hoffmann-Eifert, S.; Waser, R. Stoichiometry Dependence and Thermal Stability of Conducting NdGaO3/SrTiO3 Heterointerfaces. Appl. Phys. Lett. 2013, 102, 071601. [Google Scholar] [CrossRef] [Scilit]
- Kalabukhov, A.; Boikov, Y.A.; Serenkov, I.T.; Sakharov, V.I.; Claeson, T.; Winkler, D. Cation Stoichiometry and Electrical Transport Properties of the NdGaO3/(001)SrTiO3 Interface. J. Phys. Condens. Matter 2015, 27, 255004. [Google Scholar] [CrossRef] [Scilit]
- Dong, Y.; Xu, H.; Luo, Z.; Zhou, H.; Fong, D.D.; Wu, W.; Gao, C. Effect of Gate Voltage Polarity on the Ionic Liquid Gating Behavior of NdNiO3/NdGaO3 Heterostructures. APL Mater. 2017, 5, 051101. [Google Scholar] [CrossRef] [Scilit]
- International Centre for Diffraction Data. PDF Card 00-069-0263: Neodymium Gallium Oxide, NdGaO3; ICDD: Newtown Square, PA, USA, 2019. [Google Scholar]
- Berkstresser, G.W.; Valentino, A.J.; Brandle, C.D. Growth of single crystals of rare earth gallates. J. Cryst. Growth 1991, 109, 457–466. [Google Scholar] [CrossRef] [Scilit]
- Savytskii, D.I.; Ubizskii, S.B.; Matkovskii, A.O.; Suchocki, A.; Bismayer, U.; Pashkov, V.M.; Borisov, V.N.; Alexandrovskii, A.N.; Soldatov, A.V. Anomaly of NdGaO3 single crystal dielectric properties in the temperature range 80–300 K. Phase Transit. 1999, 70, 57–63. [Google Scholar] [CrossRef] [Scilit]
- Savytskii, D.; Vasylechko, L.; Senyshyn, A.; Matkovskii, A.; Bähtz, C.; Sanjuan, M.L.; Bismayer, U.; Berkowski, M. Low-temperature structural and Raman studies on rare-earth gallates. Phys. Rev. B 2003, 68, 024101. [Google Scholar] [CrossRef] [Scilit]
- De, B.K.; Dwij, V.; Gupta, M.K.; Mittal, R.; Bhatt, H.; Reddy, V.R.; Sathe, V.G. Breaking of inversion symmetry in NdGaO3. Phys. Rev. B 2021, 103, 054106. [Google Scholar] [CrossRef] [Scilit]
- Lang, M.; Devanathan, R.; Toulemonde, M.; Trautmann, C. Advances in Understanding of Swift Heavy-Ion Tracks in Complex Ceramics. Curr. Opin. Solid State Mater. Sci. 2015, 19, 39–48. [Google Scholar] [CrossRef] [Scilit]
- Singh, K.; Verma, M.; Rathi, V.; Kumar, V.; Kanjilal, D.; Brajpuriya, R.K.; Kumar, A. Swift Heavy Ion Irradiation of Gallium Nitride: A Review of Defect Dynamics, Ion–Matter Interactions, and Property Modifications. J. Mater. Sci. Mater. Electron. 2025, 36, 1795. [Google Scholar] [CrossRef] [Scilit]
- Bessonov, V.; O’Connell, J.; Shomenov, T.; Abdullaev, A.; Kozlovskiy, A.; Skuratov, V.; Wang, Y.; Utegulov, Z. Controlling Subsurface Radiation Tolerance in Swift Heavy Ion Irradiated Ceramics. Appl. Surf. Sci. 2026, 725, 165730. [Google Scholar] [CrossRef] [Scilit]
- Xu, Q.M.; Gou, J.; Zhang, C.H.; Wang, Y.Y.; Song, Y.; Ding, K.K.; Guo, Y.P. In Situ Investigations of Swift Heavy Ion Irradiation Effects: Luminescence of Al2O3 by Swift Heavy Ions. Nucl. Instrum. Methods Phys. Res. Sect. B Beam Interact. Mater. At. 2025, 568, 165867. [Google Scholar] [CrossRef] [Scilit]
- Xu, Q.M.; Gou, J.; Zhang, C.H.; Yang, Z.H.; Wang, Y.Y.; Song, Y.; Ding, K.K. In-Situ Luminescence of CaF2 Single Crystals Irradiated by Swift Heavy Ions. Radiat. Eff. Defects Solids 2026, 181, 5–6. [Google Scholar] [CrossRef] [Scilit]
- Szenes, G.; Pászti, F.; Péter, Á.; Popov, A.I. Tracks Induced in TeO2 by Heavy Ions at Low Velocities. Nucl. Instrum. Methods Phys. Res. Sect. B Beam Interact. Mater. At. 2000, 166–167, 949–953. [Google Scholar] [CrossRef] [Scilit]
- Liang, J.; He, S.; Liao, W.; Bai, Y.; Li, W.; Shi, T.; Zang, H.; Wei, J.; He, H.; He, C. Femtosecond Ultrafast Dynamics Simulations of Typical Semiconductor Materials under Swift Heavy Ion Irradiation. J. Appl. Phys. 2026, 139, 085701. [Google Scholar] [CrossRef] [Scilit]
- Ge, Z.; Hu, J.; Peng, S.; Kang, W.; Shen, X.; Xie, Y.; Xue, J. Ion Track Formation via Electric-Field-Enhanced Energy Deposition. Phys. Rev. Res. 2026, 8, 023013. [Google Scholar] [CrossRef] [Scilit]
- Cheridi, N.; Meftah, A. Structural Modifications in Vitreous SiO2 Induced by N and Ar Ion Irradiation: Competing Roles of Nuclear and Electronic Energy Losses. Acta Phys. Pol. A 2025, 148, 34. [Google Scholar] [CrossRef] [Scilit]
- Ziegler, J.F.; Ziegler, M.D.; Biersack, J.P. SRIM—The Stopping and Range of Ions in Matter. Nucl. Instrum. Methods Phys. Res. B Beam Interact. Mater. At. 2010, 268, 1818–1823. [Google Scholar] [CrossRef] [Scilit]
- Stoller, R.E.; Toloczko, M.B.; Was, G.S.; Certain, A.G.; Dwaraknath, S.; Garner, F.A. On the use of SRIM for computing radiation damage exposure. Nucl. Instrum. Methods Phys. Res. B 2013, 310, 75–80, Erratum in Nucl. Instrum. Methods Phys. Res. B 2019, 459, 196–197. [Google Scholar] [CrossRef] [Scilit]
- Mahne, N.; Čekada, M.; Panjan, M. Energy distribution of sputtered atoms explored by SRIM simulations. Coatings 2023, 13, 1448. [Google Scholar] [CrossRef] [Scilit]
- Ali, Z.; Liu, F.; Wang, Y.; Rasool, H.G.; Wang, F.; Haseeb, M. Advancements in primary radiation damage models and SRIM simulations: A review of radiation damage predictions. Nucl. Eng. Technol. 2025, 57, 103570. [Google Scholar] [CrossRef] [Scilit]
- Zdorovets, M.V.; Kozlovskiy, A.A.; ZhMoldabayeva, G.; Ivanov, I.A.; Konuhova, M. Radiation-induced degradation effects of optical properties of MgO ceramics caused by heavy ion irradiation. Opt. Mater. X 2025, 26, 100406. [Google Scholar] [CrossRef] [Scilit]
- Inerbaev, T.; Akilbekov, A.; Kenbayev, D.; Dauletbekova, A.; Shalaev, A.; Polisadova, E.; Konuhova, M.; Piskunov, S.; Popov, A.I. Color Centers in BaFBr Crystals: Experimental Study and Theoretical Modeling. Materials 2024, 17, 3340. [Google Scholar] [CrossRef] [Scilit]
- Ryskulov, A.E.; Ivanov, I.A.; Kozlovskiy, A.L.; Konuhova, M. The effect of residual mechanical stresses and vacancy defects on the diffusion expansion of the damaged layer during irradiation of BeO ceramics. Opt. Mater. X 2024, 24, 100375. [Google Scholar] [CrossRef] [Scilit]
- Akilbekov, A.; Kenbayev, D.; Dauletbekova, A.; Polisadova, E.; Yakovlev, V.; Karipbayev, Z.; Shalaev, A.; Elsts, E.; Popov, A.I. The Effect of Fast Kr Ion Irradiation on the Optical Absorption, Luminescence, and Raman Spectra of BaFBr Crystals. Crystals 2023, 13, 1260. [Google Scholar] [CrossRef] [Scilit]
- Karipbayev, Z.T.; Aralbayeva, G.M.; Zhalgas, A.T.; Burkanova, K.; Zhunusbekov, A.M.; Manika, I.; Akilbekov, A.; Bakytkyzy, A.; Ubizskii, S.; Sagyndykova, G.E.; et al. Radiation-Induced Disorder and Lattice Relaxation in Gd3Ga5O12 Under Swift Xe Ion Irradiation. Crystals 2025, 15, 1065. [Google Scholar] [CrossRef] [Scilit]
- Cullity, B.D.; Stock, S.R. Elements of X-Ray Diffraction, 3rd ed.; Prentice Hall: Upper Saddle River, NJ, USA, 2001. [Google Scholar]
- Hubbell, J.H.; Seltzer, S.M. Tables of X-Ray Mass Attenuation Coefficients and Mass Energy-Absorption Coefficients from 1 keV to 20 MeV for Elements Z = 1 to 92 and 48 Additional Substances of Dosimetric Interest; NISTIR 5632; National Institute of Standards and Technology: Gaithersburg, MD, USA, 1995.
- Gibbons, J.F. Ion Implantation in Semiconductors—Part II: Damage Production and Annealing. Proc. IEEE 1972, 60, 1062–1096. [Google Scholar] [CrossRef] [Scilit]
- Karipbayev, Z.T.; Kumarbekov, K.; Manika, I.; Dauletbekova, A.; Kozlovskiy, A.L.; Sugak, D.; Ubizskii, S.B.; Akilbekov, A.; Suchikova, Y.; Popov, A.I. Optical, Structural, and Mechanical Properties of Gd3Ga5O12 Single Crystals Irradiated with 84Kr+ Ions. Phys. Status Solidi B Basic Solid State Phys. 2022, 259, 2100415. [Google Scholar] [CrossRef] [Scilit]
- Zirour, H.; Izerrouken, M.; Sari, A. Radiation damage induced in Al2O3 single crystal by 90 MeV Xe ions. Nucl. Instrum. Methods Phys. Res. Sect. B Beam Interact. Mater. At. 2015, 365, 269–272. [Google Scholar] [CrossRef] [Scilit]
- Song, Y.; Zhang, S.; Zhang, C.; Yang, Y.; Lv, K. Raman Spectra and Microstructure of Zinc Oxide irradiated with Swift Heavy Ion. Crystals 2019, 9, 395. [Google Scholar] [CrossRef] [Scilit]
- Bano, R.; Zubair, M.; Javaid, K.; Khan, M.I.; Hussain, J.; Ahmad, I.; Izerrouken, M.; Iqbal, M.F. Defect-induced in situ luminescence enhancement in α-Al2O3 via MeV H+ ion irradiation. Nucl. Instrum. Methods Phys. Res. Sect. B Beam Interact. Mater. At. 2026, 574, 166071. [Google Scholar] [CrossRef] [Scilit]
- Izerrouken, M.; Meftah, A.; Nekkab, M. Color centers in neutron-irradiated Y3Al5O12, CAF2 and LiF single crystals. J. Lumin. 2007, 127, 696–702. [Google Scholar] [CrossRef] [Scilit]

Disclaimer/Publisher’s Note: The statements, opinions and data contained in all publications are solely those of the individual author(s) and contributor(s) and not of MDPI and/or the editor(s). MDPI and/or the editor(s) disclaim responsibility for any injury to people or property resulting from any ideas, methods, instructions or products referred to in the content. |
© 2026 by the authors. Licensee MDPI, Basel, Switzerland. This article is an open access article distributed under the terms and conditions of the Creative Commons Attribution (CC BY) license.