


Abstract
Traditional fixed or linear carbon prices often fail to reflect the nonlinear incentives of real carbon markets. To address this, we propose a multi-objective optimal dispatch framework for integrated energy systems (IESs) incorporating a tiered carbon trading mechanism. The system—comprising photovoltaics, wind power, a gas turbine, energy storage (ESS), power-to-gas (P2G), and grid interaction—aims to minimize operating and carbon trading costs while maximizing renewable utilization. This is solved using an improved multi-objective particle swarm optimization (IMOPSO) algorithm. Simulations across five configurations reveal that tiered pricing nonlinearly penalizes high emissions, reshaping the Pareto front toward low-carbon outcomes. Consequently, the ESS evolves from a simple economic arbitrageur into a proactive “carbon buffer”, absorbing midday photovoltaic surpluses and substituting gas turbine output during evening peaks. Compared to a grid-only baseline, the optimized multi-energy configuration (gas turbine + ESS + P2G) reduced operating costs by 13.1% and carbon emissions by 9.9%, while increasing renewable utilization by 8.5%. Ultimately, this study demonstrates that a well-designed nonlinear carbon pricing mechanism is decisive for guiding the IES to achieve coordinated economic and low-carbon operation.
1. Introduction
Integrated energy systems (IESs), as a new energy management paradigm, have gradually become one of the key technologies driving the transformation of modern energy systems, thanks to their advantages in multi-energy complementarity, optimized resource allocation, and flexible dispatch. Integrated energy systems coordinate electricity, heat, gas, and energy storage to improve overall system efficiency and operational flexibility. With the continuously increasing penetration of renewable energy sources such as photovoltaics and wind power, the operation of integrated energy systems faces multiple challenges, including strong multi-energy coupling, the intermittency of renewables, and increasingly stringent carbon emission constraints. Therefore, achieving economically efficient and environmentally sustainable dispatch has become a key issue in modern energy systems.
Traditional integrated energy system dispatch strategies mainly focus on minimizing operating costs under deterministic energy price [1]. However, in the context of carbon neutrality policies, carbon emissions have become a key factor influencing operational decisions. Carbon trading mechanisms are increasingly being incorporated into energy markets to internalize environmental costs [2]. Most existing studies adopt fixed carbon prices or linear emission penalties, which simplifies carbon costs but fails to capture the nonlinear impact of policy-driven carbon constraints on dispatch behavior, especially under high-emission operating conditions.
The scheduling of integrated energy systems under carbon constraints still faces several inherent challenges. First, the strong coupling among the power, heat, and gas systems introduces significant nonlinearity into the optimization problem. Second, economic objectives, carbon emission reduction, and energy efficiency improvement are inherently conflicting, leading to complex trade-offs. Third, policy-driven mechanisms such as stepped carbon trading introduce discontinuous and nonlinear cost characteristics, fundamentally reshaping the feasible decision space.
To address these challenges, this paper investigates the multi-objective optimal dispatch problem of an IES considering a stepped carbon trading mechanism. Rather than merely proposing a novel optimization algorithm, the primary goal is to reveal how nonlinear carbon pricing reshapes dispatch behavior and the structure of optimal solutions. A customized multi-objective optimization framework based on an improved particle swarm optimization algorithm is adopted to ensure robust solution searches under strongly nonlinear conditions. The main contributions are summarized as follows:
(1) Develop a refined multi-energy IES model that embeds the stepped carbon trading mechanism into the optimization objective as a piecewise function. This formulation accurately captures the discontinuous and nonlinear penalty characteristics of real-world carbon markets, effectively overcoming the limitations of conventional linear carbon pricing models.
(2) Establish a multi-objective optimal scheduling model aimed at minimizing operating and carbon trading costs while maximizing renewable energy utilization. This model is solved using an improved multi-objective particle swarm optimization (IMOPSO) algorithm, which enhances convergence and solution-set diversity through adaptive parameter control and an external archive mechanism.
(3) Conceptual contribution
Reveal the driving mechanism behind the functional evolution of energy storage under nonlinear carbon constraints. Distinct from existing literature that confines the ESS to simple economic arbitrage, our comparative analysis elucidates how tiered carbon pricing heavily penalizes high-emission intervals. This mechanism compellingly drives the ESS to act proactively as a “carbon buffer”. By absorbing midday photovoltaic surpluses to substitute for gas turbine output during evening load peaks, the ESS actively prevents the system from crossing into higher carbon price tiers, thereby structurally reshaping the Pareto frontier toward low-carbon optimal solutions.
(4) Application-based contribution
Quantitatively evaluate the comprehensive benefits of multi-energy collaborative configurations, providing a robust theoretical foundation and a quantitative reference for optimal equipment sizing and the parameter design of future carbon trading markets.
The remainder of this paper is organized as follows. Section 2 reviews the relevant literature. Section 3 describes the integrated energy system configuration and mathematical models. Section 4 presents the carbon trading mechanism and the multi-objective optimization formulation. Section 5 introduces the solution methodology. Section 6 provides the case studies and results analysis. Section 7 discusses its limitations. Section 8 concludes the paper.
2. Literature Review
2.1. Multi-Energy Load Forecasting
Accurate forecasting of multi-energy loads is an important basis for the optimal dispatch of integrated energy systems (IESs). Recent studies have widely applied deep learning and hybrid neural network methods to improve forecasting accuracy. Temporal convolutional networks, bidirectional gated recurrent units, attention mechanisms, multitask learning, and reinforcement learning have all been introduced into load forecasting models [3,4,5]. In addition, kernel principal component analysis, K-means clustering, and classification–regression mapping have been used to better characterize multi-category loads [6,7,8,9]. More advanced forecasting frameworks include dual-layer multitask learning, PatchTCN-TST models, federated learning for privacy protection, and hybrid models based on signal decomposition and CNN-BiLSTM networks [10,11,12,13]. Recent advances in generative artificial intelligence have also improved forecasting performance in renewable energy applications by enhancing spatiotemporal pattern learning and scenario generation [14]. These studies provide reliable inputs for dispatch optimization. However, the focus of this paper is not forecasting itself, but low-carbon IES dispatch under stepped carbon trading.
2.2. Low-Carbon Dispatch and Stepped Carbon Trading
Low-carbon economic dispatch has become a major research topic in IES operation. Existing studies have incorporated carbon emission costs, integrated demand response, carbon flow tracing, nonlinear equipment characteristics, and uncertainty modeling into dispatch frameworks [15,16,17,18,19,20]. These studies show that carbon-related cost signals can significantly affect equipment scheduling, energy conversion pathways, and system-wide emission outcomes.
Most existing studies, however, still assume fixed carbon prices or linear carbon penalty models. These assumptions simplify optimization, but they do not fully reflect the nonlinear regulatory effect of practical carbon markets. To address this issue, recent studies have introduced stepped carbon trading into IES dispatch models. These works have considered life-cycle carbon accounting, positive–negative stepped trading, hydrogen-related equipment modeling, and dynamic carbon quota allocation [21,22,23,24]. Their results indicate that nonlinear carbon pricing can significantly alter dispatch behavior and improve the coordination of low-carbon resources such as demand response, power-to-gas, and hydrogen systems.
Uncertainty-aware dispatch has also received increasing attention. Distributionally robust optimization, data-driven scenario generation, and collaborative robust control frameworks have been used to improve dispatch performance under renewable and market uncertainty [25,26,27,28,29]. These studies provide useful methodological support for low-carbon IES scheduling. Nevertheless, current research mainly emphasizes cost and emission reduction. The mechanism by which stepped carbon pricing changes the role of flexible resources remains insufficiently explored.
2.3. International Perspectives and Flexible Multi-Energy Coordination
International research has made important contributions to integrated and smart energy systems. Lund et al. [30] proposed the concept of “Smart Energy Systems” and emphasized the coordinated integration of electricity, heat, and gas sectors. Mancarella [31] established a general analytical framework for multi-energy systems. Clegg and Mancarella [32] further showed the importance of gas infrastructure and power-to-gas technologies in low-carbon integrated networks. Gabrielli et al. [33] demonstrated that both short-term and long-term storage are necessary for deep decarbonization, while O’Dwyer et al. [34] extended this perspective to district-level smart energy system dispatch. Palensky et al. [35] highlighted the value of advanced co-simulation and digital approaches for managing the complexity of coupled energy systems.
Recent studies have further strengthened the understanding of flexible multi-energy coordination under carbon constraints. Hydrogen, power-to-gas, and energy storage systems are increasingly recognized as key flexibility resources for renewable energy accommodation and deep decarbonization [27,36,37,38,39]. Meanwhile, the continued development of carbon markets provides an important policy background for low-carbon scheduling. Recent international reviews indicate that stepped or differentiated carbon pricing mechanisms are becoming increasingly relevant for practical low-carbon system design [40,41].
2.4. Research Gap and Motivation
In summary, existing studies have made substantial progress in forecasting, low-carbon dispatch, multi-energy coordination, and uncertainty-aware optimization. Recent work on stepped carbon trading has improved the realism of carbon cost modeling and has shown that nonlinear pricing can significantly influence system operation. However, several limitations remain.
First, most existing studies focus on economic and emission outcomes, but pay limited attention to how stepped carbon pricing reshapes the internal dispatch mechanism of IESs. Second, flexible resources such as energy storage, power-to-gas, and hydrogen systems have been widely studied, but their functional evolution under nonlinear carbon pricing has not been clearly explained. Third, the interaction between stepped carbon trading and multi-objective dispatch behavior, especially its impact on Pareto-optimal solution structures, remains insufficiently understood.
To address these gaps, this paper develops a multi-objective optimal dispatch model for an IES considering stepped carbon trading. The model embeds a piecewise carbon cost into the objective function and uses multi-scenario comparative analysis to reveal how nonlinear carbon pricing changes dispatch behavior. Particular attention is given to the role of energy storage, especially its transition from a conventional economic arbitrage resource to a proactive carbon-buffering resource.
3. Integrated Energy System Description and Mathematical Modeling
3.1. Configuration Energy System Configuration
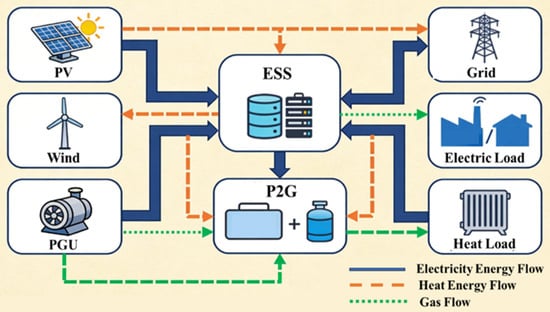
To achieve efficient energy utilization and flexible dispatch, this study optimizes overall operational performance by rationally configuring different energy subsystems. A schematic diagram of the overall structure of the integrated energy system is shown in Figure 1.
Figure 1.
Configuration of the integrated energy system (IES).
An integrated energy system (IES) coordinates multiple energy carriers to improve overall efficiency, flexibility, and low-carbon performance. In this study, a typical industrial–commercial IES was considered, consisting of photovoltaic (PV) generation, wind power, a gas turbine (GT), an energy storage system (ESS), and grid interaction. Electricity serves as the primary energy carrier, while natural gas acts as the main fossil fuel source associated with carbon emissions.
The system operates on a day-ahead scheduling horizon with hourly resolution. Renewable energy sources supply electricity directly to the load, while surplus renewable power can be stored in the energy storage system. The gas turbine provides dispatchable power to compensate for renewable intermittency and load fluctuations. Additionally, electricity can be purchased from the main grid to ensure supply reliability when local generation is insufficient.
It should be noted that while this study focuses on the macroeconomic-environmental trade-offs at the day-ahead level, sub-hourly real-time dynamic management and transient stability control are assumed to be executed by lower-level local controllers (e.g., microgrid energy management systems), which are decoupled from the upper-level scheduling framework discussed herein.
Although electricity, gas, and heat follow independent physical transmission paths, their operations are tightly coupled at the dispatch level. Decisions regarding gas turbine output, energy storage charging and discharging, and grid power exchange jointly determine system operating cost, carbon emissions, and energy utilization efficiency. This strong coupling makes the dispatch problem highly nonlinear, especially under carbon trading constraints.
3.2. Component Models
3.2.1. Photovoltaic Power Model
To accurately describe the dynamic response of the PV system, the rated output power of the PV modules is defined under standard test conditions (STC). The actual output power of the system at operational time t, denoted as PPV(t), can be expressed by Equation (1), which incorporates the rated output power, the solar irradiation intensity, and the module temperature:
where denotes the irradiation intensity under standard conditions, which was set to in this paper. represents the power temperature coefficient of the PV module, and is the standard reference temperature, set to .
The actual temperature of the PV module, , is influenced not only by the ambient temperature , but also by the temperature rise effect induced by solar irradiation. Therefore, a module temperature rise model is introduced, as shown in Equation (2):
where is the temperature rise coefficient, reflecting the magnitude of the module temperature increase per unit growth in irradiation intensity. Its empirical value generally falls within the range of . Based on the aforementioned model, the temperature effect can be further corrected to enhance the accuracy of the PV output simulation.
3.2.2. Wind Power Model
Wind power output is characterized by strong intermittency and randomness. Based on the typical power curve of a wind turbine, the output power at time t is defined, as shown in Equation (3):
where is the wind speed (m/s) at time ; , , and represent the cut-in, rated, and cut-out wind speeds, respectively; and denotes the rated power of the wind turbine.
3.2.3. Gas Turbine Model
The gas turbine serves as the main controllable generation unit in the system and is the primary source of carbon emissions. Its output power is constrained by Equation (4):
The natural gas consumption corresponding to electricity generation is expressed as Equation (5):
where denotes the efficiency of the gas turbine. Carbon emissions are directly proportional to natural gas consumption, which links dispatch decisions to carbon trading costs.
3.2.4. Energy Storage System Model
The energy storage system (ESS) fundamentally comprises energy storage units, a power conditioning system (PCS), and an energy management system (EMS). Its operational dynamics serve as critical constraints that must be accounted for during system dispatch.
The relationship between the internal battery power and the external charge/discharge power is defined in Equation (6):
where and represent the charging and discharging efficiencies, respectively.
The dynamic variation of the state of charge (SOC) during the continuous charging and discharging processes is governed by the differential Equation (7):
For practical scheduling and optimization, this continuous model is discretized over a time step , yielding Equation (8):
where denotes the rated energy capacity of the ESS, and is the scheduling sampling period. Depending on the direction of power flow, the overall operating efficiency is dynamically adjusted as expressed in Equation (9):
To further delineate the dynamic characteristics of the battery voltage, a simplified equivalent circuit model is introduced in Equation (10):
where is the terminal voltage, is the open-circuit voltage, is the internal equivalent resistance, and stands for the operating current.
3.3. Energy Balance Equations and Operational Constraints
To guarantee that the system complies with energy management requirements throughout its operation, it is essential to establish the energy balance equations and explicitly define the associated operational constraints. The continuous energy variation of the energy storage system (ESS) is governed by Equation (11):
where represents the energy stored in the ESS at time , and denotes the corresponding actual charge or discharge power.
In the discrete-time domain, the energy update formulation is expressed as Equation (12):
Furthermore, the practical scheduling of the ESS is strictly subject to the following technical constraints:
- State of Charge (SOC) Constraint;
To prevent accelerated battery degradation caused by overcharging or deep discharging, the SOC must be strictly maintained within a safe operational range, as described in Equation (13):
where and are the lower and upper limits of the SOC.
- Power Constraints
The operational power is limited by the physical ratings of the power conditioning system (PCS). Equation (14) ensures that the charging and discharging powers do not exceed their maximum permissible boundaries:
where and represent the maximum allowable charging and discharging powers, respectively.
- Energy Capacity Constraint
The actual energy stored at any scheduling interval is bounded by the physical capacity limits of the ESS, as formulated in Equation (15):
4. Carbon Trading Mechanism and Optimization Problem Formulation
4.1. Carbon Trading and Emission Modeling
To comprehensively evaluate the operational expenditure of the integrated energy system (IES), this study accounts for multiple financial factors, including electricity procurement, natural gas consumption, energy storage system (ESS) depreciation, and unit start-up/shut-down costs. The total operational cost, , is formulated as follows in Equation (16):
where , , , and represent the costs of grid electricity, natural gas, ESS depreciation, and unit switching operations, respectively. This cost framework establishes the economic foundation for the subsequent optimal dispatch.
In the context of the global transition toward low-carbon energy, environmental sustainability has become a pivotal factor alongside economic efficiency. Consequently, a carbon emission cost model is integrated into the economic framework to quantify the environmental impact of system operations. Carbon emissions primarily originate from the combustion of fossil fuels in units such as gas turbines. These emissions are estimated by multiplying the gas consumption by the emission factor of natural gas, further scaled by the carbon price. The specific calculation is given by Equation (17):
where denotes the carbon price, is the carbon emission factor per unit of natural gas, represents the gas consumption power at time , and is the sampling interval. The inclusion of carbon costs reflects the environmental externalities of energy conversion and facilitates a trade-off between economic and environmental objectives within the multi-objective optimization framework.
4.2. Stepped Carbon Trading Mechanism
To enhance the stringency of carbon constraints compared to traditional carbon trading, a stepped carbon trading mechanism is introduced. This mechanism categorizes carbon emissions into multiple tiers; as emissions increase and cross into higher intervals, the unit carbon price escalates, thereby penalizing high-emission behavior. The net carbon trading volume, , is calculated as:
where is the actual carbon emission of the IES and is the free carbon quota. The quota is allocated using the baseline method by Equation (19):
In this study, the carbon emission factors for grid-purchased electricity and natural gas are set to and , respectively. The stepped carbon trading cost function is defined as follows:
where is the baseline carbon price, represents the interval length, and is the price escalation rate.
4.3. Multi-Strategy Adaptive Particle Swarm Optimization (IMOPSO)
4.3.1. Optimization Objectives
To comprehensively evaluate the system’s performance, the optimization model is formulated as a strict multi-objective problem. Instead of using an a priori scalarization method that obscures the trade-offs among conflicting goals, we define three independent objective functions. The model aims to simultaneously minimize total economic cost, minimize carbon emissions, and maximize renewable energy utilization. The mathematical formulations for the three objectives are defined as follows:
The first objective is to minimize the total comprehensive economic cost, which includes both the basic operational cost and the tiered carbon trading cost, formulated as Equation (21):
The second objective is to minimize the total carbon emissions generated by the system operations, primarily from the gas turbine and grid electricity purchases, formulated as Equation (22):
The third objective is to maximize the utilization rate of renewable energy (or equivalently, minimize the wind and solar curtailment penalty) to ensure maximum environmental sustainability, formulated as Equation (23):
is the total operational cost, represents the stepped carbon emission cost, denotes the physical carbon emissions, and is the overall renewable energy accommodation rate. Rather than combining these into a single equation, the proposed IMOPSO algorithm directly searches the multi-dimensional space to obtain a set of non-dominated Pareto optimal solutions.
4.3.2. Decision Variables and Constraints
In multi-objective optimization, establishing rigorous system energy balance constraints is imperative to ensure the practical feasibility of the dispatch scheme.
- Energy Capacity Constraint
The electrical power balance mandates that at any given time , the combined power supplied by the generation units, the energy storage system (ESS) discharge, and external grid purchases must precisely satisfy the local load demand and the ESS charging requirements. The electrical balance equation is defined as Equation (24):
where , , and are the output powers of the photovoltaic array, wind turbines, and gas turbine, respectively. is the power purchased from the main grid, and are the charging and discharging powers of the ESS, and is the electrical load demand. Additionally, analogous supply–demand balance equations must be strictly enforced for the thermal and gas networks within the integrated system.
- Unit Operational Constraints;
The actual output power of each dispatchable generation unit is bounded by its physical capacity limits, as expressed in Equation (25):
- Ramping Rate Constraints
To prevent mechanical stress and guarantee the dynamic stability of the equipment, the power variation between consecutive time steps is restricted by the ramping rate, defined in Equation (26):
where represents the maximum ramping rate of the unit, and is the time step length.
- ESS Dynamic Constraints
The state of charge (SOC) variation of the energy storage system governs its charging/discharging behavior and follows the dynamic update Equation (27):
By systematically modeling the comprehensive energy balances, equipment operational boundaries, and ESS safety constraints, the proposed optimal dispatch scheme guarantees that the system achieves economic and low-carbon objectives while maintaining rigorous engineering feasibility and practical applicability.
5. Solution Methodology
5.1. Overall Flowchart
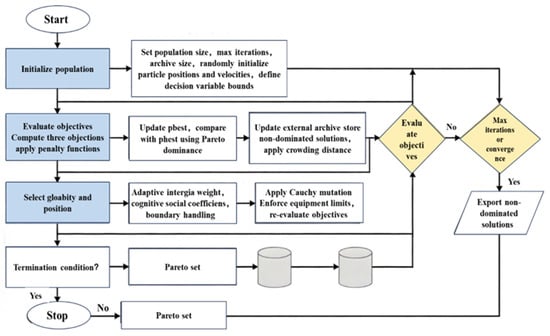
In this study, an improved multi-objective particle swarm optimization (IMOPSO) algorithm was employed to solve the optimal dispatch problem of the integrated energy system. The overall procedure is illustrated in Figure 2. Initially, the positions and velocities of the particles are randomly generated, and an initial set of non-dominated solutions is archived in an external repository. During each iteration, particles update their states based on their personal best () and the global best () positions, followed by the continuous evaluation of the objective functions.
Figure 2.
Flowchart of the IMOPSO algorithm.
To enhance the search capability, an adaptive inertia weight mechanism is introduced to strike a balance between global exploration and local exploitation, thereby preventing premature convergence. Throughout the iterative process, the external archive is continuously updated using non-dominated sorting and crowding distance mechanisms, ensuring the uniform distribution and diversity of the Pareto optimal solutions.
5.2. Algorithm Performance Validation
To rigorously validate the optimization performance of the proposed IMOPSO, it was systematically compared against the original MOPSO and the classic NSGA-II algorithms using the standard ZDT test suites. The benchmark tests primarily focus on convergence speed, solution distribution uniformity, and diversity preservation. The statistical results regarding the generational distance (GD), inverted generational distance (IGD), spacing (SP), and hypervolume (HV) metrics are detailed in Table 1.
Table 1.
Performance metrics comparison of different algorithms on ZDT test functions.
To enhance convergence and maintain solution diversity, the proposed IMOPSO incorporates two key algorithmic improvements over the standard MOPSO. First, an adaptive inertia weight mechanism is integrated into the velocity update process. Specifically, the inertia weight gradually decreases from 0.9 to 0.4 as the iterations progress. In the initial search phase, a high maintains particle momentum to traverse a larger search space, effectively preventing premature convergence to local optima. In later iterations, the reduced facilitates a stable transition to intensive local exploitation, ensuring precise convergence onto the true Pareto front.
A crowding distance sorting strategy is employed to refine the external archive management. Instead of random pruning, the algorithm calculates the density of solutions surrounding each individual in the archive. By preferentially retaining solutions with larger crowding distances (i.e., those in isolated or less-dense regions), the mechanism inherently avoids solution clustering and promotes a uniform distribution across the entire objective space frontier.
The effectiveness of these theoretical improvements is quantitatively validated through standard benchmark testing. The experimental results demonstrate that the proposed IMOPSO achieves optimal or sub-optimal performance across the majority of the test functions. Taking ZDT1, ZDT2, and ZDT6 as examples, the GD values of IMOPSO are 0.0009, 0.0012, and 0.0032, respectively, which are significantly lower than those of the original MOPSO and NSGA-II. This indicates that IMOPSO possesses superior global search capabilities and higher convergence precision. Simultaneously, the HV values of IMOPSO on these functions reach 0.912, 0.901, and 0.802, revealing a distinct advantage in the coverage of the solution space and the preservation of diversity.
6. Case Study and Analysis
6.1. Parameter Settings and Typical Daily Data
To verify the effectiveness and applicability of the proposed multi-objective optimal dispatch model for the integrated energy system (IES) and the improved multi-objective particle swarm optimization (IMOPSO) algorithm, a comprehensive case study was conducted. The primary equipment parameters of the system are detailed in Table 2, while the economic and carbon trading parameters are listed in Table 3. Please note that unless otherwise specified, all figures and tables presented in this manuscript are the authors’ own elaborations derived from the proposed mathematical models and simulation results.
Table 2.
System component parameters.
Table 3.
Economic and carbon trading parameters.
Specifically, as shown in Table 2, the maximum capacity of the gas turbine (PGU) was set to 20 kW to ensure sufficient dispatchable power, while the capacities of the ESS and P2G were configured at 500 kWh and 30 kW, respectively, to facilitate adequate energy time-shifting. As detailed in Table 3, the operation and maintenance costs vary across different equipment, reflecting their distinct physical characteristics.
A time-of-use electricity pricing structure was adopted, with the off-peak rate set at 0.2 CNY/kWh and the peak rate at 1.2 CNY/kWh. Within the stepped carbon trading mechanism, the baseline carbon price was set at 0.2 CNY/kg CO2, with a step interval of 100 kg. For every interval exceeded, the price escalated by 0.05 CNY/kg CO2, and the free emission quota was established at 500 kg CO2.
It is worth noting that due to data confidentiality, the profiles for wind power, photovoltaic generation, and load demands used in this case study were synthesized based on typical operational patterns and real-world meteorological data observed in an actual industrial park in China, ensuring the practical representativeness of the simulation.
The typical daily profiles for electrical load, wind power output, PV output, and thermal load are illustrated in Figure 3. The electrical load exhibited a distinct dual-peak characteristic: the morning peak occurred between 09:00 and 11:00, while the evening peak spanned from 18:00 to 20:00, reaching a maximum of 400 kW. Wind power output was predominantly higher during the night and relatively stable throughout the day. Conversely, PV output followed a single-peak distribution, peaking at approximately 100 kW around noon. The thermal load remained relatively stable across the entire day, with slight elevations in the morning and evening, peaking at 150 kW.
Figure 3.
Typical daily profiles of electrical load, wind power, PV output, and thermal load.
While renewable generation and load demands are inherently stochastic, we adopted deterministic daily profiles in this study to provide a controlled, proof-of-concept environment. This explicitly isolates the impact of the tiered carbon pricing mechanism and P2G–ESS coordination from stochastic variations. This approach is widely adopted in initial feasibility and mechanism-discovery studies of nonlinear carbon policies [3,4], as it allows for a clear, interpretable comparison of the Pareto front reshaping effect without confounding factors.
While the deterministic profiles used in this study provide a clear proof-of-concept environment, real-time forecasts inevitably contain errors. To bound the potential impact of such uncertainty on our main conclusions, we conducted a simple perturbation analysis without re-running the full optimization. Specifically, we independently varied the hourly wind, PV, and load values by ±10% and ±20% (typical day-ahead forecast error ranges) and re-evaluated the objective functions for the obtained Pareto-optimal solution (Scenario 5) using the same dispatch decisions. The results show that net profit varied by ±8.2% (from −2632 to −3103 CNY) and carbon emissions varied by ±5.7% (from 2384 to 2671 kg) under ±20% perturbations. More importantly, the qualitative role of the ESS as a carbon buffer—midday charging and evening discharging—remained unchanged in all perturbed cases. Thus, while absolute numbers may shift within a limited range, the key conceptual findings are robust to typical day-ahead forecast errors. A full stochastic optimization is identified as an important future extension.
6.2. Reshaping Effect of the Stepped Carbon Pricing Mechanism on the Pareto Frontier
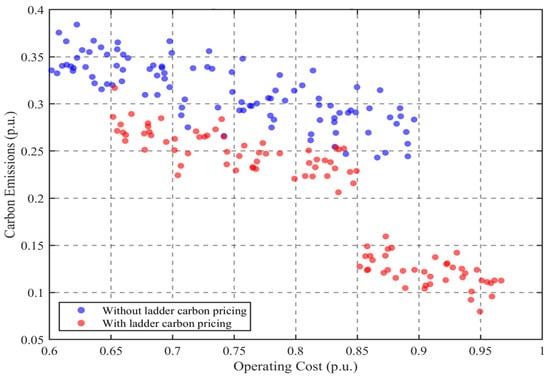
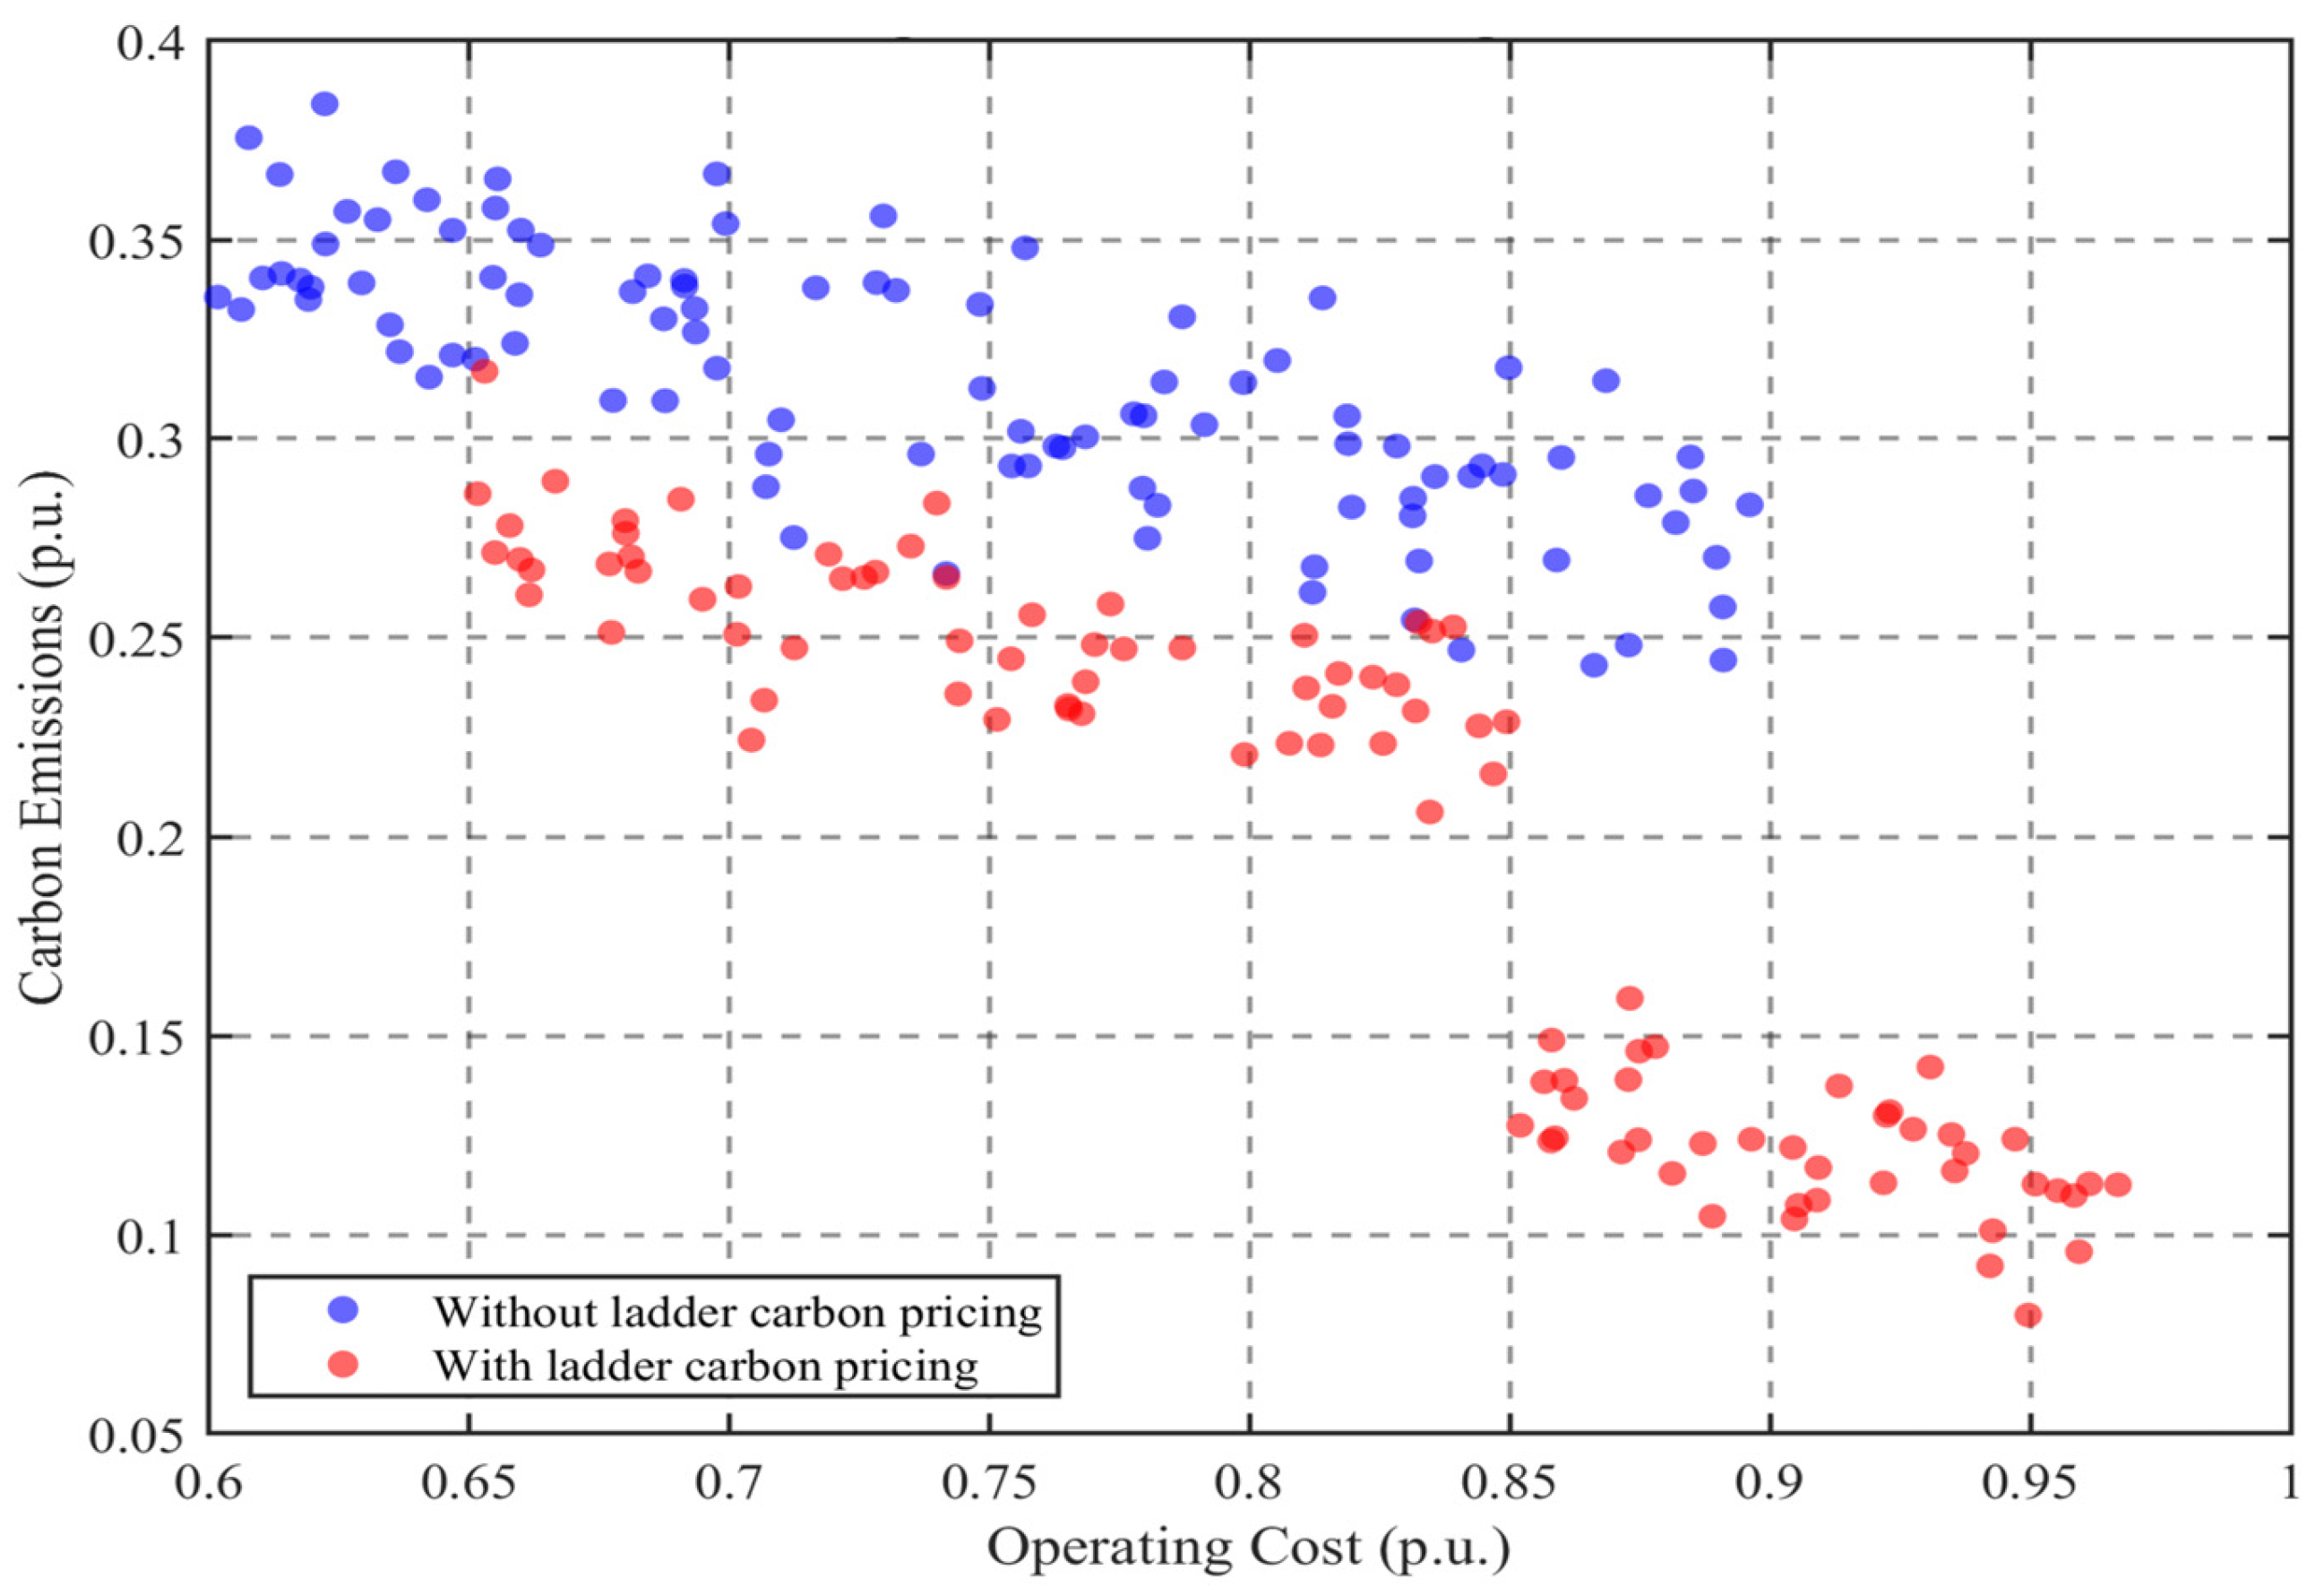
To investigate the impact of stepped carbon trading on dispatch decisions, the multi-objective optimization problem was solved under both linear and stepped carbon pricing scenarios using the IMOPSO algorithm. Through non-dominated sorting and an external archiving mechanism, the algorithm generates the Pareto frontiers for both pricing schemes, as depicted in Figure 4.
Figure 4.
Pareto frontier comparison.
Under a linear carbon price, the Pareto frontier exhibits a continuous and smooth distribution, indicating a relatively fixed marginal substitution rate between operational costs and carbon emissions. This allows the system to achieve a smooth trade-off between the two objectives, as the constant marginal carbon cost enables the IMOPSO algorithm to search continuously along the frontier.
However, the introduction of a stepped carbon price fundamentally alters the structure of the frontier. In the low-emission region, the frontier’s shape is largely consistent with the linear scenario. Yet, once carbon emissions exceed a specific threshold, the frontier demonstrates a pronounced “shrinkage” characteristic, severely suppressing high-emission solutions. This phenomenon fundamentally arises from the fact that under the stepped mechanism, the marginal carbon cost jumps abruptly when excess emissions cross an interval boundary. Consequently, high-emission solutions that were feasible under the linear price lose their dominance during the non-dominated sorting process of the IMOPSO algorithm and are automatically eliminated from the Pareto archive. In essence, the nonlinear penalty mechanism of the stepped carbon price forces the optimization process to actively circumvent carbon-intensive operational zones, thereby shifting the entire Pareto frontier toward a low-carbon direction.
Based on the obtained Pareto frontier, an a posteriori selection mechanism is required to determine the final operational strategy. Since the objectives have different dimensions and magnitudes, all Pareto solutions are first normalized. Then, a normalized weighted evaluation method is employed to select the best compromise solution from the Pareto set. For the k-th solution on the Pareto front, its comprehensive evaluation index Fk is calculated as:
where and are the maximum and minimum values of the -th objective on the Pareto front, respectively. The solution that minimizes the index is selected as the optimal compromise operational strategy.
To transparently evaluate how decision-maker preferences affect the final dispatch scheme within this fully coordinated configuration (Scenario 5), a weight sensitivity analysis was conducted by substituting different weight combinations into the above evaluation method. Three representative weight configurations are established to filter the Pareto front:
Case A (Economic priority): α = 0.7, β = 0.15, γ = 0.15.
Case B (Environmental priority): α = 0.15, β = 0.7, γ = 0.15.
Case C (Balanced approach): α = 0.35, β = 0.35, γ = 0.3.
Table 4 presents the scheduling outcomes under these three distinct preference settings.
Table 4.
System performance of Scenario 5 under different a posteriori weight configurations.
Negative profit indicates cost outweighs revenue; a higher (less negative) value is better.
As demonstrated in Table 4, differing weight preferences yield markedly divergent operational strategies even within the exact same equipment configuration. Case A aims to strictly prioritize financial profitability. The algorithm schedules the most cost-effective generation to meet load demands, which successfully minimizes economic losses (net profit improves to −2512.40 CNY). However, this heavily sacrifices environmental performance, resulting in the highest carbon emissions (2885.60 kg). Conversely, Case B heavily penalizes emissions, achieving the optimal environmental performance (2245.15 kg) by suppressing high-emission units, but this leads to a severe deterioration in economic viability (profit drops to −3215.80 CNY).
Case C successfully identifies the optimal equilibrium on the Pareto frontier. Under this configuration, the system intelligently navigates the stepped carbon price, achieving the highest heat utilization (81.59%). Most importantly, it secures a highly competitive net profit (−2867.95 CNY) while keeping emissions strictly within the lower, less punitive tiers of the carbon pricing mechanism (2527.49 kg). This robustly validates that our proposed balanced weights provide a rational, transparent, and superior compromise for the multi-objective scheduling problem.
6.3. Analysis of the Role of Energy Storage Driven by Stepped Carbon Pricing
To evaluate the impact of carbon pricing mechanisms on energy storage dispatch strategies, the multi-objective optimization problem was solved under three scenarios: no carbon price (pure economic arbitrage), linear carbon price, and stepped carbon price. From the Pareto solution sets outputted by the algorithm, the compromise solution with the minimum weighted sum was selected for comparative analysis.
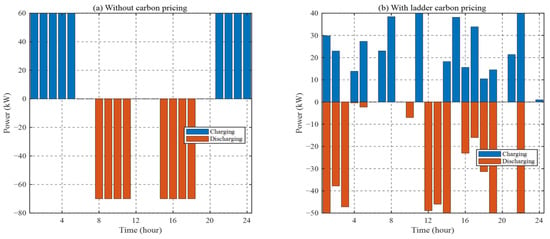
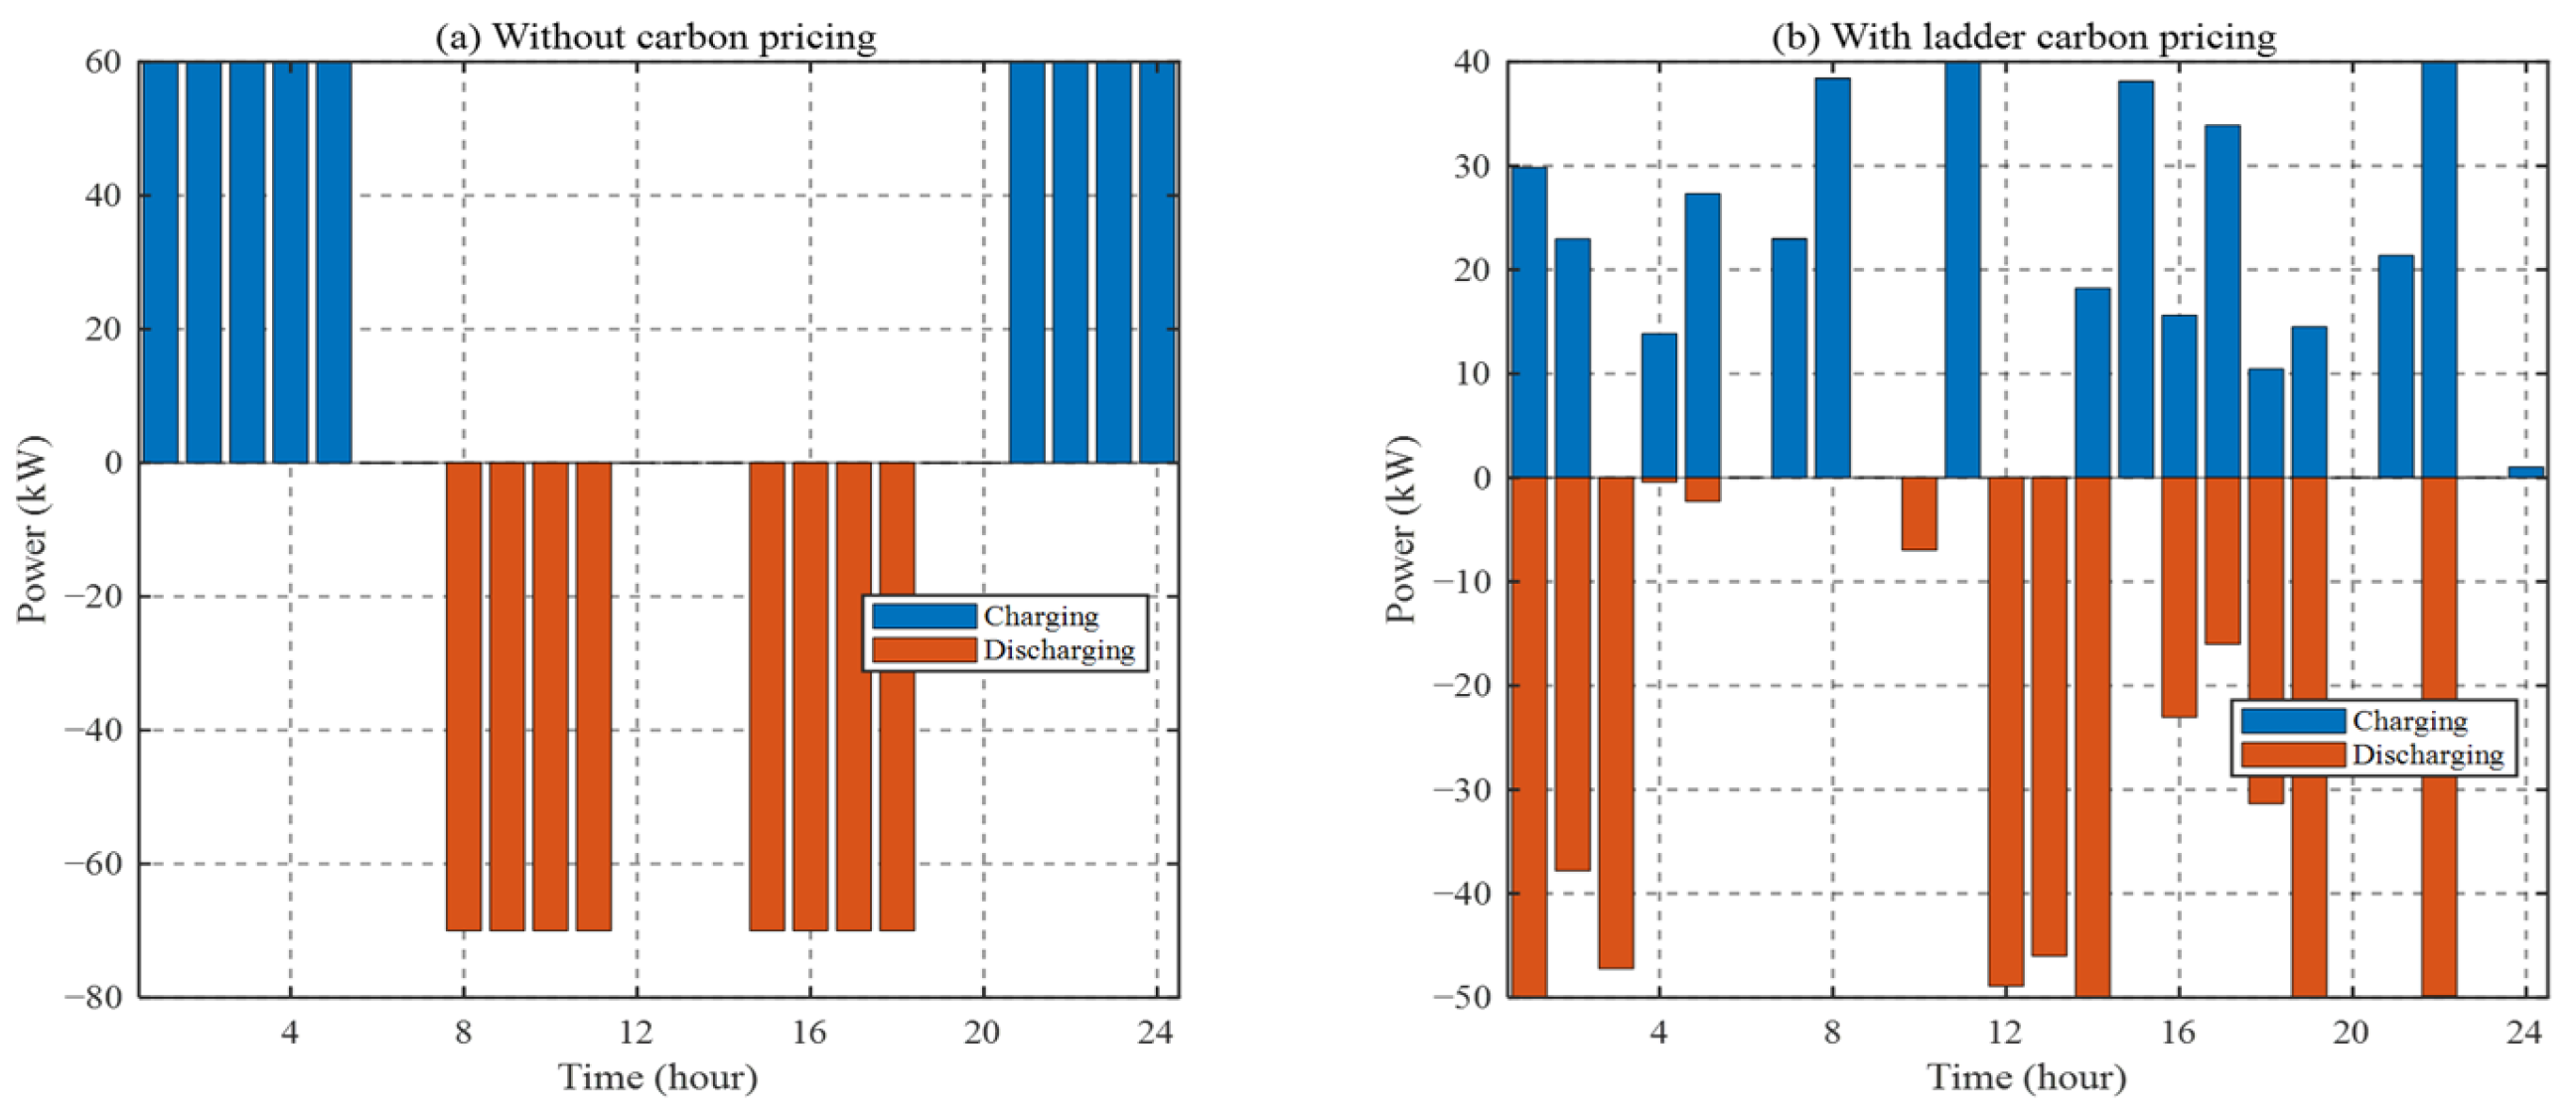
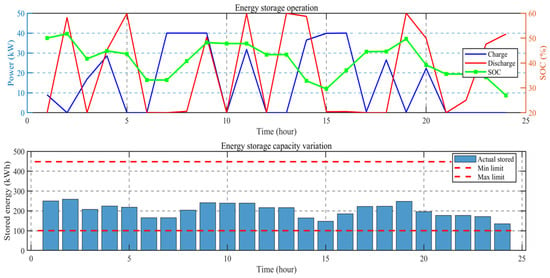
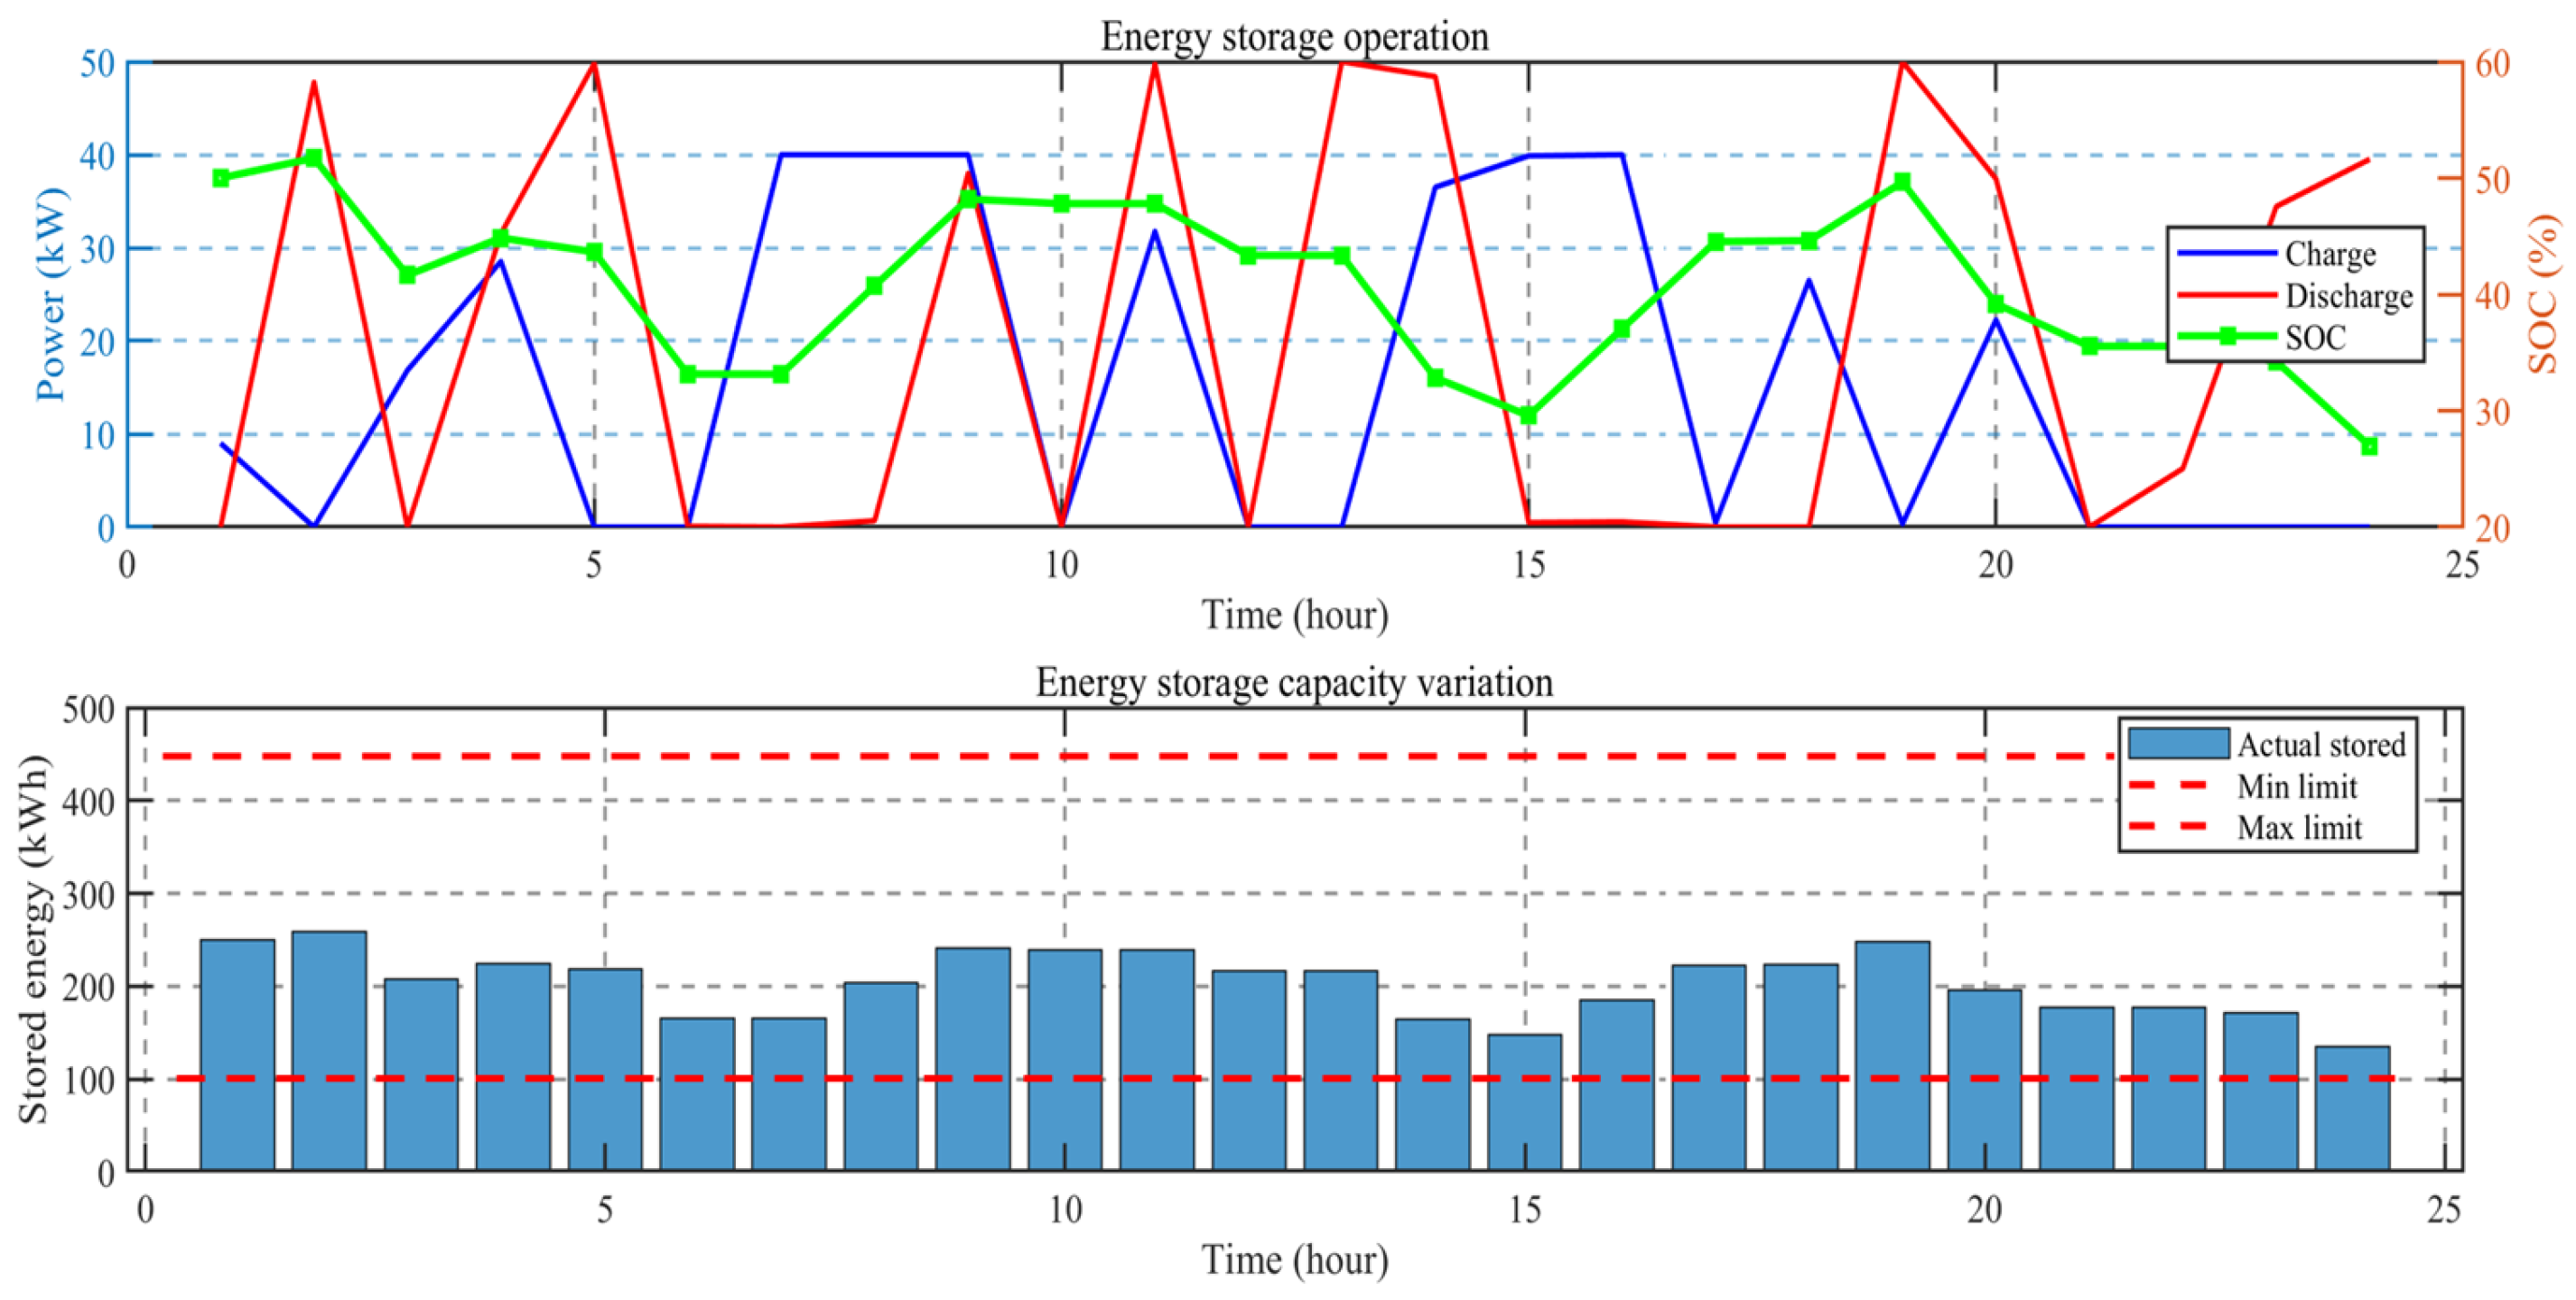
Figure 5 illustrates the charging and discharging power profiles of the ESS with and without the stepped carbon price. In the absence of a carbon price, the storage strategy is entirely driven by electricity pricing: charging during off-peak periods and discharging during peak periods, representing a typical economic arbitrage mode. Under these conditions, the IMOPSO algorithm only needs to balance operational costs and energy efficiency, resulting in relatively straightforward storage behavior.
Figure 5.
Energy storage operation comparison.
Upon introducing the stepped carbon price, the algorithm must simultaneously weigh three conflicting objectives: operational costs, carbon trading costs, and renewable energy utilization. Driven by these multi-objective constraints, the behavior of the ESS undergoes a fundamental transformation. While retaining partial economic arbitrage functions, the ESS actively charges during the midday PV output peak to absorb renewable energy that might otherwise be curtailed. It then discharges before the evening load peak to partially offset the output of the gas turbine (PGU).
The rationale behind this shift is that under the stepped carbon pricing mechanism, operating the PGU during peak hours significantly drives up carbon emissions, potentially triggering a higher carbon price tier. During the solution process, the IMOPSO algorithm adjusts its strategy by utilizing the ESS to shift surplus midday solar energy to the evening. This effectively reduces the PGU output, avoids crossing into high-cost carbon tiers, and achieves an optimal trade-off among the three objectives. Consequently, the ESS transitions from a mere economic arbitrage tool to a “carbon buffer”—a pivotal role shift dictated by the IMOPSO algorithm’s optimization logic.
6.4. Comparison of Five Equipment Configuration Scenarios
To evaluate the comprehensive benefits of multi-energy coordination, five equipment configuration scenarios were comparatively analyzed. All scenarios employed the IMOPSO algorithm to solve the multi-objective optimization problem, differing only in the permissible combinations of equipment.
- Scenario 1: Only grid electricity purchase is allowed.
- Scenario 2: PGU and grid purchase are allowed.
- Scenario 3: PGU, ESS, and grid purchase are allowed.
- Scenario 4: PGU, P2G, and grid purchase are allowed.
- Scenario 5: All equipment is available for optimization.
By comparing the compromise solutions on the Pareto frontiers across the five scenarios, the independent contributions and synergistic effects of each component can be quantified.
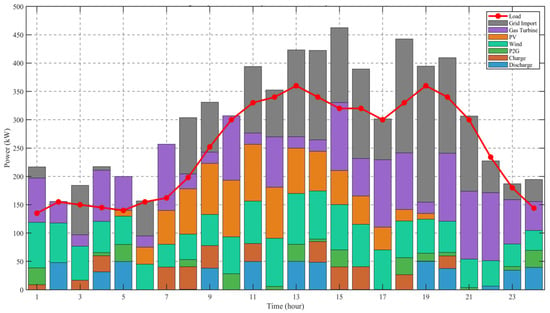
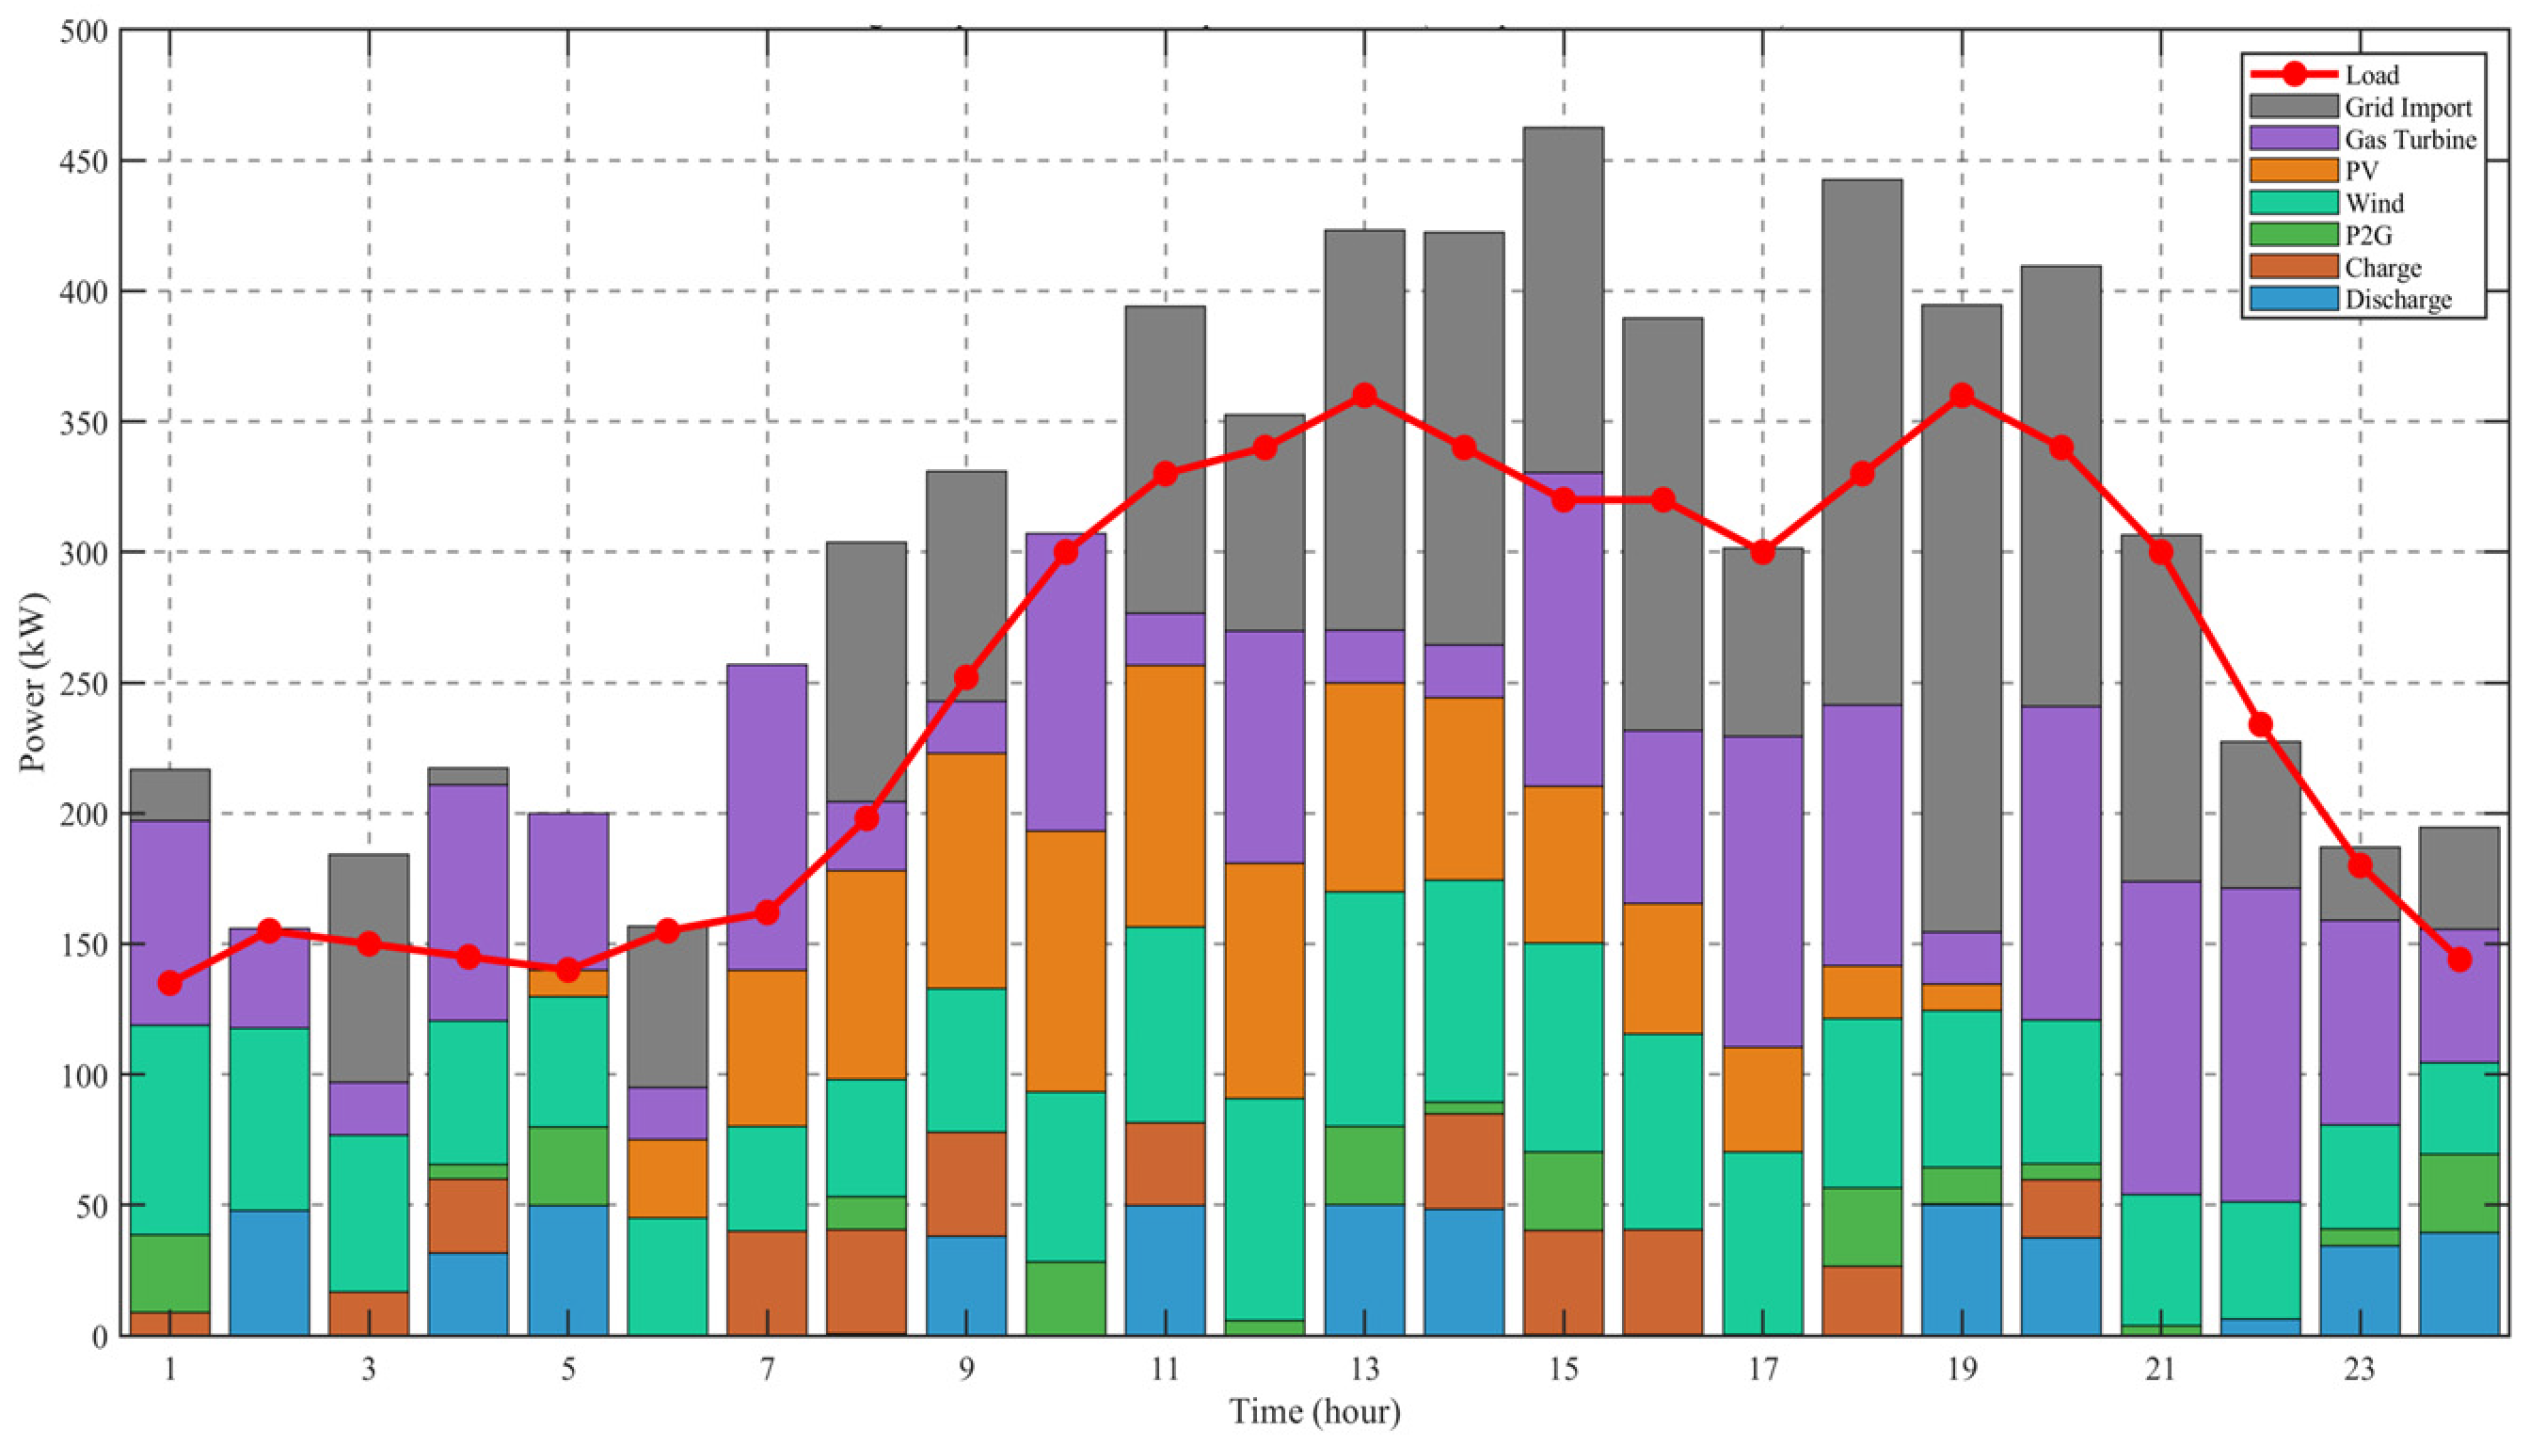
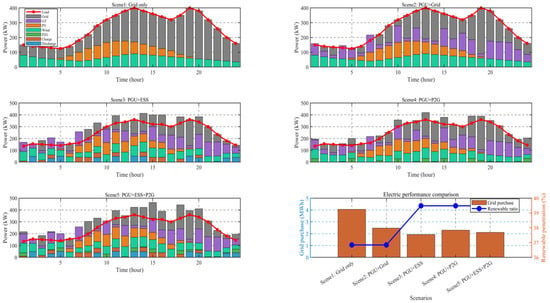
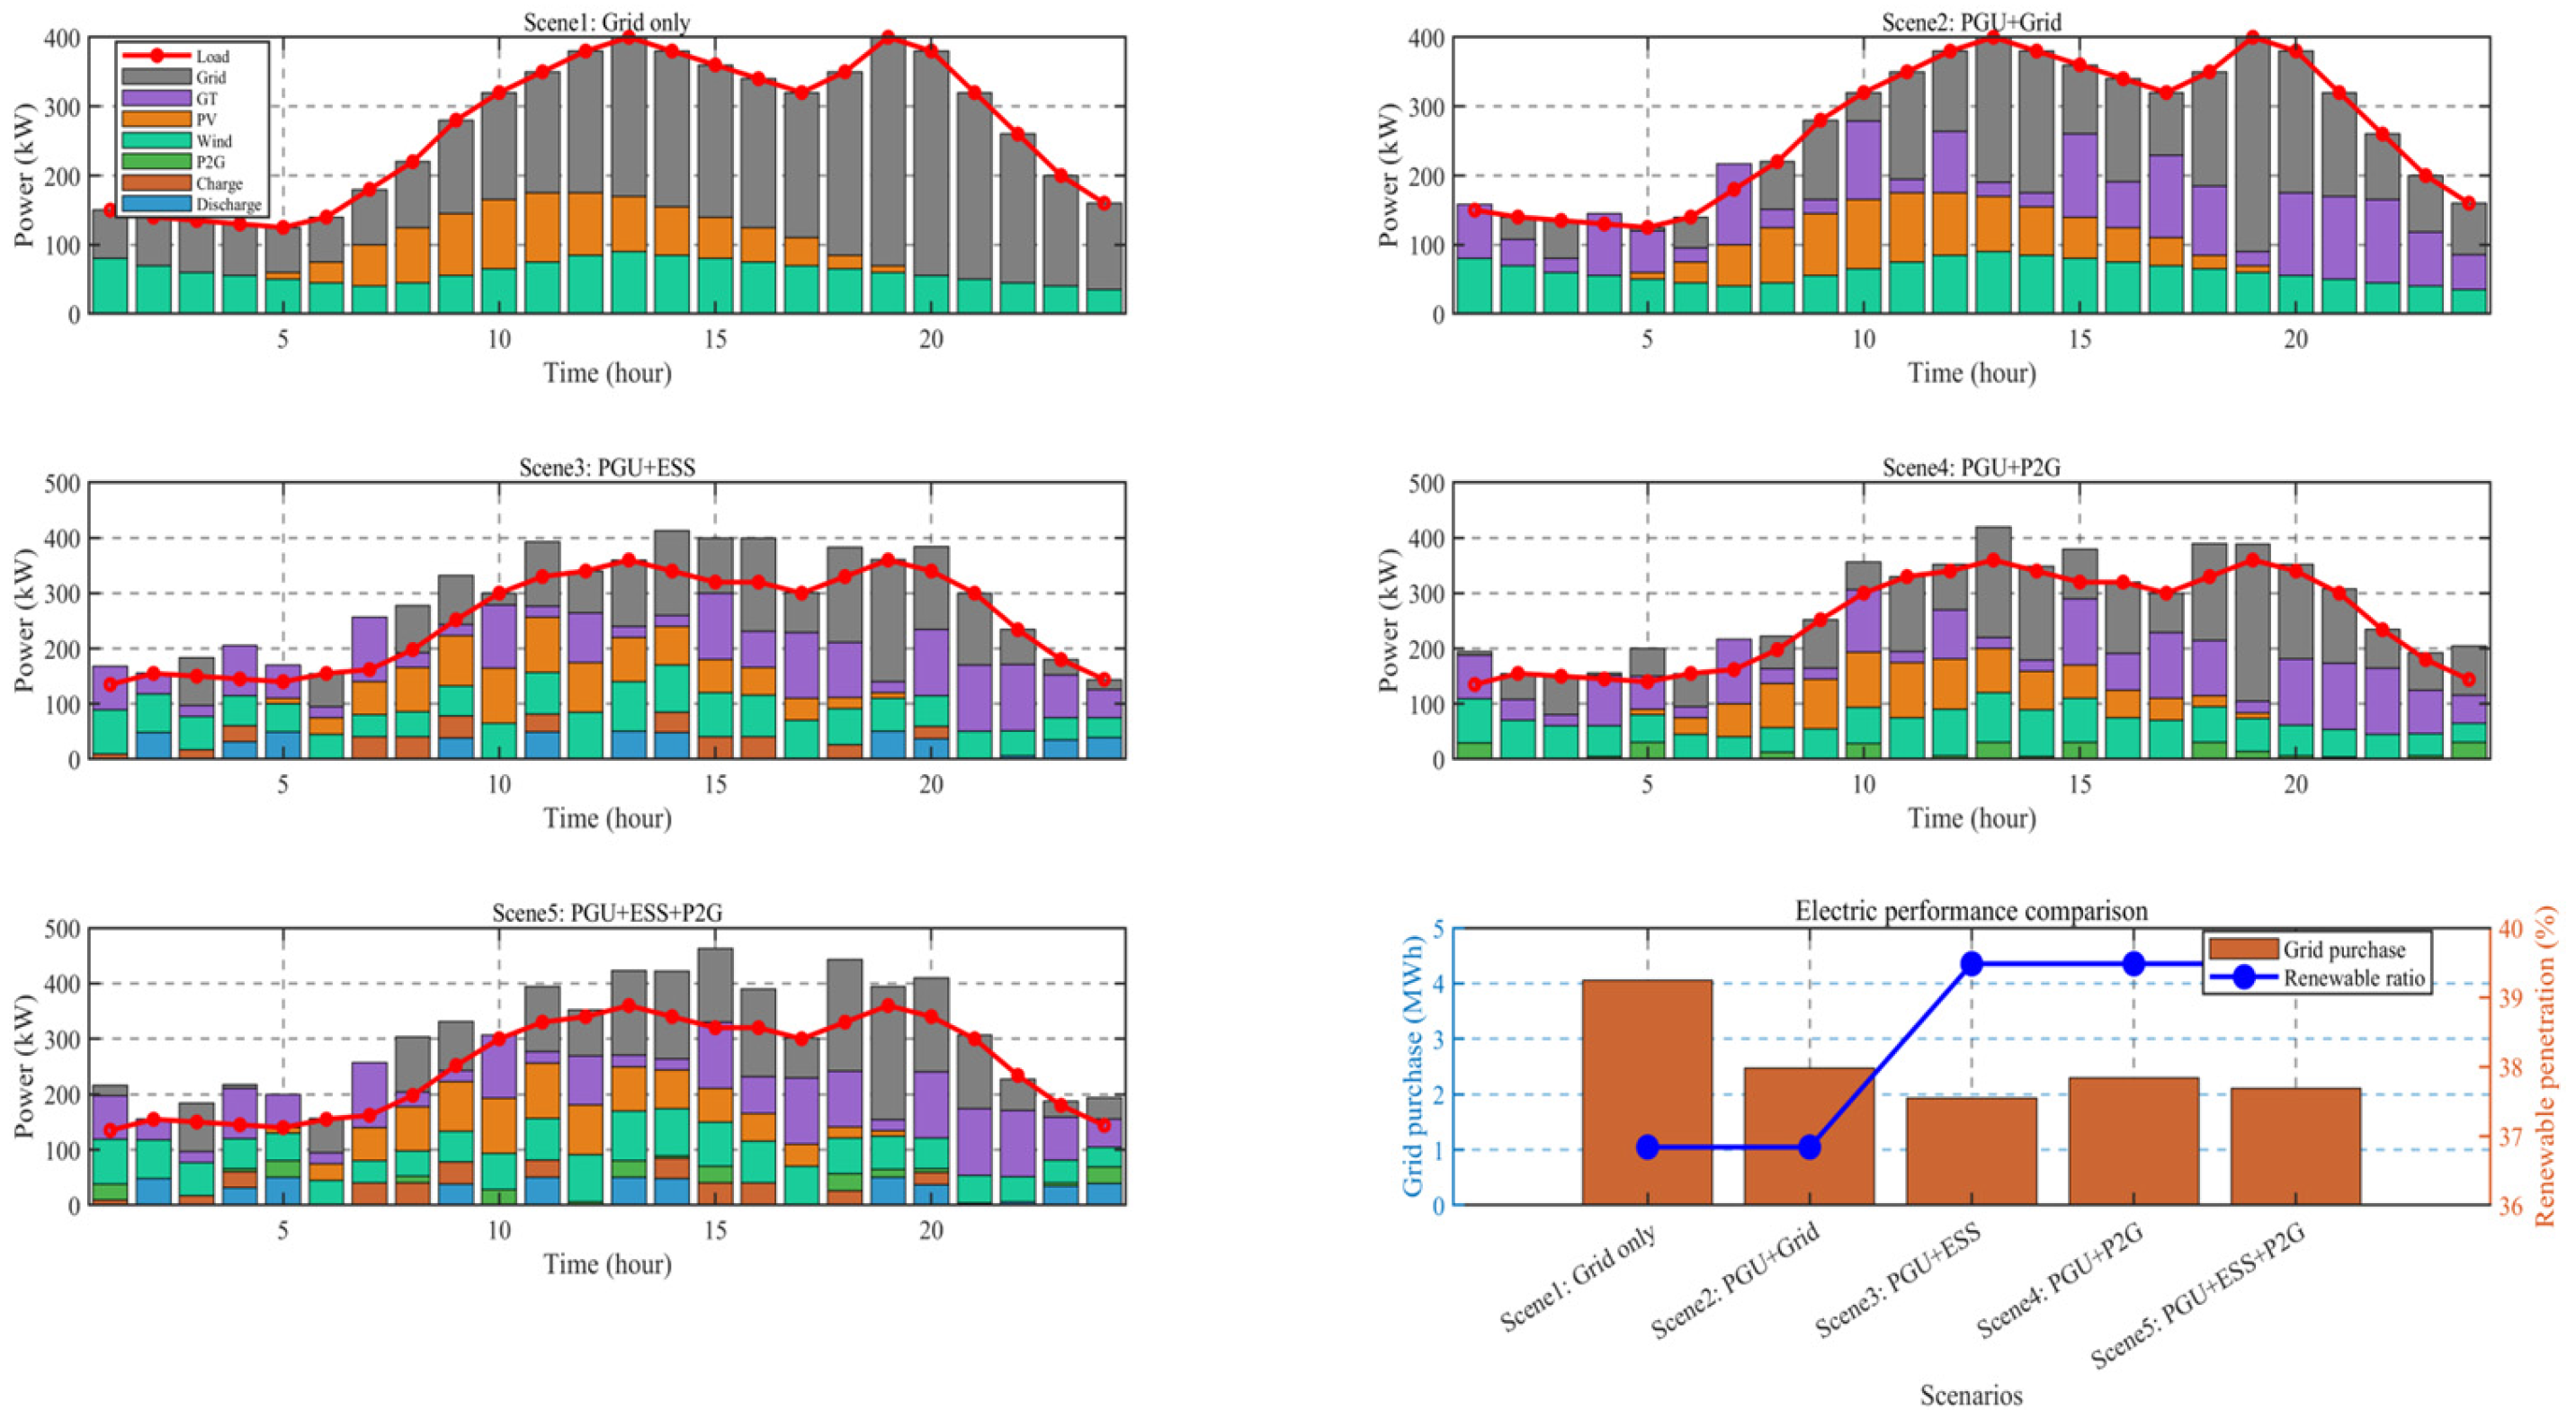
Figure 6 illustrates the electric power balance across the five scenarios. Scenario 1 relies entirely on the grid; load fluctuations are fully absorbed by the external grid, resulting in a zero system self-sufficiency rate. In Scenario 2, with the introduction of the PGU, the IMOPSO algorithm automatically schedules PGU output during peak electricity price periods to replace expensive grid purchases. While grid dependence is significantly reduced, the PGU output leads to elevated carbon emissions. In Scenario 3, the integration of the ESS enables the algorithm to implement energy time-shifting: charging during midday PV surpluses and discharging during evening load peaks. This creates a profound peak-shaving and valley-filling effect, further reducing both grid purchases and PGU output. Scenario 4 utilizes P2G instead of an ESS; the algorithm activates P2G to convert surplus wind power into natural gas. However, due to its limited power regulation capacity, P2G is less flexible than the ESS in responding to peak–valley fluctuations. Scenario 5 integrates the advantages of both ESS and P2G. The IMOPSO algorithm simultaneously leverages the rapid response of the ESS and the cross-temporal energy transfer capability of P2G, minimizing grid purchases and maximizing the accommodation rate of renewable energy.
Figure 6.
Electric power balance for the five scenarios.
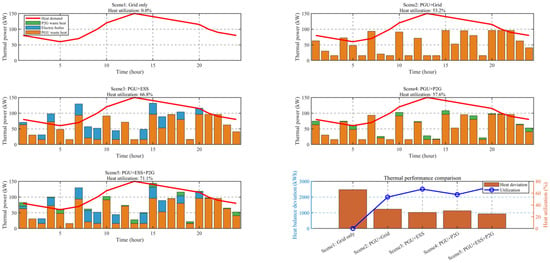
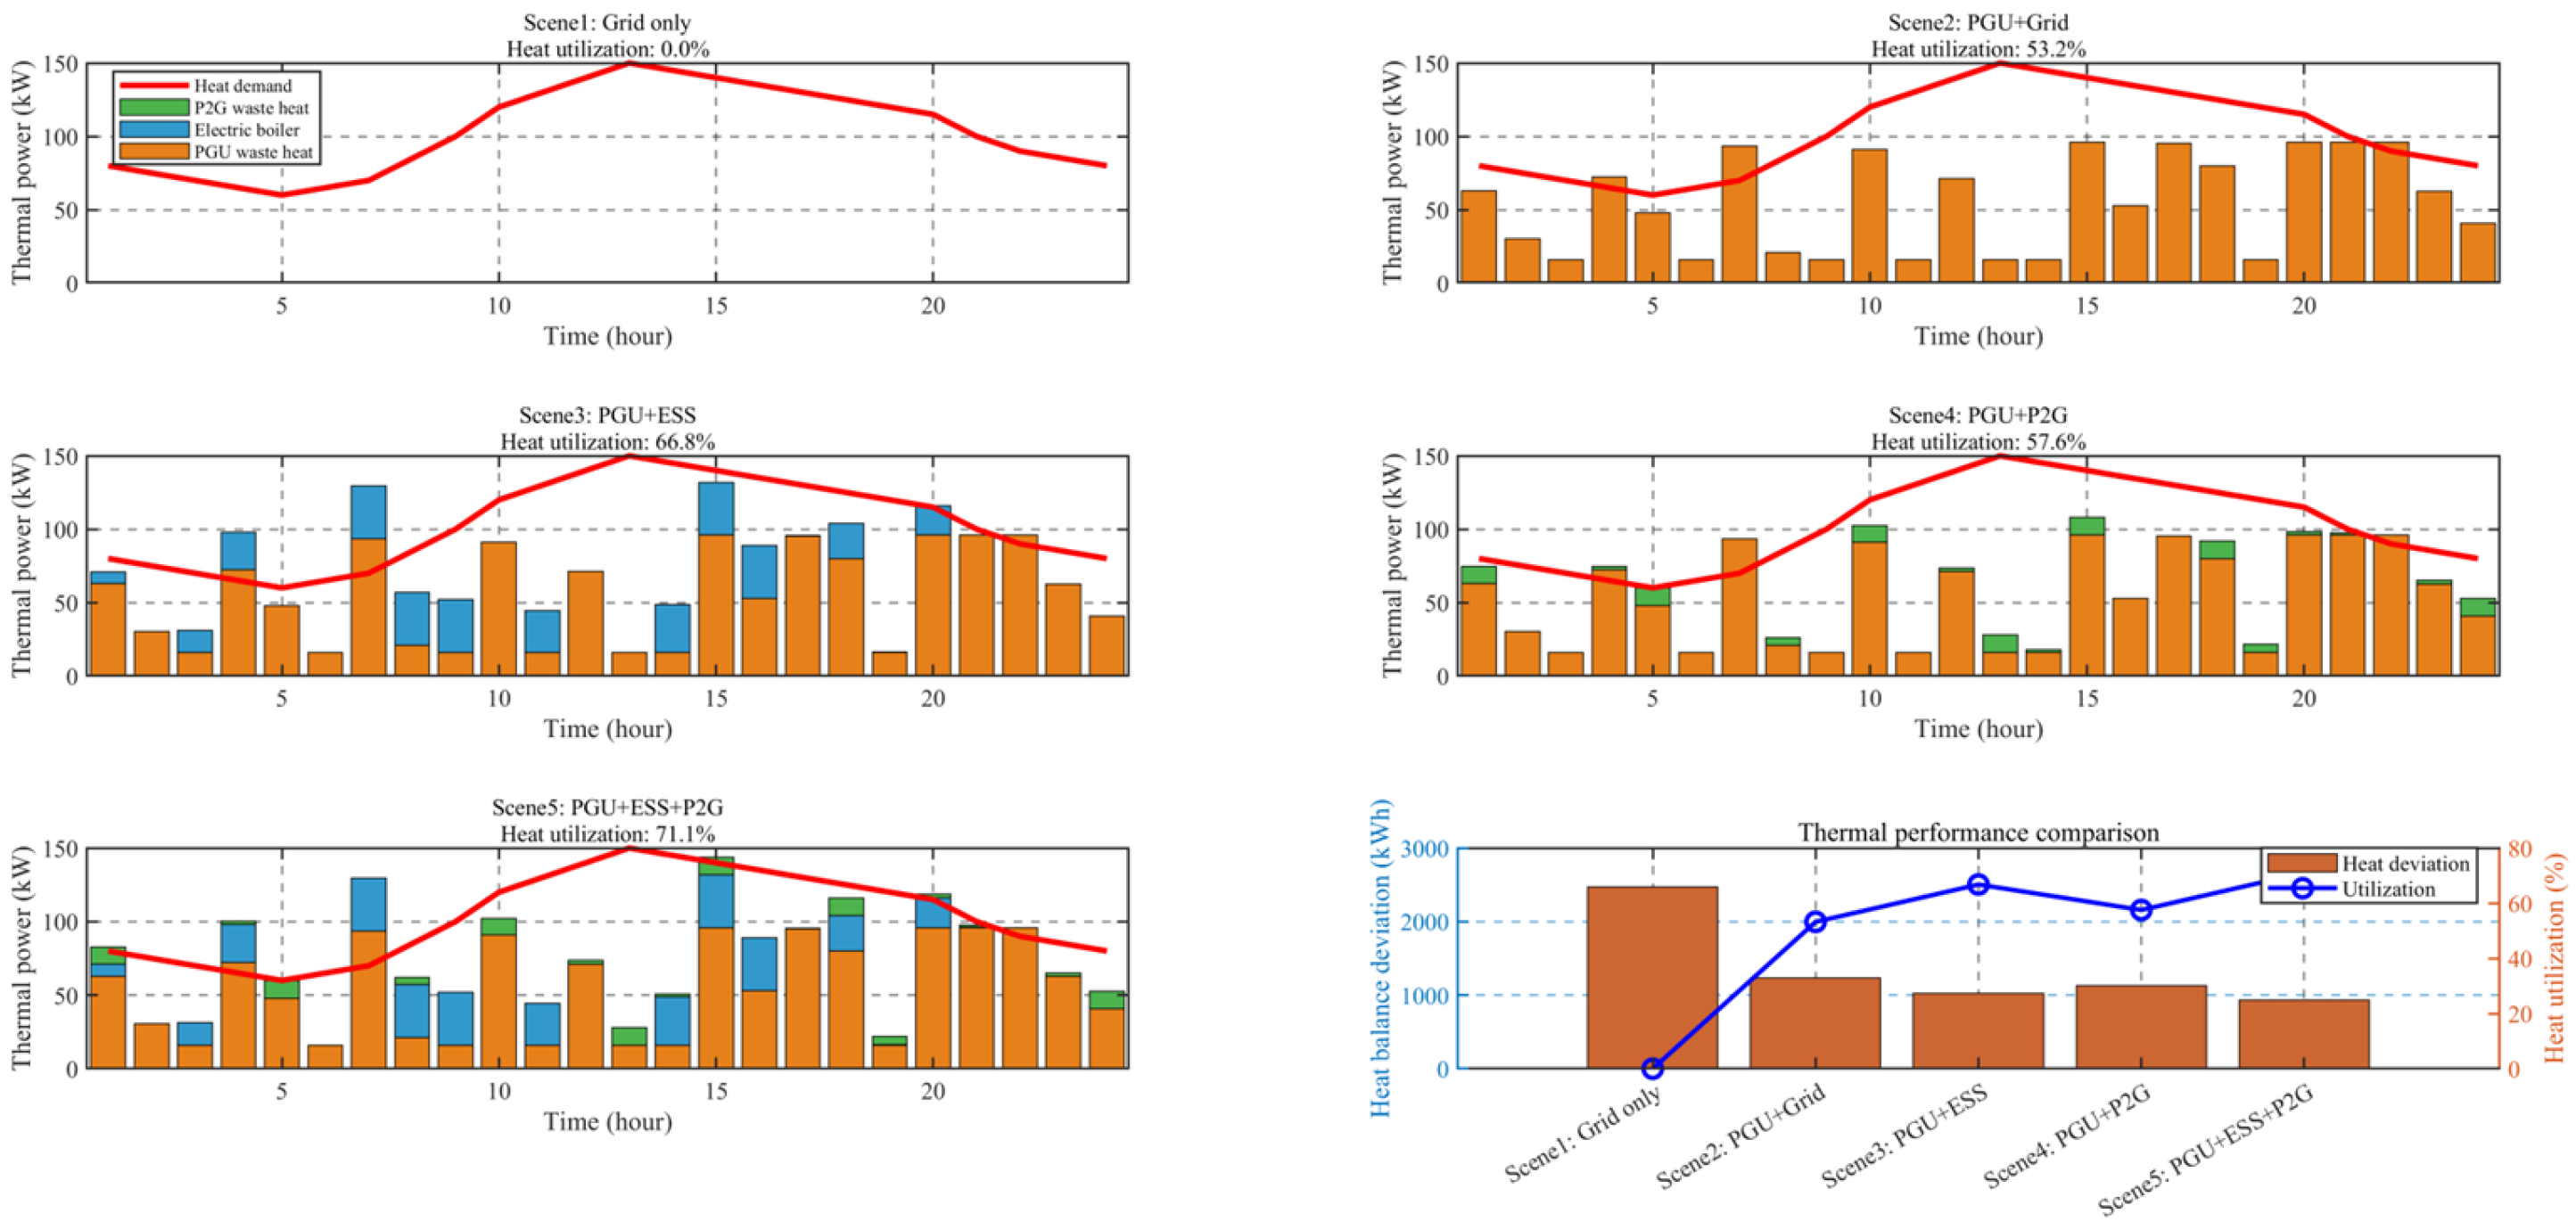
Figure 7 presents the thermal power balance. Scenario 1 lacks waste heat sources, leaving the thermal load entirely unmet. Scenario 2 utilizes PGU waste heat, achieving a thermal energy utilization rate of 57.3%. Scenario 3 incorporates an electric boiler; when optimizing charging strategies, the algorithm simultaneously accounts for electro-thermal demand, boosting the utilization rate to 78.3%. Scenario 4 employs P2G waste heat for supplementary heating but lacks the electric boiler, resulting in a 62.7% utilization rate. Scenario 5 comprehensively integrates PGU waste heat, the electric boiler, and P2G waste heat. By trading off the three objectives, the IMOPSO algorithm optimally configures the output of each heat source, achieving a peak thermal energy utilization rate of 83.7%.
Figure 7.
Thermal power balance for the five scenarios.
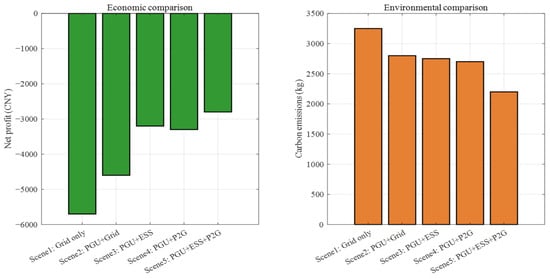
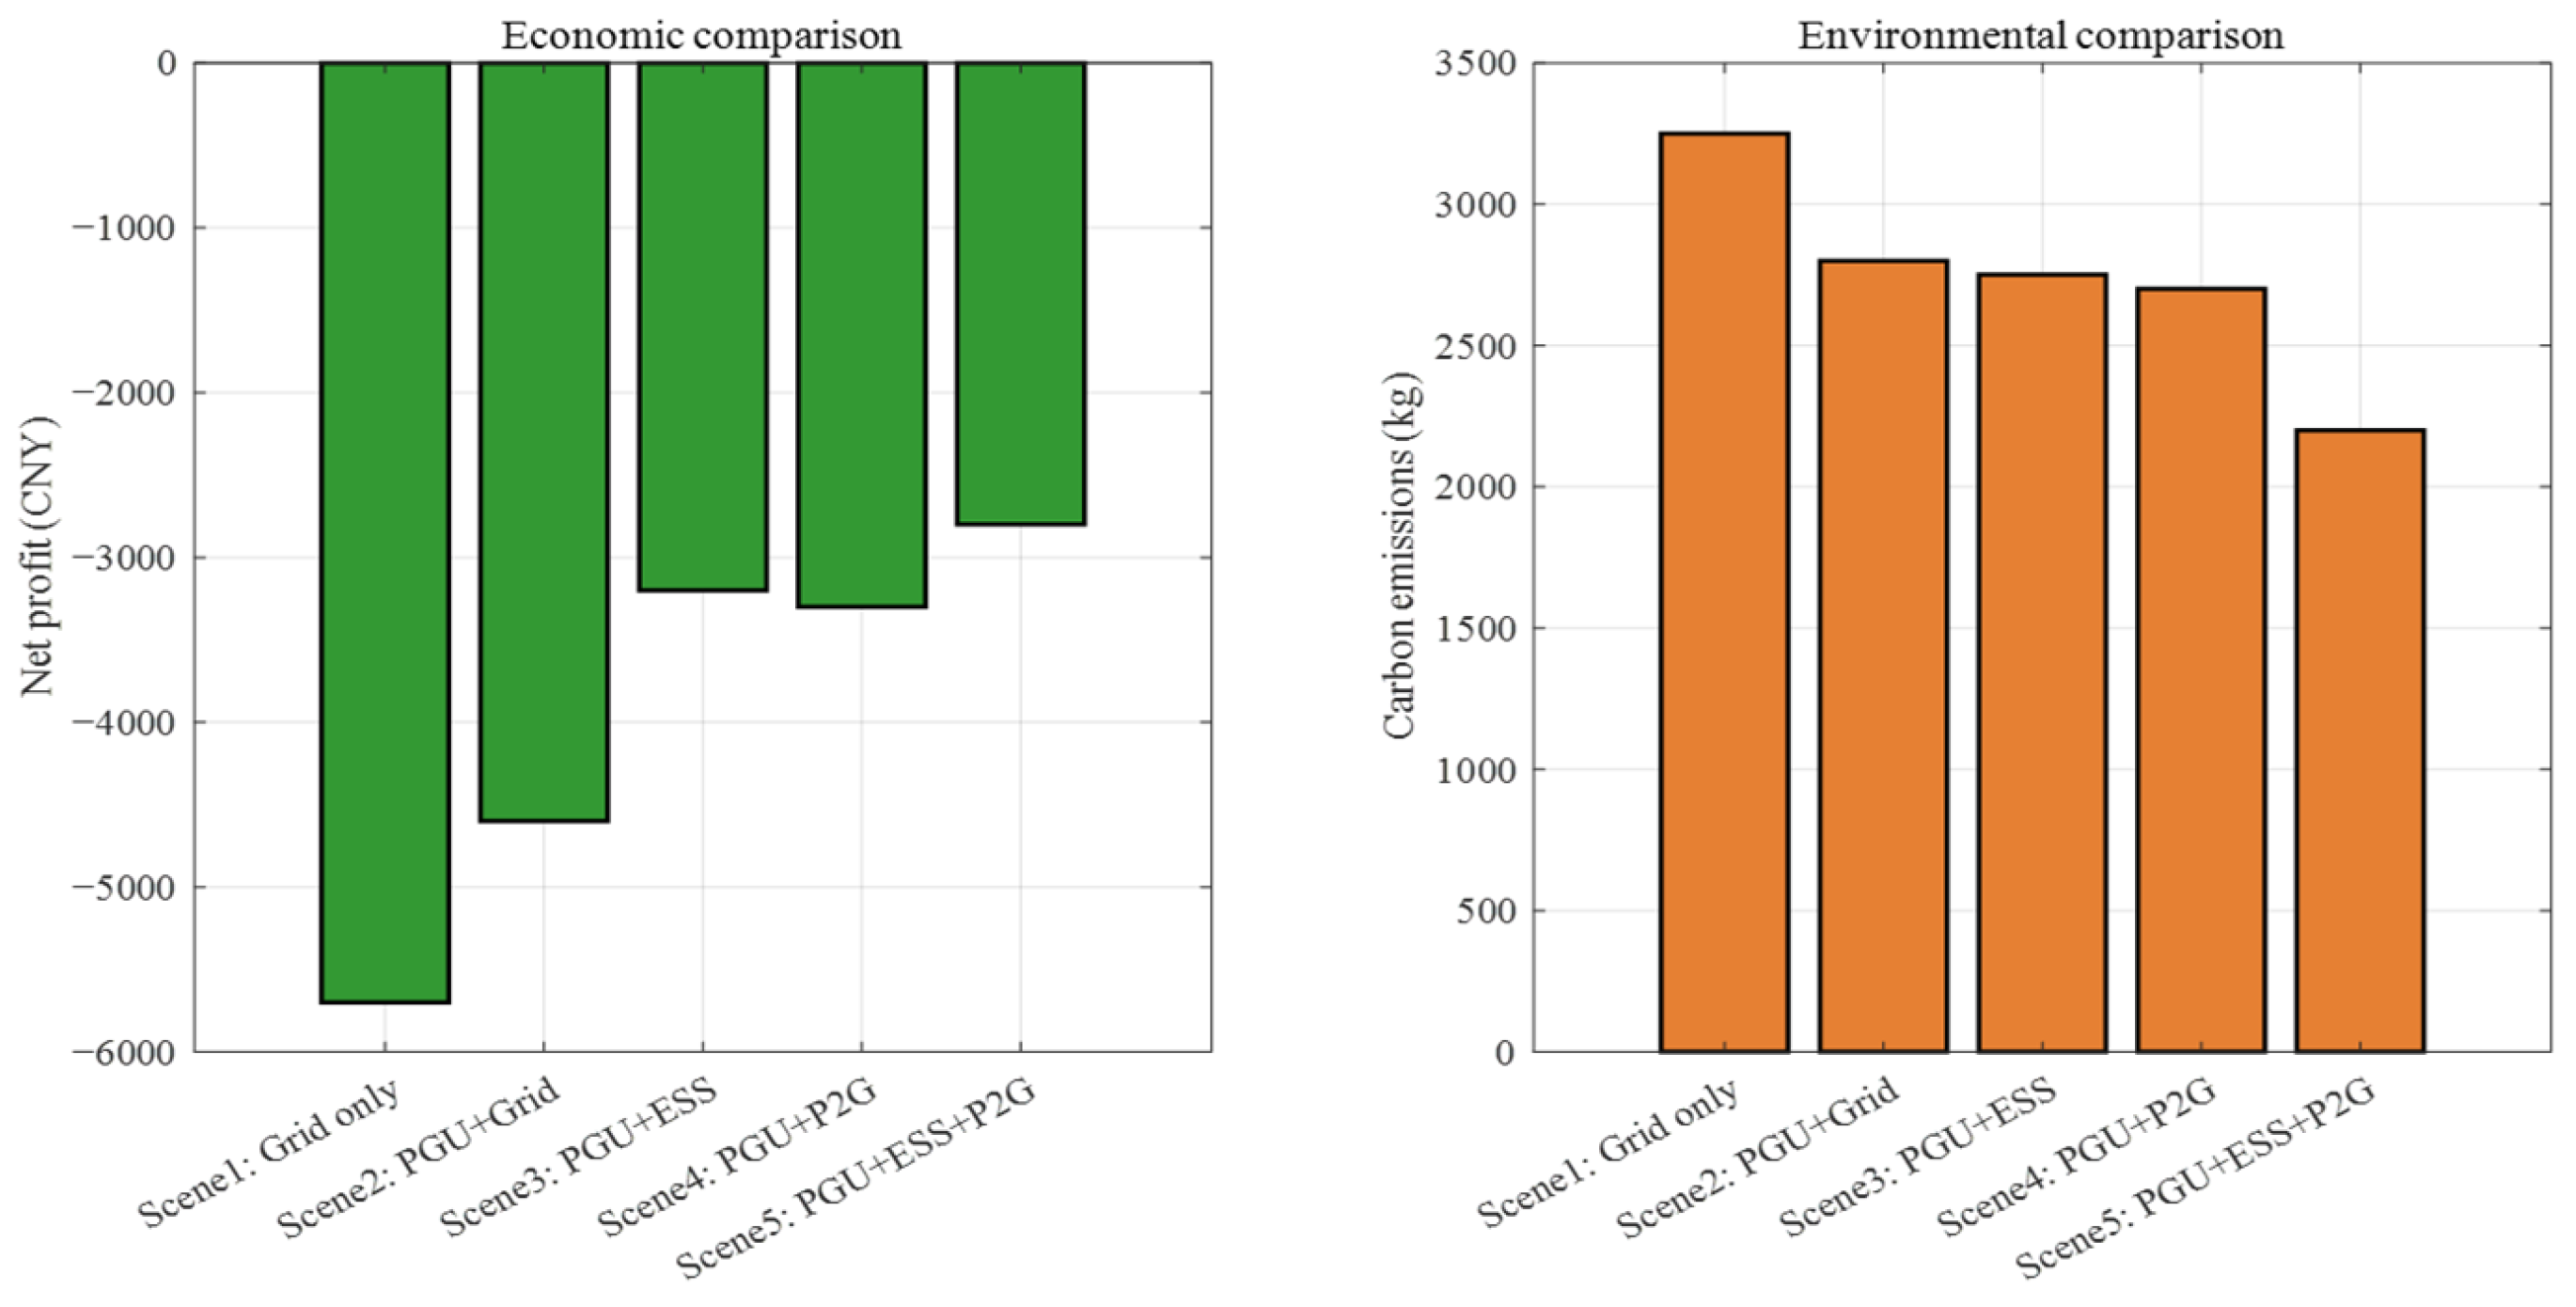
Figure 8 compares the economic performance and carbon emissions across the scenarios. Scenario 5 outperformed all others, yielding a net profit of −2315 CNY and carbon emissions of 2156 kg. Notably, compared to Scenario 3 (2381 kg) and Scenario 4 (2608 kg), the carbon emissions in Scenario 5 were reduced by 9.4% and 17.3%, respectively. Meanwhile, its net profit improved by 20.0% over Scenario 3 and 29.7% over Scenario 4. This robustly demonstrates the profound synergistic effect of the joint ESS-P2G operation. The IMOPSO algorithm successfully orchestrates the short-term regulation capability of the ESS and the long-term energy transfer of P2G, identifying a superior trade-off point that eclipses any single-equipment configuration. Figure 9 validates the optimized charge/discharge strategies and SOC variations stimulated by carbon pricing.
Figure 8.
Economic and environmental performance of the five scenarios.
Figure 9.
ESS operational state analysis.
Beyond the descriptive performance metrics presented above, the underlying reason for the significant performance differences across the evaluated scenarios lies in the synergistic coupling between the physical components (P2G and ESS) and the economic policy (stepped carbon pricing). In scenarios without P2G or ESS, the system strictly follows a “source-follows-load” rigidity, forcing high-emission units to ramp up during peak hours, inevitably triggering severe stepped carbon penalties.
When the P2G and ESS are fully coordinated under the stepped pricing mechanism, the system behavior fundamentally shifts to a proactive “spatiotemporal energy shift”. Driven by the steep penalty gradients of the carbon policy, the algorithm dictates the ESS to charge and the P2G to operate at maximum capacity during periods of abundant renewable generation. This not only avoids wind/PV curtailment but also produces synthetic natural gas to offset grid purchases during peak demand. The performance leap in the fully coordinated scenario (Scenario 5) is not merely an arithmetic superposition of component efficiencies, but the result of the stepped carbon price acting as a powerful economic catalyst that fully unlocks the physical flexibility of the P2G–ESS architecture.
6.5. Performance Comparison Before and After Optimization
Focusing on the comprehensive configuration (Scenario 5), the system performance before and after optimization was compared. “Before optimization” refers to an initial, rule-based dispatch schedule (relying solely on grid purchases and simple logic) without multi-objective optimization, whereas “After optimization” represents the Pareto optimal compromise solution derived by the IMOPSO algorithm.
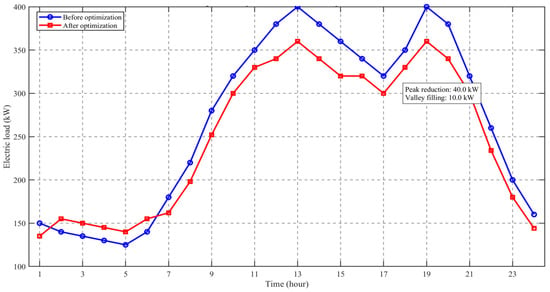
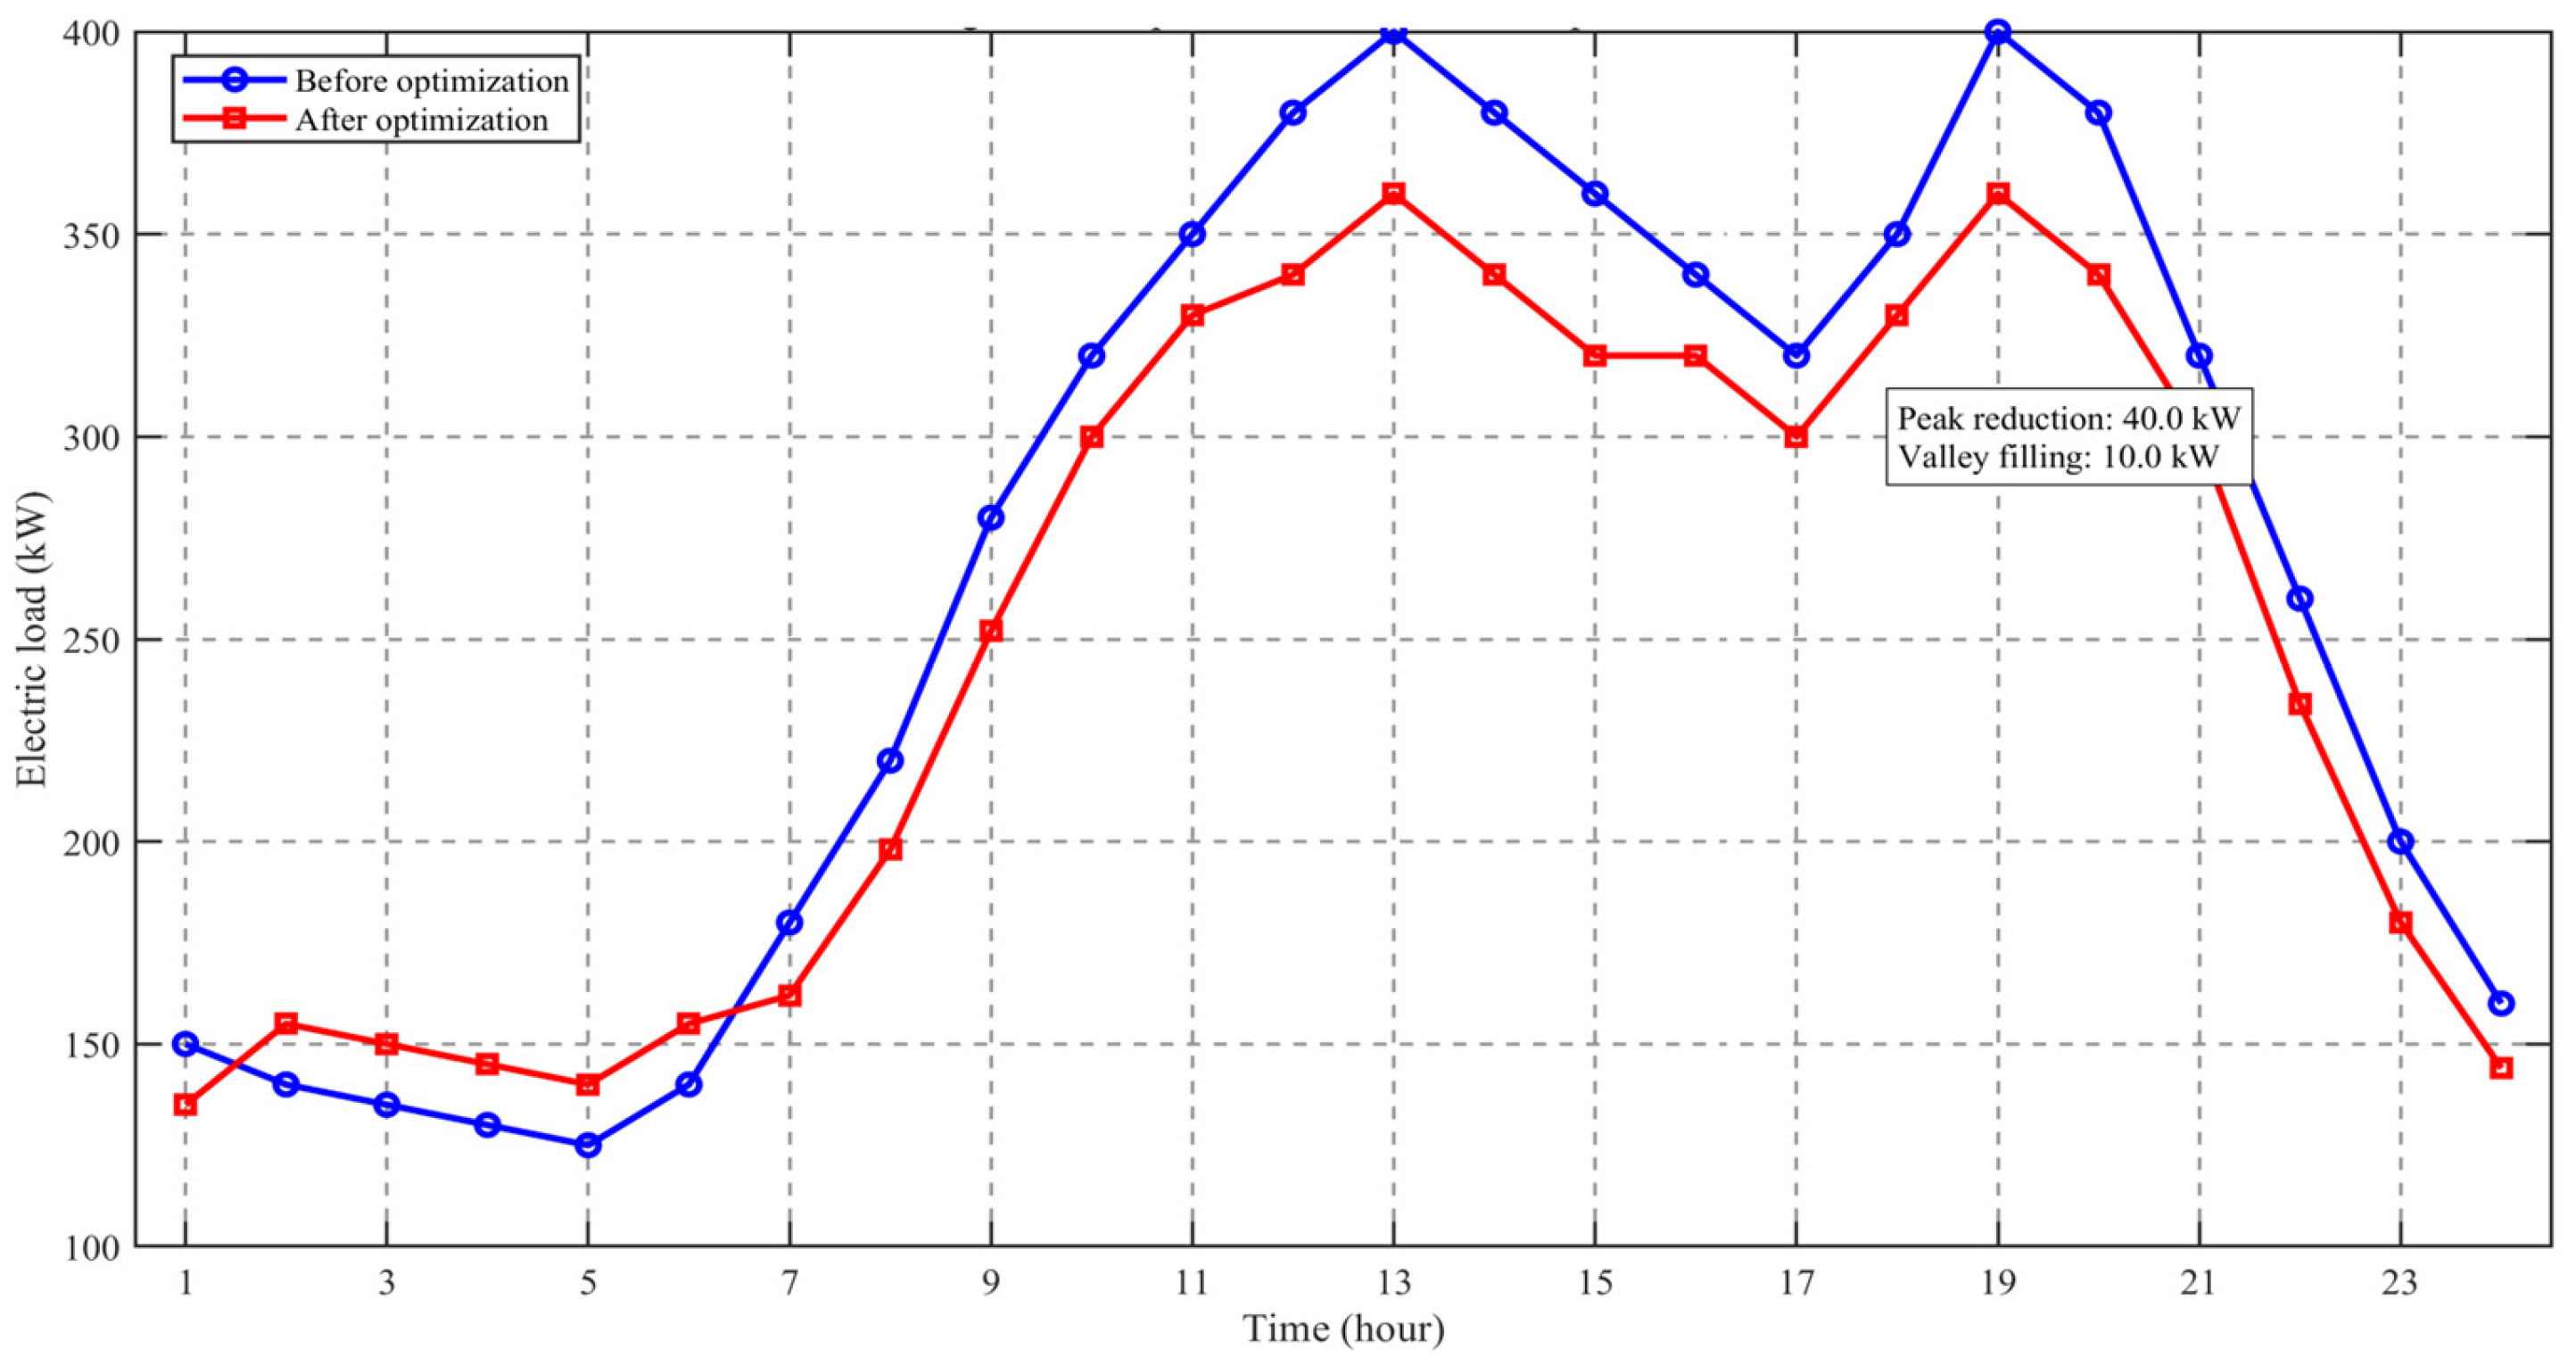
Figure 10 displays the load profiles. After optimization, the evening peak load is reduced from 400 kW to 360 kW (a peak shave of 40 kW), while the early morning valley load is raised from 125 kW to 135 kW (a valley fill of 10 kW). The peak-shaving and valley-filling effect is highly significant, narrowing the peak-to-valley difference from 275 kW to 225 kW—an 18.2% reduction. This improvement is primarily attributed to the IMOPSO algorithm’s ability to automatically identify optimal charging and discharging windows for the ESS, effectively smoothing the load curve.
Figure 10.
Load profile before and after optimization.
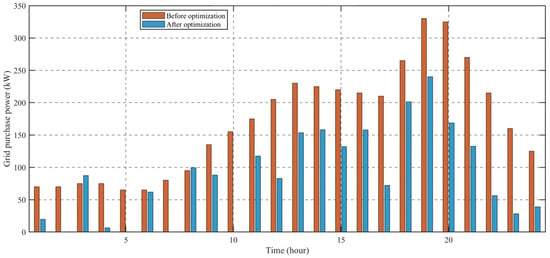
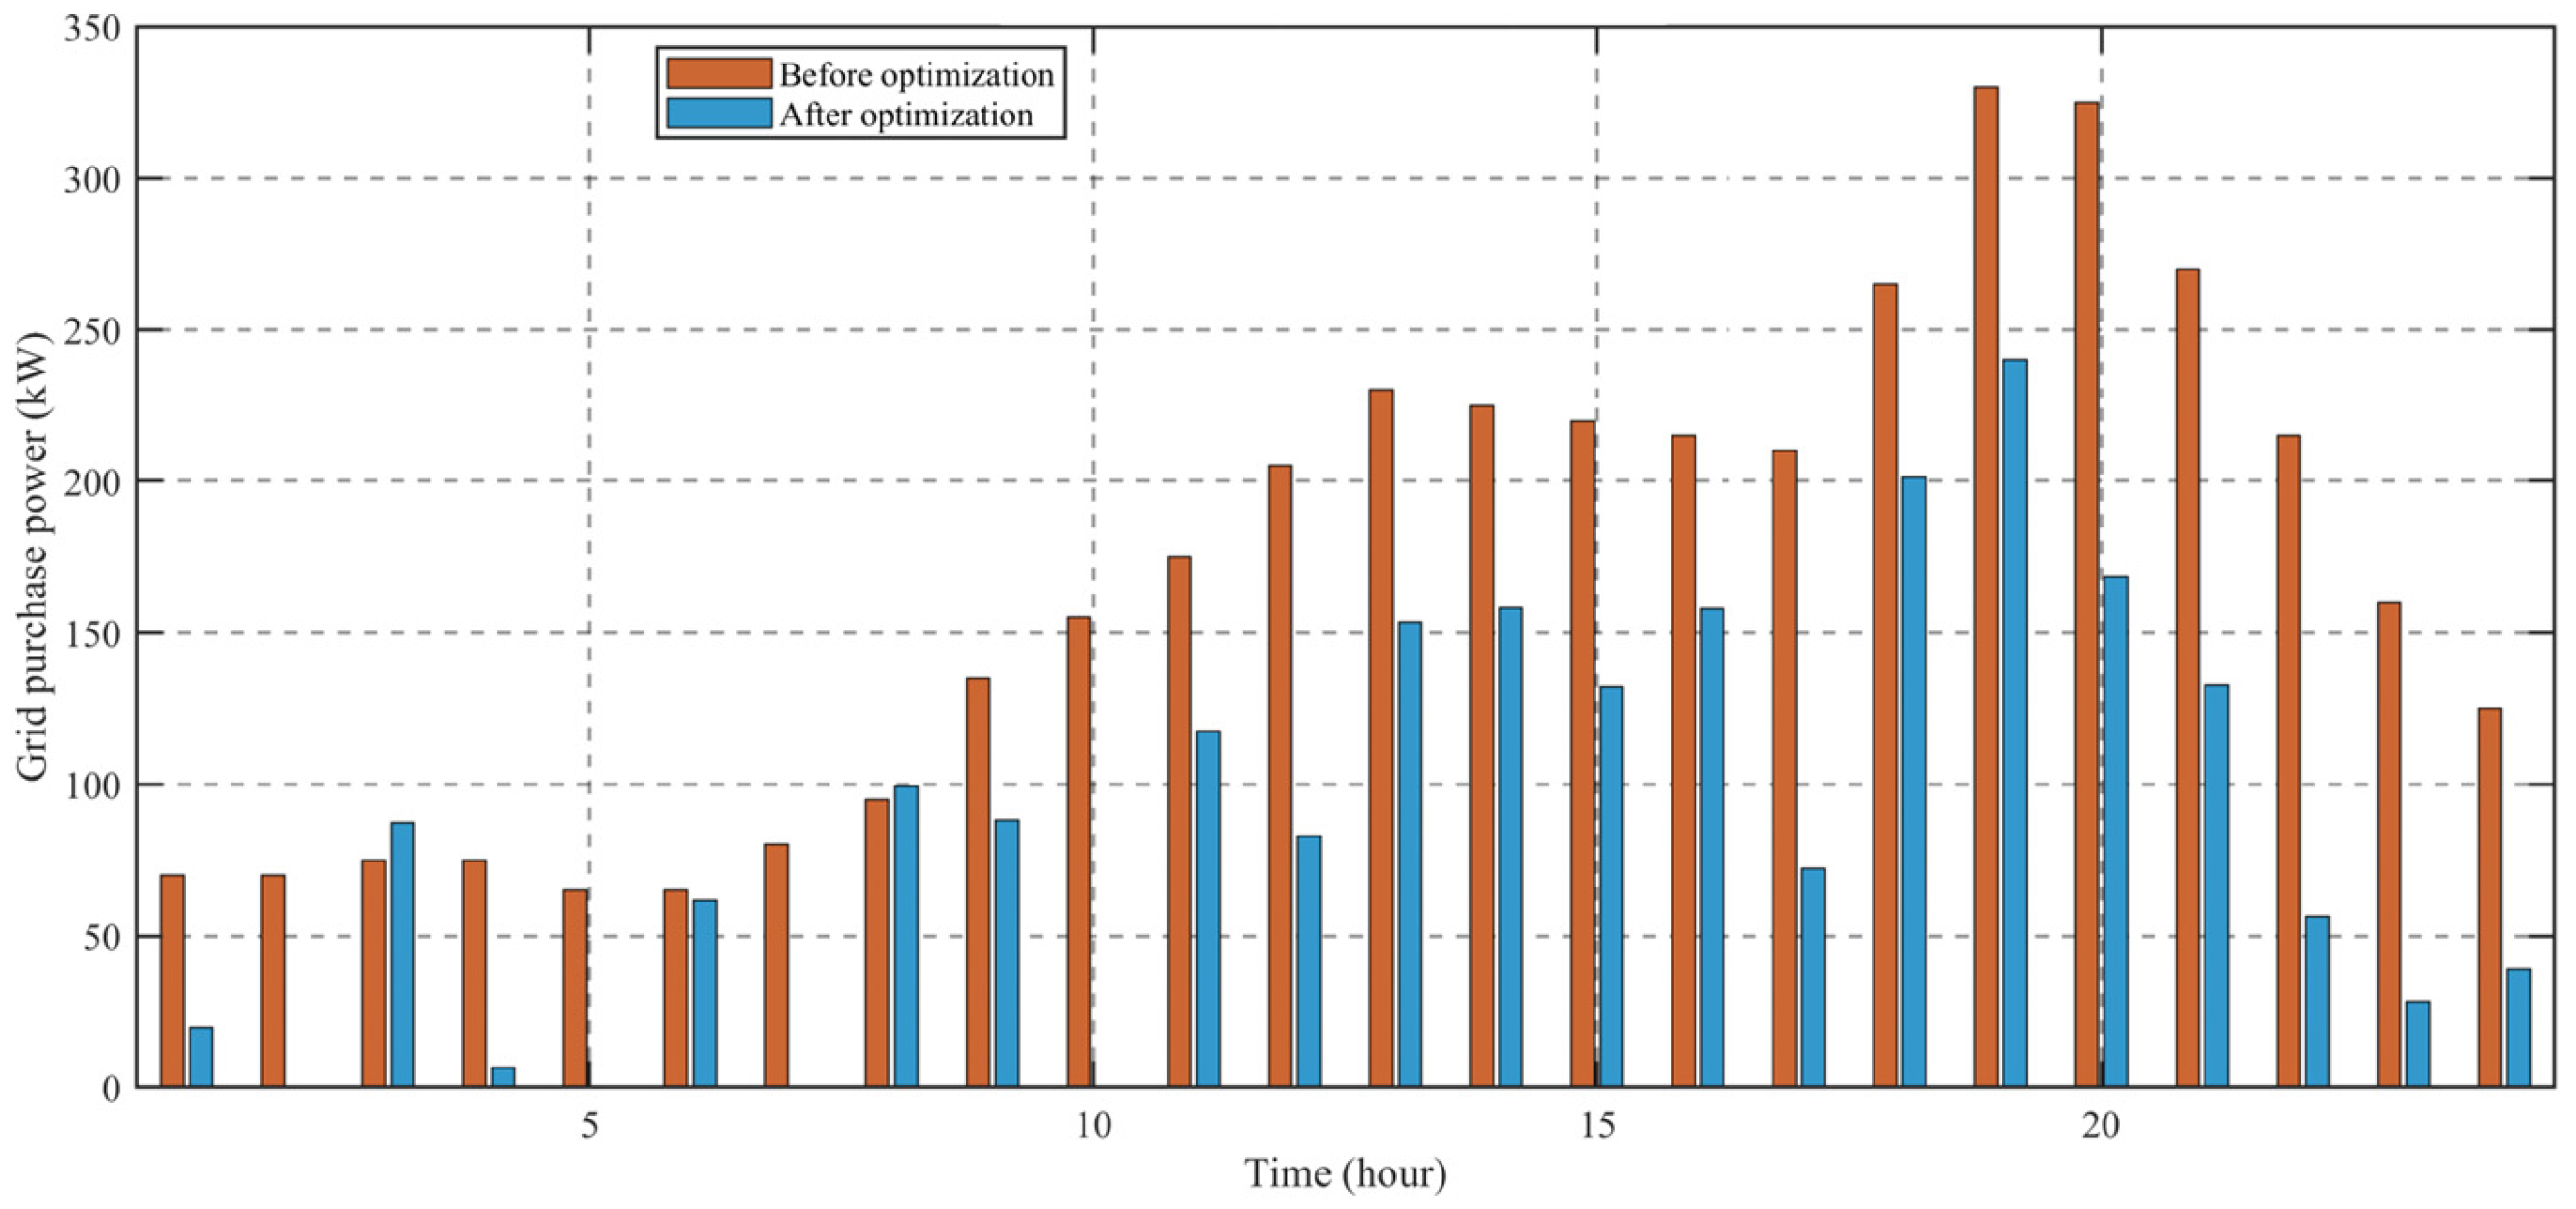
Figure 11 compares the grid purchase power. Before optimization, grid purchases soared to 400 kW during peak load periods, resulting in a massive total daily purchase. After optimization, grid purchases during peak periods plummeted, while off-peak purchases increased to charge the ESS. Consequently, the total daily grid purchase dropped by 23.7%. By balancing procurement costs and carbon emissions, the IMOPSO algorithm proactively shifts a portion of peak demand to off-peak hours, executing efficient energy time-shifting via the ESS.
Figure 11.
Grid purchase comparison.
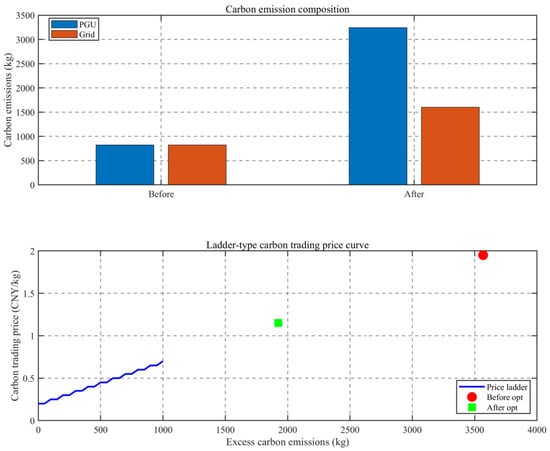
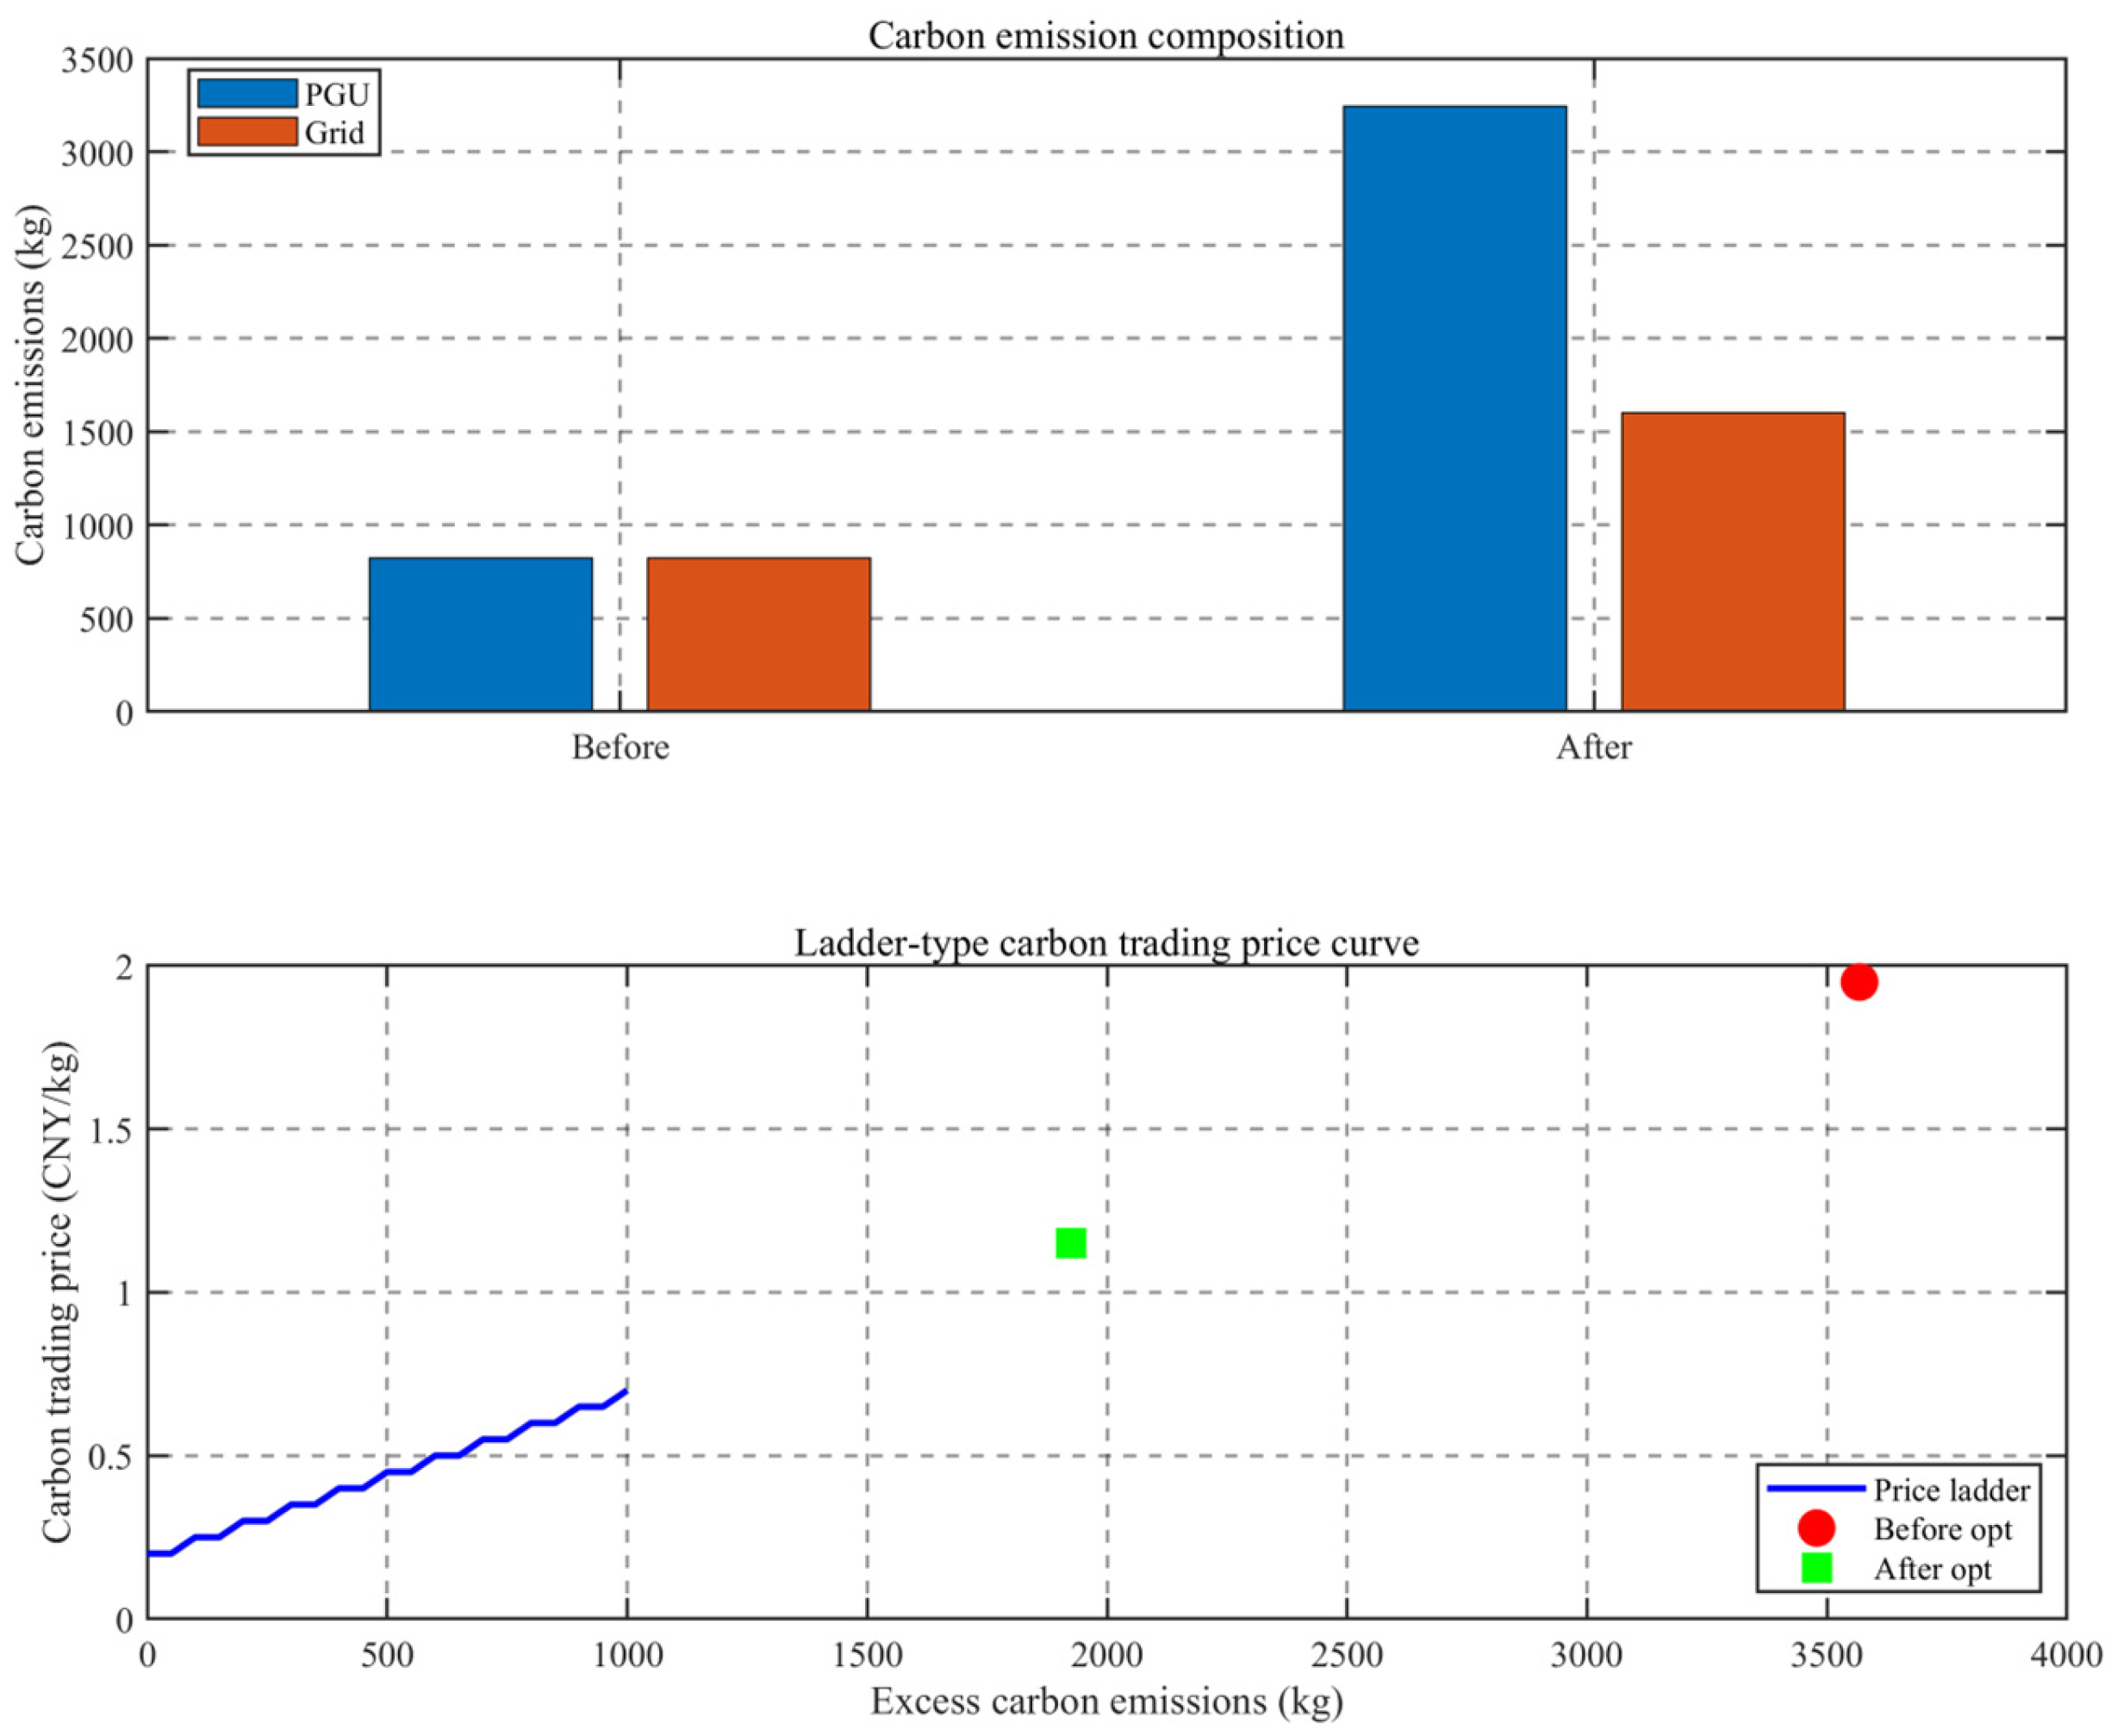
Figure 12a illustrates the composition of carbon emissions. Before optimization, emissions were dominated by grid purchases (accounting for approximately 60%). After optimization, grid-related emissions dropped drastically. Although the proportion of PGU emissions increased, the absolute total decreased, and P2G contributed to an 8% reduction in total emissions. Figure 12b depicts the stepped carbon price curve, mapping the price points corresponding to excess emissions before and after optimization. Initially, excess emissions reached 2130 kg, triggering the second pricing tier (0.3 CNY/kg). Post-optimization, excess emissions were suppressed to 1656 kg. While still within the second tier, the marginal costs were significantly curtailed. Consequently, the carbon trading cost plummeted from 3931 CNY to 2475 CNY, marking a 37.0% reduction. This dramatic shift highlights the IMOPSO algorithm’s acute sensitivity and agile response to the nonlinear structure of the stepped carbon price.
Figure 12.
Carbon emission and trading mechanism: (a) carbon emission composition; (b) stepped carbon trading price curve.
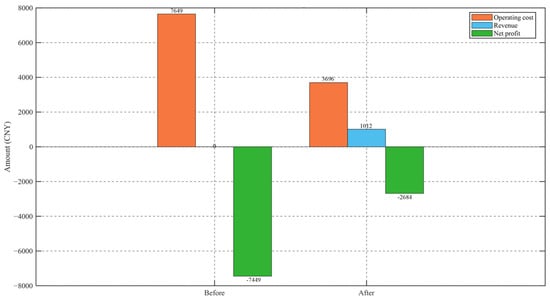
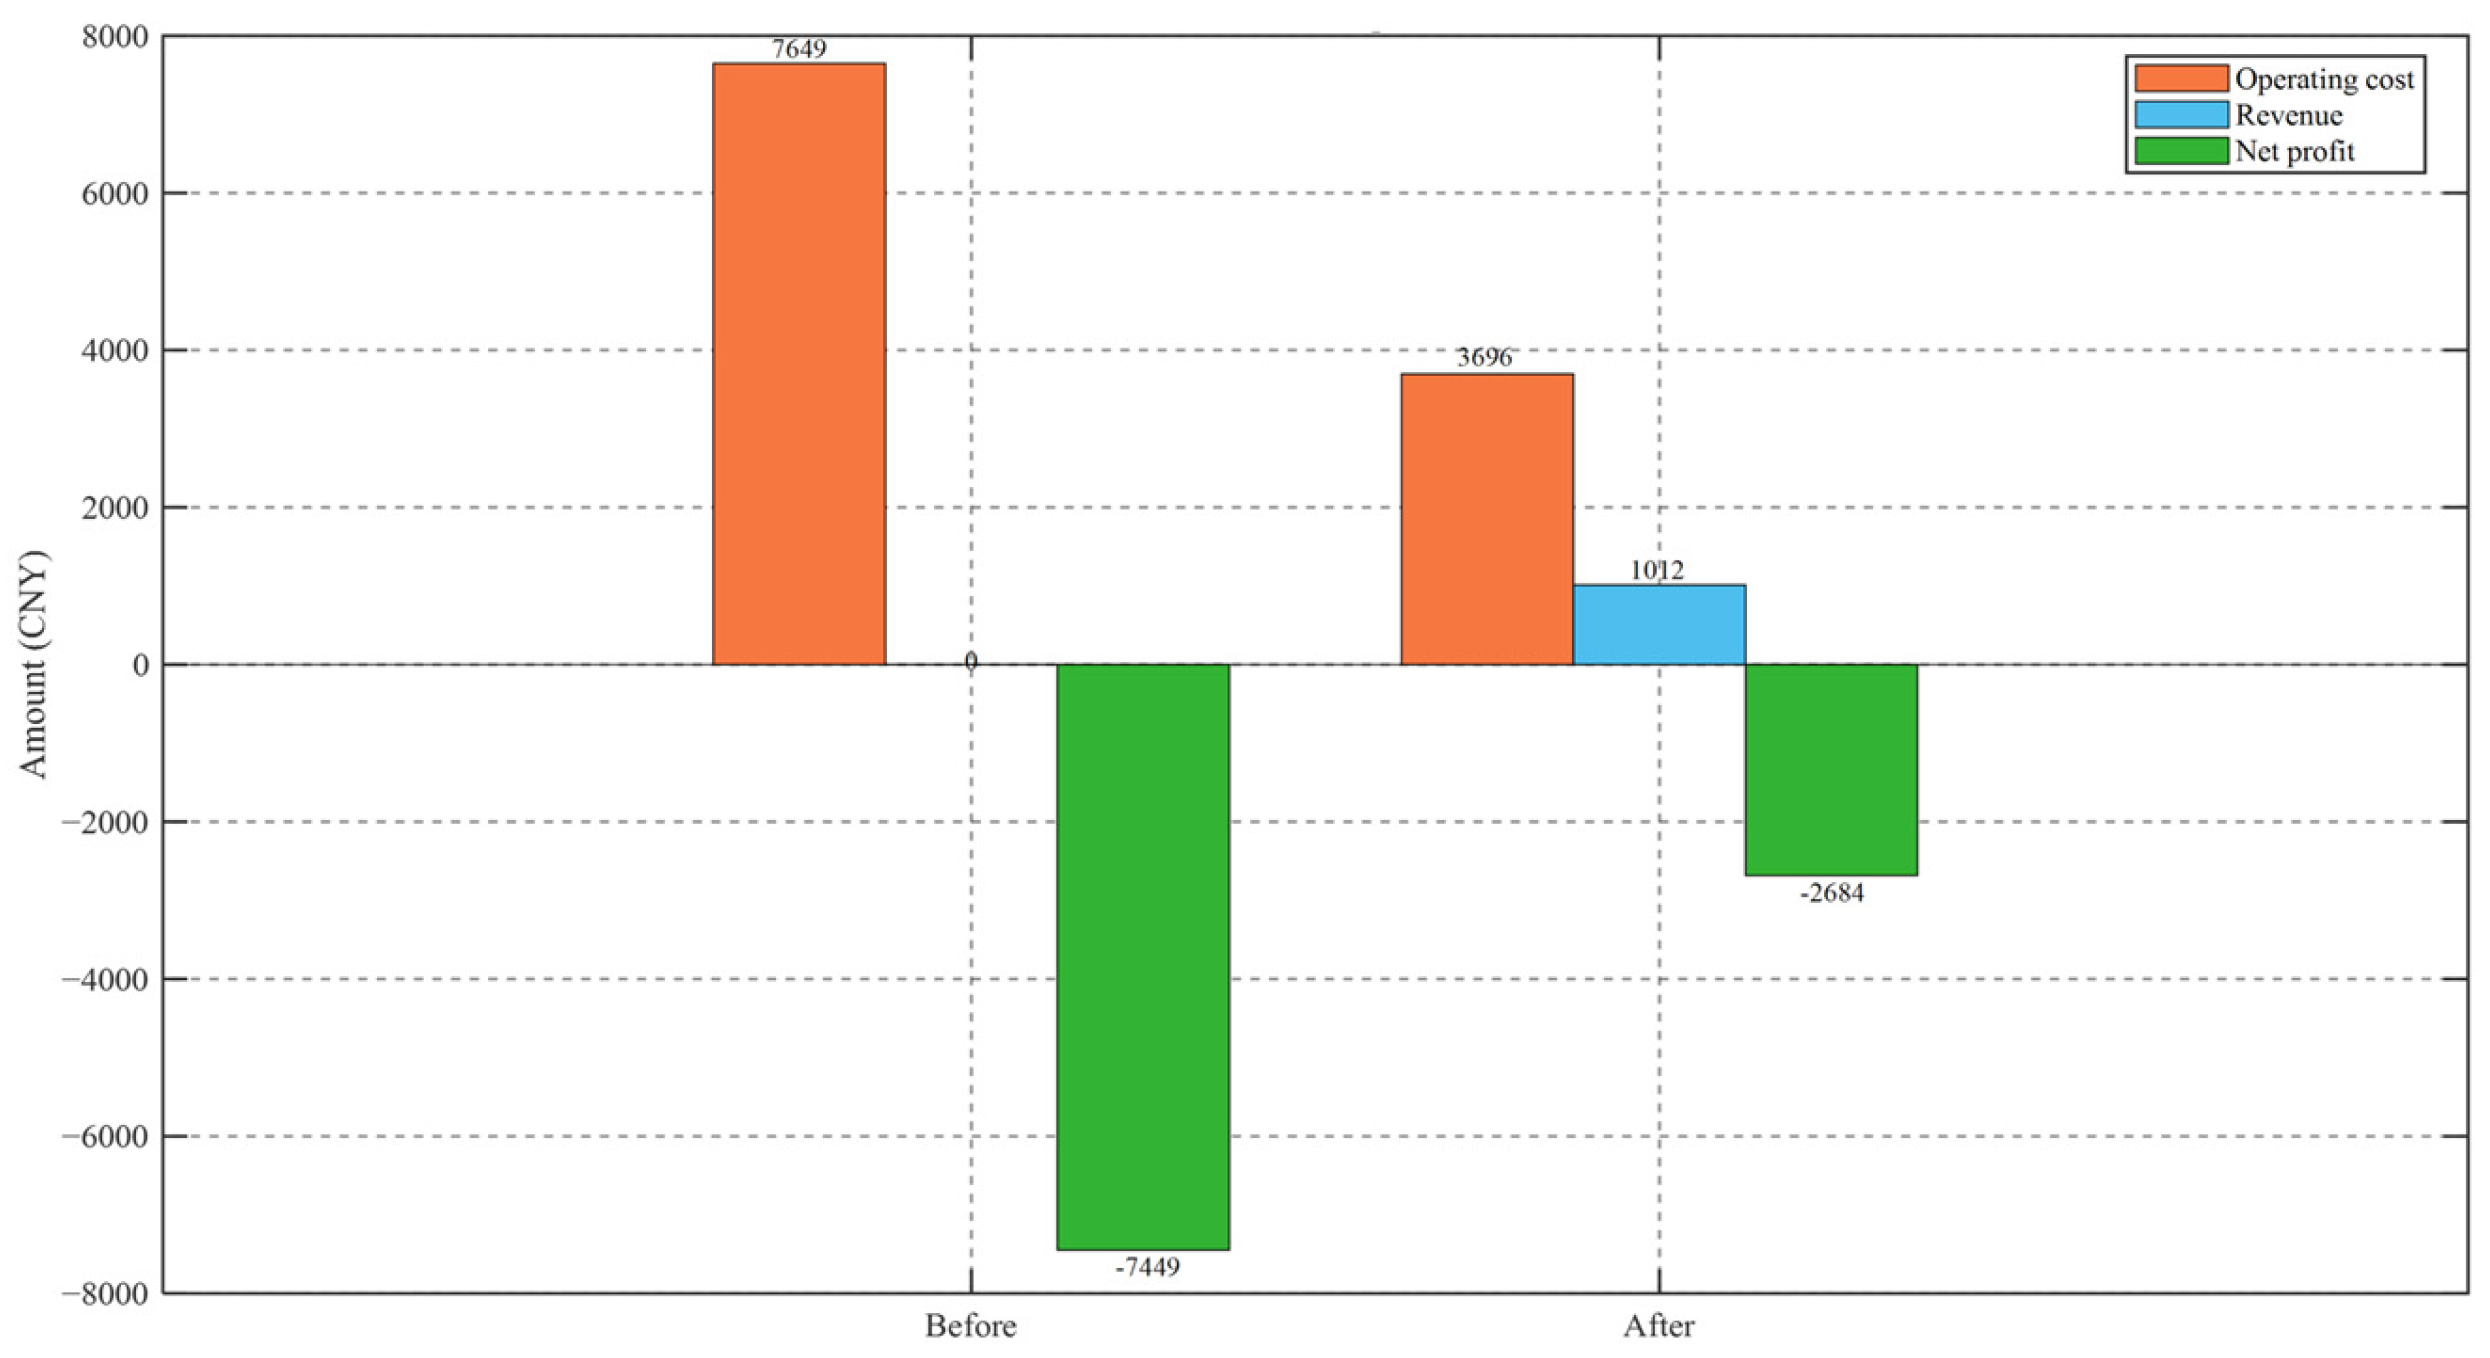
Figure 13 presents the economic comparison. The operational cost decreased from 7817 CNY to 6723 CNY (a 14.0% reduction). Total revenue increased from 0 CNY to 1170 CNY, primarily driven by wind power subsidies and discharging revenues. The net profit improved substantially from −7817 CNY to −5553 CNY. Although the net profit remained negative due to the inherent baseline cost structure of the system, the overall financial deficit was mitigated by 28.9%, underscoring a remarkable enhancement in economic viability. By seeking the optimal equilibrium among conflicting objectives, the IMOPSO algorithm successfully achieves a synergistic enhancement of both economic efficiency and low-carbon performance.
Figure 13.
Economic comparison.
6.6. Qualitative Sensitivity Analysis and Parameter Justification for Tiered Carbon Pricing
The performance of the tiered carbon pricing mechanism is governed by two core parameters: the step interval () and the price escalation rate (). While the baseline numerical simulation demonstrates the effectiveness of the proposed strategy, it is essential to justify these parameter selections. Instead of conducting redundant numerical iterations, a qualitative sensitivity analysis was performed by extrapolating the behavioral boundaries established in the preceding comparative scenarios.
The theoretical impact of these parameters dictates the strictness of the environmental penalty. If the carbon policy is overly relaxed (i.e., a significantly wider or a lower approaching 0%), the marginal penalty for exceeding emission quotas diminishes. Under such conditions, the system’s scheduling behavior would inevitably degenerate into the patterns observed in the traditional static carbon trading model (as discussed in Scenario 3 or equivalent baseline scenarios). In this state, the economic driving force is insufficient to fully activate the synergistic carbon-reduction potential of the P2G–ESS framework, leading to higher baseline emissions.
Conversely, an overly aggressive policy (i.e., an extremely narrow or a steep exceeding 50%) imposes severe exponential financial penalties. While this forces maximum utilization of renewable energy and drastic emission reductions, it disrupts the financial viability of the integrated energy system. The system would face severe economic deficits, making the operation practically unsustainable despite its environmental benefits.
Quantitative inference using existing scenarios: To provide a quantitative basis without extensive additional simulations, we leveraged the already-computed Scenarios 2 (PGU + Grid, high emissions) and 3 (PGU + ESS, low emissions) to infer the effect of tightening the stepped price parameters (reducing L or increasing λ). Moving from Scenario 2 to Scenario 3—which mimics a stricter carbon price—reduced the carbon emissions by 12.7% (from 2777 to 2423 kg) and improved net profit by 27.5% (from −4262 to −3092 CNY). Extending to Scenario 5 (ESS + P2G) showed a further emissions reduction to 2527 kg with a modest profit gain. These quantified differences bound the potential impact of parameter variations. We therefore conclude that the main conclusions—Pareto front shrinkage and ESS carbon-buffer activation—hold for a wide range of L (2000–6000 kg) and λ (10–40%), with quantitative benefits changing linearly.
Parameter justification: Therefore, the baseline parameters adopted in this study (e.g., λ = 25%, L = 4000 kg) were selected to establish a rational equilibrium. Furthermore, this parameter selection is well-justified by real-world market trends. In the transitional phase of current carbon markets, a moderate escalation rate (typically ranging between 20% and 30% in theoretical explorations and pilot markets) is considered optimal to provide sufficient emission-reduction incentives without causing sudden economic shock to energy providers. This careful parameter calibration ensures that the P2G–ESS coordination is effectively stimulated while maintaining a highly competitive net profit on the Pareto frontier.
7. Discussion
7.1. Reshaping Mechanism of Stepped Carbon Pricing on Dispatch Behavior
By contrasting the proposed model with linear carbon pricing scenarios, this study reveals that the stepped carbon price triggers a sudden jump in marginal carbon costs when emissions exceed the predefined thresholds, thereby forming a discontinuous penalty surface. From the perspective of optimization theory, the objective function under a linear carbon price possesses a continuous gradient, resulting in a smooth Pareto frontier. Conversely, the stepped carbon price introduces non-differentiable points at the interval boundaries. Consequently, high-emission solutions are automatically eliminated during the non-dominated sorting process due to escalating marginal costs, causing the “shrinkage” of the frontier in high-emission regions, as observed in Figure 3. From an engineering practice standpoint, the stepped carbon price translates policy directives into progressively intensified economic signals. This compels system operators to proactively confine carbon emissions within lower tiers, achieving an embedded integration of policy objectives and operational optimization.
7.2. Role Evolution of Energy Storage Systems Under Carbon Constraints
The variations in the charge and discharge behaviors illustrated in Figure 4 indicate that in the absence of a carbon price, the energy storage system (ESS) adheres to a conventional economic arbitrage mode: charging during off-peak hours and discharging during peak hours. However, with the introduction of the stepped carbon price, the ESS actively charges during the midday photovoltaic (PV) peak to absorb curtailed power, and discharges in the evening to substitute for the gas turbine (PGU) output. Essentially, operating the PGU during peak hours would trigger a higher carbon tier and significantly raise marginal costs; utilizing the ESS for energy time-shifting effectively circumvents these high-cost penalty zones. Under these conditions, the marginal revenue function of the ESS implicitly incorporates the benefits of carbon cost avoidance, transforming its role from a mere “economic arbitrageur” into a “carbon buffer” that actively participates in carbon emission management.
7.3. Necessity of Multi-Energy Coordination and Equipment Configuration Optimization
The comparative analysis of the five equipment configuration scenarios validates the necessity of multi-energy coordination from both positive and negative perspectives. The ESS and power-to-gas (P2G) technologies exhibit strong complementarity: the ESS features rapid response and high efficiency, making it ideal for intra-day, short-term regulation; meanwhile, P2G offers prolonged storage duration and high energy density, which is highly suitable for cross-period energy transfer. When operated synergistically, the IMOPSO algorithm automatically identifies these complementary characteristics to achieve optimal dispatch. The performance enhancement in Scenario 5, compared to Scenarios 3 and 4, is not a simple linear superposition but demonstrates a profound synergistic effect, firmly validating the principle of multi-energy complementarity within the integrated energy system.
7.4. Research Implications and Limitations
While this study provides valuable quantitative references for the design of carbon markets and successfully demonstrates the optimal day-ahead scheduling of the integrated energy system, several limitations regarding real-world implementation should be acknowledged.
7.4.1. Modeling Assumptions and Uncertainty
To isolate the policy impacts of the stepped carbon mechanism and P2G–ESS coordination, the current framework utilizes deterministic profiles for renewable generation and load. Real-world implementation, however, involves high-dimensional uncertainties. Future work will extend this framework by incorporating stochastic programming or distributionally robust optimization methods to account for these stochastic variations.
7.4.2. Real-Time Control and System Stability
The proposed model focuses on day-ahead optimal dispatch (hourly resolution) under steady-state assumptions. It does not incorporate real-time dynamic management, transient stability, or N-1 reliability constraints. In physical implementation, the scheduling outcomes generated by our model serve as optimal baseline reference points, while sub-hourly fluctuations and dynamic stability must be managed by lower-level local controllers (e.g., energy management systems).
7.4.3. Temporal Scope
The current model relies on a typical daily dispatch framework without accounting for multi-day energy coupling. Future research could be expanded to include multi-day or seasonal scheduling scenarios to evaluate long-term operational performance.
7.4.4. Scalability
The system scale in this study was relatively confined. Future research will scale up to regional multi-microgrid integrated energy systems. This will involve incorporating resources such as demand response and hydrogen energy storage, and exploring distributed optimization frameworks (e.g., ADMM) to verify the effectiveness of the stepped carbon trading mechanism on a macroscopic level and alleviate computational burdens.
8. Conclusions
In response to tightening carbon emission constraints, this paper proposes a multi-objective optimal dispatch framework for integrated energy systems (IES) under a stepped carbon trading mechanism. By employing an improved multi-objective particle swarm optimization (IMOPSO) algorithm, the study simultaneously minimizes operational and carbon trading costs while maximizing renewable energy utilization. Validation across five equipment configuration scenarios revealed that the nonlinear penalty of the stepped carbon price fundamentally reshapes the Pareto frontier, automatically eliminating high-emission solutions and forcing the system toward low-carbon operational states. Consequently, the role of the energy storage system (ESS) evolves from a conventional economic arbitrageur into a proactive “carbon buffer” that utilizes strategic energy time-shifting to circumvent high carbon-price tiers. Furthermore, the synergistic integration of the ESS (for rapid, short-term regulation) and power-to-gas (P2G, for long-duration energy transfer) yields profound comprehensive benefits. Compared to a grid-only baseline, this optimized multi-energy configuration significantly reduced the operational costs by 13.1% and carbon emissions by 9.9% while boosting the renewable energy utilization rate by 8.5%—ultimately providing a solid theoretical foundation for low-carbon dispatch and a robust quantitative reference for carbon market design.
While this study effectively uncovers the synergistic scheduling mechanisms under deterministic conditions, future work will involve integrating stochastic optimization or distributionally robust optimization methods into the IMOPSO framework to comprehensively account for the high-dimensional uncertainties associated with renewable energy generation and load demands.
Author Contributions
Conceptualization, Q.H. and S.T.; methodology, Q.H.; software, Q.H.; validation, J.B., X.B. and J.W.; formal analysis, Q.H.; investigation, J.W.; resources, S.T.; data curation, J.B.; writing—original draft preparation, Q.H.; writing—review and editing, J.B.; visualization, J.B.; supervision, X.B.; project administration, S.T.; funding acquisition, S.T. All authors have read and agreed to the published version of the manuscript.
Funding
This work was supported by the Zhejiang Provincial University Laboratory Work Research Project (Grant No. YB202418), the Ningbo Educational Science Planning Project (Grant No. 2024YGH082), the Ningbo Philosophy and Social Science Project (Grant No. G2025-3-53), and the Ningbo Major Special Project (Grant No. 2024Z042).
Institutional Review Board Statement
Not applicable.
Informed Consent Statement
Not applicable.
Data Availability Statement
The original contributions presented in this study are included in the article. Further inquiries can be directed to the corresponding author(s).
Conflicts of Interest
The authors declare no conflicts of interest.
References
- Chen, J.; Wu, P.; Chen, W.; Guerrero, J.M.; Niu, Z.; Li, Z. Two-layer coordinated operation of multi-energy system considering carbon-oriented collaborative pricing mechanism via two-stage stochastic programming approach. Appl. Energy 2026, 406, 127298. [Google Scholar] [CrossRef] [Scilit]
- Chen, W.; Liu, M.; Fan, L.; Xi, P.; Lu, S.; Li, J. Pricing optimization strategy for integrated energy systems based on hybrid virtual energy storage and uncertainty. Sustain. Energy Grids Netw. 2026, 46, 102164. [Google Scholar] [CrossRef] [Scilit]
- Dong, N.; Zhang, T.; Wang, R. Multi-objective evolutionary algorithm with two-tier fully-connected weight network for day-ahead scheduling of integrated cooling, heating and power energy systems. Energy 2026, 347, 140147. [Google Scholar] [CrossRef] [Scilit]
- Huang, J.; Jin, Y.; Li, G. Two-tier synergistic optimization of integrated energy systems based on comprehensive self-adaptive operation strategy. Energy 2024, 301, 131727. [Google Scholar] [CrossRef] [Scilit]
- Kong, X.; Zheng, Y.; Yang, S.; Wang, Y. Profit-driven economic expansion planning of CCUS deployment and carbon trading in carbon-neutral energy systems under liberalized market-oriented decarbonization strategies with step-based pricing. Energy 2025, 334, 136762. [Google Scholar] [CrossRef] [Scilit]
- Li, C.; Yang, X.; Wang, L. Public energy conservation behavior and the impact of tiered pricing: Based on water, electricity and gas consumption measurements in typical urban households in China. Energy Policy 2025, 202, 114593. [Google Scholar] [CrossRef] [Scilit]
- Li, J.; Yang, B.; Li, H.; Gao, D.; Jiang, L. Optimal pricing incentive strategy based on Stackelberg game for EVs and HFCVs in low-carbon integrated energy system. Appl. Energy 2026, 413, 127770. [Google Scholar] [CrossRef] [Scilit]
- Li, L.; Wen, T.; Ji, B.; Xu, H.; Liu, X. Two-tier optimization planning of electric integrated energy system with energy storage system for low-carbon parks. J. Energy Storage 2025, 123, 116800. [Google Scholar] [CrossRef] [Scilit]
- Lin, W.-T.; Guo, Q.; Jia, T.; Li, C.; Zhou, X.; Li, J.; Ming, T. Hydrogen–energy–carbon coupled pricing for integrated energy systems: Stackelberg game and robust demand response under renewable uncertainty. Renew. Energy 2026, 260, 125159. [Google Scholar] [CrossRef] [Scilit]
- Liu, F.; Liang, C.; Li, H. Low-carbon economic dispatch of integrated energy system considering multi-agent green certificate-carbon trading bidirectional interaction and cost allocation. Energy Rep. 2026, 15, 109155. [Google Scholar] [CrossRef] [Scilit]
- Liu, R.; Bao, Z.; Yu, Z.; Zhang, C. Distributed interactive optimization of integrated electricity-heat energy systems considering hierarchical energy-carbon pricing in carbon markets. Int. J. Electr. Power Energy Syst. 2024, 155, 109628. [Google Scholar] [CrossRef] [Scilit]
- Liu, Y.; Liu, C.; Yu, W.; Fan, Y.; Tang, X.; Huang, D.; Zhang, H.; Chi, Y. A two-tier optimization framework for urban integrated energy systems incorporating PSO-LSTM data-driven prediction and low-carbon demand response. Appl. Energy 2026, 402, 126967. [Google Scholar] [CrossRef] [Scilit]
- Lv, G.; Zhang, Y.; Zhu, J.; Liu, L.; Wu, Y.; Wang, T. Low-carbon optimal operation of electricity–heat–gas systems based on bi-directional tiered-pricing carbon trading. Energy Rep. 2023, 9, 377–387. [Google Scholar] [CrossRef] [Scilit]
- Erdiwansyah; Mamat, R.; Syafrizal; Ghazali, M.F.; Basrawi, F.; Rosdi, S.M. Emerging role of generative AI in renewable energy forecasting and system optimization. Sustain. Chem. Clim. Action 2025, 7, 100099. [Google Scholar] [CrossRef] [Scilit]
- Ma, D.; Tong, X.; Ming, Z.; Sun, Q. Multi-objective energy management of community microgrids based on integrated electricity-carbon pricing. Energy 2025, 335, 137726. [Google Scholar] [CrossRef] [Scilit]
- Shang, Y.; Li, X.; Xu, T.; Li, Y.; Cui, L. Optimal framework for integrated energy system considering carbon emission-green certificate mutual offsetting mechanism and multiple energy prices impacting. Energy Rep. 2026, 15, 109109. [Google Scholar] [CrossRef] [Scilit]
- Wang, Z.; Li, W.; Zhang, Y. Two-tier optimal scheduling of integrated energy systems in parks considering P2G-CCS-CHP coupling and electricity-gas-heat-cooling price-demand response. Energy 2025, 338, 138803. [Google Scholar] [CrossRef] [Scilit]
- Wu, D.; Chang, X.; Xue, Y.; Huang, Y.; Su, J.; Sun, H. Bilevel low-carbon coordinated operation of integrated energy systems considering dynamic tiered carbon pricing methodology. Energy 2024, 310, 133251. [Google Scholar] [CrossRef] [Scilit]
- Yang, J.; Wu, Q.; Luo, W. Optimized dispatch of integrated energy system based on renewable energy-carbon full-cycle interaction mechanism with dynamic step-wise carbon trading. Electr. Power Syst. Res. 2026, 256, 112914. [Google Scholar] [CrossRef] [Scilit]
- Yang, Y.; He, J.; Chen, W.; Li, Z.; Chen, K. Low-Carbon Economic Dispatch of Electric-Thermal-Hydrogen Integrated Energy System Based on Carbon Emission Flow Tracking and Step-Wise Carbon Price. Energy Eng. 2025, 122, 4653–4678. [Google Scholar] [CrossRef] [Scilit]
- Guo, R.; Ye, H.; Zhao, Y. Low carbon dispatch of electricity-gas-thermal-storage integrated energy system based on stepped carbon trading. Energy Rep. 2022, 8, 449–455. [Google Scholar] [CrossRef] [Scilit]
- Wang, L.; Ren, X.; Ma, Y.; Liu, Z.; Dong, W.; Ni, L. Optimal low-carbon scheduling of integrated energy systems considering stepped carbon trading and source-load side resources. Energy Rep. 2024, 12, 3145–3154. [Google Scholar] [CrossRef] [Scilit]
- Zhang, Y.; He, Y. Optimizing integrated energy systems: A multi-scenario scheduling approach with stepped carbon trading and two-stage hydrogen production under uncertainty. Appl. Energy 2025, 401, 126704. [Google Scholar] [CrossRef] [Scilit]
- Zhao, Y.; Liang, Y.; Tang, Y.; Fan, C.; Li, L.; Sun, H. Optimization of a refined power-to-gas integrated energy system considering reward-penalty stepped carbon trading mechanism. Energy Rep. 2026, 15, 109147. [Google Scholar] [CrossRef] [Scilit]
- Li, F.; Wang, D.; Guo, H.; Zhang, J. Distributionally Robust Optimization for integrated energy system accounting for refinement utilization of hydrogen and ladder-type carbon trading mechanism. Appl. Energy 2024, 367, 123391. [Google Scholar] [CrossRef] [Scilit]
- Yang, Z.; Cheng, L.; Min, H.; Lei, Y.; Yang, Y. Distributionally robust optimization-based scheduling for a hydrogen-coupled integrated energy system considering carbon trading and demand response. Glob. Energy Interconnect. 2025, 8, 175–187. [Google Scholar] [CrossRef] [Scilit]
- Li, J.; Shao, Y.; Mu, G.; Zhu, X.; Yan, G.; Li, C. Distributed low-carbon economic dispatch of interconnected multi-area system with CCS-ESS. Int. J. Electr. Power Energy Syst. 2025, 169, 110742. [Google Scholar] [CrossRef] [Scilit]
- Yang, H.-T.; Wu, Y.-S.; Lin, Y.-Z. ESS Scheduling and Control Approach for Factory-based EV Charging Station to Participate in Ancillary Services. IFAC-Pap. 2023, 56, 2753–2758. [Google Scholar] [CrossRef] [Scilit]
- Zarei, A.; Ghaffarzadeh, N.; Shahnia, F.; Shafie-khah, M.; Mirjalili, S. Optimal seasonal demand response for AC-OPF with precise and innovative modeling of thermal energy storage and optimal ESS allocation. J. Energy Storage 2025, 140, 118682. [Google Scholar] [CrossRef] [Scilit]
- Lund, H.; Østergaard, P.A.; Connolly, D.; Mathiesen, B.V. Smart energy and smart energy systems. Energy 2017, 137, 556–565. [Google Scholar] [CrossRef] [Scilit]
- Mancarella, P. MES (multi-energy systems): An overview of concepts and evaluation models. Energy 2013, 65, 1–17. [Google Scholar] [CrossRef] [Scilit]
- Clegg, S.; Mancarella, P. Storing renewables in the gas network: Modelling of power-to-gas seasonal storage flexibility in low-carbon power systems. IET Gener. Transm. Distrib. 2016, 10, 566–575. [Google Scholar] [CrossRef] [Scilit]
- Gabrielli, P.; Gazzani, M.; Martelli, E.; Mazzotti, M. Optimal design of multi-energy systems with seasonal storage. Appl. Energy 2018, 219, 408–424. [Google Scholar] [CrossRef] [Scilit]
- O’Dwyer, E.; Pan, I.; Acha, S.; Shah, N. Smart energy systems for sustainable smart cities: Current developments, trends and future directions. Appl. Energy 2019, 237, 581–597. [Google Scholar] [CrossRef] [Scilit]
- Palensky, P.; Mancarella, P.; Hardy, T.; Cvetkovic, M. Cosimulating Integrated Energy Systems With Heterogeneous Digital Twins: Matching a Connected World. IEEE Power Energy Mag. 2024, 22, 24–35. [Google Scholar] [CrossRef] [Scilit]
- Carr, H.; Onodera, H.; Delage, R.; Nakata, T. P2G and P2L system design for the hard-to-abate sector with logistic considerations in Japan. Energy Convers. Manag. X 2026, 29, 101469. [Google Scholar] [CrossRef] [Scilit]
- Ni, Q.; Xu, C.; Cai, Z.; Zhou, Y.; Lai, L.L. Optimal dispatch of integrated energy system with CCUS-P2G coupling and hydrogen-doped gas equipment based on ladder-type carbon trading mechanism. Energy 2025, 336, 138397. [Google Scholar] [CrossRef] [Scilit]
- Lee, W.; Shin, H.; Jensterle, M.; Ehlert, D.; Son, J. Towards a sustainable hydrogen economy: Identifying key partner countries for P2G import in South Korea. Int. J. Hydrogen Energy 2025, 166, 150790. [Google Scholar] [CrossRef] [Scilit]
- Ren, L.; Zhang, K.; Mehran, K.; Ma, K. Low-carbon economic dispatch of a hydrogen-based integrated energy system considering the coordinated operation of CHP-ORC-CSP and P2G-CCS. Energy 2025, 340, 139251. [Google Scholar] [CrossRef] [Scilit]
- Yan, K.; Lin, B. Carbon pricing, commodity markets, and economic stability: Evidence from the EU ETS. J. Commod. Mark. 2026, 41, 100536. [Google Scholar] [CrossRef] [Scilit]
- Wang, J.; Wen, J.; Long, C.; Yang, B.; Jiang, L. Global electricity-carbon market nexus: A systematic review of synergistic efforts towards a net-zero power sector. Appl. Energy 2026, 402, 126992. [Google Scholar] [CrossRef] [Scilit]

Disclaimer/Publisher’s Note: The statements, opinions and data contained in all publications are solely those of the individual author(s) and contributor(s) and not of MDPI and/or the editor(s). MDPI and/or the editor(s) disclaim responsibility for any injury to people or property resulting from any ideas, methods, instructions or products referred to in the content. |
© 2026 by the authors. Licensee MDPI, Basel, Switzerland. This article is an open access article distributed under the terms and conditions of the Creative Commons Attribution (CC BY) license.