


Abstract
Solid oxide electrolysis cells (SOECs) are regarded as a promising technology for sustainable hydrogen production because of their high energy conversion efficiency. In this study, a multiphysics numerical model combined with a random particle packing framework was used to evaluate the influence of anode microstructural parameters on the electrochemical performance of a button-type SOEC. The effects of anode porosity, particle size, and electrode thickness on current density were systematically analyzed. Increasing porosity from 0.3 to 0.5 reduced the current density because of the decreased fraction of electrochemically active material. Increasing the anode particle size from 50 to 300 nm significantly shortened the triple-phase boundary (TPB) length, leading to a decrease in current density from 6289 to 5502 A m−2. The effect of anode thickness reflects a trade-off between electrochemical activity and gas transport, with the current density increasing from 5502 to 5940 A m−2 as the thickness increased from 10 to 20 μm. Overall, the results highlight the coupled roles of reaction-site availability and oxygen transport in determining SOEC performance. This study provides a parametric assessment of how anode microstructure affects SOEC performance and may support the structural optimization of SOEC oxygen electrodes.
1. Introduction
Hydrogen is widely regarded as an important energy carrier for low-carbon energy systems, and water electrolysis is a promising technology for green hydrogen production [1,2]. Among the available electrolysis technologies, solid oxide electrolysis cells (SOECs) offer high energy conversion efficiency and fast reaction kinetics [3,4,5]. A typical SOEC consists of a porous hydrogen electrode, a dense oxide electrolyte, and a porous oxygen electrode [6]. During operation, SOECs involve strongly coupled physicochemical processes, including charge transfer, mass transport, and electrochemical reactions [7]. Among them, the oxygen evolution reaction at the anode is relatively sluggish and contributes significantly to polarization losses, making electrode structural optimization essential for improving SOEC performance [8].
Numerical simulation has become an important tool for understanding and optimizing SOEC electrodes [9]. Previous studies have investigated oxygen electrodes from different perspectives, including oxygen transport, concentration polarization, and coupled electrochemical/transport behavior. These studies showed that porosity, particle size, and electrode thickness strongly influence cell performance, but many of them focused on a single factor or adopted simplified model assumptions [10,11,12,13]. Continuum-based three-dimensional models were also developed to describe coupled transport and electrochemical behavior under various operating conditions [14]. However, in many such models, effective transport and reaction parameters are prescribed as constants, so the effects of microstructural variations are not always represented consistently. To improve the link between microstructure and effective properties, random-packing-based parameterization methods have been proposed [15]. Although such approaches provide a physically grounded description of conductivity and diffusivity, their systematic application to oxygen-electrode optimization in SOECs remains limited. More comprehensive SOEC models have further incorporated electrochemical kinetics, heat and mass transport, and charge transport mechanisms [16], but systematic investigation of the coupled effects of porosity, particle size, and thickness on oxygen-electrode performance is still lacking.
To address these limitations, a two-dimensional multiphysics SOEC model was developed in COMSOL Multiphysics 6.2 to examine the structural effects of the oxygen electrode. The model incorporates charge conservation, species transport, gas diffusion, and electrochemical reaction kinetics in a fully coupled manner. To account for microstructural effects in a computationally efficient continuum description, a parameterization method based on randomly packed spherical particles was adopted. In this approach, effective electronic conductivity, ionic conductivity, gas diffusion coefficients, and reaction-site density are consistently related to structural descriptors, including porosity and particle diameter. Based on this model, the effects of particle size, electrode thickness, and porosity on SOEC performance were systematically evaluated under fixed-voltage operation. The respective contributions of activation, ohmic, and concentration polarizations were further analyzed, and transport-related behavior was quantified in terms of the oxygen partial pressure difference and concentration overpotential. Accordingly, the present work aims to clarify the roles of key oxygen electrode structural parameters in SOEC performance.
2. Methods
2.1. Simulation Model
The two-dimensional multiphysics model developed in this study was constructed based on prior experimental observations and implemented in COMSOL Multiphysics 6.2. The model was designed to reproduce the geometry, operating conditions, and electrochemical environment of the experimental SOEC system. A button-type SOEC configuration was adopted, in which electrochemical reactions occur at locations where ions, electrons, and gaseous species meet simultaneously. These reactive sites, referred to as triple-phase boundaries (TPBs), govern the reaction rate, and the TPB length is determined by factors such as particle size, phase distribution, and anode composition [17].
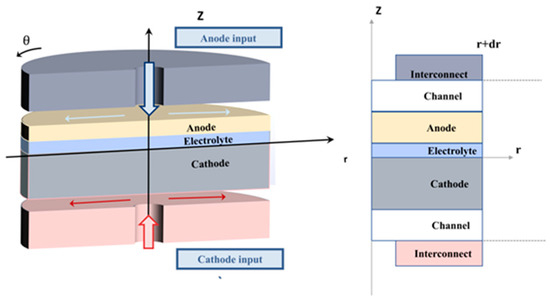
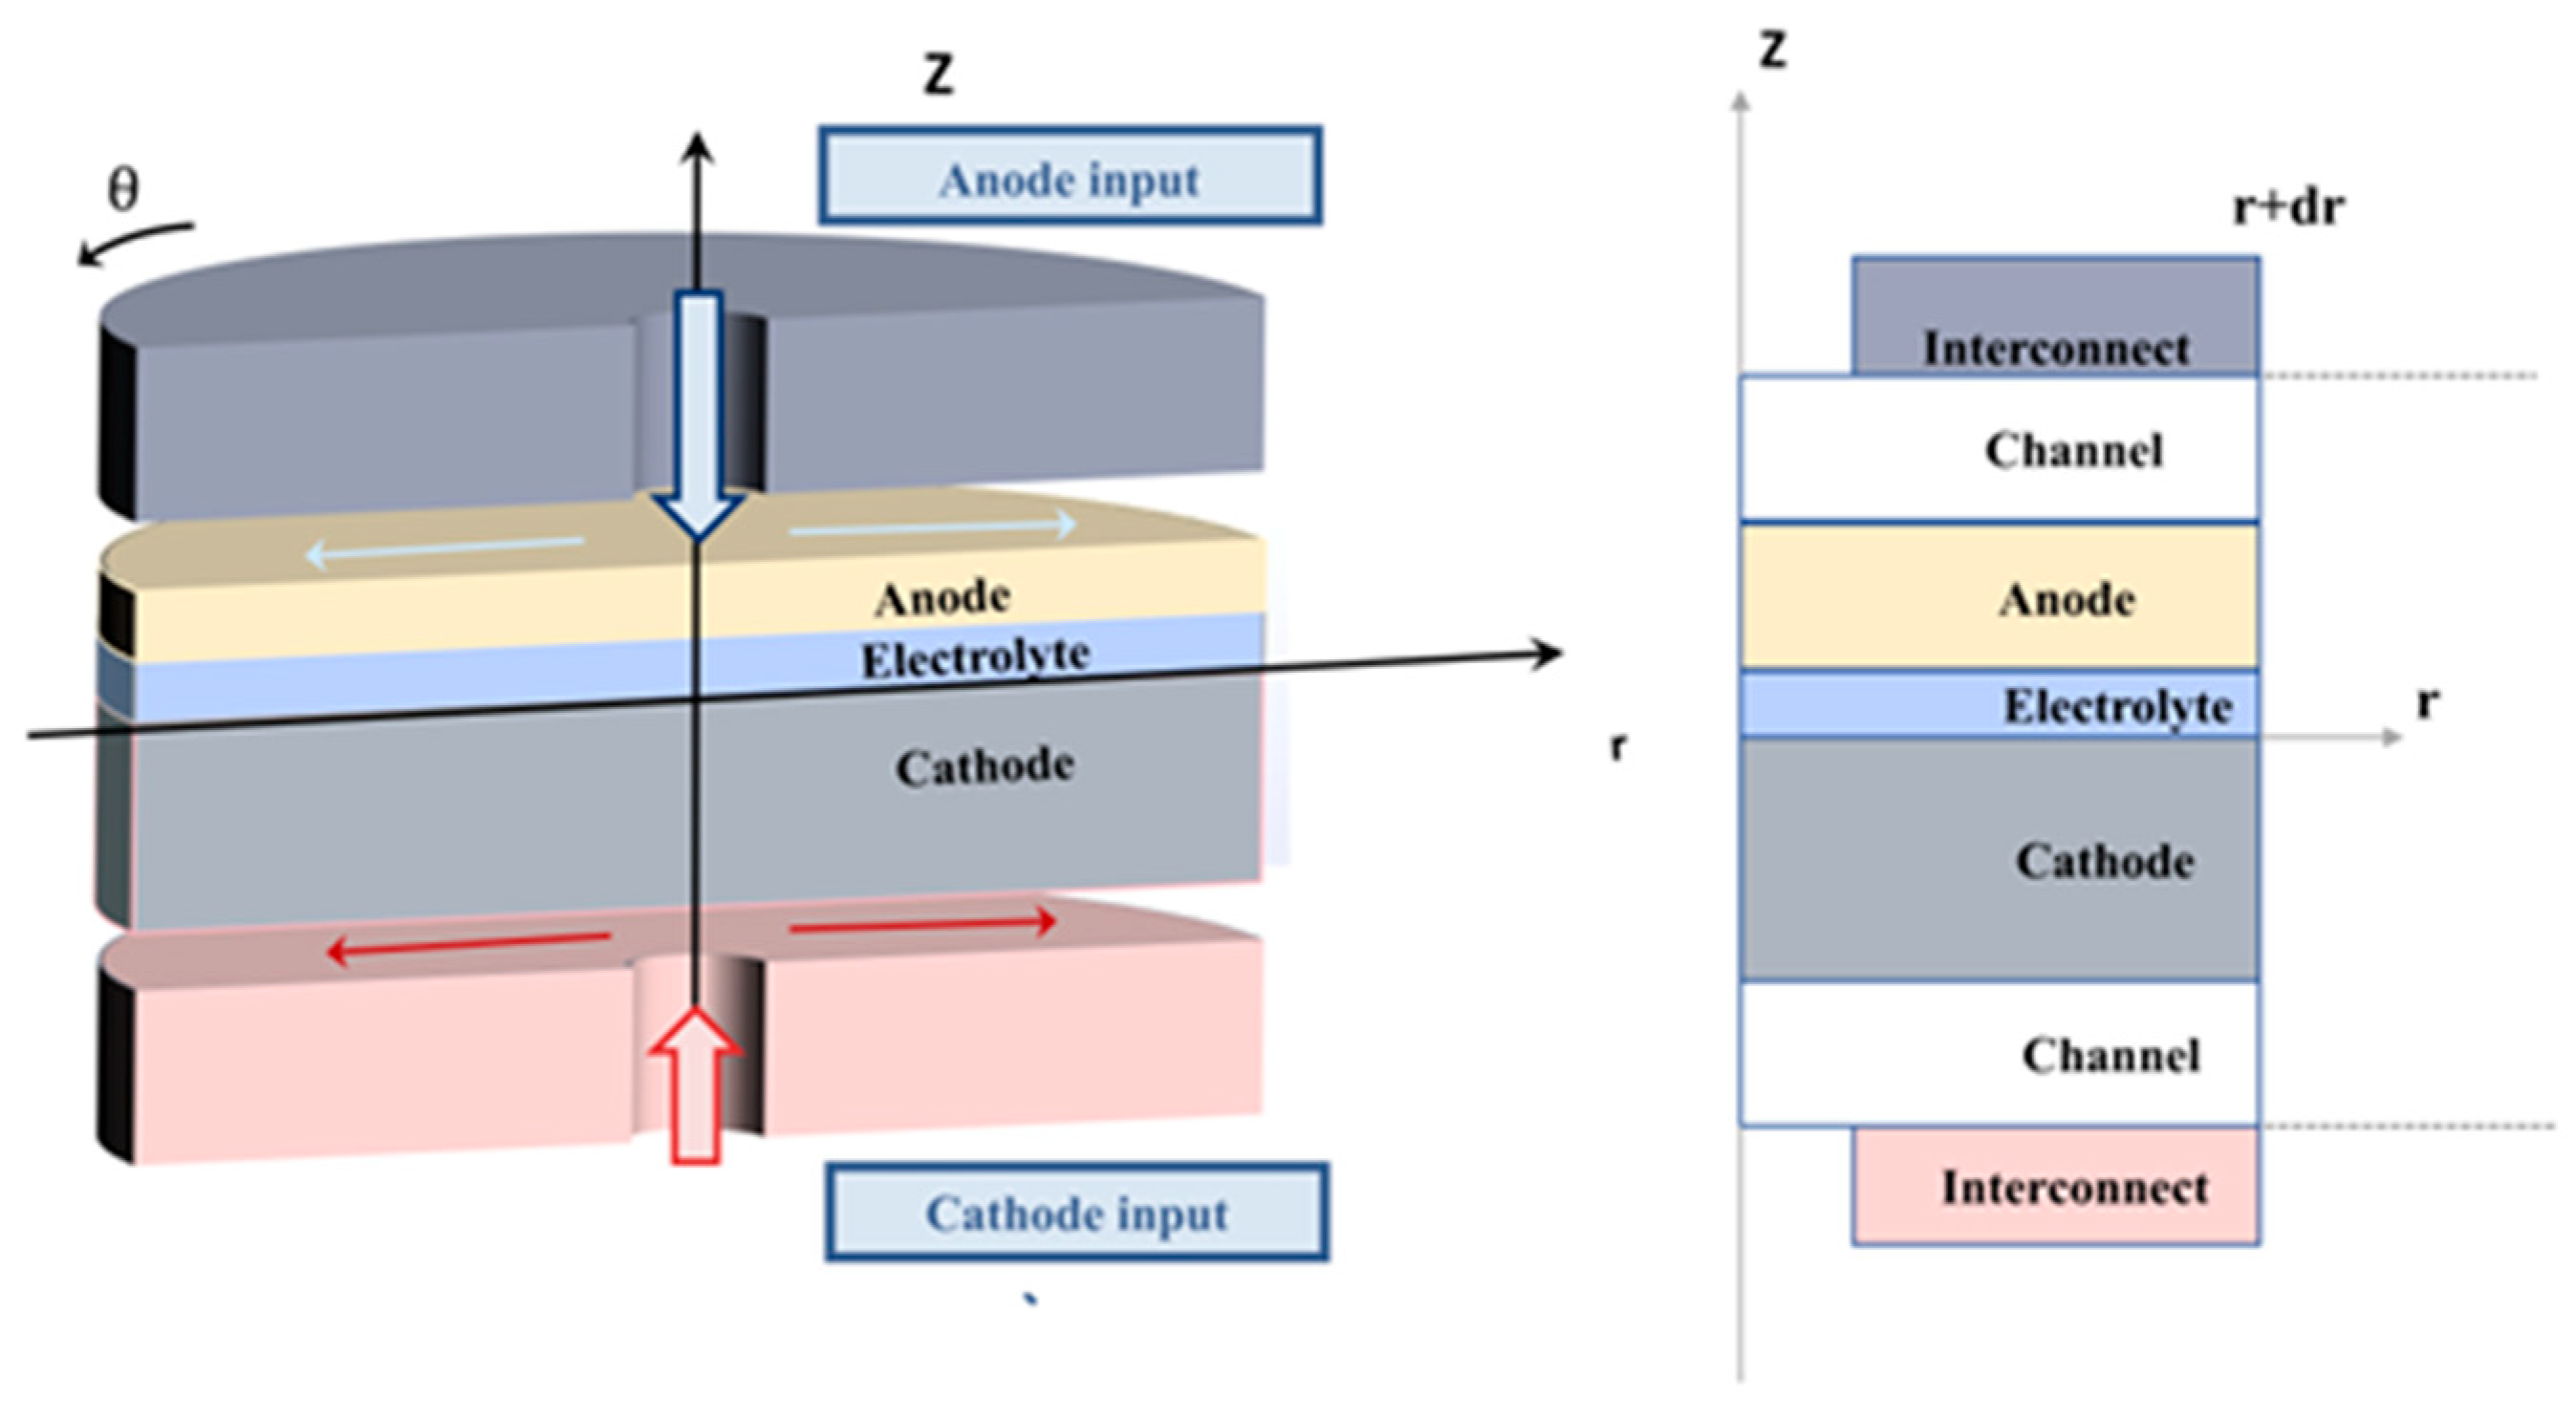
The physical model, illustrated in Figure 1, consists of a hydrogen flow channel, a cathode layer, an anode layer, an electrolyte layer, and an airflow channel. The electrolyte was represented as a dense, impermeable layer, whereas the anode and cathode were modeled as porous electrodes. Ni/YSZ was used as the cathode material, La0.6Sr0.4Co0.2Fe0.8O3+δ (LSCF) served as the anode material, and the electrolyte consisted of yttria-stabilized zirconia (YSZ).
Figure 1.
Schematic diagram of the SOEC model.
An axisymmetric framework was adopted to construct the geometric configuration and flow-channel layout, and the corresponding operating parameters are listed in Table 1. At the gas inlet, laminar flow was imposed using a specified mass-flow boundary condition, and the gas temperature was set equal to the operating temperature. The gas outlet was defined as a pressure outlet boundary condition, allowing convective transport of both mass and heat. At the interface between the flow channel and the electrode, flow and heat transfer were treated as continuous, while mass transport and the electronic potential field were treated as insulated. At the current collector/channel interface, a no-slip boundary condition was applied to the flow, while mass transport and the electronic field were insulated and heat transfer remained continuous. At the electrolyte/electrode interface, mass transport and the electronic field were set as insulated, while heat transfer was continuous. Appropriate initial values and localized boundary conditions were applied within the anode and cathode layers to ensure numerical stability. The operating voltage was imposed across the interface between the lower boundary of the cathode layer and the upper boundary of the anode layer [18].
Table 1.
Physical dimensions and working parameters of the model [19,20,21].
2.2. Charge Conservation Equations
In the present continuum framework, the intrinsic interfacial Butler–Volmer relation is formulated in terms of local electrochemical potentials, while the effect of microstructure is incorporated into the volumetric electrochemical response through the microstructure-dependent reaction-site density and effective transport properties. Specifically, the effective electronic conductivity, ionic conductivity, gas diffusion coefficients, and active reaction-site density are expressed as functions of structural descriptors such as porosity, particle size, and particle connectivity. These quantities govern local charge transfer and mass transport processes and thereby determine the overall electrochemical performance of the anode. In the present study, the random-packing-based microstructure parameterization is implemented as follows. First, the structural descriptors and model constants required for the random-packing-based parameterization are specified as input parameters and summarized in Table 2. Second, the percolation probability Pi and nv are calculated from Equations (6) and (7), based on which the active reaction-site density STPB is obtained from Equation (5). Third, the effective ionic and electronic conductivities are evaluated from Equations (8)–(12). Finally, these microstructure-dependent quantities are introduced into the continuum model through the source terms and effective transport properties in Equations (1)–(4).
Table 2.
Input parameters used in the random-packing-based microstructure parameterization.
In this framework, electric current results from the transport of charged species, namely electrons and ions. Electrons are transported through the electrode reaction layer, while ions migrate through both the electrode and the electrolyte. Charge-conservation equations are formulated for the anode layer, with analogous treatments applied to the electrolyte and cathode layers. Accordingly, based on Ohm’s law, the governing equations for electron transport (Equation (1)) and ion transport (Equation (2)) are given as follows [25].
where , are the effective electron conductivity and effective ionic conductivity, respectively; ϕel and ϕio are the electron potential and ionic potential, respectively; Sel and Sio are the volumetric source terms in the electronic and ionic charge-conservation equations, respectively, (A·m−3) [25].
where Ja and Jc are the local interfacial current densities determined by the Butler–Volmer relation, (A·m−2). The parameter STPB is the microstructure-dependent density of electrochemically active reaction sites obtained from the random-packing-based parameterization. Therefore, the volumetric source terms Sel and Sio depend on both the local electrochemical kinetics and the electrode microstructure. STPB can be determined using the following Equation (5) [22]:
where θ is the contact angle between the electronic and ionic conductors. Z is the average coordination number between the particles; Pi is the probability of the LSCF particles connecting to the porous media (Equation (6)); nv is the the number of particles per unit volume, can be determined using the following Equation (7) [9]:
Because the ionic conductivity within LSCF particles differs from that between particles, the effective ionic conductivity of the anode is expressed by the following Equation (8) [26]:
where is the effective ionic conductivity within the LSCF particles; is the effective ionic conductivity between the LSCF particles. The effective ionic conductivity within the LSCF particles can be expressed as Equation (9) [27]:
where is the intrinsic ionic conductivity of the LSCF particles, in S/m; ΨLSCF is the volume fraction of LSCF particles; εan is the porosity of the anode layer. The effective ionic conductivity between the particles is expressed as Equations (10) and (11) [28]:
where δter,r is the interface thickness between LSCF particles and between LSCF particles, estimated to be 5 nm [23]; αter is the interface contact area between LSCF particles; is the ionic conductivity between the intrinsic particles of LSCF;
Because the electronic conductivity between adjacent particles is sufficiently high, its contribution to the overall electronic conduction resistance can be considered negligible. Therefore, a similar formulation can be applied to describe the effective electronic conductivity within the anode. The effective electronic conductivity of the anode layer is then given as Equation (12) [24]:
where is the effective electron conductivity of LSCF; is the conductivity within the LSCF particles; ΨLSCF is the volume fraction of LSCF particles.
2.3. Electrochemical Reaction Model
In the actual electrolysis process, due to unavoidable losses, the required input voltage is always higher than the thermodynamically calculated voltage. As the electrolysis current increases, the associated voltage losses also increase. In general, three types of polarization overpotentials are considered: activation overpotential (ηact), ohmic overpotential (ηohm), and concentration overpotential (ηcon). The actual cell voltage (E) is composed of the reversible electromotive force and the additional overpotential (Ei) caused by various polarization losses, as expressed in Equation (13) [29]:
where E is the actual electrolysis voltage and is the reversible voltage. The reversible electromotive force E0 is expressed as Equation (14):
where ΔG(T) is the Gibbs free energy change in the electrochemical reaction at temperature T, and F is the Faraday constant.
Activation overpotential arises from the kinetic resistance of electrochemical reactions and represents the additional potential required for the hydrogen and anode reactions to overcome the activation energy barrier [30].
where Ji=a,c is the current density; J0,i is the exchange current density; αi is the symmetry factors of the forward reactions; Eeq,i is the equilibrium voltage. The exchange current density j0,i can be expressed as Equation (17) [30]:
where γi is the pre-exponential factor; Ea,i is the activation energy.
The overpotential of ohmic polarization is generated due to the resistance of charge transfer, mainly the overpotential lost by ions when they overcome the resistance during their transfer in the electrolyte and on the electrode. Ohmic polarization is expressed as Equation (18) [31].
where σele is the conductivity of the electrolyte.
Concentration overpotential occurs when the charge-transfer rate exceeds the rate at which reactive species can diffuse or migrate to the electrochemically active sites, causing their local concentrations to deviate from bulk values. This imbalance leads to the formation of a significant concentration gradient between the electrode reaction zone and the surrounding gas phase. The presence of this gradient slows the electrochemical reaction rate and, in turn, increases the overall overpotential as expressed in Equations (19)–(21) [32]:
where Econ,an and Econ,ca are the concentration polarization overpotential of the anode and cathode, respectively; is effective diffusion coefficient of H2O; μ is the dynamic viscosity of O2; kg is the permeability of the anode.
2.4. Component Transport and Diffusion Equation
It was assumed that the gases within the cell originate solely from the channel inlets. Gas transport in porous media is commonly described using either the extended Fick model (EFM) or the dusty-gas model (DGM) [33]. Both models account for Knudsen diffusion, molecular diffusion, and mass transport under finite pressure gradients. The EFM is often preferred because it provides explicit analytical expressions for species fluxes and reduces computational complexity [34]. Suwanwarangkul et al. [35] developed an anode mass-transport model for solid oxide fuel cells using both the EFM and DGM, and compared their predictive differences.
Based on these insights, the present study adopts the EFM to describe mass transport within the porous electrodes, while neglecting the influence of finite pressure gradients during computation. Accordingly, the mass-transport equation for the porous electrode using the EFM can be written as Equation (22):
where εi is the porosity of the electrode; ck,g is the molar concentration of the gas; Rk,g is the mass balance source term of gaseous substances within the porous medium; and is the effective diffusion coefficient of gaseous substances. Considering that molecular diffusion and Knudsen diffusion are dominant mechanisms in pores with diameters significantly larger than and smaller than the mean free path of gas molecules, respectively, the effective diffusion coefficient is described as Equation (23):
where and are the effective molecular diffusion coefficient and effective Knudsen diffusion coefficient, respectively, for multi-component gas mixtures. The effective molecular diffusion coefficient is calculated as Equation (24):
where xk and xj are the mole fraction of gaseous substances k and j; is the effective binary molecular diffusion coefficient. Considering the properties of porous materials, the effective binary molecular diffusion coefficient and the Knudsen diffusion coefficient are respectively expressed as Equations (25) and (26):
where τi is the tortuosity; Vk and Vj are the diffusion volumes of gaseous substances k and j; M is the molecular weight; ri is the average pore radius.
The partial pressure gradient along the thickness of the anode can be obtained by combining the Fick diffusion and current flux flowing in the electrode, shown in Equation (27)
In the anode, the relationship between the mass balance source term and the current source term can be determined by Faraday’s law as Equation (28):
where Qelec,an is the source term of the charge balance equation.
2.5. Model Validation
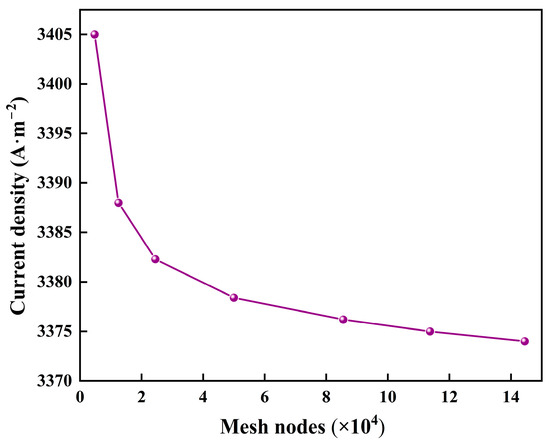
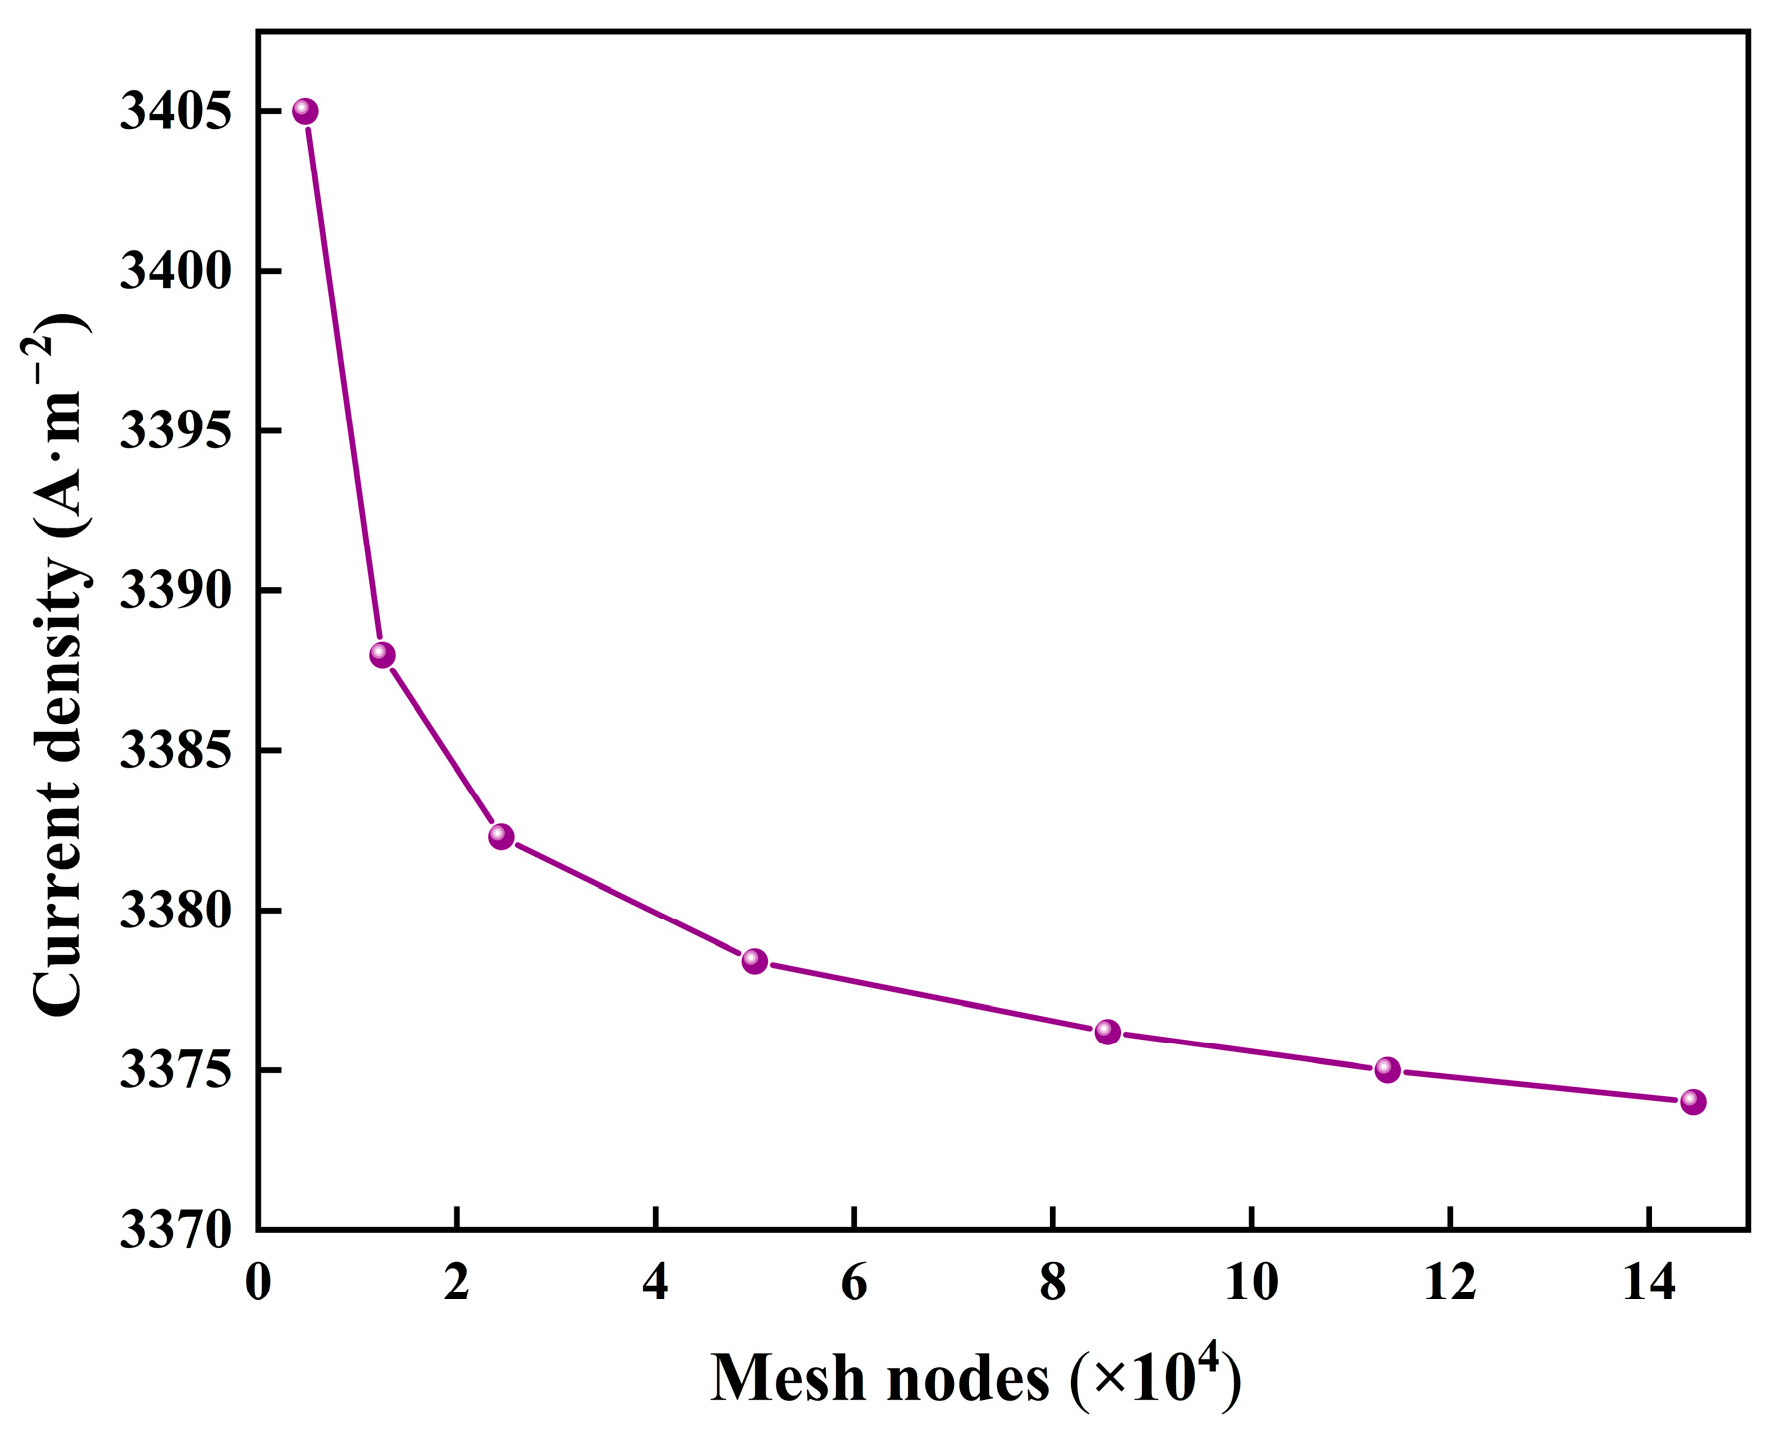
To ensure the reliability of the numerical simulation results, a mesh-independence analysis was conducted for the two-dimensional axisymmetric model, as shown in Figure 2. The current density values computed at the same electrolysis voltage were compared under different mesh densities. When the total number of mesh elements exceeded 50,000, the relative deviation in current density fell below 1%. Therefore, a mesh consisting of 50,000 elements was selected as an optimal configuration, providing an effective balance between computational accuracy and efficiency.
Figure 2.
Verification of mesh independence.
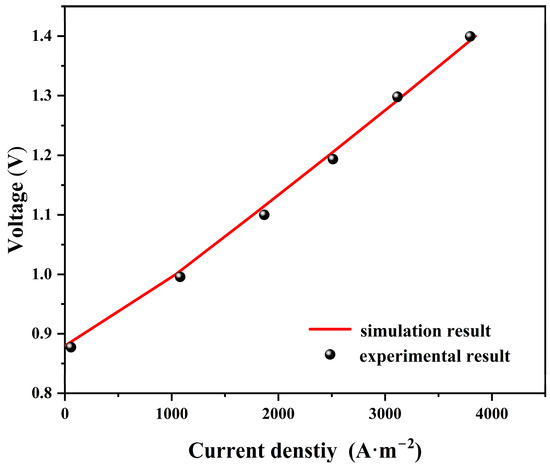
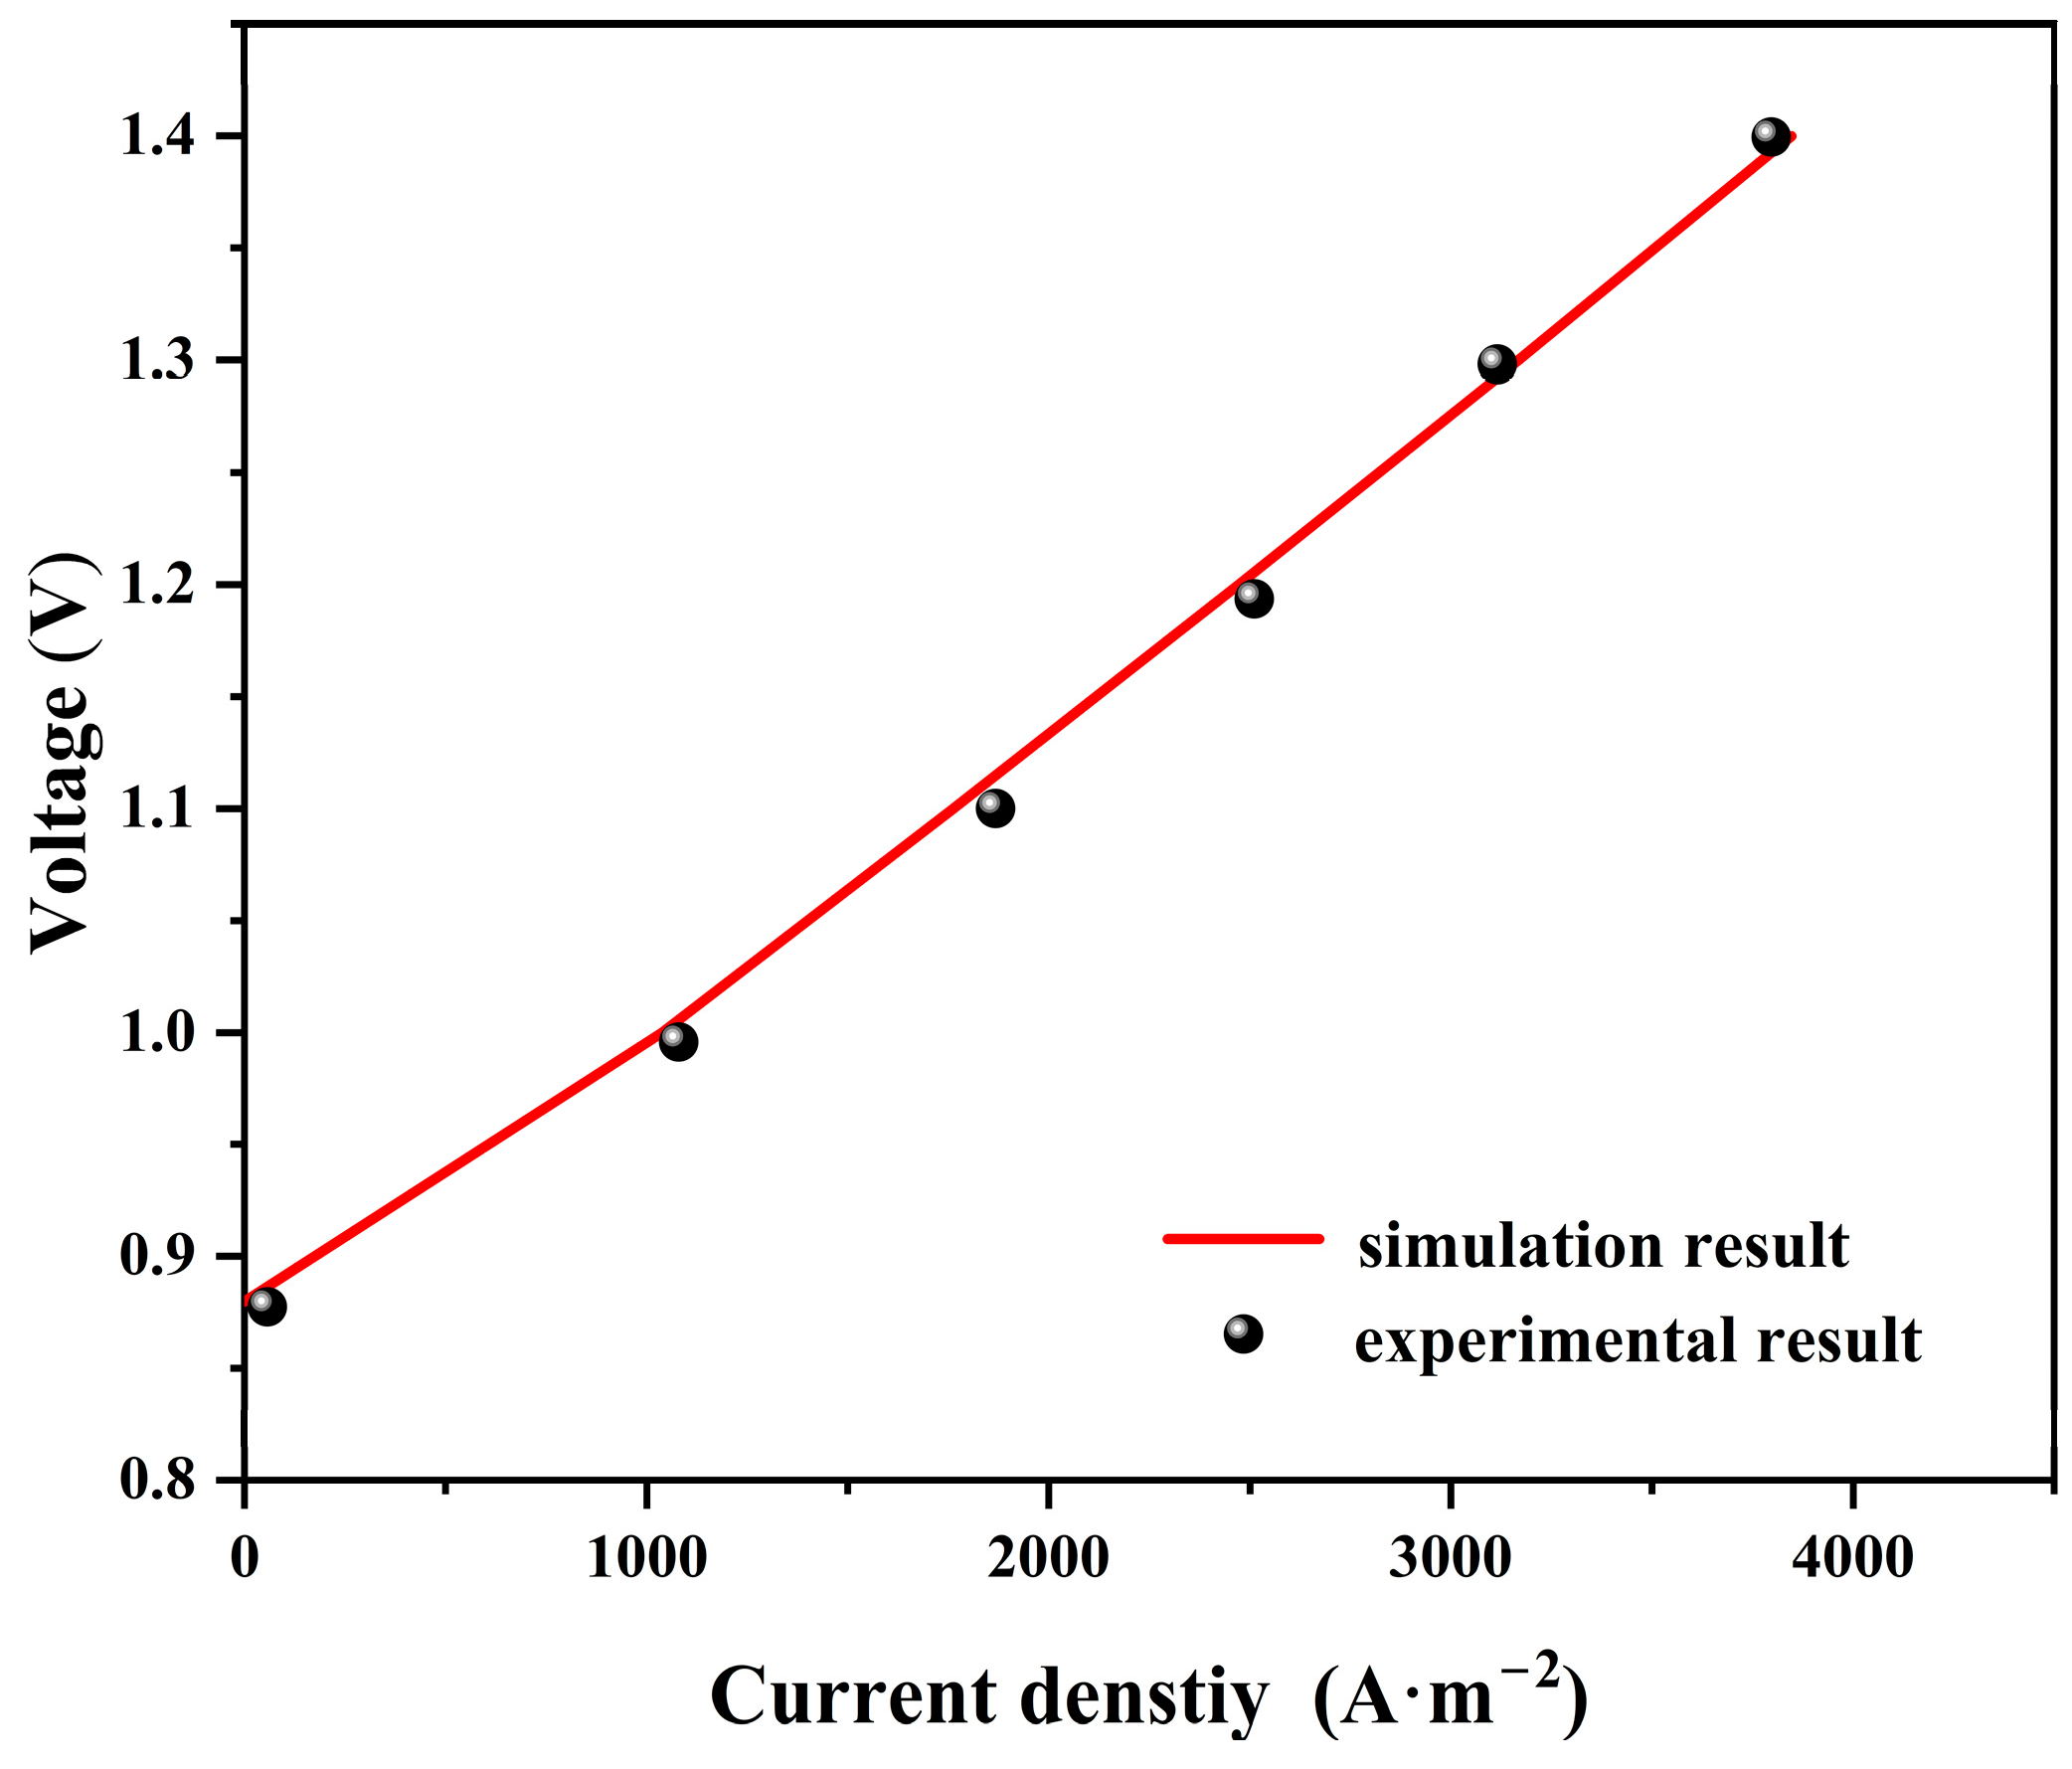
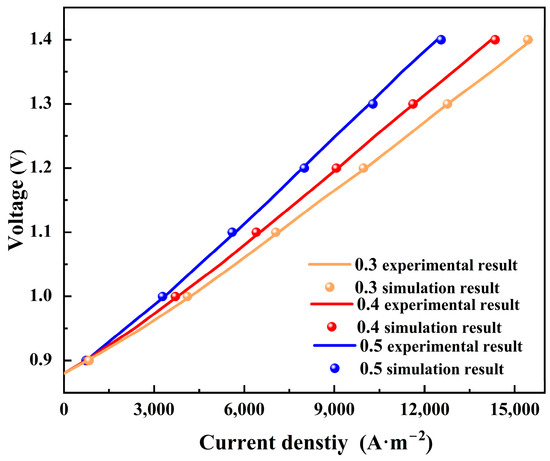
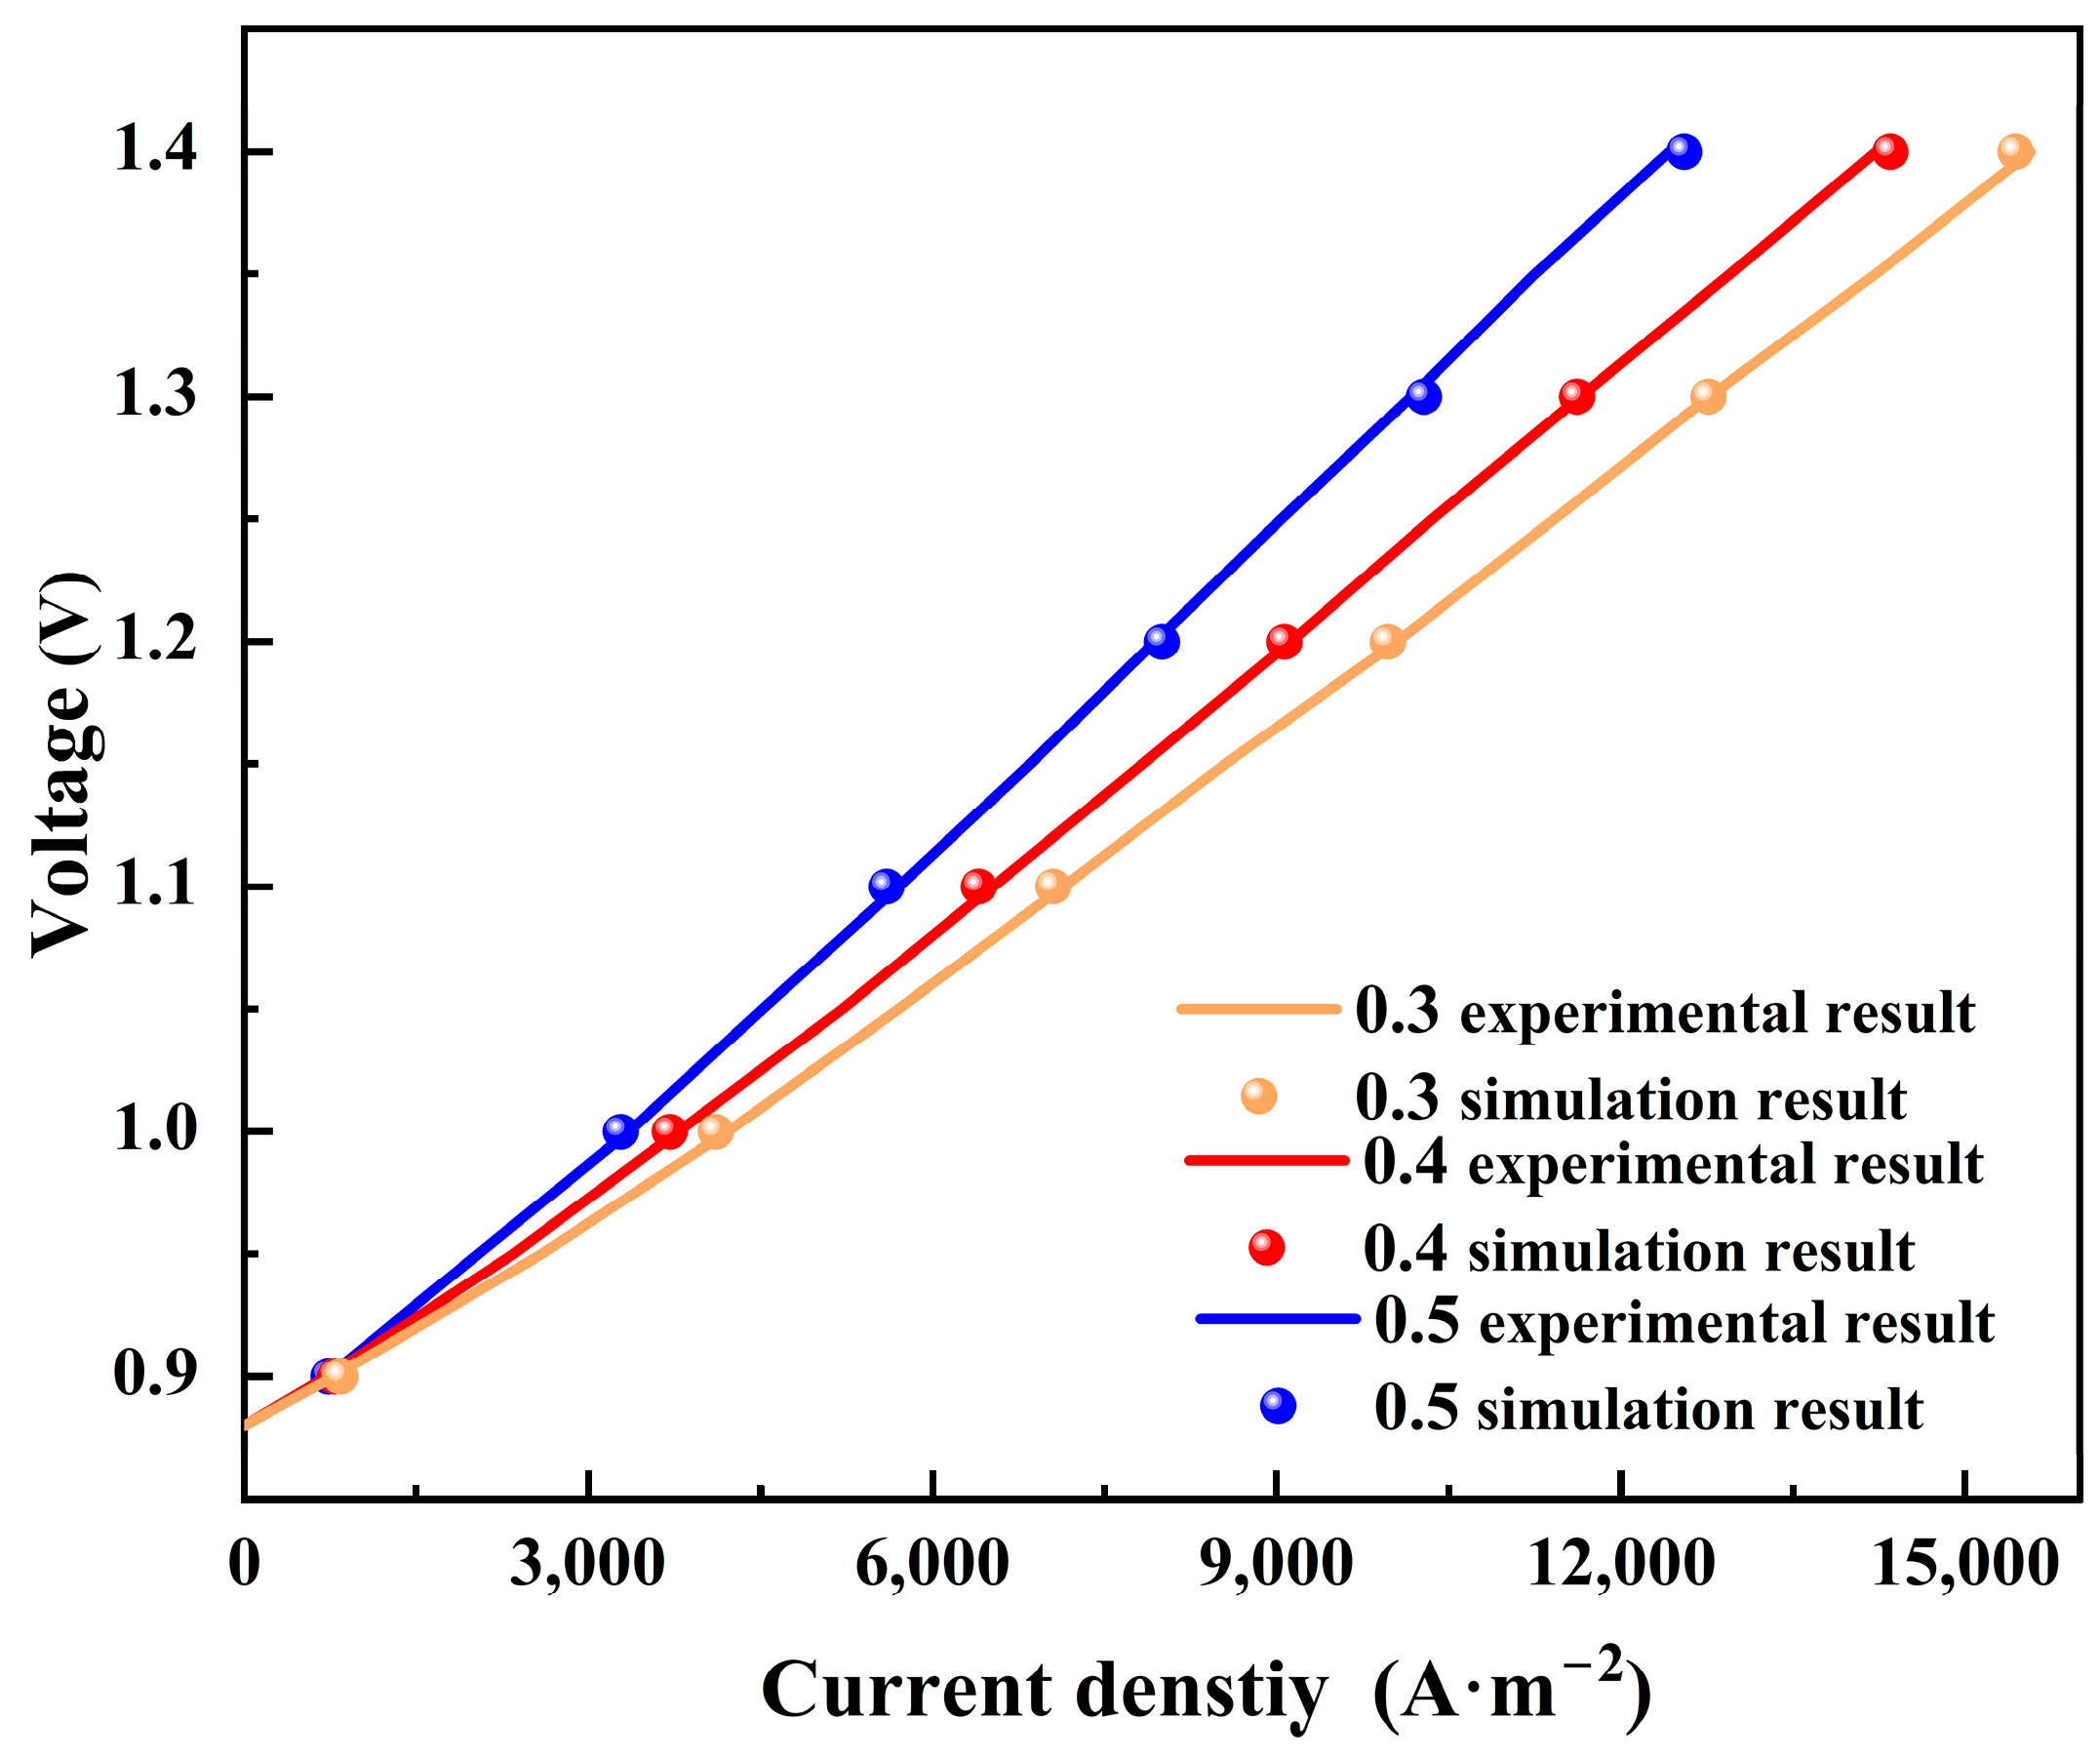
Model validation was conducted by comparing the simulated voltage–current density curve with the experimental data reported by Lin et al. [19], as presented in Figure 3. The close agreement between the numerical and experimental results confirms the accuracy and reliability of the proposed SOEC model. To validate the present model, the data from Ref. [16] were used. Figure 4 compares the simulated and experimental voltage–current density curves for SOECs with anode porosities of 0.3, 0.4, and 0.5. The simulated results are in good agreement with the experimental data, and the model successfully reproduces the performance variation with porosity. This agreement indicates that the present microstructure-informed model can reasonably capture the influence of anode microstructure on SOEC electrochemical behavior.
Figure 3.
Comparison of model voltage-current density with experimental data [19].
Figure 4.
Comparison of simulated and experimental voltage–current density curves at different anode porosities. Experimental data are taken from Ref. [16].
3. Results
In this study, the effects of key anode structural parameters, including porosity, particle size, and anode thickness, on SOEC performance are systematically investigated. Because these parameters influence current density through different mechanisms, their synergistic interactions are further analyzed to elucidate their combined impact on overall cell performance. In addition, the electrolysis voltage significantly affects the I–V characteristics and polarization losses of SOECs. Previous studies have demonstrated that an operating voltage of 1.7 V can achieve relatively high current densities [36,37,38]. Therefore, the present study focuses on evaluating the influence of anode structural variations on SOEC performance under a fixed operating voltage of 1.7 V. During the parametric analysis, only one structural parameter was varied at a time, while all other parameters were kept constant to isolate its individual effect.
3.1. Effect of Anode Porosity on Current Density
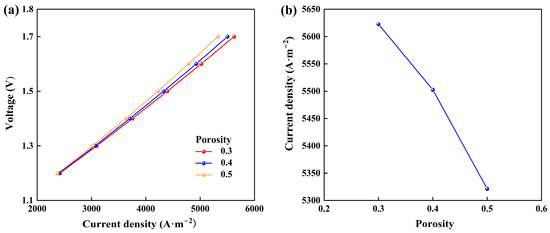
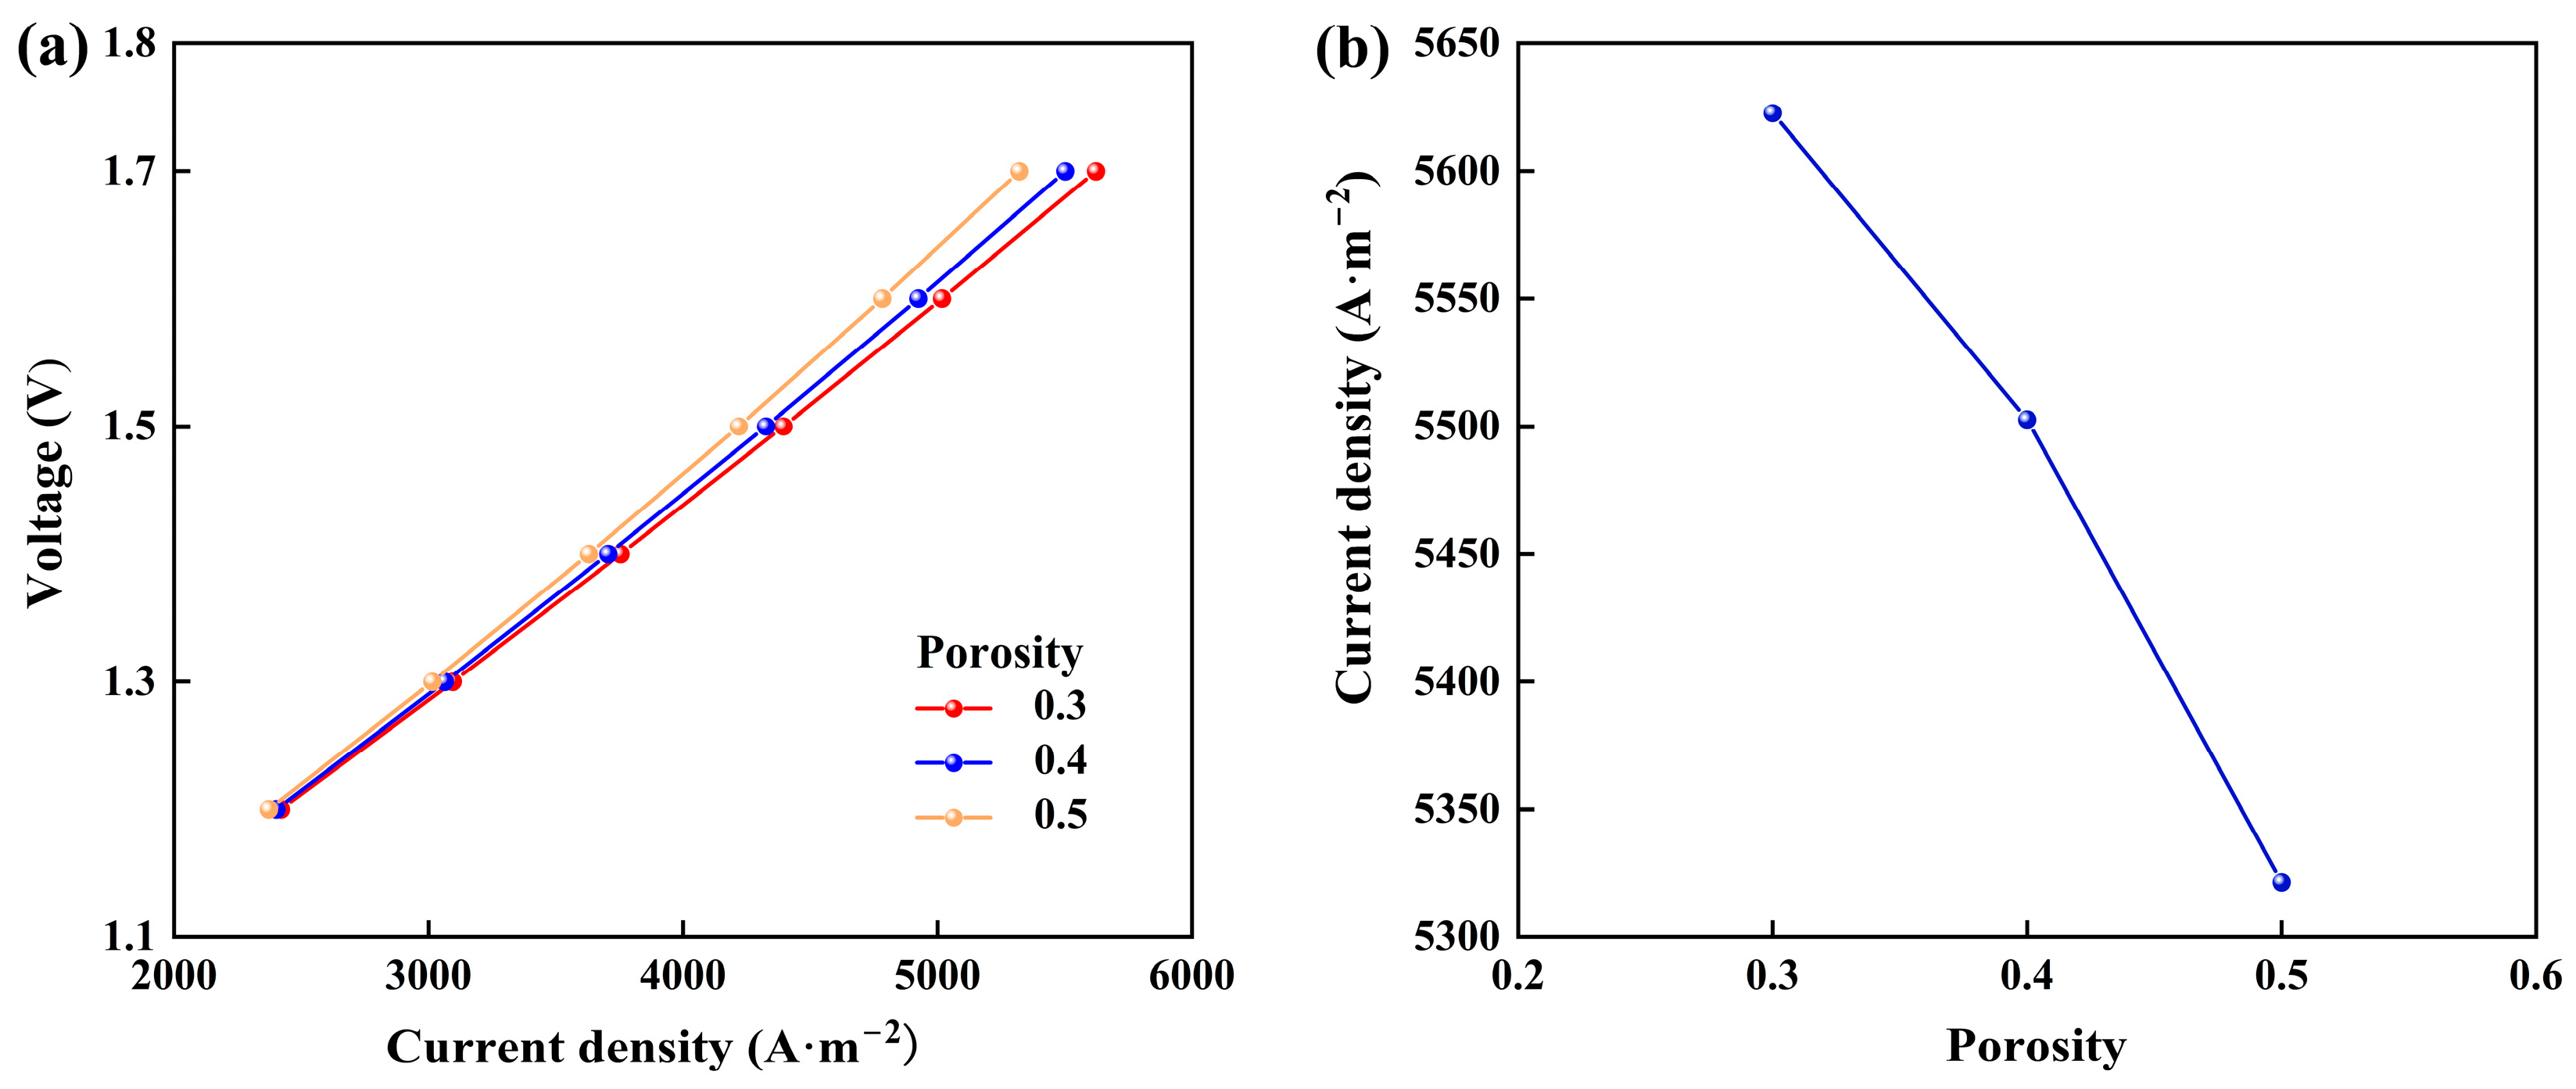
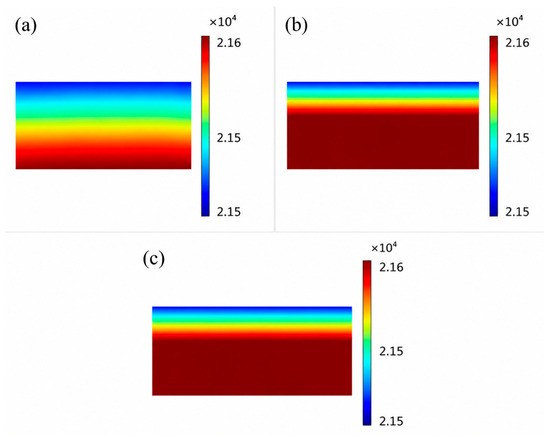
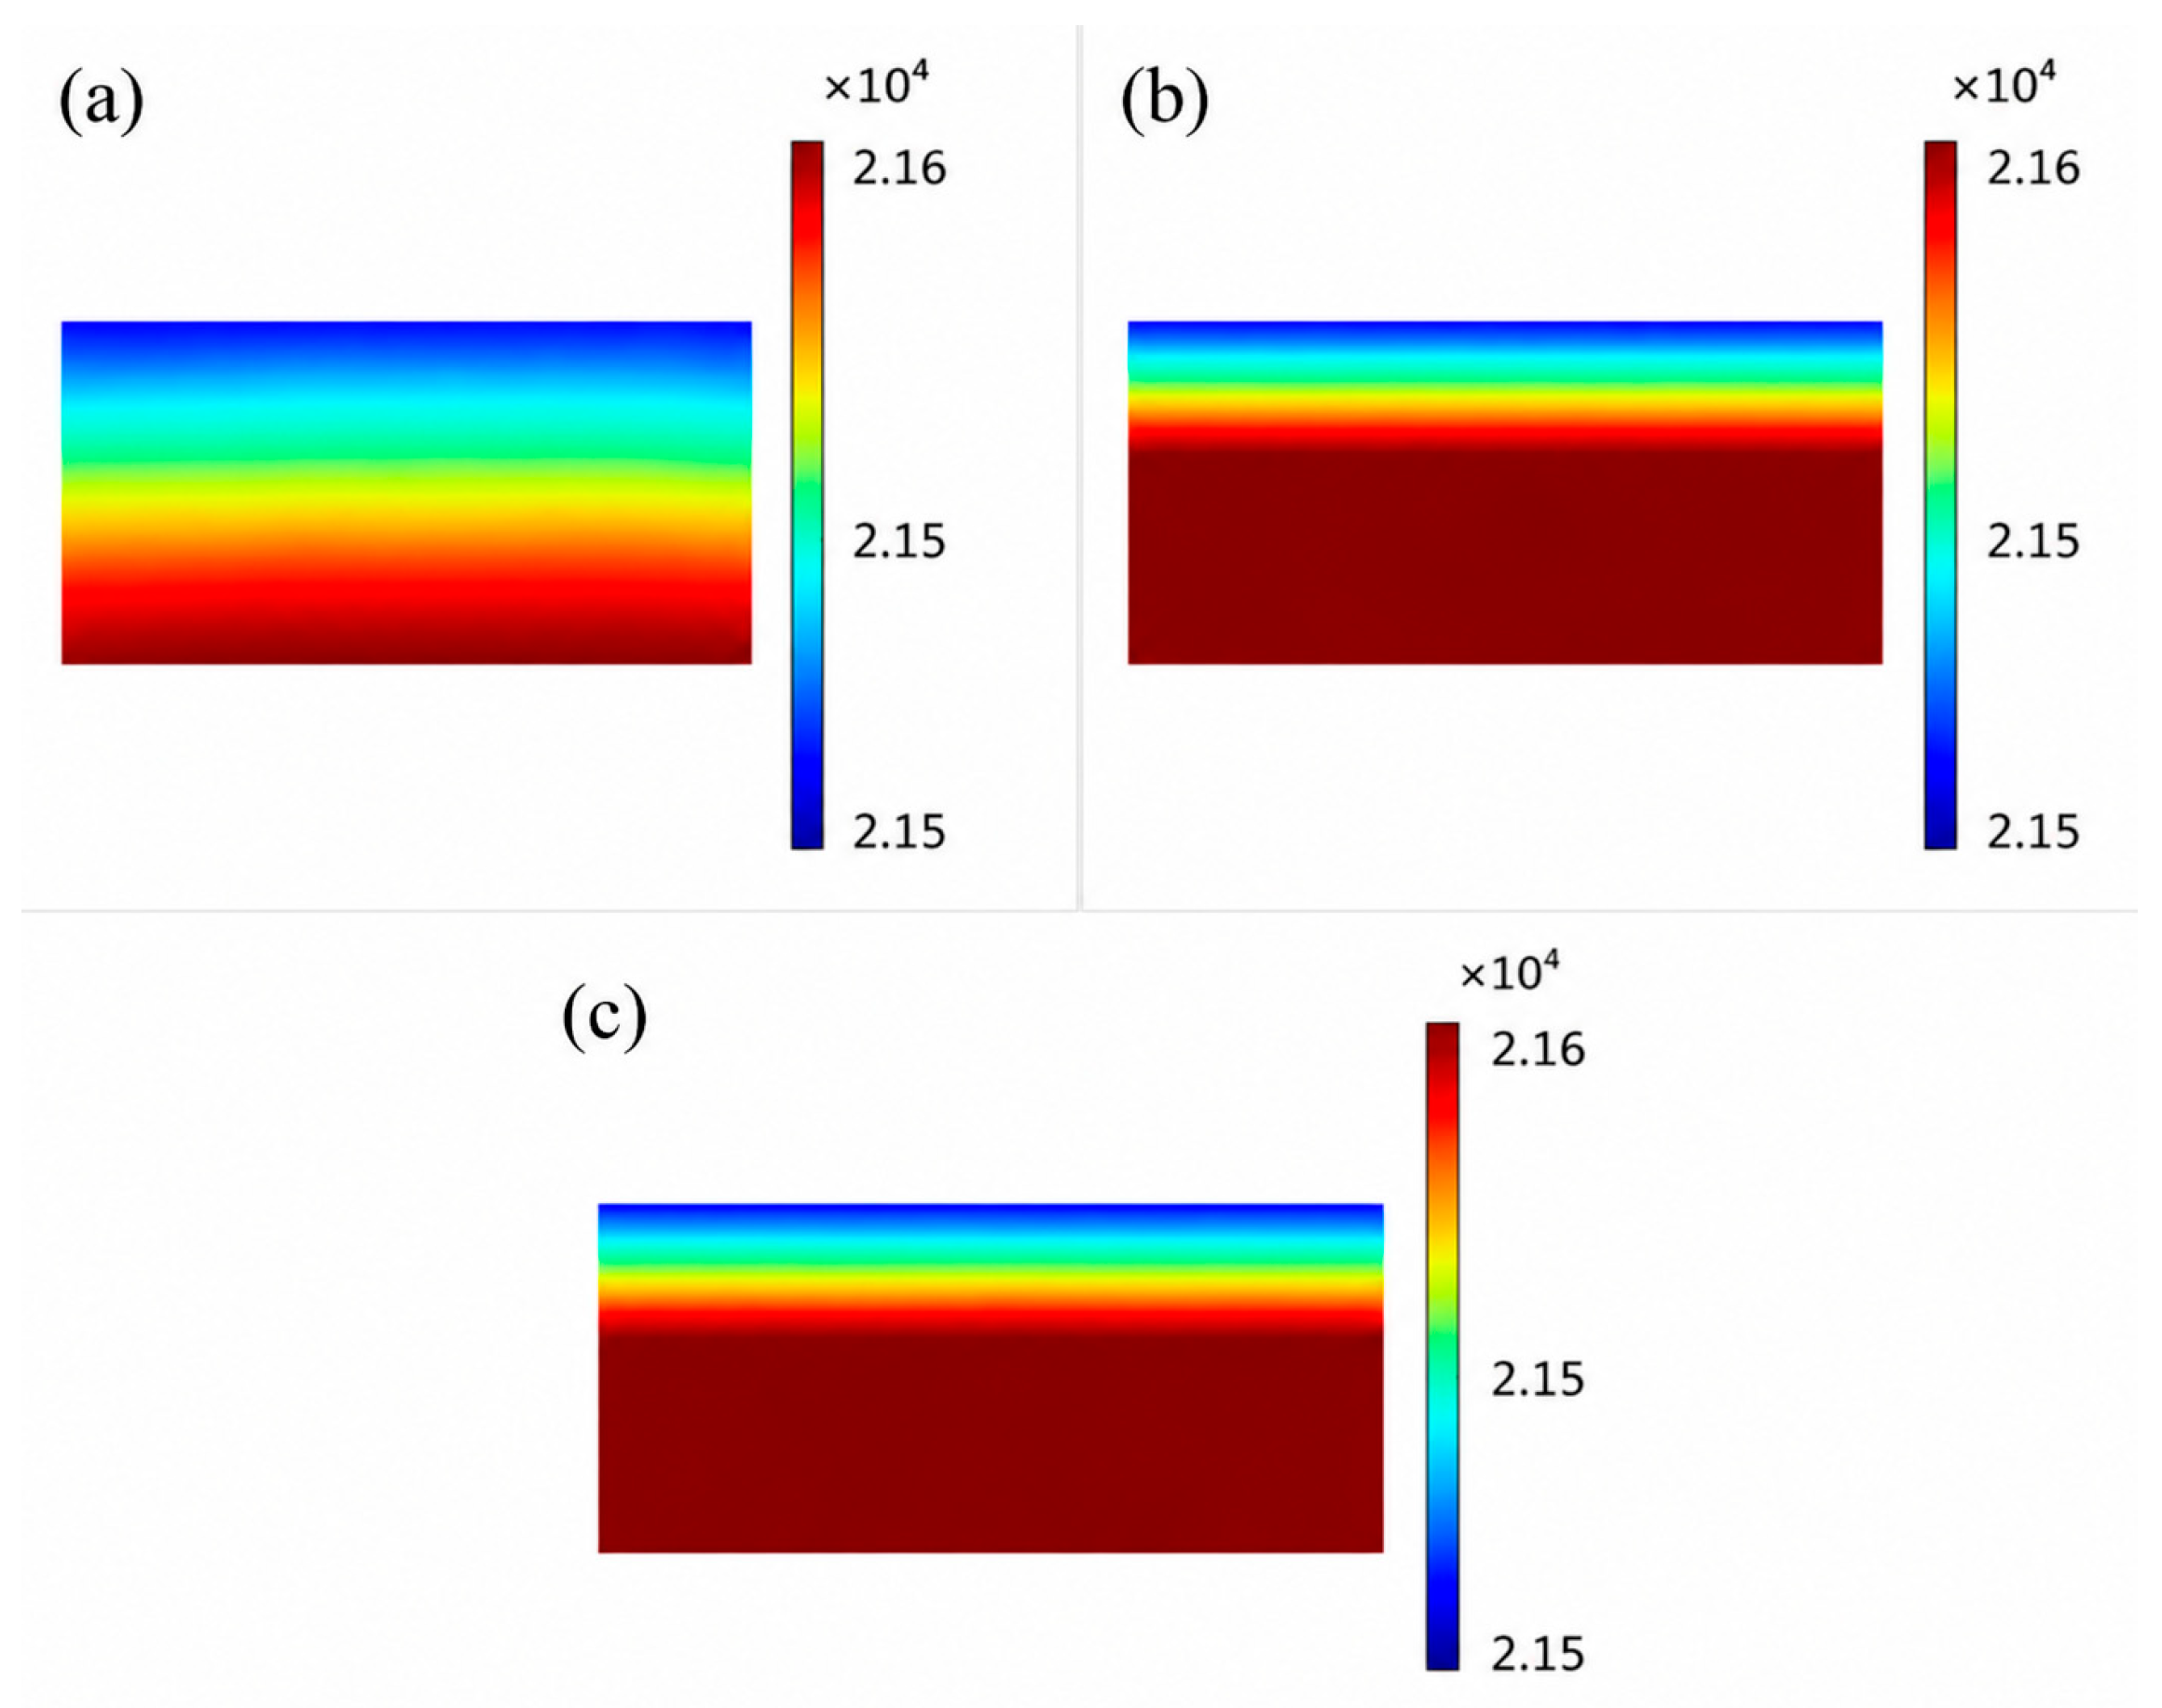
The typical adjustable porosity range of the anode layer is 0.3–0.5 [39]. To evaluate the influence of porosity on SOEC performance, current density curves were simulated within this range, as shown in Figure 5a. When porosity was varied, the corresponding effective transport and reaction parameters were updated according to the microstructure closure relations, while all other operating conditions were kept constant. At relatively low electrolysis voltages, porosity has only a minor effect on current density, mainly because the demand for electrochemically active sites and the oxygen evolution rate remain low. However, as the electrolysis voltage increases, the influence of porosity becomes more pronounced. For a given voltage, increasing porosity reduces the current density because the number of electrochemically active sites becomes insufficient to sustain the higher reaction rates. As shown in Figure 5b, when porosity increases from 0.3 to 0.5, the current density at 1.7 V decreases from 5622 to 5321 A m−2. Conversely, excessively low porosity (<0.3) may lead to electrode densification. This restricts gas transport within the anode and consequently deteriorates the overall electrochemical performance [40]. As illustrated in Figure 6, oxygen tends to accumulate near the interface between the oxygen electrode and the electrolyte layer. Higher porosity facilitates gas transport within the porous electrode. This results in a more uniform distribution of oxygen partial pressure. In contrast, when the porosity decreases, oxygen transport becomes hindered and the local oxygen partial pressure increases. The elevated oxygen partial pressure may induce additional mechanical stress within the oxygen electrode. which may cause delamination at the electrode–electrolyte interface and consequently reduce the long-term durability of the SOEC.
Figure 5.
Effect of anode porosity on SOEC electrochemical performance: (a) I–V curves under different porosities; (b) variation in current density with porosity.
Figure 6.
Oxygen partial pressure distribution in the oxygen electrode at different porosities: (a) ε = 0.3, (b) ε = 0.4, and (c) ε = 0.5.
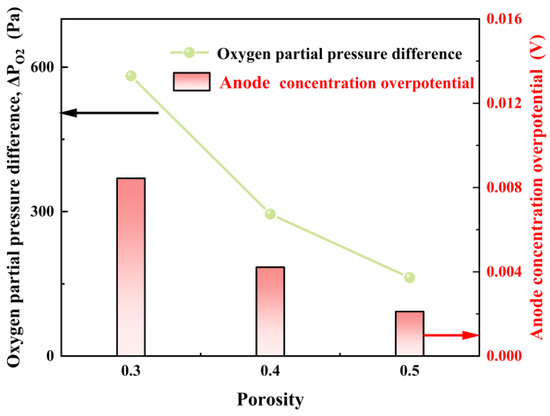
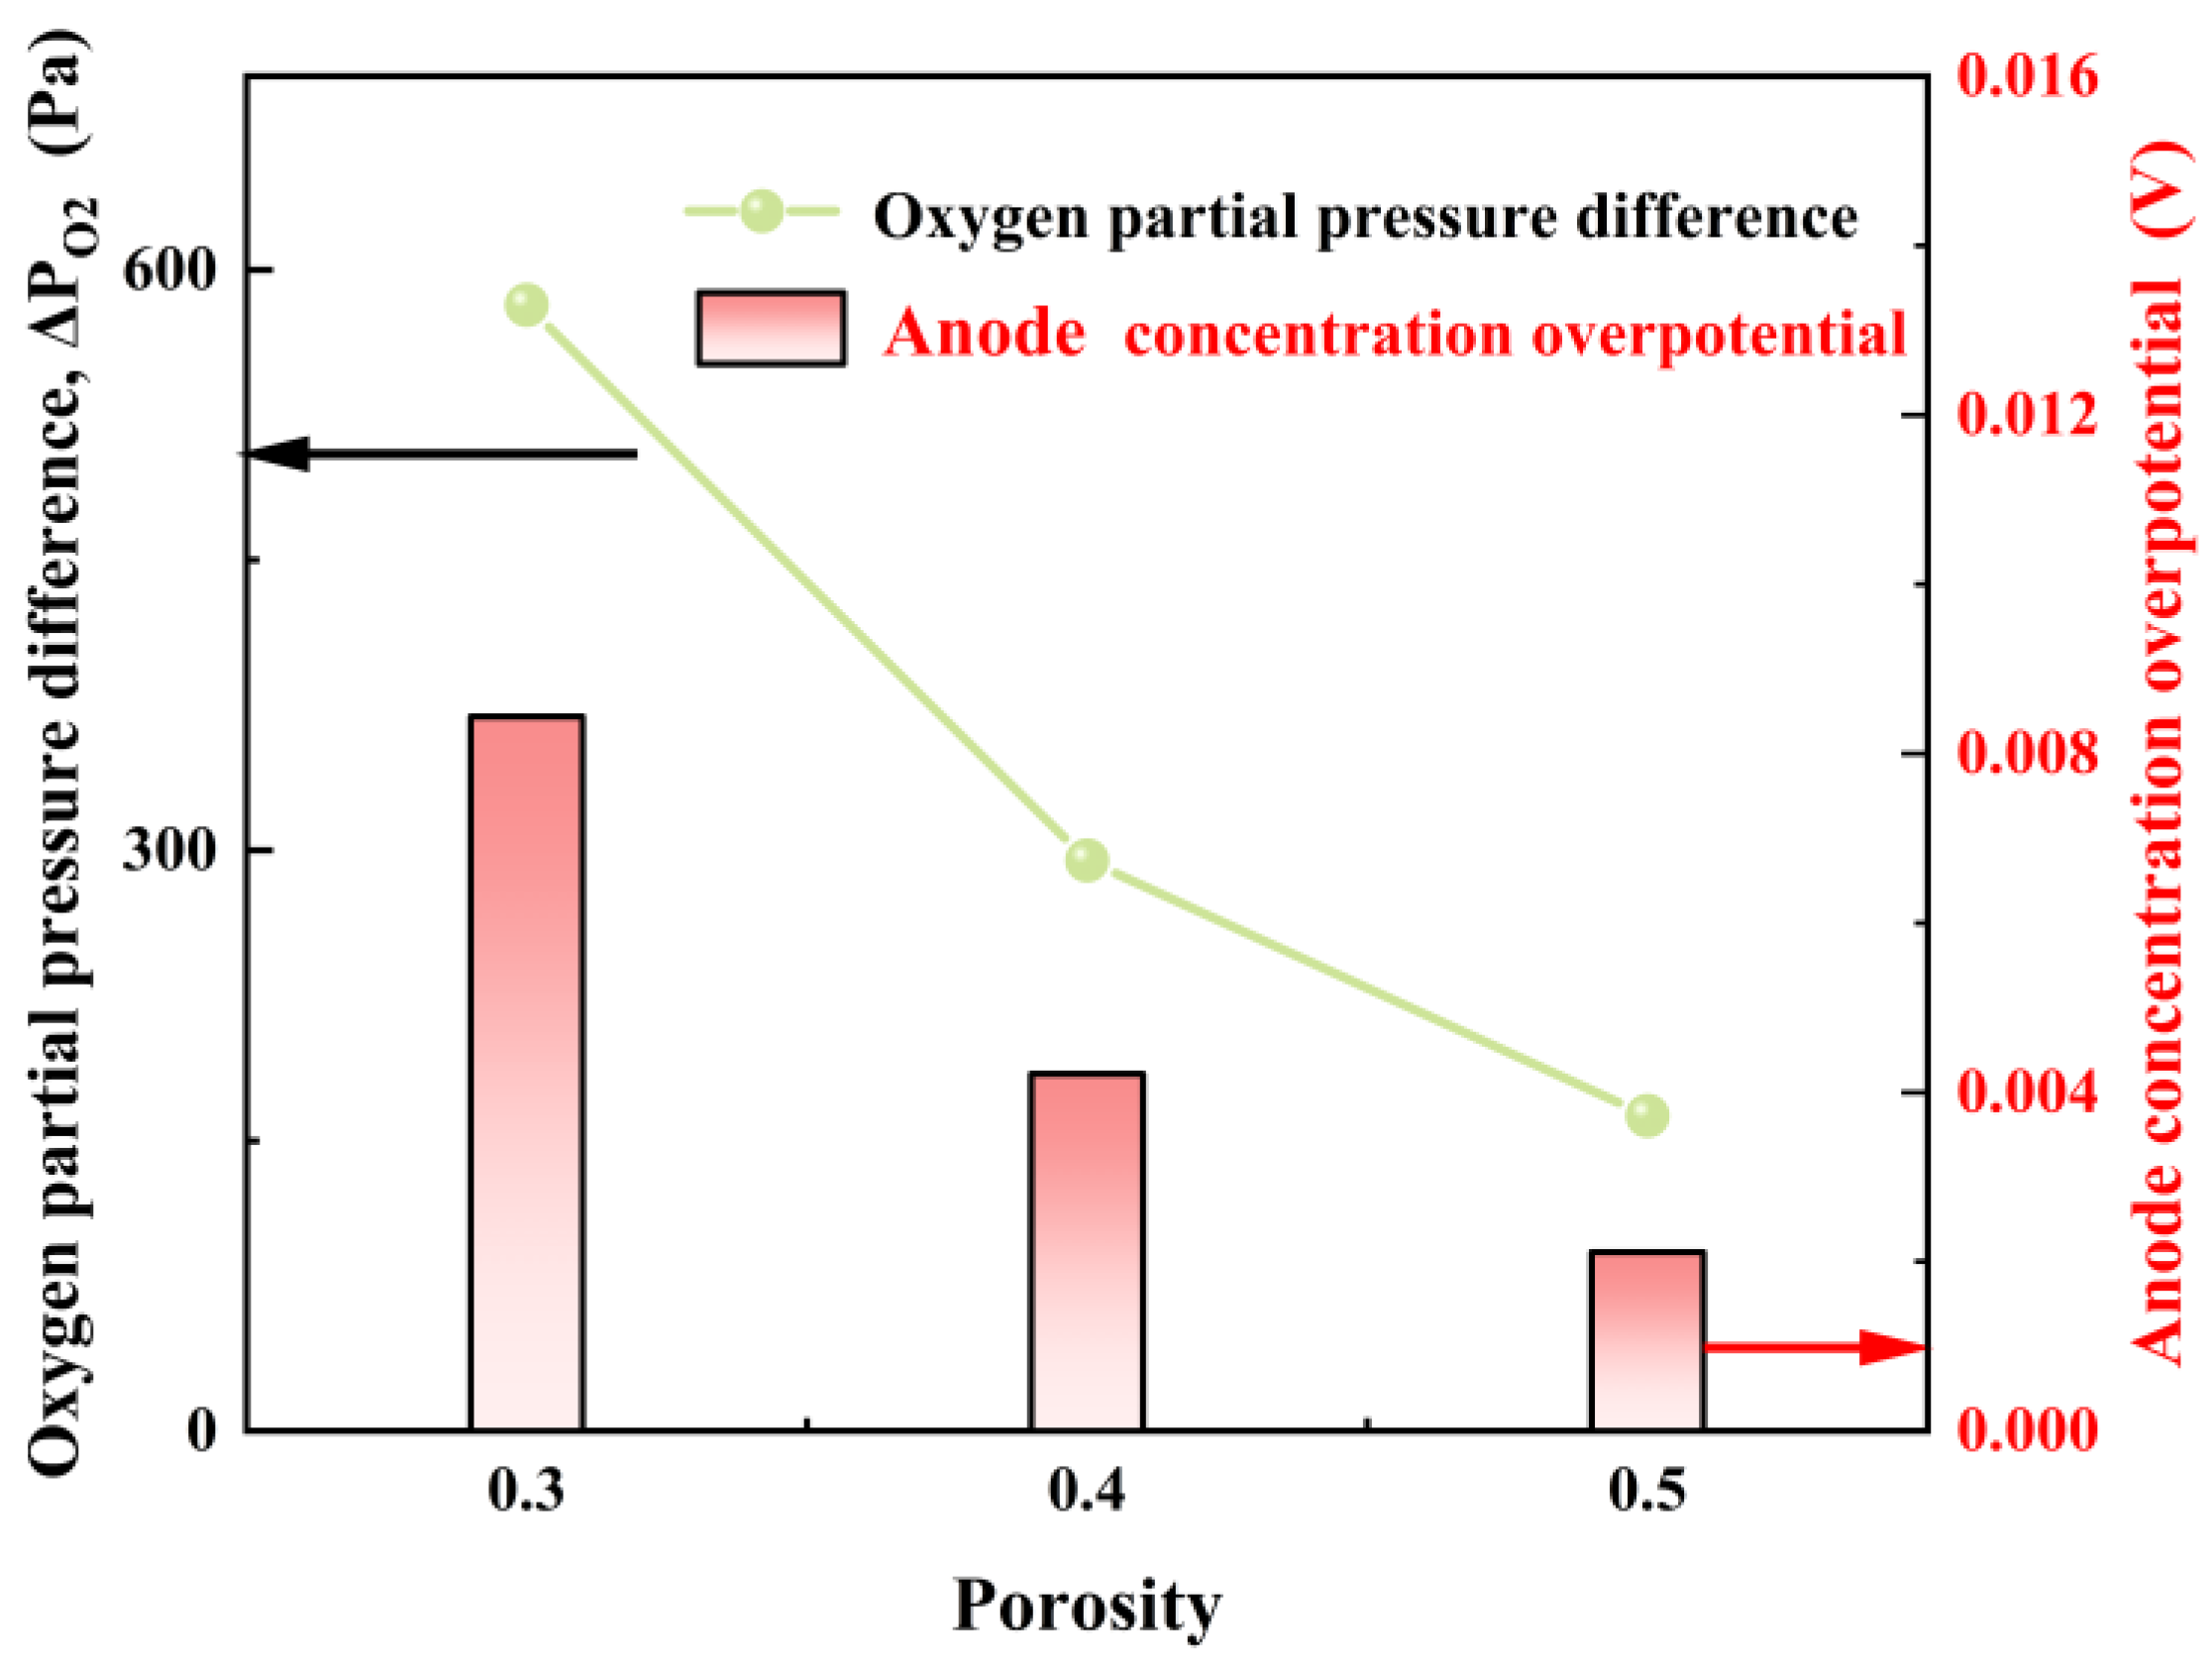
To quantitatively evaluate the diffusion limitation, the difference between the maximum and minimum oxygen partial pressures within the electrode (ΔpO2) was calculated. The results suggest that ΔpO2 reduces significantly from 583 Pa to 163 Pa as the porosity enhances, indicating that mass transport resistance is effectively alleviated at higher porosity levels.
To quantitatively evaluate the diffusion limitation, the difference between the maximum and minimum oxygen partial pressures within the electrode (ΔPO2) was calculated. Figure 7 illustrates the influence of anode porosity on oxygen transport limitation. Increasing porosity significantly reduces the oxygen partial pressure difference across the anode, indicating enhanced removal of the oxygen generated during the electrochemical reaction. Correspondingly, the anode concentration overpotential also declines, confirming that the mass-transfer resistance is weakened at higher porosity. This behavior can be attributed to the enlarged pore space and reduced diffusion resistance in the porous electrode. Hence, increasing porosity helps suppress oxygen accumulation and mitigates concentration polarization in the anode. These results indicate that particle size primarily controls the density of active reaction sites through its influence on TPB length. However, under conditions of restricted pore transport, smaller particles also intensify oxygen accumulation and concentration polarization. Therefore, particle size should be regarded as a reaction-dominant parameter with transport-related side effects.
Figure 7.
Influence of anode porosity on oxygen partial pressure difference and concentration overpotential in SOEC.
3.2. Effect of Particle Size on Current Density
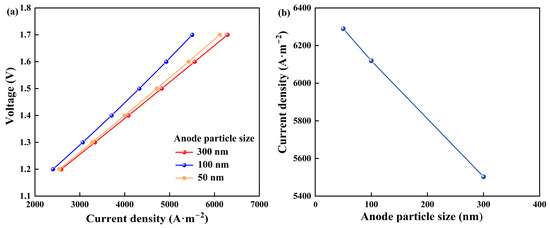
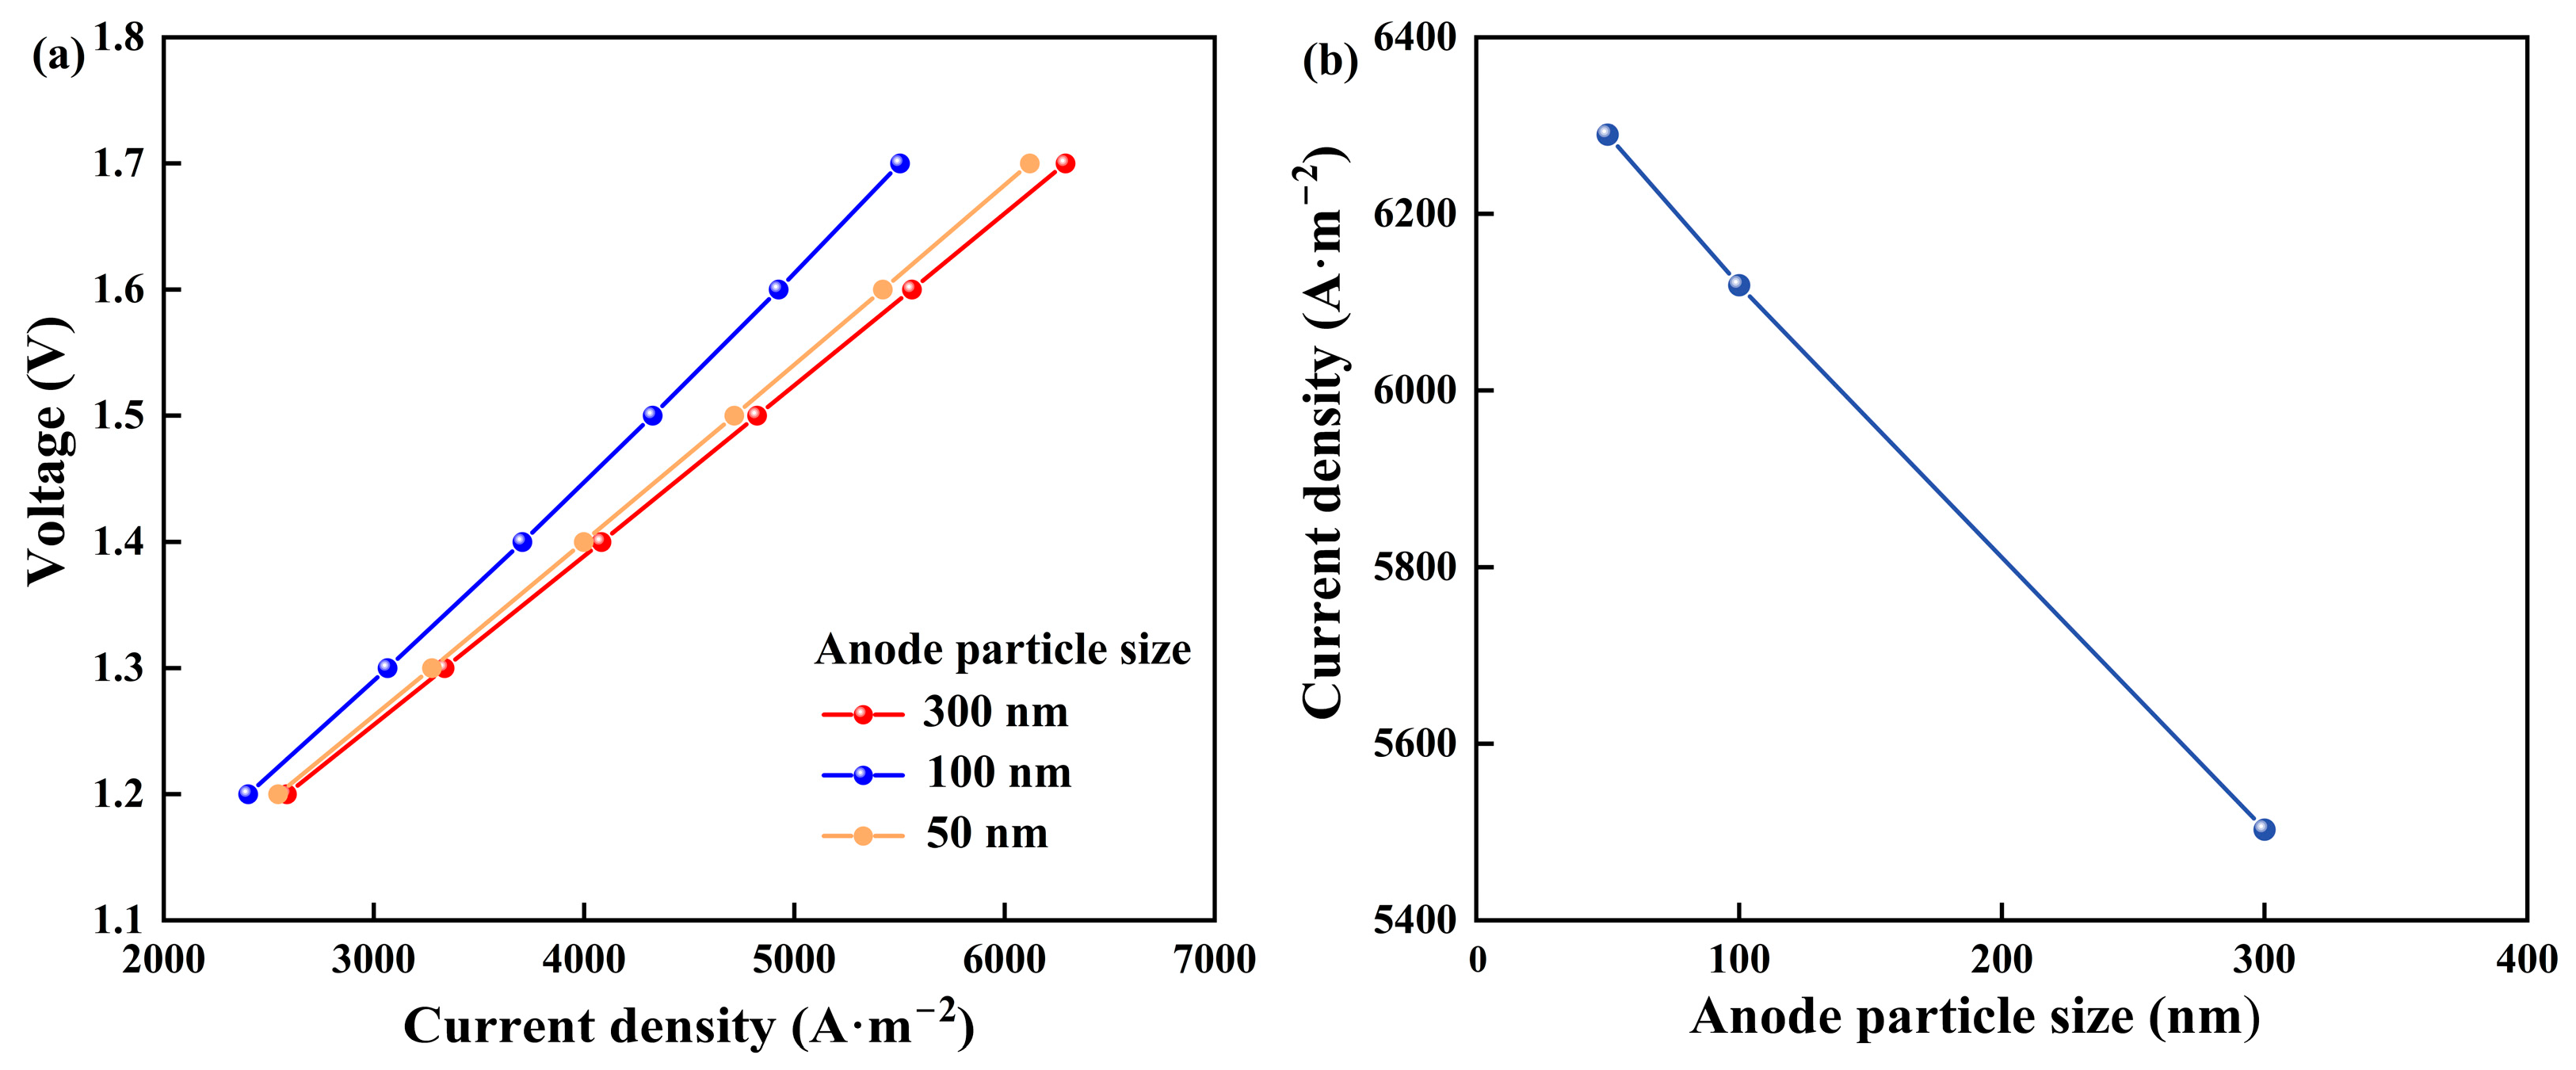
In this model, the influence of anode particle size on SOEC performance was investigated by varying the particle size while keeping all other parameters constant. As shown in Figure 8a, decreasing the anode particle diameter results in a noticeable increase in current density, and this effect becomes more pronounced at higher electrolysis voltages. This behavior can be attributed to the reduction in triple-phase boundary (TPB) length associated with increasing particle diameter, which reduces the number of electrochemically active reaction sites and consequently decreases the current density, as illustrated in Figure 8b. At an operating voltage of 1.7 V, the current density increases approximately linearly as the particle size decreases.
Figure 8.
Effect of anode particle size on SOEC electrochemical performance: (a) I–V curves under different particle sizes; (b) variation in current density with particle size.
Advances in material processing techniques can effectively reduce the particle size of anodes. Nevertheless, excessively small particles may enhance the charge-transfer resistance between adjacent grains and hinder gas transport within the anode, thereby aggravating concentration polarization [41].
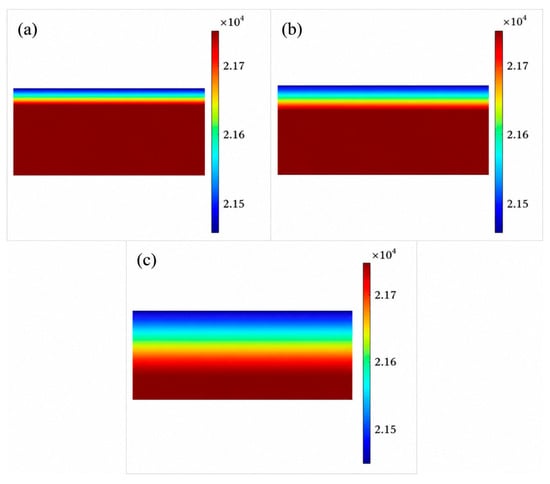
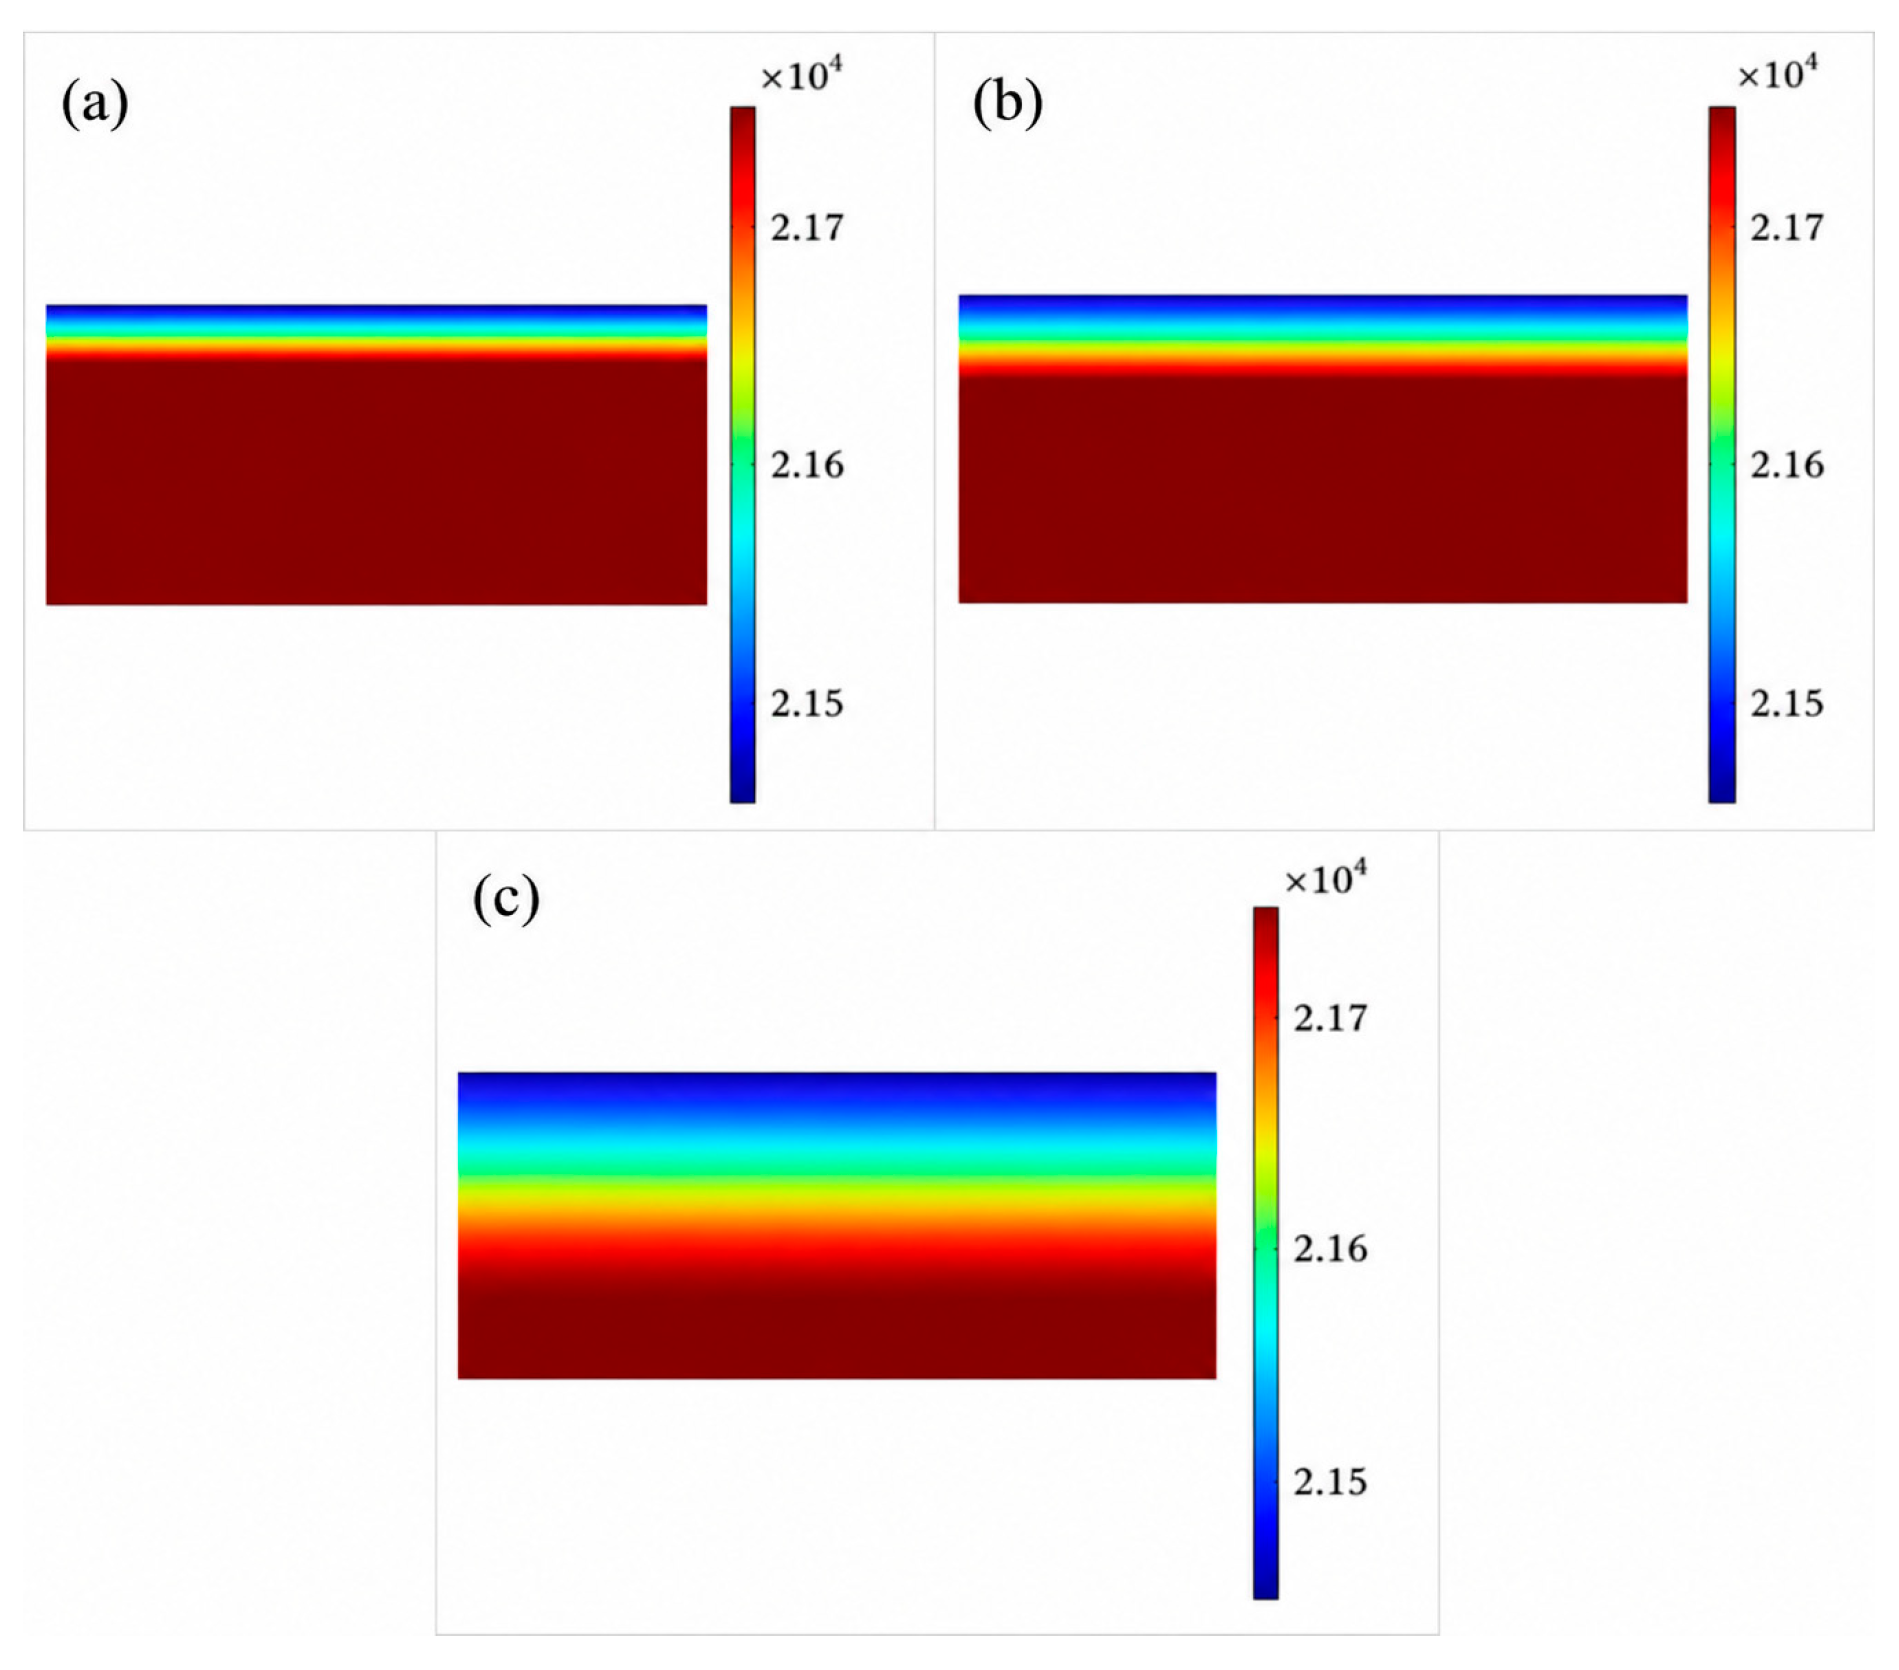
As shown in Figure 9a, as the particle size decreases, the oxygen partial pressure within the electrode increases and a steeper gradient is observed. This behavior is associated with the increase in active specific surface area at smaller particle sizes. According to the spherical particle framework, the reaction surface area is inversely proportional to the particle diameter. Therefore, smaller particles enhance the electrochemical reaction rate and increase the local oxygen generation near the electrolyte interface. Since the effective diffusion coefficient is primarily governed by porosity and remains nearly unchanged with particle size, the intensified oxygen production leads to stronger oxygen accumulation and a larger concentration gradient within the electrode. These results indicate that although smaller particles improve electrochemical activity, they may also aggravate transport limitations and concentration polarization.
Figure 9.
Oxygen partial pressure distribution in the oxygen electrode at different particle size: (a) 50 nm, (b) 100 nm (c) 300 nm.
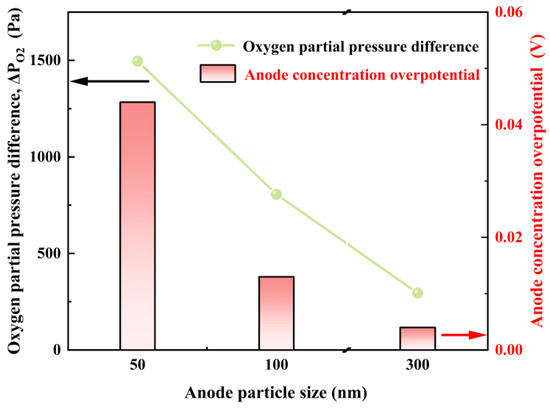
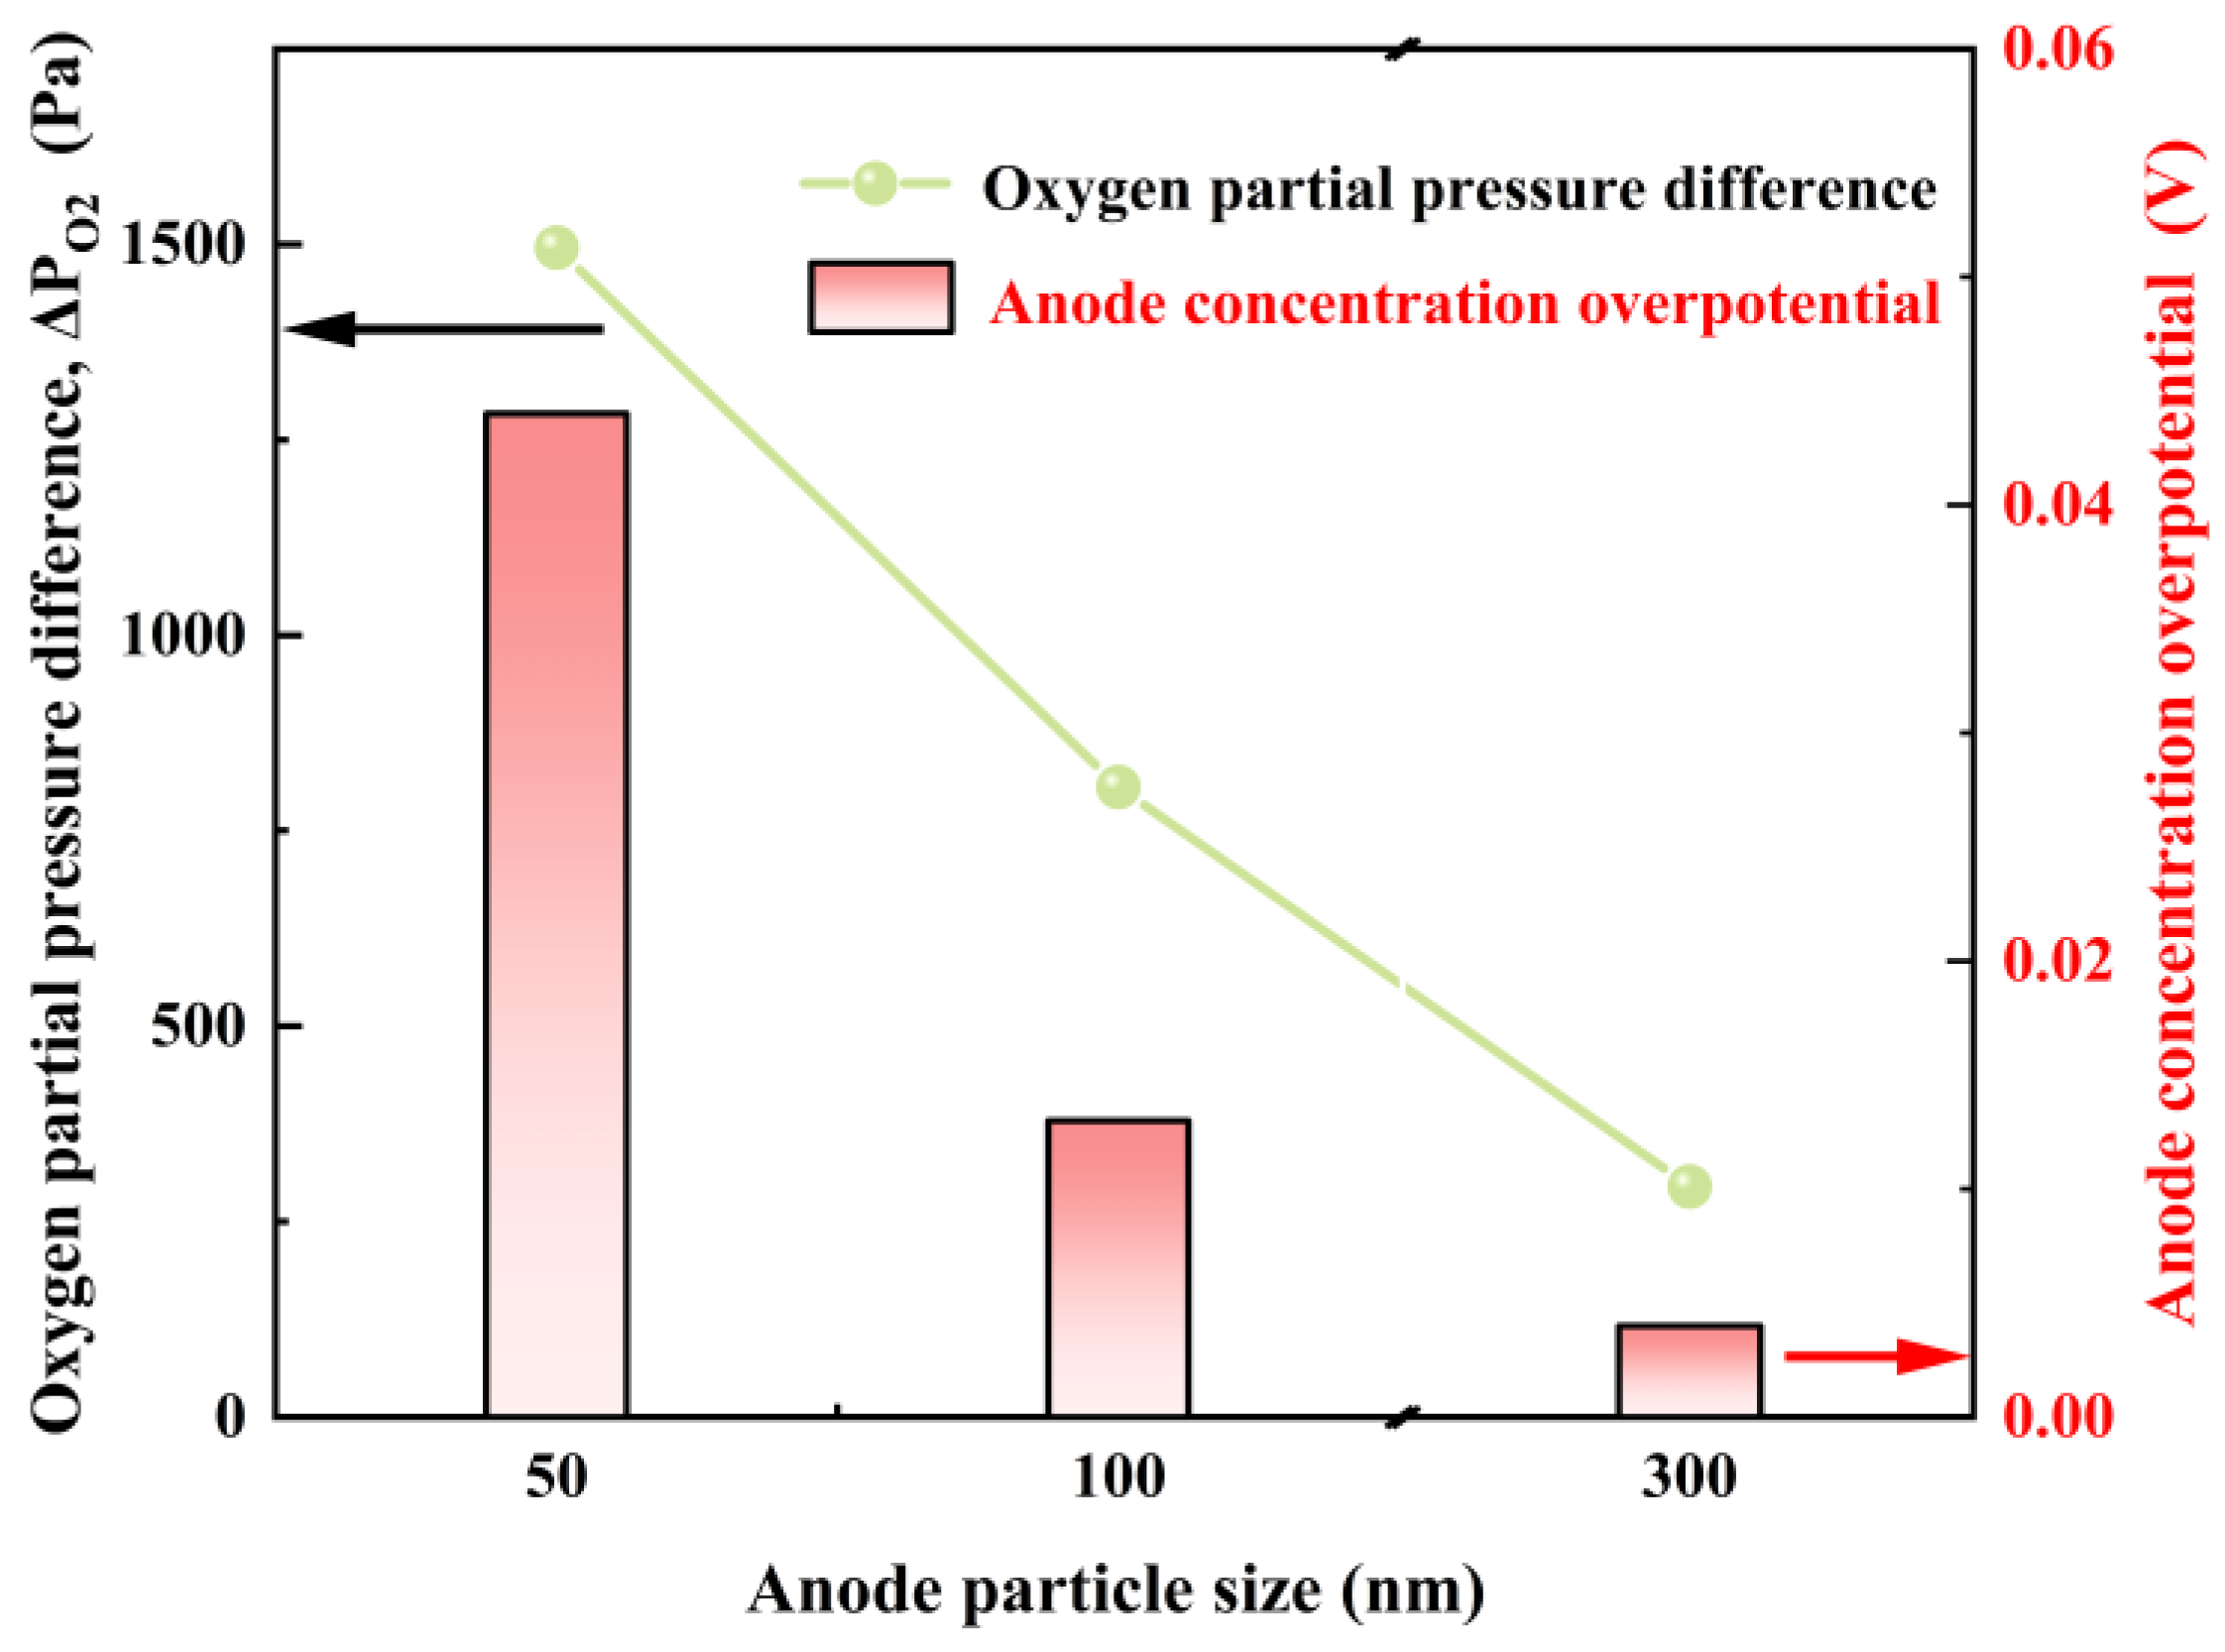
A similar transport-related trend is observed in Figure 10 for anode particle size. With increasing particle size, both the oxygen partial pressure difference and the concentration overpotential decrease markedly, indicating improved oxygen evacuation and lower diffusion resistance. These results suggest that particle size influences SOEC performance not only through electrochemical activity but also through its direct effect on oxygen transport behavior. Therefore, its role should be understood as a balance between reaction-site availability and gas diffusion capability. These results indicate that particle size primarily controls the density of active reaction sites through its influence on TPB length. However, under conditions of restricted pore transport, smaller particles also intensify oxygen accumulation and concentration polarization. Therefore, particle size should be regarded as a reaction-dominant parameter with transport-related side effects.
Figure 10.
Influence of anode particle size on oxygen partial pressure difference and concentration overpotential in SOEC.
3.3. Effect of Anode Thickness on Current Density
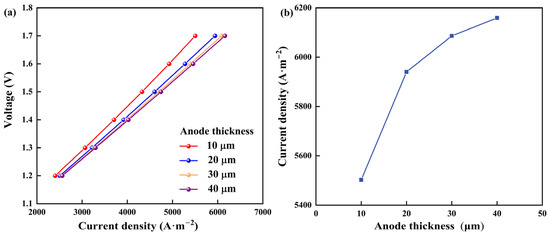
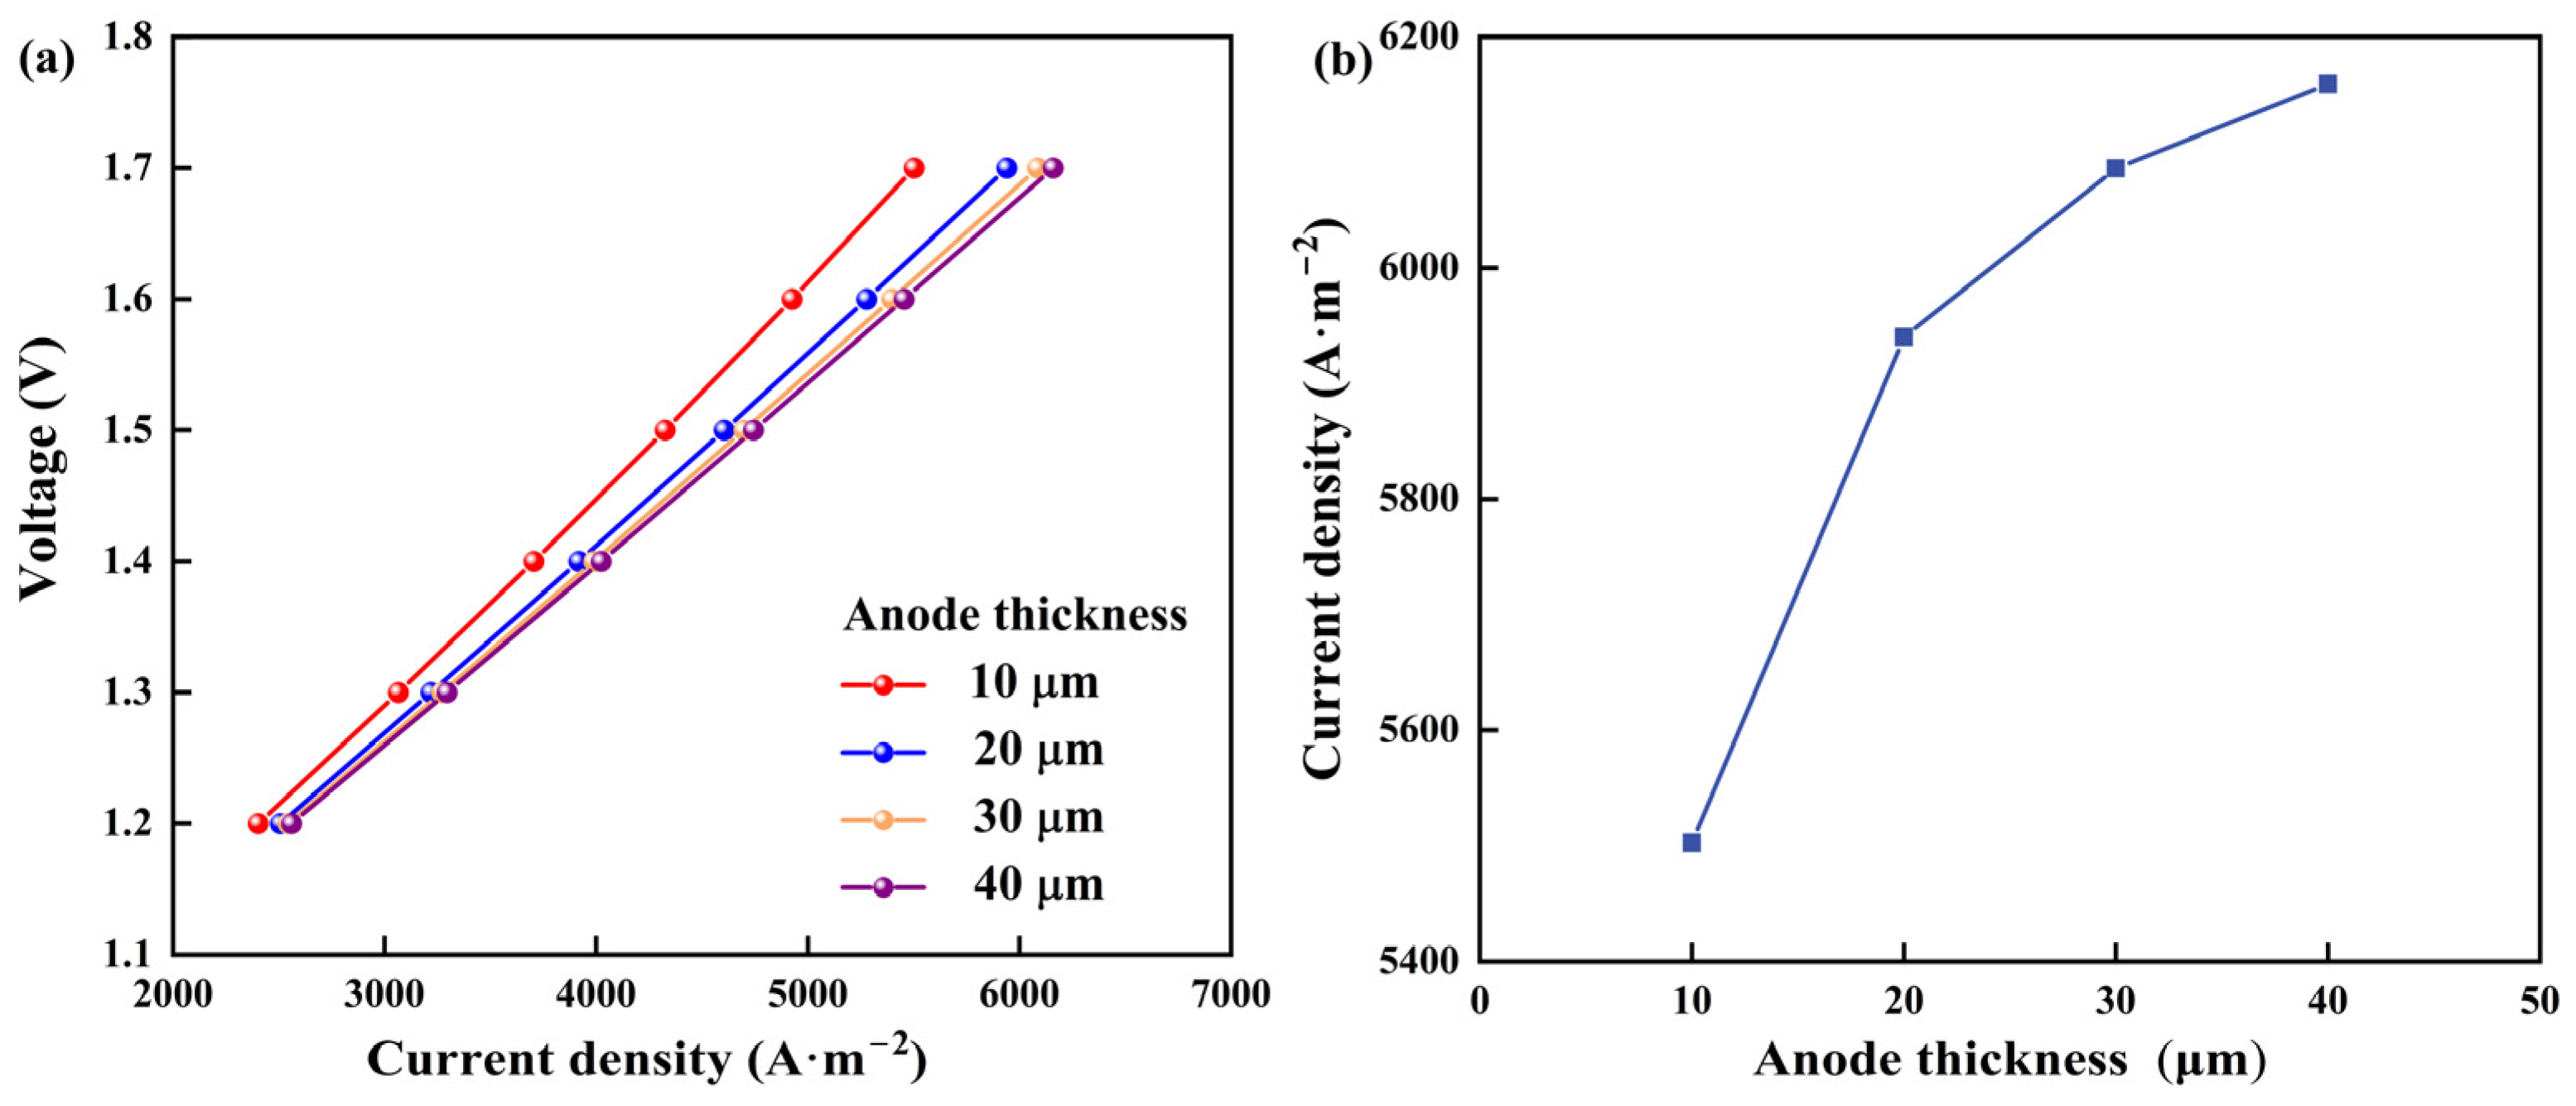
The thickness of the anode layer plays a critical role in determining the performance of solid oxide electrolysis cells (SOECs). As shown in Figure 11a, increasing the anode thickness from 10 μm to 20 μm leads to a noticeable increase in current density, from 5502 A m−2 to 5940 A m−2. This enhancement can be attributed to the enlarged reaction zone and the extended triple-phase boundary (TPB) provided by the thicker anode, which promote faster electrochemical reaction kinetics and higher current output. Although a thinner anode layer facilitates gas diffusion, the reduced number of electrochemically active sites limits the achievable current density.
Figure 11.
Effect of anode thickness on SOEC electrochemical performance: (a) I–V curves under different thickness; (b) variation in current density with thickness.
However, as shown in Figure 11b, further increasing the anode thickness from 20 μm to 40 μm results in only a marginal improvement in performance. While thicker anodes contain more active reaction sites, they also significantly impede gas transport within the electrode, thereby intensifying concentration polarization. In practical applications, excessively thick anode layers not only hinder oxygen transport but also increase fabrication complexity and material costs [42].
The diffusion path length plays a significant role in determining concentration polarization in porous electrodes. As the electrode thickness increases, the diffusion distance for oxygen transport becomes longer. This reduces the mass transport rate and promotes oxygen accumulation near the electrolyte interface. Consequently, a larger oxygen partial pressure gradient develops across the electrode. This results in enhanced concentration polarization.
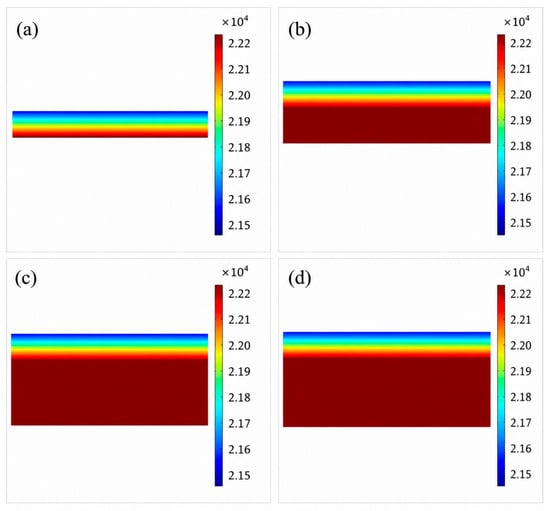
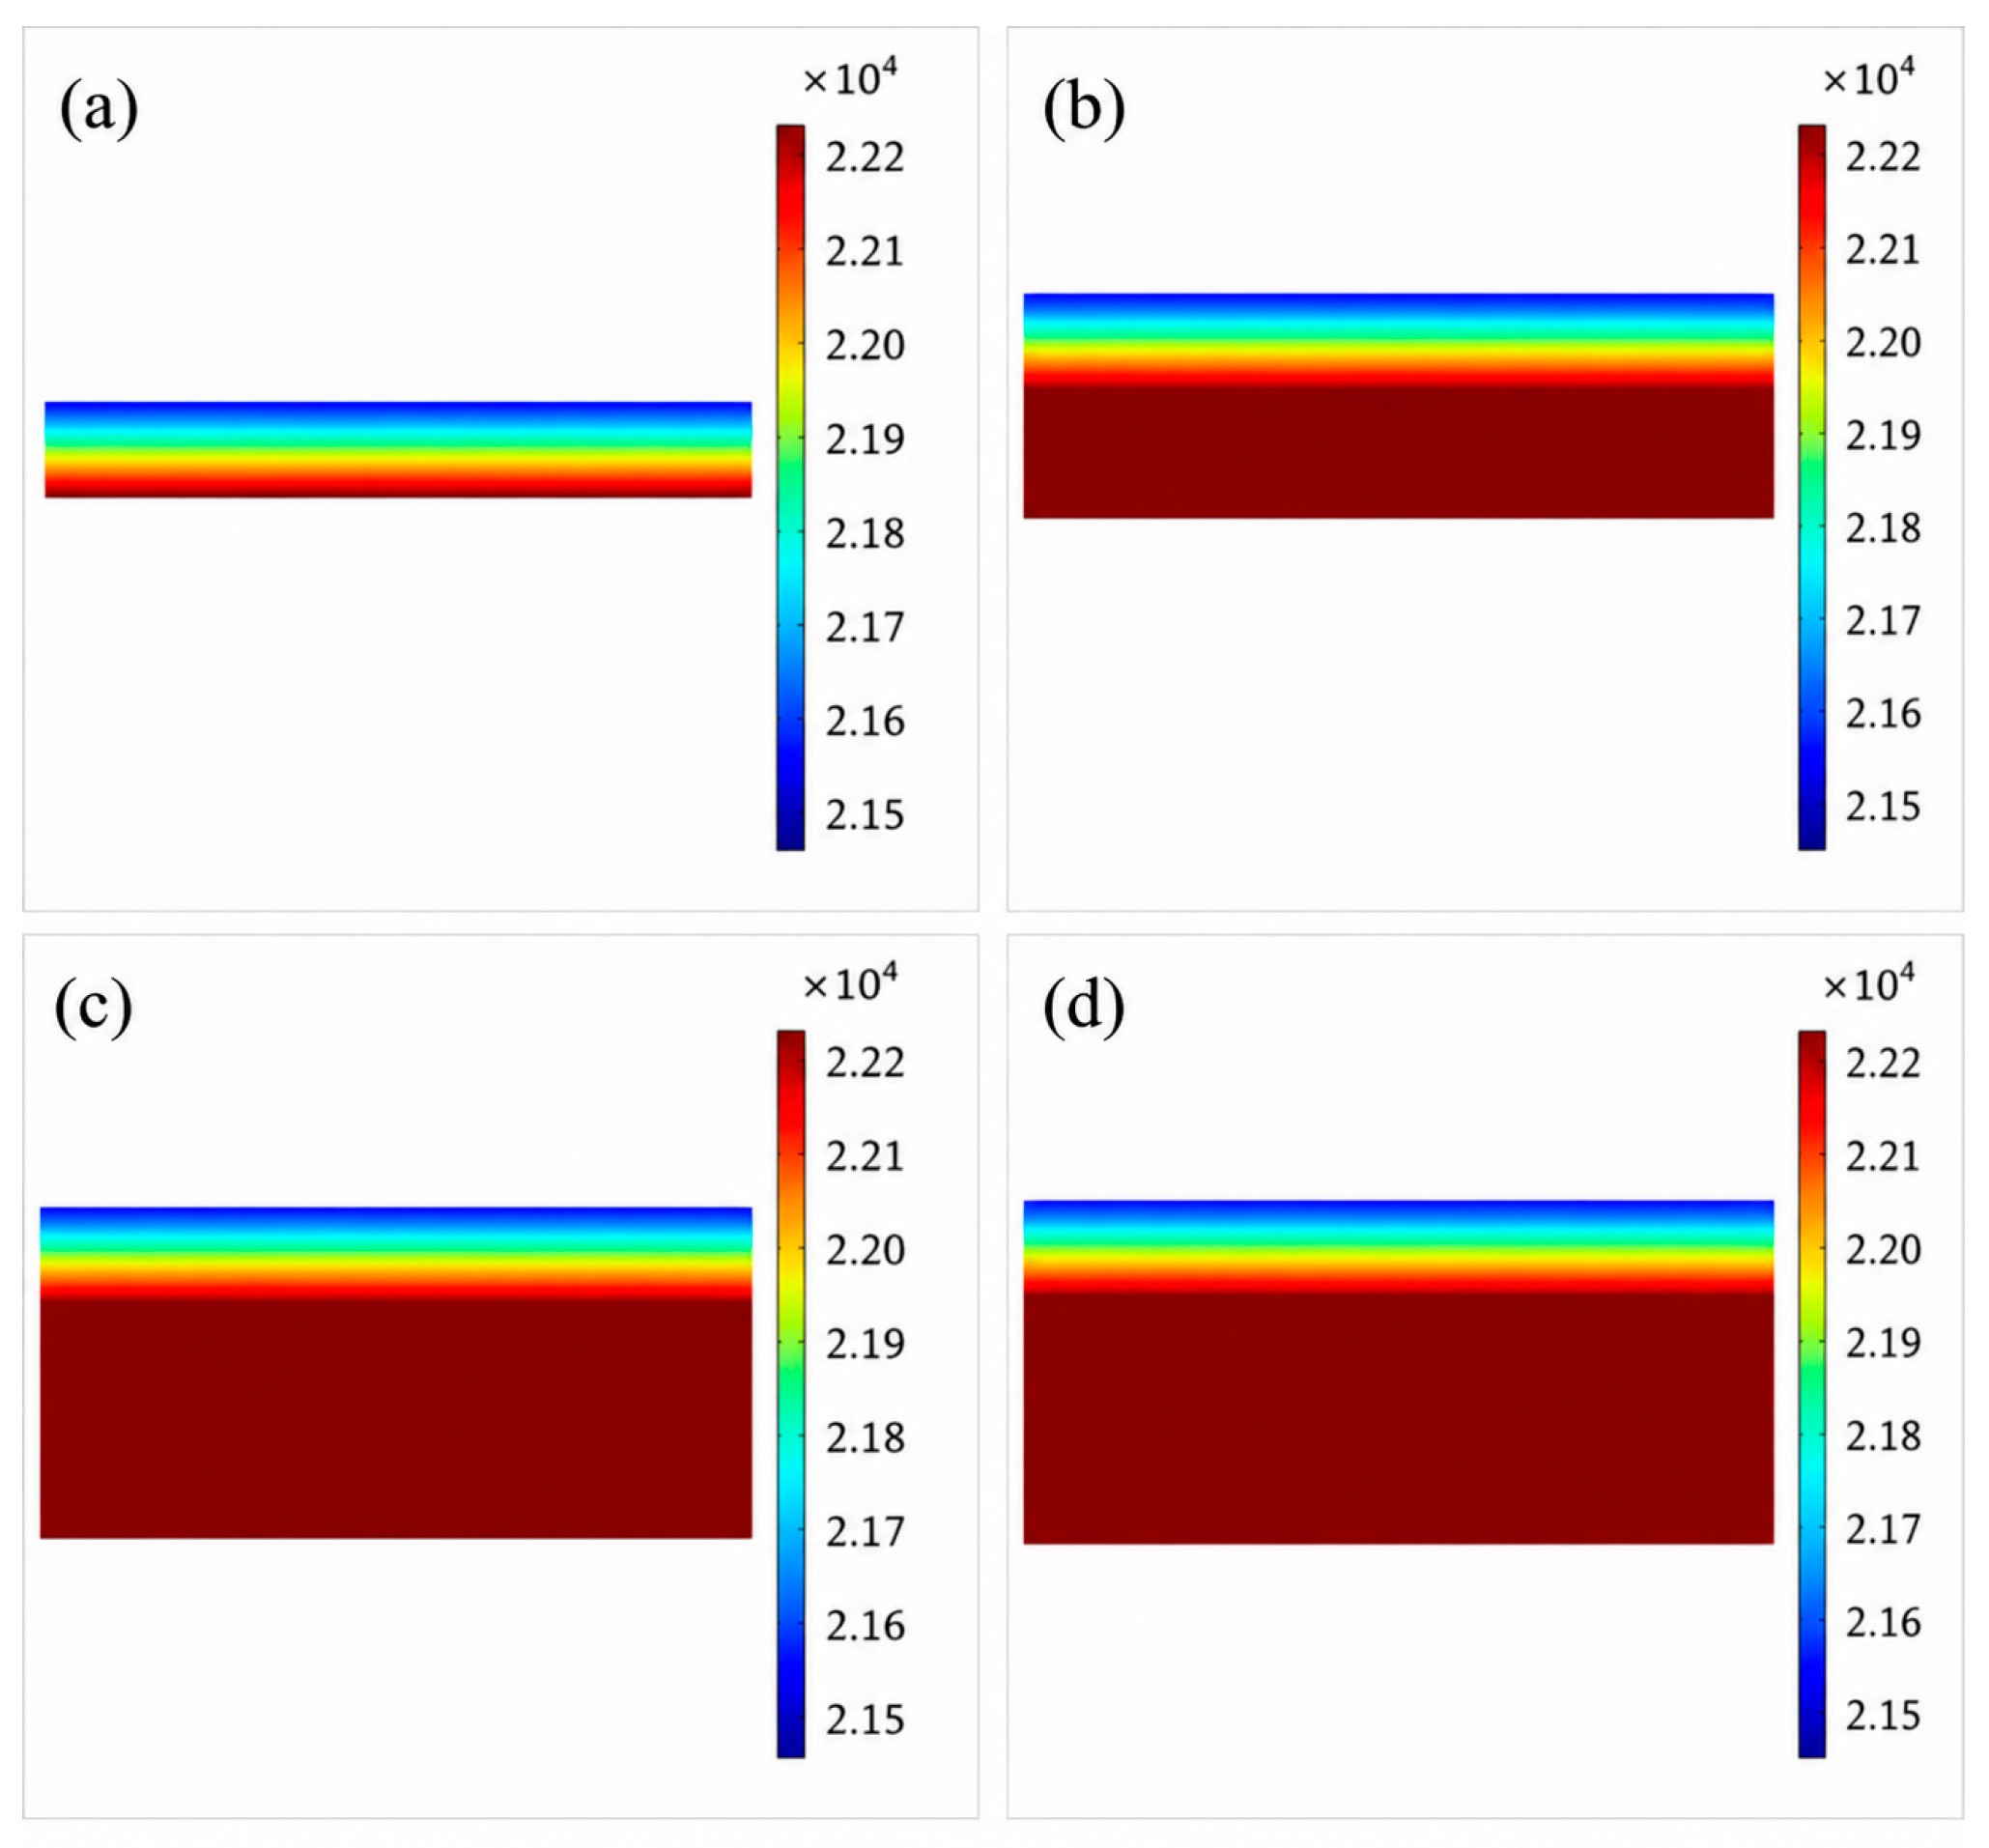
Figure 12 illustrates the oxygen partial pressure distribution in the oxygen electrode at different anode thicknesses. The diffusion path length plays a significant role in determining concentration polarization in porous electrodes. As the electrode thickness increases, the diffusion distance for oxygen transport becomes longer. This reduces the mass transport rate and promotes oxygen accumulation near the electrolyte interface. Consequently, a larger oxygen partial pressure gradient develops across the electrode. This results in enhanced concentration polarization.
Figure 12.
Oxygen partial pressure distribution in the oxygen electrode at different anode thickness: (a) 10 µm, (b) 20 µm, (c) 30 µm, (d) 40 µm.
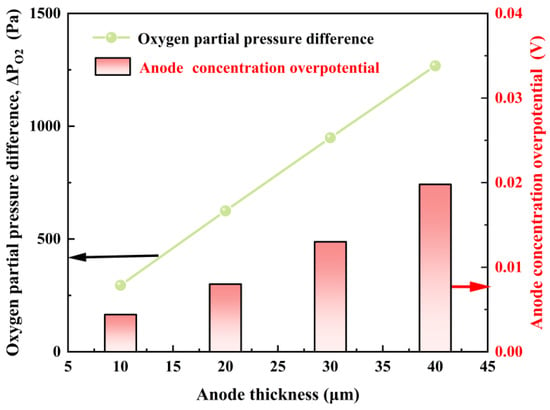
Figure 13 illustrates the oxygen partial pressure distribution within the anode at different electrode thicknesses. Oxygen is primarily generated at the anode–electrolyte interface due to the oxygen evolution reaction and therefore tends to accumulate in this region. As the anode thickness increases, the oxygen partial pressure within the electrode rises, and a more pronounced oxygen partial pressure gradient develops. This behavior results from the combined effects of oxygen generation and mass transport limitation. A thicker anode expands the electrochemically active region, thereby enhancing oxygen evolution and increasing the local oxygen concentration. At the same time, the longer diffusion pathway hinders oxygen transport toward the gas channel, further intensifying the concentration gradient within the electrode. These results indicate that although increasing anode thickness promotes reaction activity, excessive thickness aggravates transport resistance and leads to oxygen accumulation near the electrolyte interface. These results indicate that anode thickness determines the balance between active reaction region and diffusion path length. Increasing thickness initially improves performance by enlarging the electrochemically active region, but excessive thickness eventually causes transport limitation to dominate. Thus, thickness acts as a geometric trade-off parameter in SOEC anode design.
Figure 13.
Influence of anode thickness on oxygen partial pressure difference and concentration overpotential in SOEC.
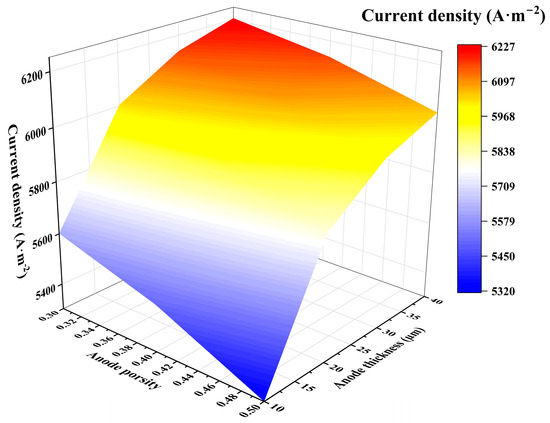
3.4. Effect of Common Variation in Anode Parameters on Current Density
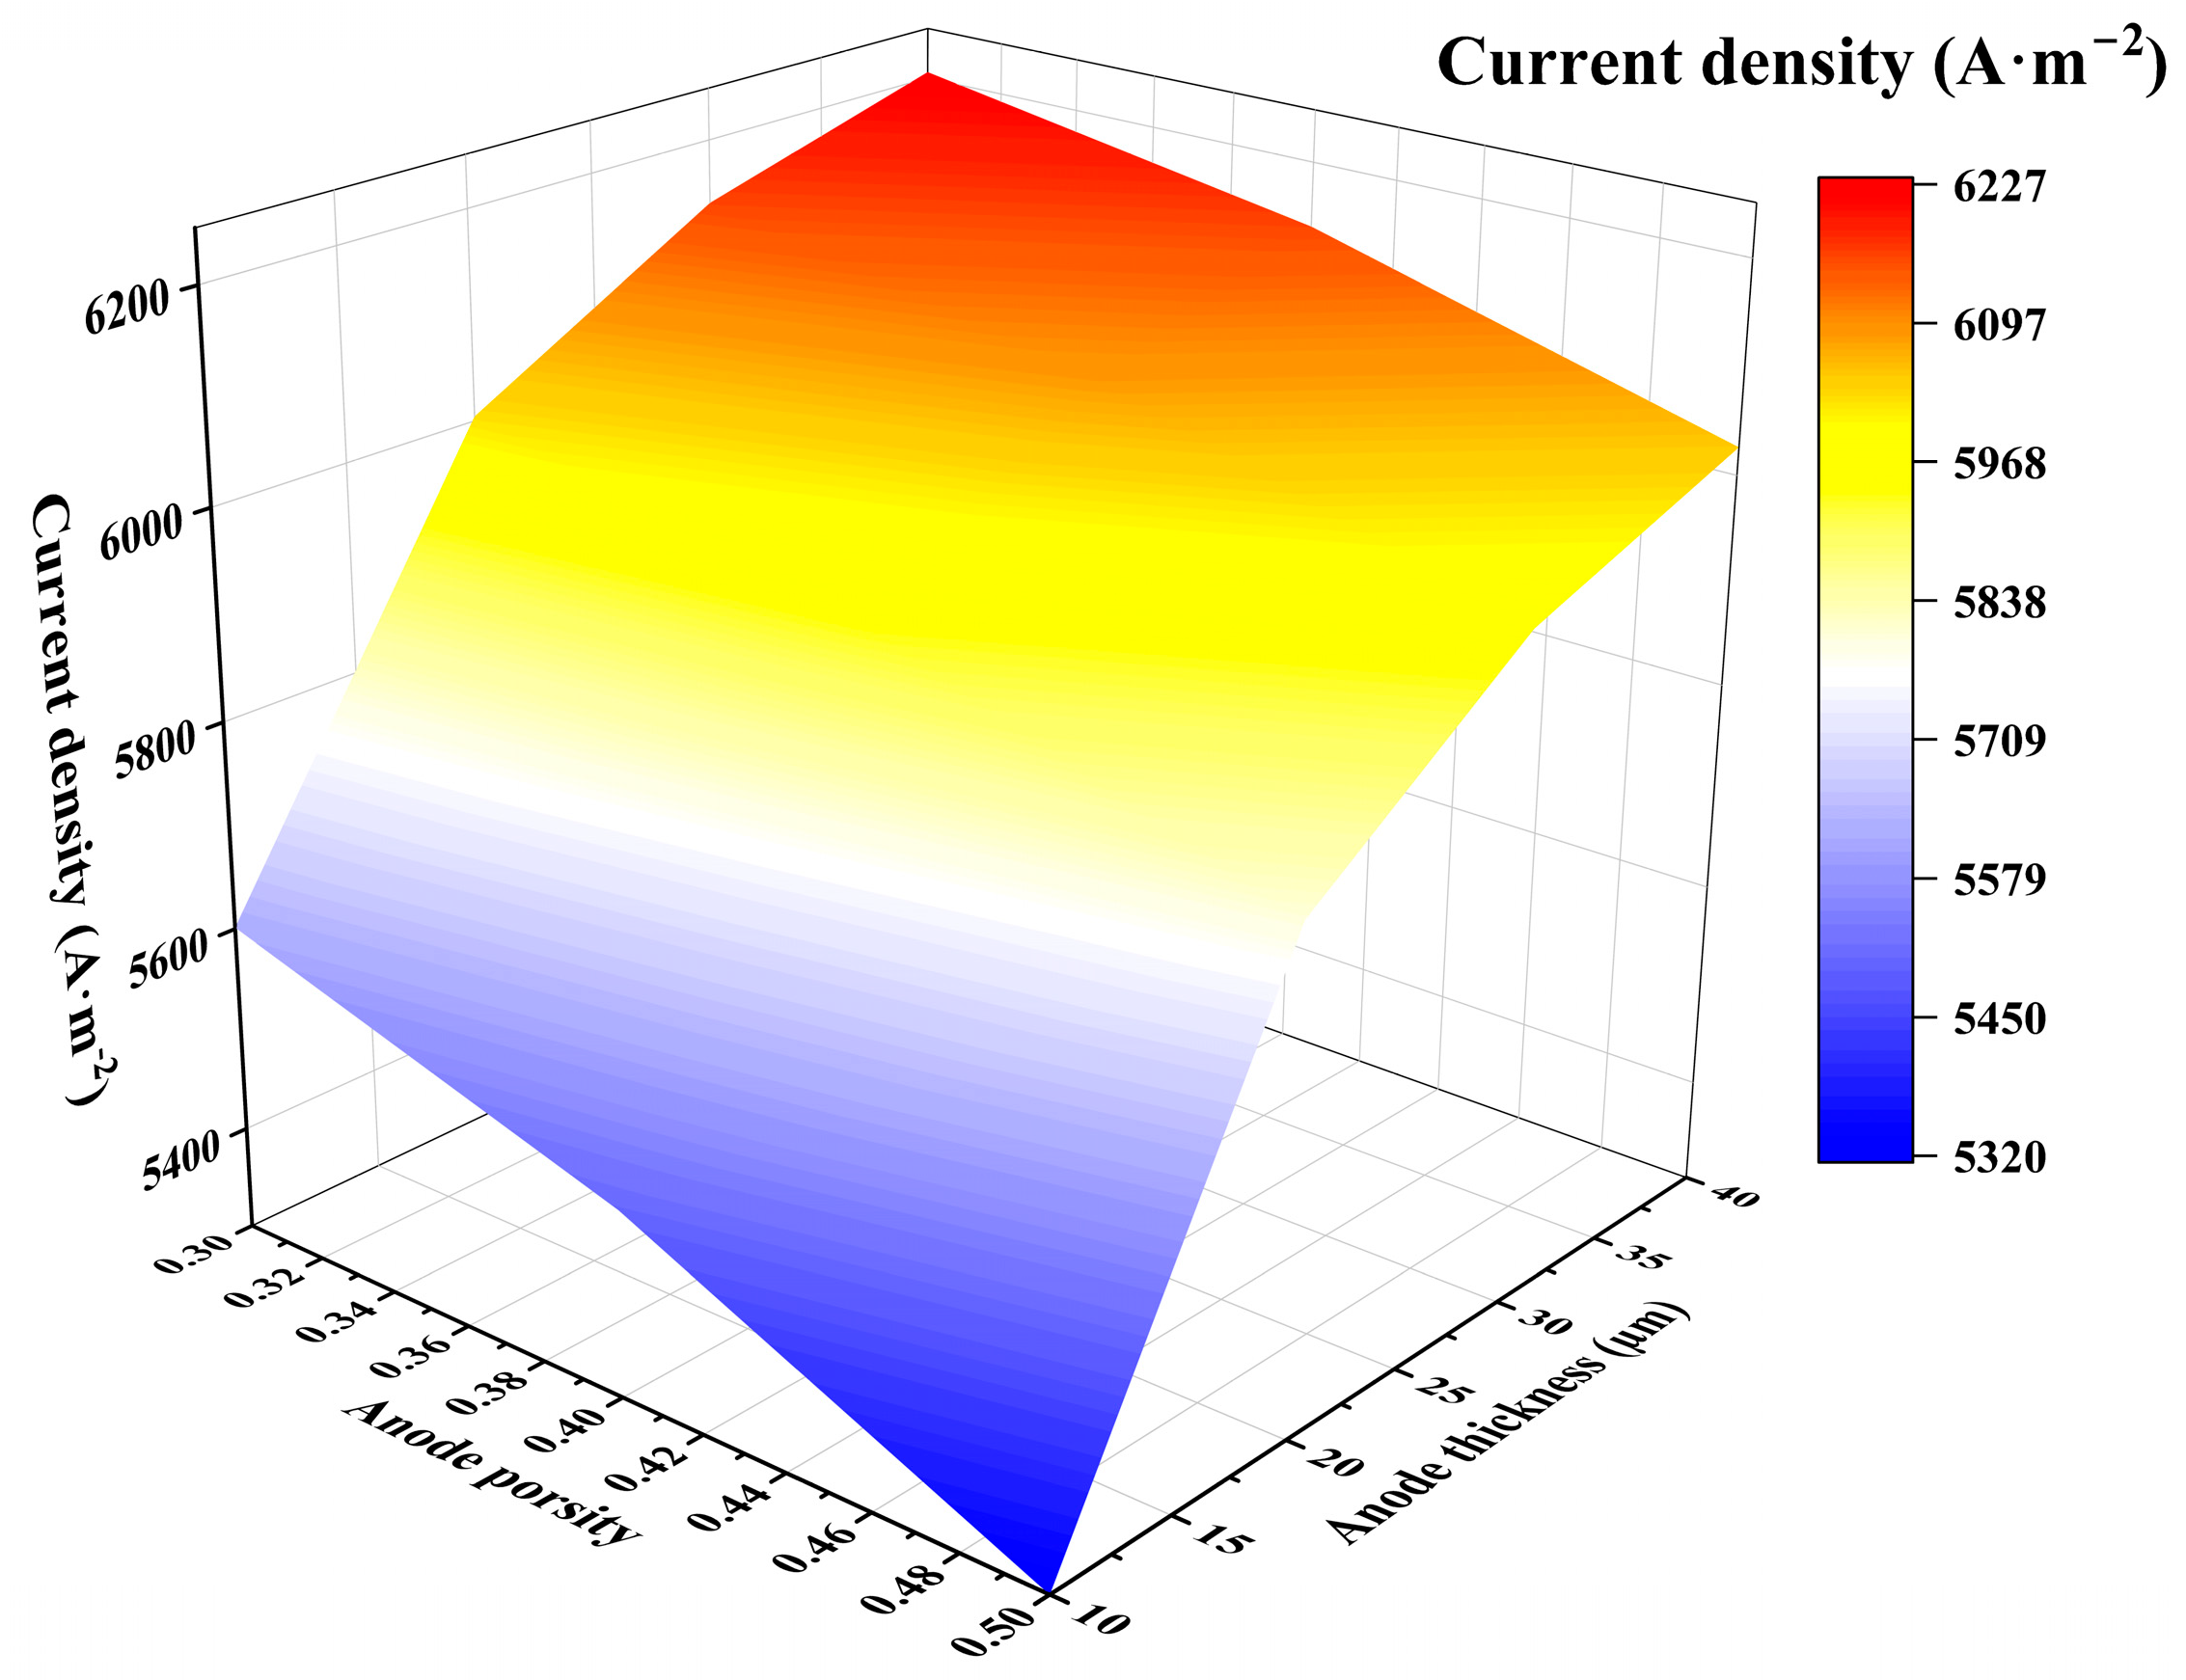
As illustrated in Figure 14, the combined variations in porosity and anode thickness significantly affect SOEC performance. At an electrolysis voltage of 1.7 V, the highest current density of 6227 A m−2 is obtained when the porosity is 0.3 and the anode thickness is 40 μm. Within the investigated ranges of 10–40 μm for anode thickness and 0.3–0.5 for porosity, a thinner anode layer provides a shorter gas diffusion path but also contains fewer electrochemically active reaction sites. This results in lower oxygen evolution rates. Under these conditions, increasing porosity further reduces the number of available reaction sites, and the combined effect of high porosity and small anode thickness therefore leads to a substantial reduction in current density. Conversely, thicker anode layers provide more active reaction sites, and the number of available sites continues to increase as porosity decreases. However, thicker anodes also restrict oxygen diffusion, and under low-porosity conditions the resulting transport limitations reduce the rate at which current density improves with increasing thickness.
Figure 14.
Effect of anode layer thickness on current density under different porosities.
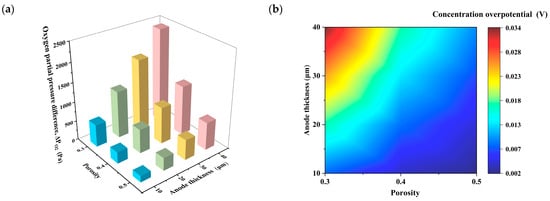
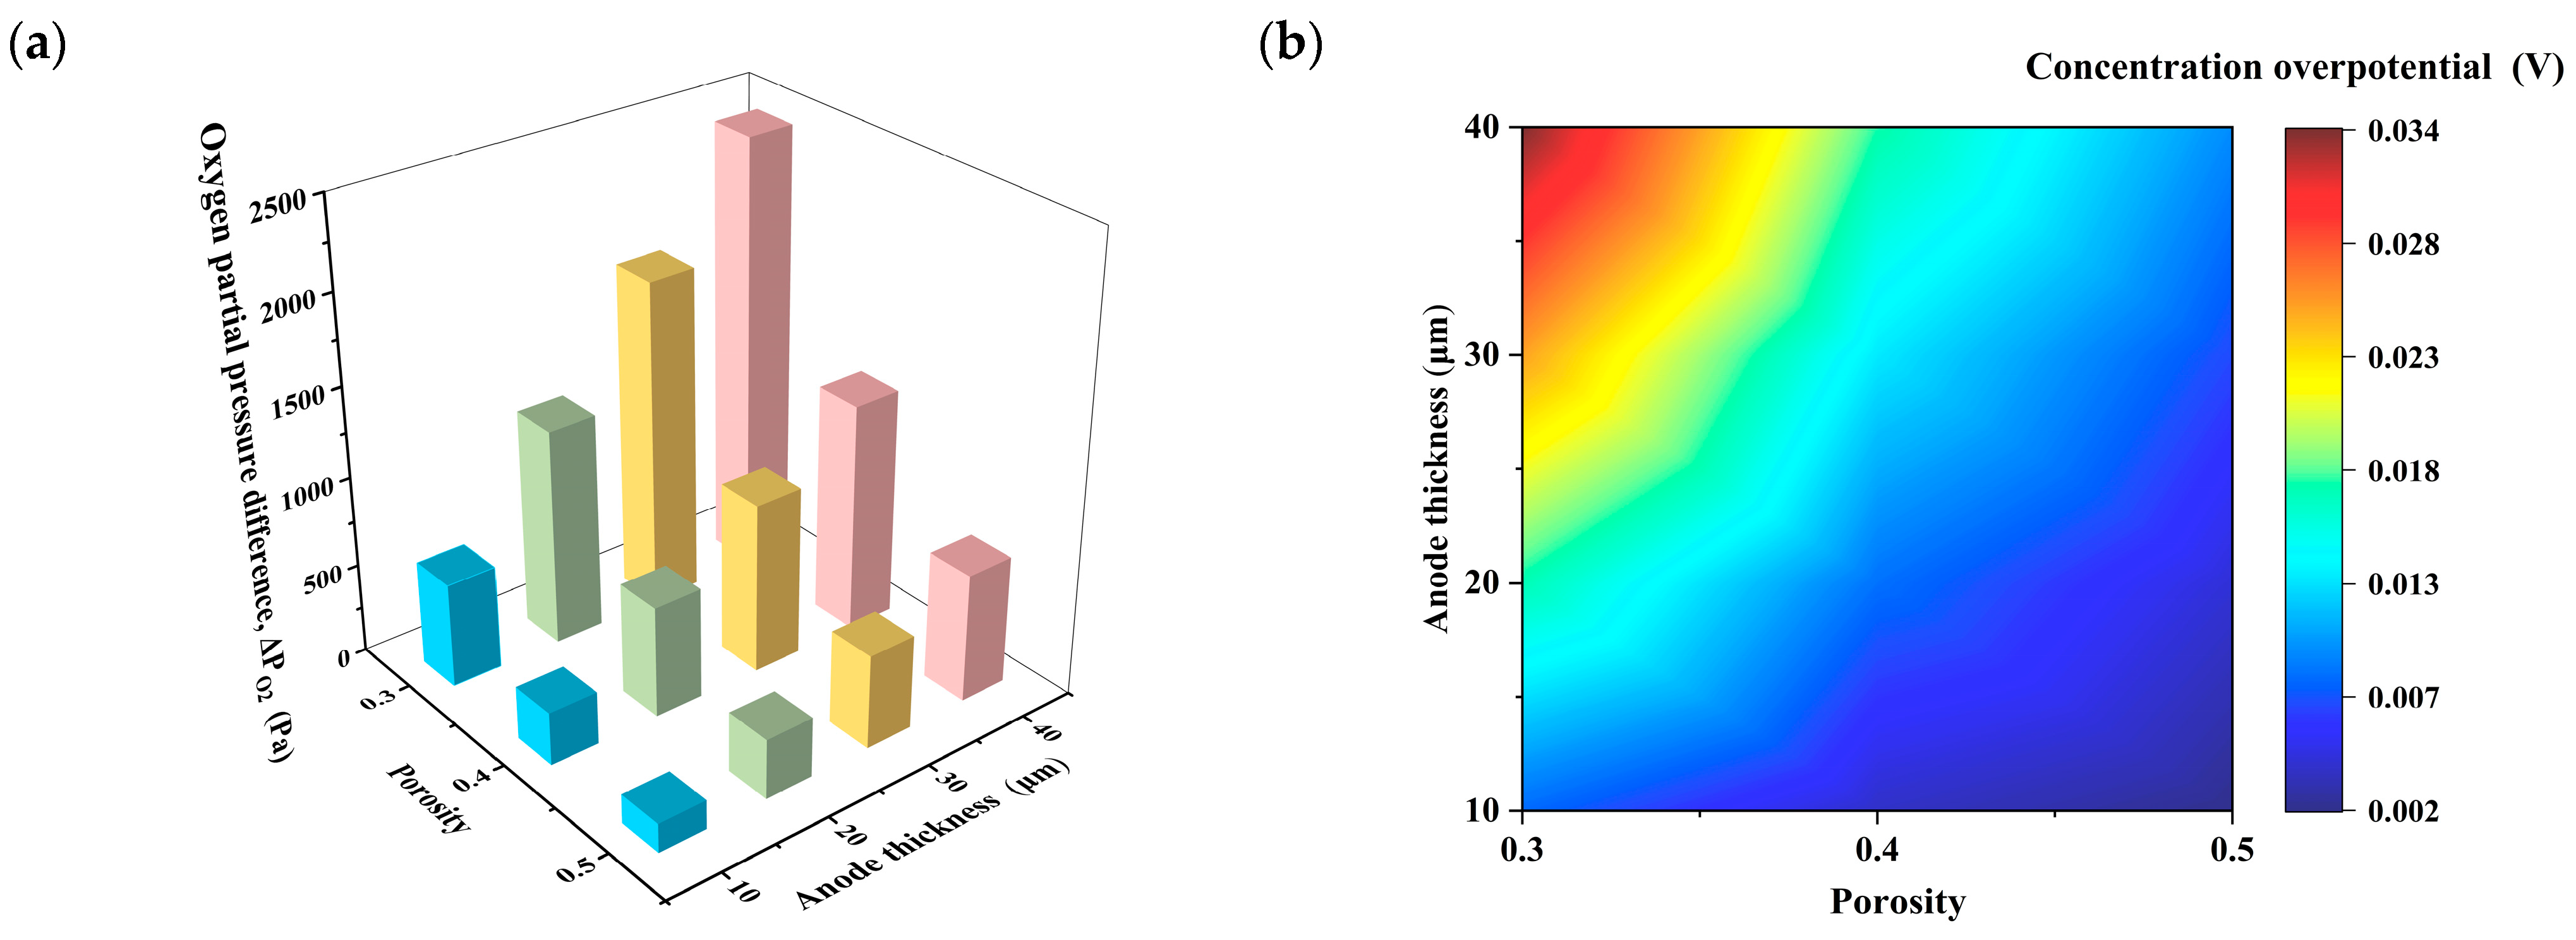
Based on the above single-parameter trends, Figure 15 further demonstrates the coupled influence of porosity and anode thickness. The oxygen partial pressure difference decreases with increasing porosity but increases with increasing thickness, and the concentration overpotential exhibits the same tendency. The most severe transport limitation appears under the combination of low porosity and large thickness, whereas high porosity and small thickness correspond to the weakest concentration polarization. These results indicate that porosity can partially compensate for the transport penalty caused by a thicker anode but cannot completely eliminate it. Thus, porosity and thickness should be optimized in a coordinated manner.
Figure 15.
(a) Effect of anode porosity and thickness on the oxygen partial pressure difference (ΔPO2) in SOEC. (b) Effect of anode porosity and thickness on the concentration overpotential in SOEC.
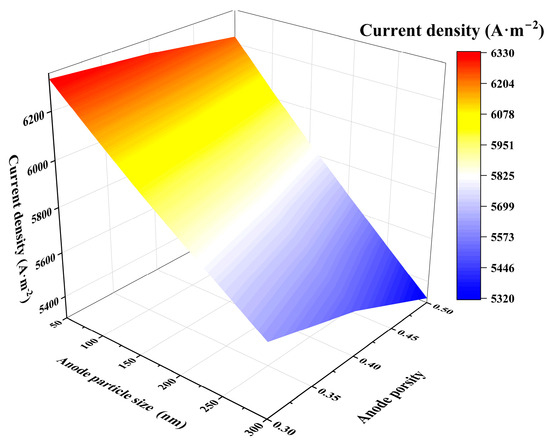
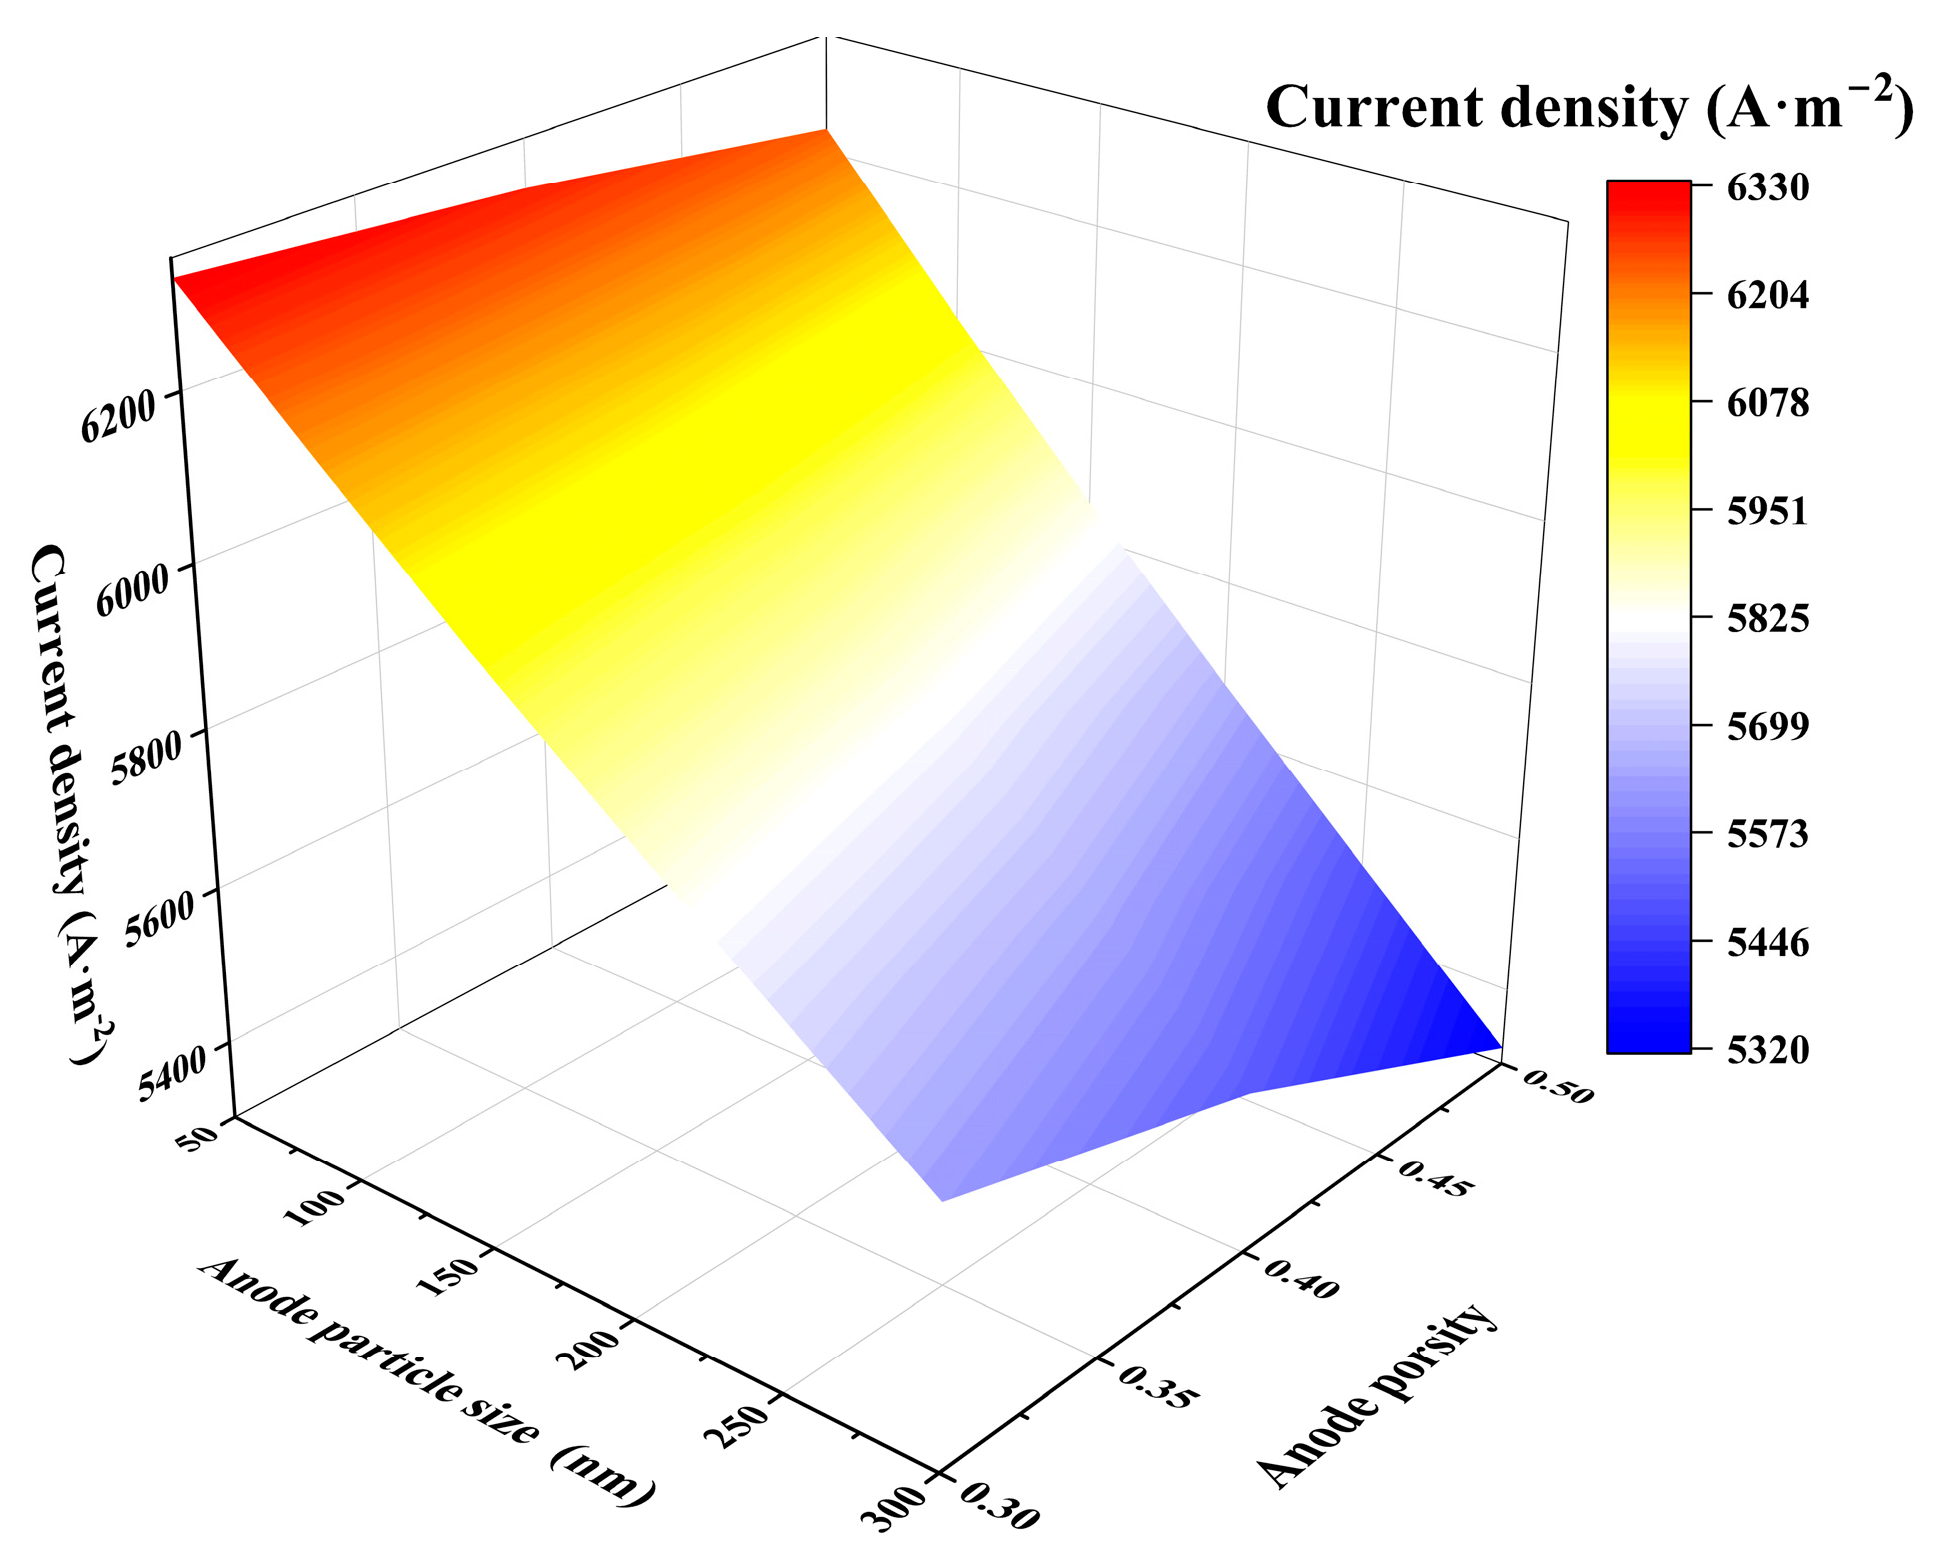
As illustrated in Figure 16, the combined effects of porosity and particle size exert a strong influence on the current density of SOECs. With particle sizes varying from 50 to 300 nm and porosity ranging from 0.3 to 0.5, the sensitivity of current density to porosity increases as the particle size becomes larger. At an operating voltage of 1.7 V, the maximum current density of 6327 A m−2 is obtained at a porosity of 0.3 and a particle size of 50 nm. Increasing particle size reduces the number of particles per unit volume, thereby decreasing the number of electrochemically active reaction sites and shortening the triple-phase boundary (TPB) length. Higher porosity further reduces the density of active sites, and under the combined conditions of large particle size and high porosity, the reduction in reactive sites becomes the dominant mechanism leading to current-density degradation.
Figure 16.
Effect of porosity changes under different particle sizes on current density.
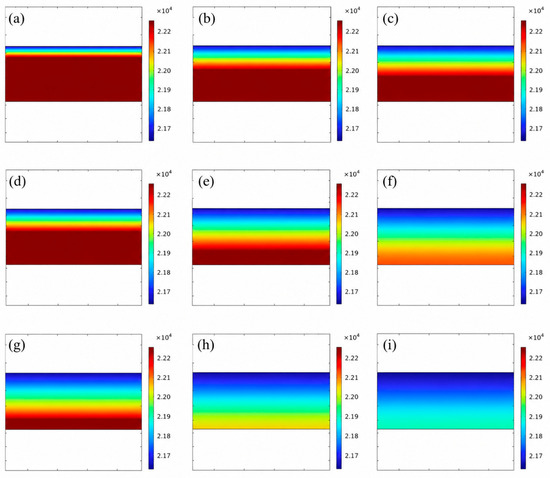
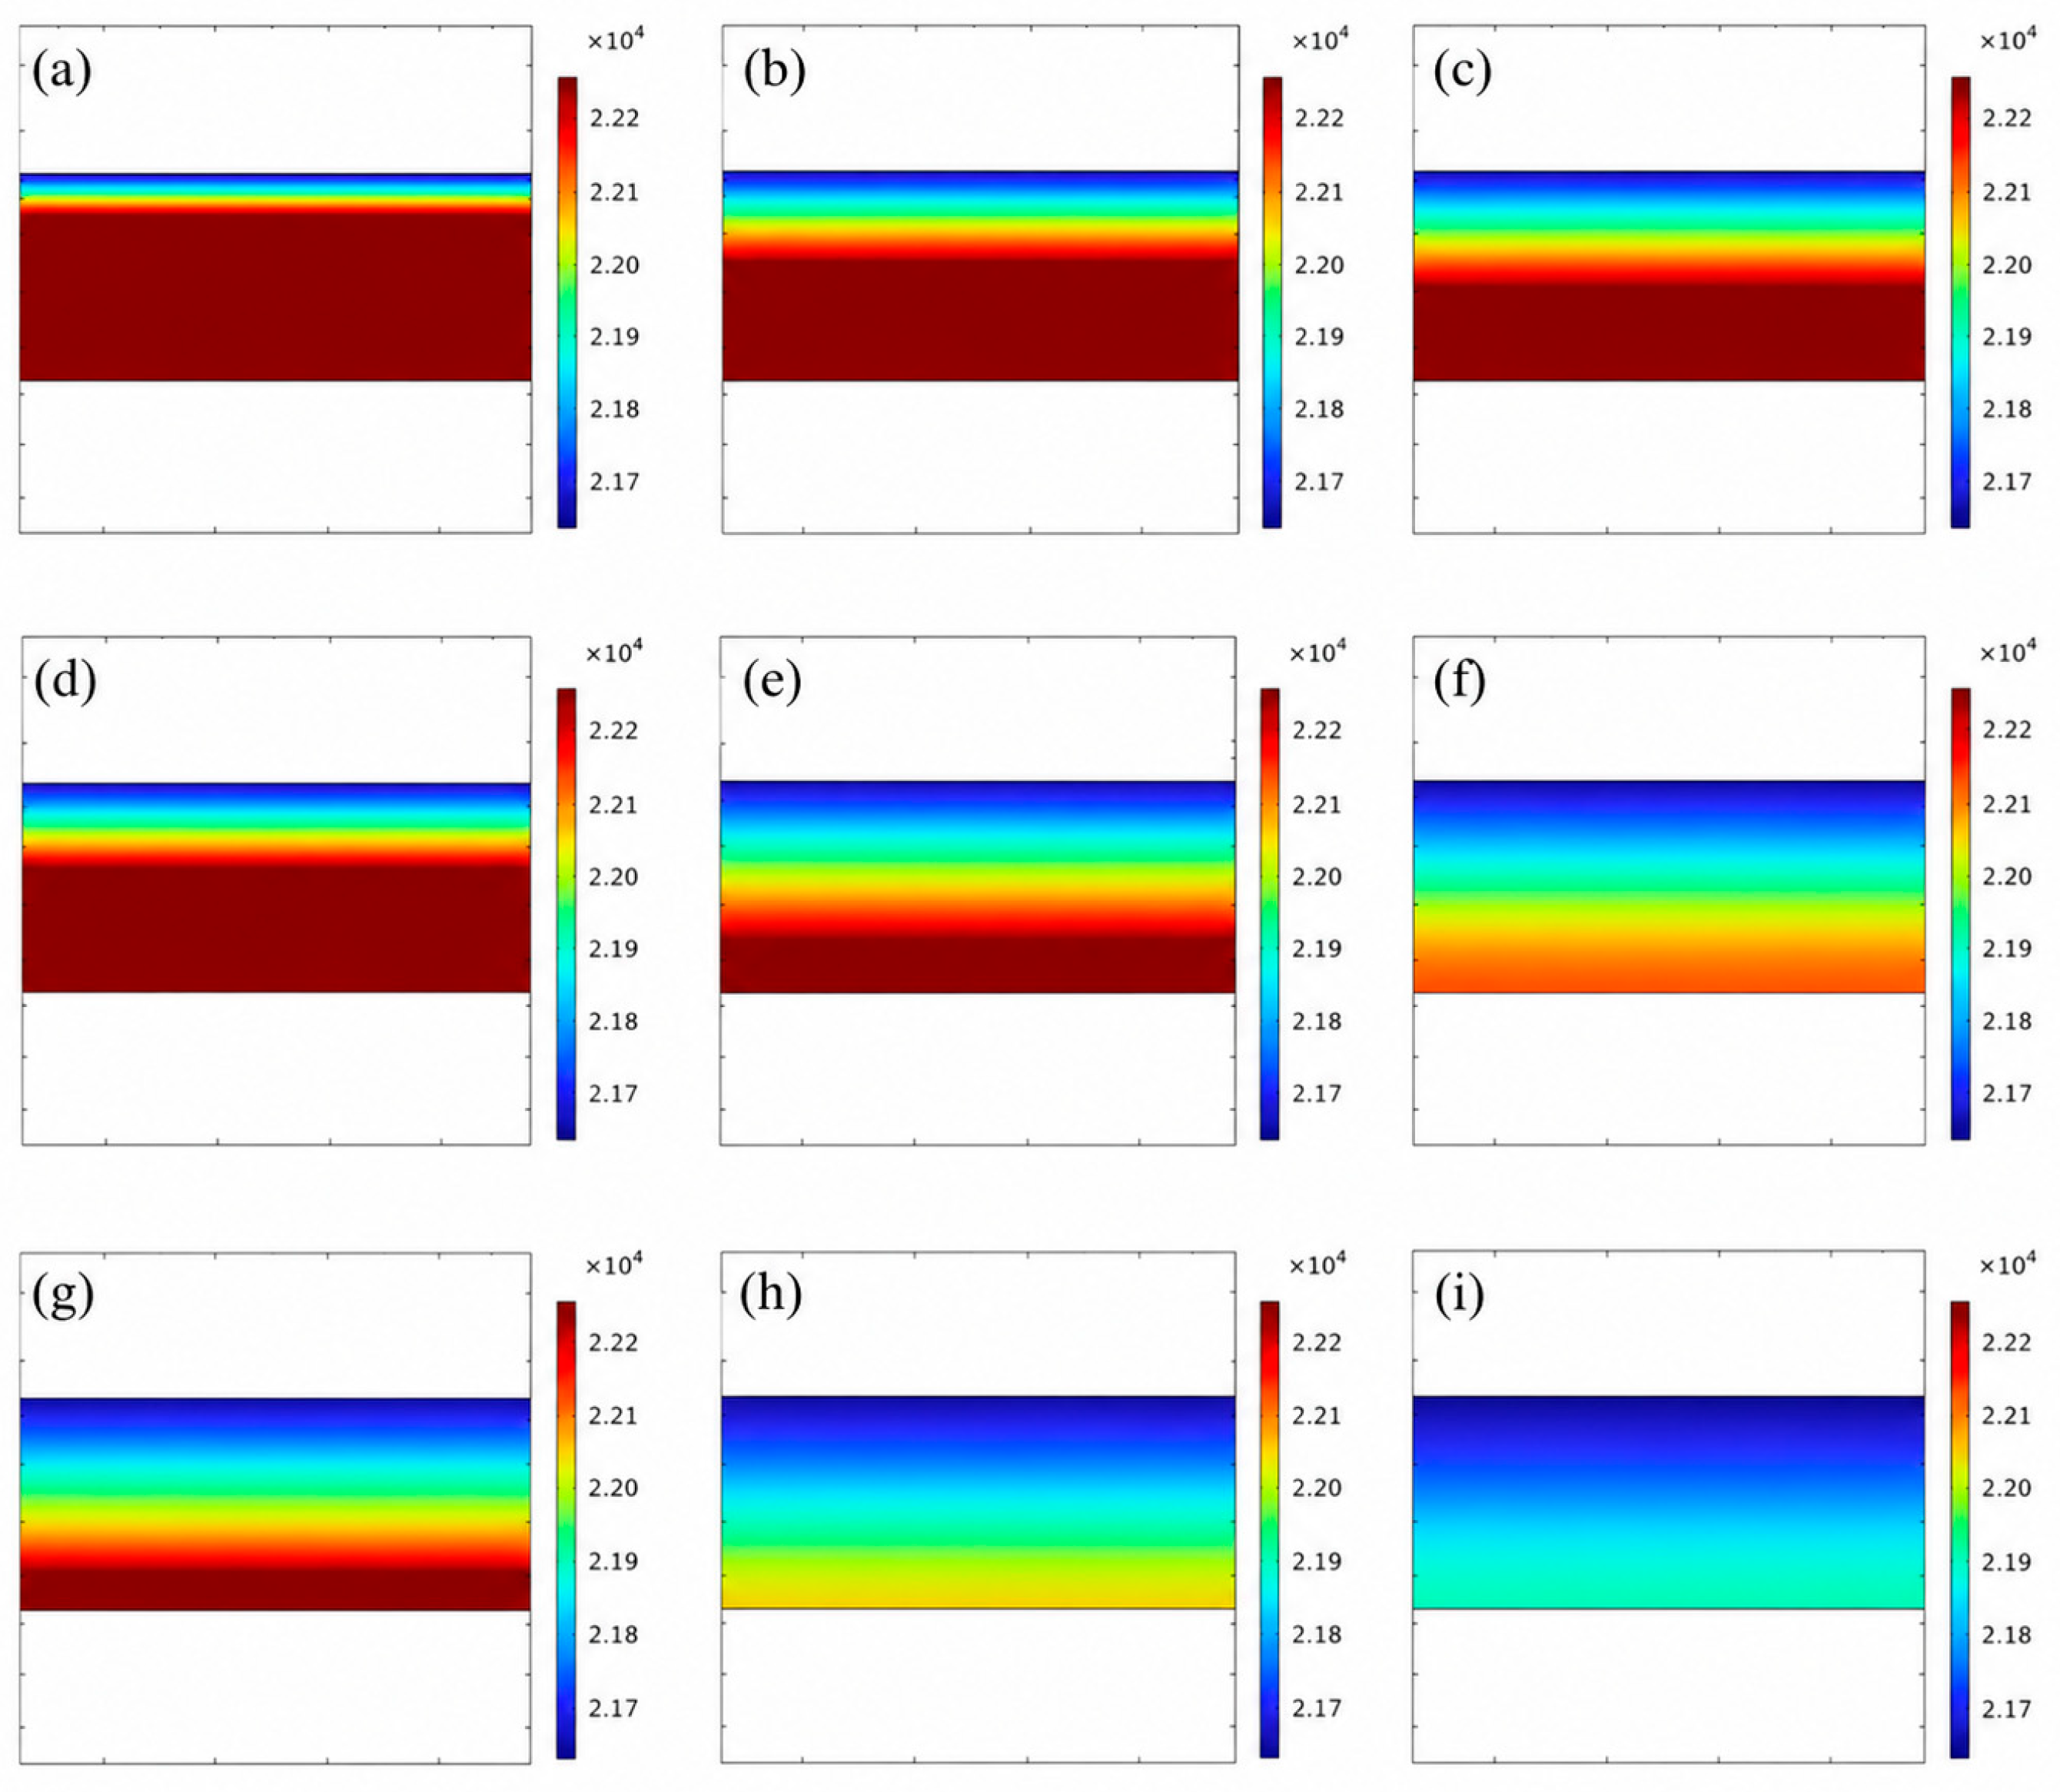
As illustrated in Figure 17, the results demonstrate that the oxygen partial pressure distribution within the oxygen electrode is governed by the coupled interaction between reaction kinetics and mass transport. Decreasing particle diameter enhances the active specific surface area and intensifies local oxygen generation, whereas increasing porosity enhances effective diffusion and alleviates concentration polarization. The oxygen partial pressure gradient can therefore be interpreted as the balance between the oxygen generation rate and the diffusion capacity. While smaller particles promote electrochemical activity, sufficient porosity is required to prevent excessive diffusion limitations. These results highlight the importance of co-optimizing particle size and porosity to achieve a structurally balanced and high-performance oxygen electrode.
Figure 17.
Effect of porosity and particle size on the oxygen partial pressure distribution in the oxygen electrode. (a–c) εan = 0.3, (d–f) εan = 0.4, and (g–i) εan = 0.5, with particle diameter increasing from left to right.
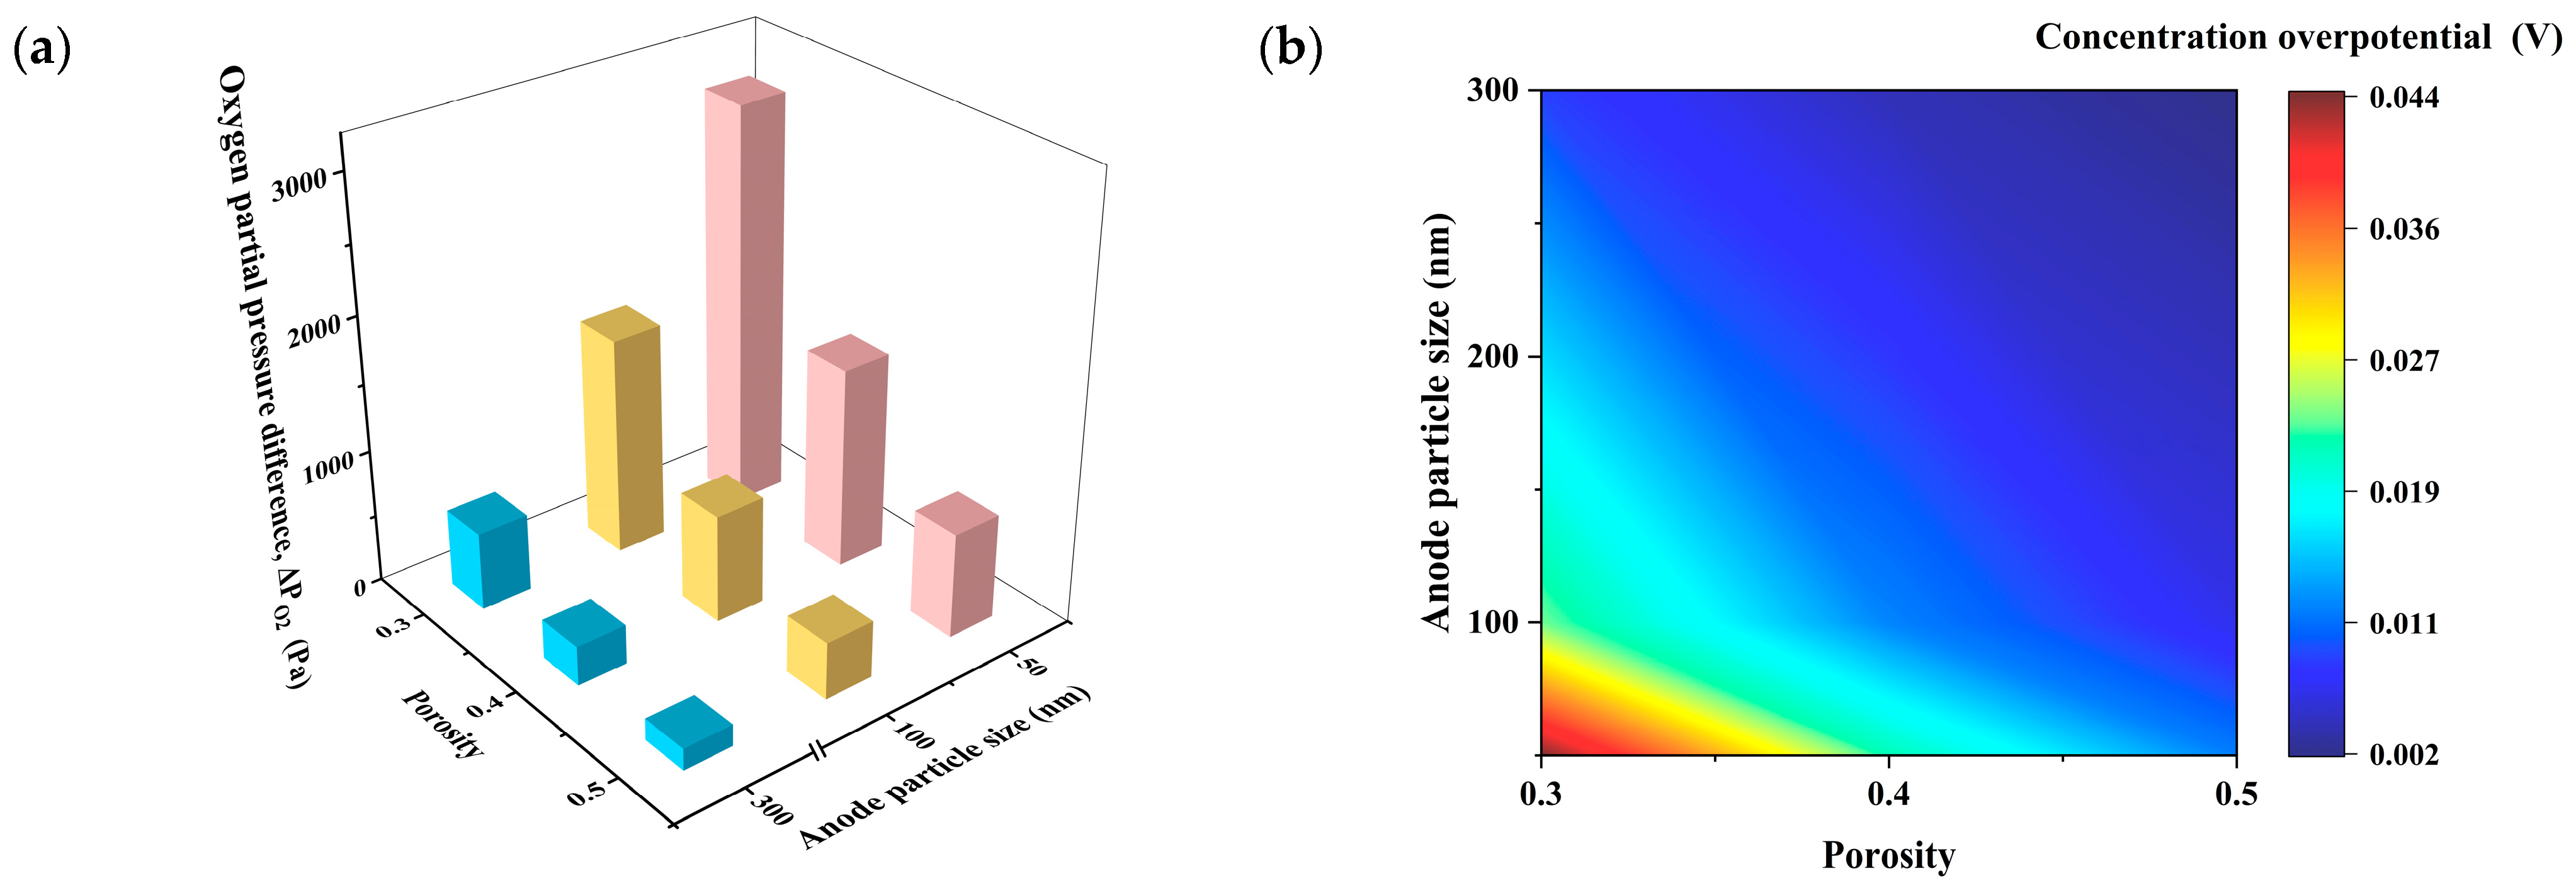
Figure 18 further reveals the coupled influence of porosity and particle size on oxygen transport limitation in the anode. Both the oxygen partial pressure difference and the concentration overpotential decrease with increasing porosity and particle size, indicating improved oxygen evacuation and reduced mass-transfer resistance. In particular, the most severe concentration polarization appears at the combination of low porosity and small particle size, where oxygen transport pathways are the most restricted.
Figure 18.
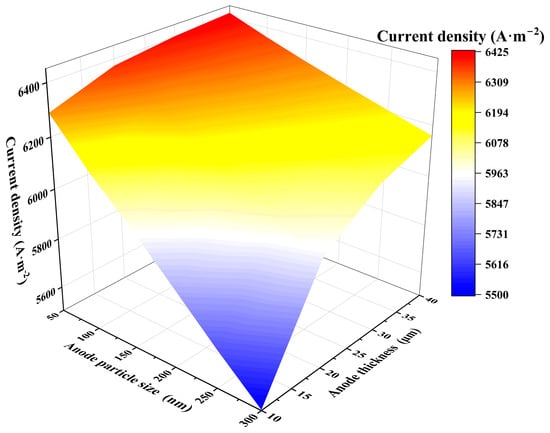
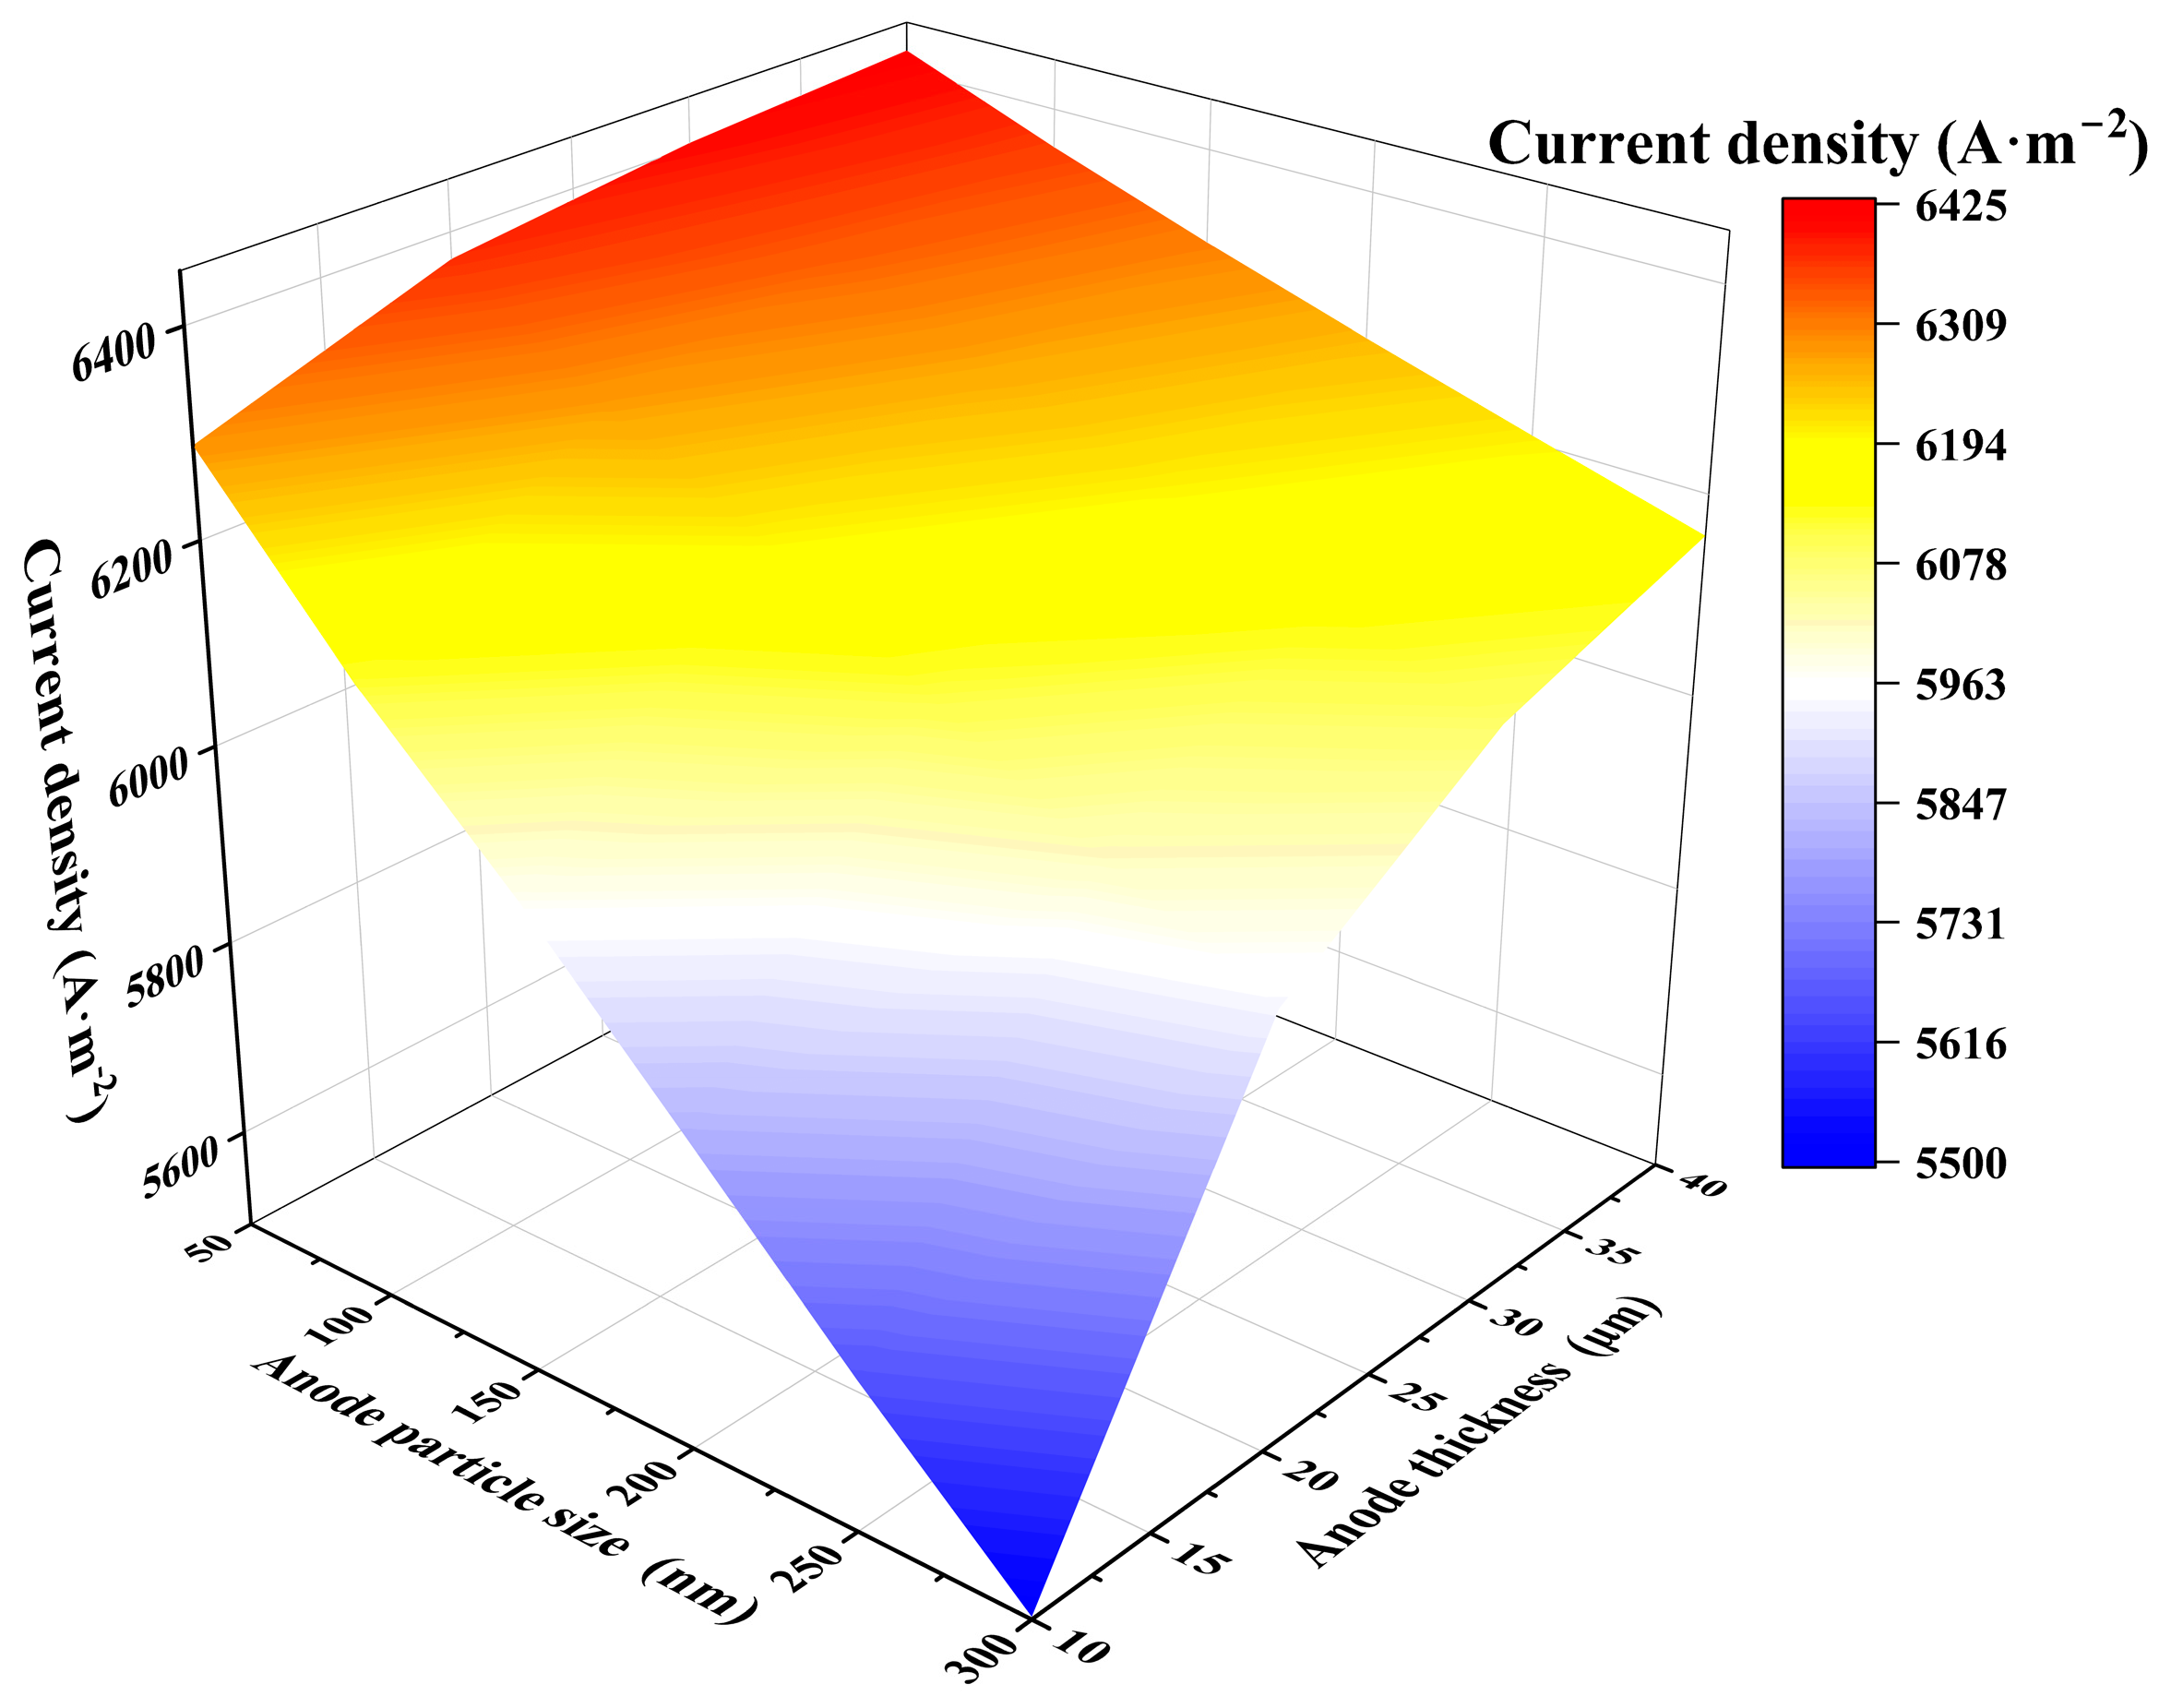
(a) Effect of anode porosity and particle size on oxygen partial pressure difference (ΔPO2) in SOEC. (b) Effect of anode porosity and particle size on concentration overpotential in SOEC. The above parametric analysis indicates that anode thickness and particle size exert stronger influences on SOEC performance than porosity. Therefore, their coupled effects were further investigated, as shown in Figure 19. When the particle size ranges from 50 to 300 nm and the anode thickness from 10 to 40 μm, the maximum current density of 6421 A m−2 is obtained at 1.7 V with a particle size of 50 nm and an anode thickness of 40 μm. For a fixed particle size, variations in anode thickness leads to smaller changes in current density, indicating that oxygen diffusion becomes the dominant factor governing performance. A thinner anode shortens the oxygen diffusion path but reduces the number of electrochemically active reaction sites. Reducing particle size compensates for this limitation by increasing the number of active sites and extending the TPB length. Consequently, combining a thin anode layer with a small particle size significantly improves electrochemical performance. Conversely, in thicker anodes where oxygen transport is strongly hindered, the benefit of reducing particle size becomes less pronounced.
Figure 19.
Effect of particle size on current density at different anode layer thicknesses.
Although smaller particles may enhance electrochemical activity by increasing the active reaction-site density, the present results show that they also intensify oxygen transport limitation, especially under low-porosity conditions. Therefore, the role of particle size should be understood as a balance between electrochemical activity and gas diffusion capability, and its optimization should be considered together with porosity.
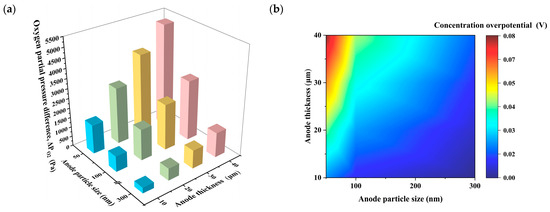
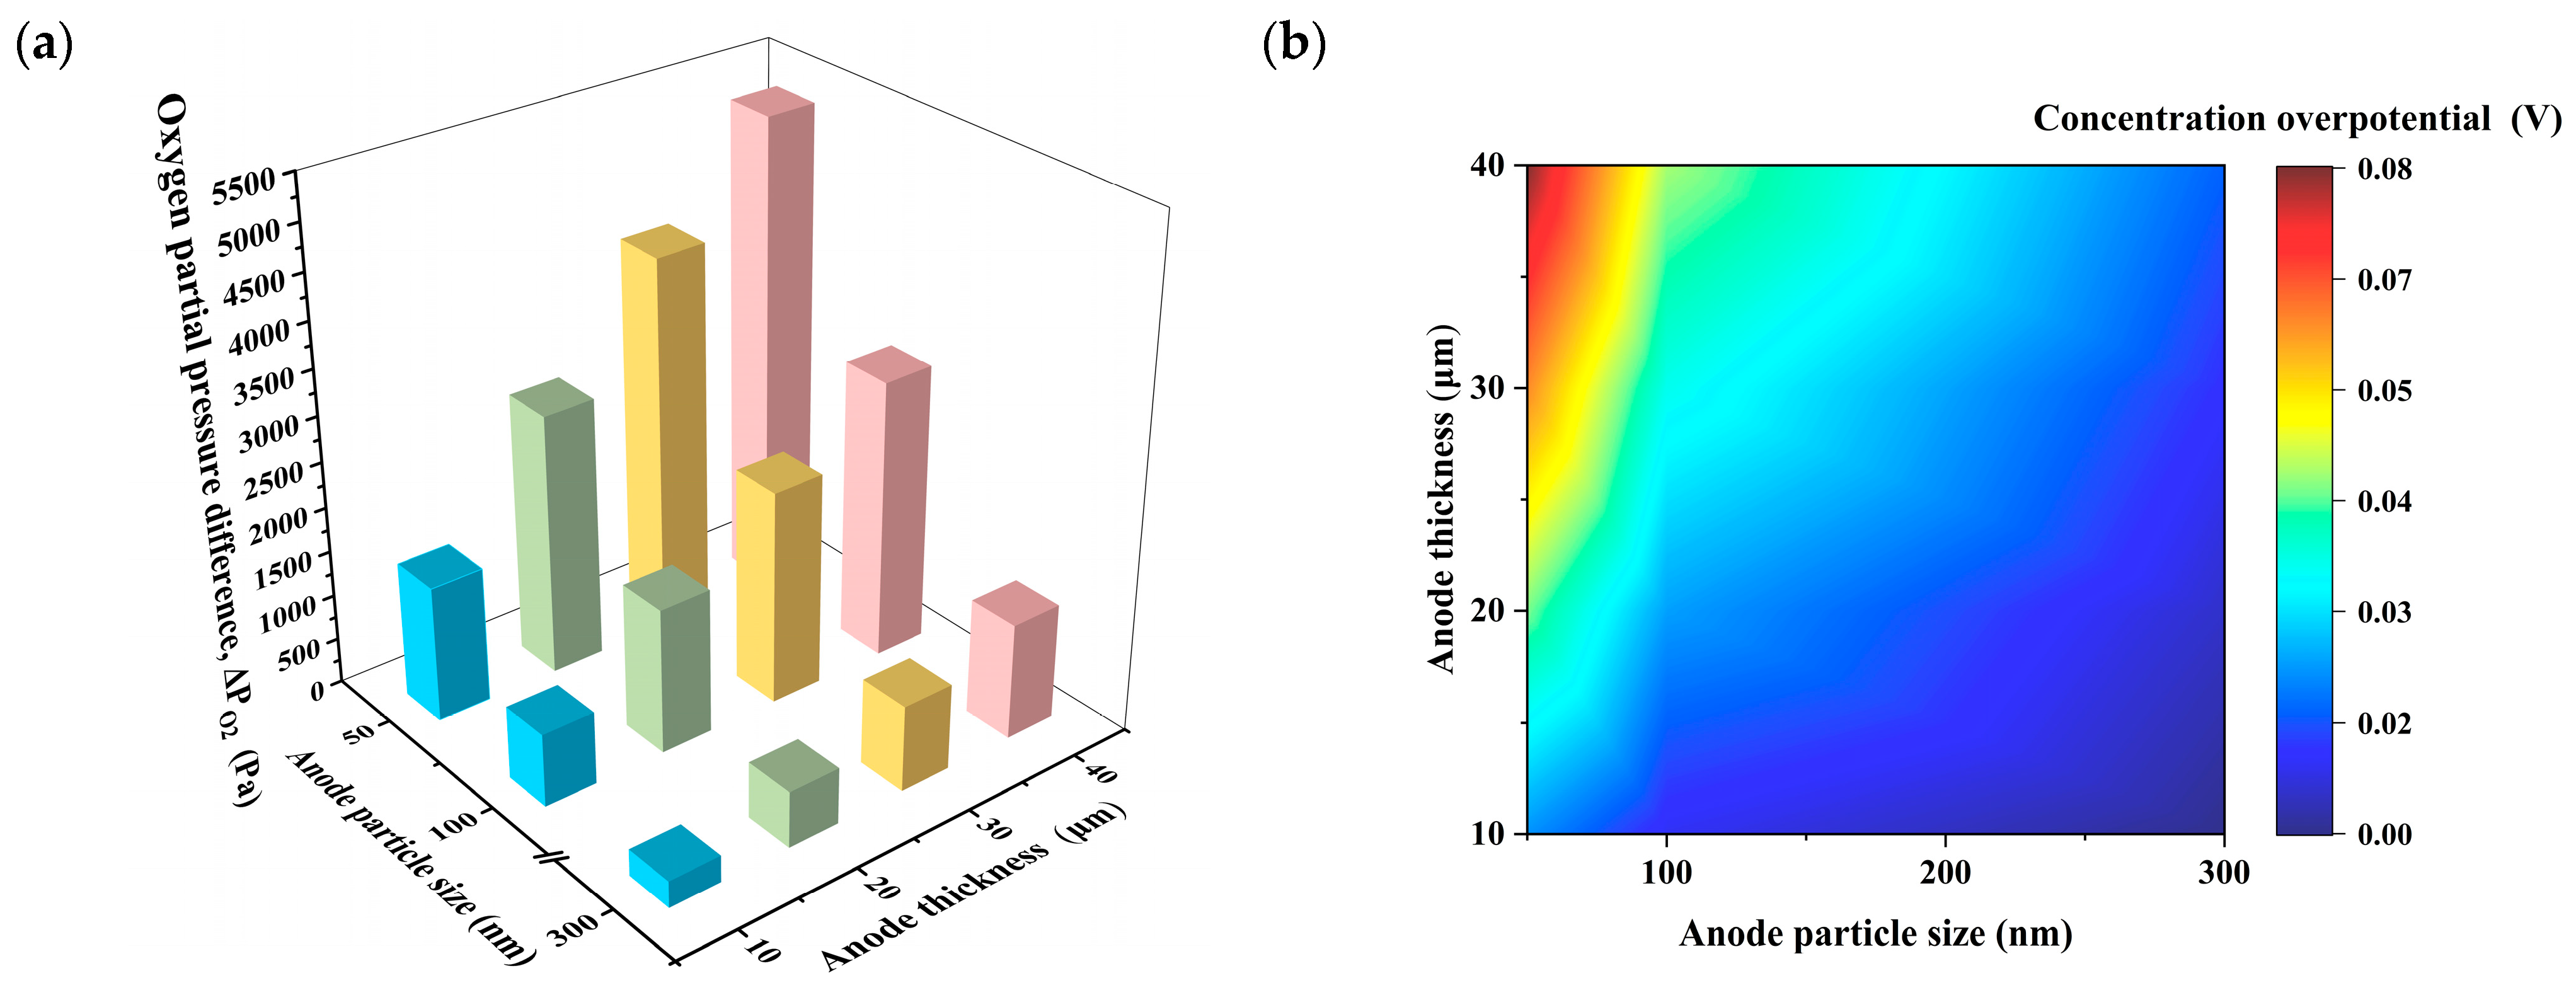
Figure 20 shows that the oxygen partial pressure difference and concentration overpotential are jointly affected by anode thickness and particle size. Increasing thickness strengthens oxygen accumulation and concentration polarization, whereas increasing particle size has the opposite effect. The most severe transport limitation occurs in the high-thickness/small-particle region, confirming that oxygen transport resistance is controlled by the combined effects of diffusion distance and pore transport capability. Therefore, the influence of particle size becomes more critical in thick anodes, and these two parameters should be optimized together.
Figure 20.
(a) Effect of anode thickness and particle size on the oxygen partial pressure difference (ΔpO2) in SOEC. (b) Effect of anode thickness and particle size on the concentration overpotential in SOEC.
4. Conclusions
In this study, the effects of key anode structural parameters, including porosity, particle size, and anode thickness, on the electrochemical performance of SOECs were systematically investigated under a fixed operating voltage of 1.7 V. The coupled influences among these parameters were analyzed to clarify their combined impact on cell performance.
The results indicate that anode porosity plays a dual role in SOEC performance. Increasing porosity improves oxygen transport, reduces the oxygen partial pressure gradient, and mitigates concentration polarization. However, excessive porosity decreases the density of electrochemically active sites, leading to a reduction in current density. Therefore, an optimal porosity should balance mass transport capability and reaction-site availability.
Particle size also exhibits competing effects. Reducing particle size increases the triple-phase boundary length and increases electrochemical activity, thereby improving current density. Nevertheless, smaller particles tend to intensify oxygen transport limitations, particularly under low-porosity conditions, resulting in increased concentration overpotential. This suggests that particle size should be optimized by considering both reaction kinetics and gas diffusion behavior.
The effect of anode thickness shows a trade-off between reaction enhancement and transport limitation. Increasing thickness within a moderate range improves current density due to the expansion of the active reaction region. However, excessive thickness leads to longer diffusion pathways, aggravates oxygen accumulation, and increases concentration polarization, thereby limiting further performance improvement.
The coupled analysis further reveals that these structural parameters cannot be optimized independently. Severe transport limitations occur under combinations of low porosity and large thickness, as well as low porosity and small particle size. Moreover, the influence of particle size becomes more significant in thicker anodes. These findings highlight the necessity of coordinated optimization of anode microstructure.
Overall, SOEC performance is determined by the interplay between electrochemical activity and oxygen transport. Anode microstructure should therefore be optimized by balancing reaction-site availability and gas transport capability. The present results provide a parametric basis for understanding the influence of anode structural features on SOEC oxygen electrode performance.
Author Contributions
The manuscript was written through the contributions of all authors. Investigation, conceptualization, methodology, H.L.; conceptualization, project administration, funding acquisition, M.Z.; methodology, investigation, review and editing, J.L. and Y.L.; review and editing, methodology, investigation, Z.L.; review and editing, methodology, formal analysis. All authors have read and agreed to the published version of the manuscript.
Funding
This research was funded by the “National Natural Science Foundation of China, grant number 52176208”.
Data Availability Statement
The datasets supporting the conclusions of this article are included within the article.
Conflicts of Interest
The authors declare that there is no conflict of interest.
References
- Lahrichi, A.; El Issmaeli, Y.; Kalanur, S.S.; Pollet, B.G. Advancements, strategies, and prospects of solid oxide electrolysis cells (SOECs): Towards enhanced performance and large-scale sustainable hydrogen production. J. Energy Chem. 2024, 94, 688–715. [Google Scholar] [CrossRef] [Scilit]
- Hou, X.; Jiang, Y.; Wei, K.; Jiang, C.; Jen, T.-C.; Yao, Y.; Liu, X.; Ma, J.; Irvine, J.T.S. Syngas production from CO2 and H2O via solid-oxide electrolyzer cells: Fundamentals, materials, degradation, operating conditions, and applications. Chem. Rev. 2024, 124, 5119–5166. [Google Scholar] [CrossRef] [Scilit]
- Wolf, S.E.; Winterhalder, F.E.; Vibhu, V.; de Haart, L.G.J.; Guillon, O.; Eichel, R.-A.; Menzler, N.H. Solid oxide electrolysis cells—Current material development and industrial application. J. Mater. Chem. 2023, 11, 17977–18028. [Google Scholar] [CrossRef] [Scilit]
- Hauch, A.; Küngas, R.; Blennow, P.; Hansen, A.B.; Hansen, J.B.; Mathiesen, B.V.; Mogensen, M.B. Recent advances in solid oxide cell technology for electrolysis. Science 2020, 370, eaba6118. [Google Scholar] [CrossRef] [Scilit]
- Zhao, C.; Li, Y.; Zhang, W.; Zheng, Y.; Lou, X.; Yu, B.; Chen, J.; Chen, Y.; Liu, M.; Wang, J. Heterointerface Engineering for Enhancing the Electrochemical Performance of Solid Oxide Cells. Energy Environ. Sci. 2020, 13, 53–85. [Google Scholar] [CrossRef] [Scilit]
- Men, H.J.; Tian, N.; Qu, Y.M.; Wang, M.; Zhao, S.; Yu, J. Improved performance of a lanthanum strontium manganite–based oxygen electrode for an intermediate-temperature solid oxide electrolysis cell realized via ionic conduction enhancement. Ceram. Int. 2019, 45, 7945–7949. [Google Scholar] [CrossRef] [Scilit]
- Arslan, O.; Acikkalp, E.; Genc, G. A Multi-Generation System for Hydrogen Production through the High-Temperature Solid Oxide Electrolyzer Integrated to 150 MW Coal-Fired Steam Boiler. Fuel 2022, 315, 123201. [Google Scholar] [CrossRef] [Scilit]
- Zou, G.; Feng, W.-C.; Song, Y.-F.; Wang, G.-X. Recent Advances in Anode Materials of Solid Oxide Electrolysis Cells. J. Electrochem. 2023, 29, 2215006. [Google Scholar]
- Chan, S.H.; Xia, Z.T. Anode Micro Model of Solid Oxide Fuel Cell. J. Electrochem. Soc. 2001, 148, A388–A394. [Google Scholar] [CrossRef] [Scilit]
- Cao, J.; Li, Y.; Zheng, Y.; Wang, S.; Zhang, W.; Qin, X.; Geng, G.; Yu, B. A Novel Solid Oxide Electrolysis Cell with Micro-/Nano Channel Anode for Electrolysis at Ultra-High Current Density over 5 A cm−2. Adv. Energy Mater. 2022, 12, 2200899. [Google Scholar] [CrossRef] [Scilit]
- Li, W.; Shi, Y.; Luo, Y.; Cai, N. Theoretical Modeling of Air Electrode Operating in SOFC Mode and SOEC Mode: The Effects of Microstructure and Thickness. Int. J. Hydrog. Energy 2014, 39, 13738–13750. [Google Scholar] [CrossRef] [Scilit]
- Chen, Y.; Wu, X.; Hu, H.; Zhang, J. System-level performance analysis and parameter optimization of hydrogen production based on solid oxide electrolytic cell. Appl. Energy 2023, 347, 121432. [Google Scholar] [CrossRef] [Scilit]
- Ni, M.; Leung, M.K.H.; Leung, D.Y.C. Mathematical Modeling of the Coupled Transport and Electrochemical Reactions in Solid Oxide Steam Electrolyzer for Hydrogen Production. Electrochim. Acta 2007, 52, 6707–6718. [Google Scholar] [CrossRef] [Scilit]
- Mustafa, A.; Shuai, Y.; Wang, Z.; Iranzo, A.; Bachirou, G.L.; Rafique, M.; Nasir, M.A.; Razzaq, S. Three-Dimensional Modelling of Key Parameters Impacting the Steam Electrolysis in Solid Oxide Electrolysis Cell for Clean Hydrogen Production. Fuel 2025, 406, 136860. [Google Scholar] [CrossRef] [Scilit]
- Abdullah, T.; Liu, L. Simulation-based microstructural optimization of solid oxide fuel cell for low temperature operation. Int. J. Hydrog. Energy 2016, 41, 13632–13643. [Google Scholar] [CrossRef] [Scilit]
- Li, J.; Lei, Z.; Jing, J.; Shang, Y.; Wang, H.; Wang, J.; Yang, Z.; Liu, S. Structure optimization of hydrogen electrode for enhancing solid oxide electrolysis cell performance and strength: A model-based quantitative analysis. Fuel 2026, 417, 138587. [Google Scholar] [CrossRef] [Scilit]
- O’Hayre, R.P.; Barnett, D.M.; Prinz, F.B. The Triple Phase Boundary: A Mathematical Model and Experimental Investigations for Fuel Cells. J. Electrochem. Soc. 2005, 152, A439. [Google Scholar] [CrossRef] [Scilit]
- Bernadet, L.; Laurencin, J.; Roux, G.; Montinaro, D.; Mauvy, F.; Reytier, M. Effects of pressure on high temperature steam and carbon dioxide co-electrolysis. Electrochim. Acta 2017, 253, 114–127. [Google Scholar] [CrossRef] [Scilit]
- Lin, Z.; Khan, M.S.; Chen, J.; Xia, Q.; Ma, K.; Ding, W.; Jiao, L.; Gao, Z.; Chen, C. Solar methanol production from carbon dioxide and water using NaA zeolitic membrane reactor with pressurized solid oxide electrolysis cell. Energy 2024, 311, 133353. [Google Scholar] [CrossRef] [Scilit]
- Im-Orb, K.; Visitdumrongkul, N.; Saebea, D.; Patcharavorachot, Y.; Arpornwichanop, A. Flowsheet-based model and exergy analysis of solid oxide electrolysis cells for clean hydrogen production. J. Clean. Prod. 2018, 170, 1–13. [Google Scholar] [CrossRef] [Scilit]
- Khan, M.S.; Xu, X.; Knibbe, R.; Zhu, Z. Air electrodes and related degradation mechanisms in solid oxide electrolysis and reversible solid oxide cells. Renew. Sustain. Energy Rev. 2021, 143, 110918. [Google Scholar] [CrossRef] [Scilit]
- Costamagna, P.; Costa, P.; Antonucci, V. Micro-modelling of solid oxide fuel cell electrodes. Electrochim. Acta 1998, 43, 375–394. [Google Scholar] [CrossRef] [Scilit]
- Verkerk, M.J.; Middelhuis, B.J.; Burggraaf, A.J. Effect of grain boundaries on the conductivity of high-purity ZrO2–Y2O3 ceramics. Solid State Ion. 1982, 6, 159–170. [Google Scholar] [CrossRef] [Scilit]
- Wu, J.; McLachlan, D.S. Percolation exponents and thresholds obtained from the nearly ideal continuum percolation system graphite-boron nitride. Phys. Rev. B 1997, 56, 1236–1248. [Google Scholar] [CrossRef] [Scilit]
- Zhao, J.; Lin, Z.; Zhou, M. Three-Dimensional Modeling and Performance Study of High Temperature Solid Oxide Electrolysis Cell with Metal Foam. Sustainability 2022, 14, 7064. [Google Scholar] [CrossRef] [Scilit]
- Chen, D.; Wang, H.; Zhang, S.; Tade, M.O.; Shao, Z.; Chen, H. Multiscale model for solid oxide fuel cell with electrode containing mixed conducting material. AIChE J. 2015, 61, 3786–3803. [Google Scholar] [CrossRef] [Scilit]
- Bertei, A.; Nicolella, C. Percolation theory in SOFC composite electrodes: Effects of porosity and particle size distribution on effective properties. J. Power Sources 2011, 196, 9429–9436. [Google Scholar] [CrossRef] [Scilit]
- Chen, D.; He, H.; Zhang, D.; Wang, H.; Ni, M. Percolation theory in solid oxide fuel cell composite electrodes with a mixed electronic and ionic conductor. Energies 2013, 6, 1632–1656. [Google Scholar] [CrossRef] [Scilit]
- Chen, C.; Xia, Q.; Feng, S.; Liu, Q. A novel solar hydrogen production system integrating high temperature electrolysis with ammonia based thermochemical energy storage. Energy Convers. Manag. 2021, 237, 114143. [Google Scholar] [CrossRef] [Scilit]
- Andersson, M.; Yuan, J.; Sundén, B. SOFC modeling considering electrochemical reactions at the active three phase boundaries. Int. J. Heat Mass Transf. 2012, 55, 773–788. [Google Scholar] [CrossRef] [Scilit]
- Yang, S.; Chen, T.; Wang, Y.; Peng, Z.; Wang, W.G. Electrochemical analysis of an anode-supported SOFC. Int. J. Electrochem. Sci. 2013, 8, 2330–2344. [Google Scholar] [CrossRef] [Scilit]
- Ni, M.; Leung, M.K.H.; Leung, D.Y.C. Parametric study of solid oxide fuel cell performance. Energy Convers. Manag. 2007, 48, 1525–1535. [Google Scholar] [CrossRef] [Scilit]
- O’Brien, J.E.; McKellar, M.G.; Harvego, E.A.; Stoots, C.M. High-temperature electrolysis for large-scale hydrogen and syngas production from nuclear energy—Summary of system simulation and economic analyses. Int. J. Hydrog. Energy 2010, 35, 4808–4819. [Google Scholar] [CrossRef] [Scilit]
- Shin, Y.; Park, W.; Chang, J.; Park, J. Evaluation of the high temperature electrolysis of steam to produce hydrogen. Int. J. Hydrog. Energy 2007, 32, 1486–1491. [Google Scholar] [CrossRef] [Scilit]
- Suwanwarangkul, R.; Croiset, E.; Fowler, M.W.; Douglas, P.L.; Entchev, E.; Douglas, M.A. Performance comparison of Fick’s dusty-gas and Stefan–Maxwell models to predict the concentration overpotential of a SOFC anode. J. Power Sources 2003, 122, 9–18. [Google Scholar] [CrossRef] [Scilit]
- Yao, Y.; Ma, Y.; Wang, C.; Ye, H.; Liu, Y.; Liu, J.; Zhao, X.; Tao, T.; Yao, Y.; Lu, S.; et al. A cofuel channel microtubular solid oxide fuel/electrolysis cell. Appl. Energy 2022, 327, 120010. [Google Scholar] [CrossRef] [Scilit]
- Price, R.; Cuesta, A.F.; Bausinger, H.; Longo, G.; Naden, A.B.; Grolig, J.G.; Mai, A.; Irvine, J.T.S. Evaluation and upscaling of impregnated La0.20Sr0.25Ca0.45TiO3 fuel electrodes for solid oxide electrolysis cells. J. Electrochem. Soc. 2024, 171, 104503. [Google Scholar] [CrossRef] [Scilit]
- Dong, D.; Shao, X.; Hu, X.; Chen, K.; Xie, K.; Yu, L.; Ye, Z.; Yang, P.; Parkinson, G.; Li, C.-Z. Improved gas diffusion within microchanneled cathode supports of SOECs for steam electrolysis. Int. J. Hydrog. Energy 2016, 41, 19829–19835. [Google Scholar] [CrossRef] [Scilit]
- Cui, D.; Yang, Y.; Wang, G.; Shi, Y.; Li, Y.; Cheng, M.; Ji, Y.; Tu, B. Modeling analysis of SOFC supported on anode employing straight channel fabricated by phase-inversion method. Int. J. Hydrog. Energy 2024, 69, 486–492. [Google Scholar] [CrossRef] [Scilit]
- Kim, S.; Joh, D.W.; Lee, D.-Y.; Lee, J.; Kim, H.S.; Khan, M.Z.; Hong, J.E.; Lee, S.-B.; Park, S.J.; Song, R.-H.; et al. Microstructure tailoring of solid oxide electrolysis cell air electrode to boost performance and long-term durability. Chem. Eng. J. 2021, 410, 128318. [Google Scholar] [CrossRef] [Scilit]
- Nan, X.; Chen, G.; Wei, K.; Yu, L.; Wang, M.; Ma, Y.; Yu, K.; Geng, S. Impact of MgO morphology and particle size on the performance of SOEC with MgO/NaFeO2 composite electrolyte. Fuel 2025, 400, 135676. [Google Scholar] [CrossRef] [Scilit]
- Bertei, A.; Nucci, B.; Nicolella, C. Microstructural modeling for prediction of transport properties and electrochemical performance in SOFC composite electrodes. Chem. Eng. Sci. 2013, 101, 175–190. [Google Scholar] [CrossRef] [Scilit]

Disclaimer/Publisher’s Note: The statements, opinions and data contained in all publications are solely those of the individual author(s) and contributor(s) and not of MDPI and/or the editor(s). MDPI and/or the editor(s) disclaim responsibility for any injury to people or property resulting from any ideas, methods, instructions or products referred to in the content. |
© 2026 by the authors. Licensee MDPI, Basel, Switzerland. This article is an open access article distributed under the terms and conditions of the Creative Commons Attribution (CC BY) license.