


Abstract
This study develops a lifecycle economic comparison framework for shared energy storage, in which multiple users share a common storage asset through capacity leasing. A multi-service revenue structure, including capacity leasing, spot-market arbitrage, auxiliary frequency regulation, peak shaving, and capacity compensation, is established for comparative evaluation. Case studies are conducted for lithium iron phosphate (LFP) and vanadium redox flow (VRF) batteries across six representative Chinese electricity markets and six standardized revenue-combination scenarios. The results show that, among the scenarios that more closely reflect current operating practices, P3 (capacity compensation + spot market + auxiliary frequency regulation) delivers the highest net present value (NPV). P6 combines all five revenue streams without explicitly modeling service-coupling dispatch constraints, and is therefore treated as a theoretical benchmark rather than an immediately deployable operating mode. Under this benchmark assumption, its calculated NPV is 21.1% and 41.7% higher than that of P3 for the two battery types, respectively. The study also shows that power-related services are more sensitive to rated power, while spot-market and peak-shaving revenues are more dependent on rated capacity.
1. Introduction
Climate change has become a critical global challenge. The Intergovernmental Panel on Climate Change has emphasized the need to limit global warming to 1.5 °C to ensure sustainable development [1]. With the continuous rise in global demand for clean energy and the increasingly severe structural difficulties of the traditional energy system, the installed capacity and power supply proportion of renewable energy sources such as solar energy and wind energy in the power system are showing a rapid upward trend. Statistics show that China’s installed photovoltaic capacity exceeded 890 gigawatts, marking a year-on-year increase of 45.2%, while its wind power installed capacity reached approximately 520 gigawatts, with an annual increase of 18.0% by the end of 2024. However, the high penetration of renewable energy entering the grid has caused significant uncertainty on both the generation and demand sides [2], posing a major challenge to the secure and stable operation of the grid [3,4]. In this context, energy storage, as a flexible resource with strong regulation capability, has attracted increasing attention because of its strategic role and supporting value in power systems. It enhances grid stability and the utilization rate of renewables while reducing costs and improving transaction flexibility [5,6,7].
Nonetheless, there are still many obstacles to the large-scale promotion of China’s energy storage industry, including the lack of long-term mechanisms and considerable uncertainty in revenue streams [8]. Standalone energy storage projects often suffer from low utilization rates and limited revenue, and shared energy storage emerged as a viable solution [9]. Relying on intelligent dispatching, flexible sharing can be achieved among renewable generators, grid operators, and end users, which not only improves efficiency but also reduces costs [10]. With the help of favorable policies and a mature power market, shared energy storage obtains diversified benefits through auxiliary services, spot markets, capacity compensation and other methods [11]. Therefore, it is the key to the new power system and the development of sustainable energy [12], and at the same time, the role it plays in the process of reconstructing the global energy landscape is also becoming increasingly crucial.
Previous studies have examined shared energy storage from multiple perspectives, primarily focusing on business modes, investment strategies, and market mechanisms. Regarding business operation modes, studies [13,14,15,16,17] have summarized diverse pathways such as the ancillary service market mode, virtual power plant mode, and energy performance contracting mode, aiming to integrate dispersed storage resources for peak shaving and frequency regulation. These modes address the limitations of the traditional “exclusive” mode, which suffers from high initial investment and low utilization rates, by promoting resource sharing among generation, grid, and user sides. In terms of investment and economic viability, research [8,18,19] distinguishes between independent investment and joint investment modes. It is noted that while independent investment suits large enterprises with strong capital, joint investment facilitates multi-party cooperation by leveraging technical and financial advantages. However, recent analyses [20,21] highlight that the profitability of shared storage remains a challenge, often heavily reliant on capacity leasing revenue and constrained by immature market mechanisms. Furthermore, concerning market mechanisms and pricing, scholars [22] have proposed pricing strategies based on capacity, flow, and packages to optimize revenue distribution and facilitate market transactions.
However, notable limitations persist in the aforementioned research. Studies on business modes often remain conceptual, lacking a quantitative evaluation framework. Meanwhile, operational optimization research is typically confined to single or limited revenue streams, failing to systematically assess the combined impact of multi-service coupling on the lifecycle economics of projects. Furthermore, comparative studies on different storage technologies (e.g., LFP vs. VRF batteries) under identical market rules are scarce.
To address these gaps, this study establishes a unified lifecycle economic comparison framework for shared energy storage under multiple revenue combinations, including capacity leasing, spot arbitrage, capacity compensation, peak shaving, and frequency regulation ancillary services. Rather than proposing a real-time dispatch optimization strategy, this study focuses on comparative economic assessment across representative market settings and battery technologies. Specifically, this work: (1) characterizes region-specific revenue environments in six typical provincial electricity markets in China; (2) compares the lifecycle economic performance of two representative battery technologies under six standardized revenue-combination scenarios; and (3) identifies key revenue-driving parameters through sensitivity analysis. The main contribution of this paper therefore lies in offering a structured comparative framework for assessing economic potential, rather than demonstrating the operational feasibility of fully stacked multi-service dispatch.
2. Energy Storage Business Modes
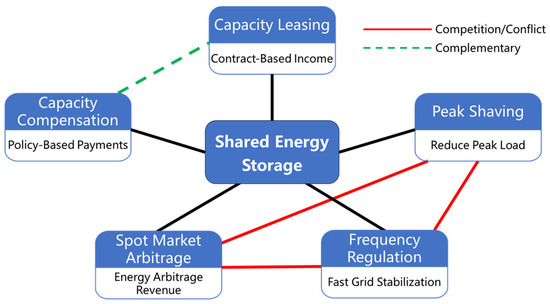
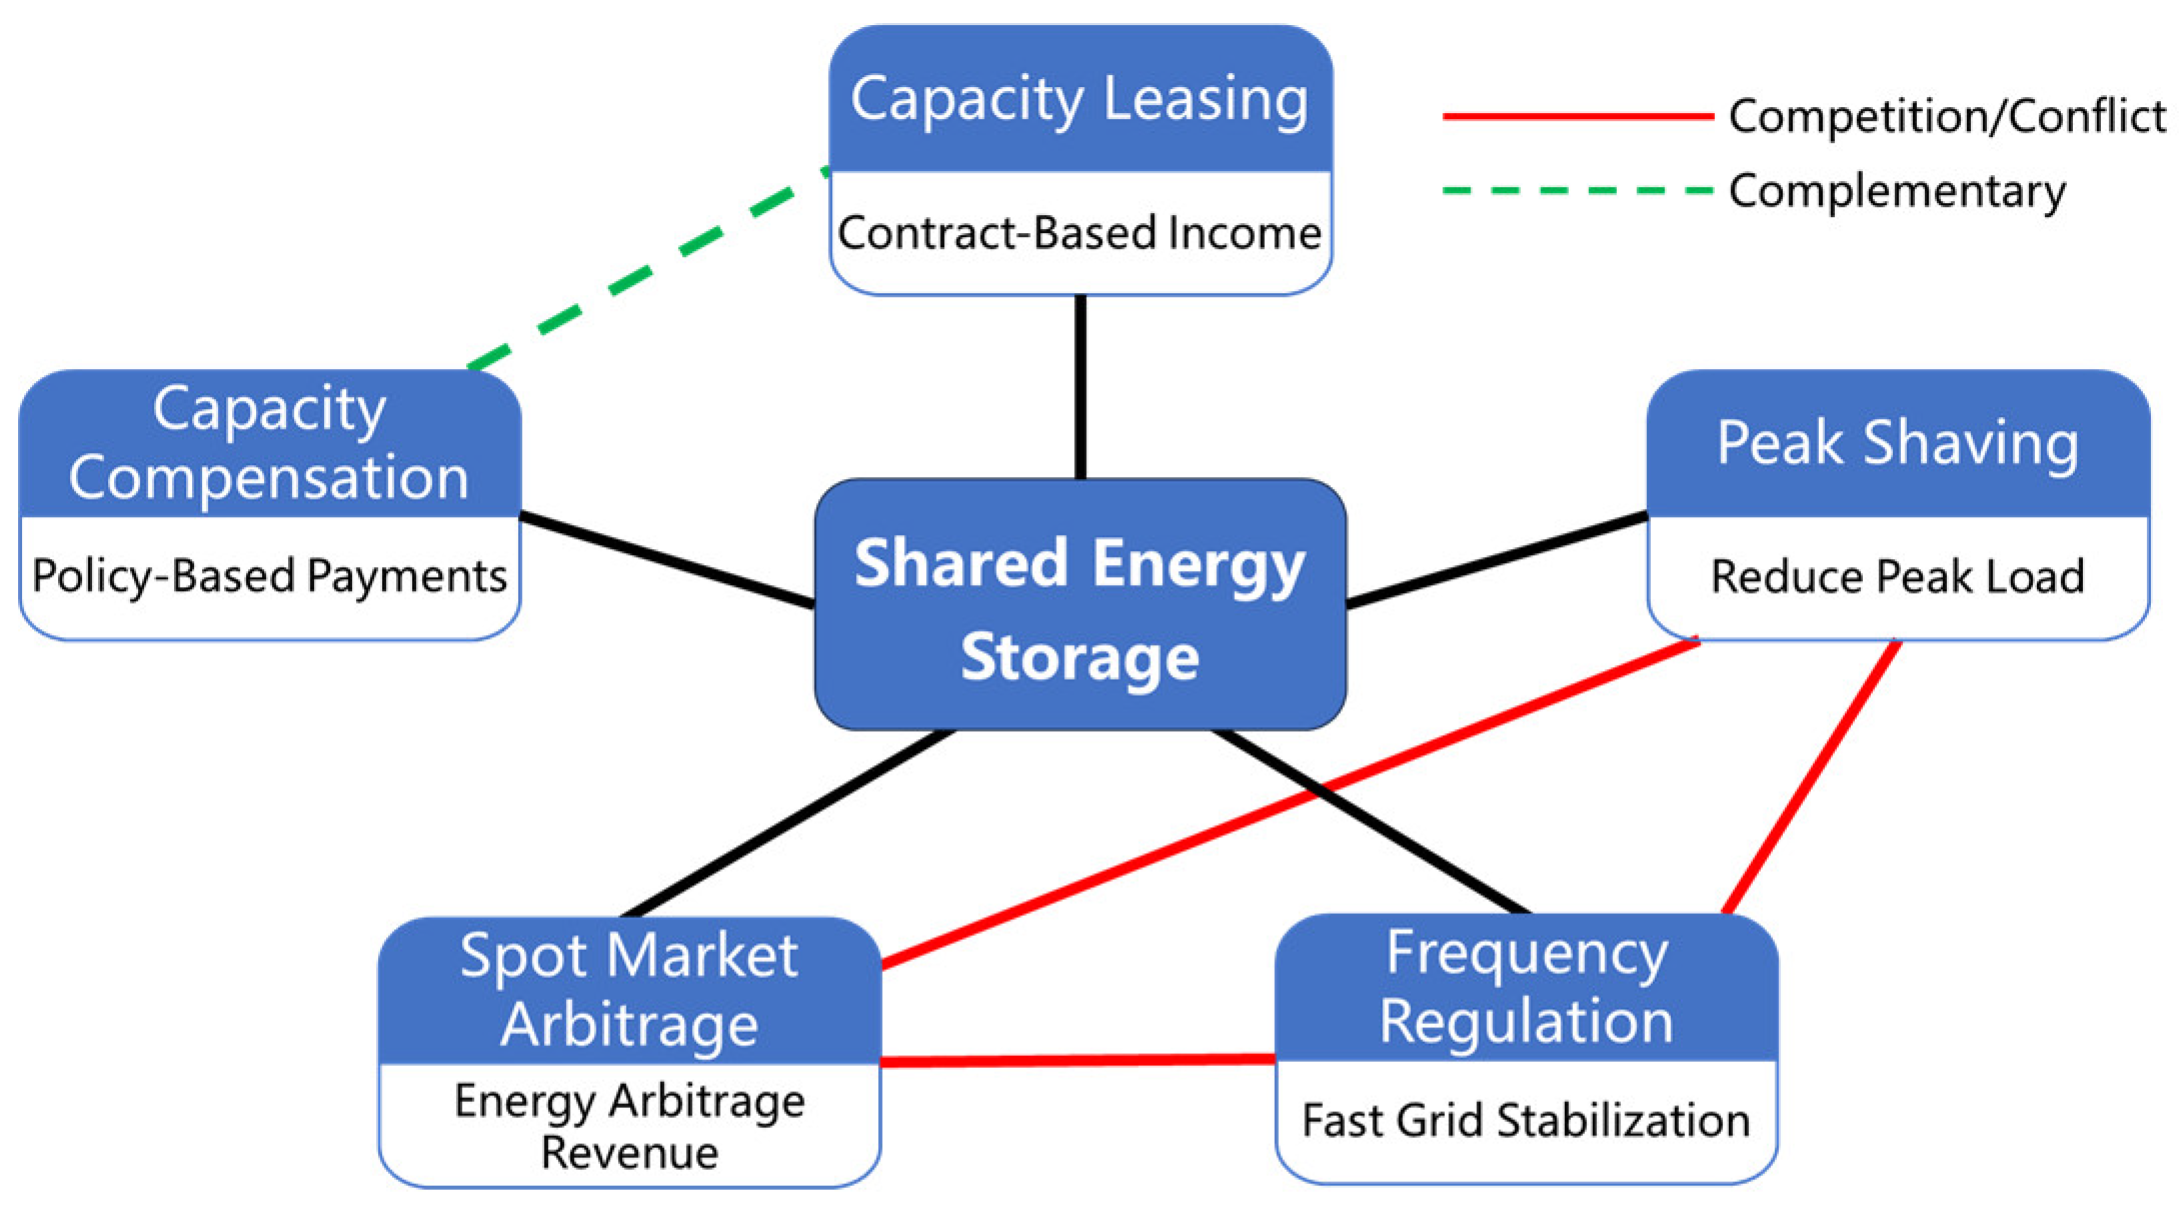
To better support the economic analysis in this study, Figure 1 illustrates the relationships among the major revenue services of shared energy storage. The figure shows that some services may be combined in a relatively compatible manner, whereas others are more closely related in terms of their use of storage power, capacity, and dispatch time. Therefore, the economic performance of shared energy storage is influenced not only by the availability of multiple revenue channels but also by the relationships among different services. In the commercialization process of China’s energy storage industry, differentiated business modes have emerged in diverse application scenarios [23,24]. This study applies the SWOT [25] (Strengths, Weaknesses, Opportunities, Threats) analysis method to comprehensively analyze six energy storage business operation modes, aiming to systematically sort out the core competitiveness and potential problems of each mode: the two-part tariff mode, the negotiated leasing mode, the ancillary services market mode, the energy performance contracting mode, the independent energy storage mode, and the shared energy storage mode [26], as shown in Table 1.
Figure 1.
Relationships among major revenue services of shared energy storage.
Table 1.
SWOT analysis of energy storage business modes.
The two-part tariff mode can accurately reflect the fixed operating costs and variable production expenditures of the power system. Setting the capacity tariff makes large industrial users bear more fixed costs and prevents residential users from being overburdened. Capacity pricing prompts users to adjust their electricity consumption, for example, transferring production to off-peak hours, reducing the peak–valley difference, and optimizing resource allocation. However, its current application scope remains limited, and the proportion of the capacity tariff in the overall electricity price is relatively low.
Under the ancillary services market model, competitive bidding and dynamic compensation incentivize resources such as energy storage to respond rapidly to grid requirements. This technical means can effectively stabilize the fluctuation range at the load end, and at the same time promote the large-scale grid connection and efficient integration of renewable energy. The current policy framework prominently places the strategic position of energy storage technology in the market development, and at the same time, also reserves policy space for energy dispatch and transaction between regions. However, competition rules and regulatory standards vary substantially across regions, and coupled with changes in policies or changes in market supply and demand, the returns will fluctuate.
The negotiated leasing model offers flexible revenue arrangements. Users can rely on lease amortization to share costs and do not need to make large upfront investments in equipment. This point is particularly crucial for small and medium-sized enterprises, and it can also inject new impetus into the vigorous development of the leasing industry. However, with more people participating and market competition becoming intense, the profit margin may decrease.
In the energy performance contract, the service provider pays first, and the user pays according to usage. However, situations such as too long contract period, reduced technical performance, and changed user behavior will affect the energy-saving effect, and the service provider bears the risks of technical degradation and revenue decline.
Independent energy storage operation mode can obtain operating revenues by participating in multi-dimensional energy services and has relatively high operating autonomy. There are drawbacks, such as high initial investment costs, long payback periods, and often relying on policy subsidies in some regions. Policies that require renewable energy projects to install energy storage have created market opportunities for this mode.
Shared energy storage belongs to a collaborative mode, that is, one energy storage asset provides services for multiple interested parties. Different from traditional dedicated energy storage (one entity owns and operates it), aggregating users’ capacities to achieve economies of scale can be flexibly leased and coordinated, and can also obtain benefits from multiple markets (such as the spot market, frequency regulation market, and peak shaving market). It reduces the burden of personal investment and improves the utilization rate of assets. However, there are also difficulties, such as coordinating stakeholders’ interests, meeting users’ needs, resolving conflicts in profit distribution, and dealing with imperfect profit-sharing mechanisms.
The core features of shared energy storage are multi-user participation, capacity leasing, and intelligent regulation. The subsequent part will evaluate the economic benefits of the mode according to this.
4. Results and Discussion
4.1. Parameter Specification and Baseline Values
In the current practical implementation of shared energy storage projects in China, lithium iron phosphate (LFP) batteries dominate the market, whereas vanadium redox flow batteries have been deployed in only a limited number of projects [34]. To reflect this reality, case analyses were conducted based on two representative battery technologies: lithium iron phosphate batteries and vanadium redox flow batteries, as detailed in Table 3 [35]. In the LFP battery case study, the system was configured with a capacity of 100 MW/200 MWh. In the case study of the vanadium flow battery, a configuration of 100 MW/400 MWh was adopted, and the residual recovery value was incorporated into the cost assessment framework. For clarity, the replacement assumption used in the lifecycle cost calculation is restated here: for LFP batteries, one replacement is assumed for peak-shaving-dominated operation, whereas five replacements are assumed for frequency-regulation-dominated operation because of the higher cycling intensity. In scenarios involving frequency regulation, the higher-cycle replacement assumption is adopted in the cost calculation.
Table 3.
Shared energy storage technical and economic parameters.
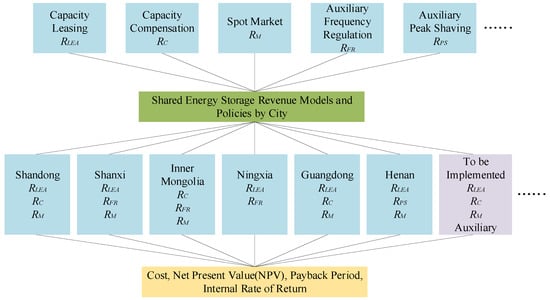
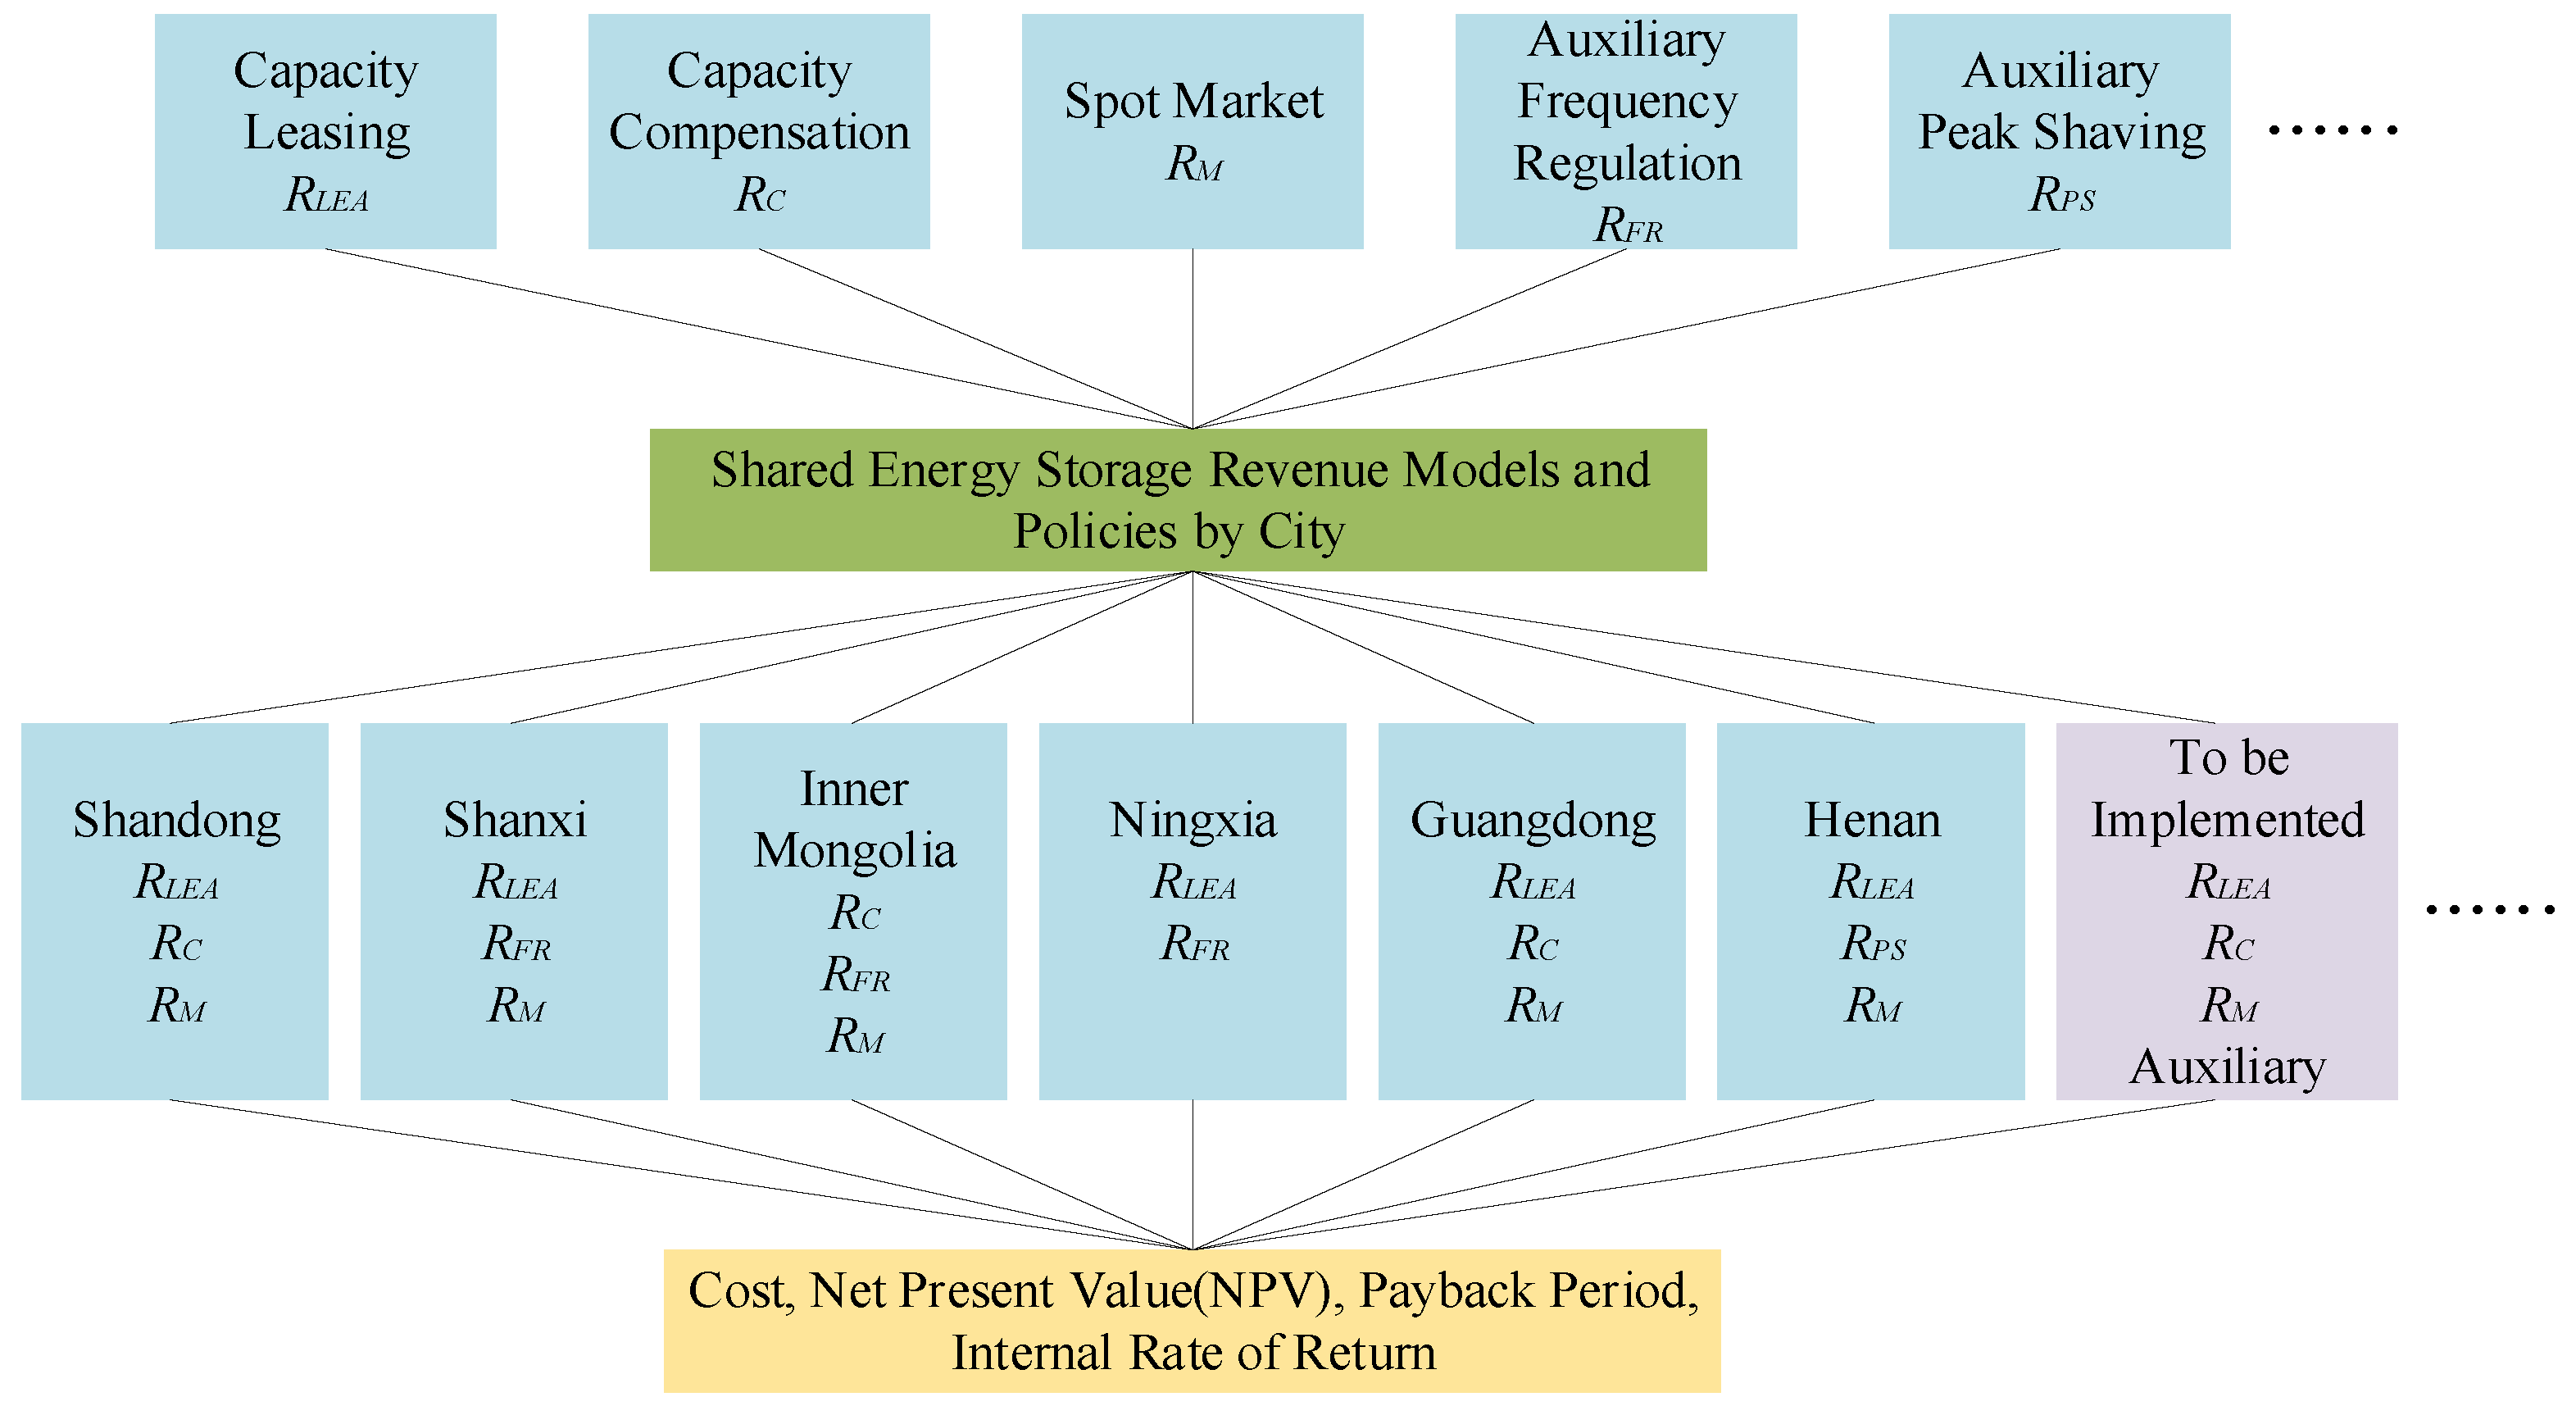
Based on representative revenue structures observed in current shared energy storage practice [38], this study defines six standardized revenue-combination scenarios (P1–P6) for comparative economic evaluation, as summarized in Table 4. These scenarios are designed to support structured comparison under unified assumptions rather than to represent dispatch-feasible operating portfolios in a specific province.
Table 4.
Standardized revenue-combination scenarios for comparative evaluation.
4.2. Economic Analysis of Shared Energy Storage Technology
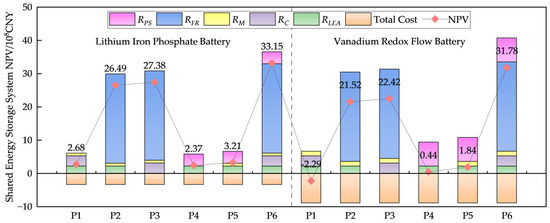
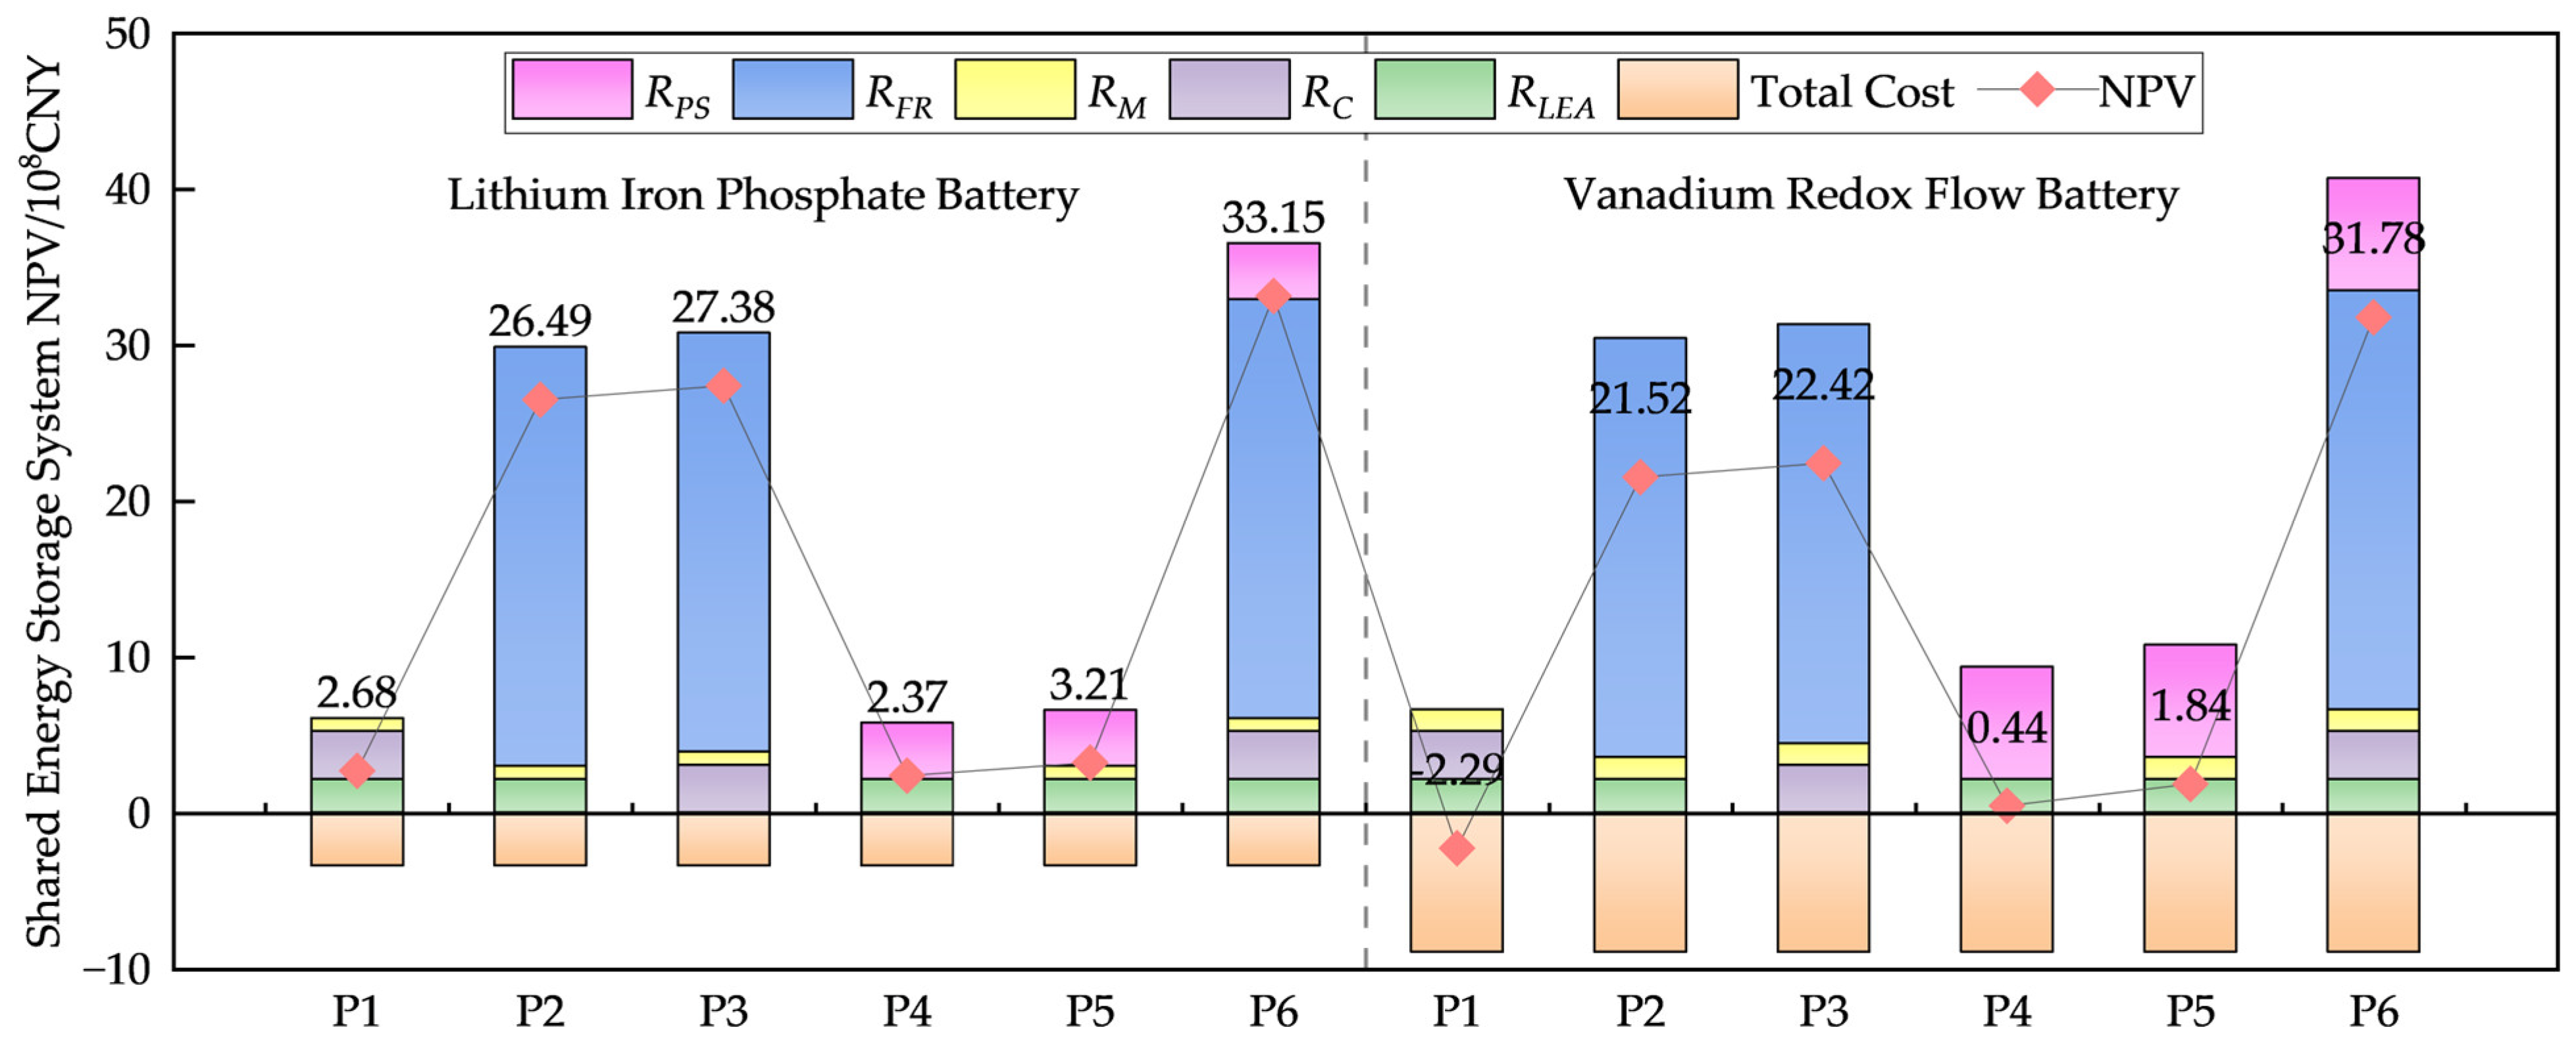
First, the life-cycle costs, revenues, and NPVs of shared energy storage under the six standardized revenue-combination scenarios were calculated and compared [39], as shown in Figure 6. Among the scenarios more consistent with currently observed operational frameworks (P1–P5), P3 yielded the highest NPV, reaching CNY 2.738 billion for LFP batteries and CNY 2.242 billion for vanadium redox flow (VRF) batteries. By contrast, P6 is treated in this study as a benchmark scenario that aggregates all five revenue streams without explicitly modeling service-coupling dispatch constraints. In practical operation, the attainable revenue of P6 would likely be lower than this benchmark value because different services compete for the same storage power, energy capacity, and dispatch time. For example, frequency regulation usually requires reserved fast-response power and state-of-charge headroom, whereas spot-market arbitrage and peak shaving consume storage capacity during specific time periods. Therefore, mutual exclusivity between frequency regulation and spot-market arbitrage may reduce the actual P6 revenue, and the magnitude of this reduction depends on how storage resources are allocated among services over time. Under this additive-revenue assumption, the calculated NPV of P6 is 21.1% and 41.7% higher than that of P3 for LFP and VRF batteries, respectively. The full-lifecycle cost of the LFP battery system was CNY 339 million, while that of the VRF battery system was CNY 893 million. Due to its higher cost, the NPV of the VRF battery remained lower than that of the LFP battery across all scenarios.
Figure 6.
Shared energy storage project net present value.
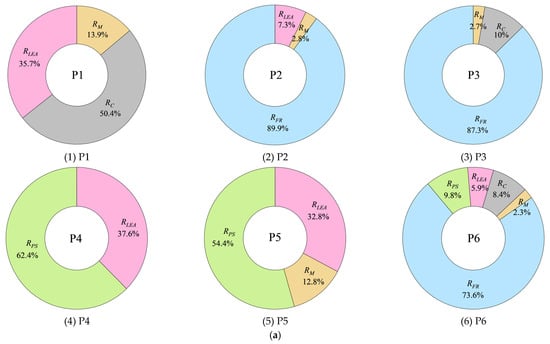
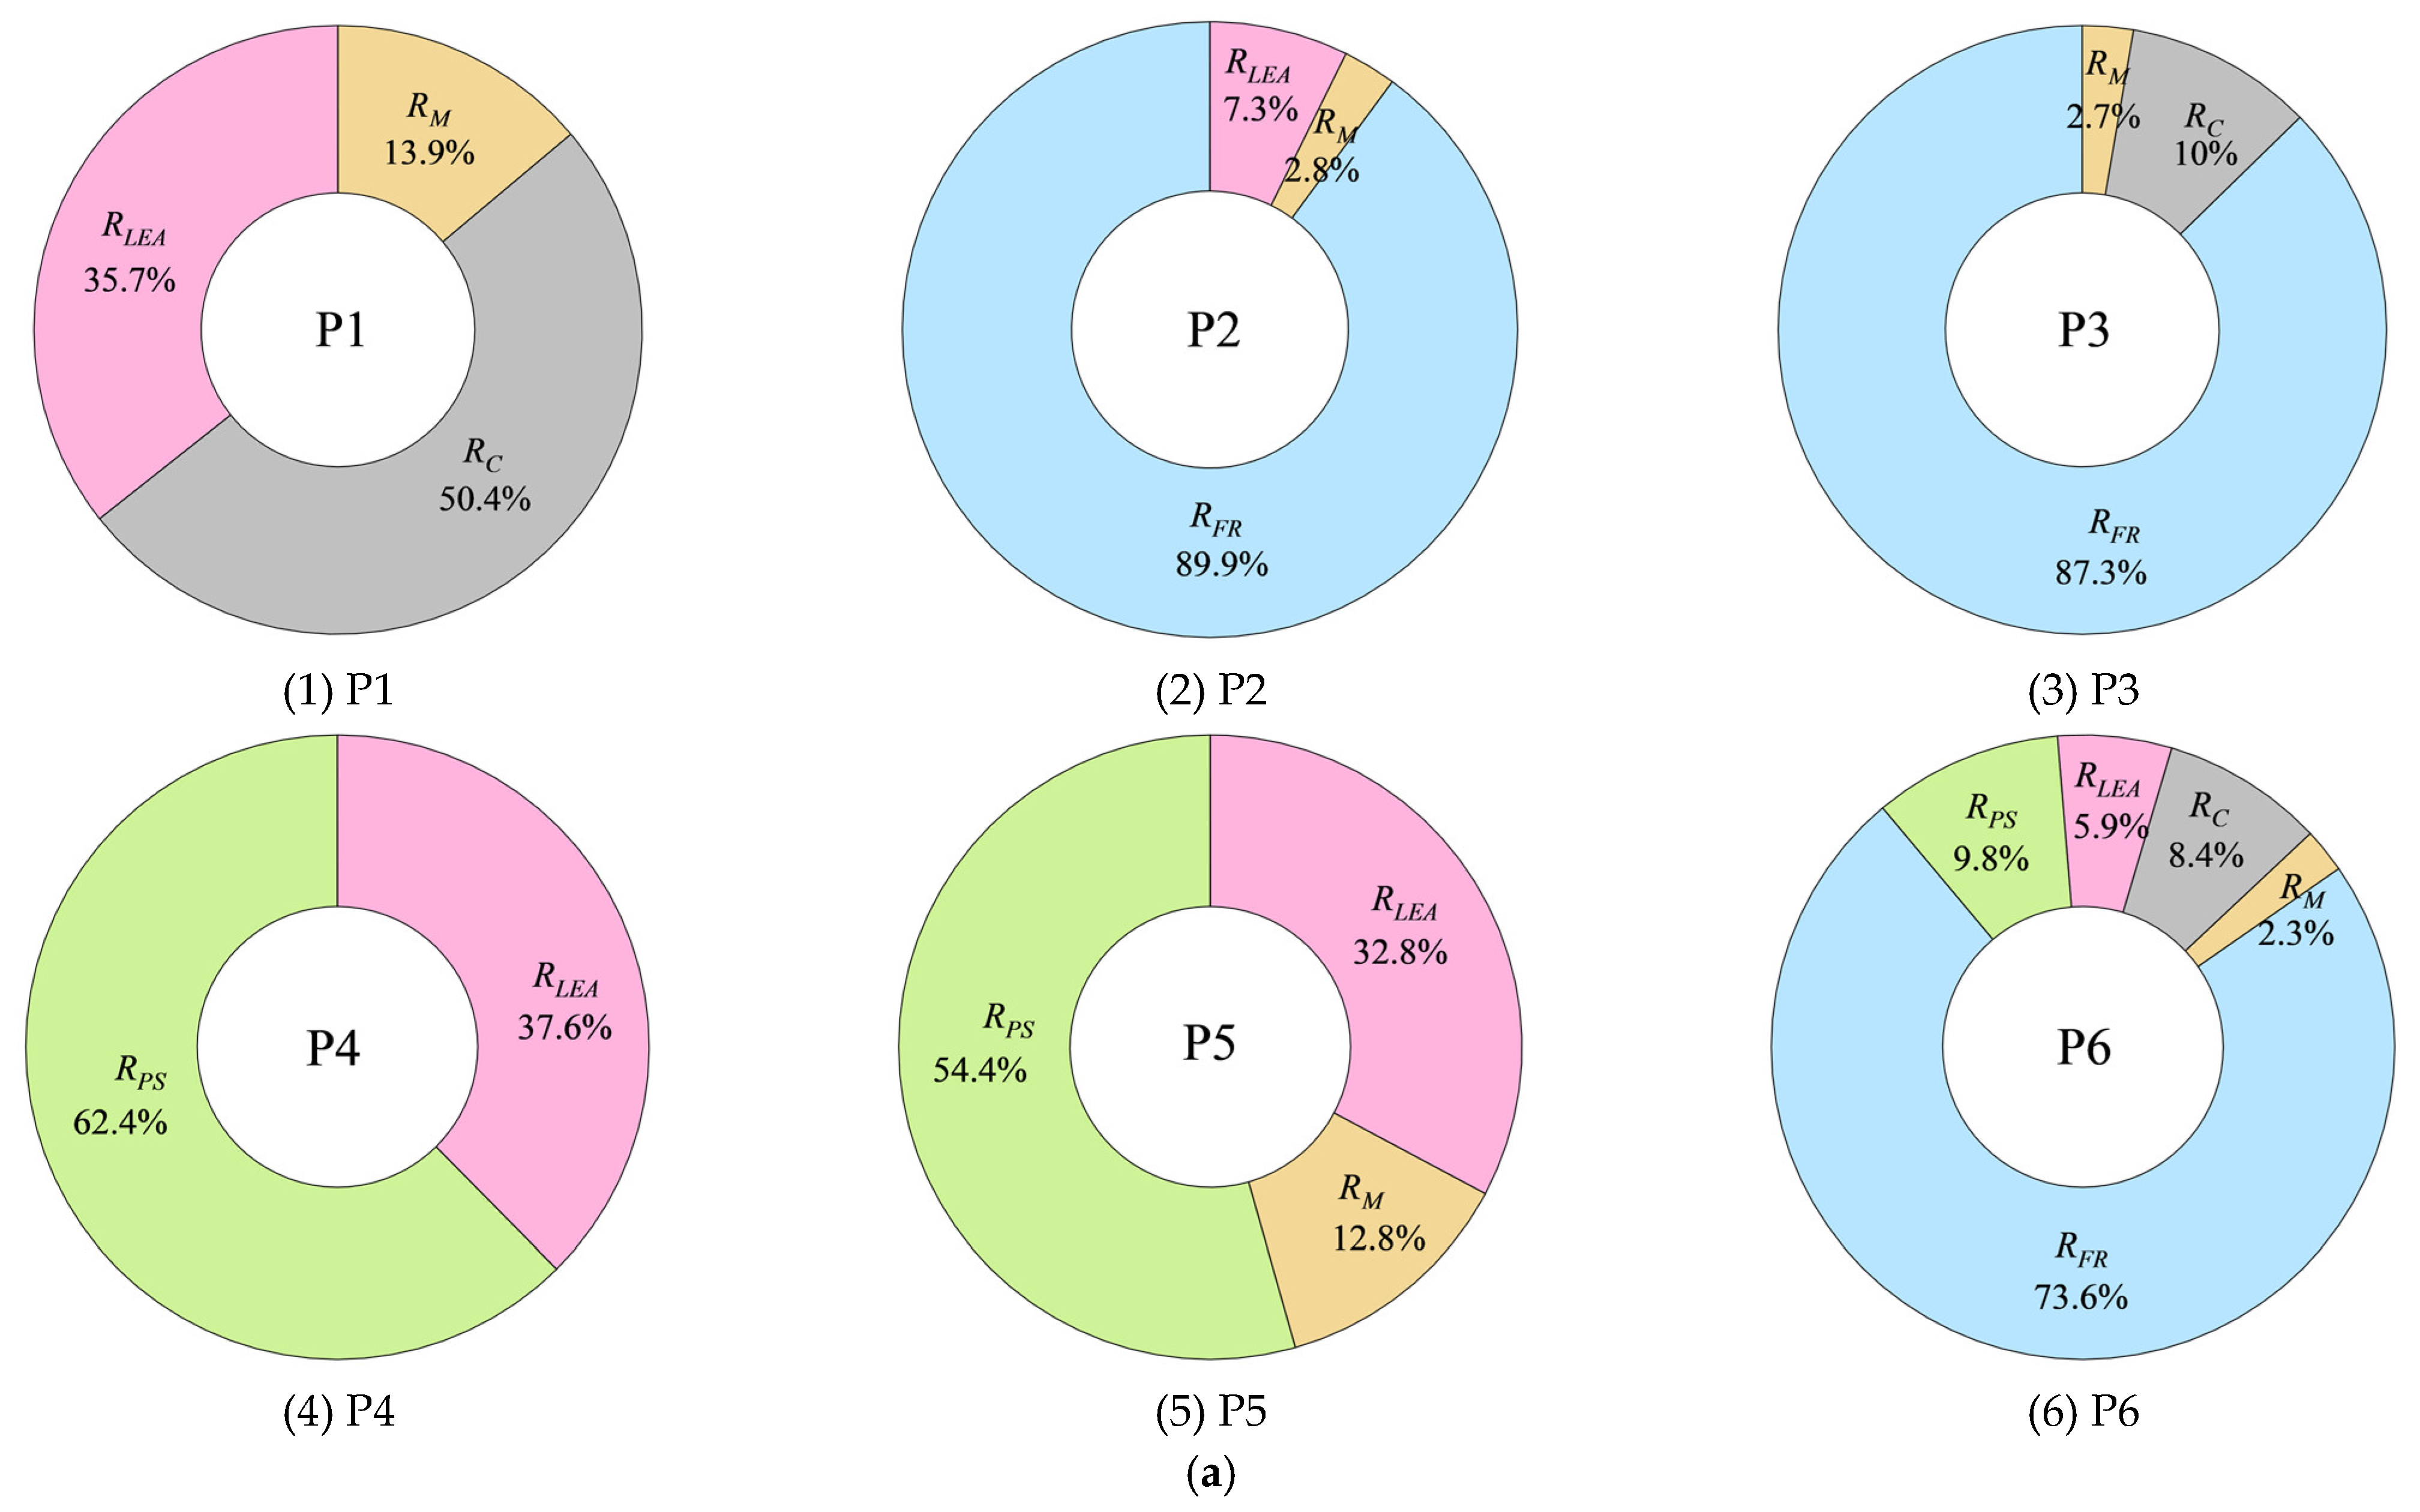
Taking LFP batteries as an example, the proportion of revenue from various sources under the six revenue scenarios was analyzed, as shown in Figure 7a. In P1, capacity subsidies accounted for 50.4% of the shared energy storage project’s revenue, representing a significant subsidy contribution. In P2, P3, and P6, revenue from ancillary frequency regulation constituted 89.9%, 87.3%, and 73.6% of total revenue, respectively. In P4 and P5, revenue from providing ancillary peak-shaving services accounted for 62.4% and 54.4%, respectively. The data shows that the auxiliary service revenue of shared energy storage is much higher than that of other service types.
Figure 7.
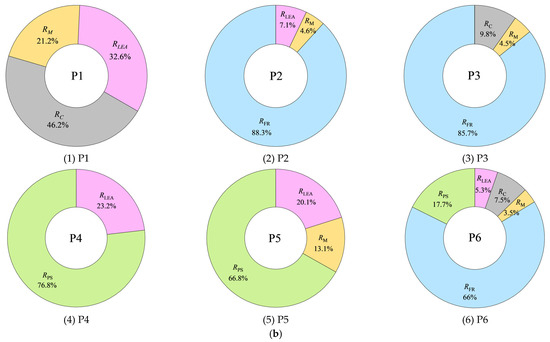
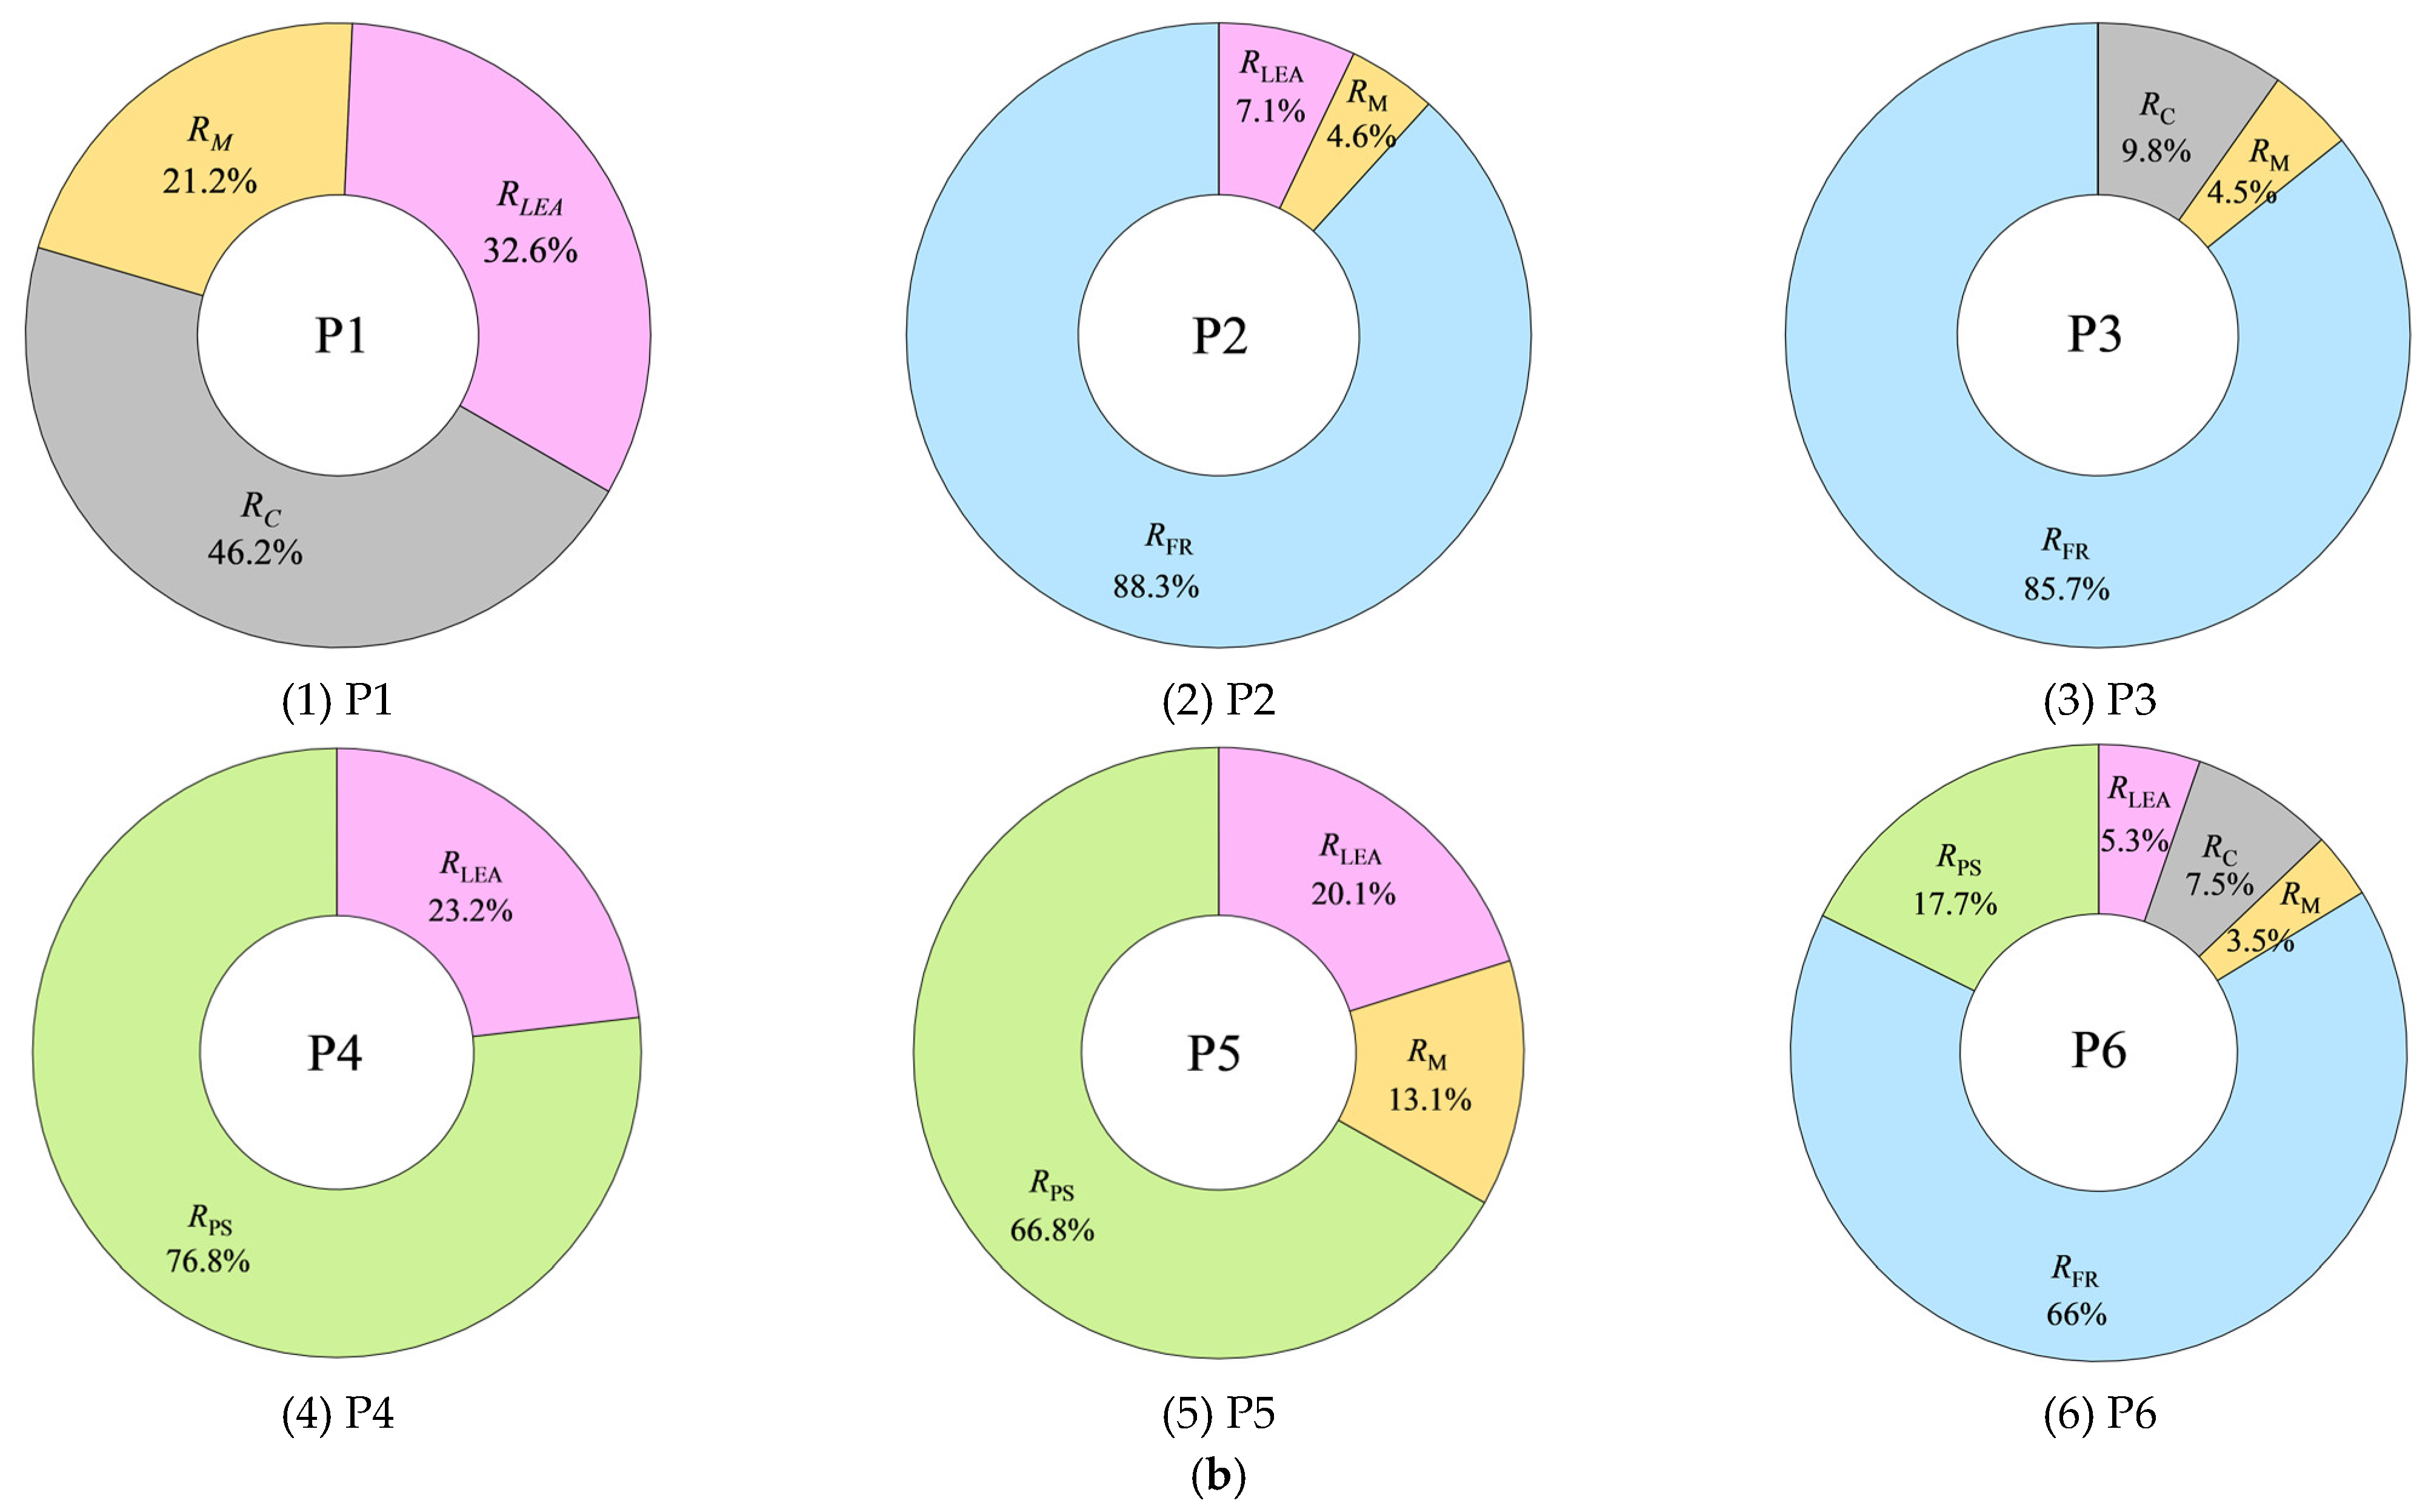
Proportion of revenue in P1-P6 scenarios. (a) LFP (b) VRF.
For completeness, the revenue-share distributions of VRF batteries under P1–P6 are additionally provided in Figure 7b. Compared with LFP batteries, VRF batteries show a relatively larger contribution from peak-shaving revenue in scenarios involving longer discharge duration, although their overall NPV remains constrained by higher lifecycle cost.
To further interpret the role of the 4 h VRF configuration across different revenue-combination scenarios, it should be noted that its longer discharge duration provides only limited benefit in P2 and P3, where the dominant revenue is ancillary frequency regulation and is more closely related to rated power than to storage duration. By contrast, the longer duration of VRF is more relevant in P4 and P5, because these scenarios include peak-shaving revenue, which is more energy-oriented. In P1, the longer duration can moderately improve spot-market arbitrage potential, but the gain remains insufficient to offset the much higher lifecycle cost. In P6, although the longer duration contributes to peak-shaving-related revenue, the overall economic result is still constrained by the cost premium of VRF and by the fact that the largest revenue share is not exclusively determined by storage duration.
In summary, cost remains a key constraint on the NPV of VRF batteries. Although some revenue streams are more favorable to long-duration storage, higher lifecycle cost still weakens overall economic competitiveness. The higher NPV obtained in P6 should be understood as the theoretical value space associated with broader multi-service participation under additive revenue stacking, rather than as evidence of a currently achievable operating improvement.
4.3. Comparative Analysis of Net Present Value Under Different Energy Storage Capacities
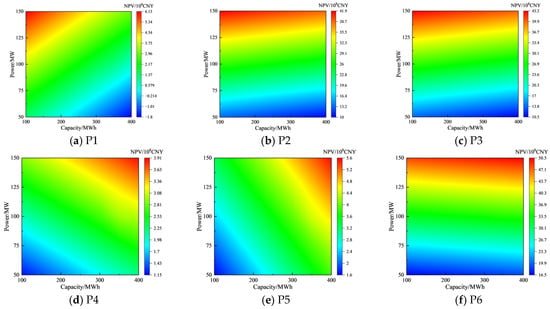
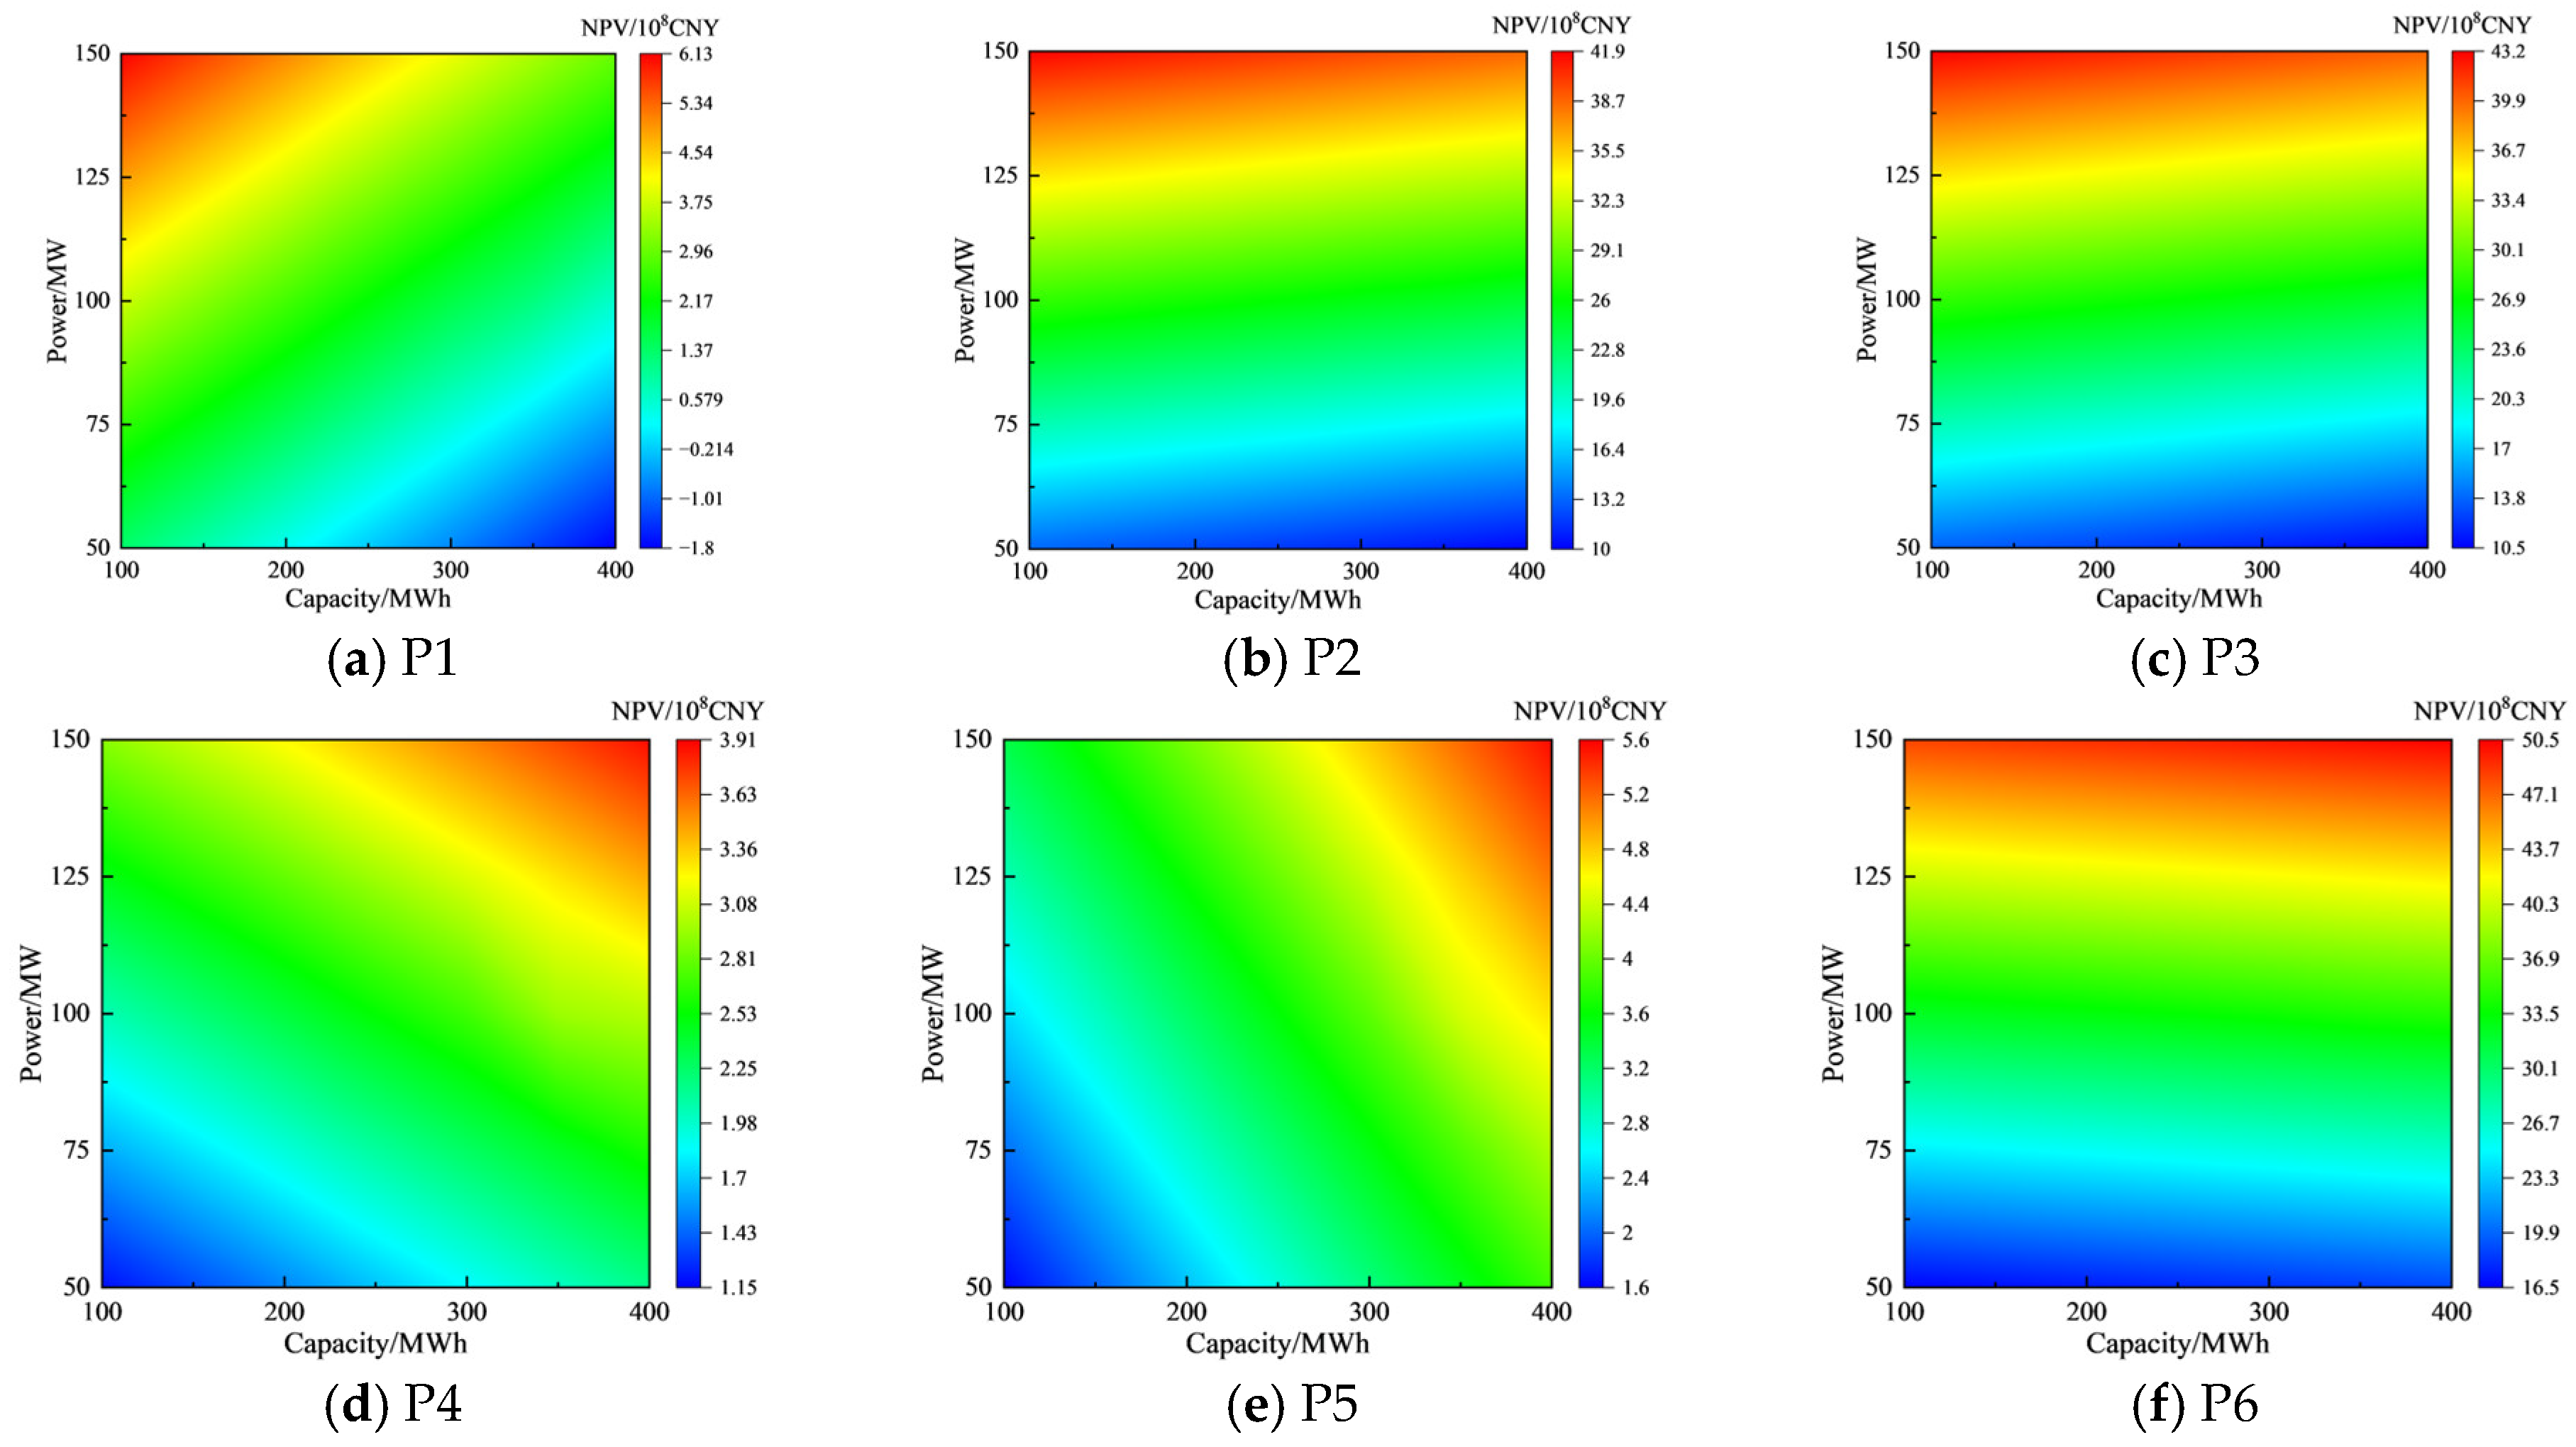
Using the LFP battery as an example and holding the technical parameters constant, the rated energy storage capacity is, respectively, set to 100 to 400 MWh, and the rated power is adjusted to 50 to 150 MW. Then, a comparative study on the system performance under different combinations of capacity and power is carried out. Using the economic value evaluation framework of collaborative energy storage, the NPV of collaborative energy storage projects under six revenue-combination scenarios is calculated. This research process needs to explore the mechanism by which the configuration selection of capacity and power parameters affects the NPV of the project.
Figure 8 presents the effect of different energy storage capacity and power parameters on the NPV of energy storage projects under scenarios P1–P6. In P1, when the installed capacity was constant, each 25 MW increase in rated power resulted in an NPV increase of CNY 120 million. Conversely, with rated power held constant, each 50 MWh increase in rated capacity led to an NPV decrease of CNY 52 million. Since the main sources of income for P1, namely capacity subsidies and leasing, are positively correlated with power, increasing the capacity has a relatively limited improvement in the spot market income and also incurs higher costs.
Figure 8.
The influence of different energy storage capacities on the net present value.
In P2, with the installed capacity being constant, each 25 MW increase in rated power resulted in a linear NPV increase of CNY 715 million. Conversely, when the rated power was constant, each 50 MWh increase in rated capacity led to a linear NPV decrease of CNY 52 million. This is because revenue in P2 primarily came from ancillary frequency regulation, which was positively correlated with power, while increased capacity only marginally improved spot market revenue at a disproportionately higher cost.
In P3, with the constant installed capacity, increasing the rated power from 50 MW to 150 MW yielded a linear NPV growth of CNY 2.948 billion. With the rated power being constant, increasing the storage capacity from 100 MWh to 400 MWh resulted in a linear NPV decrease of CNY 315 million. This pattern is similar to that observed in P2 and P3, because ancillary frequency regulation accounts for up to 87.3% of total revenue. Therefore, the influence of capacity configuration on project NPV in P3 and P2 followed the same pattern.
In P4, when the installed capacity was constant, each 25 MW increase in rated power led to an NPV increase of CNY 43 million. With rated power held constant, each 50 MWh increase in rated capacity resulted in an NPV increase of CNY 16 million. The main revenue sources in P4, namely auxiliary peak regulation (positively correlated with capacity) and capacity leasing, both contribute significantly to the increase in returns.
In P5, with the installed capacity being constant, each 25 MW increase in rated power yielded a linear NPV growth of CNY 42 million. When the rated power was constant, each 50 MWh increase in rated capacity produced a linear NPV increase of CNY 37 million. P5 was built on the basis of P4 by incorporating additional revenue from the spot market. However, ancillary peak shaving was the dominant revenue component (constituting 54.4% of the total) and positively correlated with capacity.
In P6, with the constant installed capacity, increasing the rated power from 50 MW to 150 MW resulted in a linear NPV increase of CNY 3.165 billion. With the rated power being constant, increasing the storage capacity from 100 MWh to 400 MWh led to a linear NPV growth of CNY 354 million. This is because the revenue in P6 was primarily derived from ancillary frequency regulation (accounting for 73.6% of the total), while the diversified revenue streams consisted of the enhanced ancillary peak shaving and spot market earnings that were obtained through increasing capacity.
For Figure 8, Figure 9, Figure 10, Figure 11 and Figure 12, the three-dimensional bar charts are retained to provide an intuitive comparison of the overall trends under different parameter combinations. The exact numerical values corresponding to these figures are provided in the Supplementary Materials to facilitate quantitative comparison and reproduction.
Figure 9.
The impact of rental ratio and rental price on rental income.
Figure 10.
The impact of peak–valley price differential and energy storage efficiency on spot market revenue.
Figure 11.
The impact of mileage compensation and comprehensive adjustment performance indicators on auxiliary frequency modulation revenue.
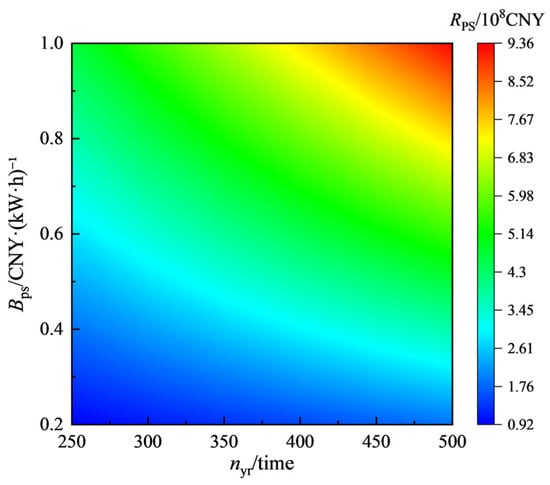
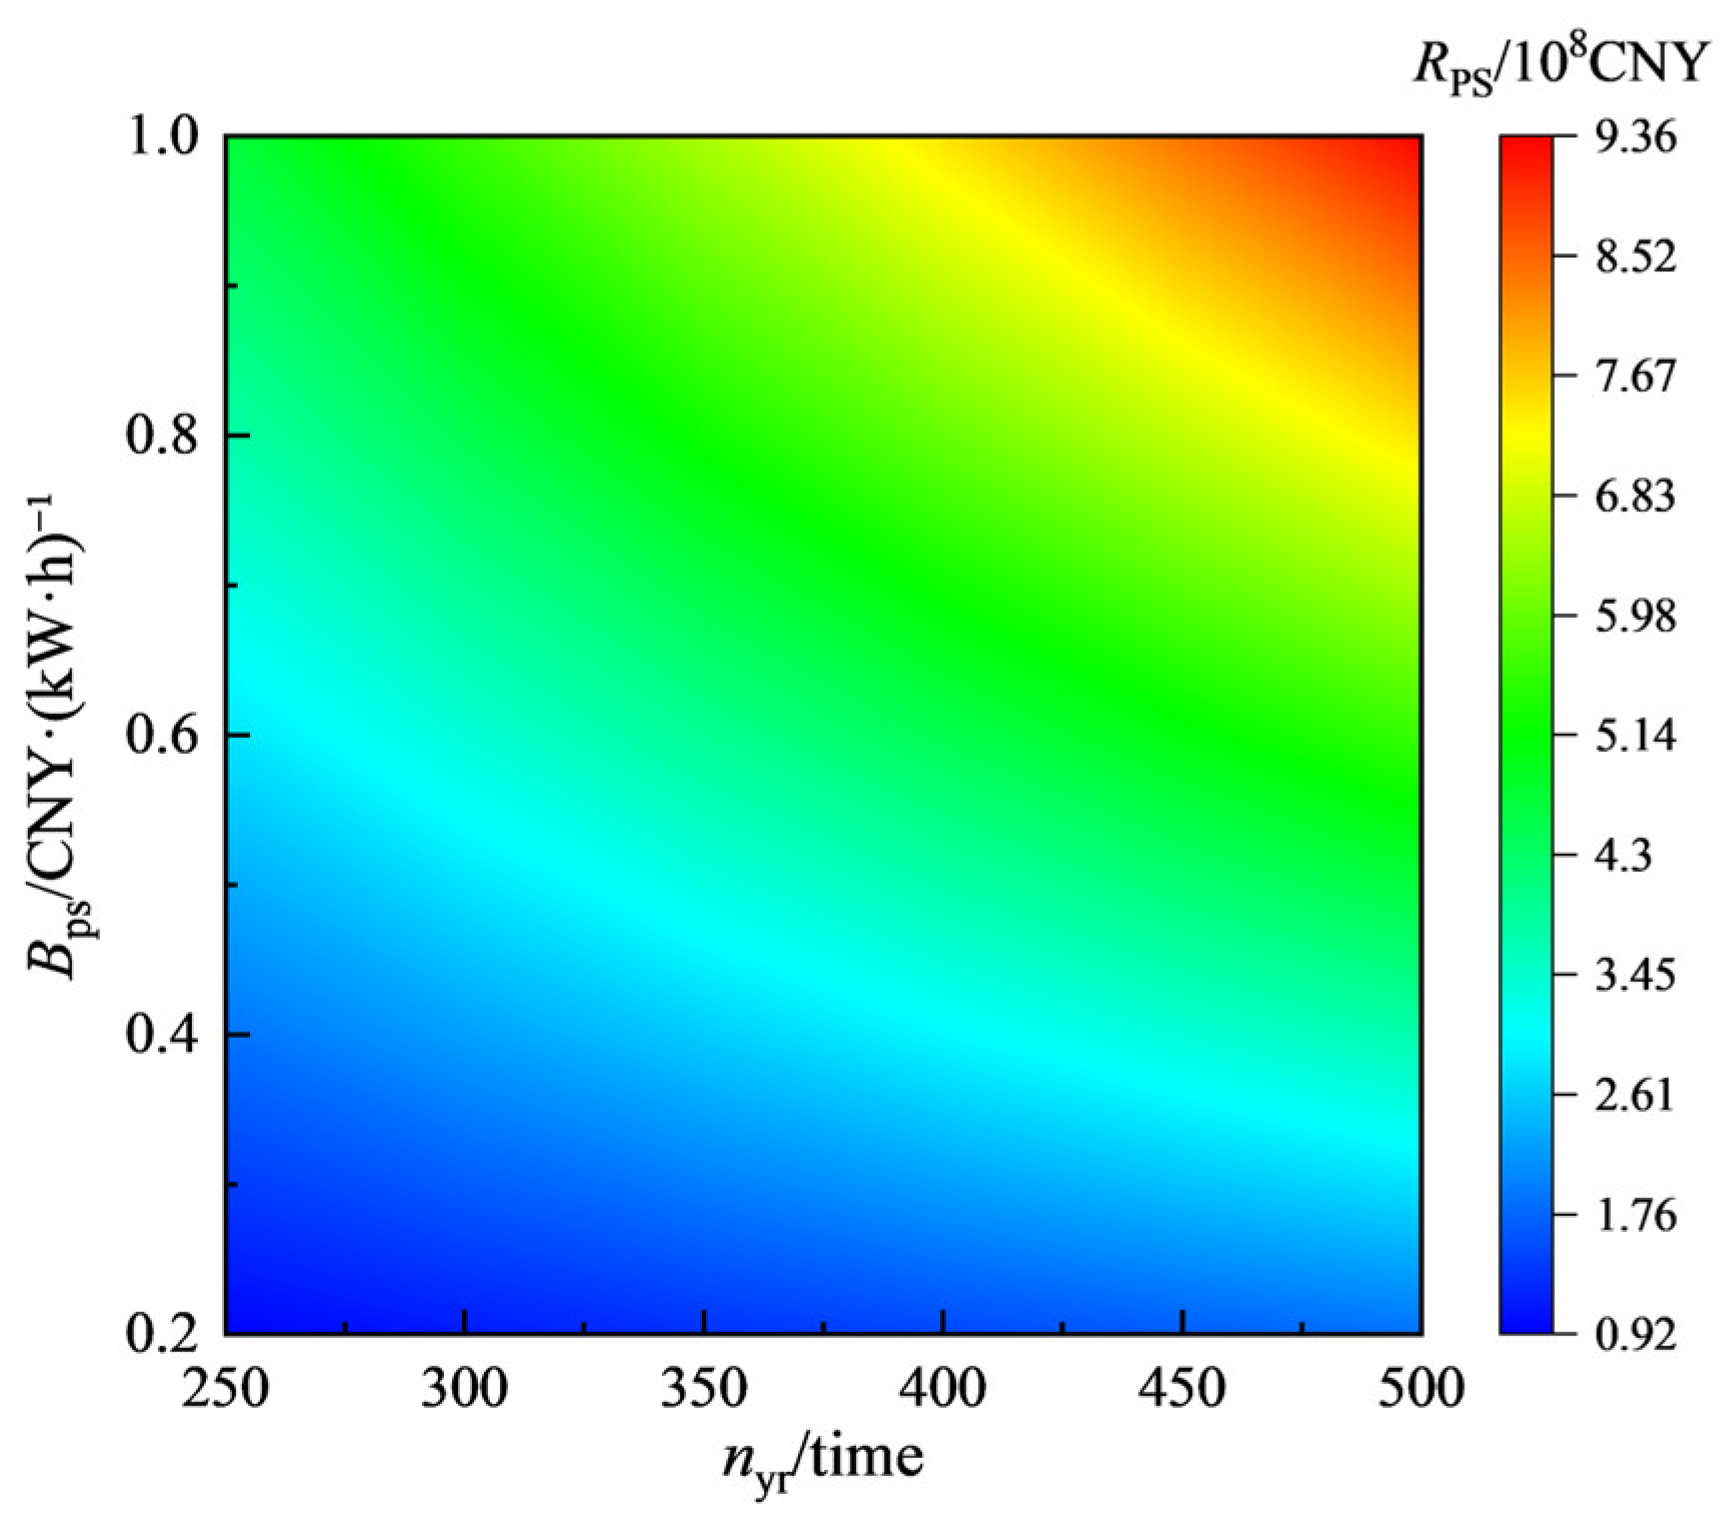
Figure 12.
The impact of annual dispatch count and peak shaving compensation on auxiliary peak shaving revenue.
This also helps explain the comparative performance of the 4 h VRF configuration: longer-duration storage is more advantageous in energy-oriented services, whereas several of the more profitable scenarios in this study are dominated by power-oriented revenues. Therefore, extending storage duration alone does not necessarily improve overall lifecycle economic performance.
In conclusion, there is a significant correlation between the NPV level of the shared energy storage project and its installed capacity configuration. Revenue from ancillary frequency regulation, capacity subsidies, and capacity leasing increases with higher rated power, whereas earnings from participation in the electricity spot market and ancillary peak shaving rise with increased rated capacity. Although revenue is important, cost impacts must also be considered. Maximizing economic benefits requires balancing capacity configuration optimization and effective cost control.
4.4. Analysis of Parameters Affecting Shared Energy Storage Revenue
To examine the sensitivity of different revenue components to key market and operational variables, this study uses the P6 benchmark scenario as the basis for sensitivity analysis. This choice is made because P6 contains all five revenue components within one unified scenario, which facilitates parameter-wise sensitivity analysis. It does not imply that the full combination is currently dispatch-feasible under existing market constraints.
4.4.1. Impact of Leasing Ratio and Leasing Price on Leasing Revenue
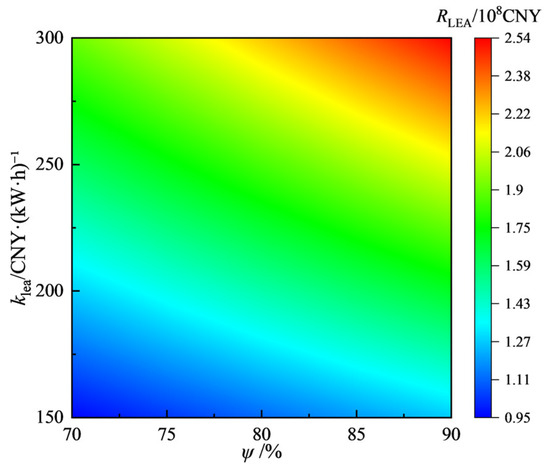
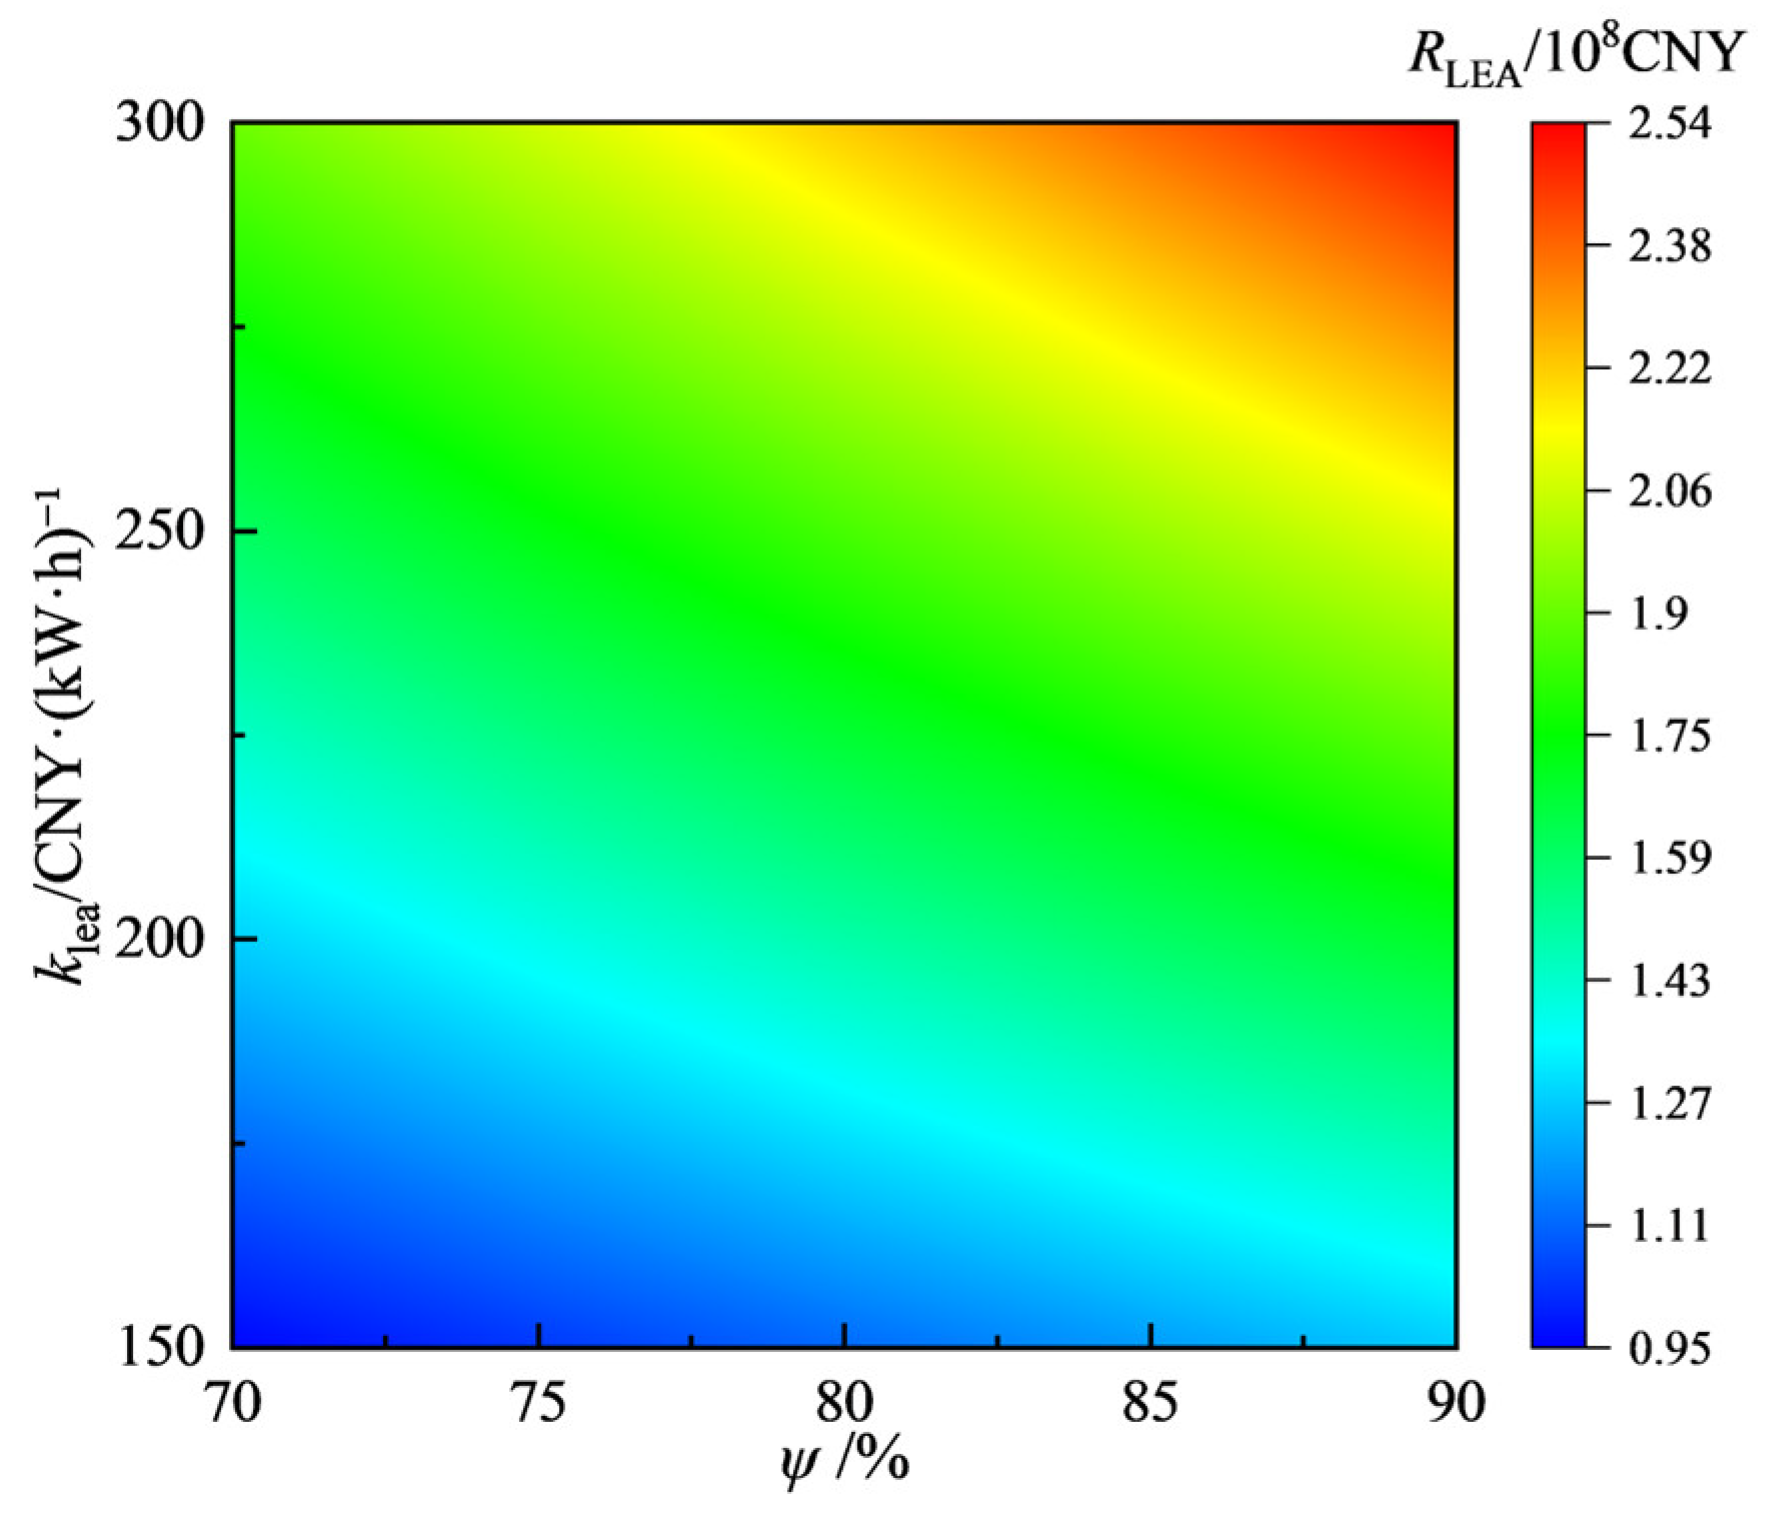
The impact of the leasing ratio and leasing price on leasing revenue is shown in Figure 9. Leasing revenue increased significantly with a higher leasing ratio and leasing price. Analysis reveals that within the range of the 70–90% leasing ratio and the price of 150–300 CNY·(kW·year)−1, when the price was fixed, each 5% increase in the ratio raised revenue from CNY 80 to 160 million. When the ratio was fixed, each increase in price of 30 CNY·(kW·year)−1 could lead to revenue increment between CNY 190 and 250 million. Therefore, reasonably increasing the leasing ratio and optimizing the leasing price are key strategies for enhancing project leasing income, which could provide important strategic guidance for practical project operation.
4.4.2. Impact of Peak–Valley Price Differential and Energy Storage Efficiency on Spot Market Revenue
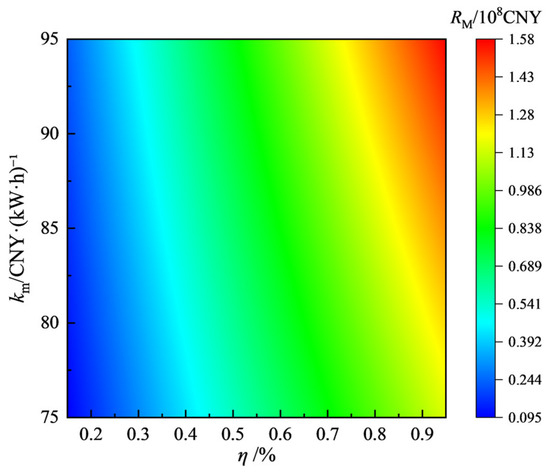
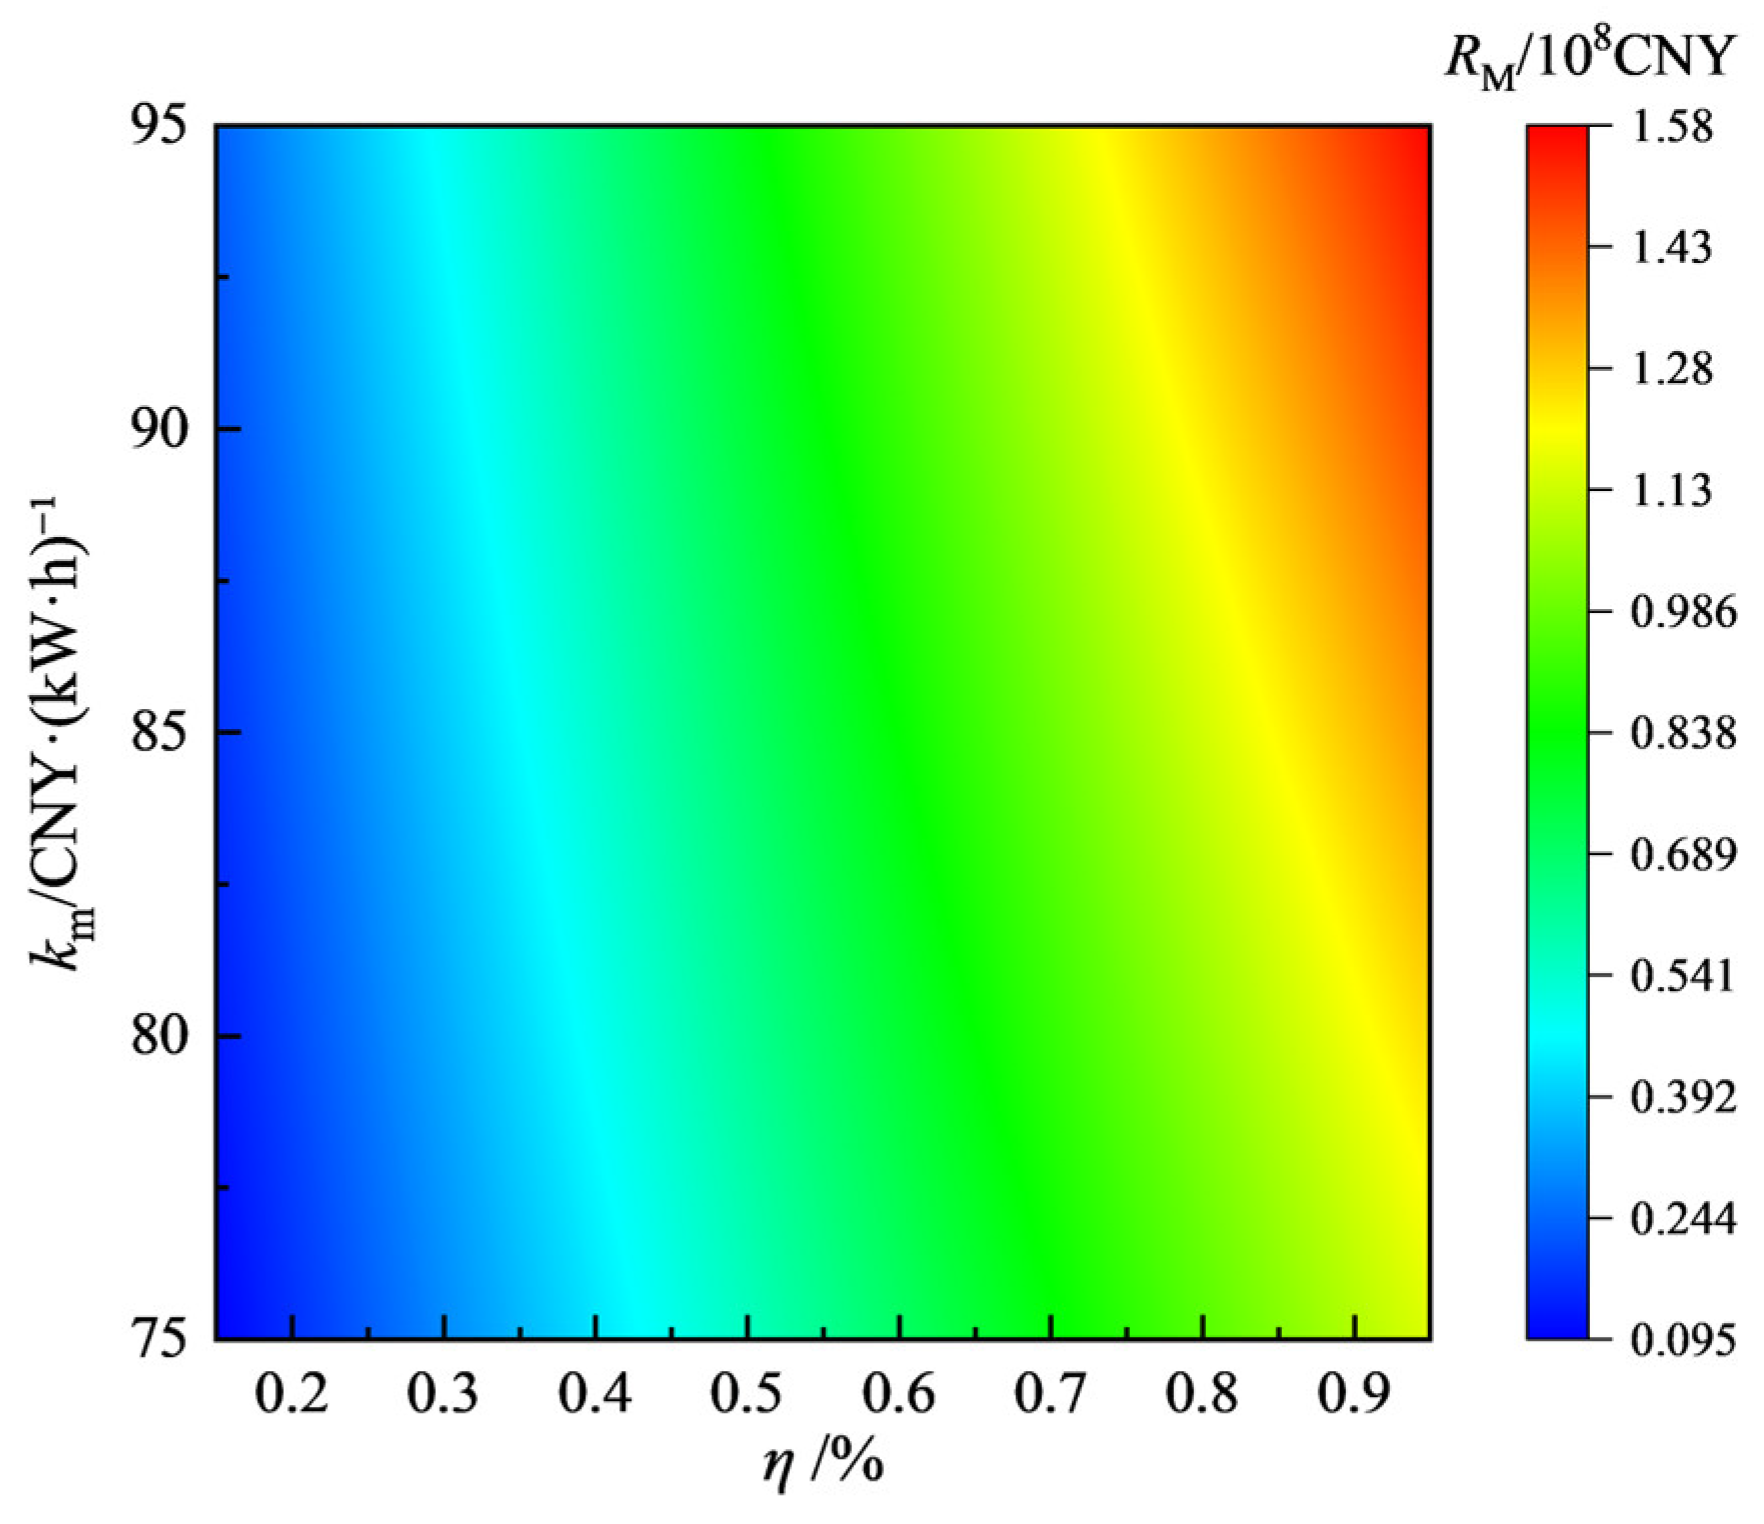
Figure 10 illustrates the impacts of the peak–valley electricity price difference and the conversion efficiency of energy storage systems on the profits in the spot market. The analysis indicates that spot market revenue was positively correlated with both of them. Within the examined ranges of the 0.15–0.95 CNY·(kW·h)−1 price differential and 75–95% efficiency, when the price differential was fixed, each 5% increase in efficiency yielded a revenue increment from CNY 27 to 34 million. When efficiency was fixed, as the price differential increased from 0.15 to 0.95 CNY·(kW·h)−1, the revenue increment varied from CNY 3 to 10 million with each increase in efficiency of 5%. In project operation, leveraging policy advantages related to the peak–valley price differential and improving storage efficiency are the key pathways for enhancing spot market revenue.
4.4.3. Impact of Mileage Compensation and Comprehensive Regulation Performance Metric on Ancillary Frequency Regulation Revenue
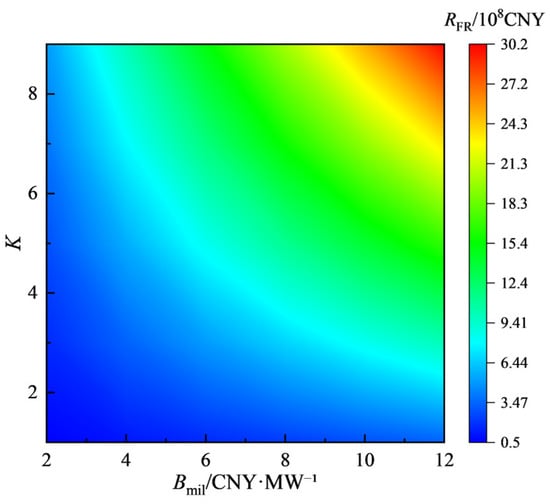
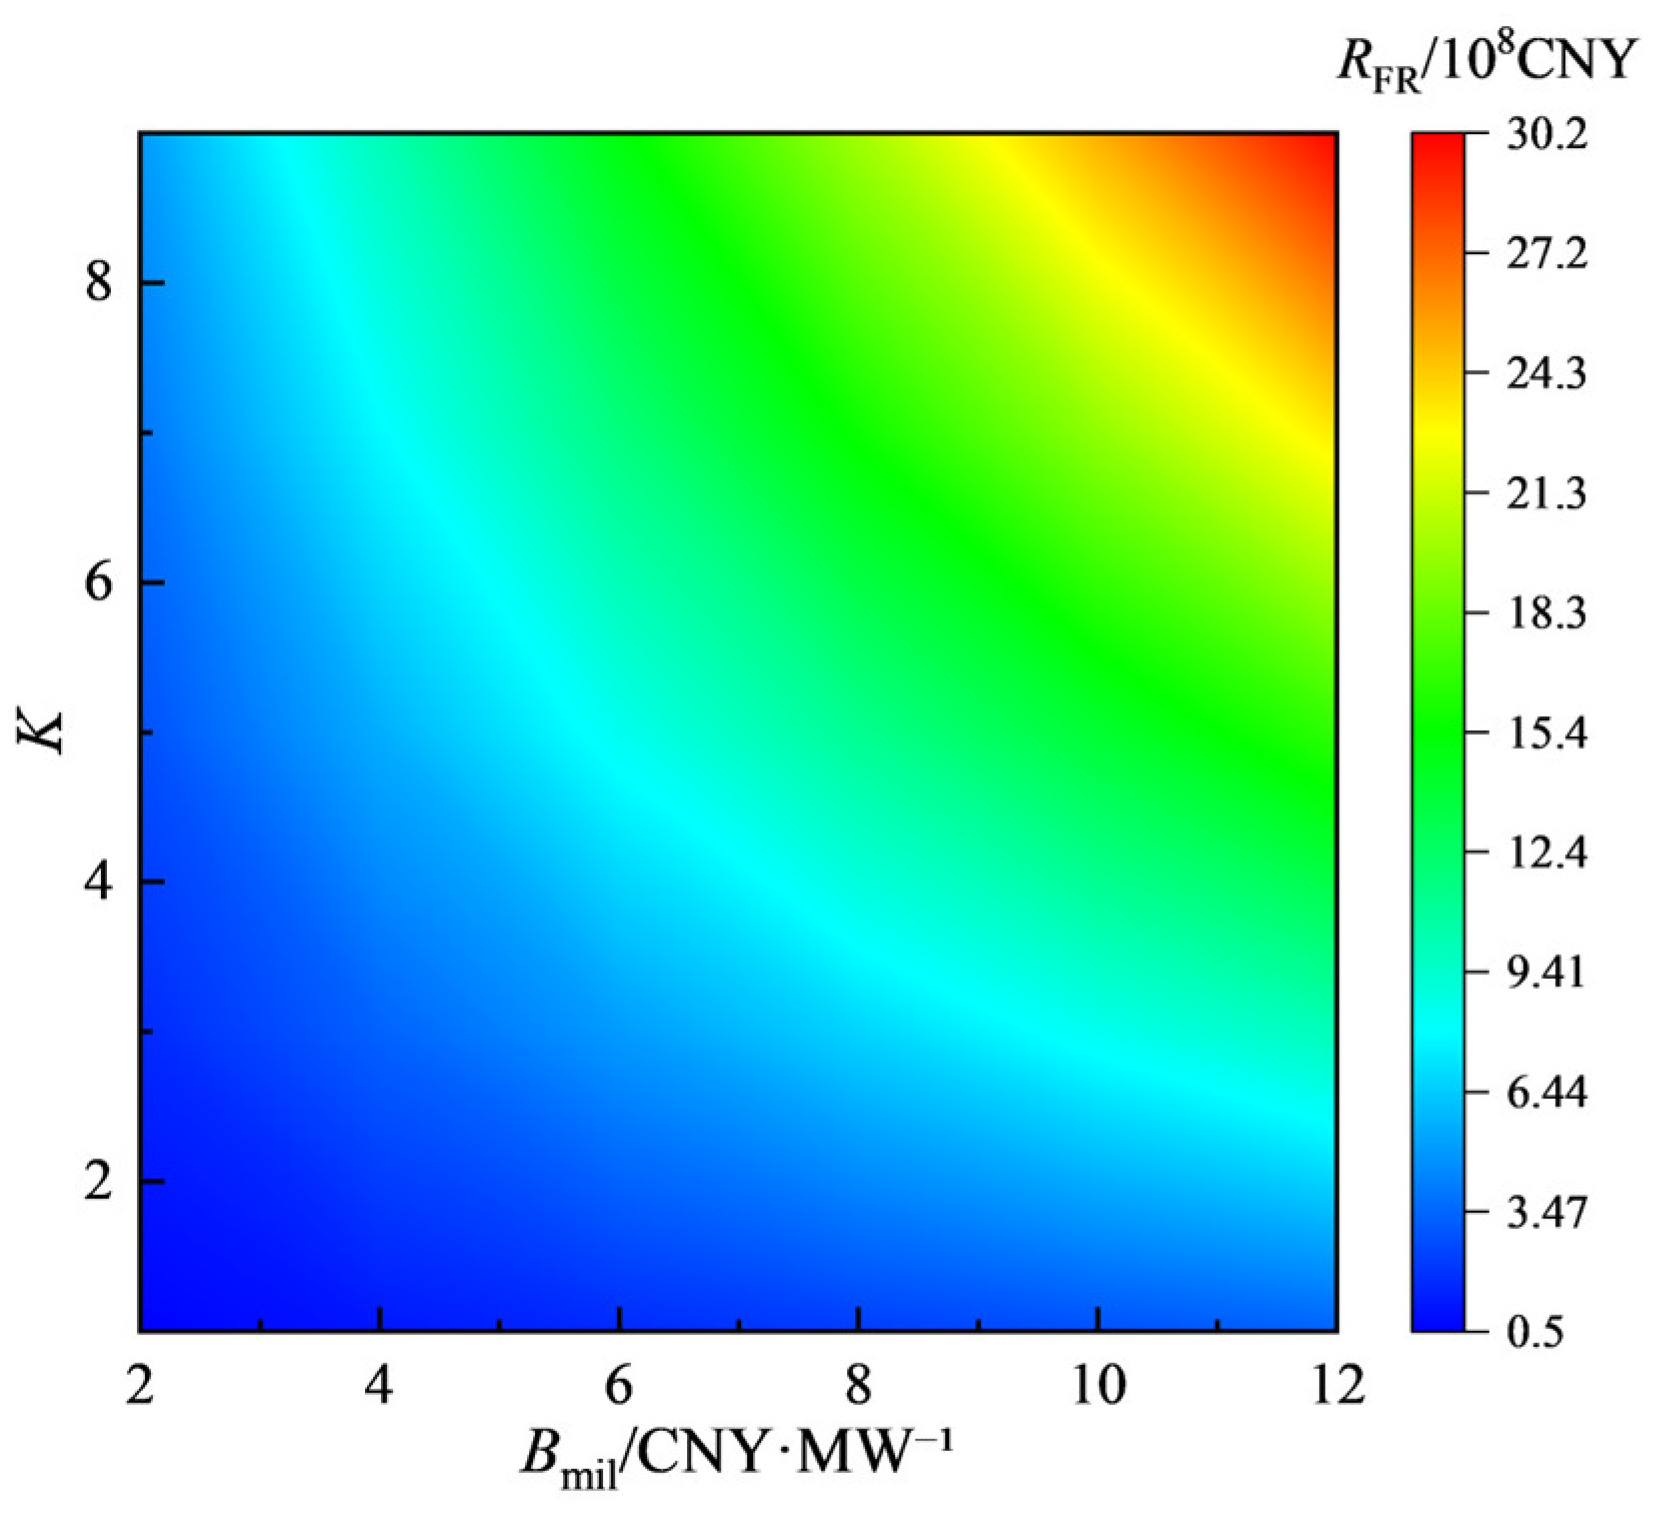
The impact of mileage compensation and the comprehensive regulation performance metric on ancillary frequency regulation revenue is shown in Figure 11. The revenue was positively correlated with both the mileage compensation price (ranging from 2 to 12 CNY·MW−1) and the comprehensive regulation performance metric (ranging from 1 to 9). Analysis shows that when the metric increased from 1 to 9, the revenue increment ranging from CNY 56 to 502 million was achieved with each 2 CNY·MW−1 increase in mileage compensation. As mileage compensation increased from 2 to 12 CNY·MW−1, each 2-unit increase in the performance metric contributed to a revenue increment between CNY 112 and 670 million. In the daily operation process of shared energy storage projects, it is essential to closely monitor policy developments to optimize mileage compensation strategies on the one hand, and improve the comprehensive regulation performance metric on the other hand. Maximizing ancillary frequency regulation revenue requires the coordinated optimization of these two variables.
4.4.4. Impact of Annual Dispatch Count and Peak-Shaving Compensation on Ancillary Peak-Shaving Revenue
The impact of the annual dispatch count and peak-shaving compensation on ancillary peak-shaving revenue is shown in Figure 12. The revenue was positively correlated with both the annual dispatch count (ranging from 250 to 500 times) and the peak-shaving compensation (ranging from 0.2 to 1.0 CNY·(kW·h)−1). Analysis indicates that as the compensation increased from 0.2 to 1.0 CNY·(kW·h)−1, each increase in the annual dispatch count of 50 times led to a revenue increment from CNY 18 to 93 million. When the annual dispatch count rose from 250 to 500, a revenue increment ranging from CNY 93 million to CNY 187 million was obtained for each increase of 0.2 CNY·(kW·h)−1 in compensation. In summary, in the operation of shared energy storage projects, maximizing ancillary peak-shaving revenue requires simultaneous policy alignment and operational optimization. On the one hand, it is necessary to closely monitor policy developments to obtain higher compensation standards. On the other hand, strengthening equipment operation and maintenance management is crucial for increasing the annual dispatch count.
4.5. Limitations
This study has several limitations. First, the P1–P6 comparison is not a time-series dispatch optimization model; rather, it provides standardized revenue-combination scenarios for comparative lifecycle economic evaluation. In particular, P6 is an upper-bound benchmark based on additive revenue stacking and does not explicitly enforce service exclusivity, time-coupled dispatch, or shared-capacity allocation constraints across markets. Second, battery aging is represented through replacement-cost treatment rather than a year-by-year performance degradation trajectory, and revenues are therefore evaluated under a stepwise replacement assumption. Third, the unified parameter set used in Section 4 is intended for cross-scenario comparison and does not reproduce the full heterogeneity of provincial market rules discussed in Section 3.4. These limitations do not affect the comparative purpose of the present study, but they should be considered when interpreting P6 as a theoretical benchmark rather than a directly deployable operating mode.
Although this study establishes a lifecycle revenue assessment framework for shared energy storage, it still simplifies the allocation logic of storage power and energy and does not include a discrete time-step dispatch model. Future work will focus on developing a dispatch framework that can explicitly represent SOC evolution, energy balance, and service interaction during multi-service operation, thereby improving the engineering applicability of the analysis.
5. Conclusions
This study establishes a comparative lifecycle economic framework for evaluating shared energy storage under multiple revenue combinations. Based on regional case analysis, technology comparison, and parameter sensitivity analysis, the main findings can be summarized as follows:
- Among the revenue-combination scenarios that are more consistent with currently observed operational frameworks, P3 yields the highest NPV for both LFP and VRF batteries. By contrast, P6 should be interpreted as a theoretical upper-bound benchmark under additive revenue stacking rather than as an immediately realizable operating strategy. Therefore, the role of P6 in this study is to reveal the potential economic headroom associated with broader multi-service participation, not to demonstrate a currently achievable enhancement pathway. Realizing such value in practice would require future dispatch optimization models that explicitly incorporate service exclusivity, temporal coupling, and capacity-sharing constraints.
- Auxiliary frequency regulation, capacity reserve and rent will increase with higher rated power. Spot-market and ancillary peak-shaving revenues increase with higher rated energy capacity. When evaluating energy storage projects, revenue should exceed relevant costs. Therefore, to achieve the maximum economic benefit of the project, a balance needs to be sought between optimizing capacity configuration and cost control.
- The parameter analysis indicates that revenue streams are highly sensitive to market and policy variables, such as peak–valley price differences for spot trading and mileage compensation for frequency regulation. Consequently, adopting a collaborative strategy that combines policy adaptation with operational optimization is crucial. This approach systematically improves economic feasibility by leveraging multi-resource synergy and diversified service participation, providing a viable path for maximizing life-cycle returns.
Supplementary Materials
The following supporting information can be downloaded at: https://www.mdpi.com/article/10.3390/en19092177/s1.
Author Contributions
Conceptualization, Y.L.; Investigation, W.T.; Methodology, Q.X.; Validation, F.Z.; Writing—original draft, J.W. All authors have read and agreed to the published version of the manuscript.
Funding
This research was supported by the Science and Technology Project of State Grid Henan Electric Power Company, “Research on Grid-Connection Characteristics Analysis and Cooperative Regulation Technology for 100MW-Class Compressed Air Energy Storage Power Station” (Project No. 521770250002, Contract No. SGHAXY00XTJS2500487).
Data Availability Statement
The raw data supporting the conclusions of this article will be made available by the authors on request.
Conflicts of Interest
Authors Yang Liu and Weijun Teng were employed by the company, State Grid Henan Electric Power Research Institute. Qishan Xu and Feng Zhang were employed by State Grid Henan Xinyang Power Supply Company. Jinggang Wang was employed by the company, State Grid Henan Electric Power Company. The authors declare that this study received funding from State Grid Henan Electric Power Company. The funder was not involved in the study design, collection, analysis, interpretation of data, the writing of this article, or the decision to submit it for publication.
References
- Masson-Delmotte, V.; Zhai, P.; Pörtner, H.; Roberts, D.; Skea, J.; Shukla, P.; Pirani, A.; Moufouma-Okia, W.; Péan, C.; Pidcock, R.; et al. Global Warming of 1.5 °C: An IPCC Special Report on the Impacts of Global Warming of 1.5 °C Above Pre-Industrial Levels and Related Global Greenhouse Gas Emission Pathways, in the Context of Strengthening the Global Response to the Threat of Climate Change, Sustainable Development, and Efforts to Eradicate Poverty; Intergovernmental Panel on Climate Change (IPCC): Geneva, Switzerland, 2018. [Google Scholar]
- Huang, S.; Ye, Z.; Huang, Y. Capacity tariff mechanism design for grid-side energy storage in China: A Stackelberg game approach. Util. Policy 2025, 95, 101963. [Google Scholar] [CrossRef] [Scilit]
- Liu, X.; Wu, Y.; Li, H.; Zhou, H. Design and development of pilot plant applied to wind and light abandonment power conversion: Electromagnetic heating of solid particles and steam generator. J. Clean. Prod. 2024, 470, 143313. [Google Scholar] [CrossRef] [Scilit]
- Sudhoff, R.; Schreck, S.; Thiem, S.; Niessen, S. Implications of forecast uncertainty on the optimal operation of renewable energy communities. In Proceedings of the 27th International Conference on Electricity Distribution (CIRED 2023), Rome, Italy, 12–15 June 2023; IET: Stevenage, UK, 2023; pp. 1275–1279. [Google Scholar]
- Meng, H.; Jia, H.; Xu, T.; Wei, W.; Wu, Y.; Liang, L.; Cai, S.; Liu, Z.; Wang, R.; Li, M. Optimal configuration of cooperative stationary and mobile energy storage considering ambient temperature: A case for Winter Olympic Game. Appl. Energy 2022, 325, 119889. [Google Scholar] [CrossRef] [Scilit]
- Fang, X.; Guo, H.; Zhang, X.; Wang, X.; Chen, Q. An efficient and incentive-compatible market design for energy storage participation. Appl. Energy 2022, 311, 118731. [Google Scholar] [CrossRef] [Scilit]
- Han, X.; Li, Y.; Nie, L.; Huang, X.; Deng, Y.; Yan, J.; Kourkoumpas, D.-S.; Karellas, S. Comparative life cycle greenhouse gas emissions assessment of battery energy storage technologies for grid applications. J. Clean. Prod. 2023, 392, 136251. [Google Scholar] [CrossRef] [Scilit]
- Liu, Y.; He, Q.; Shi, X.; Zhang, Q.; An, X. Energy storage in China: Development progress and business model. J. Energy Storage 2023, 72, 108240. [Google Scholar] [CrossRef] [Scilit]
- Kalathil, D.; Wu, C.; Poolla, K.; Varaiya, P. The sharing economy for the electricity storage. IEEE Trans. Smart Grid 2017, 10, 556–567. [Google Scholar] [CrossRef] [Scilit]
- Cui, J.; Zhu, Z.; Qu, G.; Wang, Y.; Li, R. Demand-side shared energy storage pricing strategy based on stackelberg-Nash game. Int. J. Electr. Power Energy Syst. 2025, 164, 110387. [Google Scholar] [CrossRef] [Scilit]
- Yao, Y.; He, Y.; Wu, H.; Bi, R.; Ding, M. Multi-timescale hierarchical dispatch strategy of hybrid energy storage for multiple auxiliary service markets. J. Energy Storage 2025, 105, 114677. [Google Scholar] [CrossRef] [Scilit]
- Li, J.; Yang, Z.; Wu, Z.; Yang, L.; Li, S.; Zhu, Y. Master-slave game-based operation optimization of renewable energy community shared energy storage under the frequency regulation auxiliary service market environment. J. Energy Storage 2024, 103, 114499. [Google Scholar]
- Dai, R.; Esmaeilbeigi, R.; Charkhgard, H. The utilization of shared energy storage in energy systems: A comprehensive review. IEEE Trans. Smart Grid 2021, 12, 3163–3174. [Google Scholar] [CrossRef] [Scilit]
- Walker, A.; Kwon, S. Analysis on impact of shared energy storage in residential community: Individual versus shared energy storage. Appl. Energy 2021, 282, 116172. [Google Scholar] [CrossRef] [Scilit]
- Lombardi, P.; Schwabe, F. Sharing economy as a new business model for energy storage systems. Appl. Energy 2017, 188, 485–496. [Google Scholar] [CrossRef] [Scilit]
- Shi, Y.; Xu, B.; Wang, D.; Zhang, B. Using battery storage for peak shaving and frequency regulation: Joint optimization for superlinear gains. IEEE Trans. Power Syst. 2017, 33, 2882–2894. [Google Scholar] [CrossRef] [Scilit]
- Stephan, A.; Battke, B.; Beuse, M.; Clausdeinken, J.; Schmidt, T. Limiting the public cost of stationary battery deployment by combining applications. Nat. Energy 2016, 1, 16079. [Google Scholar] [CrossRef] [Scilit]
- Kong, S.; Wang, Y.; Xie, D. Battery energy scheduling and benefit distribution models under shared energy storage: A mini review. Front. Energy Res. 2023, 11, 1100214. [Google Scholar] [CrossRef] [Scilit]
- Meng, H.; Jia, H.; Xu, T.; Sun, J.; Wang, R.; Wang, J. Trading mechanism of distributed shared energy storage system considering voltage regulation. Appl. Energy 2024, 374, 123904. [Google Scholar] [CrossRef] [Scilit]
- Li, Q.; Xiao, X.; Pu, Y.; Luo, S.; Liu, H.; Chen, W. Hierarchical optimal scheduling method for regional integrated energy systems considering electricity-hydrogen shared energy. Appl. Energy 2023, 349, 121670. [Google Scholar] [CrossRef] [Scilit]
- Li, L.; Cao, X.; Zhang, S. Shared energy storage system for prosumers in a community: Investment decision, economic operation, and benefits allocation under a cost-effective way. J. Energy Storage 2022, 50, 104710. [Google Scholar] [CrossRef] [Scilit]
- Li, L.; Peng, K.; Yang, X.; Liu, K. Coordinated design of multi-stakeholder community energy systems and shared energy storage under uncertain supply and demand: A game theoretical approach. Sustain. Cities Soc. 2024, 100, 105028. [Google Scholar]
- Yan, X.; Gu, C.; Wyman-Pain, H.; Li, F. Capacity share optimization for multiservice energy storage management under portfolio theory. IEEE Trans. Ind. Electron. 2018, 66, 1598–1607. [Google Scholar] [CrossRef] [Scilit]
- Ma, J.; Venkatesh, B. Sizing merchant energy storage for maximum revenues considering net metering and ancillary services. IEEE Access 2023, 12, 2210–2223. [Google Scholar] [CrossRef] [Scilit]
- Ren, J.; Ou, M.; Yu, Z.; Yu, G.; Hu, W.; Sun, Y. SWOT-Based Analysis of Commercial Benefits of Electrochemical Energy Storage. In Proceedings of the 2021 IEEE/IAS Industrial and Commercial Power System Asia (I&CPS Asia), Chengdu, China, 18–21 July 2021; IEEE: New York, NY, USA, 2021; pp. 1423–1428. [Google Scholar]
- Hu, H.; Lu, H.; Zhao, W.; Cao, X.; Fan, X.; Jiang, J. Optimization configuration method for shared energy storage considering economic consumption of new energy. Int. J. Electr. Power Energy Syst. 2025, 172, 111117. [Google Scholar] [CrossRef] [Scilit]
- Chen, X.; Huang, L.; Liu, J.; Song, D.; Yang, S. Peak shaving benefit assessment considering the joint operation of nuclear and battery energy storage power stations: Hainan case study. Energy 2022, 239, 121897. [Google Scholar] [CrossRef] [Scilit]
- Chen, W.; Lu, H.; Wei, Z. Optimal allocation method for MIES-based shared energy storage using cooperative game theory and CSP. J. Renew. Sustain. Energy 2024, 16, 023701. [Google Scholar] [CrossRef] [Scilit]
- Du, X.; Li, X.; Hao, Y.; Chen, L. Sizing of centralized shared energy storage for resilience microgrids with controllable load: A bi-level optimization approach. Front. Energy Res. 2022, 10, 954833. [Google Scholar] [CrossRef] [Scilit]
- Xu, J.; Fu, Z.; Wang, C.; Liu, H. The Trading Strategy of Distributed Energy Storage Participating in Energy and Frequency Modulation Market. In Proceedings of the 2024 7th International Conference on Energy, Electrical and Power Engineering (CEEPE), Yangzhou, China, 26–28 April 2024; IEEE: New York, NY, USA, 2024; pp. 1694–1700. [Google Scholar]
- Wu, N.; Wu, Q.; Ren, H.; Jin, H.; Li, Q. Hierarchical game optimization of independent shared energy storage system considering multiple profits and penalty. Energy 2025, 321, 135448. [Google Scholar] [CrossRef] [Scilit]
- Wu, B.; Yue, Y.; Yue, H.; Ding, J.; Chen, D. Research on Distribution Network Side Shared Energy Storage Business Model under Double Carbon Strategy. E3S Web Conf. 2023, 385, 01026. [Google Scholar] [CrossRef] [Scilit]
- Chi, Y.; Jin, Z.; Zhang, X.; Zhang, Y.; Wu, Y.; Wang, J. Study on the investment and construction models and value assessment of shared energy storage in the context of the new power system. Glob. Energy Interconnect. 2025, 8, 700–718. [Google Scholar] [CrossRef] [Scilit]
- Talihati, B.; Tao, S.; Fu, S.; Zhang, B.; Fan, H.; Li, Q.; Lv, X.; Sun, Y.; Wang, Y. Energy storage sharing in residential communities with controllable loads for enhanced operational efficiency and profitability. Appl. Energy 2024, 373, 123880. [Google Scholar] [CrossRef] [Scilit]
- Li, Y.; Han, X.; Nie, L.; Deng, Y.; Yan, J.; Roumpedakis, T.C.; Kourkoumpas, D.-S.; Karellas, S. Life cycle environmental hotspots analysis of typical electrochemical, mechanical and electrical energy storage technologies for different application scenarios: Case study in China. J. Clean. Prod. 2024, 466, 142862. [Google Scholar] [CrossRef] [Scilit]
- Hemmati, M.; Bayati, N.; Ebel, T. Life cycle assessment and costing of large-scale battery energy storage integration in Lombok’s power grid. Batteries 2024, 10, 295. [Google Scholar] [CrossRef] [Scilit]
- da Silva Lima, L.; Quartier, M.; Buchmayr, A.; Sanjuan-Delmás, D.; Laget, H.; Corbisier, D.; Mertens, J.; Dewulf, J. Life cycle assessment of lithium-ion batteries and vanadium redox flow batteries-based renewable energy storage systems. Sustain. Energy Technol. Assess. 2021, 46, 101286. [Google Scholar] [CrossRef] [Scilit]
- Li, Y.; Wei, M.; Tian, R. Performance analysis of an energy system with multiple combined cooling, heating and power systems considering hybrid shared energy storage. Appl. Therm. Eng. 2023, 233, 121166. [Google Scholar] [CrossRef] [Scilit]
- Zhang, X.; Xiao, Q.; Li, T.; Lu, W.; Mu, Y.; Jia, H.; Qiao, J.; Wang, X.; Pu, T. Operation Optimization Strategy of Multi-Energy Microgrid with Shared Energy Storage Based on Stackelberg Game; Frontier Academic Forum of Electrical Engineering; Springer: Singapore, 2025; pp. 288–296. [Google Scholar]

Disclaimer/Publisher’s Note: The statements, opinions and data contained in all publications are solely those of the individual author(s) and contributor(s) and not of MDPI and/or the editor(s). MDPI and/or the editor(s) disclaim responsibility for any injury to people or property resulting from any ideas, methods, instructions or products referred to in the content. |
© 2026 by the authors. Licensee MDPI, Basel, Switzerland. This article is an open access article distributed under the terms and conditions of the Creative Commons Attribution (CC BY) license.