


Abstract
This study analyzes the economic viability of electric vehicle charging stations (EVCSs) in medium-sized cities with low electric vehicle (EV) adoption. Based on EVCS usage patterns from both Europe and the USA, and validating EV energy consumption with a microscopic model of roads and traffic through the Eclipse SUMO simulator, the analysis provides a comprehensive assessment. Also, level 2 and level 3 (DC fast) charging stations are considered with installation and operation costs. Finally, a photovoltaic (PV) system and governmental subsidies are considered as support. The Pasto city, Colombia, is the case study due to its medium-sized city characteristics in an emerging economy country, where EV penetration is concentrated in the capital and large cities, with a national EV penetration rate of less than 1%. Scenarios are developed with varying annual EV penetration rates and different financial discount rates. The results suggest that, without significant increases in EV adoption, government subsidies, and PV generation, EVCSs are not economically viable in most of the analyzed scenarios. The study concludes that the financial sustainability of these projects is heavily reliant on supportive public policies that incentivize infrastructure deployment, particularly in medium-sized cities.
1. Introduction
Reducing greenhouse gas emissions and facing climate change requires a shift to electric vehicles (EVs). In the transportation sector, which has historically been one of the biggest producers of carbon emissions, EVs have shown to be a feasible alternative for reducing the negative environmental effects of fossil fuels. The availability, use, and financial viability of electric vehicle charging stations (EVCSs) are the major obstacles to the broad adoption of EVs [1,2].
The availability, use, and financial viability of EVCS are the major obstacles to the broad adoption of EVs [3,4]. Beyond the initial purchase barrier, recent evidence suggests that charging inconvenience is a decisive factor in long-term market sustainability. Inadequate infrastructure and dissatisfaction with the public charging experience can significantly undermine continued ownership and negatively influence repurchase decisions [3]. In some markets, a lack of reliable charging has even led early adopters to discontinue EV use, reverting to conventional vehicles [4]. Consequently, the development of a robust and financially viable EVCS network is essential not only to attract first-time buyers but also to ensure the permanent transition to electric mobility by securing user satisfaction and long-term brand loyalty.
In medium-sized cities with emerging economies, where EV adoption is still low and investments in charging infrastructure are not economically attractive without subsidies or supportive policies, these issues are very significant [5]. A common legislative approach to boost the supply of EVCS is the provision of subsidies for purchase and installation. However, there is a shortage of studies assessing if these subsidies promote the deployment of EVCS [6].
In emerging economies with constrained public budgets, the strategic allocation of subsidies faces a fundamental trade-off. While incentives can be directed toward reducing the high purchase cost of EVs to stimulate demand, recent literature highlights the importance of balancing these with investments in recharging infrastructure to overcome ’range anxiety’ and ensure long-term market sustainability [7,8]. In the specific context of non-producing nations, where EV technology is primarily imported, this debate shifts from industrial production support to a choice between subsidizing vehicle acquisition versus infrastructure deployment. This research focuses on the latter, arguing that characterizing the financial viability of EVCS is a prerequisite for any efficient subsidy allocation strategy, as infrastructure serves as the backbone for indirect network effects that stabilize the EV market.
For instance, a Bruneian study made clear that significant initial subsidies and competitive pricing structures are critical to the economic viability of EVCS. It has been demonstrated that a 40% acquisition cost subsidy combined with preferential power rates greatly increases economic feasibility and promotes EV adoption on a wide scale [9].
One way to lower operating costs and control the fluctuation of energy demand at industrialized nations is to integrate distributed energy resources like photovoltaic panels, which will improve the sustainability of EVCS [10]. Utilizing plentiful and affordable sources like solar and wind energy, renewable energy-based EVCSs have also surfaced as a viable way to reduce grid strain [11].
Some studies analyze EVCS using microscopic traffic simulations. For example, high-performance EVCSs along highways have been found profitable even at low demand, though grid congestion becomes a concern with increased EV adoption [12]. Urban traffic flow analyses, incorporating road topology data from OpenStreetMap and using algorithms like the Hungarian method and the multi-commodity flow problem, have demonstrated their utility in optimizing the sizing and location of EVCS in smart cities [13]. However, a notable gap remains in the literature: the use of microscopic traffic simulations as a tool for validating energy consumption patterns for the purpose of a comprehensive economic feasibility analysis of EVCS projects in low-penetration contexts.
In summary, the transition to EVs is a critical step towards mitigating climate change and decarbonizing the transportation sector. However, widespread EV adoption is heavily dependent on the deployment of a robust charging infrastructure. In emerging economies and medium-sized cities, this presents significant challenges due to low EV penetration and the high initial investment required for EVCS. While prior studies have explored subsidies, renewable energy integration, and optimization methods for EVCS placement, no research has systematically combined microscopic traffic simulations with economic feasibility assessments.
To address this research gap, the present study focuses on two research questions:
- What is the economic viability of different EVCS business models in a medium-sized city with low EV adoption, considering subsidies and PV energy integration?
- How do variations in annual EV penetration rates and financial discount rates influence the long-term profitability and payback period of these projects?
This paper contributes to both academic research and practical application, as follows:
- Pioneering Methodology: It presents a novel methodology that integrates microscopic traffic simulation (Eclipse SUMO) with economic analysis to model realistic EV energy consumption and assess the financial feasibility of EVCS.
- Contextual Analysis: It provides a comprehensive case study for a medium-sized city in an emerging economy (Pasto, Colombia), highlighting the critical role of public policies and renewable energy in a low-adoption context.
- Financial Scenarios: It evaluates the sensitivity of EVCS business cases to key external factors, offering valuable insights for policymakers and potential investors in similar markets.
2. Materials and Methods
This study evaluates the feasibility of 14 business cases for EVCS in Pasto, Colombia, using simulations from Eclipse SUMO (1.19.0) and Python (3.11). It incorporates energy consumption modeling, PV energy generation analysis, and cash flow calculations, considering factors such as subsidies, tax exemptions, and renewable energy integration. Economic performance metrics like Net Present Value (NPV) and payback period are assessed under different scenarios, with sensitivity analyses for demand growth and discount rates. Additionally, the study integrates user behavior insights and emphasizes the role of incentives and renewable energy in optimizing EVCS operations.
2.1. Software and Libraries
To obtain the necessary information to carry out an objective comparison, we propose to perform simulations using Eclipse SUMO and Python. Eclipse Simulation of Urban Mobility (Eclipse SUMO™) is a free and open-source traffic simulation toolkit. SUMO allows modeling and analyzing intermodal traffic systems, covering road vehicles, public transport, freight logistics, and pedestrians. SUMO includes various support tools that handle tasks such as route search, visualization, network import, and emissions estimation.
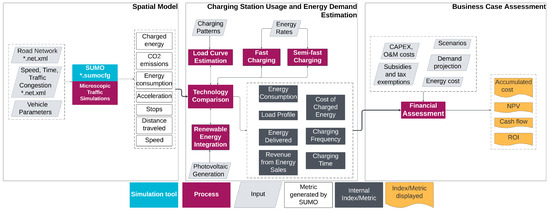
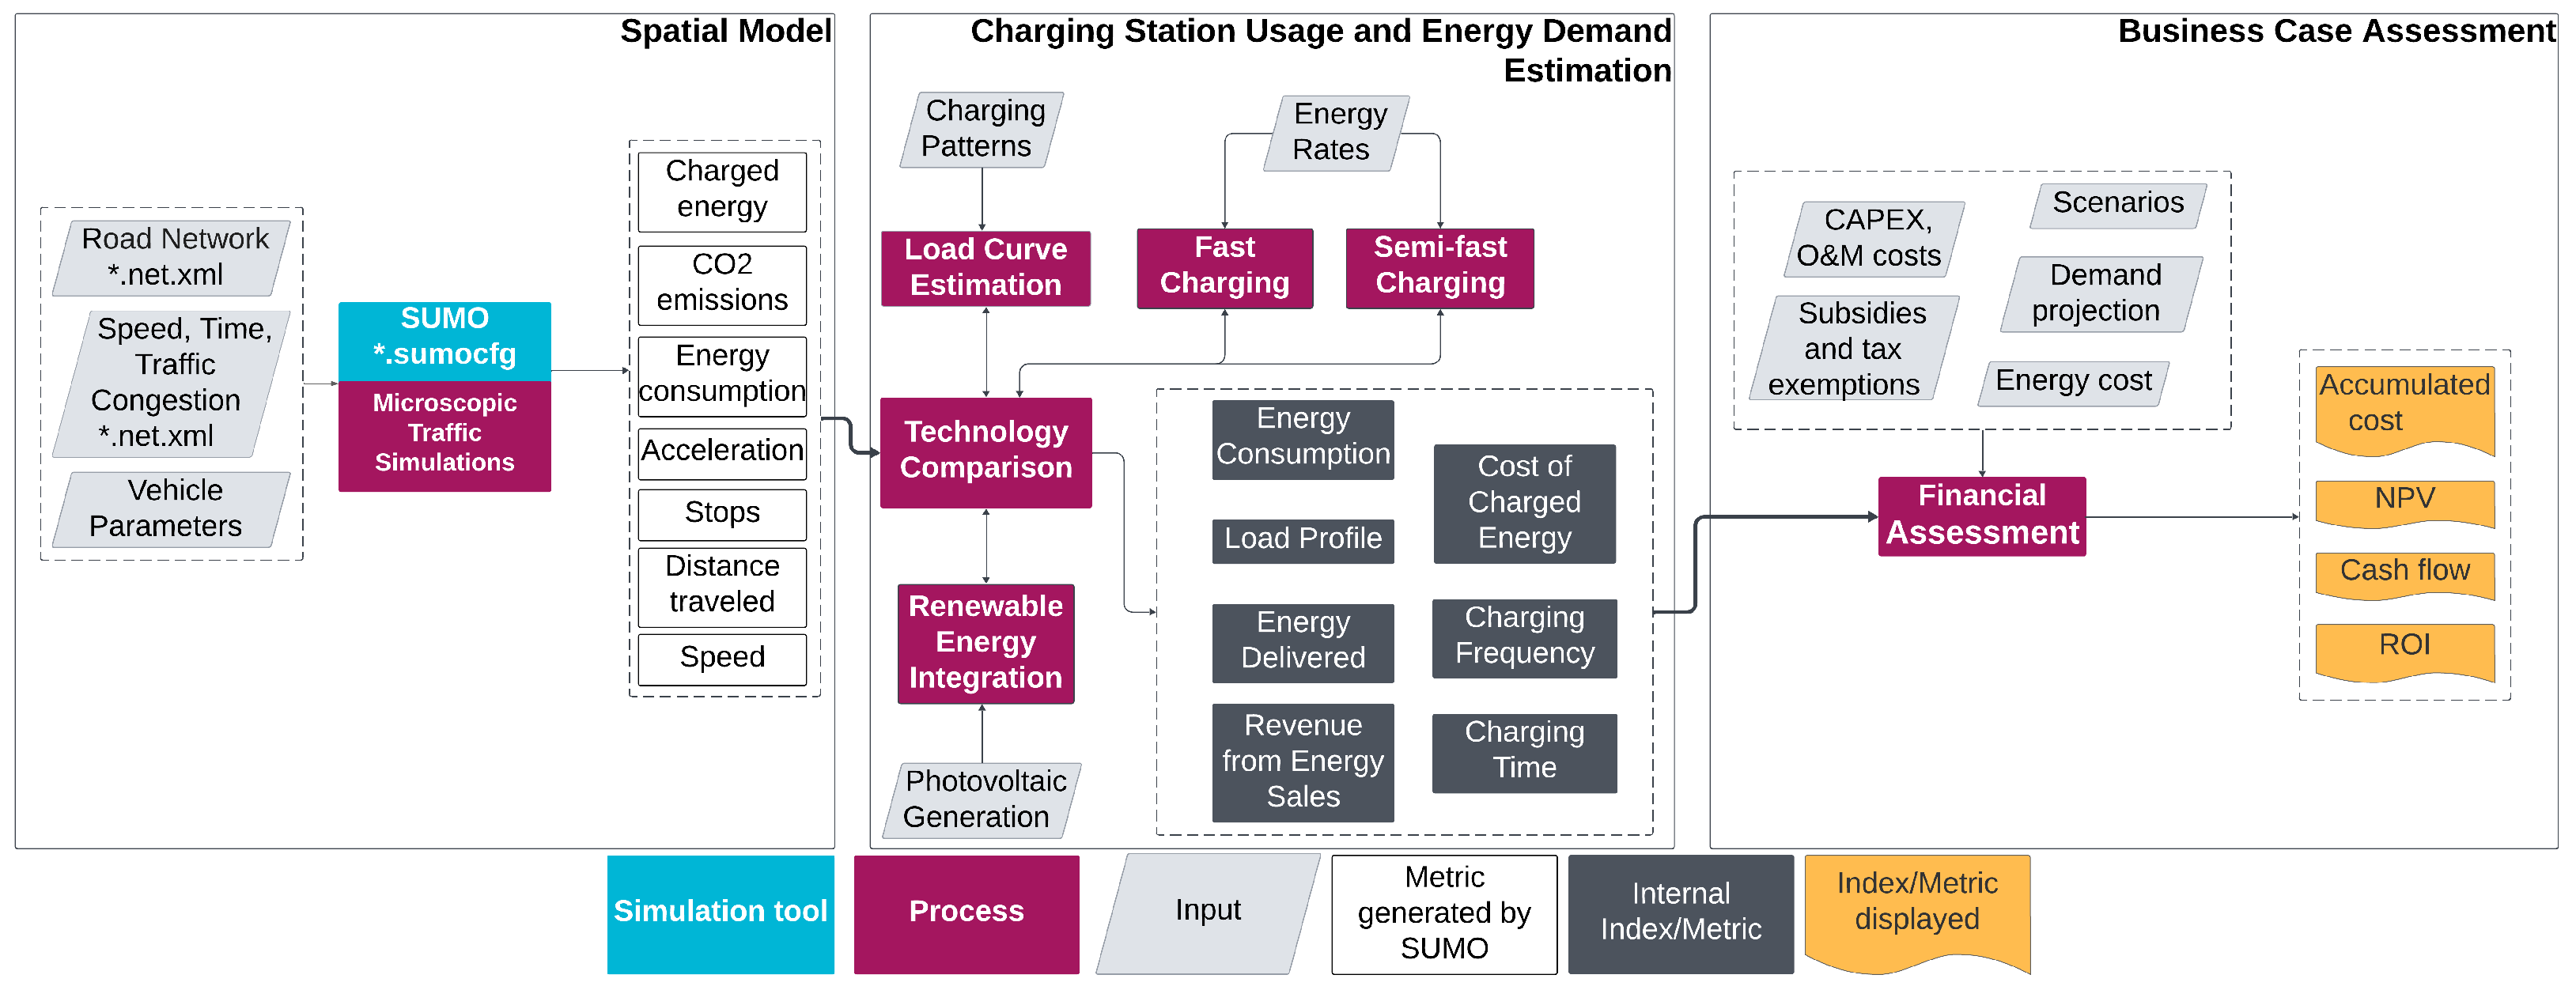
Figure 1 presents the scheme for performing the simulations. Input information such as road corridors, speed limits, travel times, and congestion levels is sent to SUMO to simulate the routes and obtain the traveled distances and energy consumption. These results are then transmitted to a Python application for processing and assessment. To obtain these results, SUMO uses the MMP Electric Vehicle Emission Model (MMPEVEM). This emission model considers the components of the powertrain individually to accurately compute power consumption in every simulation step. This includes the transmission (i.e., a single reduction gear and a differential) with constant efficiency, the electric motor (as well as its inverter) whose power losses are read/interpolated from a characteristic map, a constant power consumer to represent auxiliary devices such as air conditioning, and the battery [14].
Figure 1.
Simulation and assessment process.
Specifically, the model’s input parameters were sourced from various publicly available and official documents to ensure the validity and replicability of the results. The detailed road network, including all segments, intersections, and topology, was extracted from OpenStreetMap (OSM), enabling a high-fidelity representation of the city’s street layout. The speed limits assigned to each road type were established in strict accordance with the Colombian national traffic legislation (Ley 769 de 2002) [15], ensuring that the vehicle behavior simulated was consistent with local regulations.
Furthermore, to model a realistic traffic environment, the travel times and congestion levels were derived from the official “Plan Maestro de Movilidad y Espacio Público para el Municipio de Pasto, Nariño” [16], a public document providing a comprehensive analysis of the city’s mobility patterns.
On the other hand, some business cases consider PV systems as auxiliary power generators. To determine how much energy a photovoltaic system can provide, the pvlib Python library was used to calculate the energy generated in a single day. This library is a community-developed toolbox that offers a set of functions and classes for simulating the performance of photovoltaic energy systems and performing related tasks [17]. Input data included irradiance and temperature measurements taken in the study city between 13 March and 19 March 2024.
Subsequently, the data provided by SUMO and pvlib were incorporated into a Python application. This application conducted an economic evaluation by calculating cash flows and the Net Present Value (NPV) over a 20-year period. A sensitivity analysis was carried out with an emphasis on demand increase and discount rate. These aspects help define scenarios in the context of the case study. While they are not controllable variables for investors interested in EVCS, they significantly influence the business case’s viability.
2.2. Proposed Business Cases
This study analyzed 14 EVCS business cases, including Level 2 and Level 3 stations, photovoltaic energy generation, subsidies, tax exemptions, and charging rates. The suggested business cases are described in depth in Table 1. The evaluation begins with a baseline scenario that considers purchasing and installing charging stations without any tax incentives. From this base case, additional scenarios incorporate tax-free, subsidies, and support for energy generation through PV systems.
Table 1.
Description of the business cases.
The economic analysis incorporates a subsidy that reduces the Capital Expenditure (CAPEX) associated with the purchase and installation of EVCS by 80%. This percentage is grounded in international benchmarks, such as the NYSERDA ‘Charge Ready NY’ and the ‘CALeVIP’ programs in the United States, which provide rebates covering between 50% and 70% of initial costs [18,19]. Similarly, Spain’s ‘Moves III’ Program offers subsidies reaching up to 80% [20]. Consequently, the 80% threshold is adopted as a ‘maximum incentive scenario’ to establish an upper bound for the feasibility analysis, representing the most favorable policy environment possible for infrastructure deployment.
Finally, a scenario is evaluated where the charging rate per kWh at Level 3 (DC fast) stations is doubled relative to Level 2. This pricing strategy aligns with established schemes in the United States [21] and is technically justified by the significantly higher Operational Expenditure (OPEX) inherent to high-power infrastructure. Specifically, grid operators often impose substantial demand charges and contracted power capacity fees to manage the high-intensity loads required by Level 3 chargers. From a consumer perspective, this premium reflects the ‘value of time’ and the convenience of rapid energy recovery for users in transit.
2.3. Economic Analysis Methodology
To quantitatively illustrate some outcomes for the business cases, some economic metrics are presented and compared. Initially, yearly cash flows were computed as follows:
where the equipment purchased costs () and installation costs () are incurred in the initial year (). Energy income () results from the energy exported to the grid by the PV system after charging the EV batteries. Subsidies () are also received in the initial year (). Charging income () mainly depends on the energy demand for battery recharging. The maintenance costs for the EVCS () and the PV system () are incurred in each subsequent period (t).
The income from the sale of excess energy to the energy market and income from charging EV is calculated using Equations (2) and (3). represents the excess PV energy calculated with Equation (4), where denotes the average daily energy generated by the PV system.
Energy market income is zero () for business cases without a PV system, while income from EV charging depends solely on the energy demand of EV batteries () multiplied by the charging rate (). These revenues are calculated daily and then multiplied by 365 to obtain annual income, if the energy market rate () remains constant throughout the year. Both and are adjusted annually to account for inflation, which has been approximately 10% in Colombia over the past two years [22].
Finally, summary metrics are NPV, payback period, and a weighting that combines them:
where different discount rates () are considered to generate various scenarios to a sensitivity analysis. Additionally, represents the lifespan of the charging system. W is a weighted result that assigns greater importance to the investment payback period and less weight to the final NPV. and are the normalized NPV and payback period, respectively, calculated with Equation (6).
The cost model described in Table 2 below was used for economic evaluation.
Table 2.
Cost model for economic analysis.
2.4. EVCS Usage Patterns
Due to user behavior heterogeneity, data fragmentation across operators, and privacy regulations, it can be difficult to identify usage patterns at EVCS. Additionally, it might be difficult to predict possible consumption trends in cities with low EV uptake, which adds a great deal of uncertainty to decisions regarding EVCS placement in these areas. However, these difficulties can be addressed with the use of Eclipse SUMO and data published in scientific journals.
Studies like the one by [27] provide valuable insights into the behavior of EV users and EVCS usage patterns in high EV penetration contexts. In this case, the study provides a typology of charging behavior and EV user types based on 4.9 million charging transactions from January 2017 to March 2019, and 27,000 users at 7079 public Level 2 charging points across the four largest cities and metropolitan areas in the Netherlands. The study identified 13 clusters that group similar patterns or behaviors in EVCS usage; of these, 4 clusters are not related to charging at workplaces or homes. The 4 selected clusters are characterized by daytime charging, typically at different charging points, with short connection durations, and in several cases, with more than 2 days between charges. On average, the energy demanded per charge is 10 kWh.
2.5. Context of Case Study
The city of Pasto is located at the southwest of Colombia and has an area of 1181 km2 and approximately 392,930 inhabitants. It is a border city that is growing quickly and has an expanding economy. Because of the size of the city, auto trips are usually short and don’t take more than an hour. However, autos may use more gasoline or energy due to Pasto’s topography characteristics [28].
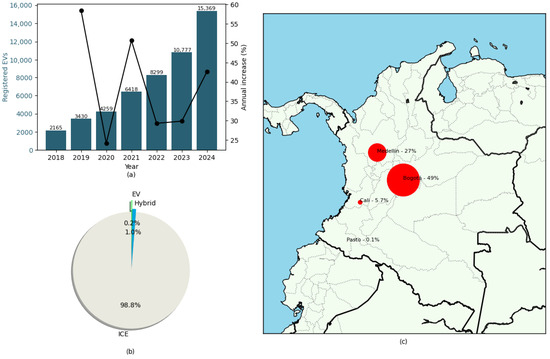
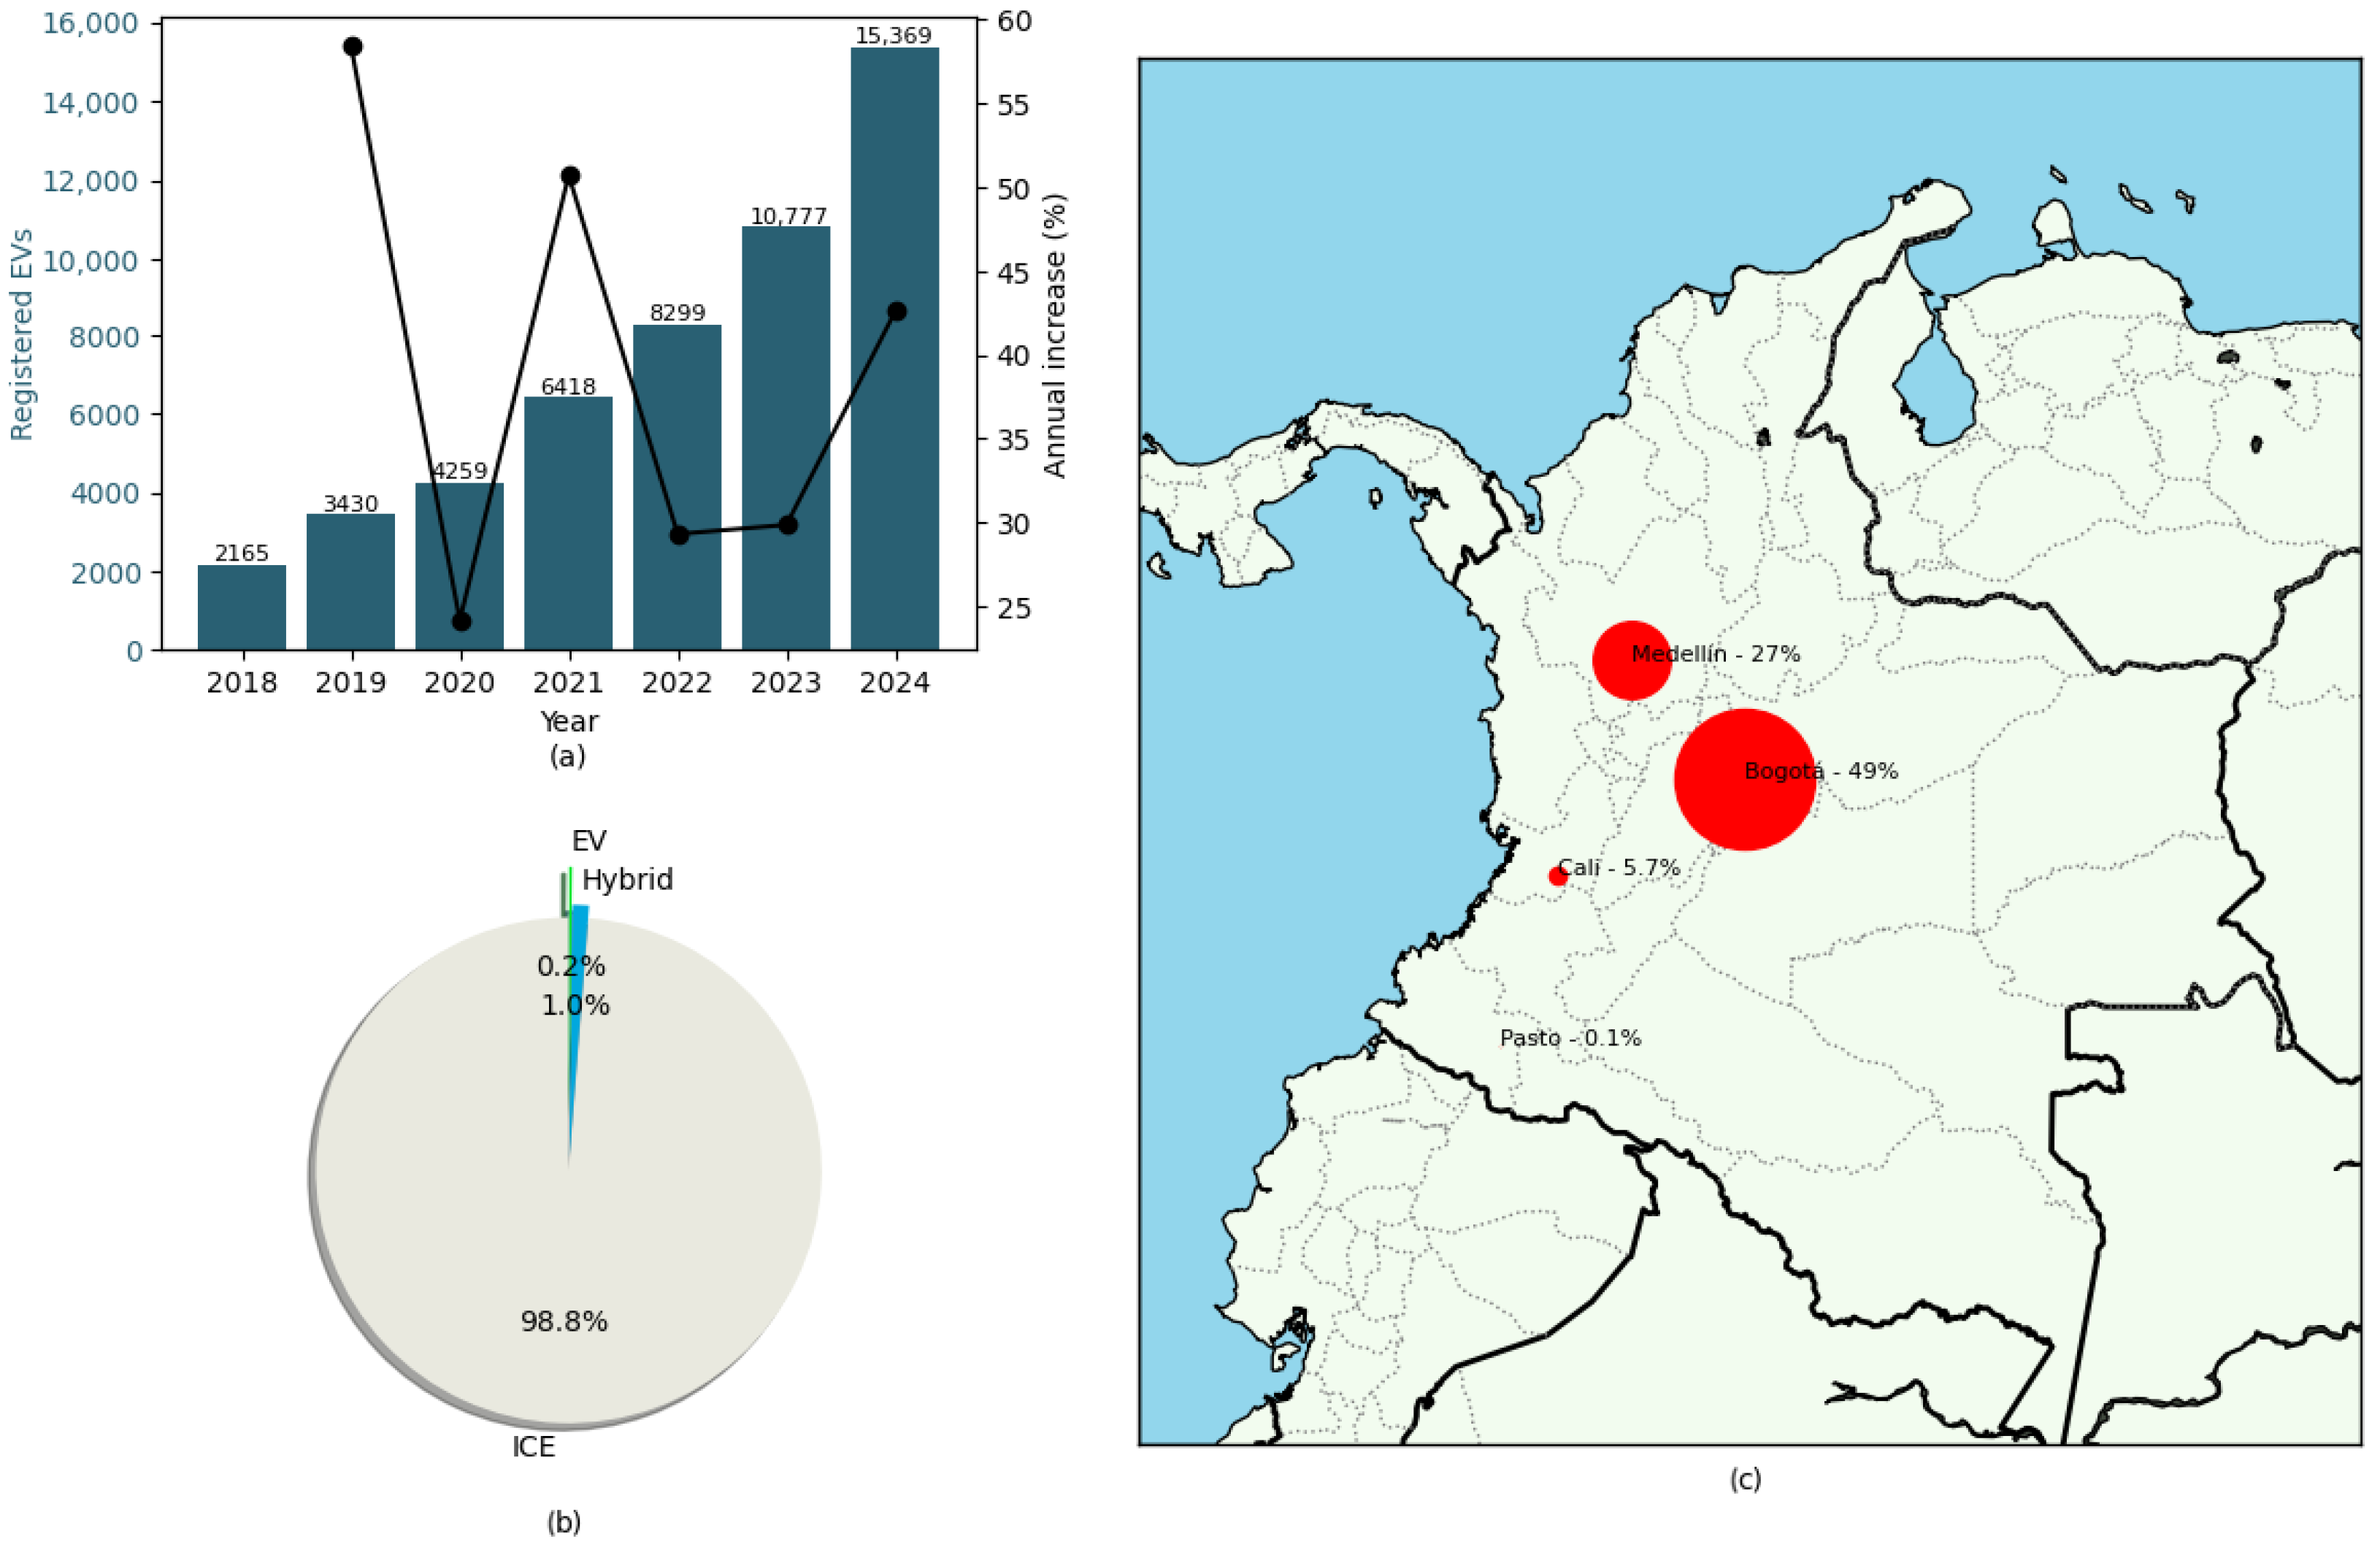
Figure 2 summarizes the current situation of the case study. In Colombia, the adoption of EVs is still low; by the end of 2024, approximately 15,369 EVs had been registered in the country. Since 2018, there has been sustained growth in the number of EVs, with increases ranging from 24.17% to 58.43%, see Figure 2a. As shown in Figure 2b, approximately 0.2% of the total vehicles are EV, 1% are hybrid, and 98.8% are still combustion powered. On the other hand, when analyzing only the 15,369 EVs, Figure 2c shows that the majority are concentrated in Bogotá, with 49%, followed by Medellín with 27%. Other cities, such as Cali, have lower percentages, in the range of 5–6%. Finally, cities like Pasto have minimal numbers, around 0.1% [29].
Figure 2.
Actual situation of EV in the case study. (a) Increase of EVs in Colombia; (b) Distribution of EVs, Hybrid and ICE in Colombia; (c) Colombian Map with EVs proportions.
Approximately 40% of the Colombian population resides in intermediate cities—defined as urban centers with populations between 100,000 and 1,000,000 inhabitants. These cities are characterized by concentrated manufacturing sectors or tertiary services and play a strategic role as hubs interconnecting rural areas and small towns with major metropolitan areas and global markets [30]. Furthermore, numerous cities across the Andean region share topographic and demographic characteristics similar to those of Pasto. While this research focuses on the Colombian context due to data availability, the methodology presented herein is highly transferable to other medium-sized Andean cities facing similar geographic and economic challenges. This underscores the relevance of the study as a scalable framework for assessing EVCS feasibility in emerging Andean urban environments.
3. Results
The results of this study provide valuable insights into the performance and economic viability of Level 2 and Level 3 EVCS supported by PV energy generation under varying scenarios. Simulations and analyses were conducted to evaluate the energy production potential of PV systems, the utilization patterns of charging stations, and the financial outcomes of different business cases. Sensitivity analyses considered a range of demand growth and discount rates, highlighting the influence of external factors such as EV penetration and financial incentives on the feasibility of charging infrastructure investments. These findings emphasize the importance of renewable energy integration and supportive policies to enhance the sustainability and profitability of EV charging stations in diverse scenarios.
3.1. PV System
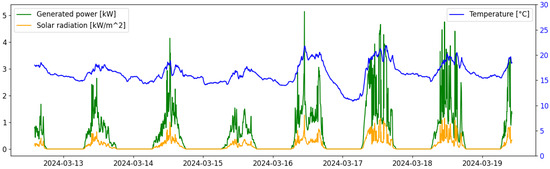
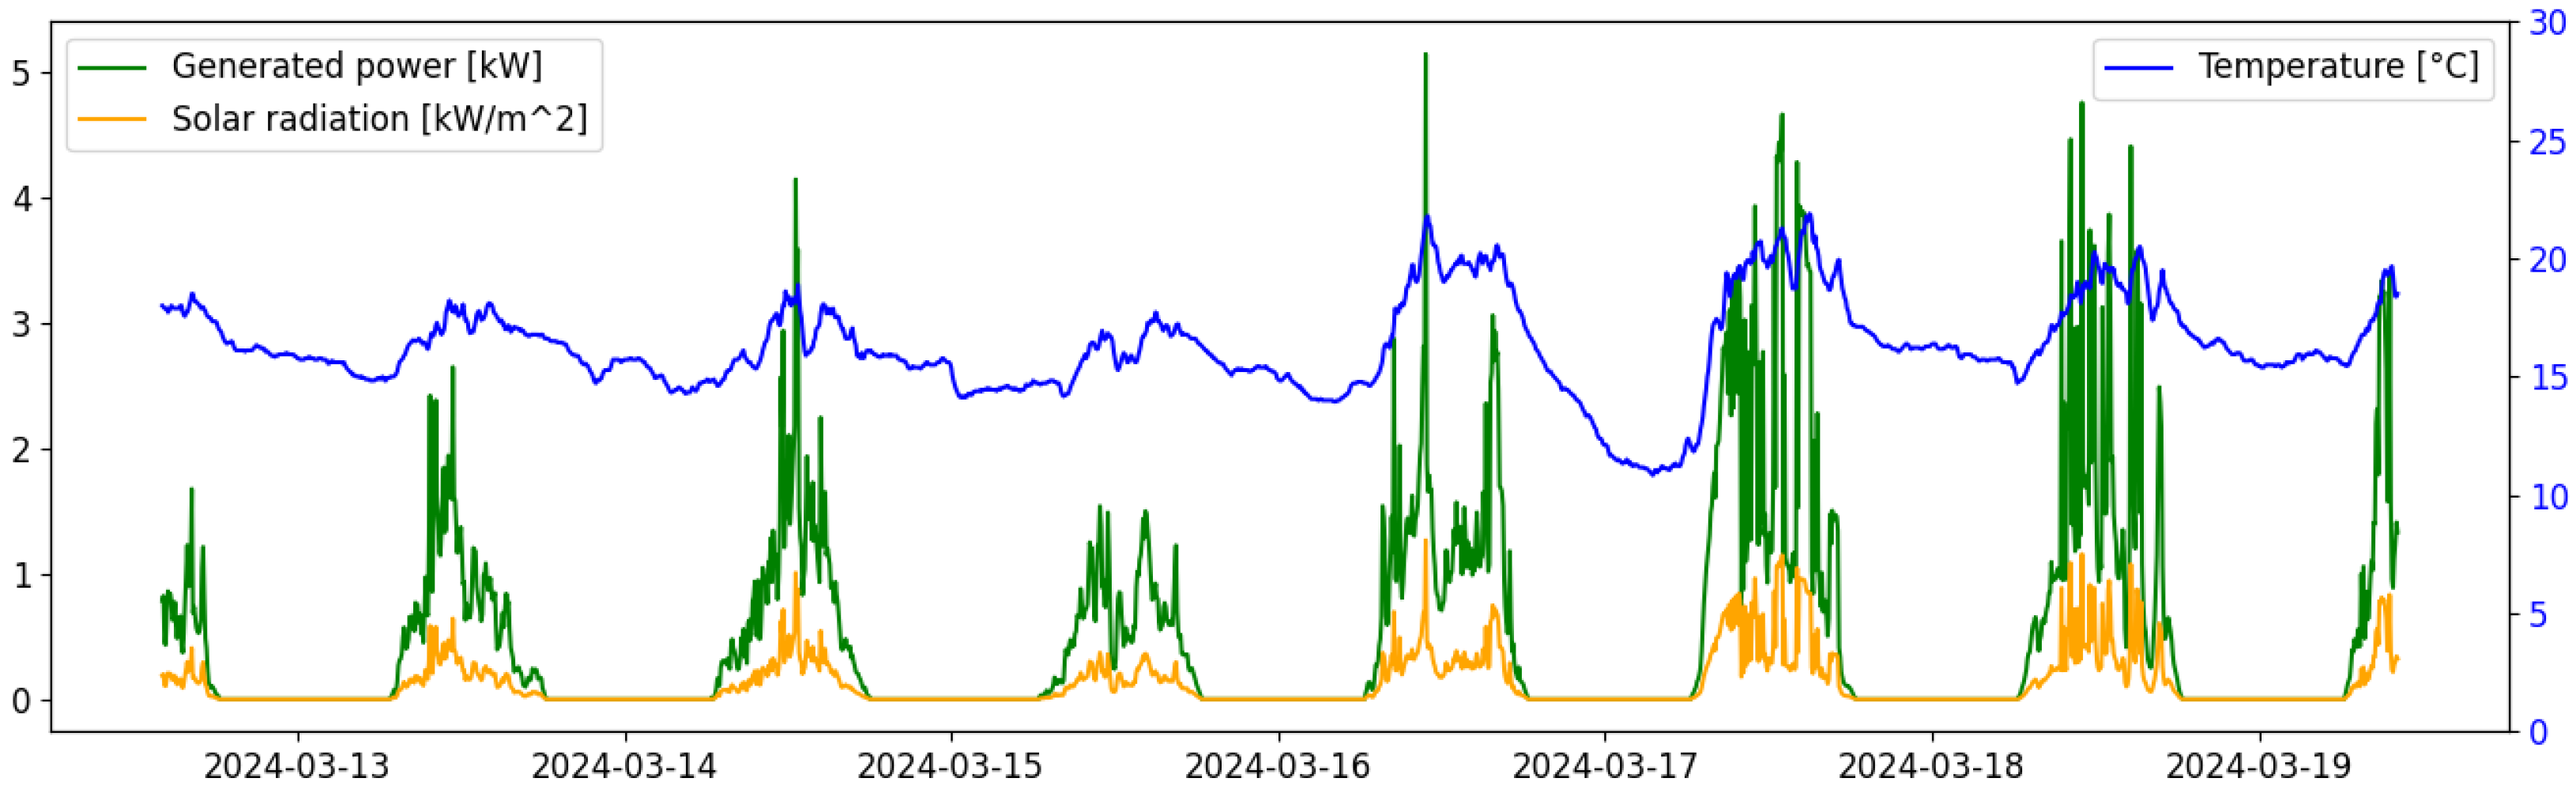
Figure 3 presents the energy generation results of the 4 kW PV system. As expected, the generation profile closely follows the irradiance pattern. The average ambient temperature in Pasto typically ranges between 14 and 16 °C, with minimal seasonal variation, which is favorable for photovoltaic conversion efficiency. Moreover, due to its altitude of approximately 2500 m above sea level, Pasto benefits from relatively high irradiance levels; however, cloud cover is frequent. Irradiance data were obtained from [31].
Figure 3.
PV system generation results for a 4 kW system.
Based on these results, a 4 kW PV system is estimated to generate an average of 12.6 kWh per day, equivalent to 378.3 kWh per month. When scaled to a 40 kW installation, the average daily energy production increases to 103.9 kWh, corresponding to a monthly generation of approximately 3.12 MWh.
The 4 kW PV system may be sufficient to cover the energy demand of EVs during the first 3 to 4 years depending on the annual growth rate of this demand. However, with high EV penetration, this system would be insufficient. The 40 kW PV system can generate enough energy to meet a large portion of the EV demand, even in high-penetration scenarios. As will be presented in the economic evaluation, having a system of this capacity can benefit the viability of EVCS.
3.2. SUMO Simulations
Six vehicles with the same specifications were used in SUMO simulations to collect data on the utilization characteristics of Level 2 and Level 3 charging stations. Two short routes (vehicles 4 and 5, less than 30 km), two medium-length routes (vehicles 0 and 2, around 40 km), and two long routes (vehicles 1 and 3, more than 80 km) were defined.
With the parameters listed in Table 2, a Lightning ZEV3 Zero Emission Transit Cargo Van was chosen as the simulation testing vehicle [32], whose characteristics are described in Table 3.
Table 3.
Testing vehicle characteristics.
Table 4 presents simulation for level 2 EVCS over a 24-h period. It shows that the charging times are quite long, as expected. In general, the charging times exceed 2 h, and the energy delivered ranges from 10 to 20 kWh. Vehicles 4 and 5 did not stop charging on this specific day, so no charging data is available for them.
Table 4.
Simulation results of Level 2 EVCS.
The simulation results for vehicle charging at Level 3 stations are shown in Table 5. In contrast to Level 2 stations, this one has shorter charging time (around an hour) and delivers more than 50 kWh of energy. The state of charge (SoC) is higher than 50%, reaching 80% in vehicles 4 and 5, because of the increased energy transfer in less time. In comparison, the SoC is between 20% and 35% in the scenario shown in Table 4. The distances traveled throughout the day also show this disparity.
Table 5.
Simulation results of Level 3 EVCS.
The vehicles with short routes (vehicles 4 and 5, less than 30 km) only made 2 recharges, while the vehicles with medium-length routes (vehicles 0 and 2, around 40 km) made 3 recharges, and the vehicles with long routes (vehicles 1 and 3, more than 80 km) made 4 and 5 recharges, respectively. The results from these simulations align with the usage patterns described in the literature (Section 2.3). These results, derived from the simulations of the spatial model, are used for the study scenarios on which the economic evaluation is based, as described in Figure 1.
3.3. Sensitivity Analysis
To generate the sensitivity scenarios, three recharged demand increase rates (DI = 5%, 15%, 25%) and three discount rates (DR = 5%, 10%, 15%) were selected. By combining these rates, nine sensitivity scenarios were created. The purpose of evaluating the business cases within these scenarios is to assess their success under both favorable and unfavorable conditions in the context, considering external variables that are beyond control. The most relevant results are presented below, along with a summary of the findings using heat maps.
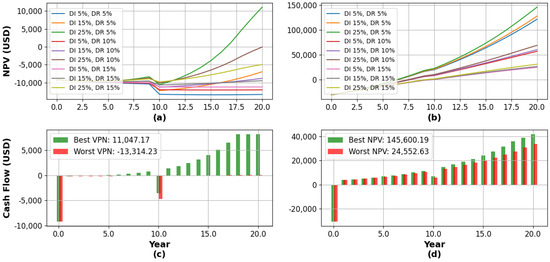
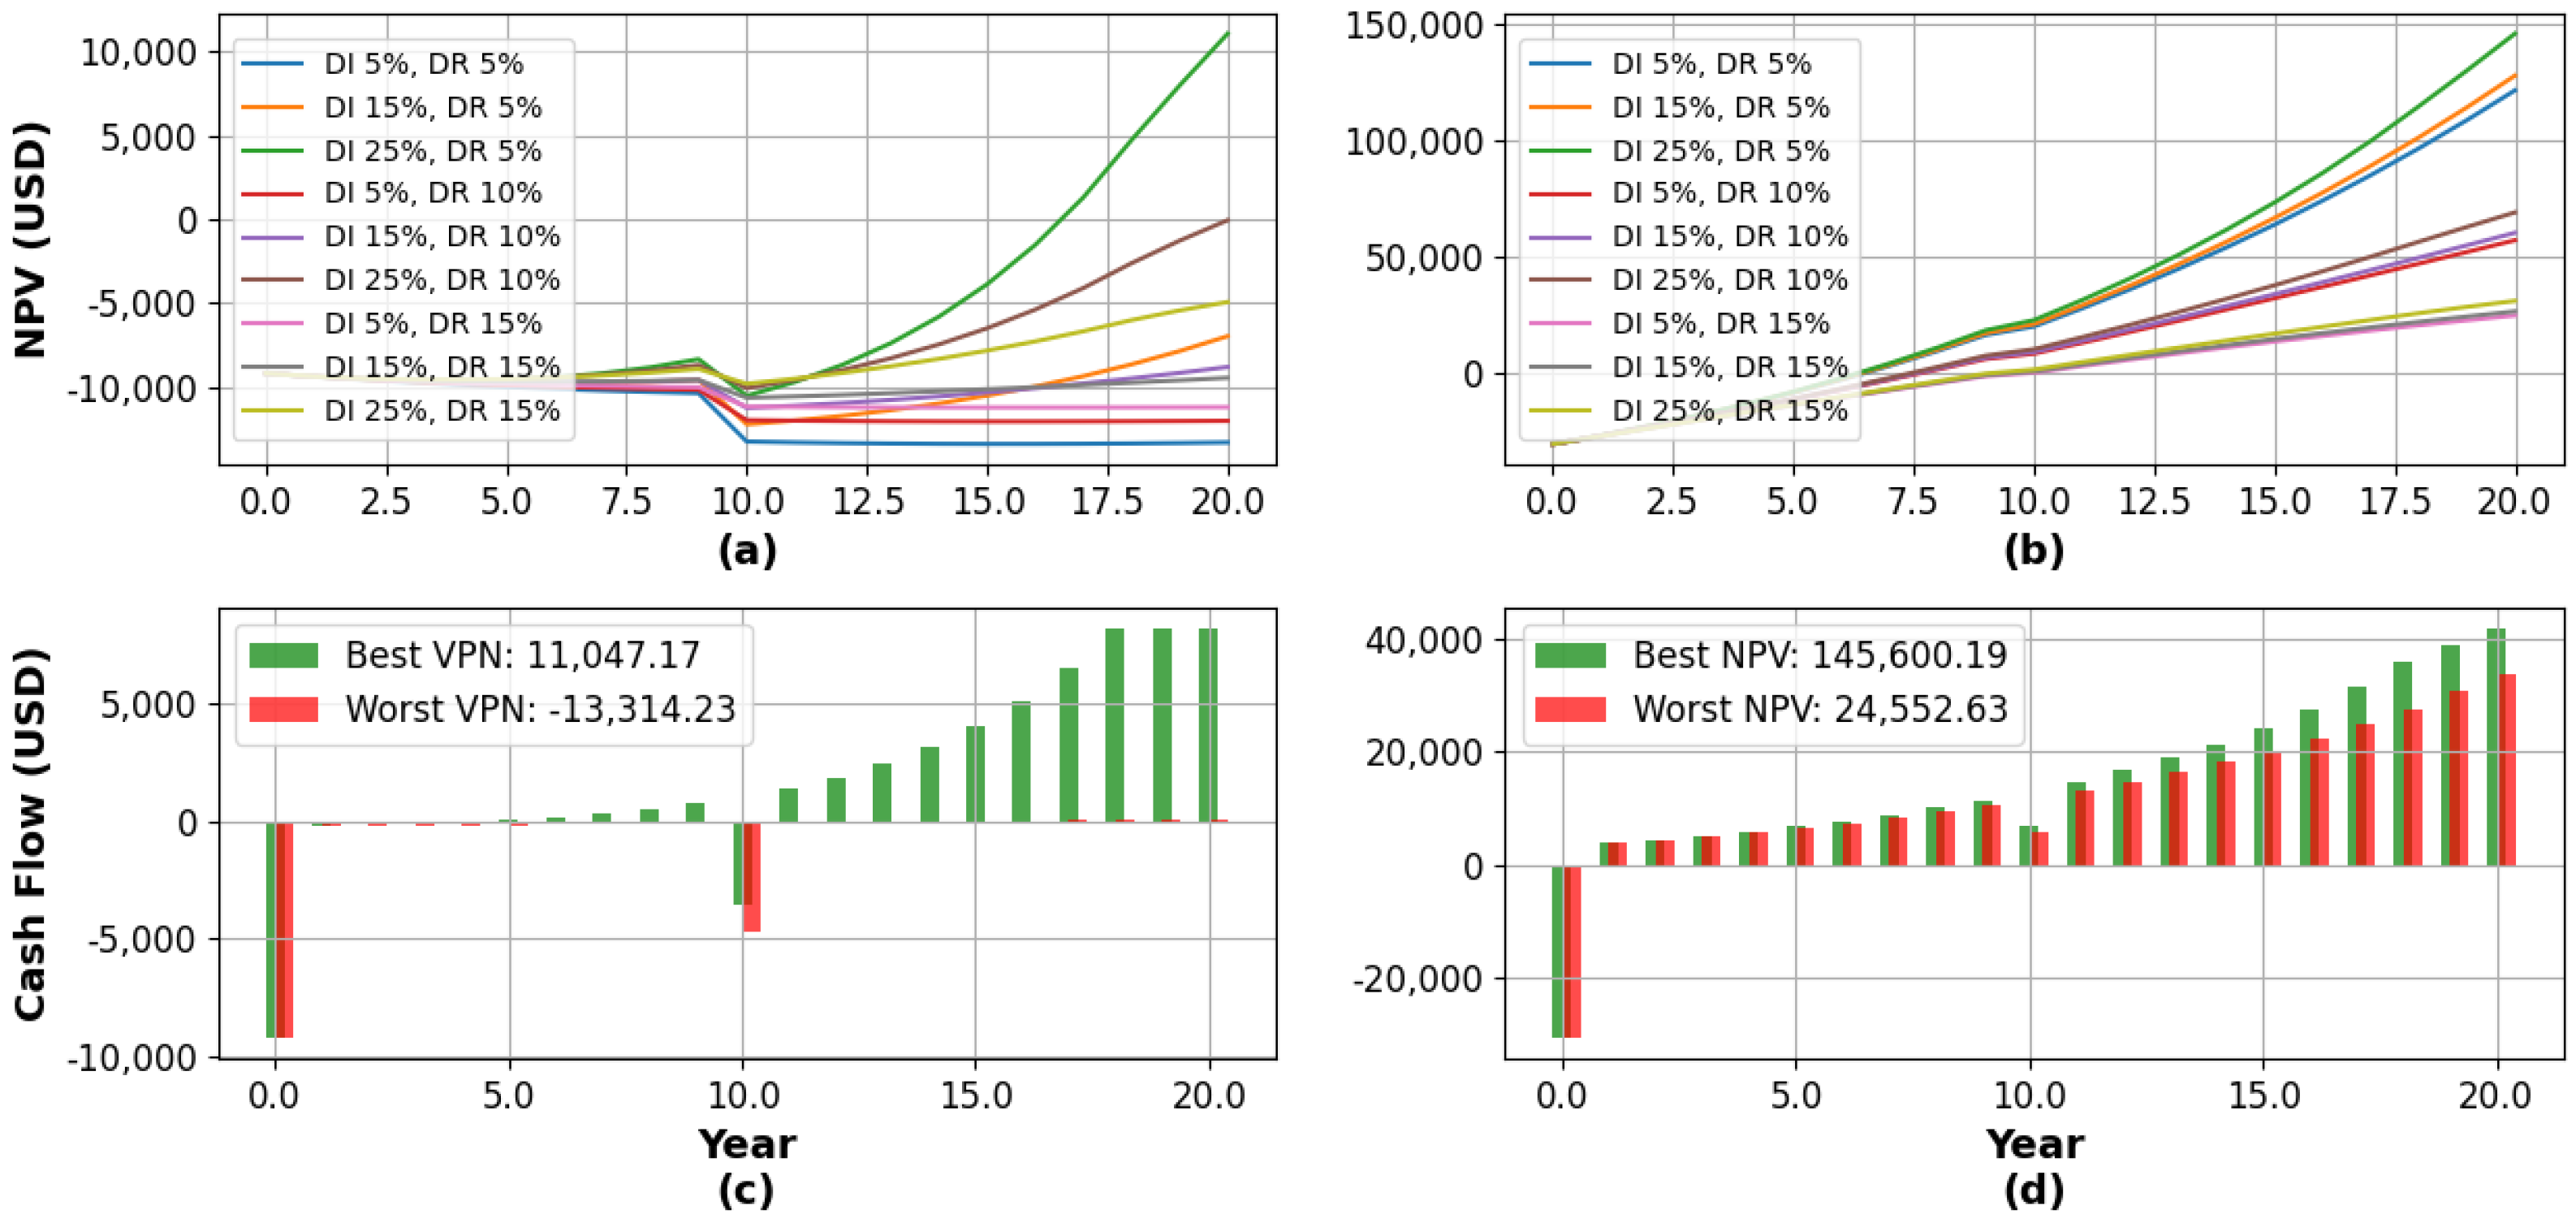
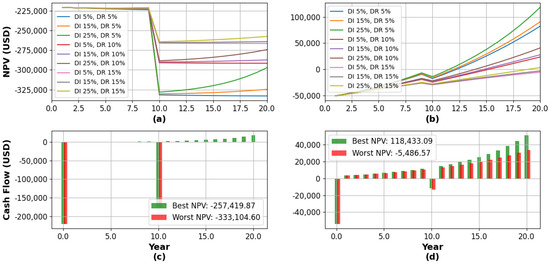
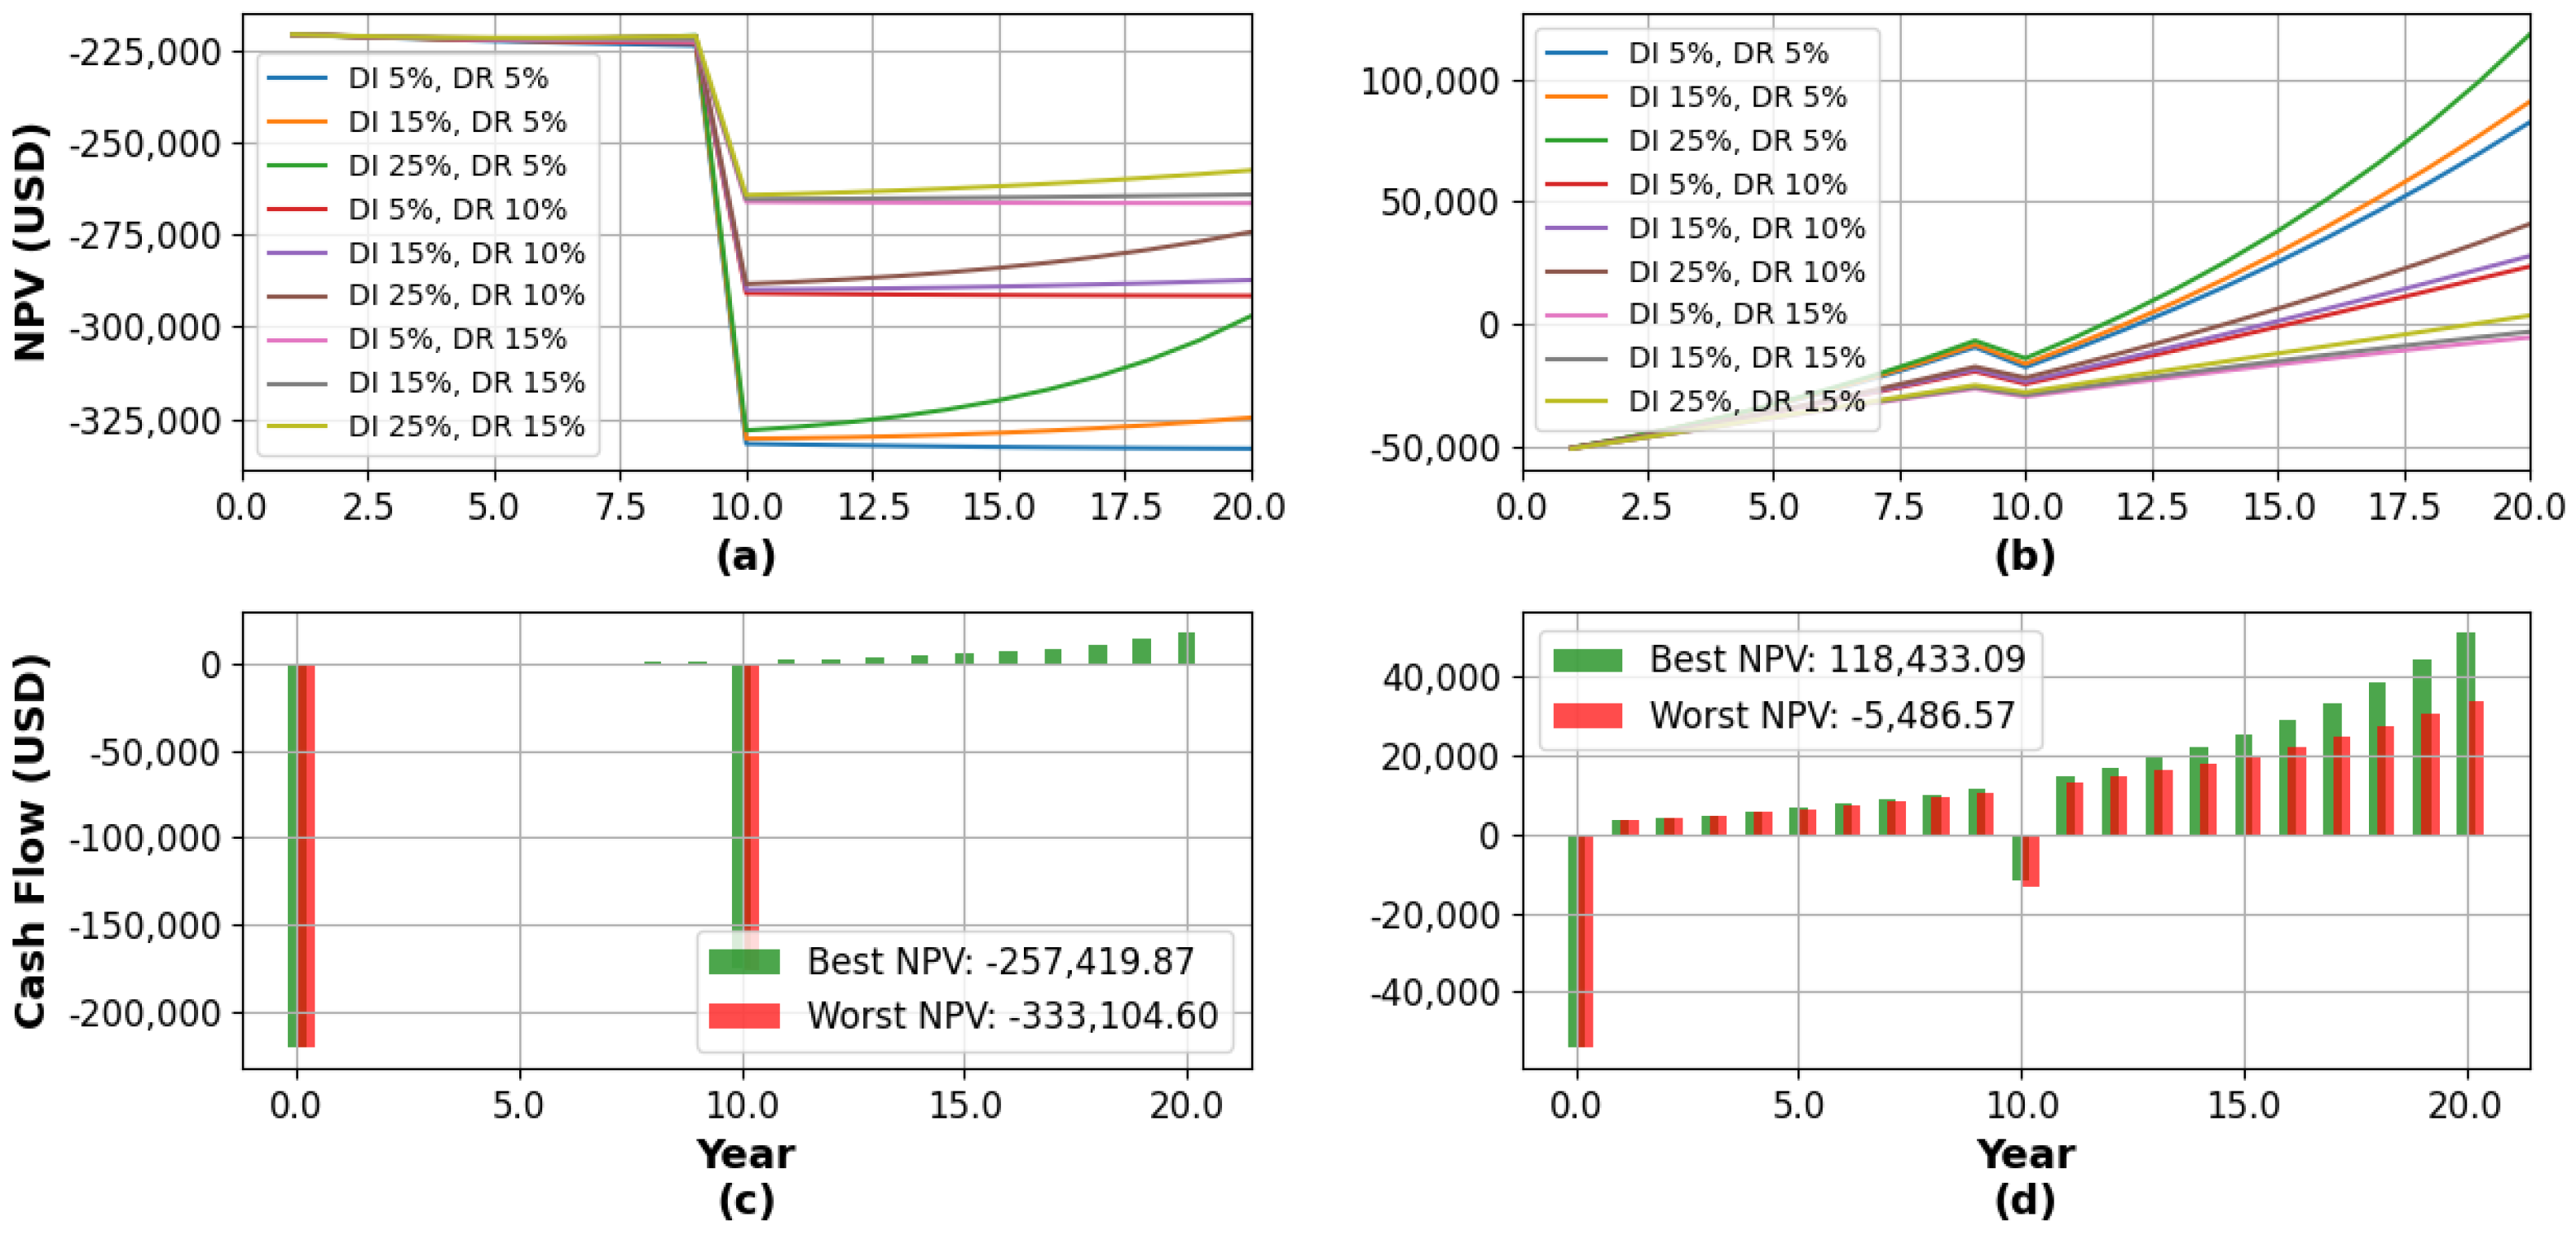
Figure 4 presents the results for Level 2 charging stations. Panels on the left (Figure 4a,c) illustrate the baseline case (L2_BC), while those on the right (Figure 4b,d) depict the best case (L2_PV40k_TF_SB). The latter assumes energy generation through a 40 kW PV system (PV40k), tax-free (TF) for acquisition of the EVCS and an 80% subsidy (SB) for purchase and installation costs.
Figure 4.
Sensitivity analysis results for Level 2 EVCS. (a) Accumulated NPV for L2_BC; (b) Accumulated NPV for L2_PV40k_TF_SB; (c) Cash flow for L2_BC; (d) Cash flow for L2_PV40k_TF_SB (Best scenario).
In the baseline case (L2_BC), the scenario with the highest DI and lowest DR produces the best results, as shown by the green line in Figure 4a,b. Notably, in this case, the best case (L2_PV40k_TF_SB) reduces the payback period by about 10 years when compared to the baseline. On the other hand, only the green line in L2_BC indicates a payback period of less than 20 years, whereas other cases require significantly longer to recover the investment. Moreover, scenarios with low DI = 5% stagnate and do not yield a return on investment.
All evaluated scenarios achieve an investment return within 10 years for the best case (L2_PV40k_TF_SB). The best case, once again, involves DI = 25% and DR = 5%. A notable grouping is observed: scenarios with DR = 5% consistently outperform those with DR = 10%, which, in turn, yield better results than scenarios with DR = 15%. Considering that the DR for projects in Colombia was 9% in 2022 [33], scenarios with DR = 5% are optimistic, whereas those with DR = 15% are conservative.
Figure 4c,d depict the cash flows for L2_BC and L2_PV40k_TF_SB cases, respectively. In each one, the cash flow with the highest accumulated NPV over the 20-year analysis period is represented in green, while the lowest accumulated NPV is shown in red. For the baseline case, the best NPV corresponds to an optimistic scenario with DI = 25% and DR = 5%, whereas the worst NPV aligns with DI = 5% and DR = 5%, reflecting a mismatch between a favorable DR and a pessimistic DI.
In Figure 4d, cash flows exhibit significantly higher annual net revenues. As in the baseline case, the green bars represent the best cumulated NPV (DI = 25%, DR = 5%), while the red bars depict the worst cumulated NPV (DI = 5%, DR = 15%). A consistent pattern emerges: scenarios with DI = 25% deliver the most favorable outcomes, while those with DI = 5% perform poorly. This emphasizes how crucial it is to increase EV penetration rates to guarantee the financial sustainability of a business case.
Figure 5 presents the results for Level 3 stations. The panels on the left (Figure 5a,c) show the baseline scenario (L3_BC), while those on the right (Figure 5b,d) depict the best scenario (L3_PV40k_TF_SB). The latter assumes energy generation through a 40 kW PV system (PV40k), tax-exempt (TF) acquisition of the EVCS, and an 80% subsidy for purchase and installation costs.
Figure 5.
Sensitivity analysis results for Level 3 EVCS. (a) Accumulated NPV for L3_BC; (b) Accumulated NPV for L3_PV40k_TF_SB; (c) Cash flow for L3_BC; (d) Cash flow for L3_PV40k_TF_SB (Best scenario).
It is noteworthy that the baseline case is not viable in any of the proposed scenarios, as the initial investment is very high, and the 10-year update is also costly. The revenues over the analysis period are insufficient to cover operational expenses and recover the investment. Even though there is a scenario with high EV penetration, with a 25% annual growth rate, this is still not enough to achieve economic viability. The scenario with a DI = 25% and DR = 15% shows the best performance, while the scenario with DI = 5% and DR = 5% has the highest NPV.
It is observed that in most scenarios, the L3_PV40k_TF_SB case is viable, although the return on investment occurs after more than 10 years. This case has a cumulative NPV exceeding 118,000 USD after 20 years, which is lower than the NPV of the L2_PV40k_TF_SB case for level 2 stations. This may be since the energy sales cost at Level 2 and Level 3 stations is assumed to be relatively similar, considering the current energy prices in Colombia.
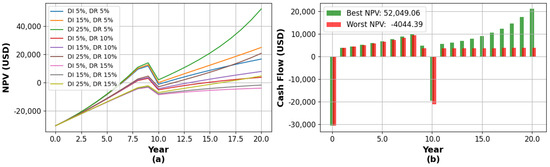
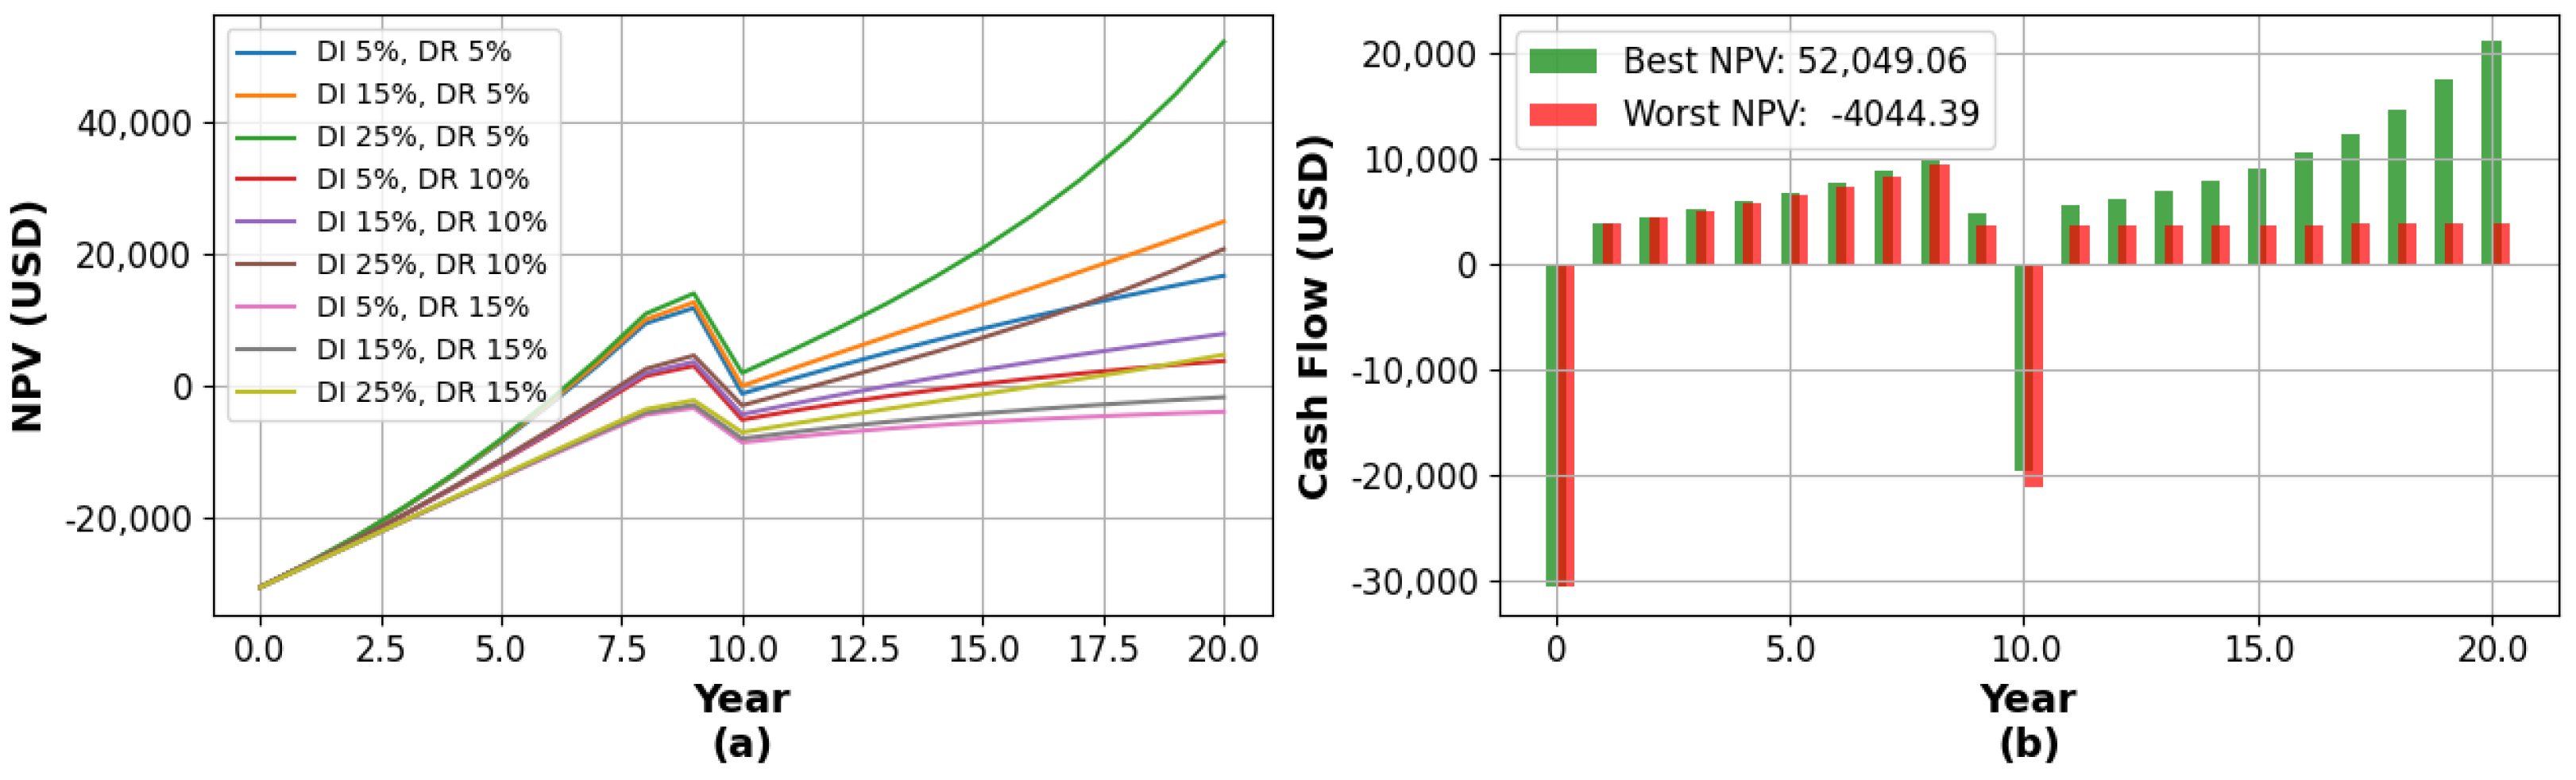
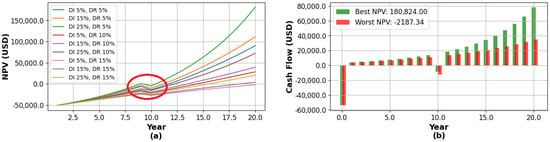
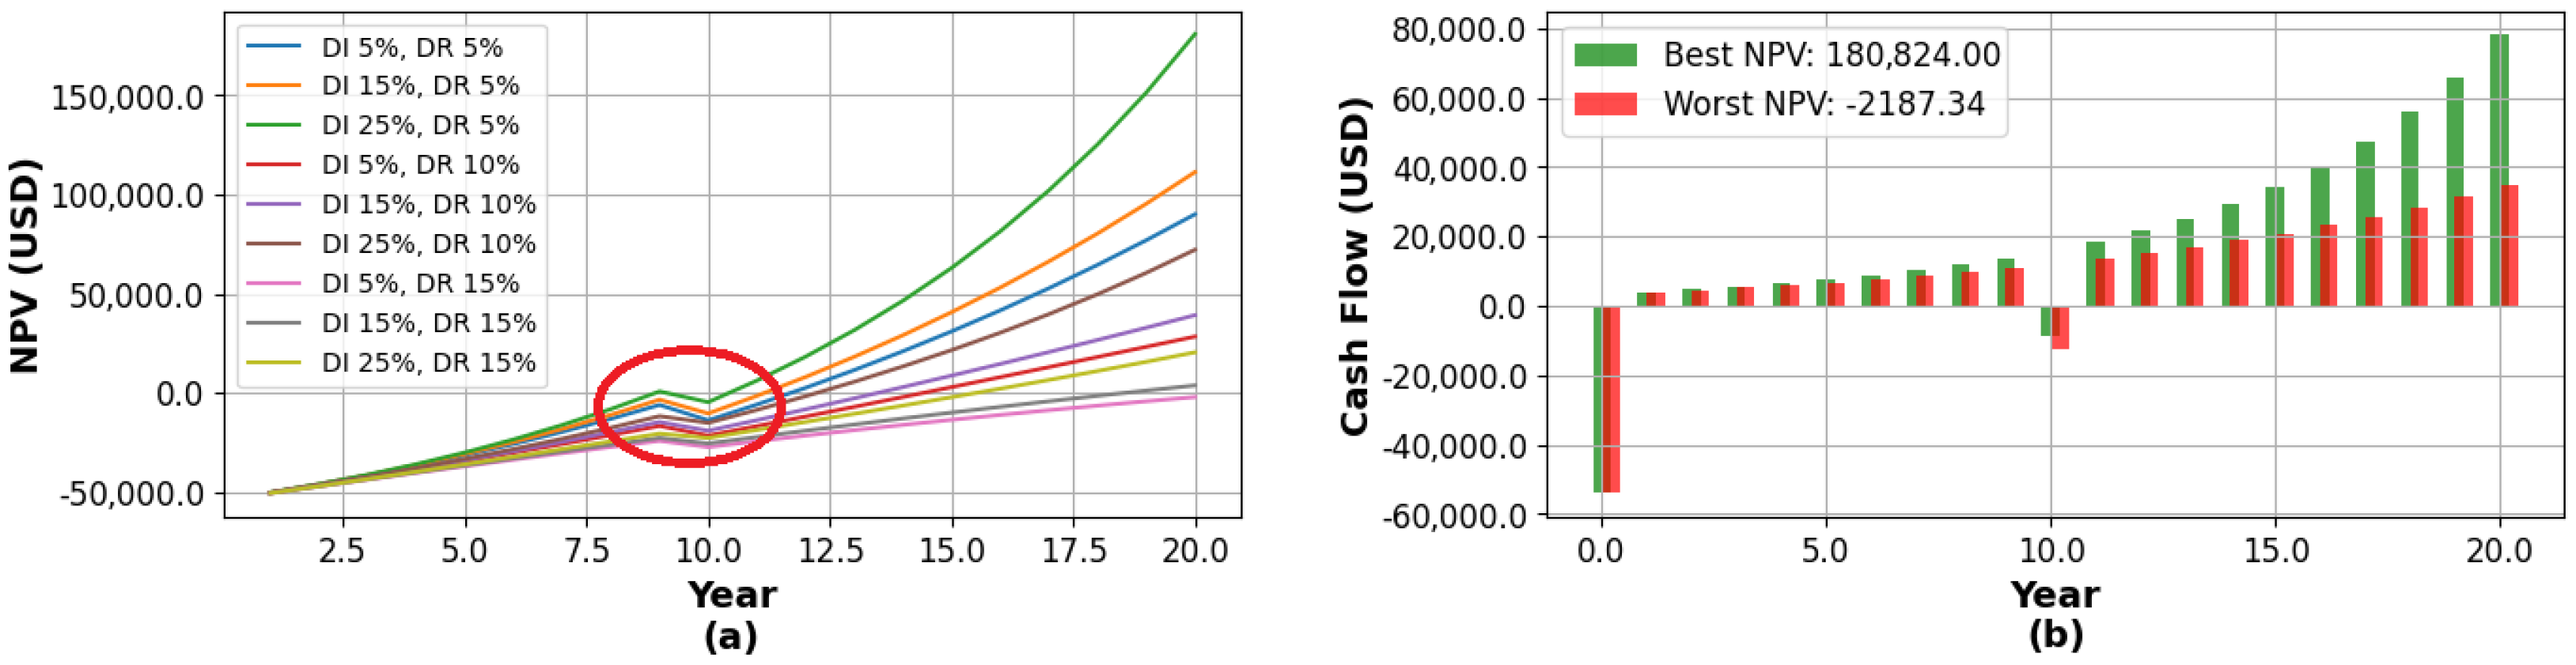
Figure 6 shows the results for the L2_L3_PV40k_TF_SB case, which considers Level 2 stations upgraded to Level 3 after 10 years. This case includes energy generation through a 40 kW PV system, tax-free, and an 80% subsidy for the acquisition and installation.
Figure 6.
Sensitivity analysis results with level 2 to level 3 upgrade. (a) Accumulated NPV; (b) Cash flow.
This case demonstrates the advantage of recovering the initial investment quickly, similar to the Level 2 stations. However, the 10-year upgrade to Level 3 leads to a significant cash outflow that slows the growth of the accumulated NPV. After this, the curves return to their upward trend, although the growth is much less pronounced in several scenarios. It maintains a consistent shape in the scenario with DI = 25% and DR = 5%, reaching a cumulative NPV of over 52,000 USD by the end of the 20-year analysis period.
The results in Figure 7a show that the cumulative NPV is higher than in the L3_PV40k_TF_SB case. Although the energy sales price has been doubled, and the same station utilization rate is assumed, the cumulative NPV after 20 years increased by approximately 60,000 USD, and the return on investment was delayed by only about one year.
Figure 7.
Sensitivity analysis results with level 3 doubled charging rate. (a) Accumulated NPV; (b) Cash flow.
While Figure 7a shows that the cumulative NPV for the DI = 25% and DR = 5% scenario reaches zero after around 9 years (highlighted in a red), the 10-year station upgrade results in a significant cash outflow, delaying the return on investment until around 10.5 years. Although this case shows better results, it should be noted that an increase in the charging rate could potentially reduce the station’s utilization rate, which has not been considered in this scenario.
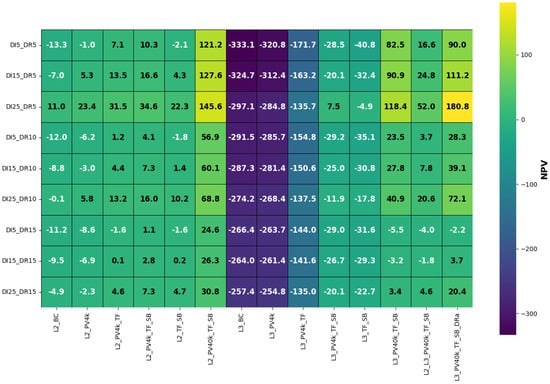
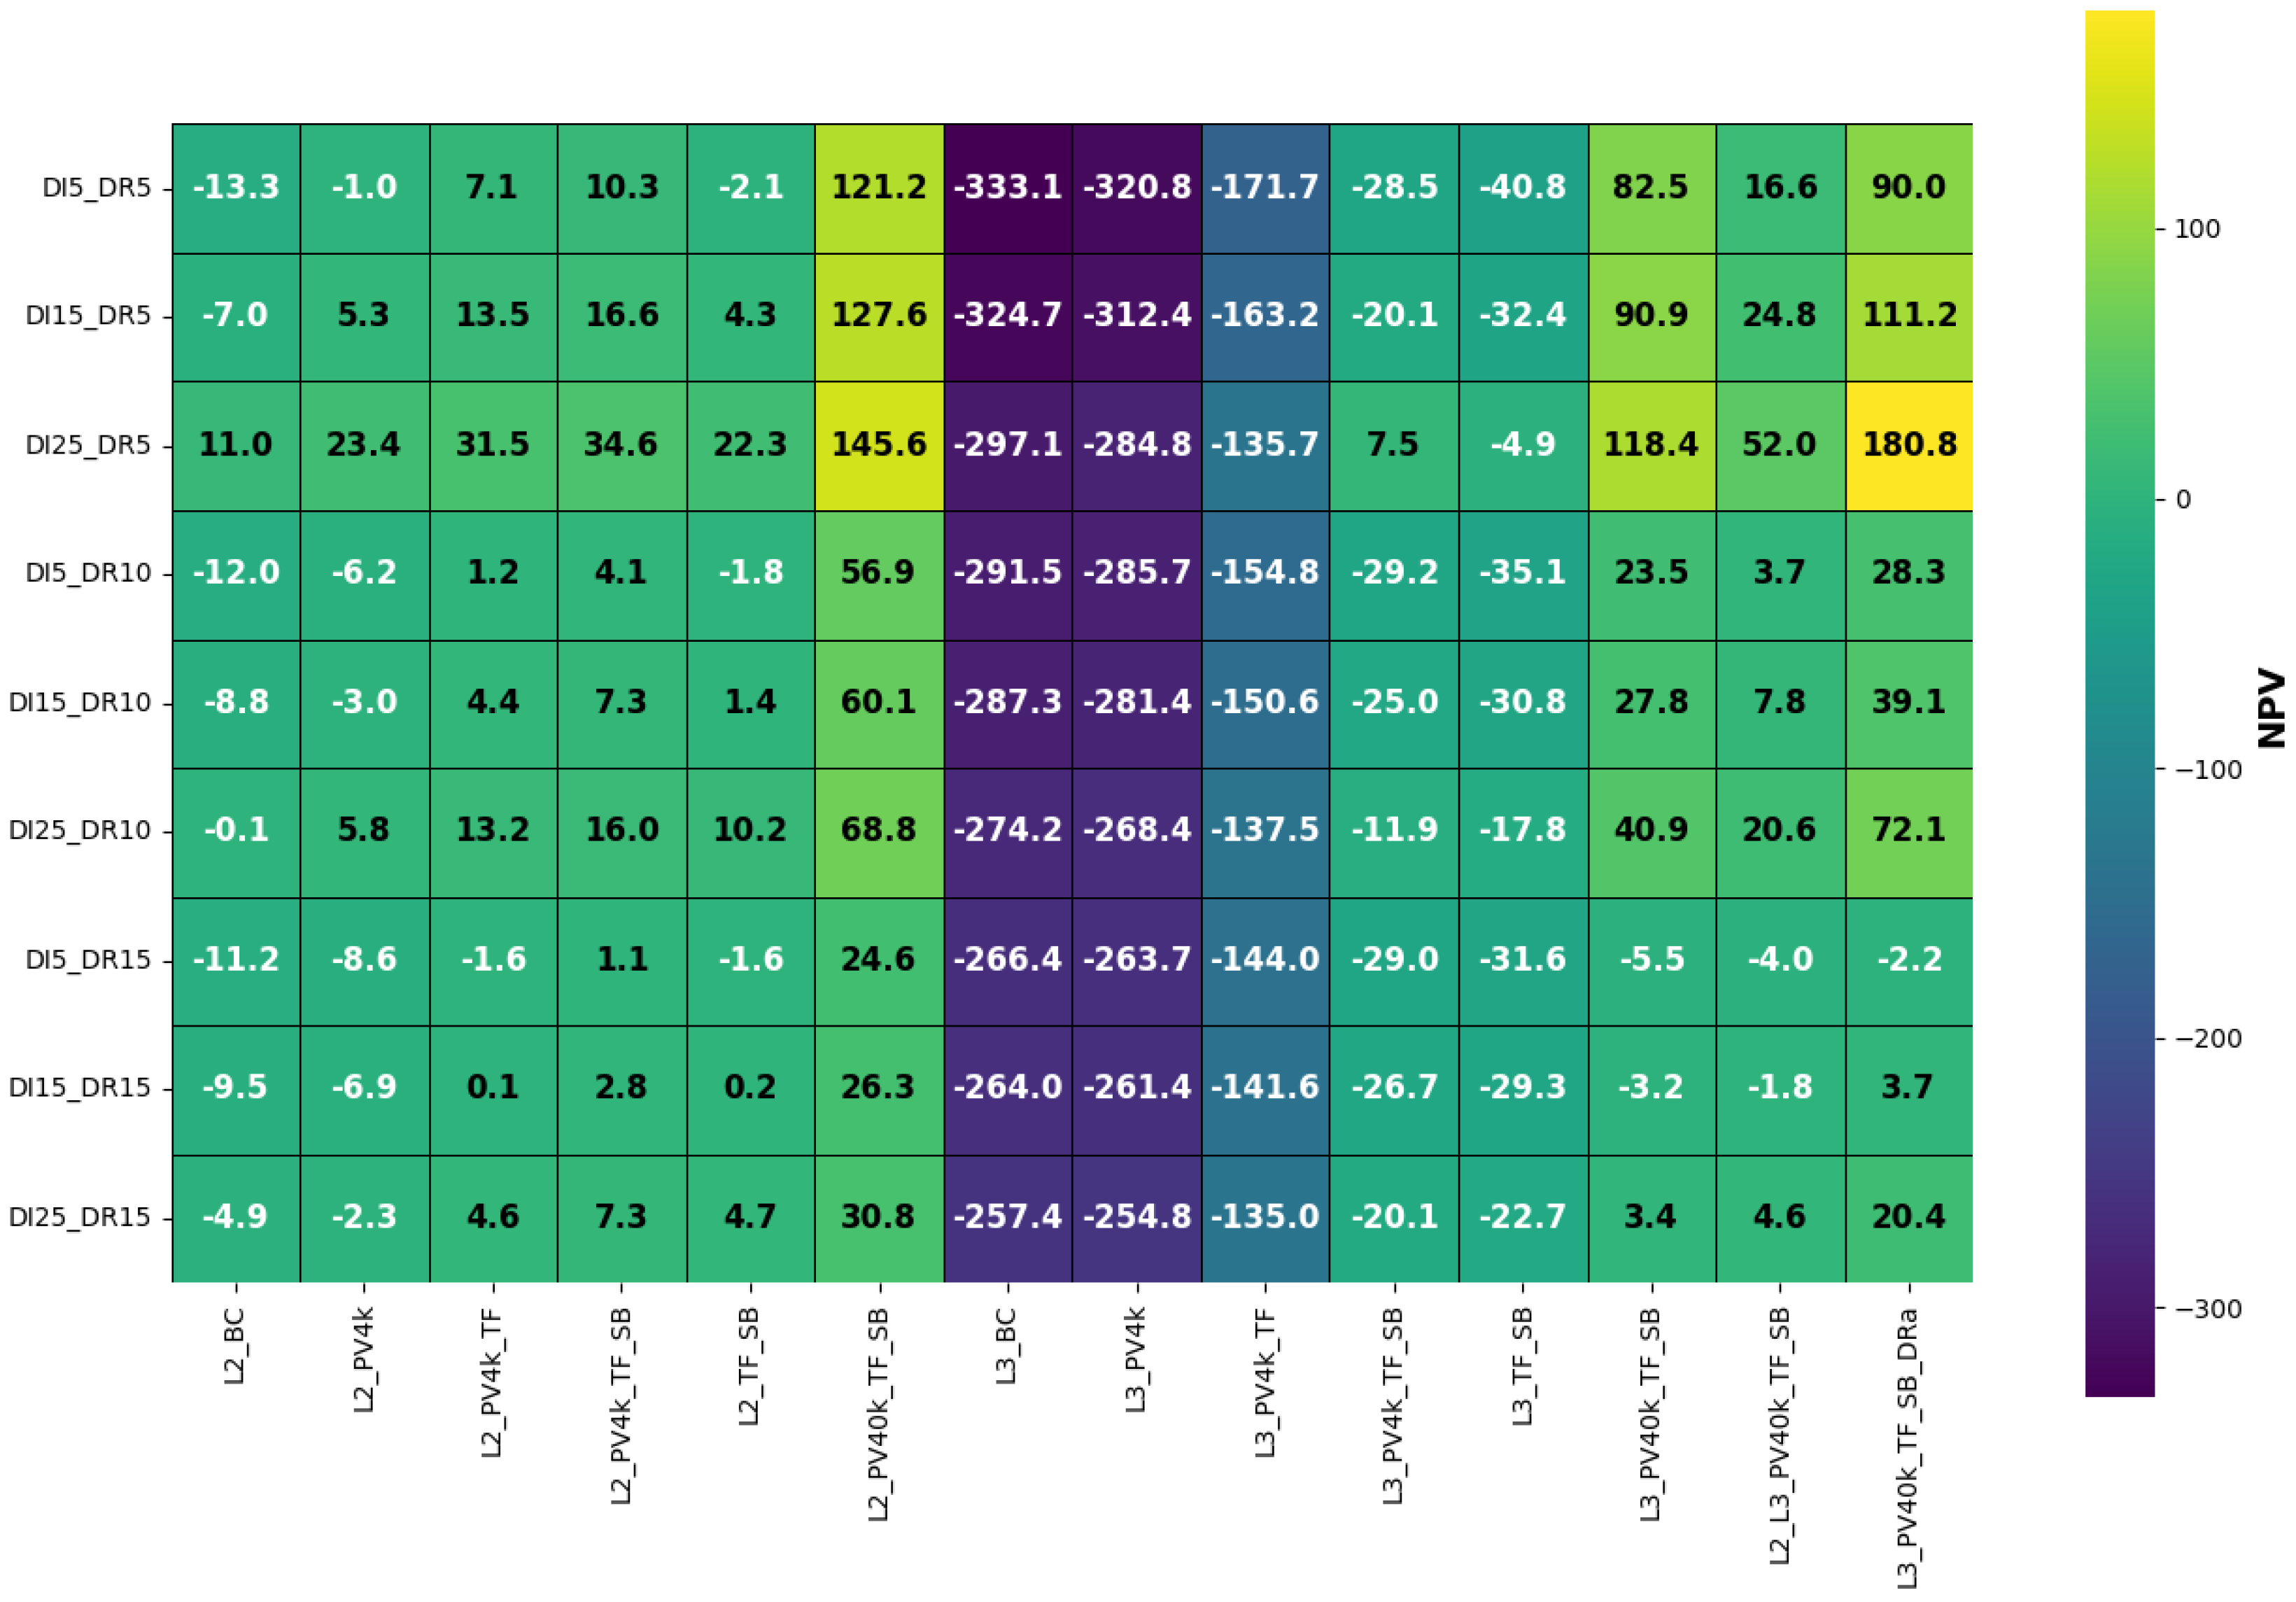
Figure 8 summarizes the cumulative NPV at the end of the 20-year, in thousands of USD. It is noteworthy that only the L2_PV4k_TF_SB and L2_PV40k_TF_SB cases achieve a return on investment in less than 20 years across all scenarios. This allows us to conclude that both cases result in a return on investment regardless of contextual conditions, even with low EV penetration rates and high discount rates.
Figure 8.
Heat map of the accumulated NPV, 20 years of analysis (in thousands of USD).
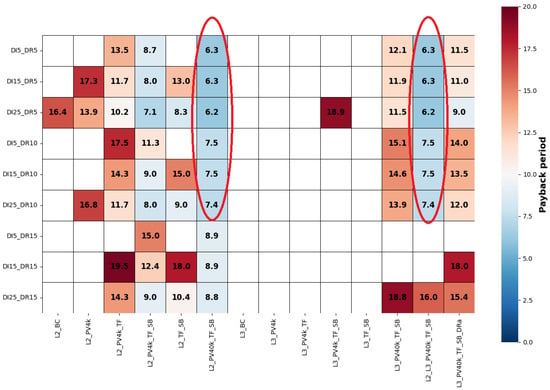
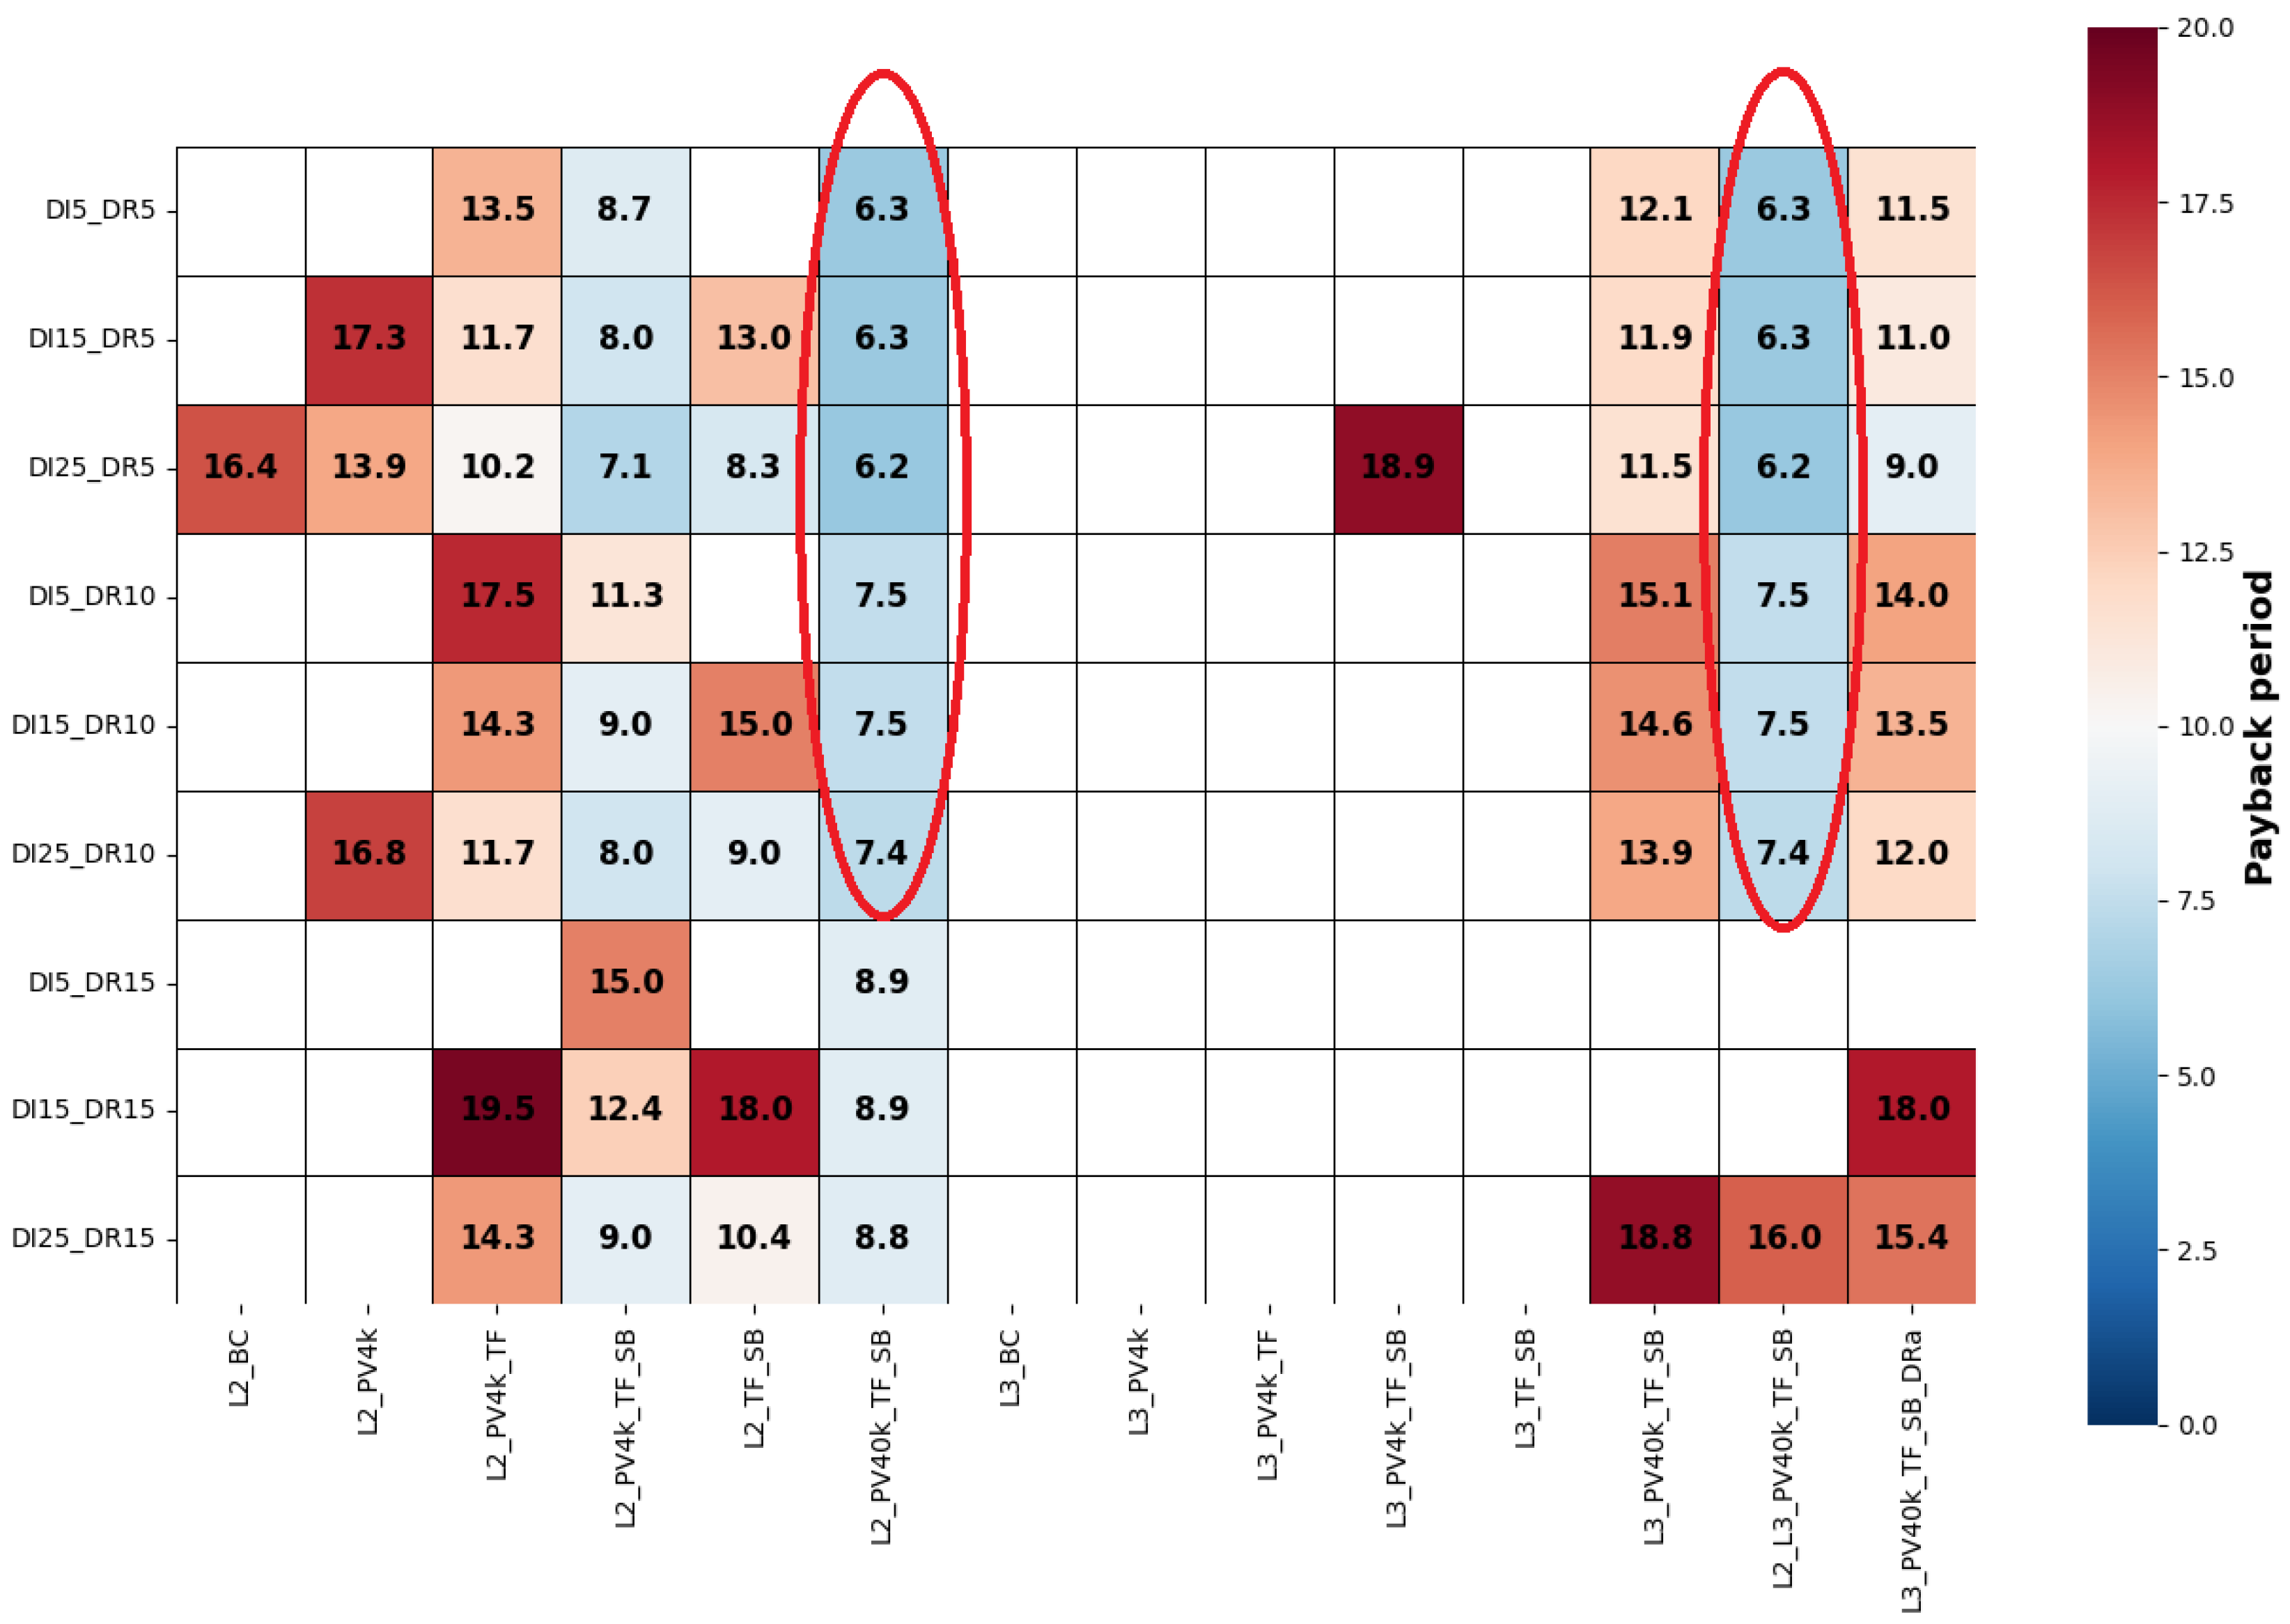
Figure 9 illustrates the payback period. Blank spaces represent cases where the investment is not recovered within 20 years. Considering this timeframe, the best-performing cases are L2_PV40k_TF_SB and L2_L3_PV40k_TF_SB. The durations highlighted in red indicate that these two cases are identical except in scenarios with high discount rates (DR = 15%). This difference arises because, during the first 10 years, both represent the same setup, after which the L2_L3_PV40k_TF_SB case is upgraded from Level 2 to Level 3. Across the proposed range of possibilities, the minimum recovery time observed is 6.2 years, occurring under scenarios with high EV penetration and low discount rates (DI = 25% and DR = 5%).
Figure 9.
Heat map of the payback period (in years).
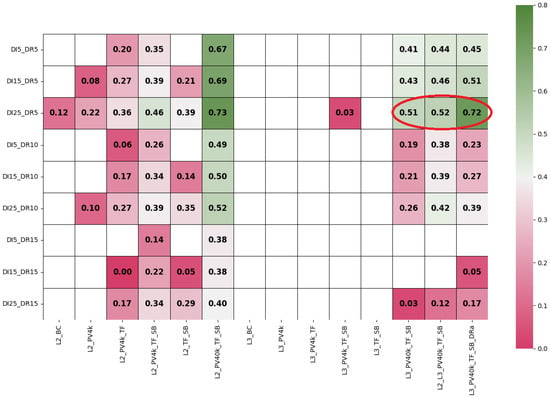
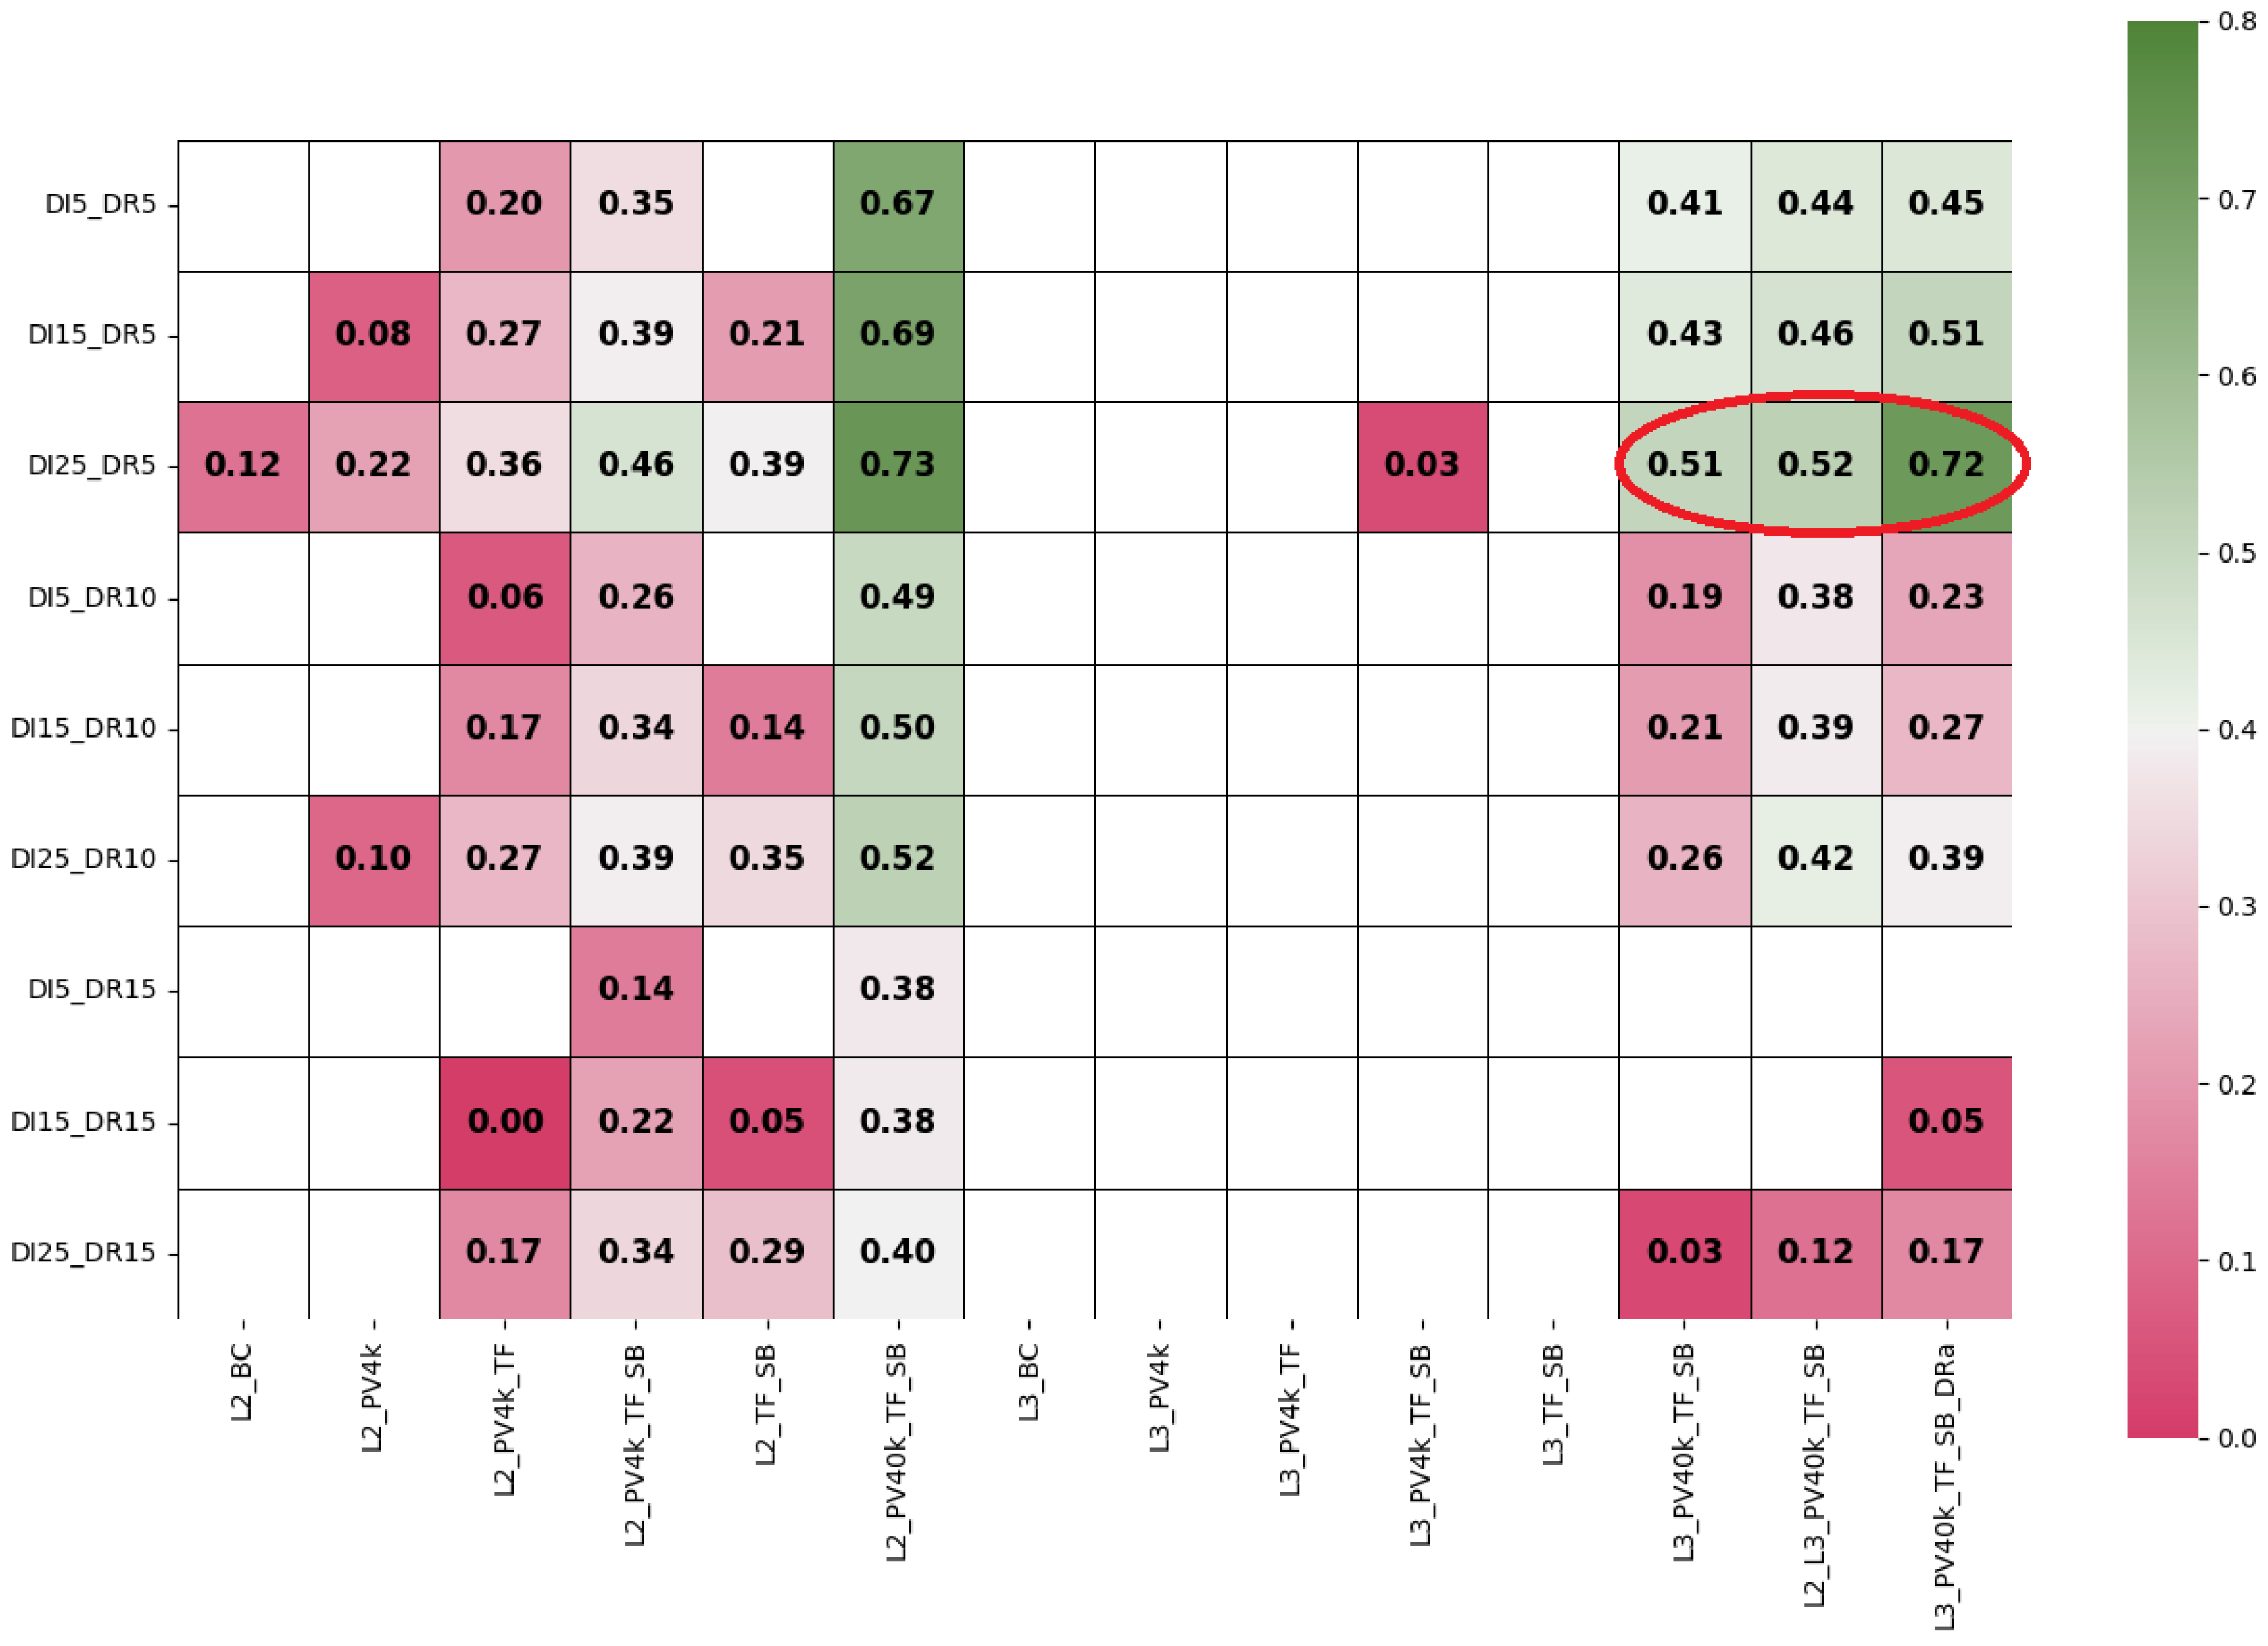
In conclusion, to better evaluate these cases, the results for each scenario are weighted using Equation (7) from the methodology. The outcomes are presented in Figure 10. As shown in Row 1, for the scenario DI = 5% and DR = 5% (low EV penetration and low discount rate), the best case is L2_PV40k_TF_SB, with a weight of 0.67. L2_PV40k_TF_SB consistently emerges as the best case for each scenario since it features the highest weights, making it the top-performing option.
Figure 10.
Weighting of the proposed scenarios.
To streamline the interpretation of these results, the analysis highlights two archetypal cases that align with current Colombian regulations: L2_PV4k_TF and L3_PV4k_TF. These scenarios incorporate existing tax exemptions for renewable energy and EV infrastructure. As shown in Figure 10, under these ’real-world’ policy conditions, Level 2 stations achieve feasibility at moderate penetration rates, whereas Level 3 stations consistently require additional capital support to overcome the high operational costs associated with demand charges.
It is worth highlighting that the scenario DI = 25% and DR = 5% features two cases with very similar weights: L2_PV40k_TF_SB and L3_PV40k_TF_SB_DRa. This demonstrates that Level 3 stations can become significantly more profitable with higher charging rates, though this might reduce their utilization rate. Furthermore, given that these cases have the highest weights 0.73 and 0.72, respectively, they can be considered the most desirable options. However, these results are contingent on very specific conditions of increased demand and return rates, which are independent and beyond control. Nevertheless, if these conditions materialize, it is clear that both Level 2 and Level 3 stations are equally viable under the conditions outlined for cases L2_PV40k_TF_SB and L3_PV40k_TF_SB_DRa.
Table 6 provides a summary of the best-performing business case, the L2_PV40k_TF_SB station, across all analyzed scenarios. This specific case represents a Level 2 charging station with a 40 kWp PV system, tax-free, and a government subsidy. The table highlights the NPV, payback period, and a weighting metric, which quantifies financial performance.
Table 6.
Best-performing business case (L2_PV40k_TF_SB).
The results show a clear trend: the financial viability of this business case is highly sensitive to the discount rate. As the discount rate increases, representing a higher cost of capital or perceived risk, both the NPV and the weighting metric decrease significantly. For example, in the DI25_DR5 scenario, a low discount rate of 5% yields a high NPV of 145,600 USD and a quick payback period of 6.2 years. In contrast, under the DI25_DR15 scenario, with a high discount rate of 15%, the NPV drops to 30,800 USD, and the payback period extends to 8.8 years.
The data also reveals that the annual increase in demand positively impacts the project’s financial metrics. A higher demand increase consistently results in a higher NPV and a shorter payback period across all discount rate levels. This confirms that sustained growth in EV adoption is a critical driver for the long-term profitability and sustainability of EVCS projects in emerging markets.
4. Discussion
The results of this study suggest that in contexts of low EV adoption, such as medium-sized cities in emerging economies, achieving the economic viability of EVCS remains a major challenge. Without external support, particularly government subsidies and the integration of renewable energy, most EVCS business models are not financially sustainable in the short to medium term. The scenarios analyzed demonstrate that project profitability and payback periods are strongly influenced by factors beyond the control of private investors, including EV penetration rates and supportive public policies.
These findings are consistent with existing research showing that high initial capital costs and low utilization rates are key barriers to EVCS deployment in early-stage markets [34]. While studies in countries with mature EV adoption (e.g., Norway, China) often emphasize optimizing dense charging networks, the present results highlight a more fundamental issue: ensuring that projects can reach basic economic viability under low-demand conditions. This underlines the importance of a phased deployment strategy in emerging economies, where early projects depend heavily on policy support, in contrast to the market-driven expansion observed in advanced economies [35].
To distinguish between market-driven and policy-driven viability, four specific business cases were analyzed: L2_BC, L2_PV4k, L3_BC, and L3_PV4k. The results indicate that market-driven viability is extremely limited; only the Level 2 scenarios (L2_BC and L2_PV4k) achieve financial feasibility, and only under the dual conditions of high EV penetration rates and favorable discount rates. In contrast, Level 3 (DC fast charging) scenarios remain financially unviable when driven solely by market forces. This disparity underscores that while slow-charging infrastructure might find a niche in high-demand urban settings, the high CAPEX and power demand charges associated with Level 3 stations create a ‘viability gap’ that cannot be bridged without targeted government incentives or subsidies. These findings highlight the critical role of policy intervention in de-risking high-power infrastructure investments in emerging markets.
To synthesize the extensive sensitivity analysis, this study identifies a set of archetypal cases that reflect the current regulatory environment in Colombia, specifically scenarios L2_PV4k_TF and L3_PV4k_TF. These cases incorporate existing tax exemptions for renewable energy and EV infrastructure. The results demonstrate that under these current policy conditions, only Level 2 stations (L2_PV4k_TF) achieve financial feasibility at moderate EV penetration rates. In contrast, Level 3 stations (L3_PV4k_TF) remain unviable due to their high capital and operational intensity. To bridge this gap, two strategic pathways are identified: (i) scaling up PV generation capacity to further offset demand charges—noting that this would increase initial CAPEX—or (ii) implementing more aggressive direct subsidies, as explored in the 80% rebate scenarios. This categorization simplifies the decision-making process for stakeholders by highlighting that current tax incentives are sufficient for slow charging but insufficient for the rapid charging network required for intensive urban mobility.
From a policy perspective, the results clearly indicate that government interventions are not optional, but essential to stimulate investment in EVCS. These interventions may include direct subsidies, tax incentives, or preferential electricity tariffs. In addition, the significant influence of PV integration on project profitability highlights the value of combining EV charging infrastructure development with renewable energy initiatives. This reinforces the case for integrated policy frameworks that simultaneously promote EV adoption and decentralized clean energy generation.
In addition to these policy and profitability considerations, the analysis highlights a trade-off in pricing high-power charging services. Although premium pricing for Level 3 stations is necessary for cost recovery due to high demand charges and grid fees, excessive price differences with Level 2 charging may shift price-sensitive users toward slower or residential alternatives. This could reduce fast-charging utilization and extend payback periods, indicating that a balanced pricing strategy is essential to preserve demand and ensure the long-term viability of fast-charging infrastructure.
Regarding the methodological scope, it is acknowledged that simulating with a limited fleet of six identical EVs does not fully capture the socio-economic diversity or spatial heterogeneity of a larger fleet. Nevertheless, the aim was not to replicate the city’s complete traffic flow under a scenario of widespread EV adoption, an unrealistic assumption given the current penetration rate in Pasto. Instead, the objective was to generate a dataset of validated energy consumption patterns for short, medium, and long trips under the city’s specific topographical and traffic conditions. This approach provided a solid basis for the subsequent economic analysis while maintaining the study’s feasibility. Future research could extend this work by modeling larger and more diverse fleets to reflect long-term adoption trends.
While the microscopic simulation approach enabled highly realistic estimation of energy consumption, the study did not incorporate broader socio-economic variables such as user behavior or willingness to pay, which could be explored through complementary survey-based research. Comparative analyses across different cities or the inclusion of additional renewable energy sources would also enrich the understanding of EVCS viability across varied urban contexts.
A potential limitation of this study is the use of a homogeneous simulated fleet. In real-world scenarios, fleet heterogeneity—encompassing diverse vehicle models, battery capacities, and varying SoC levels upon arrival—could introduce stochasticity in charging frequency and duration. For instance, vehicles with larger batteries or those used for intensive commercial purposes might utilize Level 3 charging more frequently, potentially increasing revenue but also intensifying grid demand peaks. Conversely, a higher proportion of private vehicles with shorter daily commutes might shift demand toward Level 2 domestic charging, as noted in the sensitivity checks for trip length distribution. While our model uses archetypal profiles to represent aggregate demand, future research should incorporate probabilistic distributions for SoC and trip lengths to further refine the granularity of revenue projections and infrastructure utilization rates.
5. Conclusions
The results show that business cases related to Level 3 charging stations are viable only under very specific conditions. The weighted analysis of the proposed scenarios indicates that, without a significant PV generation system, achieving a return on investment is nearly impossible. With a 4 kW system, only one scenario (DI = 25% and DR = 5%) yields positive results, with a payback period of 18.9 years.
Setting high charging rates at Level 3 stations—nearly double the rates of Level 2 stations—is not only reasonable but also a crucial strategy for enhancing the viability of business cases associated with these stations. This is evident in Figure 10, where the weighted results of three business cases are highlighted in red. Although the L3_PV40k_TF_SB_DRa case has a payback period of 9 years and the L2_L3_PV40k_TF_SB case has a payback period of 6.2 years, the former generates significantly higher revenues than the latter. Users’ preference for Level 3 stations over Level 2 stations can be fully justified by the reduced charging time offered by Level 3. In this context, a higher tariff can be seen as a natural consequence of providing a much more satisfying service for the user.
The baseline cases are unviable in almost all scenarios, as they represent government inaction. This underscores the necessity for governments to lead the transition to electromobility by implementing public policies that encourage both citizens to adopt EVs and investors to engage in businesses related to EVCS.
The business cases with the lowest weights are associated with insufficient governmental incentives and limited or no support for renewable energy generation. Having a PV generation system not only ensures very low greenhouse gas emissions but also significantly improves profitability. This is because the cost per kWh generated is very low, allowing for a greater profit margin when sold for EV charging. Additionally, energy surpluses can be sold in the energy market, generating additional income.
While this study initially utilized a 5% discount rate to reflect international investment benchmarks and favorable private financing conditions, the scenarios incorporating a 10% rate provide a more representative assessment of the financial landscape in Colombia. This higher rate accurately accounts for the sovereign risk and capital costs inherent to emerging economies, aligning with national planning guidelines. Therefore, the results derived from the 10% discount rate should be prioritized as the most realistic framework for stakeholders and policy-makers seeking to implement EVCS projects within the regional context.
Under the analyzed conditions, the main conclusion for any potential investor in these business cases is that the best option lies in Level 2 charging stations that are tax-exempt, subsidized, and equipped with a high-power PV generation system. This business model ensures a payback period of less than 9 years and a strong NPV at the end of 20 years.
Author Contributions
Conceptualization, F.A.D.; Methodology, F.A.D.; Software, F.A.D.; Validation, F.A.D.; Formal analysis, F.A.D.; Investigation, F.A.D.; Data curation, F.A.D.; Writing—original draft, F.A.D.; Writing—review & editing, J.M.-H. and E.F.C.-B.; Supervision, J.M.-H. and E.F.C.-B.; Project administration, J.M.-H. and E.F.C.-B. All authors have read and agreed to the published version of the manuscript.
Funding
The APC was funded by the internal call No. 166-2024 for the formation of the research project portfolio from Universidad del Valle.
Data Availability Statement
The data presented in this study are available on request from the corresponding author due to privacy considerations.
Conflicts of Interest
The authors declare no conflicts of interest.
Abbreviations
The following abbreviations are used in this manuscript:
| EV | Electric Vehicle |
| EVCS | Electric Vehicle Charging Station |
| PV | Photovoltaic |
| PV4k | 4 kW Photovoltaic System |
| PV40k | 40 kW Photovoltaic System |
| kW | Kilowatt |
| kWh | Kilowatt-hour |
| MPGe | Miles per Gallon Equivalent |
| GVWR | Gross Vehicle Weight Rating |
| SoC | State of Charge |
| SUMO | Simulation of Urban Mobility |
| MMPEVEM | MMP Electric Vehicle Emission Model |
| OSM | OpenStreetMap |
| PVLIB | Photovoltaic Energy Simulation Python Library |
| NPV | Net Present Value |
| DI | Demand Increase Rate |
| DR | Discount Rate |
| TF | Tax Free |
| SB | Subsidy |
| DRa | Double Rate scenario |
| L2 | Level 2 Charging Station |
| L3 | Level 3 Charging Station |
| BC | Base Case |
| NYSERDA | New York State Energy Research and Development Authority |
| CALeVIP | California Electric Vehicle Infrastructure Project |
| IDAE | Instituto para la Diversificación y Ahorro de la Energía |
| DNP | Departamento Nacional de Planeación |
| AFDC | Alternative Fuels Data Center |
| EPA | Environmental Protection Agency |
| EMR | Energy Market Rate |
| CR | Charging Rate |
References
- Alanazi, F. Electric Vehicles: Benefits, Challenges, and Potential Solutions for Widespread Adaptation. Appl. Sci. 2023, 13, 6016. [Google Scholar] [CrossRef] [Scilit]
- Mastoi, M.S.; Zhuang, S.; Munir, H.M.; Haris, M.; Hassan, M.; Usman, M.; Bukhari, S.S.H.; Ro, J.S. An in-depth analysis of electric vehicle charging station infrastructure, policy implications, and future trends. Energy Rep. 2022, 8, 11504–11529. [Google Scholar] [CrossRef] [Scilit]
- Dua, R.; Edwards, A.; Anand, U.; Bansal, P. Are American electric vehicle owners quitting? Transp. Res. Part D Transp. Environ. 2024, 133, 104272. [Google Scholar] [CrossRef] [Scilit]
- Hardman, S.; Tal, G. Why Are Some California Consumers Abandoning Electric Vehicle Ownership? Technical Report; National Center for Sustainable Transportation, UC Davis: Davis, CA, USA, 2021. [Google Scholar] [CrossRef]
- España, N.; Murillo-Hoyos, J.; Caicedo, E. Methodology for the comparative evaluation of vehicle technologies in intermediate cities considering electric vehicles. Transp. Res. Interdiscip. Perspect. 2024, 24, 101068. [Google Scholar] [CrossRef] [Scilit]
- Luo, Z. Powering Up a Slow Charging Market: How Do Government Subsidies Affect Charging Station Supply? Technical Report; Elsevier: New York, NY, USA, 2022. [Google Scholar] [CrossRef] [Scilit]
- Dua, R.; Almutairi, S. A perspective on emerging policy and economics research priorities for enabling low-carbon trucking. Energy Res. Soc. Sci. 2025, 124, 104025. [Google Scholar] [CrossRef] [Scilit]
- Li, S.; Tong, L.; Xing, J.; Zhou, Y. The Market for Electric Vehicles: Indirect Network Effects and Policy Design. J. Assoc. Environ. Resour. Econ. 2017, 4, 89–133. [Google Scholar] [CrossRef] [Scilit]
- Danial, M.; Azis, F.A.; Abas, P.E. Techno-economic analysis and feasibility studies of electric vehicle charging station. World Electr. Veh. J. 2021, 12, 264. [Google Scholar] [CrossRef] [Scilit]
- Lee, T.; Yoon, G.; Kang, B.; Choi, M.I.; Park, S.; Park, J.; Park, S. Enhancing Electric Vehicle Charging Infrastructure: A Techno-Economic Analysis of Distributed Energy Resources and Local Grid Integration. Buildings 2024, 14, 2546. [Google Scholar] [CrossRef] [Scilit]
- Alkawsi, G.; Baashar, Y.; Abbas, U.D.; Alkahtani, A.A.; Tiong, S.K. Review of renewable energy-based charging infrastructure for electric vehicles. Appl. Sci. 2021, 11, 3847. [Google Scholar] [CrossRef] [Scilit]
- Pesch, T.; Allelein, H.J.; Müller, D.; Witthaut, D. High-performance charging for the electrification of highway traffic: Optimal operation, infrastructure requirements and economic viability. Appl. Energy 2020, 280, 115706. [Google Scholar] [CrossRef] [Scilit]
- Campaña, M.; Inga, E.; Cárdenas, J. Optimal sizing of electric vehicle charging stations considering urban traffic flow for smart cities. Energies 2021, 14, 4933. [Google Scholar] [CrossRef] [Scilit]
- Institute of Transportation Systems. MMPEVEM–SUMO Documentation. 2024. Available online: https://sumo.dlr.de/docs/Models/MMPEVEM.html (accessed on 10 June 2024).
- Congreso de la República de Colombia. Ley 769 de 2002. Through Which the National Land Transit Code is Enacted. Available online: https://www.funcionpublica.gov.co/eva/gestornormativo/norma.php?i=5557 (accessed on 5 October 2023).
- Movilidad Sostenible LTDA. Proyecto de acuerdos para el día sin carro y moto en el municipio de Pasto, Nariño. Available online: https://concejodepasto.gov.co/wp-content/uploads/2023/11/PROYECTO-DE-ACUERDO-DIA-SIN-CARRO-Y-MOTO_0001.pdf (accessed on 15 October 2024).
- Anderson, K.S.; Hansen, C.W.; Holmgren, W.F.; Jensen, A.R.; Mikofski, M.A.; Driesse, A. pvlib python: 2023 project update. J. Open Source Softw. 2023, 8, 5994. [Google Scholar] [CrossRef] [Scilit]
- New York State Energy Research and Development Authority (NYSERDA). Charge Ready NY 2.0—NYSERDA. Available online: https://www.nyserda.ny.gov/All-Programs/Charge-Ready-NY (accessed on 10 November 2024).
- California Electric Vehicle Infrastructure Project (CALeVIP). CALeVIP 2.0 Rebates. Available online: https://calevip.org/find-project-2 (accessed on 10 November 2024).
- Instituto para la Diversificación y Ahorro de la Energía (IDAE). Programa MOVES III | Idae. Available online: https://www.idae.es/ayudas-y-financiacion/para-movilidad-y-vehiculos/programa-moves-iii (accessed on 20 November 2024).
- Scooter Doll. Electrify America Says It Will Raise EV Charging Prices Next Month. 2023. Available online: https://electrek.co/2023/02/03/electrify-america-customers-raise-ev-charging-prices/ (accessed on 10 November 2024).
- Banco Mundial. Inflación, Precios al Consumidor (% Anual)—Colombia | Data. Available online: https://datos.bancomundial.org/indicador/FP.CPI.TOTL.ZG?end=2023&locations=CO&start=1960 (accessed on 7 November 2024).
- Enel, X. How to Maximize EV Charging Cost Savings; Technical Report; Enel X: Rome, Italy, 2020. [Google Scholar]
- U.S. Department of Energy; Alternative Fuels Data Center (AFDC). Alternative Fuels Data Center: Operation and Maintenance for Electric Vehicle Charging Infrastructure. Available online: https://afdc.energy.gov/fuels/electricity-infrastructure-maintenance-and-operation (accessed on 20 November 2024).
- XM Compañía de Expertos en Mercados. Precio de Bolsa y Escasez. Available online: https://www.xm.com.co/transacciones/cargo-por-confiabilidad/precio-de-bolsa-y-escasez (accessed on 20 November 2024).
- Vásquez-Herrera, D. ¿Cuánto Cuesta Cargar un Carro Eléctrico en Colombia? | EL ESPECTADOR. 2024. Available online: https://www.elespectador.com/autos/cuanto-cuesta-cargar-un-carro-electrico-en-colombia/ (accessed on 21 November 2024).
- Helmus, J.R.; Lees, M.H.; van den Hoed, R. A data driven typology of electric vehicle user types and charging sessions. Transp. Res. Part C Emerg. Technol. 2020, 115, 102637. [Google Scholar] [CrossRef] [Scilit]
- Departamento Nacional de Planeación (DNP). Alcaldía de Pasto—Movilidad; Technical Report; Departamento Nacional de Planeación (DNP): Bogotá, Colombia, 2013. Available online: https://colaboracion.dnp.gov.co/CDT/Sinergia/Documentos/Producto%206%20%20-%20Informe%20Final%20Pasto%20(ajustado).pdf (accessed on 21 November 2024).
- Ministerio de Transporte de Colombia. Colombia tiene 8.299 vehículos eléctricos en el Runt, 1.699 más de la meta del Plan Nacional de Desarrollo. Available online: https://mintransporte.gov.co/publicaciones/11015/colombia-tiene-8299-vehiculos-electricos-en-el-runt-1699-mas-de-la-meta-del-plan-nacional-de-desarrollo/ (accessed on 21 November 2024).
- Departamento Administrativo Nacional de Estadística (DANE). Ciudades de Orden Nacional. Available online: https://geoportal.dane.gov.co/servicios/atlas-estadistico/src/Tomo_I_Demografico/%E2%80%A2ciudades-de-orden-nacional.html (accessed on 18 April 2023).
- Barco-Jiménez, J.; Rosero, D.; Zambrano, A.; Eraso-Checa, F.; Ruales, M.; Eraso, J.C. Irradiance dataset in the south of Colombia from 2013 to 2023 in 5-minutes intervals. Data Brief 2025, 63, 112063. [Google Scholar] [CrossRef] [Scilit] [PubMed]
- Lightning eMotors. Lightning ZEV3 Transit Cargo Van | Lightning eMotors. Available online: https://theevriders.com/car-details/29 (accessed on 1 April 2024).
- Revista Jurídica | DNP. Available online: https://www.dnp.gov.co/publicaciones/Revista-Juridica/Paginas/Adopci%C3%B3n-de-la-Tasa-Social-de-Descuento-para-la-evaluaci%C3%B3n-de-proyectos-de-inversi%C3%B3n.aspx (accessed on 21 November 2024).
- Martínez-Gómez, J.; Espinoza, V.S. Challenges and Opportunities for Electric Vehicle Charging Stations in Latin America. World Electr. Veh. J. 2024, 15, 583. [Google Scholar] [CrossRef] [Scilit]
- Briceno-Garmendia, C.; Qiao, W.; Foster, V. The Economics of Electric Vehicles for Passenger Transportation; The World Bank: Washington, DC, USA, 2023. [Google Scholar] [CrossRef] [Scilit]

Disclaimer/Publisher’s Note: The statements, opinions and data contained in all publications are solely those of the individual author(s) and contributor(s) and not of MDPI and/or the editor(s). MDPI and/or the editor(s) disclaim responsibility for any injury to people or property resulting from any ideas, methods, instructions or products referred to in the content. |
© 2026 by the authors. Licensee MDPI, Basel, Switzerland. This article is an open access article distributed under the terms and conditions of the Creative Commons Attribution (CC BY) license.