


Abstract
In order to achieve more accurate and efficient oil-paper insulation aging assessment, and to improve the operation and maintenance level of oil-paper insulated power equipment, this paper proposes an aging evaluation method of oil-paper insulation based on Raman spectrum and frequency-domain spectroscopy. First, oil-paper insulation samples with different aging degrees were prepared by an accelerated thermal aging test in this experiment. Then, Raman spectroscopy and frequency-domain dielectric spectroscopy were used to examine the samples and analyze the aging characteristics of the samples by LightGBM R2019b. Finally, the gray neural network is used to establish a prediction model for the degree of polymerization of insulating paper based on frequency-domain dielectric features and Raman spectral features. The results of this study showed that there is a certain correlation between the Raman characteristics of insulating oil and the FDS characteristics of insulating paper. The average absolute error of the prediction of the R-F-PGNN model developed in this paper is 20.4. The research in this paper provides a strong support for the development of Raman spectroscopy diagnosis technology for oil-paper insulation aging in the power industry, which has certain academic value and engineering application significance.
1. Introduction
As an important line of defense for the safe operation of the power system, the overall condition of the transformer has always been the focus of attention of the power industry, and its insulation status is directly related to the healthy operation of the transformer [1,2]. In the process of transformer operation, its internal oil-paper insulation system will gradually age due to electrical, thermal, mechanical and many other stresses, resulting in a decline in the overall insulation performance of the transformer which affects the stable operation of the entire power grid [3,4]. Therefore, timely and accurate assessment of the aging state of the oil-paper insulation system inside the transformer to realize the non-destructive testing of the transformer is of great significance.
At present, the main methods for evaluating and analyzing the aging state of oil-paper insulation in transformers include the degree of polymerization (DP) method, physical and chemical analysis method, dielectric response method, spectroscopy method, and so on. Although the DP method and the physical and chemical analysis method have high test accuracy, the possibility of field application is limited because it is a destructive experiment and the test process is complex [5]. The dielectric response method has received widespread attention at home and abroad because of its advantages such as non-destructive testing. For example, recovery voltage method (RVM), polarization and depolarization current (PDC) and frequency-domain spectroscopy (FDS). Compared with RVM and PDC, FDS has stronger anti-interference ability and richer signal information, which is more suitable for field detection [6]. References [7,8,9] show that the aging of oil-paper insulation is mainly reflected in the low frequency band of FDS. As the aging degree deepens, the dielectric loss tangent tanδ gradually increases, and it does not change much in the high frequency band. In Reference [10], the FDS characteristic curve of oil-paper insulation was studied, and the aging characteristic parameters were extracted by combining the finite element model and Havriliak-Negami equation. The author in [11] decomposed the FDS of oil-paper insulation by second-order conductance, investigated the conductance, polarization and aging relationship, and extracted the aging characteristic quantities. FDS is still in the state of roughly evaluating the aging degree in the aging diagnosis of oil-paper insulation, and it is expected to realize the quantitative evaluation of the aging process with the deepening of subsequent research.
Spectroscopy has also been applied to the field of oil-paper insulation by scholars at home and abroad due to its advantages of being fast, nondestructive, and showing good reproducibility, among which Raman spectroscopy shows great potential in the field of oil and paper insulation aging diagnosis due to its ability to obtain the characteristic information of the target molecules through a very small amount of samples [12]. References [13,14,15] verified the feasibility of Raman spectroscopy in the diagnosis of oil-paper insulation aging and preliminarily analyzed the relationship between the characteristic peaks of Raman spectroscopy and the aging characteristics of oil-paper insulation. The authors in [16] used linear discriminant analysis to extract the aging characteristic quantities in Raman spectra of oil-paper insulation and established the relationship between Raman spectral characteristics and transformer aging. Based on the Fisher algorithm and random forest algorithm, the aging diagnosis model of oil-paper insulation based on Raman spectroscopy was established in [17]. Although some scholars have gradually used the Raman spectroscopy characteristics of insulating oil to diagnose the aging state of oil-paper insulation system, the Raman spectroscopy diagnosis technology of oil-paper insulation aging still has much room for improvement compared with the development and application of other traditional technologies.
Based on this, this paper proposes a method for evaluating the aging of oil-paper insulation by combining Raman spectroscopy and frequency-domain dielectric spectroscopy. Firstly, oil-paper insulation samples with different aging degrees were prepared by accelerated thermal aging in the laboratory. Secondly, the dielectric properties and Raman spectral characteristics of these samples were tested, and the dielectric characteristics and Raman spectral characteristics sensitive to aging were extracted and analyzed. Finally, the gray neural network was used to establish an evaluation model of the degree of polymerization of insulating paper combined with Raman spectral characteristics and frequency-domain dielectric characteristics, and the validity of the model was verified by the test set.
2. Materials and Methods
2.1. Experimental Setup and Procedure
Based on the IEEE standard, this paper uses Karamay 25 # naphthenic mineral oil (PetroChina Company Limited, Karamay, Xinjiang, China) and 0.2 mm ordinary kraft paper (Shanghai Paper Industry Co., Ltd., Shanghai, China) for the accelerated thermal aging test to obtain aging samples at different stages. According to the previous research of our research group, the oil-paper ratio is set to 10:1 [18,19]. The accelerated thermal aging test process of oil-paper insulation samples is as follows: Firstly, kraft paper and insulating oil were dried for 48 h under vacuum conditions of 90 °C and 50 Pa, respectively. Then, the paper was immersed into the dried oil and dried for 24 h under vacuum conditions of 60 °C and 50 Pa. Subsequently, the dried sample was subjected to accelerated thermal aging test of oil-paper insulation at 130 °C. The sampling time points mainly included aging days 0, 5, 10, 15, 20, 25, 30, 35 and 40. To ensure the statistical reliability of the experimental results and effectively distinguish aging-induced variations from random sample-to-sample differences, 20 independent parallel oil-paper insulation samples were prepared and tested at each aging time point (0, 5, 10, 15, 20, 25, 30, 35, and 40 days). Data visualization and plotting were performed using Origin 2018 (OriginLab Corporation, Northampton, MA, USA). Model establishment and the LightGBM algorithm were implemented using MATLAB R2019b (MathWorks Inc., Natick, MA, USA).
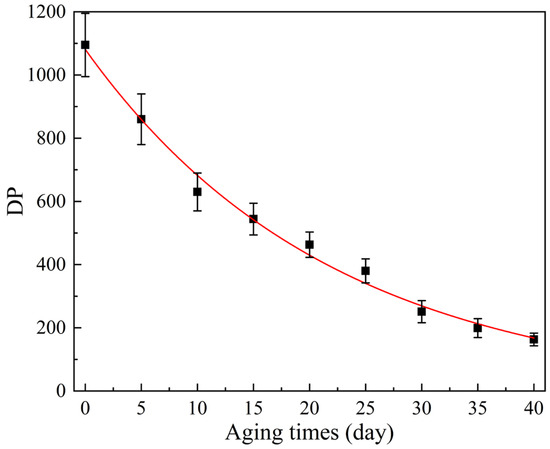
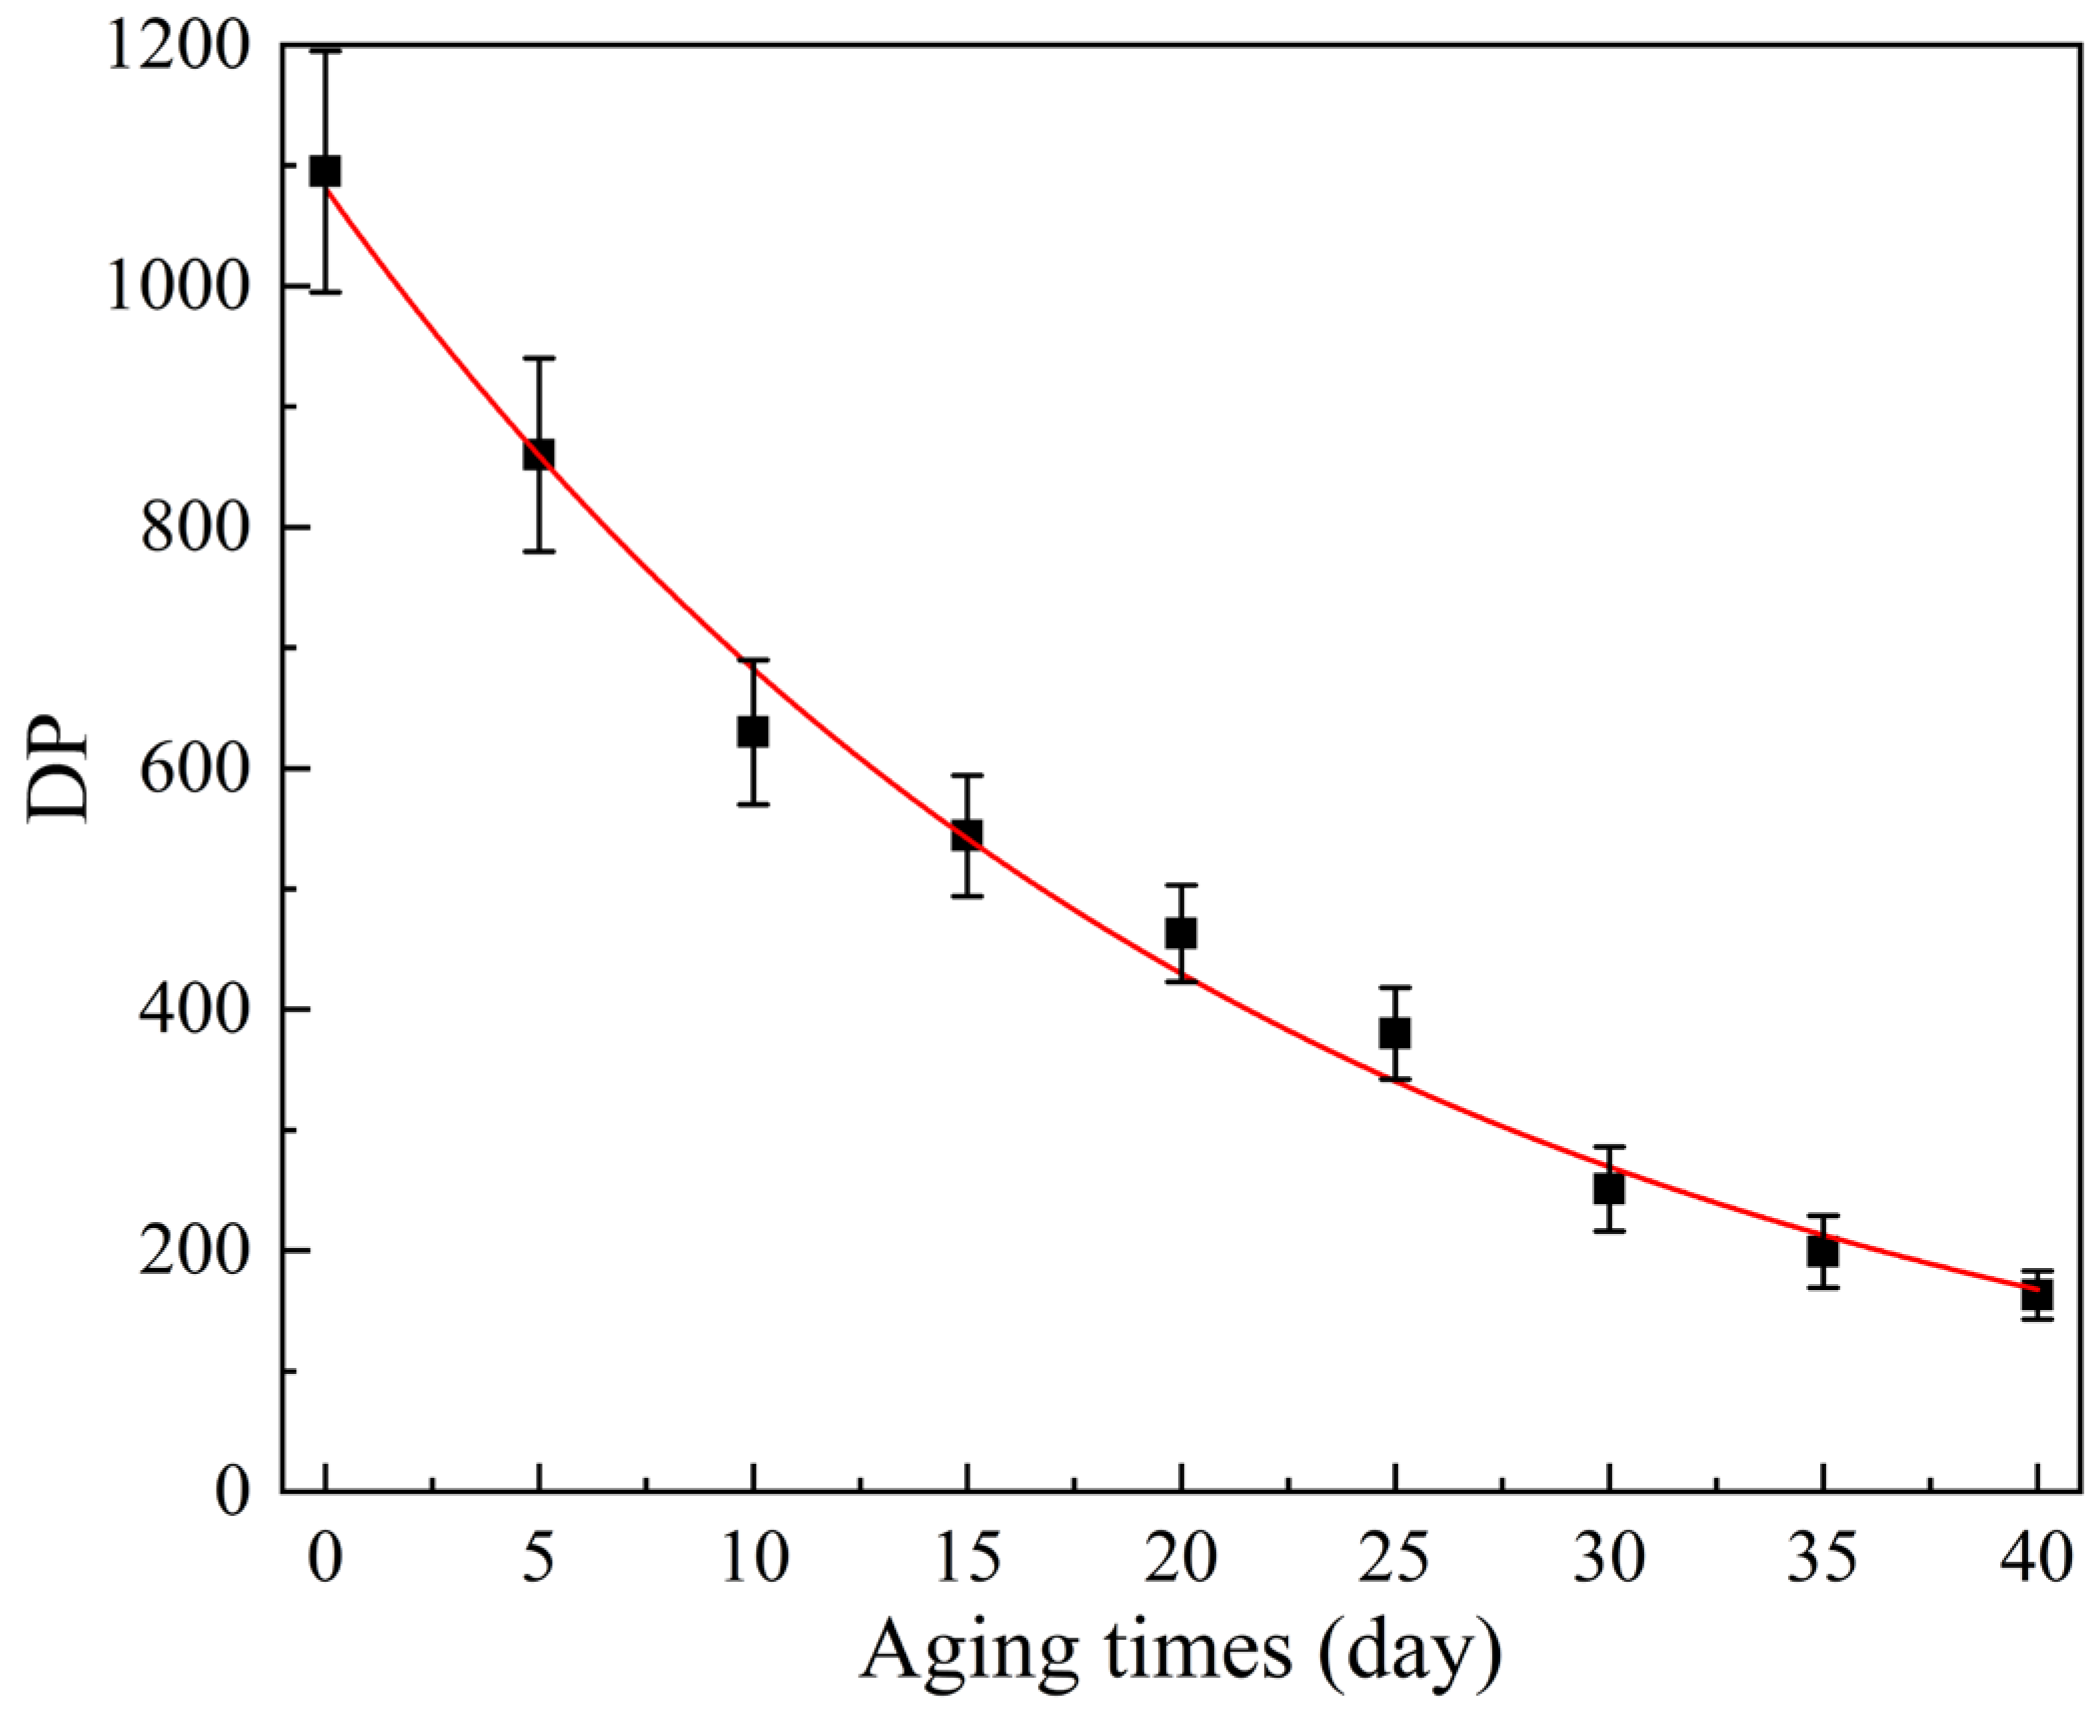
The pyrolysis, hydrolysis and chemical reaction of oil-paper insulation samples during aging are attributed to the breakage of long cellulose chains [20]. The degree of polymerization of insulating paper is an important indicator to characterize the aging state of transformers. In this paper, the degree of polymerization of insulating paper samples was tested according to GB/T 29305. The variation in the degree of polymerization of samples with aging time in the experiment is shown in Figure 1.
Figure 1.
Changes in DP of samples during aging.
It can be seen from Figure 1 that the DP of insulating paper decreases with the increase in aging time, and the rate of decline is faster in the early stage of aging and slower in the later stage. In order to better study the aging of oil-paper insulation, domestic and foreign scholars mainly put forward the zero-order kinetic model, the second-order kinetic model and the degree of polymerization cumulative loss kinetic model of the oil-paper insulation aging kinetic model [21]. The cumulative loss kinetic model of DP has more clear physical meaning than the zero-order and second-order kinetic models. The expression is
where ω the degradation state of insulating paper, DPt is the DP of insulating paper at time t, λ is the ability of DP to degrade savings, k is the degradation rate of insulating paper and DP0 is the initial degree of polymerization of insulating paper. In this study, DP0 = 1114. The red line in Figure 1 is the fitted curve of the change in the degree of polymerization of the sample during the aging process, with R2 = 0.99. According to the fitted curve, the kinetic model of the cumulative loss of DP of oil-paper insulation samples in this study can be obtained as follows:
From Formula (2), it is easy to know that λ = 0.9825, k = 0.0506. The aging of the samples in the experiment conforms to the aging law of oil-paper insulation. The obtained samples with different aging degrees are suitable for subsequent Raman spectrum analysis and frequency-domain dielectric spectrum analysis.
2.2. Raman Spectrum
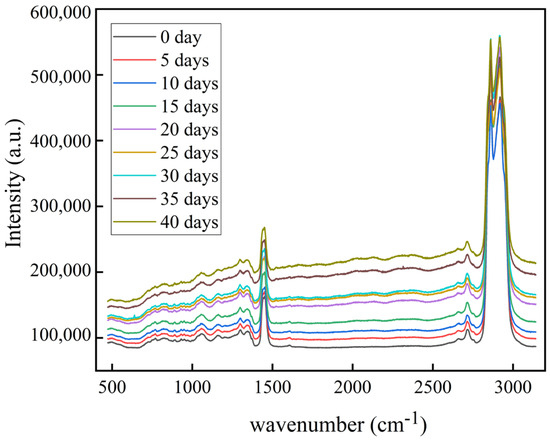
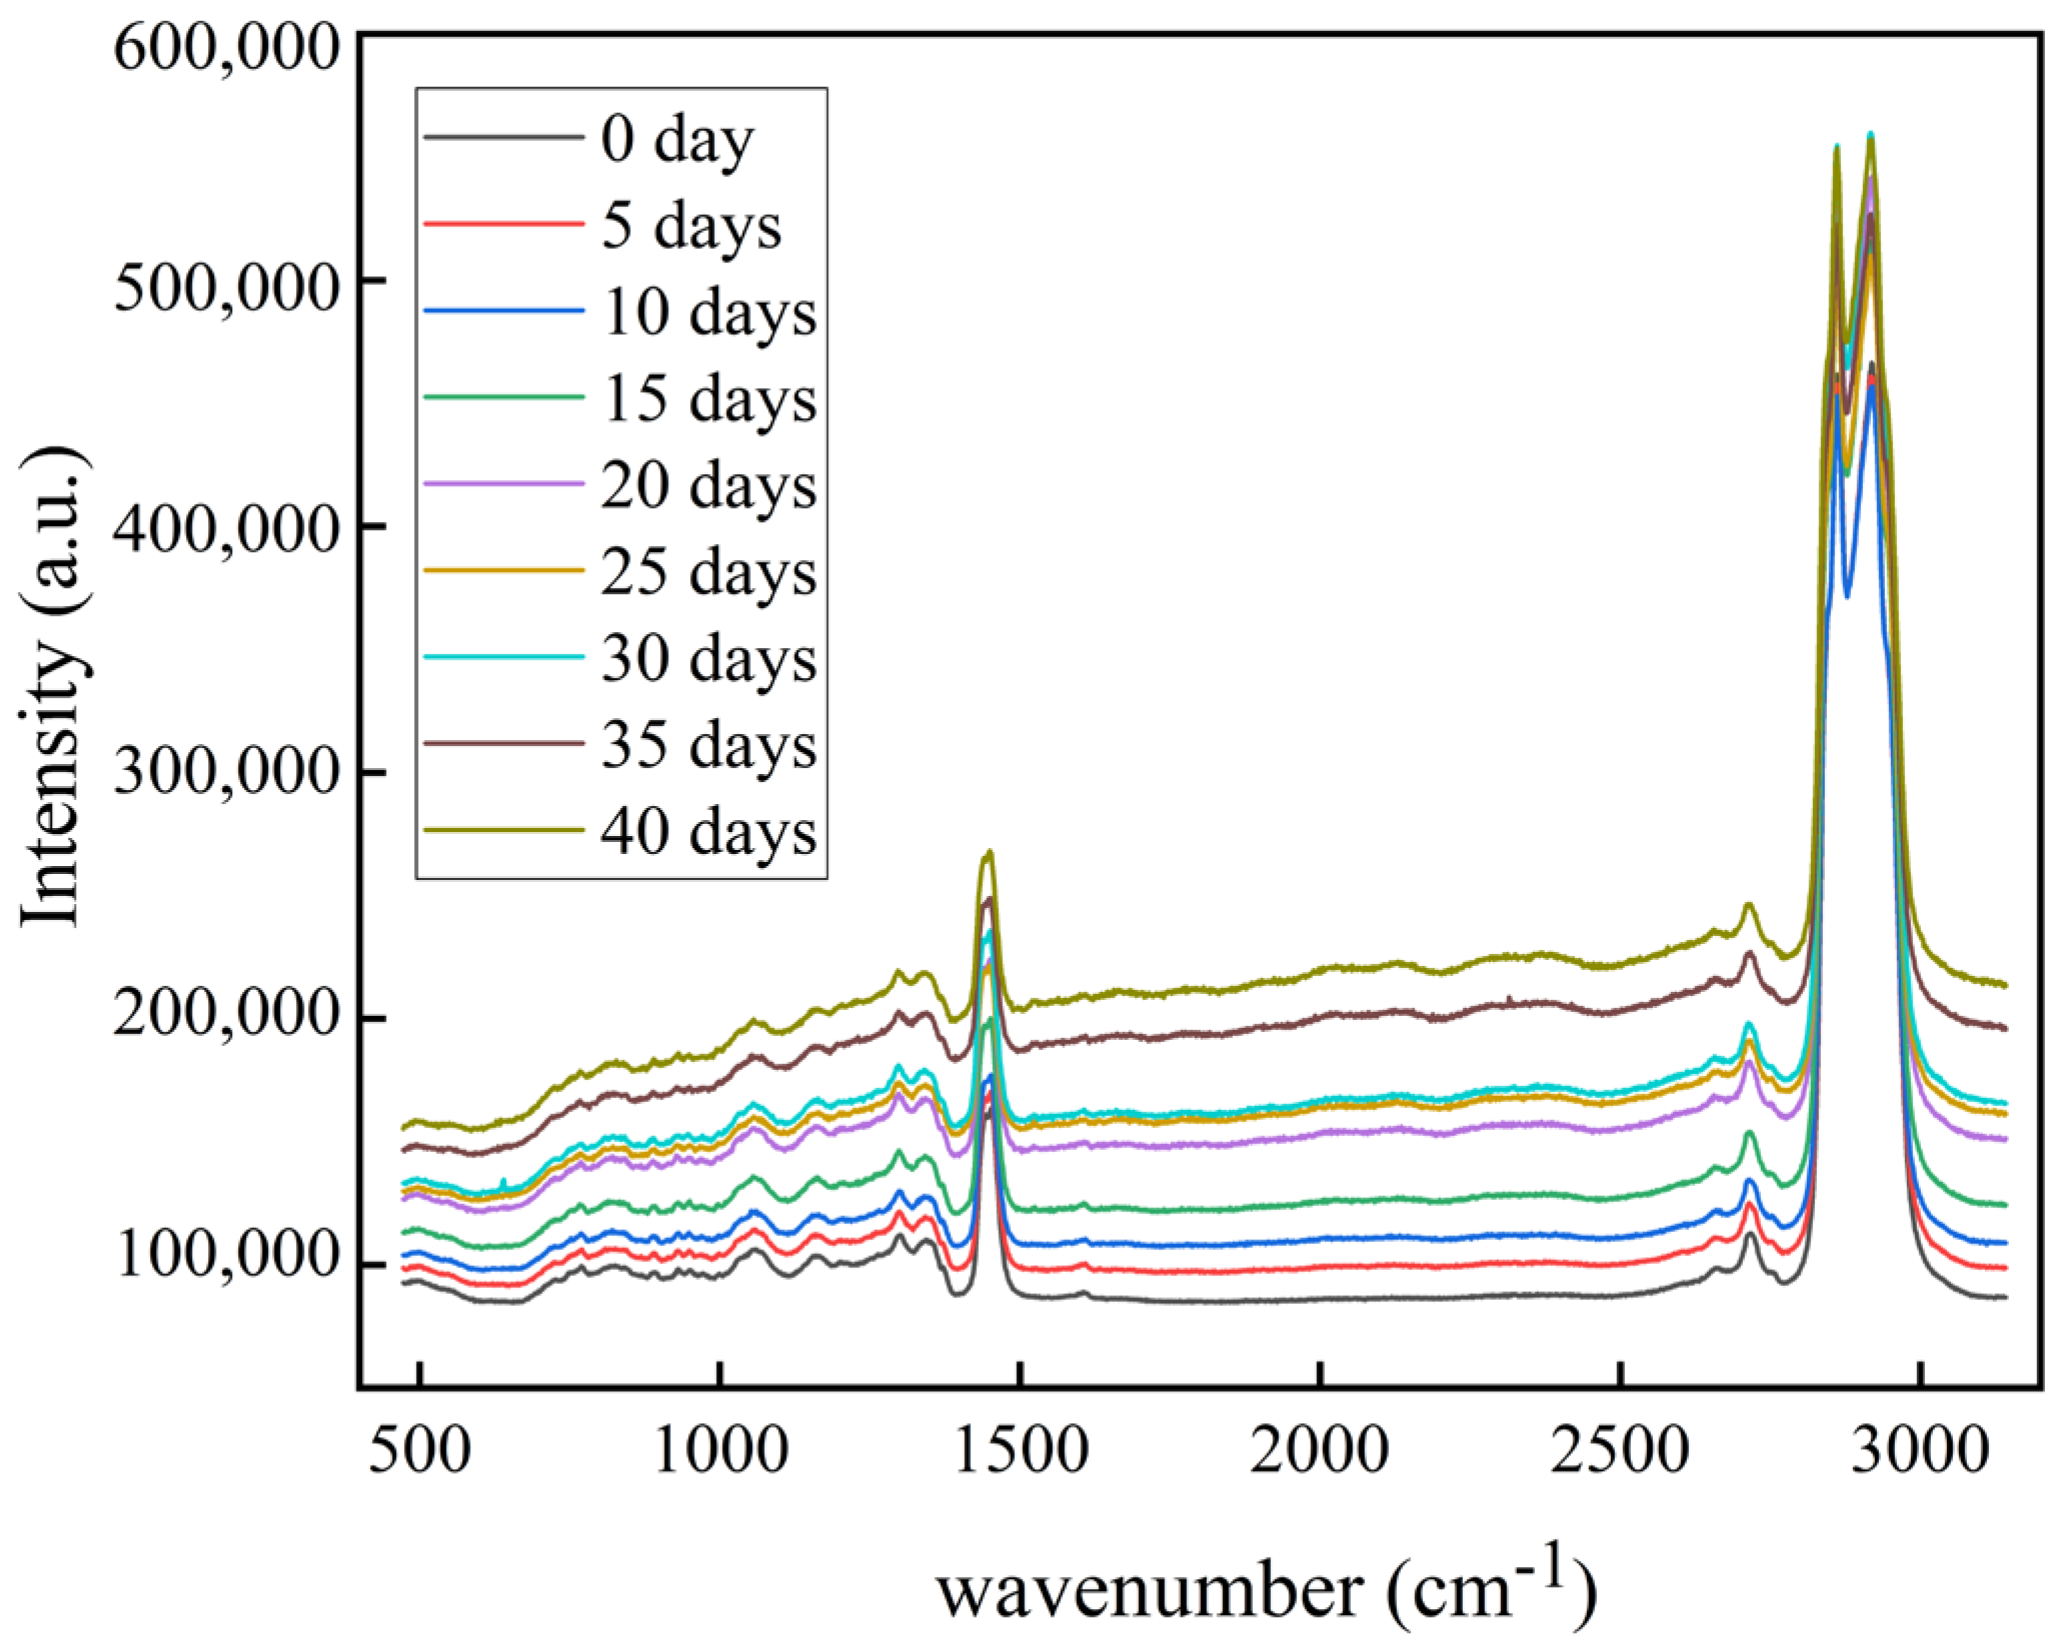
The Raman spectroscopy detection system (Beijing Zhuoli Hanguang Instrument Co., Ltd., Beijing, China) used in this study mainly includes five parts: laser (785 mm, 250 mW), spectrometer, charge coupled device (CCD), microscope and optical module. The Raman scattering signal of the laser focusing on oil samples is collected in real time by the microscope, spectrometer and CCD and saved for analysis by computer. In order to obtain the Raman spectrum signal, which can better characterize the aging characteristics of oil, the spectral region is set to 800~3000 cm−1, the laser intensity is 250 mW, and the integration time is 0.3 s. In order to reduce the influence of the spectrometer and external environment on the test results, all samples were measured ten times during the test, and the average value was taken as the final Raman spectrum. Figure 2 shows the Raman spectra of transformer oil with different aging times.
Figure 2.
Raman spectra of samples at different aging times.
It can be seen from Figure 2 that with the increase in aging time, the change in the Raman spectrum of transformer oil is mainly reflected in the baseline and characteristic peaks. As far as the baseline is concerned, the baseline increases with the deepening of aging. The aging products of oil-paper insulation are mostly organic matter (such as furfural, organic acid, etc.), and the organic matter in the oil gradually increases with aging. The carbonyl and vinyl groups in the organic molecules will absorb photons in the ultraviolet region, which makes the absorption of the organic molecules shift to a longer wavelength, resulting in the absorption range of the oil-paper insulation sample extending to the visible light region, which also leads to the aging of the insulating oil with a fluorescent background; the longer the aging time, the stronger the fluorescent background. The baseline not only contains the fluorescence background caused by the aging product but also contains a large number of interference signals. Therefore, the baseline does not increase monotonically, and the aging diagnosis of oil-paper insulation cannot be performed only by the baseline. As far as the characteristic peaks are concerned, with the change in aging time, there is no formation of new characteristic peaks or the disappearance of the original characteristic peaks, only the change in the existing characteristic peaks. During the aging process of oil-paper insulation, organic matter will undergo an oxidation reaction and related chain reaction in insulating oil. The Raman peaks in 1400~1500 cm−1 are mainly due to the bending vibration of the C–H bond and the stretching vibration of the C=O bond, and the Raman peaks in 2700~3000 cm−1 are mainly due to the stretching vibration of the C–H bond. These are the embodiment of oil-paper insulation aging in insulating oil. In addition, the Raman spectrum characteristic peaks of oil-paper insulation at other wave numbers also changed partially, so the full spectrum of Raman spectrum is rich in the aging information of oil-paper insulation samples.
2.3. Frequency-Domain Spectroscopy
In this study, the Concept 80 broadband dielectric spectrum test system (Novocontrol GMBH, Montabaur, Germany) was used to test the frequency-domain dielectric spectrum of the samples prepared in this paper at room temperature (26 °C). In the frequency range of 10−2~106 Hz, the dielectric loss of aged oil-paper insulation samples was measured. The current I*(ω) through the aged oil-paper insulation sample can be obtained by applying an AC voltage with an angular frequency to the sample under the 30 mm gold-plated electrode. I*(ω) can be written as
where C*(ω) is a dielectric complex capacitance that characterizes the electrical properties of oil-paper insulation samples, denoted as
where C0 is a vacuum capacitor, ε′(ω) characterizes the polarization intensity of dielectric c material under electric field, ε″(ω) characterizes the loss (polarization loss and conduction loss) of dielectric materials under electric field, and ε′(ω) and ε″(ω) correspond to the real and imaginary parts of the complex dielectric constant ε*(ω), respectively. The dielectric loss factor tanδ can be expressed as the ratio of ε″(ω) to ε′(ω), namely tanδ = ε″(ω)/ε′(ω).
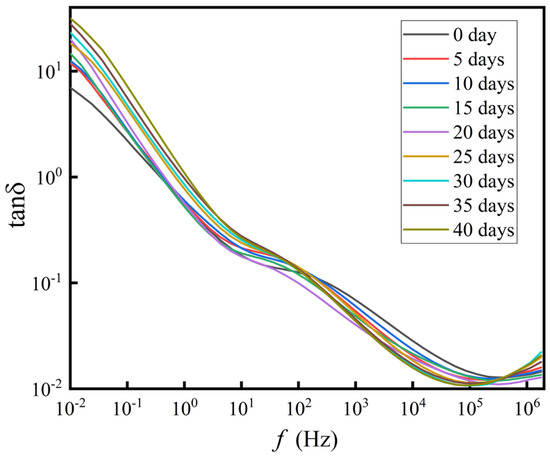
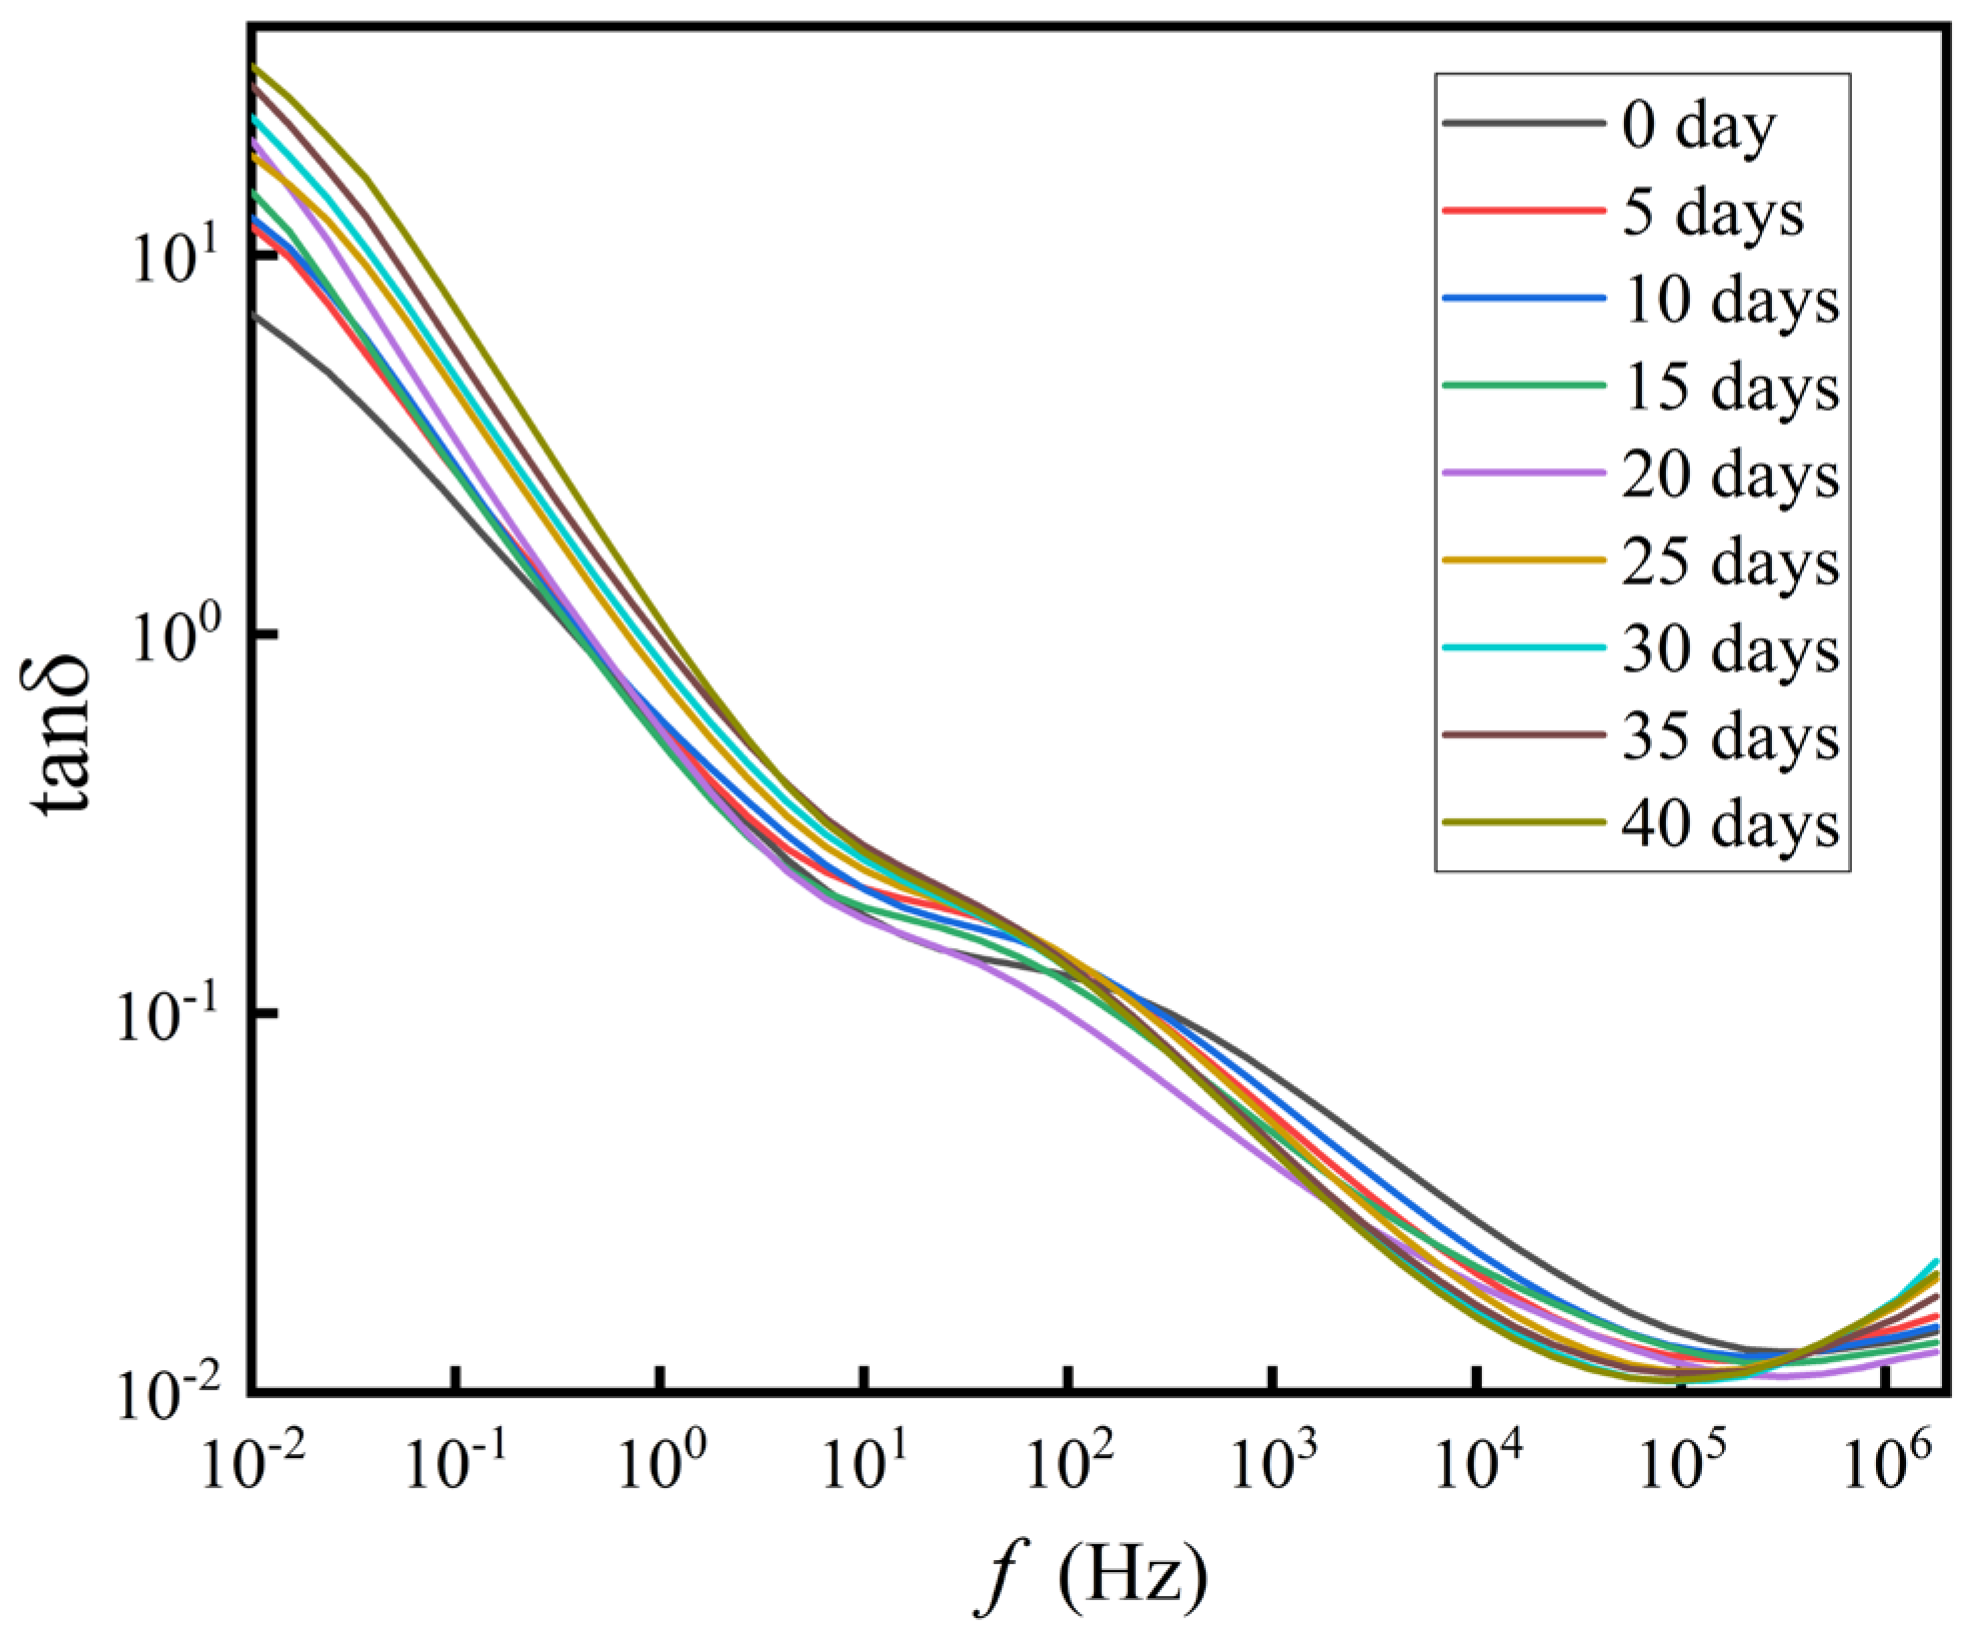
The main component of insulating paper is α cellulose formed by a large number of D-pyranose linked by 1,4-β-glycosidic bonds. Since the 1,4-β-glycosidic bond is an acetal bond, it will break under the action of heat, acid, oxygen and other stresses, resulting in glucose, water, CO, CO2 and organic acids, so the aging degree of insulating paper can be characterized by cellulose fracture. Figure 3 describes the relationship between tanδ, aging degree and test frequency of oil-paper insulation samples.
Figure 3.
tanδ of oil-paper insulation samples with different aging degrees.
It can be seen from Figure 3 that in the low frequency band, as the aging degree deepens, the tanδ of the oil-paper insulation sample also increases, while in the middle frequency band and high frequency band, the change is small. This is because there is a small amount of air in the experimental device. During the accelerated thermal aging process, the cellulose in the insulating paper breaks and produces aging products such as trace water and organic acids, which in turn accelerate the degradation of cellulose. In this process, charged particles that can move directionally under the action of an electric field are generated, resulting in an increase in the conductivity of the oil-paper insulation sample. Under the action of thermal stress, the interaction force within the molecule is weakened, which leads to the formation of more oil-paper interfaces. Due to the presence of carriers and dipoles, the loss in the low frequency band is aggravated and a strong low frequency dispersion effect occurs, which makes the tanδ of the oil-paper insulation sample increase with the deepening of the aging degree. In the middle and high frequency bands, due to the increase in frequency, the polarization begins to lag behind the change of electric field, the relaxation polarization cannot be established, and the polarization loss decreases, resulting in the decrease of tanδ with the increase in frequency, resulting in the tanδ difference of oil-paper insulation samples with different aging degrees in the middle and high frequency bands.
3. Results and Discussion
3.1. Raman Spectroscopic Analysis of Oil-Paper Insulation Aging
Insulating oil is a complex mixture. Its Raman spectrum not only contains the aging information of the sample, but also contains some interference signals, which makes it difficult to directly use the original Raman spectrum signal to diagnose and analyze the aging state of the transformer. Therefore, it is necessary to take a certain method to mine the information of Raman spectrum characteristics related to the aging of oil-paper insulation. In the field of Raman spectroscopy diagnosis of oil-paper insulation aging, although the unsupervised feature extraction method can achieve effective feature extraction, this method only considers the characteristics of Raman spectroscopy data itself and does not make full use of the information in Raman spectroscopy that can characterize the aging state of oil-paper insulation. Therefore, this paper uses the LightGBM algorithm to fully extract the Raman spectral characteristics of insulating oil that can reflect the aging of transformers under the supervision of oil-paper insulation aging information.
The essence of LightGBM is the gradient boosting decision tree (GBDT) [22]. In this algorithm, the sample set is assumed to be (xi, yi), where xi is the Raman spectrum of insulating oil and yi is the corresponding aging state of oil-paper insulation. Given the Raman spectrum xi of the input sample, the output FM(xi) is
where hm is the m-th decision tree, M is the number of decision trees, and F0(xi) = 0.
GBDT needs to traverse every feature of each sample in each iterative training, which ensures its excellent performance but also increases the computational complexity. LightGBM is lightweighted by the histogram algorithm, unilateral gradient sampling algorithm and depth-limited growth strategy, which reduce its computational complexity while ensuring its feature extraction ability [23,24].
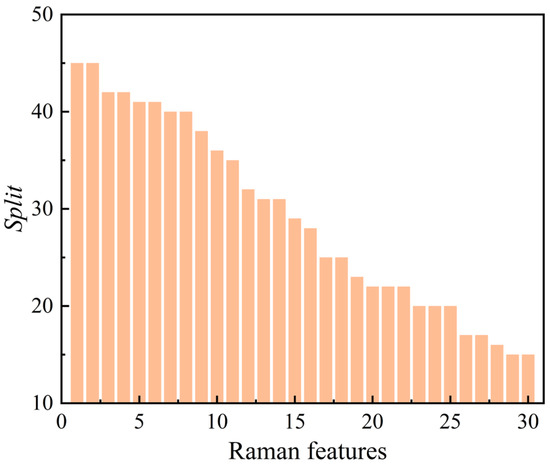
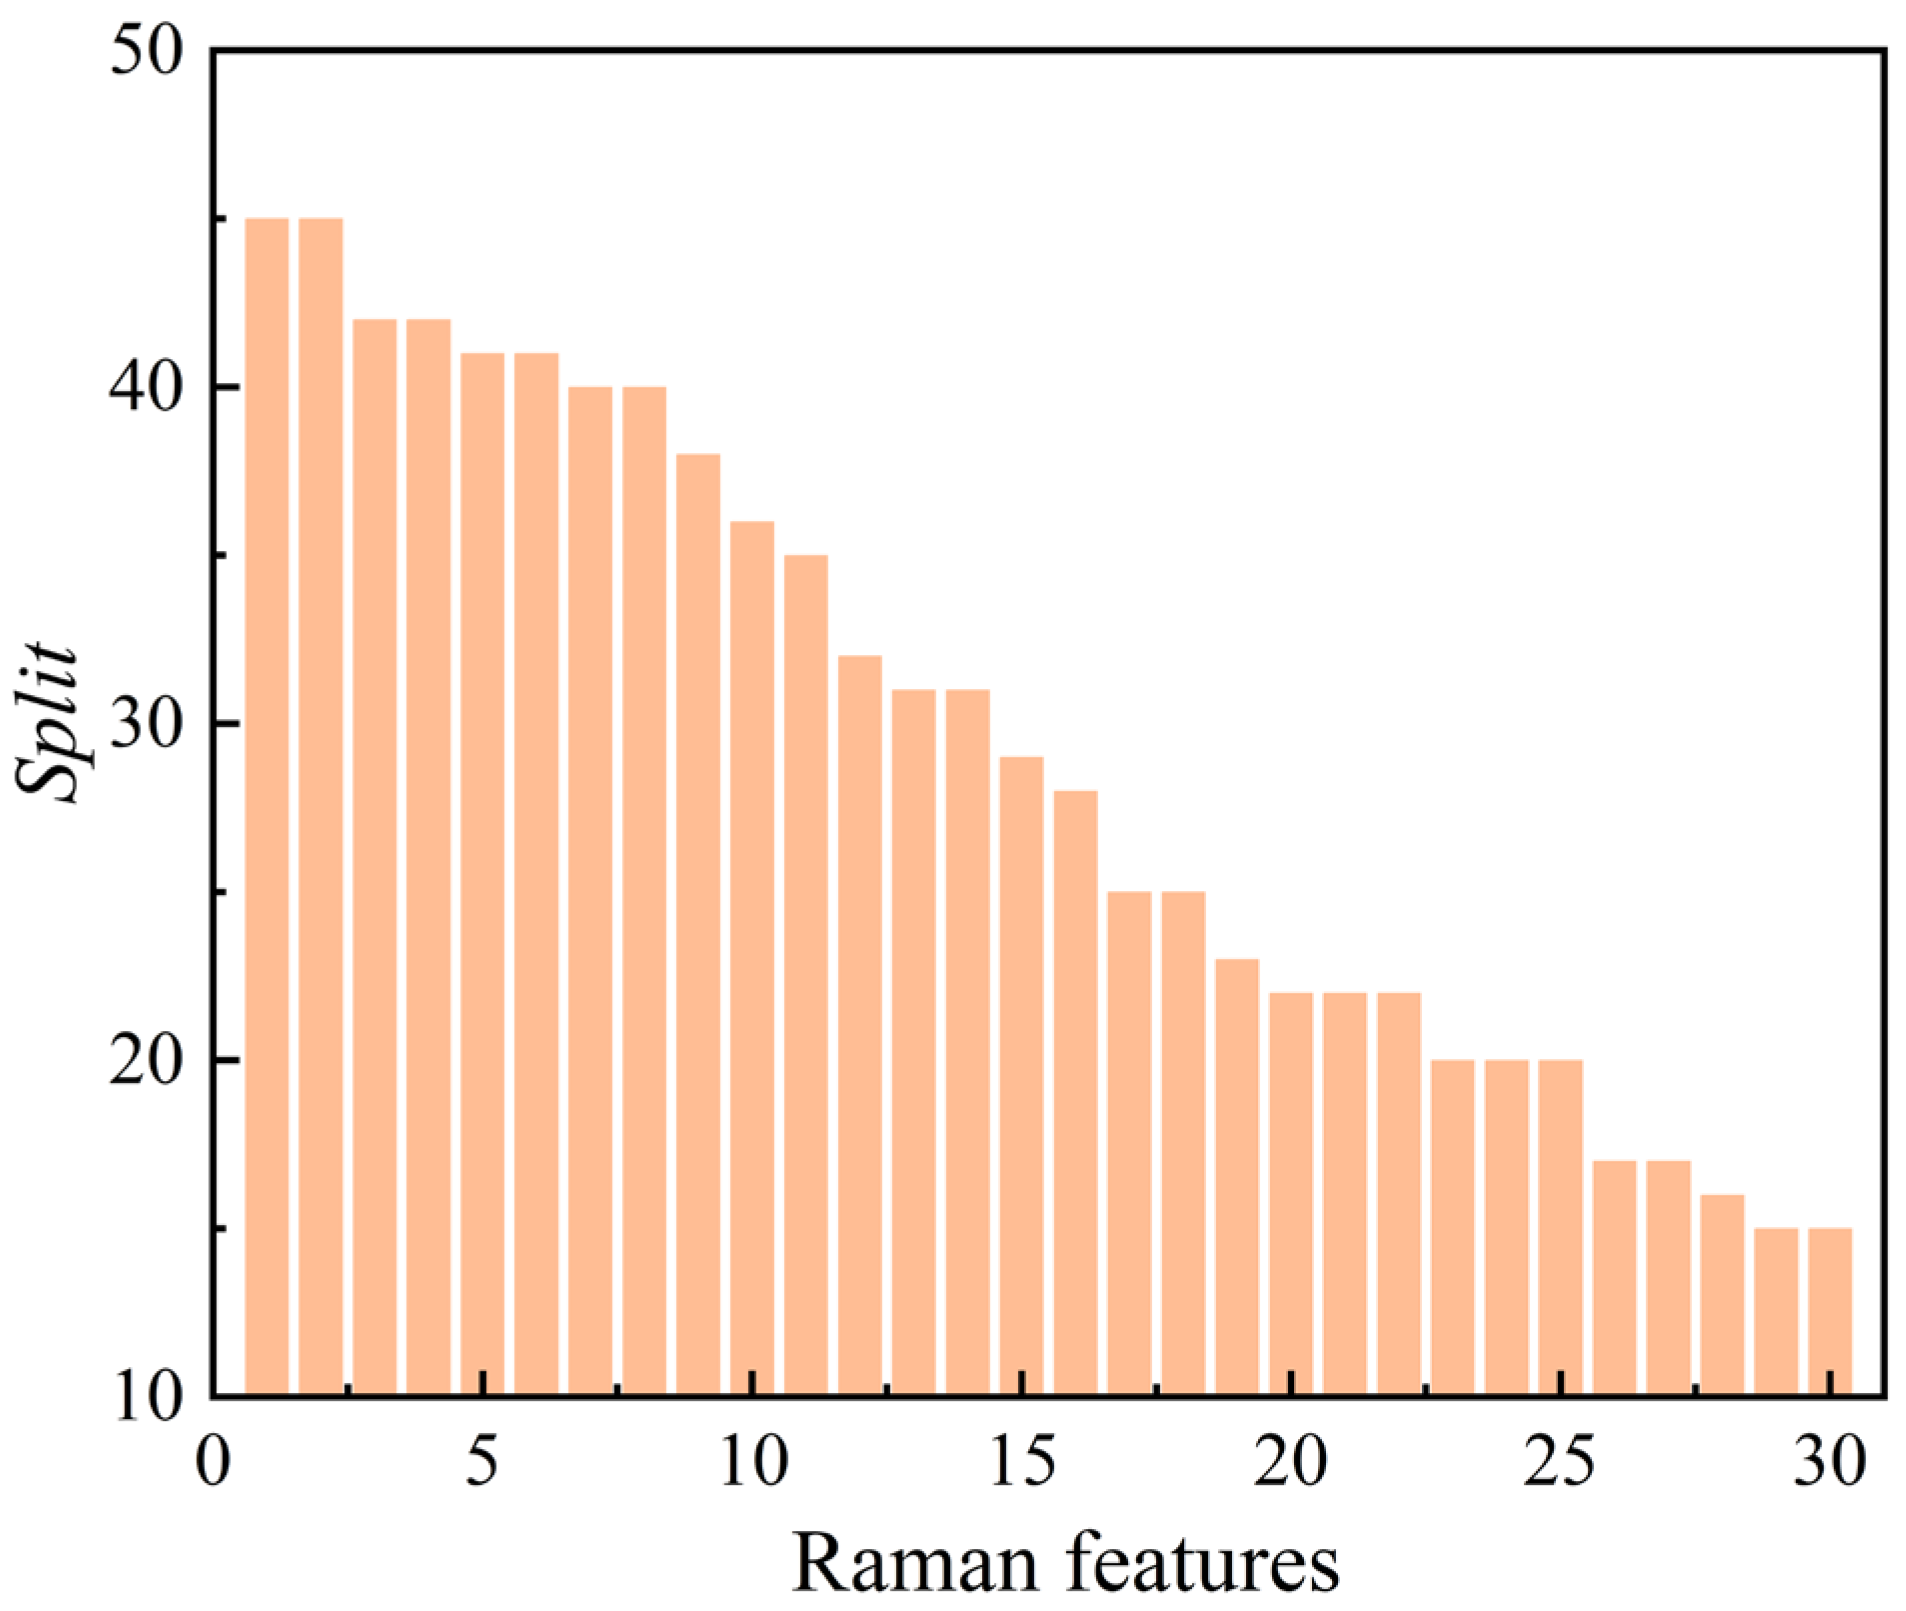
In this paper, the number of splits of each feature in the decision tree is used as an indicator to measure its importance. The larger the value, the more important the feature is. Taking the aging degree as the label, the importance of the Raman spectral characteristics associated with the aging of oil-paper insulation is calculated by LightGBM, and the results are shown in Figure 4.
Figure 4.
The importance of Raman characteristics of oil-paper insulation aging.
To ensure a clear and legible presentation, only the top 30 important features are shown in Figure 4. Among them, the importance of feature 1 and feature 2 is the highest, which correspond to the characteristic peaks of a Raman frequency shift of 1439 cm−1 and 1673 cm−1 respectively. The above two characteristic peaks indicate that C=O and C=C bond vibrations are important bands reflecting the aging products of oil-paper insulation. The features with a split proportion higher than 60% correspond to the top 16 Raman characteristic peaks that are most sensitive to aging changes, which are mainly concentrated in the wavebands of 1350–1700 cm−1 and 2800–3000 cm−1. These wavebands are closely related to the C–H bending vibration, C=O and C=C stretching vibration of aging products and have clear physical and chemical significance for characterizing the aging degree of oil-paper insulation. The former mainly characterizes the C–H expansion vibration modes of various compounds in the oil, and the latter mainly characterizes the C–H bending vibration, C=O expansion vibration modes, etc. The molecular deformation in these two bands mainly reflects the redox reaction of organic compounds during the aging process of oil-paper insulation.
3.2. FDS Analysis of Oil-Paper Insulation Aging
When analyzing the FDS characteristics of oil-paper insulation samples, in order to avoid the human error caused by artificial points and reduce the slight distortion of the curve caused by interference, the dielectric loss tangent integral Stanδ is introduced as the FDS aging characteristic parameter of oil-paper insulation samples. The calculation formula of a is shown in Equation (6).
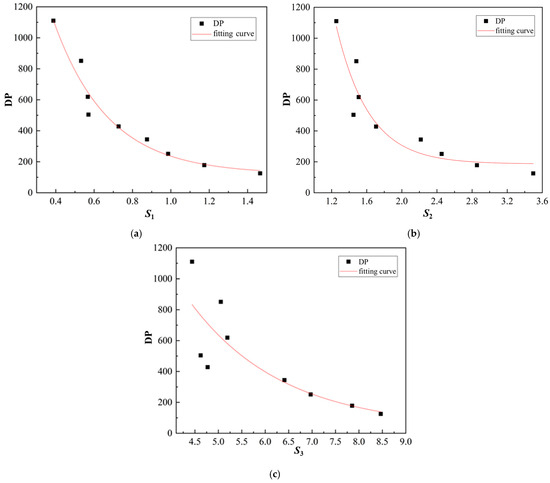
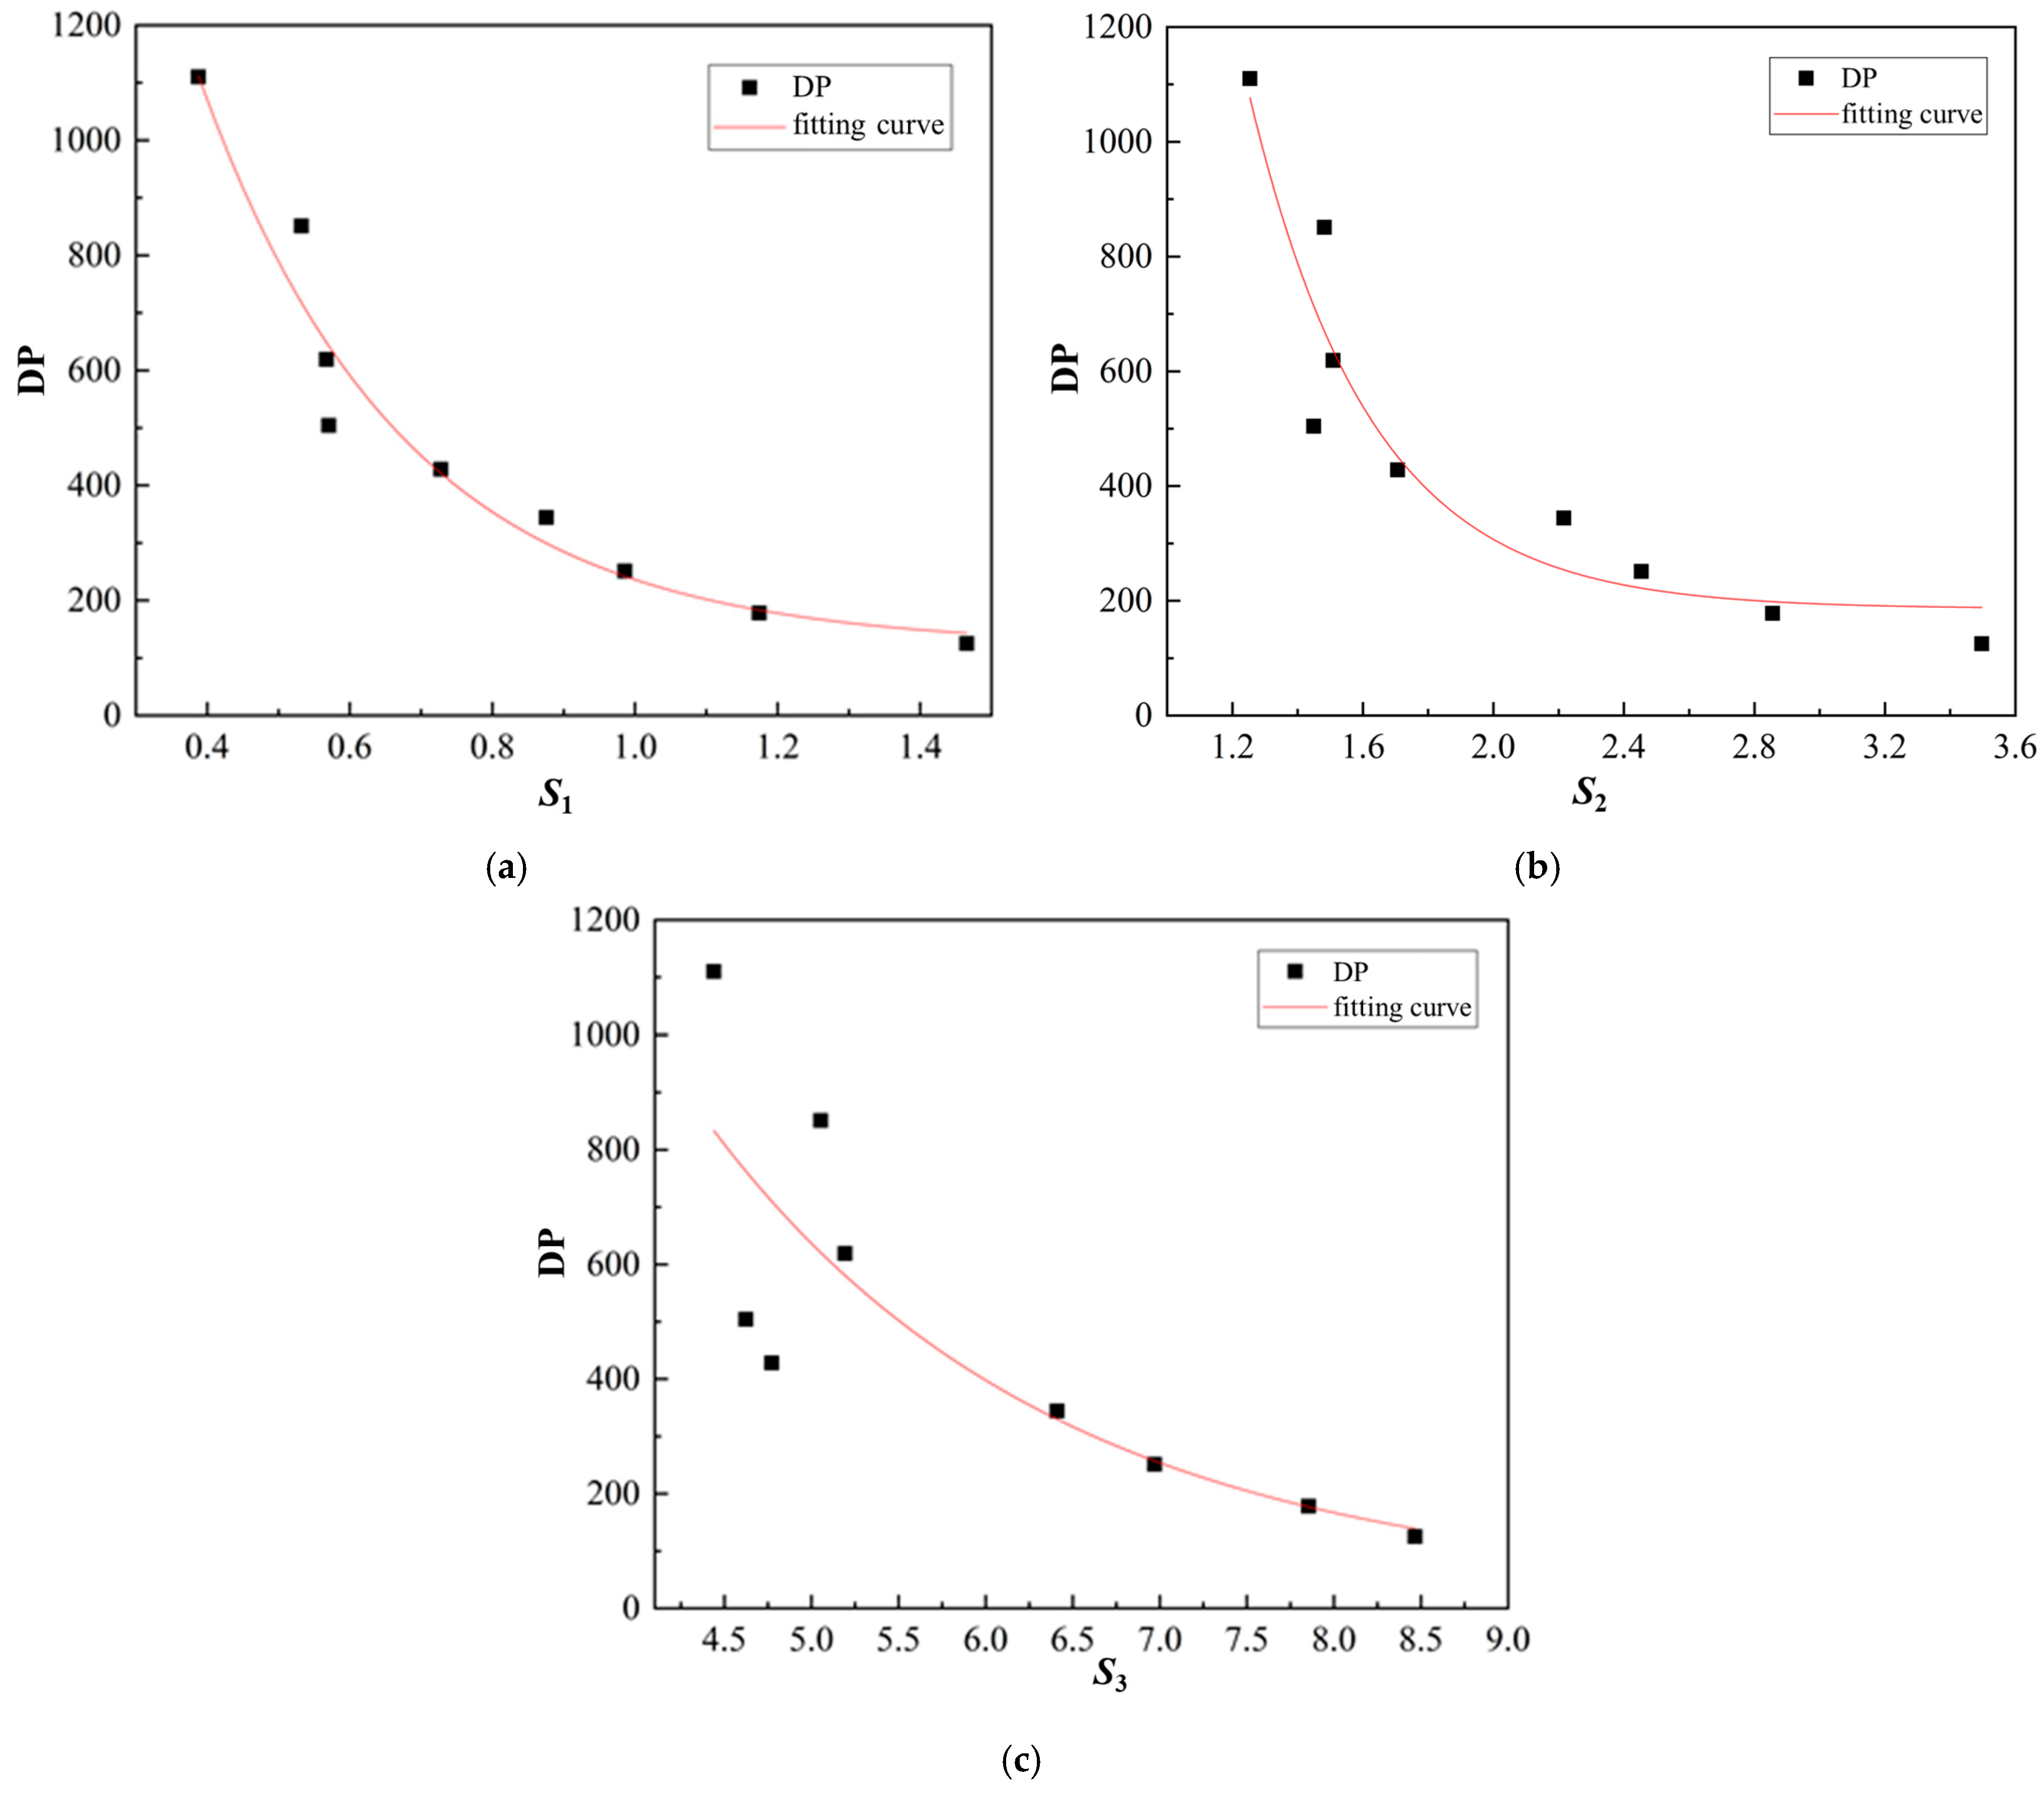
The Stanδ represents the area enclosed by frequency-domain dielectric spectrum tanδ and frequency f. It can reflect the trend of the curve shape of frequency-domain dielectric spectrum tanσ in the corresponding low frequency band, better reflect the difference in frequency-domain dielectric spectrum tanδ of oil-paper insulation samples with different aging degrees, and more effectively characterize the dielectric response characteristics of different aging samples. It can be seen from Figure 3 that the difference in frequency-domain dielectric spectroscopy during aging is mainly reflected in the range of 10−2~101 Hz. Therefore, in this paper, take f0 = 10−2 Hz; f1 respectively takes 10−1 Hz, 100 Hz, and 101 Hz, a total of three frequency bands integral as the FDS characteristic analysis of the three characteristics of S1 (10−2~10−1 Hz), S2 (10−2~100 Hz), and S3 (10−2~101 Hz). Figure 5 and Table 1 show the correlation between FDS aging characteristics and DP of insulating paper.
Figure 5.
Relation between DP and (a) S1, (b) S2, (c) S3.
Table 1.
The fitting function relationship between Stanδ and DP of insulating paper.
It can be seen from Figure 5 and Table 1 that as the DP of the insulating paper decreases, the dielectric aging characteristic parameters increase. This is because in the process of accelerated thermal aging, the polymer chain of insulating paper fiber is broken under the action of thermal stress, which is manifested as the continuous decrease in DP of insulating paper. The structure of insulating paper is more evacuated. At the same time, many polar substances (low molecular acid, furfural, etc.) are produced, which in turn react on the oil-paper insulation material, accelerating its degradation and resulting in an increase in its dielectric loss, which is reflected in the increase in the dielectric aging characteristic parameter Stanδ. In addition, from the fitting function relationship between Stanδ and insulation paper DP given in Table 1, it is easy to observe that Stanδ and insulation paper DP have the best fitting function relationship in the frequency band of 10−2~10−1 Hz.
3.3. Correlation Analysis of Raman Spectrum Features and FDS Features of Oil-Paper Insulation Aging
The power transformer internal oil-paper insulation system gradually ages in the operation process. Among them, insulation paper aging is mainly cellulose in the macromolecular chain breakage; insulation oil aging mainly produces acidic compounds and aldehydes, ketones, and other oxides. The relative dielectric constants of insulating oil and insulating paper satisfy the Kiusius–Mosotti equation.
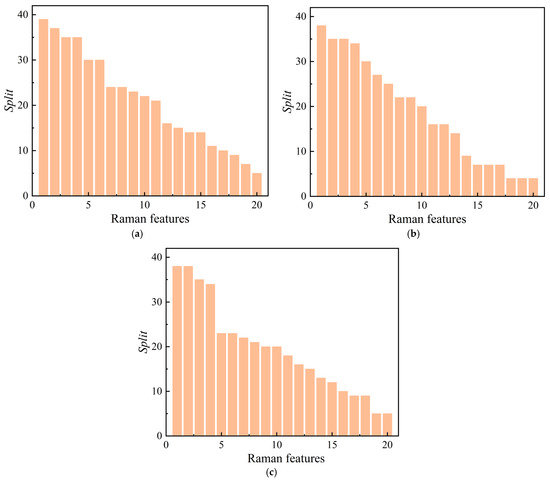
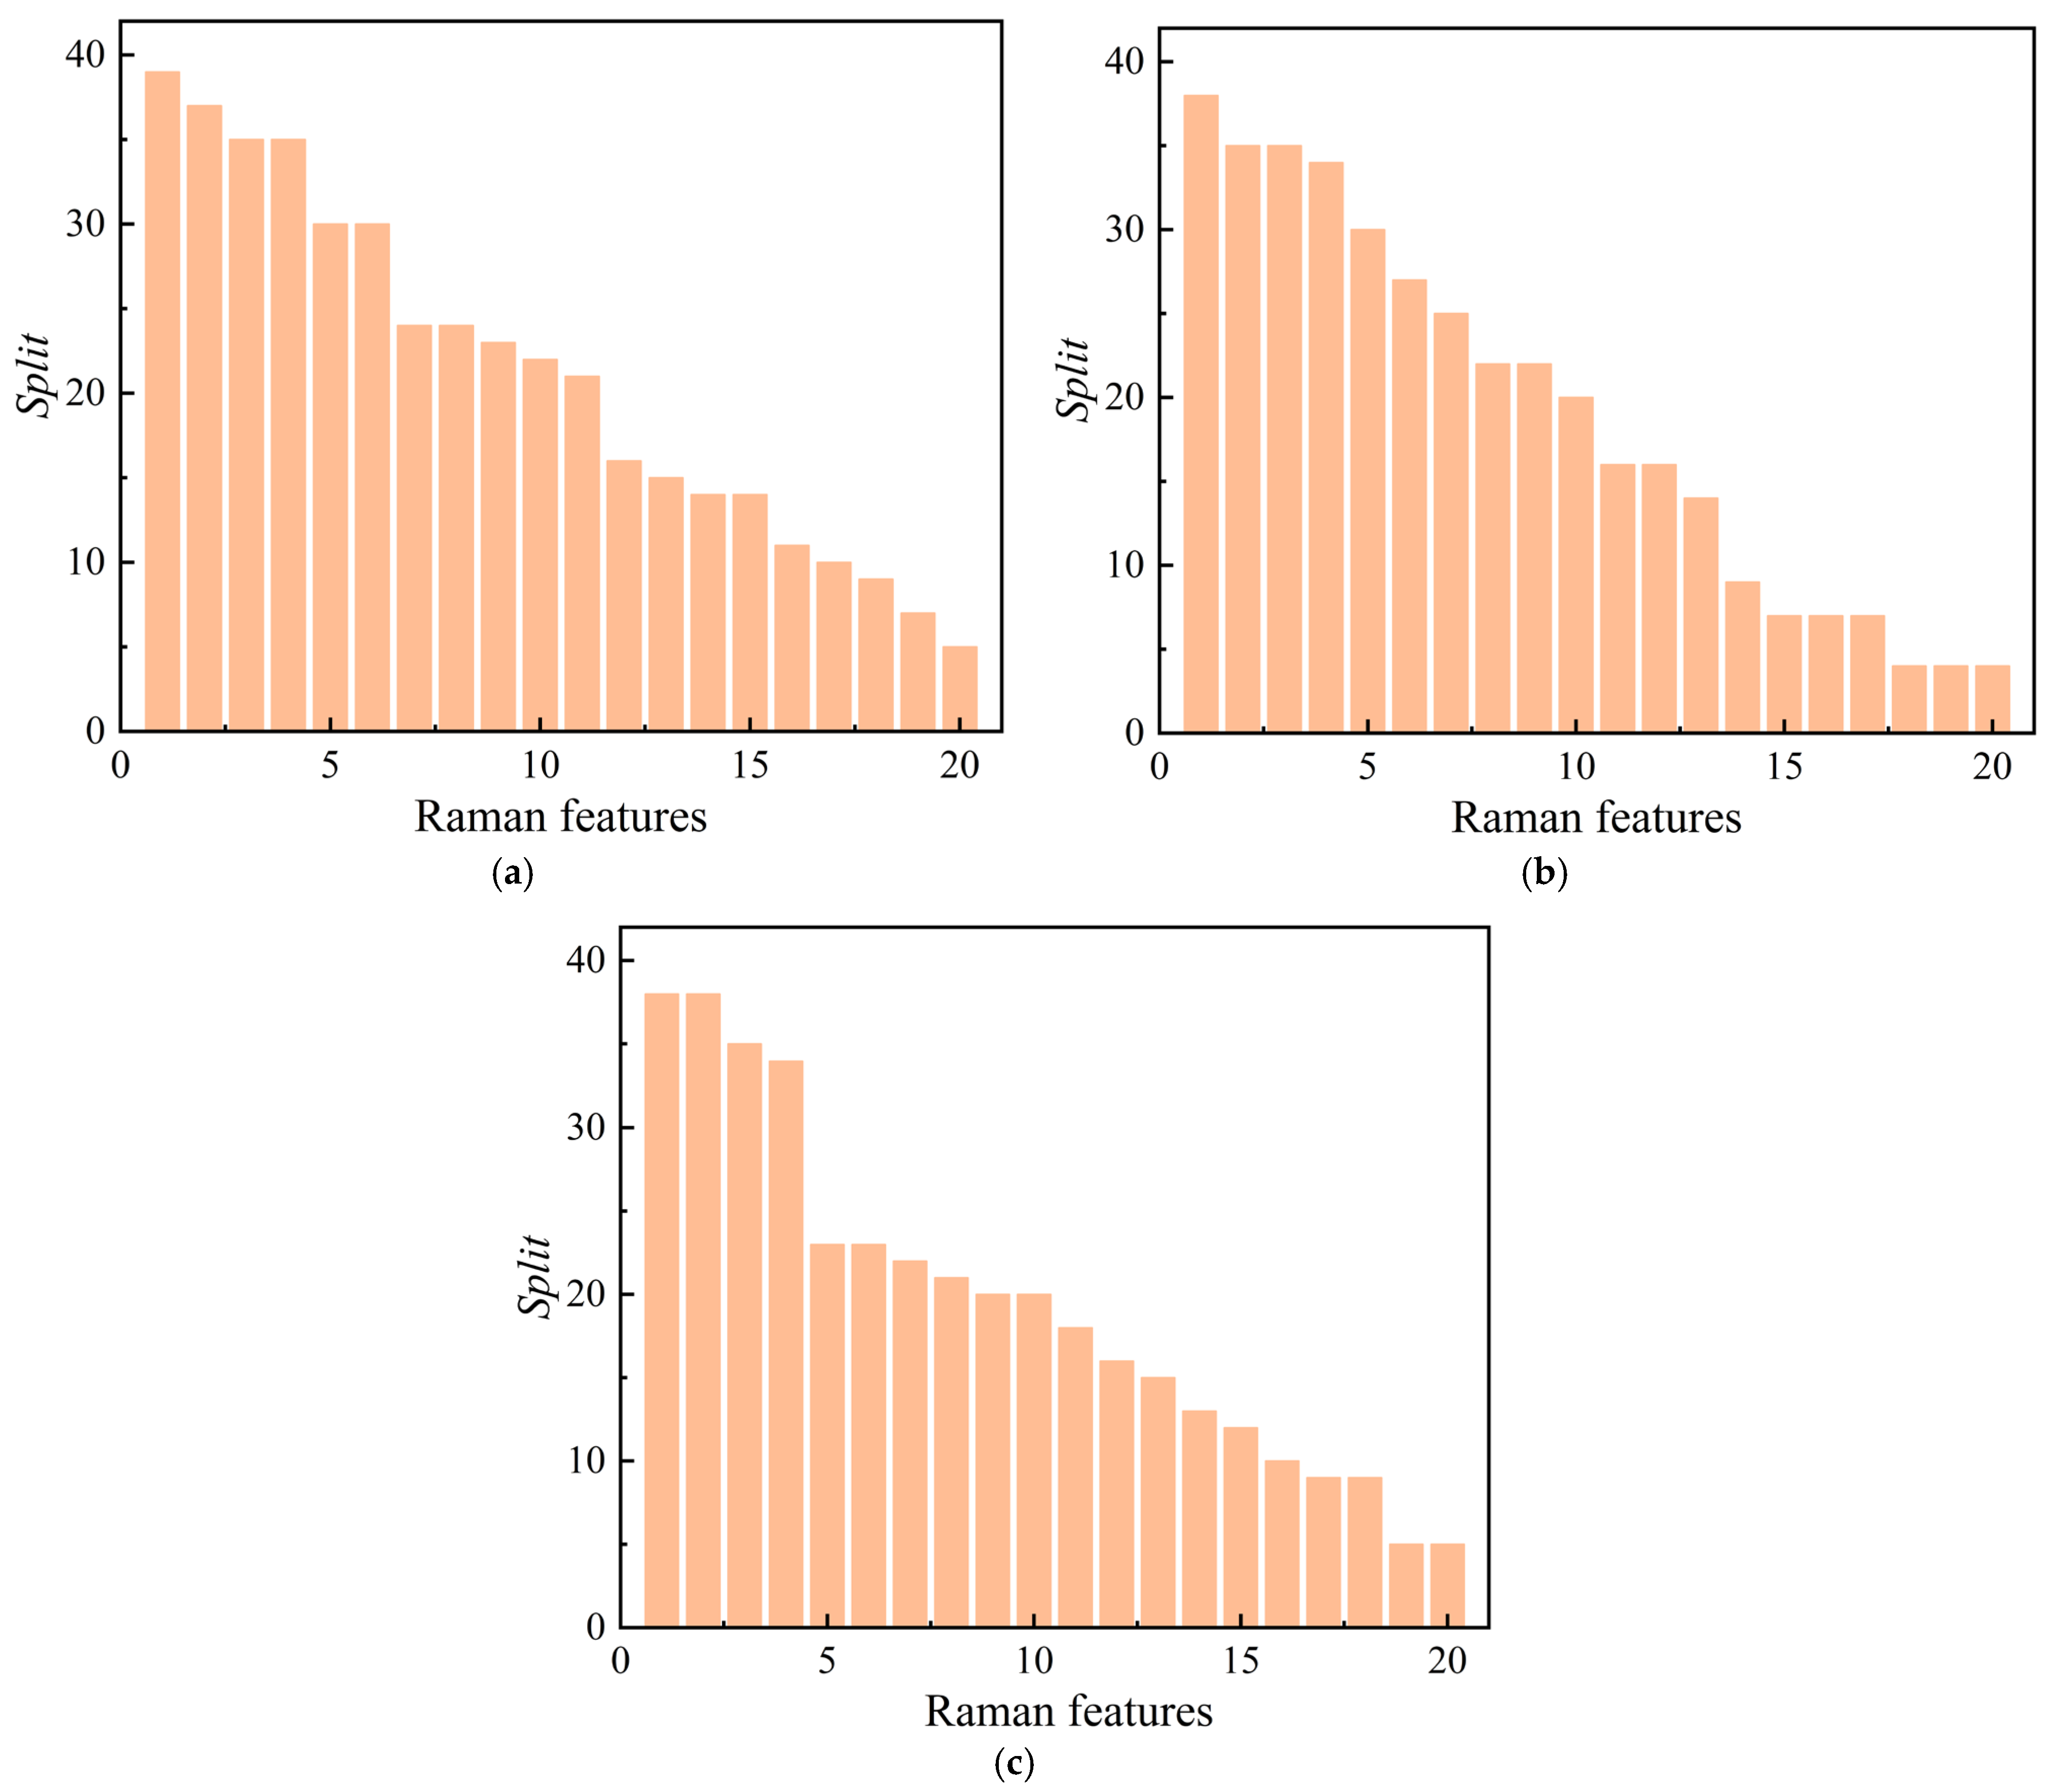
where εr is the relative dielectric constant, ε0 is the vacuum dielectric constant, and N is the number of particles per unit volume within the dielectric and α is the polarization rate. From Equation (7), it can be seen that as the operating time of the transformer is lengthened, the more polar molecules in its internal oil-paper insulation system, the greater the relative dielectric constant of the oil-paper insulation system. In this paper, the correlation between the dielectric aging characteristic coefficients (S1, S2, S3) of insulating paper as labels and the Raman spectral features of insulating oil were evaluated using the LightGBM algorithm and correlation coefficients as shown in Figure 6 with Table 2.
Figure 6.
Relation between dielectric aging characteristic parameters (a) S1, (b) S2, (c) S3 and Raman characteristics.
Table 2.
Relation between dielectric aging characteristic parameters and Raman characteristics.
From Figure 6 and Table 2, it can be seen that a number of 9-dimensional Raman features are highly correlated with FDS features. Among them, the Raman features that are highly correlated with S1 have 6 dimensions, those that are highly correlated with S2 have 5 dimensions, and those that are highly correlated with S3 have 4 dimensions. The Raman characteristics in Table 2 are mainly attributed to the stretching vibration of the C-C bond and the antisymmetric bending vibration of the methyl group. This has a certain correlation with the polar molecules in the oil-paper insulation system. This is also a simple proof of the correlation between Raman features and FDS features.
3.4. Oil-Paper Insulation Aging Diagnosis Based on FDS Features and Raman Features
As can be seen from the previous section, in the diagnosis of oil-paper insulation aging, Raman spectroscopy is based on the functional groups in the oil, and frequency-domain dielectric spectroscopy is based on the polarization loss of the insulating paper. Therefore, it is theoretically feasible to combine the Raman characteristics of insulating oil and the FDS characteristics of insulating paper to improve the accuracy of oil-paper insulation aging diagnosis.
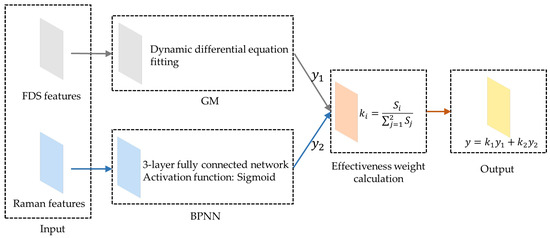
Gray neural network is a hybrid model that combines the gray model with the neural network [25,26]. It not only has the advantages of the gray model to mine the evolution law of original data but also has the excellent nonlinear mapping ability of the neural network. In this study, parallel grey neural network (PGNN) was used to realize Raman spectroscopy diagnosis of oil-paper insulation aging. Its structure is shown in Figure 7.
Figure 7.
Diagram of PGNN structure.
The essence of the gray model is to establish a dynamic differential equation based on the input data to evaluate the change trend of the data itself. The nonlinear prediction ability of the neural network mainly depends on the activation function of neurons, the connection mode of each layer of neurons and the learning algorithm. In this study, a fully connected neuron connection method and a back propagation learning method are used. The activation function is defined as
This study uses the principle of validity to combine the output y1 of the gray model and the output y2 of the neural network [27].
where y is the prediction output of the combined model, and k1 and k2 are the weighting coefficients of the two models.
where S1 and S2 are the effectiveness of the gray model and neural network, respectively. Effectiveness is defined as follows
where E and σ are the mean and mean square error of the At of the combined prediction.
where is the actual value and is the output of the combined model.
In this study, a total of 240 samples were obtained by accelerated aging test, and all samples were divided into four stages according to DL/T 984 (stage I: DP > 500, stage II: 500 > DP > 250, stage III: 250 > DP > 150, stage IV: 150 > DP). The oil-paper insulation aging diagnostic model was established using 210 of these samples, and another 30 samples not involved in the training were used to validate the established model and to ensure that there were samples involved in training and testing at each stage. The specifics of sample classification are shown in Table 3.
Table 3.
Division of accelerated aging samples.
In this study, a transformer aging diagnostic model based on Raman spectroscopy and FDS and combined with PGNN was developed and validated in the MATLAB (2019b) simulation environment.
As shown in Table 1, the FDS features present a clear exponential fitting relationship with the degree of polymerization (DP), which is highly consistent with the advantage of the gray model in capturing monotonic evolution trends. Therefore, the frequency-domain dielectric spectral features (S1, S2, and S3) are used as inputs to the gray model in PGNN. Meanwhile, the relevant literature [13,14,15,16,17,18] has verified that Raman features have a strong nonlinear mapping relationship with the aging state, which is suitable for the powerful nonlinear fitting ability of neural networks. The 16-dimensional Raman spectral features selected in this paper show a highly nonlinear correlation with the aging state of the oil-paper insulation, so they are used as inputs to the neural network in the PGNN. The parallel gray neural network (PGNN) integrates the respective merits of the gray model and neural network to realize the effective fusion of FDS and Raman features. In addition, the output of the model is the degree of aggregation of the corresponding samples, which is denoted as the R-F-PGNN model in this study. Based on this, in this paper, the R-F-PGNN model is trained by the training set and the constructed model is validated using the test set.
In order to further evaluate the performance of the models developed in this paper, three other models are developed for comparative analysis, which are as follows:
- a.
- R-R-PGNN model: It is difficult to measure the FDS of insulating paper in practical engineering applications. Section 3.3 investigates and analyzes the correlation between insulating paper FDS features and insulating oil Raman spectral features. Therefore, the model uses the 9-dimensional Raman spectral features that can characterize the dielectric aging characteristic coefficients of insulating paper in Section 3.3 as inputs to the gray model, as well as the 16-dimensional insulating oil Raman spectral features as inputs to the neural network, to build a PGNN aggregation prediction model to evaluate the aging state of the transformer.
- b.
- FDS model: The model evaluates the aging state of the transformer by measuring the FDS of the insulating paper and obtaining the corresponding DP of the insulating paper using Equation (6) and Table 1.
- c.
- Raman model: The model takes the Raman spectral full-spectrum data of the sample as input and the corresponding DP of the sample as output and establishes a sample DP prediction model based on neural network to evaluate the aging state of the transformer.
The results of the validation of the four different models using the test set of 30 data sets are shown in Table 4.
Table 4.
Quantitative aging diagnosis results of 30 test samples.
It can be seen from Table 4 that the average absolute error of the R-F-PGNN model is 20.4, the average absolute error of the R-R-PGNN model is 31.9, the average absolute error of the FDS model is 57.4, and the average absolute error of the Raman model is 42.5. The errors of the four models are not more than 100, which means that the Raman features and FDS features extracted in this paper are effective reflections of oil-paper insulation aging. Among them, the error of the R-F-PGNN model is the smallest, the error of the FDS model is the largest, and the average absolute error difference between the R-R-PGNN model and the R-F-PGNN model is 11.5. There is no deviation between the aging stage diagnosed by the R-F-PGNN model and the actual aging stage of the sample. In the R-R-PGNN model, the aging stage division of samples 21 and 25 is wrong. In the FDS model, the aging stages of samples No. 10, 12, 14, 21, 23 and 26 are divided incorrectly. In the Raman model, the aging stages of samples No. 9, 12, 22, 24 and 26 are divided incorrectly.
The measurement results of FDS mainly characterize the polarization and conductivity loss characteristics of insulating paper. Although the aging of oil-paper insulation system can be reflected in the FDS curve, the FDS curve is also particularly sensitive to the moisture in the insulating paper. Under the action of thermal stress, a small amount of water will also be produced during the deterioration of insulating paper. The coverage of the degree of polymerization of insulating paper in the later stage of aging is less than 150, which also causes the deviation of the FDS model in the state diagnosis of the later stage of aging. Raman spectroscopy mainly relies on the stretching vibration of microscopic groups and chemical bonds to reflect the information in insulating oil. Unlike FDS, which is susceptible to water, it can effectively use the information of aging characteristic substances in oil to effectively diagnose the aging of insulating oil. As the aging degree deepens, the baseline of the Raman spectrum is higher, so the samples with diagnostic deviations in the Raman model also mainly appear in the late stage of aging. The R-F-PGNN model integrates the microscopic chemical characteristic information of insulating oil from Raman spectroscopy and the macroscopic polarization loss information of insulating paper from frequency-domain spectroscopy, which can compensate for the limitations of single-method evaluation. Specifically, the FDS-only model is easily disturbed by moisture and trace polar products in the late aging stage, while the Raman-only model is affected by fluorescence baseline drift in severe aging. By contrast, the R-F-PGNN model effectively reduces the above interferences and achieves more stable and accurate prediction, especially on the samples where the FDS-only model or Raman-only model shows large errors.
To ensure a comprehensive and objective comparison of model performance, this study further introduces quantitative evaluation metrics including Mean Absolute Error (MAE), Mean Squared Error (MSE), and Root Mean Squared Error (RMSE). These metrics complement the intuitive error values presented in Table 4 by providing a statistical summary of prediction accuracy and stability.
As shown in Table 5, the quantitative evaluation metrics including MAE, MSE, and RMSE are calculated to objectively compare the performance of different models. The R-F-PGNN model achieves the lowest values of MAE (20.43), MSE (659.01), and RMSE (25.67), which are significantly superior to those of the R-R-PGNN, FDS-only, and Raman-only models. The results show that the proposed model not only minimizes the average prediction deviation but also effectively reduces the overall dispersion of prediction errors, thus demonstrating higher stability and reliability.
Table 5.
The calculation results of the evaluation indexes of each model.
The research in this paper shows that the R-F-PGNN model combines the chemical information in the insulating oil and the polarization loss information of the insulating paper macroscopically and reflects the aging state of the oil-paper insulation system more comprehensively. It can be seen from the prediction results of the R-R-PGNN model that the Raman spectral characteristics of the insulating oil can reflect the polarization loss information of the insulating paper to a certain extent. Since the FDS measurement results have the characteristics of ‘two-dimensional data’ due to the frequency-dependent characteristics, the prediction effect is slightly lower than that of the R-F-PGNN model, but the performance of the model still meets the actual engineering requirements. In summary, the feature supervised extraction method of Raman spectroscopy and FDS for oil-paper insulation aging and the prediction method of DP proposed in this paper have the ability to quantify the aging state of oil-paper insulation, which can further improve the online monitoring level of electrical equipment.
4. Conclusions
In this paper, the aging samples of oil-paper insulation were obtained by accelerated thermal aging test. The aging characteristics of oil-paper insulation were analyzed by Raman spectroscopy and frequency-domain dielectric spectroscopy. The PGNN was used to establish an oil-paper insulation aging evaluation model combining FDS characteristics and Raman spectral characteristics. The specific conclusions are as follows:
(1) The full Raman spectrum of insulating oil is rich in the aging state information of the transformer. Under the supervision of oil-paper insulation aging information, the LightGBM method is used to comprehensively extract the key Raman features that can characterize the aging information in insulating oil. The nonlinear function relationship between the dielectric characteristic parameters and the DP of the insulating paper was obtained by using the dielectric loss tangent integral Stanδ in the range of 10−2~10−1 Hz, and the correlation coefficient R2 = 0.95.
(2) The correlation between the Raman spectral characteristics of insulating oil and the frequency-domain dielectric characteristics of insulating paper was evaluated by LightGBM method. The results show that the nine Raman features can be used to effectively characterize the dielectric aging characteristic parameters of insulating paper.
(3) The average prediction error of the constructed oil-paper insulation aging R-F-PGNN prediction model is 20.4. The results show that the method proposed in this paper effectively combines the aging characteristic information rich in insulating paper and insulating oil. The combination of Raman spectral characteristics and frequency-domain dielectric characteristics can more comprehensively and accurately predict the degree of polymerization during the aging process of oil-paper insulation. The research in this paper also opens up a new idea for Raman spectroscopy diagnosis of oil-paper insulation aging.
Author Contributions
Conceptualization, Z.Y. (Zhuang Yang) and Z.Y. (Zhixian Yin); methodology, Z.Y. (Zhuang Yang); software, Z.Y. (Zhuang Yang) and C.W.; validation, Z.Y. (Zhuang Yang), F.Z. and Q.W.; formal analysis, F.Z. and C.W.; investigation, Z.Y. (Zhixian Yin); resources, Q.W.; data curation, Z.Y. (Zhixian Yin); writing—original draft preparation, Z.Y. (Zhuang Yang); writing—review and editing, Z.Y. (Zhuang Yang); visualization, F.Z. and C.W.; supervision, Z.Y. (Zhixian Yin) and C.W. All authors have read and agreed to the published version of the manuscript.
Funding
This research was funded by the science and technology project of Chongqing municipal education commission (No. KJQN202502627).
Data Availability Statement
The data presented in this study are available on request from the corresponding author. (The datasets generated during the current study are not publicly available because the data are part of an ongoing research project. However, they are available from the corresponding author upon reasonable request.)
Conflicts of Interest
Author Zhixian Yin was employed by the company State Grid Chongqing Beibei Power Supply Company. The remaining authors declare that the research was conducted in the absence of any commercial or financial relationships that could be construed as a potential conflict of interest.
References
- Jiang, Z.J.; Liu, J.F.; Fan, X.H.; Zhang, H.; Zhang, E.Z.; Song, B.S.; Zhang, Y.Y. Microscopic mechanisms analysis of various dielectric response processes in oil-paper insulation with different insulating states. High Volt. 2024, 9, 591–600. [Google Scholar] [CrossRef] [Scilit]
- Tamma, W.R.; Prasojo, R.A.; Suwarno. High voltage power transformer condition assessment considering the health index value and its decreasing rate. High Volt. 2021, 6, 314–327. [Google Scholar] [CrossRef] [Scilit]
- Yang, Z.; Chen, W.G.; Yin, Z.H.; Yang, D.K. Study on the evaluation method of polymerization degree based on Raman spectroscopic plot. High Volt. 2024, 9, 794–804. [Google Scholar] [CrossRef] [Scilit]
- Yang, Z.; Zhou, Q.; Wu, X.D.; Zhao, Y.H. A novel measuring method of interfacial tension of transformer oil combined PSO optimized SVM and multi frequency ultrasonic technology. IEEE Access 2019, 7, 182624–182631. [Google Scholar] [CrossRef] [Scilit]
- Lin, Y.D.; Yang, L.J.; Liao, R.J.; Sun, W.D.; Zhang, Y.Y. Effect of oil replacement on furfural analysis and aging assessment of power transformers. IEEE Trans. Dielectr. Electr. Insul. 2015, 22, 2611–2619. [Google Scholar] [CrossRef] [Scilit]
- Hao, Y.; Yang, Y.; Shen, Z.; Xiang, H.; Zhou, N.; Zhang, H.; Deng, J. Moisture Condition Assessment of Oil–Paper Insulation Based on Frequency-Domain Dielectric Spectroscopy and Relaxation Time Distribution. Energies 2025, 18, 6436. [Google Scholar] [CrossRef] [Scilit]
- Gao, G.; Liao, R.J.; Wang, Y.Y.; Yang, L.J.; Hao, J.; Liu, R.; Xiao, Z.N. Ageing characteristic quantities of oil-paper insulation for transformers based on extended debye model. Trans. China Electrotech. Soc. 2016, 31, 211–217. [Google Scholar]
- Liao, R.J.; Liu, J.F.; Yang, L.J.; Zhang, Y.Y.; Gao, J.; Ma, Z.Q.; Hao, J. Extraction of Frequency Domain Dielectric Characteristic Parameter of Oil-paper Insulation for Transformer Condition Assessment. Electr. Power Compon. Syst. 2015, 22, 3625–3632. [Google Scholar] [CrossRef] [Scilit]
- Liao, R.J.; Hao, J.; Yang, L.J.; Yuan, Q.; Tang, C. Relationship between frequency domain dielectric characteristic quantity and aging status of transformer oil-paper insulation. Trans. China Electrotech. Soc. 2012, 27, 43–49. [Google Scholar]
- Dong, M.; Liu, Y.; Ren, M.; Wu, X.Z.; Wang, K.; Liu, R.; Li, J.Z. Study of characteristic parameter extraction and insulation condition correlation of frequency-domain dielectric spectroscopy for oil-paper insulation systems. Proc. Chin. Soc. Electr. Eng. 2015, 35, 6246–6253. [Google Scholar]
- Xie, J.C.; Dong, M.; Xu, G.H.; Hu, Y.Z.; Yang, K.G.; Li, J.Z. Quantitative relationship between aging degree of oil-paper and its charge motion parameters in frequency domain. Power Syst. Technol. 2021, 45, 2033–2041. [Google Scholar]
- Kong, W.; Liu, Q.; Li, Q.; Yao, X.; Wan, F. Simultaneous and Dynamic Detection of SF6 Decomposition Products Under Partial Discharge Defect of Gas-Insulated Power Equipment by Fiber-Enhanced Raman Spectroscopy. IEEE Trans. Dielectr. Electr. Insul. 2024, 31, 376–384. [Google Scholar] [CrossRef] [Scilit]
- Yang, Z.; Chen, W.G.; Yang, D.K.; Song, R.M. A Novel Recognition Method of Aging Stage of Transformer Oil-Paper Insulation Using Raman Spectroscopic Recurrence Plots. IEEE Trans. Dielectr. Electr. Insul. 2022, 29, 1152–1159. [Google Scholar] [CrossRef] [Scilit]
- Song, R.M.; Chen, W.G.; Yang, D.K.; Shi, H.Y.; Zhang, R.Y.; Wang, Z.W. Aging assessment of oil-paper insulation based on visional recognition of the dimensional expanded Raman spectra. IEEE Trans. Instrum. Meas. 2021, 70, 6007110. [Google Scholar] [CrossRef] [Scilit]
- Yang, D.K.; Chen, W.G.; Wan, F.; Zhou, Y.K.; Wang, J.X. Identification of the Aging Stage of Transformer Oil-Paper Insulation via Raman Spectroscopic Characteristics. IEEE Trans. Dielectr. Electr. Insul. 2020, 27, 1770–1777. [Google Scholar] [CrossRef] [Scilit]
- Yang, D.K.; Chen, W.G.; Wan, F.; Shi, H.Y.; Zhou, Y.K. Quantitative evaluation method of degree of polymerization based on Raman spectra of insulating oil. Proc. Chin. Soc. Electr. Eng. 2021, 41, 4710–4720. [Google Scholar]
- Yang, D.K.; Chen, W.G.; Shi, H.Y.; Wan, F.; Zhou, Y.K. Raman spectrum feature extraction and diagnosis of oil-paper insulation ageing based on kernel principal component analysis. High Volt. 2021, 6, 51–60. [Google Scholar] [CrossRef] [Scilit]
- Zhou, Y.K.; Chen, W.G.; Yang, D.K.; Zhang, R.Y. Raman spectrum characteristics and aging diagnosis of oil-paper insulation with different oil-paper ratios. IEEE Trans. Dielectr. Electr. Insul. 2019, 27, 1587–1594. [Google Scholar] [CrossRef] [Scilit]
- Chen, X.G.; Ao, Y.; Zhang, Z.H.; Ma, Z.P.; Zhang, W.X.; Wan, F.; Kuang, L.; Luo, B.W. Raman Spectroscopic Detection of the Aging State of Oil-Paper Insulationin Combined Diffusion-Based WGANGP Transformers. Spectrosc. Spectr. Anal. 2025, 45, 2164–2173. [Google Scholar]
- Ali, M.S.; Awalin, L.J.; Abd Halim, S.; Abdul Jaafar, A.S.; Abu Bakar, A.H.; Smadi, I.A.; Albatran, S. Assessing Polymerization-Based Diagnostics for Transformer Insulation via Comparative Statistics. Energies 2025, 18, 5990. [Google Scholar] [CrossRef] [Scilit]
- Liu, J.; Lv, J.L.; Zhang, M.Z.; Chi, M.H.; Qi, P.S.; Chen, X. Method for predicting lifetime of oil-paper insulation based on dielectric response. Electr. Mach. Control 2021, 25, 82–89. [Google Scholar]
- Lyu, J.; Zheng, P.; Qi, Y.; Huang, G. LightGBM-LncLoc: A LightGBM-Based Computational Predictor for Recognizing Long Non-Coding RNA Subcellular Localization. Mathematics 2023, 11, 602. [Google Scholar] [CrossRef] [Scilit]
- Qiu, Y.L.; Wang, J.; Li, Z.Y. Personalized HRTF Prediction Based on LightGBM Using Anthropometric Data. China Commun. 2023, 20, 166–177. [Google Scholar] [CrossRef] [Scilit]
- Cao, Q.; Wu, Y.; Yang, J.; Yin, J. Greenhouse Temperature Prediction Based on Time-Series Features and LightGBM. Appl. Sci. 2023, 13, 1610. [Google Scholar] [CrossRef] [Scilit]
- Wei, H.Y.; Chen, X.J.; Lv, Z.Q.; Wang, Z.Z.; Pan, H.H.; Chen, L. Online Estimation of Lithium-Ion Battery State of Health Using Grey Neural Network. Power Syst. Technol. 2017, 41, 4038–4044. [Google Scholar]
- Shi, W.J.; Huang, J.T.; Liu, Y.Z.; Jing, S.Y.; Zhou, H.P.; Li, W.P.; Wang, Z.C.; Zhang, Z.X. Prediction of Spatiotemporal Pollution of Soil Heavy Metal in Mining Areas Based on Grey Neural Network Algorithm. Water Air Soil Pollut. 2024, 235, 1065–1072. [Google Scholar] [CrossRef] [Scilit]
- Dai, M.Y.; Demirel, M.F.; Liu, X.H.; Liang, Y.Y.; Hu, J.M. Graph neural network for predicting the effective properties of polycrystalline materials: A comprehensive analysis. Comput. Mater. Sci. 2023, 230, 112461. [Google Scholar] [CrossRef] [Scilit]

Disclaimer/Publisher’s Note: The statements, opinions and data contained in all publications are solely those of the individual author(s) and contributor(s) and not of MDPI and/or the editor(s). MDPI and/or the editor(s) disclaim responsibility for any injury to people or property resulting from any ideas, methods, instructions or products referred to in the content. |
© 2026 by the authors. Licensee MDPI, Basel, Switzerland. This article is an open access article distributed under the terms and conditions of the Creative Commons Attribution (CC BY) license.