


Abstract
The electrification of floating production, storage, and offloading (FPSO) units has emerged as a strategic solution to meet the growing demand for increased oil production while reducing carbon emissions associated with onboard gas turbine generation. Power-from-shore (PFS) systems represent a promising approach to achieving this goal, with transmission technologies based on high-voltage direct current (HVDC) and high-voltage alternating current (HVAC) solutions. Although HVDC is more suitable for long-distance and high-power applications, HVAC systems offer advantages in terms of robustness, simplicity, and operational maturity. Nevertheless, the reactive power compensation requirements arising from the high capacitance of submarine cables remain a major technical challenge. This study investigates and compares several reactive power compensation topologies applied to three distinct PFS systems. The proposed methodology enables a comprehensive evaluation of both onshore and subsea reactor placement strategies under technically and technologically feasible conditions. The results demonstrate that long-distance transmission of 75 MW over 250 km was achieved exclusively through subsea compensation configurations, which maintained efficiencies above 90% and voltage and current profiles within operational limits. Conversely, onshore-only compensation proved to be the most efficient solution for shorter transmission distances. The results demonstrate that the full electrification of an FPSO is technically feasible, with voltage and current profiles remaining within acceptable operational limits. The findings also indicate that mid-cable reactor placement (at 50%) is not the most effective configuration, with superior results observed for placements at 20–80% and 40–70% of the cable length. Overall, the outcomes confirm that subsea reactor placement enables higher power transfer over longer distances, significantly extending the technical boundaries traditionally separating HVDC and HVAC solutions. These results emphasize the need for continued technological development to make subsea shunt reactor installation a viable and reliable option for future FPSO electrification projects.
1. Introduction
Despite global commitments and established targets to replace non-renewable sources with renewable energy, the use and exploitation of oil and its derivatives continue to grow [1,2]. The dependence on fossil fuels has gained greater relevance since the economic integration of countries and continents, as well as due to population growth and the development of emerging economies, which contribute to an increase in energy demand [3,4].
In a global effort to curb the increase in the average temperature of the planet, several countries established carbon emission reduction targets at the conclusion of the Paris Agreement in 2015. Brazil’s commitment stands out as one of the most ambitious, as it encompasses the entire economy and initially aimed to reduce emissions by 37% by 2025 and 43% by 2030, compared to 2005 levels. These goals have since been updated to reflect greater ambition: Brazil is now aiming for a 48% reduction by 2025, a 53% reduction by 2030, and a 59–67% reduction by 2035, bolstering the country’s role in the global climate agenda [5,6,7].
Offshore oil platforms are not only key sources of fossil fuel extraction but also significant emitters of greenhouse gases (GHGs) during the production process. A major contributor to these emissions is the use of natural gas to power gas turbines, which often operate with low efficiency. According to International Energy Agency [8], offshore platforms account for 15% of total GHG emissions in the energy sector. In Norway, Benjaminsen [9] reports that up to 84% of the country’s offshore GHG emissions come specifically from gas turbines.
To address this issue, the oil and gas industry, in collaboration with local governments, has been looking for solutions to reduce greenhouse gas emissions. One such initiative is the electrification of future offshore installations using an onshore power supply (power from shore), as seen at offshore installations in Norway’s Utsira formation [10]. In Brazil, as early as 2006, the federal government issued a resolution setting maximum emission limits for atmospheric pollutants from stationary sources. However, in 2021, a revision of this regulation was proposed to allow the adoption of all-electric technology on offshore oil platforms. This change enables centralized power generation at a single optimized point, allowing energy to be efficiently distributed to other equipment on the platform [11].
Power from shore could reduce atmospheric pollutant emissions by up to 20%, according to CONAMA [11]. This technology is already in use internationally and is currently in the project development phase in Brazil. Electrification can be achieved by connecting the platform to the onshore power grid or, as proposed in the literature, by integrating renewable energy sources installed nearby—such as solar, wind, and wave energy systems [4,10,12,13,14].
The electrification of floating production, storage, and offloading (FPSO) units through connection to the mainland power grid—commonly referred to as “power from shore”—offers not only environmental benefits but also technical advantages. The power generation capacity onboard FPSO units is typically dimensioned close to the total load demand [15,16,17]. As a result, this narrow margin between generation and consumption makes the isolated electrical system of an FPSO highly vulnerable. This highlights the challenges related to system stability and reliability, particularly under dynamic or transient conditions.
Furthermore, according to Teles [3], supplying FPSO units without relying on traditional primary sources—such as gas turbines—would lead to a reduction in the frequency and duration of maintenance shutdowns. This is because gas turbines typically require more frequent and longer maintenance intervals compared to other electrical system components, resulting in reduced plant productivity. However, the interconnection of offshore platforms to the power grid—whether via high-voltage direct current (HVDC) or alternating current (HVAC) transmission—presents significant challenges. These challenges are exacerbated by the distance between the platform and the mainland, as well as the depth of the seabed, both of which are critical factors in the Brazilian context due to pre-salt exploration, which may occur at depths exceeding one thousand meters.
In the case of HVAC transmission, a critical aspect that must be carefully evaluated is the definition of the required reactive power compensation—especially to mitigate energy losses and ensure proper voltage levels for power transmission from the mainland to the FPSO. Reactive power is one of the main limitations in long-distance power transmission systems. For submarine cables, this issue becomes even more critical due to their high capacitance, which leads to significant generation of reactive power. When used for long-distance transmission, submarine cables can cause substantial impacts on power quality, compromising voltage stability and increasing transmission losses [18].
HVAC power-from-shore transmission faces several challenges, including the transmission voltage level, the FPSO’s power demand, the limited space and weight available onboard for installing reactive power compensators, the practical difficulties of deploying large reactors on the ocean floor, and the transmission distance itself. These constraints underscore the need to evaluate the optimal distribution—both in terms of reactive power magnitude and geographic location—of compensation along the submarine AC transmission cable. Several academic works have proposed methodologies for calculating the required reactive power and for optimizing the placement of compensators (e.g., reactors, capacitors, SVCs, and STATCOMs) in transmission networks, including both overhead and submarine applications, especially for offshore wind power integration [19,20,21,22].
Due to the intrinsic requirement for reactive power compensation in HVAC power-from-shore systems, in-depth studies are necessary to define the optimal compensation topology, particularly concerning the optimal placement of shunt reactors. The installation of compensation equipment directly on the seabed introduces a range of technological and logistical challenges. According to [23], the installation and operation of subsea electrical systems involve several challenges, among which pressure is a key factor, increasing by approximately 10 bar for every 100 m of ocean depth. Therefore, all electrical components must be properly designed and qualified to withstand such conditions.
Beyond pressure-related constraints, seawater is both conductive and highly corrosive, requiring adequate insulation between electrical equipment and the surrounding environment. In the event of a failure, maintenance operations will most likely need to be carried out at the surface. However, retrieving equipment from the seabed is costly and may lead to prolonged production downtime.
In this context, it becomes essential to critically assess the technical trade-offs between distributed compensation along the submarine cable—including seabed-mounted reactors—and more centralized approaches where compensation is limited to onshore substations and the FPSO itself.
2. Literature Review
2.1. Power-from-Shore Systems
Regarding power-from-shore solutions, there are two main connection methods: HVAC (high-voltage alternating current) and HVDC (high-voltage direct current). As presented in Aker Solutions [24], a range of factors must be considered to determine the most suitable approach for each specific case. For instance, in a Canadian implementation study, the selection between these systems is inherently multi-factorial and must be based on a comprehensive assessment of the technical, economic, and operational characteristics of each project. Critical parameters influencing this choice include the distance to shore, water depth, required transmission capacity, system stability, installation constraints, availability of suitable dynamic cables and swivel technologies, and the overall lifecycle cost.
HVDC transmission can offer stability advantages due to its more precise control of power flow and voltage. Currently, this system has been widely adopted for the connection of offshore wind farms to onshore grids, particularly in Europe and Asia, as it is the preferred solution when challenges are primarily associated with increasing transmission capacity over long distances [25]. According to Wang et al. [26], the development of conventional HVDC transmission, also known as line commutated converter (LCC), which requires strong grid conditions at both ends and provides only active power control, has evolved with the introduction of voltage source converter (VSC)-based systems. These systems offer several benefits, including independent control of both active and reactive power, as well as a more compact physical layout. LCC systems generally face limitations such as the need for extensive filtering equipment, the inability to transmit power bidirectionally, and a lack of black-start capability. In contrast, VSC systems, based on insulated-gate bipolar transistors (IGBTs) and pulse width modulation (PWM), regulate the switching of power electronic devices to modulate the output voltage’s magnitude and phase angle. This enables effective control of active and reactive power while enhancing the stability of energy transfer in power-from-shore transmission systems.
The HVDC system presents significant challenges, the most notable being the requirement for converter substations at both ends of the transmission system. One substation operates as a rectifier (AC/DC), converting alternating current into direct current, while the other functions as an inverter (DC/AC), reversing the process to supply alternating current to the loads. In offshore applications, the rectifier substation is typically located onshore, transmitting HVDC power via submarine cables to an offshore inverter station. However, as discussed by Thibaut and Leforgeais [27], despite its limitations, the HVAC system is still adopted in certain scenarios. The choice for this technology is often driven by the advantage of not requiring modifications to the existing configuration and the reduced number of components compared to HVDC systems.
HVAC systems represent excellent solutions for submarine transmission applications, primarily due to the simplicity and technological robustness of their components. In many cases, particularly those involving short transmission distances and reduced power levels, HVAC systems are strongly recommended [28,29]. Therefore, HVAC systems are suitable solutions for offshore wind farms (OWFs) located relatively close to the mainland [30].
For power-from-shore (PFS) systems, it is essential to understand the typical electrical characteristics of FPSO units. These platforms commonly employ synchronous generators connected to large induction motor groups via medium-voltage switchgear, with the motors typically started using direct-on-line methods and featuring minimal onboard power electronics [31,32]. In this context, PFS solutions for offshore oil and gas platforms differ significantly from those designed for offshore wind farms. Given the predominantly electromechanical nature of onboard electrical systems, along with stringent constraints on space and weight within FPSO units, simpler and more robust PFS architectures are generally the preferred initial choice [33]. As such, HVAC transmission systems are often considered a technically feasible alternative. However, as previously discussed, the high reactive power flow—caused by the considerable capacitance of submarine cables—leads to substantial transmission losses. These losses reduce the overall efficiency of the system, making HVDC solutions more advantageous than HVAC alternatives when long distances and high transmission power levels are involved, as shown in Figure 1.
Figure 1.
Technical range of HVAC and HVDC applications. Reproduced from Antunes et al. [33].
This initial preference for HVAC systems, combined with the efficiency limitations imposed by excessive reactive power flow, has led to substantial scientific and technological efforts focused on developing effective compensation strategies. Furthermore, ongoing advancements aim to extend the feasibility of HVAC-based power-from-shore solutions to accommodate increasingly longer transmission distances and higher power demands. These strategies, along with their underlying technical principles, are outlined in the following sections.
2.2. Reactive Power Compensation
Considering the voltage level defined in the project, the estimated electrical demand of FPSO units, the objection to using reactors on the platform, and the challenges associated with installing large-scale reactors on the ocean floor, it is challenging to evaluate the optimal strategy for distributing reactive power compensation along the AC submarine transmission cable—both in terms of power and spatial allocation.
Several studies in the literature propose methodologies for determining the reactive power required for compensation, as well as for the optimal allocation of compensating devices—such as reactors, capacitors, SVCs, STATCOMs, etc.—in transmission networks, whether overhead or submarine, particularly for the integration of offshore wind farms [19,20,21,22,34,35]. Although most of these studies focus on presenting the computational methods developed for this purpose, they provide valuable insights and serve as references for identifying suitable devices for reactive power compensation. As an example, in the study conducted by Bagheri et al. [19], the authors aimed to optimize the allocation of devices such as static VAR compensators (SVCs) and phase-shifting transformers (PSTs), using real data from an Iranian power grid. The optimization was performed using the discrete particle swarm optimization (DPSO) algorithm integrated with the DigSILENT PowerFactory software. In this case, the authors highlighted the importance of employing advanced technologies such as FACTS devices and optimization algorithms to enhance the performance of modern power grids in terms of power flow control and voltage profile regulation. Rehman et al. [20] investigated critical issues and challenges related to reactive power compensation in HVAC systems for offshore wind farms. The study suggested the use of artificial intelligence-based approaches, such as particle swarm optimization and genetic algorithms, for reactive power compensation. In [21], the authors aimed to optimize the allocation of FACTS devices in power systems that include wind turbines by employing evolutionary algorithms, such as genetic algorithms. Meanwhile, Sirjani et al. [22] applied the global harmony search (GHS) algorithm to determine the optimal allocation of shunt reactive power compensation devices (static VAR compensators) in electric power transmission systems.
In addition to concerns regarding the allocation and rating of devices used for reactive power compensation, the cost-effectiveness and selection of appropriate compensation device types are also discussed in the literature. In this context, Chen et al. [36] applied the economic pressure difference theory, which aims to balance the costs and benefits associated with the installation of reactive power compensation devices on both the offshore and onshore sides. Their approach emphasizes high-reactance and dynamic compensation to maintain real-time reactive power balance. The authors suggested using wind turbines as dynamic reactive power regulators on the offshore side and employing dynamic reactive power compensation (SVG—static VAR generator) onshore to balance power flow and prevent under- and overvoltage issues. In contrast, Li et al. [37] proposed the use of a magnetically controlled reactor (MCR) as a replacement for conventional configurations, such as SVGs combined with fixed reactors. The authors indicated that the dynamic reactive power compensation effect is comparable to that of conventional SVC–fixed reactor compensation topologies, while operational losses were reduced by 70% in the evaluated case. Moreover, the study highlighted that, in addition to lower operational losses, MCRs offer reduced investment and maintenance costs, as well as a smaller footprint.
Concerns related to circuit breaker performance during switching operations in HVAC systems supplying power-from-shore to offshore oil and gas platforms are heightened due to the capacitive effects of long submarine cables. Marini [38] suggested using shunt reactors installed at one or both ends of the cable to mitigate these effects. The author noted, however, that the reactive power provided by the reactors should be limited to no more than 50% of the total capacitive power of the cable load. This limitation helps prevent the occurrence of zero-missing or delayed current zero crossings during cable energization. In [39], the authors proposed adjusting the transmission voltage of cables that connect offshore wind farms to the onshore grid to reduce power losses and extend the technical distance limits of AC cables. To implement this strategy, they recommended using on-load tap changers (OLTCs) on the transformers. Two operating modes were investigated: fixed-voltage operation at an optimized level and variable-voltage operation continuously adjusted based on the instantaneous power generation of the wind farm. Their results showed that a ±15% variation in voltage can reduce losses by 9%, while operating at a voltage range between 0.4 and 1.0 pu under low generation conditions can yield a 13% reduction in losses.
The study presented in [40] addressed the use of reactive power compensation for 150 kV AC transmission from an offshore wind farm to the onshore grid by allocating a shunt reactor at the midpoint of the transmission line. The analysis was based on data from a Danish wind farm and considered the installation of a 75 Mvar reactor onshore, approximately 55 km from the substation and 45 km from the 210 MW offshore wind generation facility. The authors concluded that mid-line compensation reduces cable loading, eliminating the need for larger conductor cross-sections. Additionally, it provides a 23% reduction in annual losses and maintains voltage levels within acceptable limits.
2.3. Identification of Research Gap
In line with HVAC reactive power compensation approaches, the present work investigates the use of reactors for reactive power compensation in submarine transmission lines, in this case, supplying offshore oil and gas production platforms. The main contribution of this study lies in overcoming key limitations of previous works, which typically restrict reactor placement to line terminals or the midpoint. In contrast, the present approach formulates reactor allocation as a continuous optimization variable, allowing their installation at arbitrary positions along the cable, combined with different compensation levels. This generalization significantly expands the solution space and enables the identification of configurations that are not captured by conventional assumptions.
To ensure a comprehensive and robust evaluation, multiple power-from-shore (PFS) systems are analyzed, accounting for variations in transmission distance, transmitted power, voltage level, and the presence of local generation. For each system, a wide solution space is explored, encompassing multiple combinations of key design variables, such as the number of reactors, their nominal reactive power, and their spatial distribution along the cable. This methodology enables a more realistic and exhaustive assessment of reactive power compensation strategies, providing insights that extend beyond the scope of existing studies.
For each compensation solution, the voltage and current profiles along the cable are assessed. Solutions that violate operational or design constraints are discarded, while power transfer efficiency and operational reliability are used as ranking criteria. The objective is to identify correlations between key variables and the performance of the power-from-shore system, with particular emphasis on comparing systems that rely solely on onshore compensation to those incorporating seabed-installed reactors.
By correlating the various variables involved in potential reactive power compensation solutions for selected HVAC power-from-shore systems, this study aims to inform and support future technical decision-making. Furthermore, if subsea compensation demonstrates clear technical advantages, the findings are expected to support and motivate further research, contributing to the development of advanced solutions and the broader adoption directly on seabed-mounted reactors in offshore power systems.
3. Materials and Methods
This work evaluates a large set of reactive power compensation solutions for selected typical HVAC power-from-shore systems. The approach first aims to identify solutions that comply with defined operational criteria and, subsequently, to establish correlations between the compensation strategies and the power transfer efficiency to the FPSO. Particular attention is given to the differences between systems with onshore compensation and those employing seabed-mounted reactors.
Three distinct HVAC power-from-shore systems operating at industrial frequency (60 Hz) are considered in the analysis. Each system features specific characteristics in terms of voltage level, cable length, and power transfer capacity, as well as the presence or absence of onboard electric power generation. The design parameters for each system are defined based on typical configurations with high potential for real-world implementation, and detailed information for each evaluated system is provided in the following sections.
For HVAC power from the shore system, a set of reactive power compensation strategies is assessed. Configurations consider the installation of one to three reactors throughout the system, with up to two reactors on the seabed and the possibility of allocation at every 5% interval along the cable length. The nominal reactive power of each reactor can reach up to 100 Mvar. This limit is reported by manufacturers as feasible for subsea transformers and is also adopted for reactors due to the constructive similarities between these devices. However, to reduce computational burden and improve analysis efficiency, the reactive power is varied in increments of 20 Mvar. In addition, grouped combinations are defined for each PFS system under analysis.
The complexity of the system elements and the large number of cases to be evaluated require the use of a powerful simulation tool. For this purpose, the Real Time Digital Simulator (RTDS) is employed. The RTDS’s RSCAD FX 2.4 software enables automated collection of all relevant variables for each case, including voltage and current profiles at every 5% of the cable length, system losses, overall efficiency of the power-from-shore solution, and the power factor at the grid connection point. The resulting dataset is processed in MATLAB online (version R2025b), where rejection and ranking criteria are applied and variable correlations are derived.
3.1. Analyzed HVAC Power-from-Shore Systems
The HVAC power-from-shore system evaluated in this study is described below and summarized in Table 1.
Table 1.
HVAC power-from-shore systems information.
PFS System 1: This system consists of AC power transmission at 60 Hz from an onshore substation to an FPSO unit with a load demand of 100 MW located 250 km offshore. The transmission is evaluated at 138 kV using a 3-core copper submarine cable in a trefoil configuration, with a cross-section of 500 mm2, XLPE insulation, a rated voltage of 150 kV, and a maximum current capacity of 655 A. It is important to note that the FPSO unit is equipped with onboard power generation units, and the combination of local generation and onboard load enables power import from the transmission system of up to 75 MW.
PFS System 2: This system involves a shorter transmission distance compared to System 1. It considers AC transmission at 115 kV, 60 Hz, supplying an FPSO located 120 km offshore, with a load demand of approximately 100 MW. The combination of local generation and load demand allows for power transmission of up to 75 MW. A 3-core submarine cable in trefoil configuration is also used in this case, with a rated voltage of 132 kV and a current capacity of 590 A. The cable has a cross-sectional area of 400 mm2.
PFS System 3: System 3 also aims to supply an FPSO unit from the onshore AC grid at a frequency of 60 Hz. As in System 2, the transmission voltage is set at 115 kV, covering a distance of 120 km. However, in this case, the FPSO has a load demand of 190 MW and no local generation. That is, the entire demand is fully supplied by the onshore transmission system, requiring the use of a cable with a larger cross-section. Therefore, System 3 employs two 3-core submarine cable in trefoil configuration with XLPE insulation, a cross-section of 630 mm2, a rated voltage of 132 kV, and a current capacity of 715 A. This significant increase in demand—from 100 MW to 190 MW—is under evaluation, as it reflects a new FPSO design concept in which all electrical (synchronous generators removed) and thermal (electric boilers installed) loads are supplied from the mainland.
Even with the electrification of offshore platforms—aimed at reducing GHG emissions and improving the stability and reliability of their electrical systems—it is common, especially for existing facilities, to maintain local generation. Depending on operational conditions, the number of gas turbine generators may be maintained either fully or partially. In addition to their primary function of generating electricity, these units also contribute to the platform’s thermal demands by using the waste heat from gas turbines to heat process loads.
For Systems 1 and 2, the platform demand is partially supplied by onshore power and partially by onboard generation. In contrast, System 3 assumes full electrification of the platform, with all electrical demand met exclusively by the power-from-shore system. Throughout the operational life of an FPSO, its load demand varies according to production capacity. Consequently, the different reactive power compensation solutions for each system must accommodate various power transfer conditions, resulting from the combination of load demand and onboard generator operation. Therefore, for each system, a set of power-from-shore transmission scenarios has been defined, as presented in Table 1.
For all evaluated power-from-shore systems, the points of common coupling with the main transmission grid are simplified, as shown in Figure 2. In System 1, the main grid is represented by a voltage source behind an impedance, with a voltage level of 138 kV. Table 2 provides a summary of the network equivalent parameters for each PFS system.
Figure 2.
Topological configurations of the evaluated HVAC power-from-shore systems.
Table 2.
Summary of the network equivalent parameters for each PFS system (MAIN GRID).
For Systems 2 and 3, a double-circuit subtransmission network of approximately 11.7 km in length was implemented, with its parameters detailed in Table 3—along with a transformer rated at 345 kV on the primary side and 115 kV on the secondary side.
Table 3.
A double-circuit subtransmission line (345 kV) parameters.
For the PFS System 2, two 90 MVA transformers were used, while for the PFS System 3, two 215 MVA transformers were employed. The 90 MVA units have a characteristic impedance of 12.50%, whereas the 215 MVA units have an impedance of 13.33%. All transformers present an X/R ratio of 35. Voltage regulation is available for all units through on-load tap changers (OLTC), allowing a ±15% adjustment range on the secondary side.
According to Fuchs [41], power transmission through insulated cables is governed by the same equations as overhead lines. However, the impedance and susceptance values differ due to factors such as cable insulation, phase proximity, shielding, and other construction characteristics. For all analyzed HVAC PFS systems, the submarine cables were divided into 20 sections. This segmentation allows the analysis of voltage and current profiles at every 5% of the total cable length, corresponding to a section length of 12.5 km for PFS System 1 and 6 km for PFS Systems 2 and 3. Each cable element was modeled using the Bergeron model, as it provides an accurate representation of the physical phenomena in the cable. The characteristics of the submarine cables used in each PFS system were defined based on the considerations in [42] and are presented in Table 4. The inductance and capacitance values were obtained from the manufacturer’s catalog [43], while the resistance was calculated based on the equations defined in IEC standards 60228 [44] and 60287-1-1 [45].
Table 4.
Cable parameters for each PFS system.
In each analyzed case, the reactors were modeled as passive impedances with negligible resistance. Their inductance values were defined to provide the required reactive power compensation at the nominal voltage level of either 138 kV or 115 kV, depending on the PFS system configuration. In the RSCAD model, the submarine cable was segmented, and reactors were placed at selected nodes along its length—specifically at 5% intervals, from 0% to 100% of the total cable length. For this study, the reactive power of individual reactors ranged from 20 Mvar to 100 Mvar, with the upper limit based on typical manufacturer specifications for submarine transformers and extended to the reactors due to their similar construction.
It is important to note that the use of transformers on FPSO units is essential, given the need to adapt voltage levels between the submarine transmission system and the nominal voltage of the onboard loads. Accordingly, PFS System 1 employed a 138/13.8 kV transformer rated at 100 MVA, with a characteristic impedance of 13.33% and an X/R ratio of 40. This transformer was equipped with an on-load tap changer (OLTC), enabling ±15% voltage variation from the nominal value, discretized into 32 steps for voltage regulation at the 13.8 kV bus. For PFS System 2, two 50 MVA transformers were used, while PFS System 3 employed three 75 MVA transformers. For both PFS Systems 2 and 3, the primary voltage was 115 kV, and the secondary voltage was 13.8 kV, with identical impedance and X/R ratio values of 12.5% and 35, respectively. Unlike System 1, tap changers were not implemented in the transformers installed on the FPSO units for Systems 2 and 3. However, such equipment was considered in the onshore substation’s transformers, as previously described.
The FPSO loads were represented by a lumped load at the medium-voltage level (13.8 kV). The load was defined to represent the net power import from the onshore grid to the FPSO under the operational scenarios A and B defined in Table 1.
3.2. Technical Feasibility Assessment Criteria
Given the complexity of the system required for FPSO electrification and the wide range of associated variables, certain limits and criteria must be established in order to filter and enable the search for minimally viable solutions aimed at reducing electrical losses and ensuring acceptable power factor conditions at the point of connection.
Regarding the submarine cables, which require special attention to voltage and current profile limits, for all systems, the voltage at any point along the cable must be less than or equal to 90% of the maximum voltage rating. Thus, for System 1, whose maximum cable voltage is 170 kV, the limit should be 153 kV, while for Systems 2 and 3, which use cables with the same voltage level (Vmax equal to 145 kV), the limit is 130.5 kV. Due to the safety factor associated with temperature, which is directly related to current, this must remain below 95% of the cable’s current rating. Therefore, for System 1 (PFS 1), whose adopted cable has a current rating of 655 A, the limit is 622.2 A. For PFS System 2, the current limit is 560.5 A (In = 590 A), and for PFS System 3, it is 679.2 A, considering that the current rating (In) in this case is 715 A.
At both ends of the cable and the FPSO main medium-voltage bus, the voltage limits were defined as ±5% of the nominal value for any system. Therefore, at the sending and receiving terminals of PFS System 1 (138 kV), the voltage must remain between 131.1 kV and 144.9 kV. For PFS systems 2 and 3, which operate at the same voltage level (115 kV), the voltage values at the terminals must be between 109.2 kV and 120.8 kV. For the FPSO main medium-voltage bus (13.8 kV), it must remain between 13.1 kV and 14.5 kV. All these considered limits are set below the maximum cable ratings and represent a good margin of operational safety.
The power factor limit monitored at the point of common coupling (PCC) was set to be the same for all three PFS systems. A minimum lagging power factor of 0.95 was established, except under no-load conditions. This criterion complies with the minimum technical requirements for connection to the national transmission facilities, as specified in [46]. The analyzed cases are ranked based on the highest efficiency, defined as the ratio between the active power delivered to the FPSO and the active power at the point of common coupling.
3.3. Evaluated Compensation Topologies
The evaluated reactive compensation topologies were defined according to the specific characteristics and requirements of each analyzed system and scenario. In doing so, real data and parameters were respected, enabling the assessment of solutions with practical feasibility for implementation. As previously mentioned, a maximum of three shunt reactors were employed for reactive compensation along the transmission systems, with up to two units located along the submarine section and a single reactor of up to 100 Mvar installed on the FPSO platform, due to constraints on available space and weight. At the onshore substation (sending end), only one reactor was considered, modeled with a variable reactive power rating from 0 to 360 Mvar, since there are no physical space limitations at this location, allowing for complete system compensation.
Considering the possible scenarios regarding the number and location of reactors within the transmission system, four basic compensation topologies were defined:
- Topology 1: One reactor at the onshore substation;
- Topology 2: One reactor at the onshore substation and one reactor on the FPSO platform;
- Topology 3: One reactor at the onshore substation, one submarine reactor, and one reactor on the FPSO platform;
- Topology 4: One reactor at the onshore substation and two submarine reactors.
In order to optimize the number of possible simulation combinations, the reactive power ratings of the shunt reactors were discretized in steps of 20 Mvar. The onshore reactor varied from 20 Mvar to 360 Mvar, while the submarine and platform reactors ranged from 20 Mvar to 100 Mvar. For Topology 3, the position of the submarine reactor along the transmission cable was varied from 20% to 80% of the total cable length, in increments of 10%. For Topology 4, which offers a larger number of possible configurations, seven combined positions were defined for the two submarine reactors. The Figure 3 illustrates the different topologies considered in this study.
Figure 3.
Compensation topology representations.
For the three evaluated systems (PFS 1, 2, and 3), the possible reactive power ratings of the shunt reactors for the three installation locations (mainland, seabed, and FPSO), as well as the possible positions of the submarine reactor along the transmission cable, are summarized in Table 5. Even after reducing the range of possible power ratings and positions, the total number of combinations remained significant: 18 cases were simulated for Topology 1, 90 cases for Topology 2, and 3150 cases for each of Topologies 3 and 4. It is important to note that these same simulations were repeated three times for each PFS system to account for variations in the platform load. Accordingly, each case was analyzed under no-load conditions (with the submarine cable disconnected from the FPSO) and under scenarios A and B, as defined in Table 1. Furthermore, all simulations were carried out considering the on-load tap changers (OLTCs) enabled. To illustrate the number of simulated cases, Topology 2, which initially presented 90 combinations regarding the position and rating of the reactors, resulted in a total of 270 processed simulations. This total corresponds to the product of the 90 initial combinations and the three load scenarios.
Table 5.
Possible reactor power ratings for the three installation sites and reactor position on the seabed.
3.4. HVAC Power-from-Shore System RSCAD Models
Considering all evaluated systems, reactive compensation topologies, and FPSO loading scenarios, it became evident that a large number of simulations were required to comprehensively assess the performance of the various HVAC power-from-shore solutions. The automation feature “Runtime Script” available in the RSCAD software of the Real Time Digital Simulator (RTDS) proved essential for this task, as it enabled a wide range of tests to be conducted efficiently, taking into account multiple variables within a complex digital simulation model that accurately represents the underlying physical phenomena. For each simulation, the voltage and current profiles along the HVAC cable, as well as the active and reactive power flows, were obtained according to the constraints defined for each scenario. This extensive dataset was then analyzed in MATLAB following the methodology and criteria previously described, and the corresponding results and conclusions are presented in the subsequent sections.
The following figures present the single-line diagram and the respective block diagrams adopted for the modeling of System 2 in the RSCAD software. It should be noted that a similar modeling framework is consistently applied to Systems 1 and 3, with only the parameterization being adjusted according to the specific characteristics of each system. This standardized modeling approach ensures methodological consistency and enables a direct and reliable comparison among the evaluated scenarios.
Figure 4 presents the onshore components and their corresponding representative block diagrams. The main grid (source), followed by an overhead transmission line segment, is indicated by the green dashed outline. The transformers described in Section 3.1 are identified by the blue dashed outline. The reactor block, which may be included or excluded depending on the evaluated topology, is indicated by the orange dashed outline.
Figure 4.
Onshore equipments modeled in RSCAD.
Figure 5 illustrates the HVAC cable, highlighted by the green dashed outline, along with its corresponding representative block composed of 20 Pi-sections, one of which is shown in detail. The reactor, indicated by the orange dashed outline, is enabled in Topologies 3 and 4.
Figure 5.
Subsea cable and Pi representation.
Figure 6 illustrates the components allocated on the platform and their corresponding block diagrams. The generators and the load are highlighted by the green dashed outline. The transformers are indicated by the blue dashed outline, while the reactor (considered in Topology 3) is identified by the orange dashed outline.
Figure 6.
Offshore equipments modeled in RSCAD.
As an example, Figure 7 presents the configuration block associated with the cable, in which parameters such as nominal frequency, segment length, and intrinsic characteristics (resistance and reactance) are specified. Similarly, parameterization blocks are defined for the remaining components; however, they are omitted here for the sake of clarity and brevity. All necessary parameters are detailed in Section 3.1.
Figure 7.
Cable parameterization block.
Using the Runtime Script environment of RSCAD, implemented in the C programming language, an automated routine was developed to simulate the modeled systems under a wide range of operating conditions for the four considered topologies. This approach enables the evaluation of numerous configurations, depending on the desired level of resolution. However, as the number of simulated combinations increases, the associated computational time and data processing requirements also grow significantly. Therefore, the scope of the simulations was limited, as further refinements were not expected to substantially impact the results at this stage of the study.
The script consists of a straightforward implementation based on multiple loops and conditional control structures (IF, FOR, and ELSE). Its full presentation is not feasible due to its length, exceeding 1000 lines of code. Moreover, a significant portion of these lines corresponds to variable handling and assignments. However, Figure 8 presents a flowchart that summarizes the testing methodology and the data analysis procedure.
Figure 8.
Flowchart of the simulation and data analysis procedures.
The figure illustrates the simplification of the loop structure that performs a multi-parametric sweep, as detailed below:
- Topology Selection (Loop a): The script iterates over the four reactive compensation topologies, including different subsea reactor positions along the cable (from 20% to 80% of its total length). The command is used to activate the corresponding connection nodes within the model.
- Reactor Ratings (Loops b, c, and d): The inductance values of the onshore, subsea, and platform-based reactors are updated using the command, covering the entire predefined compensation range.
- Loading Scenarios (Loop e): Each reactive compensation configuration is evaluated under three operating conditions: no-load, partial load (Scenario A), and nominal load (Scenario B).
- Data Acquisition: After issuing the command and allowing the system to reach steady-state conditions (), the script employs the function to extract RMS voltage and current values at 20 points along the cable, as well as power flow and tap position data.
With respect to data export and processing, the raw data were exported in format for subsequent post-processing in MATLAB. A filtering algorithm was applied based on strict operational limits, as presented in Section 3.2: voltage and current . Only the configurations that simultaneously satisfy these criteria under all three loading scenarios were considered valid. Finally, the feasible solutions were ranked according to energy efficiency and power factor at the point of common coupling () under nominal load conditions.
4. Results and Discussion
This section presents and discusses the results obtained from the comprehensive set of simulations performed for the selected power-from-shore (PFS) systems. Each configuration was simulated under the operating and design conditions defined in the methodology, allowing a detailed evaluation of the electrical behavior of the HVAC submarine transmission system when different reactive power compensation strategies are adopted. The analyses were organized according to the three main PFS systems previously defined, which differed in transmission distance, voltage level, and load characteristics. For each system, several compensation configurations were simulated, varying the number of reactors, their rated power, and their position along the cable. This parametric approach enabled the identification of performance trends and the influence of each variable on the overall system behavior. For every simulated case, the voltage and current profiles along the submarine cable were examined, as well as the active and reactive power flows throughout the system. From these results, the main technical indicators were derived, including bus voltage regulation, cable overvoltage levels, power transfer efficiency from the main grid to the FPSO medium-voltage bus, and the current margin relative to the cable’s thermal limit. Configurations that exceeded operational limits or result in poor voltage profiles were excluded from further consideration, whereas feasible solutions were ranked according to their efficiency and compliance with technical constraints.
Before presenting the results for each evaluated PFS system, it is necessary to clarify in detail how the simulation data were assessed. Since the reactive power compensation solutions investigated in this study employed fixed shunt reactors, each configuration must simultaneously satisfy the operating requirements under no-load, Scenario A, and Scenario B conditions. Therefore, the approval or rejection of a given compensation solution was based on its performance across all three loading conditions considered together. For a configuration to be accepted, the voltage and current profiles obtained in the simulations must comply with the operational limits defined in Section 3.2. Once the feasible configurations were identified according to these criteria, the remaining solutions were ranked based on their efficiency and power factor. Considering that both efficiency and power factor varied with system loading—and that the no-load condition represents only a temporary operating state in practical applications—these indicators were evaluated exclusively under the nominal loading condition defined as Scenario B for each system, as presented in Table 1.
The results and analyses are presented individually for each PFS system. Subsequently, a comprehensive evaluation of all feasible solutions is carried out to assess the advantages and disadvantages of reactive power compensation schemes with and without seabed-mounted reactors.
4.1. Results and Analysis for PFS System 1
The transmission distance and the amount of power transferred make PFS System 1 the most challenging configuration regarding reactive power compensation. This characteristic has also been highlighted in previous studies, as discussed in Section 2.1. Table 6 confirms that no feasible solutions were identified for Topologies 1 and 2. For Topologies 3 and 4, after a comprehensive set of simulations, only a limited number of compensation configurations met the acceptance criteria and were thus classified as approved solutions. Among the approved cases for Topologies 3 and 4, the solutions exhibit varying levels of efficiency. To assess the performance range, Table 6 also summarizes the minimum and maximum efficiency values, as well as the lowest and highest power factor values observed among the approved configurations.
Table 6.
Summary of evaluated reactive power compensation cases for PFS System 1.
Analyzing the reasons why Topologies 1 and 2 did not yield any feasible compensation solutions reveals that the voltage and current profiles exhibit significant variations throughout the loading conditions, resulting in considerable limit violations across multiple cases. Figure 9 illustrates the voltage and current distributions along the submarine cables of topologies 1 and 2 under no-load conditions for each simulated case. It can be observed that severe violations occur along several cable sections even under intensive operation of the OLTC—voltage exceedances predominantly near the FPSO side and current limit violations mainly near the onshore terminal—as highlighted by the colored operational regions and boundary limits in the plots.
Figure 9.
All Voltage and current profiles for PFS System 1 no-load conditions—Topologies 1 and 2.
Under the nominal loading condition of Topology 3, it was possible to identify 43 reactive compensation solutions that met the defined acceptance criteria. Among these approved configurations, the efficiency values lie within a narrow range, from 89.6% to 91.7%. In contrast, the power factor values exhibit a much wider variation between the minimum and maximum limits. A similar behavior was observed when analyzing the approved solutions for Topology 4. With a larger number of approved cases, the efficiency values again fall within a narrow range, from 90.1% to 92.2%. Regarding the power factor, a wide variation between the minimum and maximum values was once more observed. The greater number of approved configurations and the slight improvement in efficiency performance indicate that solutions based on Topology 4 are more promising.
Figure 10 presents all approved reactive compensation solutions for Topology 3, highlighting the positions of the shunt reactors at the cable terminals and along the submarine cable, as well as the corresponding rated compensation values at each location. The rectangles indicate the reactor positions along the cable, while the values inside each rectangle represent their rated reactive power.
Figure 10.
Topology 3: all the approved solutions for PFS System 1.
The results were sorted from the highest to the lowest efficiency, revealing that the configurations with the best performance are composed of large onshore shunt reactors. To better understand the behavior of the approved solutions, Figure 11 presents the efficiency and power factor obtained for each case. It becomes evident that there is an inverse relationship between efficiency and power factor.
Figure 11.
Efficiency and power factor of the approved compensation solutions for Topology 3 in PFS System 1.
The inverse relationship observed between efficiency and power factor is primarily associated with the trade-off imposed by reactive power compensation in long HVAC submarine cables. The adjustment of these reactors—distributed among the onshore system, seabed, and platform—directly affects the voltage and current profiles along the cable. While higher levels of compensation lead to improved power factor values, they may also result in increased current magnitudes in specific sections of the cable, thereby intensifying resistive losses. As a consequence, configurations that achieve superior power factor performance do not necessarily correspond to maximum efficiency. This behavior highlights the inherent trade-off between reactive power management and energy efficiency, emphasizing the need for an optimization approach when defining compensation strategies in power-from-shore HVAC systems.
However, it is expected that with lower power factors, the increased reactive power drawn from the main grid results in higher current circulation and, consequently, greater losses in the main grid infrastructure. The purpose of this study is to provide a technical basis to support best practices in selecting the most suitable power-from-shore configuration. Therefore, in order to account for possible losses in the main grid, it is recommended that the selection criteria also include acceptable limits for the power factor of each solution. Selecting compensation solutions that achieve higher power factors, even at the expense of a slight reduction in efficiency, is a feasible approach. Depending on the regulatory framework of the country where the power-from-shore system is implemented, additional investments may be required to provide reactive power compensation by other means, which could increase the overall complexity and cost of the project. In this study, a minimum power factor of 0.95 was adopted as the reference value, in accordance with the requirements established by Brazilian technical regulations.
The best-performing compensation configurations identified for PFS System 1 under Topology 3 are summarized in Table 7. All evaluated cases include a 60 Mvar shunt reactor installed at the FPSO terminal, while an additional 100 Mvar subsea reactor is positioned along the submarine cable, typically located at 60% or 70% of its total length. On the onshore side, the sending-end reactor ratings vary among 60, 80, and 100 Mvar, generating different combinations of overall efficiency and power factor performance. The six optimized solutions present a total installed reactive compensation capacity ranging from 220 to 260 Mvar, reflecting alternative configurations that meet the operational voltage and power factor requirements with minimal losses and adequate voltage profiles along the transmission system.
Table 7.
Best solutions—Topology 3 PFS System 1.
The 201 approved cases for Topology 4 also exhibit the same antagonistic behavior between efficiency and power factor observed in the approved solutions of Topology 3, as confirmed in Figure 12. Even greater variations in the power factor can be observed in this case.
Figure 12.
Efficiency and power factor of the approved compensation solutions for Topology 4 in PFS System 1.
Considering the additional selection criteria and the threshold of 0.95 for the power factor, Figure 13 presents the 16 best approved reactive compensation solutions for Topology 4, highlighting the rated compensation values and the locations of the shunt reactors—either at the cable terminals or distributed along the submarine cable.
Figure 13.
Best-performing compensation configurations of Topology 4 for PFS System 1.
The best-performing compensation configurations identified for PFS System 1 under Topology 4 are summarized in Table 8. The three best-performing solutions for Topology 4 correspond to configurations employing 100 Mvar shunt reactors installed on the seabed at 40% and 70% of the submarine cable length. The distinguishing factor among these cases lies in the onshore reactive compensation, where the shunt reactor ratings range from 20 Mvar to 60 Mvar. This variation directly influences both the system efficiency and the power factor. It is evident that the relatively small differences in efficiency—ranging from 91.6% to 90.8%—are less significant than the pronounced variations in power factor, which span from a leading (capacitive) to unity and finally to a lagging (inductive) condition.
Table 8.
Best solutions—Topology 4 PFS System 1.
Figure 14 illustrates the voltage and current profiles along the cable for the best reactive compensation solutions obtained for Topologies 3 and 4 of PFS System 1. The results are shown for the three operational conditions considered—no-load, Scenario A, and Scenario B. For Topology 3, Case 36 was selected, which employs a shunt reactor rated at 80 Mvar located onshore, another rated at 100 Mvar installed on the seabed at 60% of the cable length, and a 60 Mvar unit placed on the FPSO. This configuration achieves an efficiency of 90.1% under Scenario B operating conditions and a unity power factor, fully compensating the reactive power at the point of connection with the main grid. For Topology 4, the selected solution corresponds to Case 141, which also presents a unity power factor and an efficiency of 91.0%. This configuration consists of two 100 Mvar shunt reactors installed along the submarine cable at 40% and 70% of its total length, as well as another 40 Mvar reactor located onshore.
Figure 14.
Voltage and current profiles for the best cases in system 1: Topology 3 (Case 36) and Topology 4 (Case 141).
When analyzing the voltage and current profiles of both cases under all operating conditions, it can be observed that the voltage distribution along the cable remains relatively uniform. This behavior indicates that the dielectric stress on the cable insulation is also evenly distributed. Discontinuities in the current profiles are noticeable exactly at the connection points of the compensation reactors, where the current difference corresponds to the reactive compensation current absorbed by each reactor. Moreover, the current profile tends to become uniform along the cable, which contributes to a more balanced thermal distribution, enhancing the system’s overall performance and reliability. Loading variations influence the voltage and current profiles along the cable, yet all values remain within the specified design limits. A particular aspect can be observed in the voltage profile of the reactive compensation solution corresponding to Topology 3 under Scenario B. In this case, the cable voltage near the FPSO terminal slightly falls below the 10% threshold, although the OLTC action at the transformer ensures that the voltage at the busbar remains within the acceptable limits.
4.2. Results and Analysis for PFS System 2
For the PFS System 2, whose submarine transmission line length (120 km) is approximately half that of PFS System 1, a greater number of approved cases was expected—a tendency confirmed by the results presented in Table 9. This outcome reinforces the well-established understanding in the technical literature that power transfer over shorter transmission distances tends to be more feasible and efficient.
Table 9.
Summary of evaluated reactive power compensation cases for PFS System 2.
The differences in efficiency among the approved solutions are not significant, particularly for the reactive compensation configurations of Topologies 1 and 2, where the deviation between the best and worst performance does not exceed 1.2%. However, considerable variations in the power factor can be observed across all topologies.
For PFS System 2, the antagonistic correlation between efficiency and power factor observed in PFS Systems 1 was not identified, as illustrated in Figure 15. When the additional selection criterion based on the minimum power factor threshold of 0.95 is applied, the number of approved cases across the four reactive compensation topologies decreases substantially. Table 10 summarizes the cases that meet this stricter criterion, providing details on the position and rating of the shunt reactors, as well as the corresponding efficiency and power factor under the nominal operating condition (Scenario B).
Figure 15.
Efficiency and power factor of the approved compensation solutions for PFS System 2.
Table 10.
Best solutions—PFS System 2.
The Table 10 presents the approved cases for Topology 1, in which only two configurations satisfied the selection criteria, both employing onshore shunt reactors rated at 40 Mvar and 60 Mvar. These two cases exhibited identical efficiency and power factor values of 94.1% and 0.99, respectively. This outcome confirms that, for this topology, a variation of 20 Mvar in the onshore reactive compensation does not significantly influence the overall system performance. Furthermore, it is worth emphasizing that the high efficiency and favorable power factor observed for the solution in Topology 1 reinforce its potential as a viable alternative for distances up to 120 km, as shown in this paper.
A similar trend can be observed for the two approved solutions associated with the reactive compensation of Topology 2. In this case, the installation of a 20 Mvar shunt reactor at the FPSO, combined with an additional onshore reactor rated at either 20 or 40 Mvar, resulted in efficiency levels comparable to those achieved with Topology 1. Moreover, the corresponding power factor remained close to unity, further demonstrating the technical adequacy of this configuration for distances up to 120 km.
For Topologies 3 and 4 applied to the PFS System 2, which are based on configurations including at least one subsea-mounted reactor installed along the submarine cable, a similarly good performance was also observed. As in Topologies 1 and 2, the efficiency values among the approved cases were very close, indicating that the different compensation arrangements do not provide significant advantages in terms of electrical performance. This finding is consistent with current practices and design choices adopted in existing power-from-shore (PFS) installations worldwide, where the selection of the most suitable compensation solution increasingly relies on economic, reliability, and operational criteria—especially when configurations without submarine shunt reactors provide comparable electrical performance.
The selected cases for Topology 3 and 4 correspond to a single rated power of 20 Mvar for the shunt reactors, which may be installed at the onshore terminal, along the submarine cable, or at the FPSO. The main distinction among the solutions lies in the positioning of the reactor pairs—either one located along the submarine cable and the other at the FPSO (Topology 3) or both positioned along the cable’s seabed (Topology 4). In Topology 3, the 20 Mvar reactor installed along the cable can occupy positions ranging from 20 to 80% of the total cable length, resulting in negligible differences in efficiency. For Topology 4, the configurations involving two submarine reactors may adopt either symmetric arrangements (e.g., 20–80% or 35–75%) or asymmetric ones (e.g., 40–70% or 40–80%), also leading to only minor variations in overall performance. In general, the total rated reactive power of the compensation reactors for all topologies remains similar, typically ranging between 40 and 60 Mvar. This consistency reinforces the robustness of the analysis methodology and the reliability of the selection and approval criteria established in this study.
Figure 16 and Figure 17 illustrate the voltage and current profiles for the best-performing cases of each topology in the PFS System 2. The selected configurations correspond to Case 6 of Topology 1 and Case 1 of Topologies 2, 3, and 4, which were identified as the most effective reactive compensation solutions for this system.
Figure 16.
Voltage and current profiles for the best cases in system 2: Topology 1 (Case 6) and Topology 2 (Case 1).
Figure 17.
Voltage and current profiles for the best cases in system 2: Topology 3 (Case 1) and Topology 4 (Case 1).
When analyzing the voltage and current profiles of both cases under all operating conditions, it can be observed that the voltage distribution along the cable remains relatively uniform for all cases. This behavior indicates that the dielectric stress on the cable insulation is also evenly distributed. Discontinuities in the current profiles are noticeable exactly at the connection points of the compensation reactors, where the current difference corresponds to the reactive compensation current injected or absorbed by each reactor. Moreover, the current profile tends to become more uniform along the cable under Scenario B, which contributes to a more balanced thermal distribution and enhances the system’s overall performance and reliability. Under no-load and Scenario A conditions, in which the active power transfer from the onshore grid to the FPSO is relatively small, significant variations in the current profile along the submarine cable were observed. This observation confirms the well-known issue associated with the high capacitance of submarine cables, which significantly affects their electrical behavior under light-load or no-load operating conditions.
4.3. Results and Analysis for PFS System 3
PFS System 3 presents characteristics similar to those of PFS System 2, sharing the same onshore subtransmission configuration, submarine cable length, and voltage levels. However, due to the higher power demand of the associated FPSO, two parallel submarine cables with larger cross-sectional areas are employed for power transmission. The inclusion of PFS System 3 in this study aims to evaluate the feasibility of doubling the transmission capacity through the duplication of the submarine transmission elements. It is important to note that all reactive compensation topologies consider this parallel-cable arrangement, meaning that each submarine cable is equipped with its own shunt reactor for reactive power compensation. The results presented herein—such as shunt reactor ratings and the corresponding voltage and current profiles—are based on data obtained from a single submarine cable of the proposed parallel pair. This structural approach is justified by potential differences in the routing and installation paths of the parallel cables.
Table 11 summarizes the cases approved for this system based on the voltage and current compliance criteria. From a general analysis, it can be observed that the number of approved cases is similar to that obtained for PFS System 2, although slight differences are noted in the lowest power factor values and in the efficiency levels achieved. The higher efficiency observed in PFS System 3 is mainly attributed to the larger cross-sectional area of the submarine cables, which results in lower resistance per unit length. Conversely, the narrower range of power factor values can be associated with the absence of onboard power generation units in the FPSO.
Table 11.
Summary of the evaluated reactive power compensation cases for PFS System 3.
Again, the differences in efficiency among the approved solutions are not significant, particularly for the reactive compensation configurations of Topologies 1 and 2. For PFS System 3, the best-performing cases can be identified in Figure 18. When the additional selection criterion based on a minimum power factor threshold of 0.95 is applied, the number of approved cases across the four reactive compensation topologies decreases substantially. Table 12 summarizes the configurations that satisfy this stricter requirement, providing details on the location and rated power of the shunt reactors, as well as the corresponding efficiency and power factor under the nominal operating condition (Scenario B).
Figure 18.
Efficiency and power factor of the approved compensation solutions for PFS System 3.
Table 12.
Best solutions—PFS System 3.
The results obtained for the best-performing cases of Topologies 1 and 2 are identical to those observed for PFS System 2. For Topology 3, only two approved cases were identified, both involving shunt reactors installed on the seabed at positions 20 and 30% along the cable length. In the cases of Topology 4, an additional configuration was included, featuring reactor placements at 50 and 80%, compared with the corresponding solutions from PFS System 2. The fact that PFS System 3 employs duplicated transmission paths to deliver the high power demand of 190 MW under Scenario B, combined with the similar electrical performance observed among the topologies with and without subsea-mounted reactors, confirms that Topology 1 represents the most appropriate solution. This configuration is considered the best practice, as there would be no significant limitations for installing the shunt reactors at the onshore substation. Figure 19 and Figure 20 illustrate the voltage and current profiles for the best-performing cases of each topology in the PFS System 3. The selected configurations correspond to Case 2 of Topology 1, Case 1 of Topologies 2 and 3, and Case 4 of Topology 4, which were identified as the most effective reactive compensation solutions for this system.
Figure 19.
Voltage and current profiles for the best cases in system 3: Topology 1 (Case 2) and Topology 2 (Case 1).
Figure 20.
Voltage and current profiles for the best cases in system 3: Topology 3 (Case 1) and Topology 4 (Case 4).
When analyzing the voltage and current profiles of both cases under all operating conditions, it can be observed that the voltage distribution along the cable remains relatively uniform for all cases. This aspect is particularly relevant, as it should be noted that no power generation units are installed onboard the FPSO, confirming the technical feasibility of this electrical configuration for such an application. The current profiles were similar to those obtained for PFS System 2. A slight difference can be observed under the no-load condition for the Topology 1 case, in which a small current reaches the FPSO. This effect results from the combination of the absence of onboard generation units and the reactive power demand of the three 75 MVA FPSO transformers operating under no-load conditions.
4.4. Overall Analysis of the Results
The presentation and analysis of the results for each proposed PFS system provided a comprehensive understanding of the behavior of the different reactive power compensation solutions evaluated, as well as valuable insights into how each parameter and variable affects the performance of the power-from-shore transmission. Based on these results, the best-performing solutions were identified for each system and corresponding topology. At this stage, it is essential to conduct a broader assessment of the advantages and limitations of each configuration, comparing the performance of the various topologies across the different PFS systems to establish a clear understanding of their relative merits. Table 13 presents a summary of the best-performing solutions obtained for each system and reactive compensation topology, highlighting the positions of the shunt reactors, their rated reactive power, the overall efficiency, the power factor at the point of common coupling with the main grid, and the total reactive power compensation of each solution.
Table 13.
Best solutions.
It is evident that all evaluated PFS systems achieved reactive power compensation solutions with efficiencies above 90%, while maintaining a power factor close to unity under nominal operating conditions. No feasible reactive compensation solutions were found for PFS System 1 without considering configurations that include subsea-mounted shunt reactors. For each PFS system, the best-performing solutions converged to a total reactive power of approximately 240 Mvar for PFS System 1 and 40 Mvar or 60 Mvar for the other systems—values significantly lower than the total reactive power estimated from the cable operating voltage level, length, and capacitance per unit length. Reactive power compensation solutions employing a single shunt reactor installed on the seabed at 50% of the cable length, which are typically suggested and analyzed in the technical literature, do not represent the most effective configuration for the systems evaluated in this study. The minor differences in efficiency observed among the evaluated topologies are not significant; therefore, the selection of a reactive power compensation solution is driven more by potential violations in the voltage and current profiles than by the efficiency itself. Even without onboard power generation units, PFS System 3 proved to be a technically feasible solution. Furthermore, the use of paired submarine cables and compensation elements in PFS System 3 represents a reasonable and effective approach to significantly increase the amount of power transferred. Finally, it was observed from the extensive set of simulations that the reactive power compensation solutions are inherently limited, even when considering a wide range of possible combinations among the variables involved.
5. Conclusions
The challenge of achieving the expected increase in oil production, combined with the growing need to reduce carbon emissions—mainly originating from the gas turbine generators installed on FPSO units—places FPSO electrification solutions as a strategic priority. The relevance of power-from-shore technologies has therefore gained significant attention within the scientific community, motivating extensive and complex research efforts, while also mobilizing the technological sector toward the development of innovative projects and practical implementation strategies.
The main alternatives for FPSO electrification are based on HVDC and HVAC transmission technologies, each presenting distinct advantages and limitations. Currently, the choice between these solutions primarily depends on the amount of power to be transmitted and the distance to shore, with HVDC being more advantageous for high-power and long-distance applications. However, HVAC systems offer practical benefits over HVDC alternatives due to their robustness, simplicity, and operational maturity. To enhance the applicability of HVAC systems and extend their transmission capability, it is necessary to address their main limitation—the reactive power compensation requirements resulting from the high capacitance of submarine cables. The pursuit of improvements and innovative solutions for reactive power compensation in HVAC systems is not new; however, the increasing number of submarine applications, such as the connection of offshore renewable farms and the electrification of FPSO units, has intensified the need to develop new strategies to extend the technical feasibility limits of these systems.
Among the various existing reactive power compensation solutions, the simplest and most robust approach consists of installing shunt reactors in the transmission system to provide fixed reactive compensation. However, due to the current limited maturity of research and technological development in the context of submarine applications, such implementations are still restricted to connections at the cable terminations, preferably at the onshore terminal. Recognizing that further investigations into fixed reactive power compensation are still required, this study presented and evaluated a set of topological compensation solutions applied to different power-from-shore (PFS) systems, enabling a comparative assessment between onshore and subsea reactor placement configurations. The analysis encompassed PFS systems that significantly exceed conventional limits of transmitted power and distance, a typical PFS configuration representative of FPSO electrification projects, and an innovative system featuring the complete absence of onboard gas turbine generation.
After the detailed definition of the three PFS systems, developed with careful consideration of the technical and technological requirements feasible for currently available equipment and solutions, specific approval and classification criteria were established for the evaluation of the proposed configurations. By employing the powerful real-time simulation capabilities of the RTDS platform, it was possible to efficiently evaluate a large set of configurations, leading to the identification of several important conclusions. The main highlight of this study is the demonstrated capability to achieve long-distance transmission (250 km) of 75 MW for PFS System 1 using subsea reactive compensation solutions, which were the only configurations—when compared to purely onshore alternatives—that satisfied all technical criteria while maintaining efficiencies above 90%. For typical electrification scenarios involving shorter transmission distances, the best solution corresponds to onshore-only compensation, since the efficiency gains obtained with topologies including subsea reactor placement were not sufficiently significant to justify the additional investment and complexity associated with installing reactors on the seabed. The full electrification of the FPSO is technically feasible, as the voltage and current profiles along the submarine cable remain within acceptable operating limits. Moreover, duplicating the transmission system to significantly increase the power transfer capacity has proven to be an effective technical solution. Solutions involving the installation of subsea-mounted reactors at the midpoint of the cable length do not represent the most effective configuration. The best-performing solutions were observed at distinctly different positions from those typically considered in current studies, such as reactor placements at 20–80% or 40–70% of the total cable length.
Finally, after the comprehensive investigation carried out in this study, it becomes evident that reactive compensation solutions based on subsea reactor placement enable higher power transfer over longer distances, significantly extending the practical limits that currently define the choice between HVDC and HVAC systems. These configurations achieved efficiencies above 90% without violating the operational limits of the submarine cable and without adding weight or volume constraints to the FPSO. This outcome reinforces the importance of continued research and technological development to further advance the feasibility of installing shunt reactors on the seabed for future power-from-shore applications. However, this study should be further extended to address additional aspects and to achieve more accurate results, thus opening avenues for future research.
Highlights and Future Work
As a continuation of this work, it is essential to assess the costs associated with subsea reactive power compensation, including installation, operation, equipment lifespan and potential maintenance requirements. Accordingly, future studies should focus on evaluating and comparing the economic performance of subsea, onshore, and platform-based compensation strategies. In addition, further investigations should address the integration of dynamic compensation devices, particularly for platform and onshore applications. In this context, advanced solutions such as STATCOM systems may be assessed in terms of their effectiveness for automatic reactive power control and voltage regulation.
It is important to note that the discretization adopted in this study—namely, reactive power levels ranging from 20 to 100 Mvar and spatial allocation intervals of 5% along the cable length, for example—represents a balance between solution accuracy and computational feasibility. While these choices enable a comprehensive assessment within a practical simulation effort, a finer discretization could potentially yield a more accurate identification of optimal configurations. Therefore, future work should investigate the impact of higher-resolution discretization strategies, possibly combined with advanced optimization techniques, in order to further improve result accuracy without incurring significantly higher computational costs.
It should also be emphasized that the modeling approach adopted in this study relies on several simplifying assumptions, including representing the main grid as an equivalent voltage source, aggregating the FPSO demand as a lumped load, and assuming idealized behavior for the shunt reactors. While these assumptions allow for a tractable and computationally efficient analysis, they may influence the accuracy of the results. In particular, the equivalent grid representation neglects network impedance variations and dynamic interactions, which may affect voltage regulation and reactive power exchange. Similarly, the lumped load model does not capture the spatial distribution or dynamic behavior of the platform demand, potentially impacting the voltage profile along the system. Furthermore, the idealized reactor model disregards non-ideal effects such as losses, saturation, and control limitations, which may lead to optimistic estimates of compensation performance and system efficiency. Consequently, the voltage profiles and efficiency values presented herein should be interpreted as indicative trends rather than exact operational values. Future studies should consider more detailed models to better capture these effects and enhance the accuracy of the analysis.
Author Contributions
Conceptualization, F.O.P. and L.J.d.M.; methodology, validation and formal analysis, F.O.P. and L.J.d.M.; investigation, resources and data curation, F.O.P., L.J.d.M., G.V.d.S.C.C. and L.H.V.; writing—original draft preparation, F.O.P. and L.J.d.M.; writing—review and editing, F.O.P., L.J.d.M. and I.P.d.F.; visualization, supervision, project administration and funding acquisition, J.M.T.M., V.Z.S., C.A.C.C. and R.d.M.P.d.R. All authors have read and agreed to the published version of the manuscript.
Funding
This research was funded by Petrobras, a Brazilian oil and gas company, through Project N° 0050.0127997.24.9.
Data Availability Statement
Requests to access the datasheet should be directed to fredericopassos@unifei.edu.br and luciomotta@unifei.edu.br.
Acknowledgments
The authors would like to thank Petrobras, a Brazilian Oil and Gas Company, for supporting this research project.
Conflicts of Interest
Authors José Mauro Teixeira Marinho, Vinicius Zimmermann Silva, Carlos Andre Carreiro Cavaliere and Rodrigo M.P. Rosa were employed by the company Petrobras Research and Development Center (CENPES). The remaining authors declare that the research was conducted in the absence of any commercial or financial relationships that could be construed as a potential conflict of interest.
References
- Manz, D.; Walling, R.; Miller, N.; LaRose, B.; D’Aquila, R.; Daryanian, B. The Grid of the Future: Ten Trends That Will Shape the Grid over the Next Decade. IEEE Power Energy Mag. 2014, 12, 26–36. [Google Scholar] [CrossRef] [Scilit]
- Yang, Y.; Qiu, J.; Zhang, C. Distribution Network Planning Towards a Low-Carbon Transition: A Spatial-Temporal Carbon Response Method. IEEE Trans. Sustain. Energy 2024, 15, 429–442. [Google Scholar] [CrossRef] [Scilit]
- Teles, C. Estudos e Novas Propostas para Fornecimento de Energia EléTrica à Plataformas Offshore de Óleo e Gás com Aplicação na Bacia de Santos. Master’s Thesis, Universidade de São Paulo, São Paulo, Brazil, 2019. Available online: https://teses.usp.br/teses/disponiveis/3/3143/tde-07012020-122139/pt-br.php (accessed on 14 November 2022).
- Oliveira, M. Metodologia para Aplicação de Fontes Renováveis de Energia Elétrica em Plataformas Marítimas de Produção de Petróleo e Gás Natural. Ph.D. Thesis, Universidade de São Paulo, São Paulo, Brazil, 2013. Available online: https://www.teses.usp.br/teses/disponiveis/3/3143/tde-01082013-162018/pt-br.php (accessed on 14 November 2022).
- Governo do Brasil. Brazil Submits its New NDC in Alignment with the Paris Agreement to the UN. 2024. Available online: https://www.gov.br/secom/en/latest-news/2024/11/brazil-submits-its-new-ndc-2014-in-alignment-with-the-paris-agreement-2014-to-the-un (accessed on 14 April 2025).
- Climate Action Tracker. Brazil—2035 NDC Assessment. 2024. Available online: https://climateactiontracker.org/countries/brazil/2035-ndc/ (accessed on 14 April 2025).
- World Resources Institute. Statement: Brazil Releases New 2035 Emissions Reduction Target. 2024. Available online: https://www.wri.org/news/statement-brazil-releases-new-2035-emissions-reduction-target (accessed on 14 April 2025).
- International Energy Agency. World Energy Outlook 2018. 2018. Available online: https://www.iea.org/reports/world-energy-outlook-2018/oil-and-gas-innovation (accessed on 10 September 2024).
- Benjaminsen, C. We Can Electrify Offshore Oil Rigs Without Electricity Cables. SINTEF. 2022. Available online: https://partner.sciencenorway.no/ammonia-energy-environment/we-can-electrifyoffshore-oil-rigs-without-electricity-cables/2024579 (accessed on 10 March 2025).
- Ballari, A.; Østensen, J.S. Electrification of the Utsira Formation: Electric System Requirements for a Power Distribution Platform. Master’s Thesis, University of Agder, Grimstad, Norway, 2013. [Google Scholar]
- Conama Aprova Pedido de Urgência do MME para Eletrificação de Plataformas Buscando Reduzir em Até 20% as Emissões; Ministério de Minas e Energia, Governo Federal: Brasília, Brazil, 2022. Available online: https://www.gov.br/mme/pt-br/assuntos/noticias/conama-aprova-pedido-do-mme-para-eletrificacao-de-plataformas-buscando-reduzir-em-ate-20-as-emissoes (accessed on 13 March 2025).
- Antunes, H.M.A.; Brandao, D.I.; Biajo, V.H.M.; Oliveira, F.S.; Silva, S.M. Floating, Production, Storage, and Offloading Unit: A Contingency Operating Mode Using Variable Frequency Drives. IEEE Access 2024, 12, 68149–68159. [Google Scholar] [CrossRef] [Scilit]
- Amin, M.; Rygg, A.; Molinas, M. Active Power Flow Direction Effect on Stability in Multi-terminal VSC-HVDC Transmission System in Integrating Wind Farm. In Proceedings of the 2016 IEEE 17th Workshop on Control and Modeling for Power Electronics (COMPEL), Trondheim, Norway, 27–30 June 2016; IEEE: Piscataway, NJ, USA, 2016; pp. 1–8. [Google Scholar] [CrossRef] [Scilit]
- Santos, S.R. Eletrificação das Plataformas de Petróleo Através de Energia de Ondas. Estudo de Caso: Peregrino-Cabo Frio (RJ). Master’s Thesis, Universidade Federal do Paraná, Curitiba, Brazil, 2022. Available online: https://acervodigital.ufpr.br/xmlui/handle/1884/79347 (accessed on 10 March 2025).
- Liu, X.; Xiong, C.; Liu, B.; Li, Y.; Ling, C.; Yu, S. Dynamic Characteristics Analysis of Offshore Oil Platform Power System under Large Load Rejection. In Proceedings of the 2021 9th International Conference on Smart Grid and Clean Energy Technologies (ICSGCE), Sarawak, Malaysia, 15–17 October 2021; IEEE: Piscataway, NJ, USA, 2021; pp. 38–43. [Google Scholar] [CrossRef] [Scilit]
- Sun, D.; Xie, X.; Wang, J.; Li, Q.; Wei, C. Integrated generation-transmission expansion planning for offshore oilfield power systems based on genetic tabu hybrid algorithm. J. Mod. Power Syst. Clean Energy 2017, 5, 117–125. [Google Scholar] [CrossRef] [Scilit]
- Valle, R. Desempenho Dinâmico de Sistemas Elétricos Industriais com Grandes Cargas Motóricas e Geração Síncrona. Master’s Thesis, Universidade Federal do Rio de Janeiro, Rio de Janeiro, Brazil, 2018. Available online: http://hdl.handle.net/11422/11563 (accessed on 14 November 2022).
- Liu, G.; Fan, M.; Wang, P.; Zheng, M. Study on reactive power compensation strategies for long distance submarine cables considering electrothermal coordination. J. Mar. Sci. Eng. 2021, 9, 90. [Google Scholar] [CrossRef] [Scilit]
- Bagheri, A.; Rabiee, A.; Galavani, S.; Fallahi, F. Congestion Management through Optimal Allocation of FACTS Devices Using DigSILENT-Based DPSO Algorithm- A Real Case Study. J. Oper. Autom. Power Eng. 2020, 8, 97–115. [Google Scholar] [CrossRef] [Scilit]
- Rehman, A.; Koondhar, M.A.; Ali, Z.; Jamali, M.; El-Sehiemy, R.A. Critical Issues of Optimal Reactive Power Compensation Based on an HVAC Transmission System for an Offshore Wind Farm. Sustainability 2023, 15, 14175. [Google Scholar] [CrossRef] [Scilit]
- Awad, A.; Kamel, S.; Hassan, M.H.; Zeinoddini-Meymand, H. Optimal allocation of flexible AC transmission system (FACTS) for wind turbines integrated power system. Energy Sci. Eng. 2024, 12, 181–200. [Google Scholar] [CrossRef] [Scilit]
- Sirjani, R.; Mohamed, A.; Shareef, H. Optimal allocation of shunt Var compensators in power systems using a novel global harmony search algorithm. Int. J. Electr. Power Energy Syst. 2012, 43, 562–572. [Google Scholar] [CrossRef] [Scilit]
- Rajashekara, K.; Krishnamoorthy, H.S.; Naik, B.S. Electrification of subsea systems: Requirements and challenges in power distribution and conversion. CPSS Trans. Power Electron. Appl. 2017, 2, 259–266. [Google Scholar] [CrossRef] [Scilit]
- Aker Solutions. Feasibility of the Electrification of FPSO Vessels Offshore Newfoundland and Labrador, Canada; Technical report; Petroleum Research Newfoundland and Labrador: St. John’s, NL, Canada, 2020; Available online: https://energynl.ca/wp-content/uploads/2021/01/FINAL-Feasibility-of-the-Electrification-of-FPSO-Vessels-Offshore-Newfoundland-and-Labrador-IFI-2020.pdf (accessed on 22 January 2026).
- National Grid Electricity System Operator. Holistic Approach to Offshore Transmission Planning in Great Britain; Technical report; National Grid ESO: Arnhem, The Netherlands, 2020; Available online: https://www.neso.energy/document/182931/download (accessed on 22 April 2025).
- Wang, X.; Wang, L.; Song, W.; Hao, X.; Zhang, X. Economic Analysis on Transmission System of Offshore Oil Platform Based on LCC. In Proceedings of the 2023 International Conference on Distributed Computing and Electrical Circuits and Electronics (ICDCECE), Ballar, India, 29–30 April 2023; IEEE: Piscataway, NJ, USA, 2023; pp. 1–7. [Google Scholar] [CrossRef] [Scilit]
- Thibaut, E.; Leforgeais, B. Selection of Power From Shore for Offshore Oil and Gas Developments. IEEE Trans. Ind. Appl. 2015, 51, 1333–1340. [Google Scholar] [CrossRef] [Scilit]
- Lyu, Y.; Luo, Y.; Jia, Z.; Fu, S.; Tang, Y.; Wang, Q.; Zeng, Y. Benefit Evaluation of HVAC and HVDC for Offshore Wind Power Transmission System under the Multidimensional Index. Electr. Power Syst. Res. 2024, 237, 111018. [Google Scholar] [CrossRef] [Scilit]
- Rahman, S.; Khan, I.; Alkhammash, H.I.; Nadeem, M.F. A Comparison Review on Transmission Mode for Onshore Integration of Offshore Wind Farms: HVDC or HVAC. Electronics 2021, 10, 1489. [Google Scholar] [CrossRef] [Scilit]
- Bidadfar, A.; Saborío-Romano, O.; Naidu Sakamuri, J.; Akhmatov, V.; Antonio Cutululis, N.; Ejnar Sørensen, P. Coordinated Control of HVDC and HVAC Power Transmission Systems Integrating a Large Offshore Wind Farm. Energies 2019, 12, 3435. [Google Scholar] [CrossRef] [Scilit]
- Elgenedy, M.; Ahmed, K.; Burt, G.; Rogerson, G.; Jones, G. Unlocking the UK Continental Shelf Electrification Potential for Offshore Oil and Gas Installations: A Power Grid Architecture Perspective. Energies 2021, 14, 7096. [Google Scholar] [CrossRef] [Scilit]
- Ray, A.; Rajashekara, K. Electrification of Offshore Oil and Gas Production: Architectures and Power Conversion. Energies 2023, 16, 5812. [Google Scholar] [CrossRef] [Scilit]
- Antunes, T.A.; Castro, R.; Santos, P.J.; Pires, A.J. Standardization of Power-from-Shore Grid Connections for Offshore Oil and Gas Platforms. Sustainability 2023, 15, 5041. [Google Scholar] [CrossRef] [Scilit]
- Dakic, J.; Mañé, M.C.; Araujo, E.P.; Bellmunt, O.G. Optimal sizing and location of reactive power compensation in offshore HVAC transmission systems for loss minimization. In Proceedings of the 18th Wind Integration Workshop: International Workshop on Large-Scale Integration of Wind Power into Power Systems as Well as on Transmission Networks for Offshore Wind Power Plants: Digital proceedings, Dublin, Ireland, 16–18 October 2019; pp. 1–6. Available online: http://hdl.handle.net/2117/188485 (accessed on 5 November 2024).
- Guiping, Z.; Xiaowei, D.; Chen, Z. Optimisation of reactive power compensation of HVAC cable in off-shore wind power plant. IET Renew. Power Gener. 2015, 9, 857–863. [Google Scholar] [CrossRef] [Scilit]
- Chen, M.; Tang, X.; Chen, D.; Chao, W.; Gao, W.; Yang, D.; Luo, H.; Zou, Y.; Pei, L. Reactive Power Compensation Configuration of Offshore Wind Power Based on Economic Differential Pressure Theory. J. Phys. Conf. Ser. 2022, 2401, 012061. [Google Scholar] [CrossRef] [Scilit]
- Li, S.; Li, Z.; Man, Y.; Li, Q.; Liu, Y.; Yu, G. Research on Optimal Allocation of Reactive Power Compensation in Offshore Wind Power Transmission System via AC Cable Based on Controllable Reactor. J. Phys. Conf. Ser. 2022, 2401, 012062. [Google Scholar] [CrossRef] [Scilit]
- Marini, P. Shunt Reactor Compensation for Subsea Cables in Industrial Plants. In Proceedings of the 2023 PCIC Energy Europe (PCIC Energy); IEEE: Piscataway, NJ, USA, 2023; pp. 1–5. Available online: https://pcic.energy/wp-content/uploads/EUR23_02-1.pdf (accessed on 7 November 2024).
- Gustavsen, B.; Mo, O. Variable Transmission Voltage for Loss Minimization in Long Offshore Wind Farm AC Export Cables. IEEE Trans. Power Deliv. 2017, 32, 1422–1431. [Google Scholar] [CrossRef] [Scilit]
- Wiechowski, W.; Borre Eriksen, P. Selected studies on offshore wind farm cable connections—Challenges and experience of the Danish TSO. In Proceedings of the 2008 IEEE Power and Energy Society General Meeting—Conversion and Delivery of Electrical Energy in the 21st Century; IEEE: Piscataway, NJ, USA, 2008; pp. 1–8. [Google Scholar] [CrossRef] [Scilit]
- Fuchs, R.D. Transmissão de Energia Elétrica–Linhas Aéreas, 2nd ed.; Livros Técnicos e Científicos Editora S.A.: Rio de Janeiro, Brazil, 1979. (In Portuguese) [Google Scholar]
- International Association of Oil & Gas Producers (IOPG). Recommended Practices for Electrification of Oil and Gas Facilities, Report 653; Technical report; IOPG: London, UK, 2022. [Google Scholar]
- NKT Cables (formerly ABB). XLPE Submarine Cable Systems 2, Document GM5007 Rev. 5, Catalog NKT (ABB), n.d. Available online: https://new.abb.com/docs/default-source/ewea-doc/xlpe-submarine-cable-systems-2gm5007.pdf (accessed on 16 October 2025).
- International Electrotechnical Commission (IEC). IEC 60228: Conductors of Insulated Cables, 3rd ed.; Technical report; IEC: Geneva, Switzerland, 2004. [Google Scholar]
- International Electrotechnical Commission (IEC). IEC 60287-1-1: Calculation of the Current Rating of Cables—Part 1-1: Current Rating Equations (100% Load Factor) and Calculation of Losses, 2nd ed.; Technical report; IEC: Geneva, Switzerland, 2006. [Google Scholar]
- Operador Nacional do Sistema Elétrico (ONS). Submódulo 2.10—Requisitos Técnicos Mínimos para a Conexão às Instalações de Transmissão. 2023. Available online: https://www.ons.org.br/paginas/sobre-o-ons/procedimentos-de-rede/vigentes (accessed on 9 September 2025). (In Portuguese)
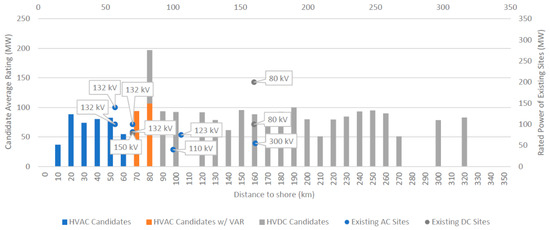
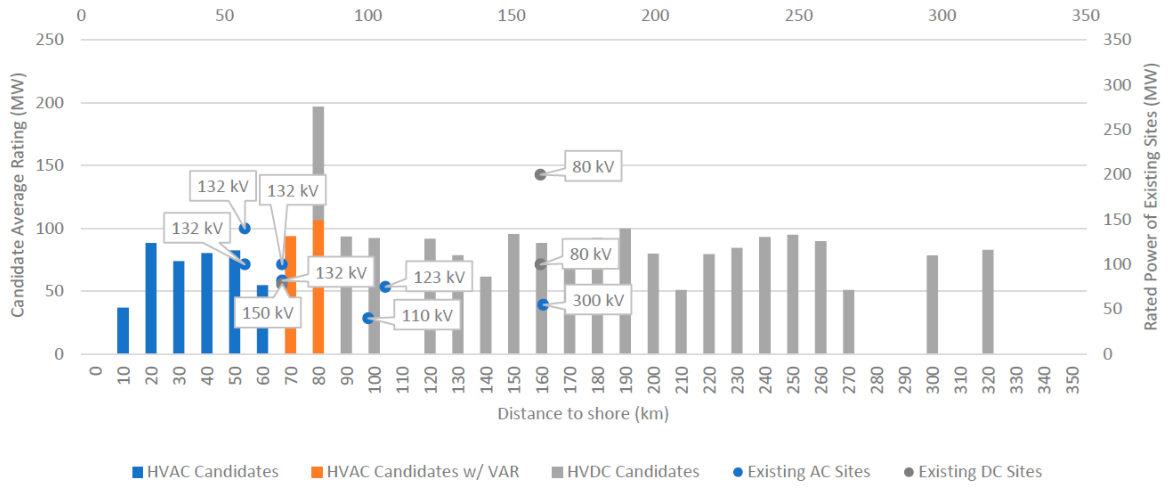
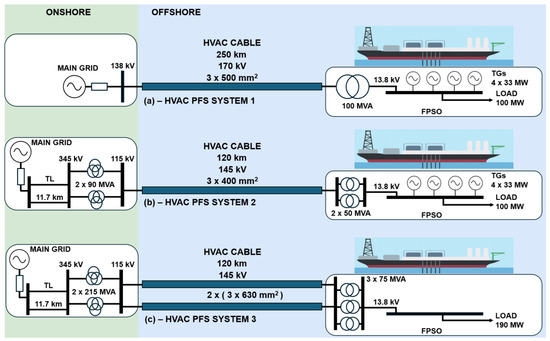
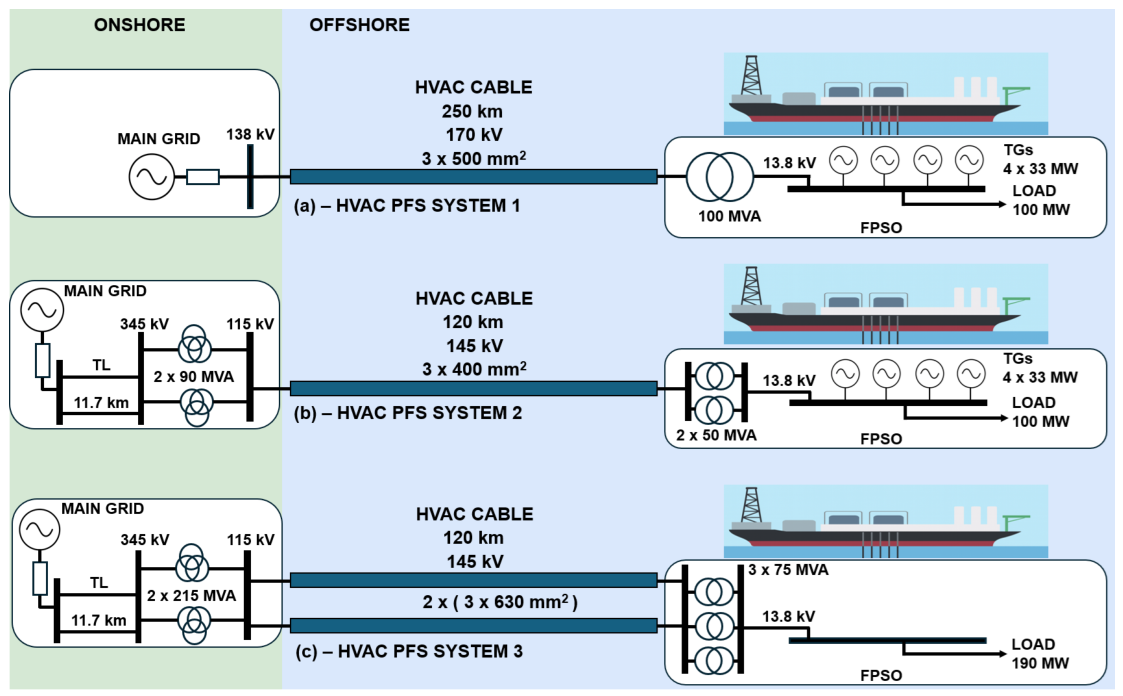
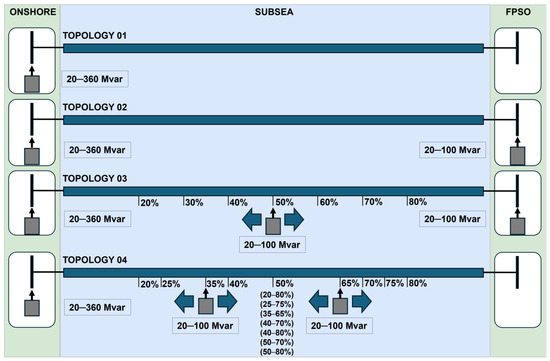
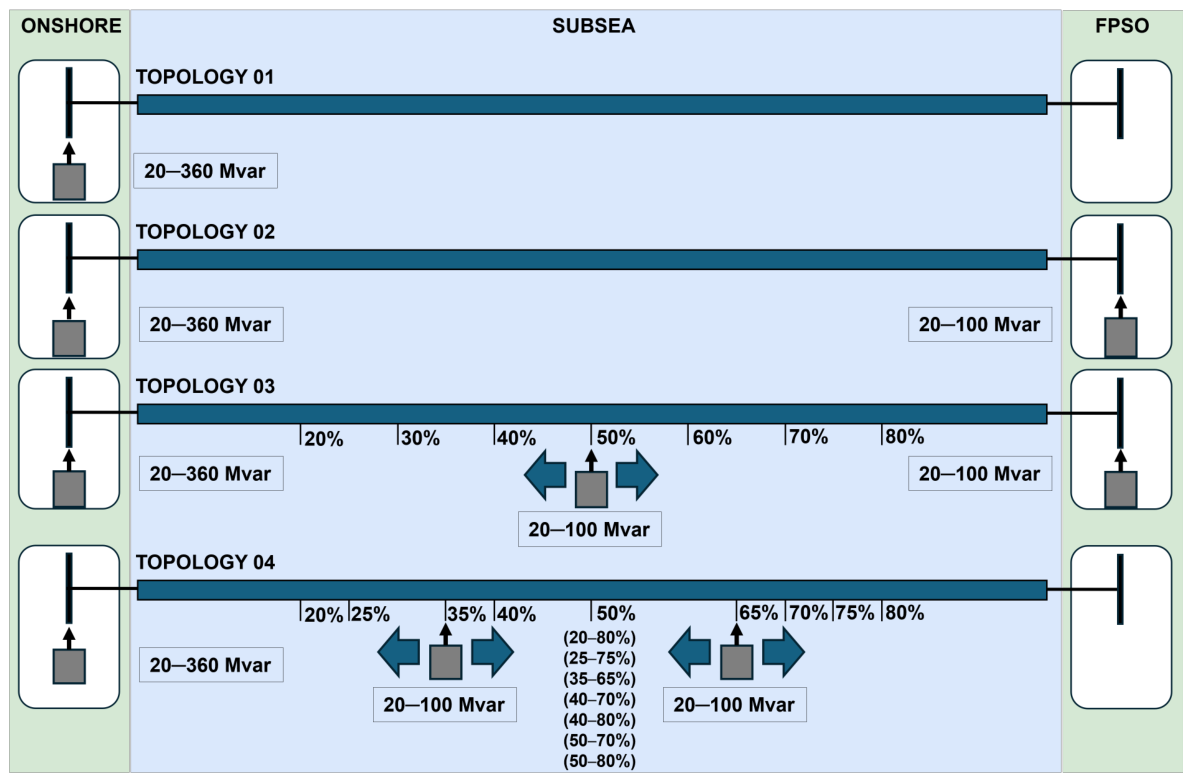
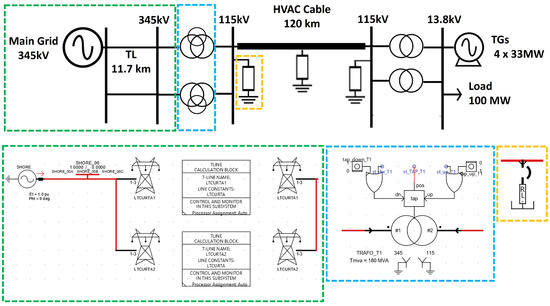
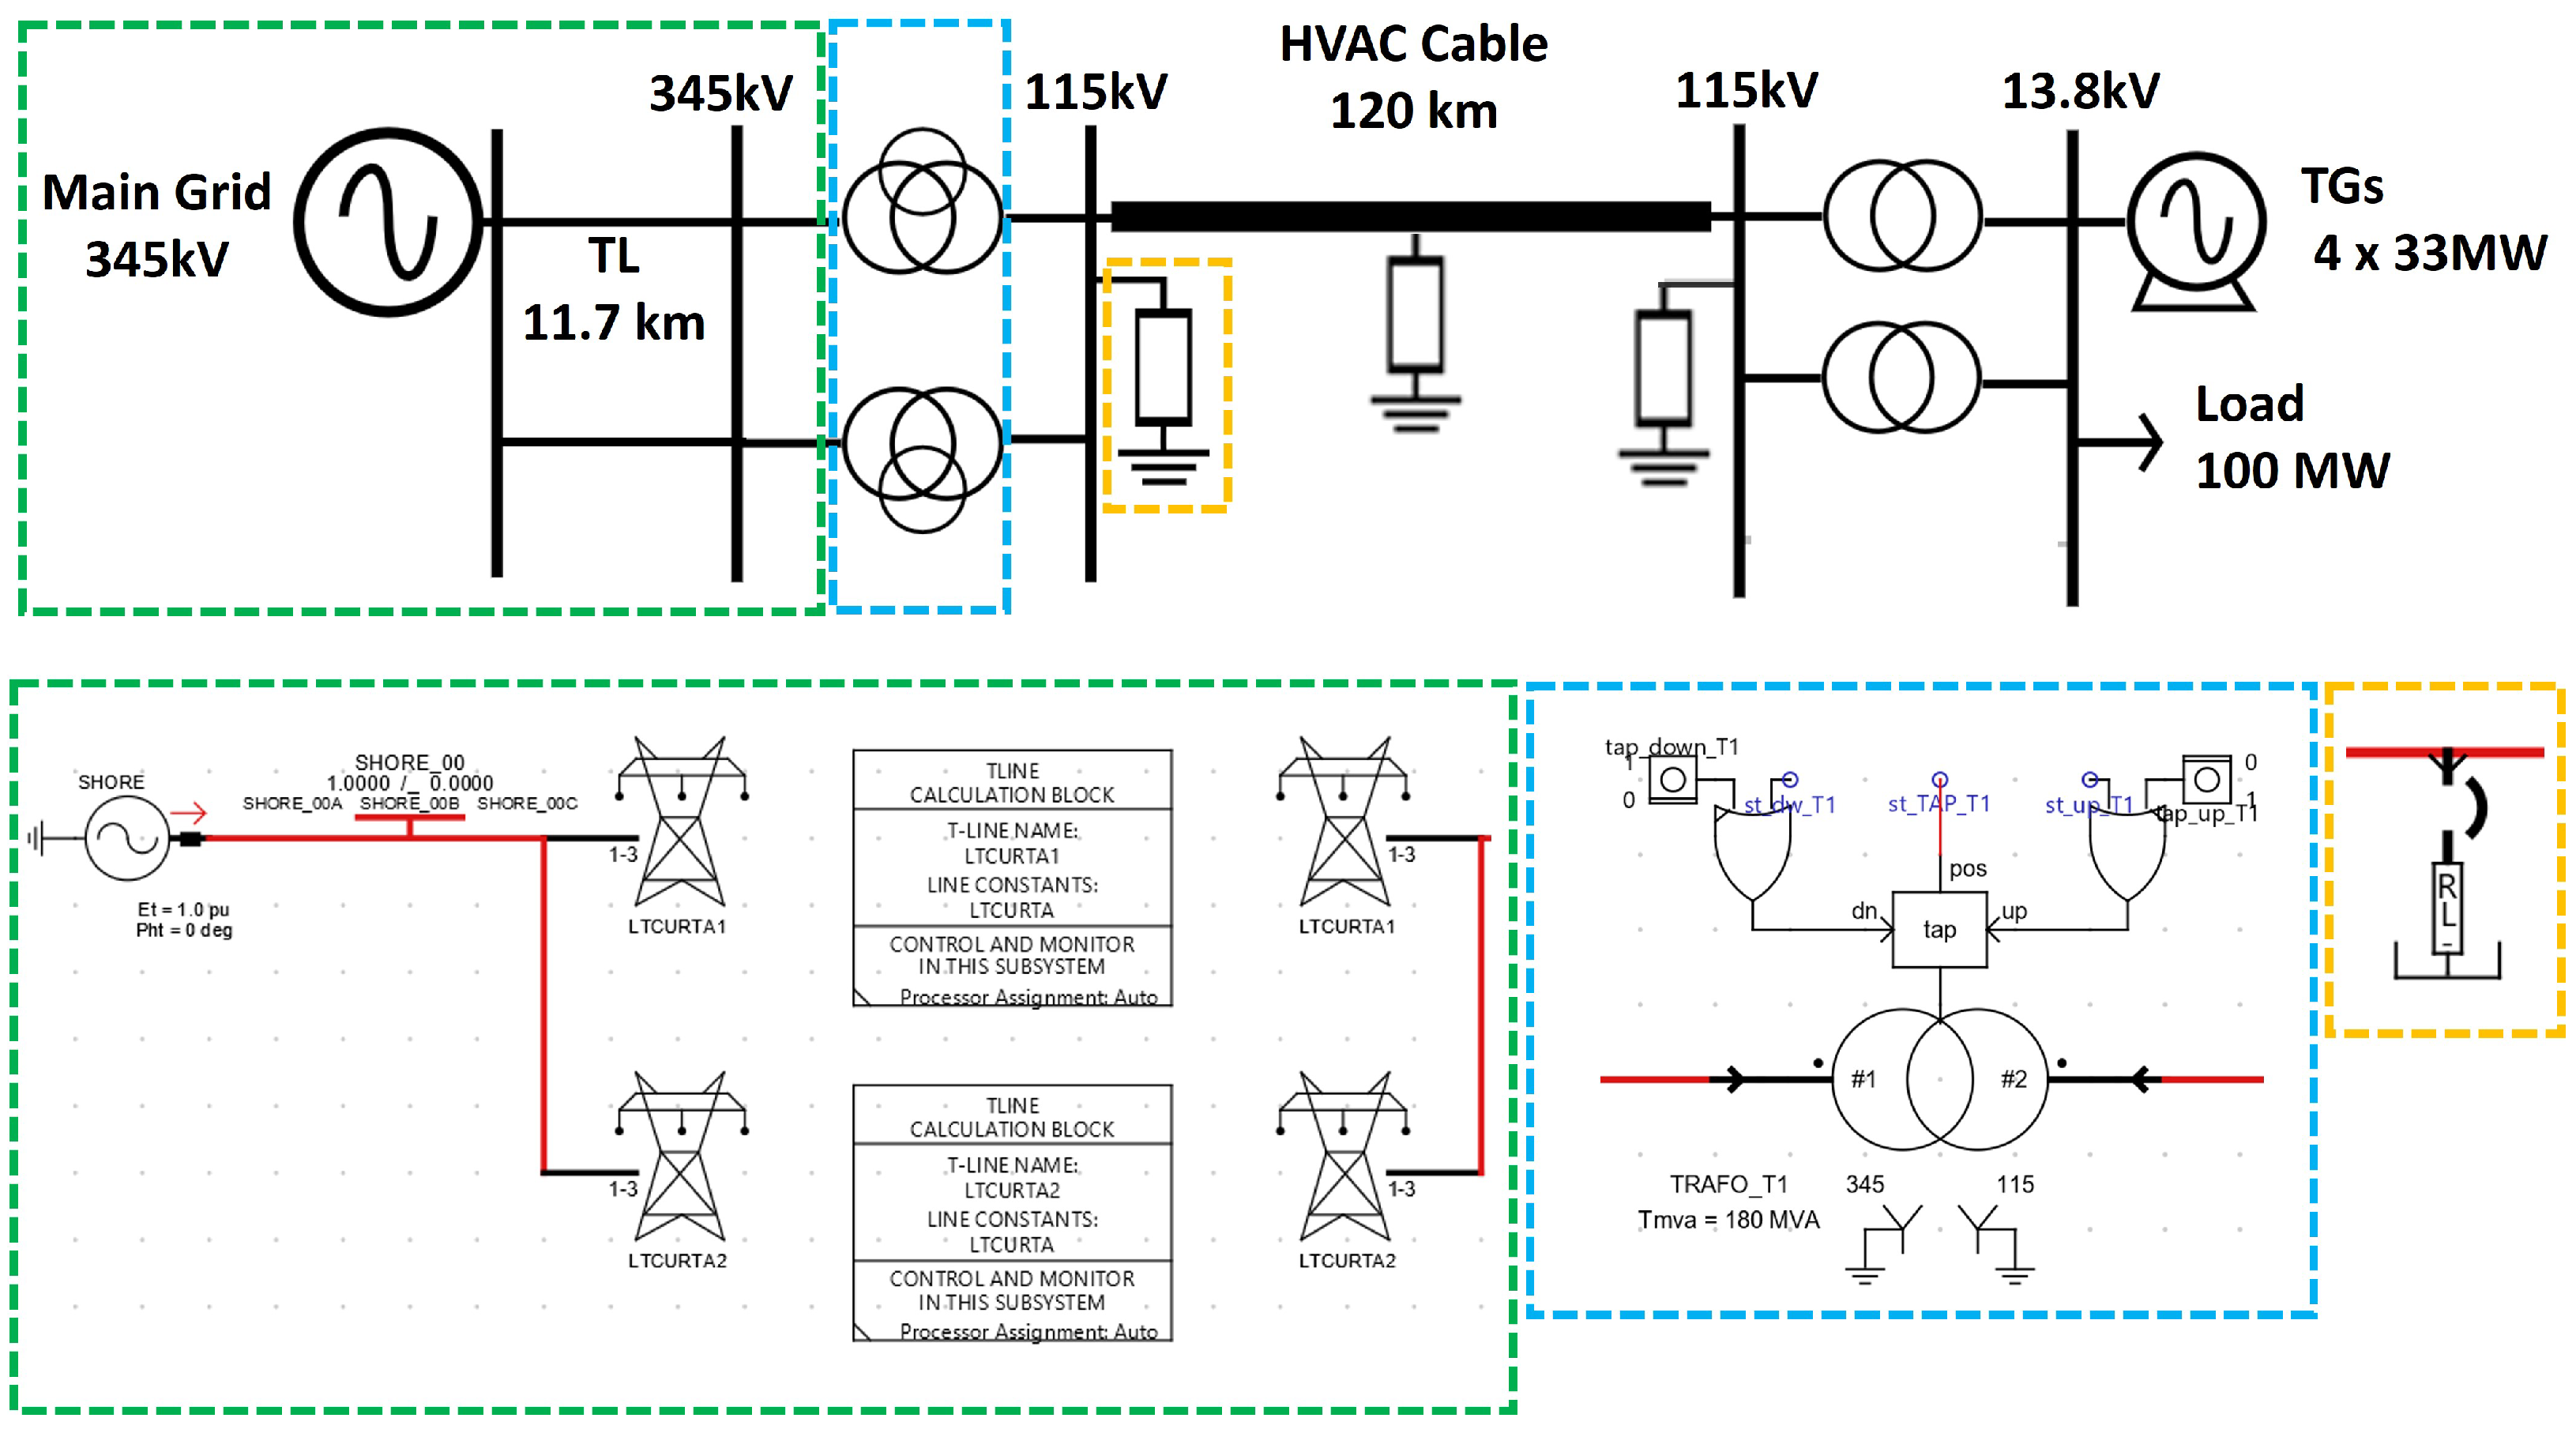
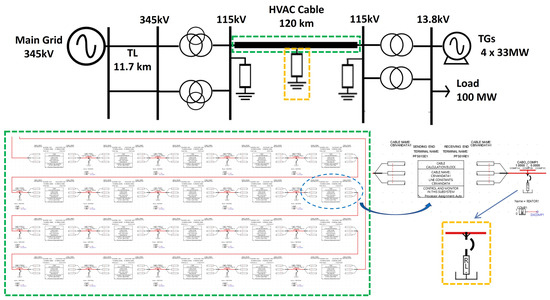
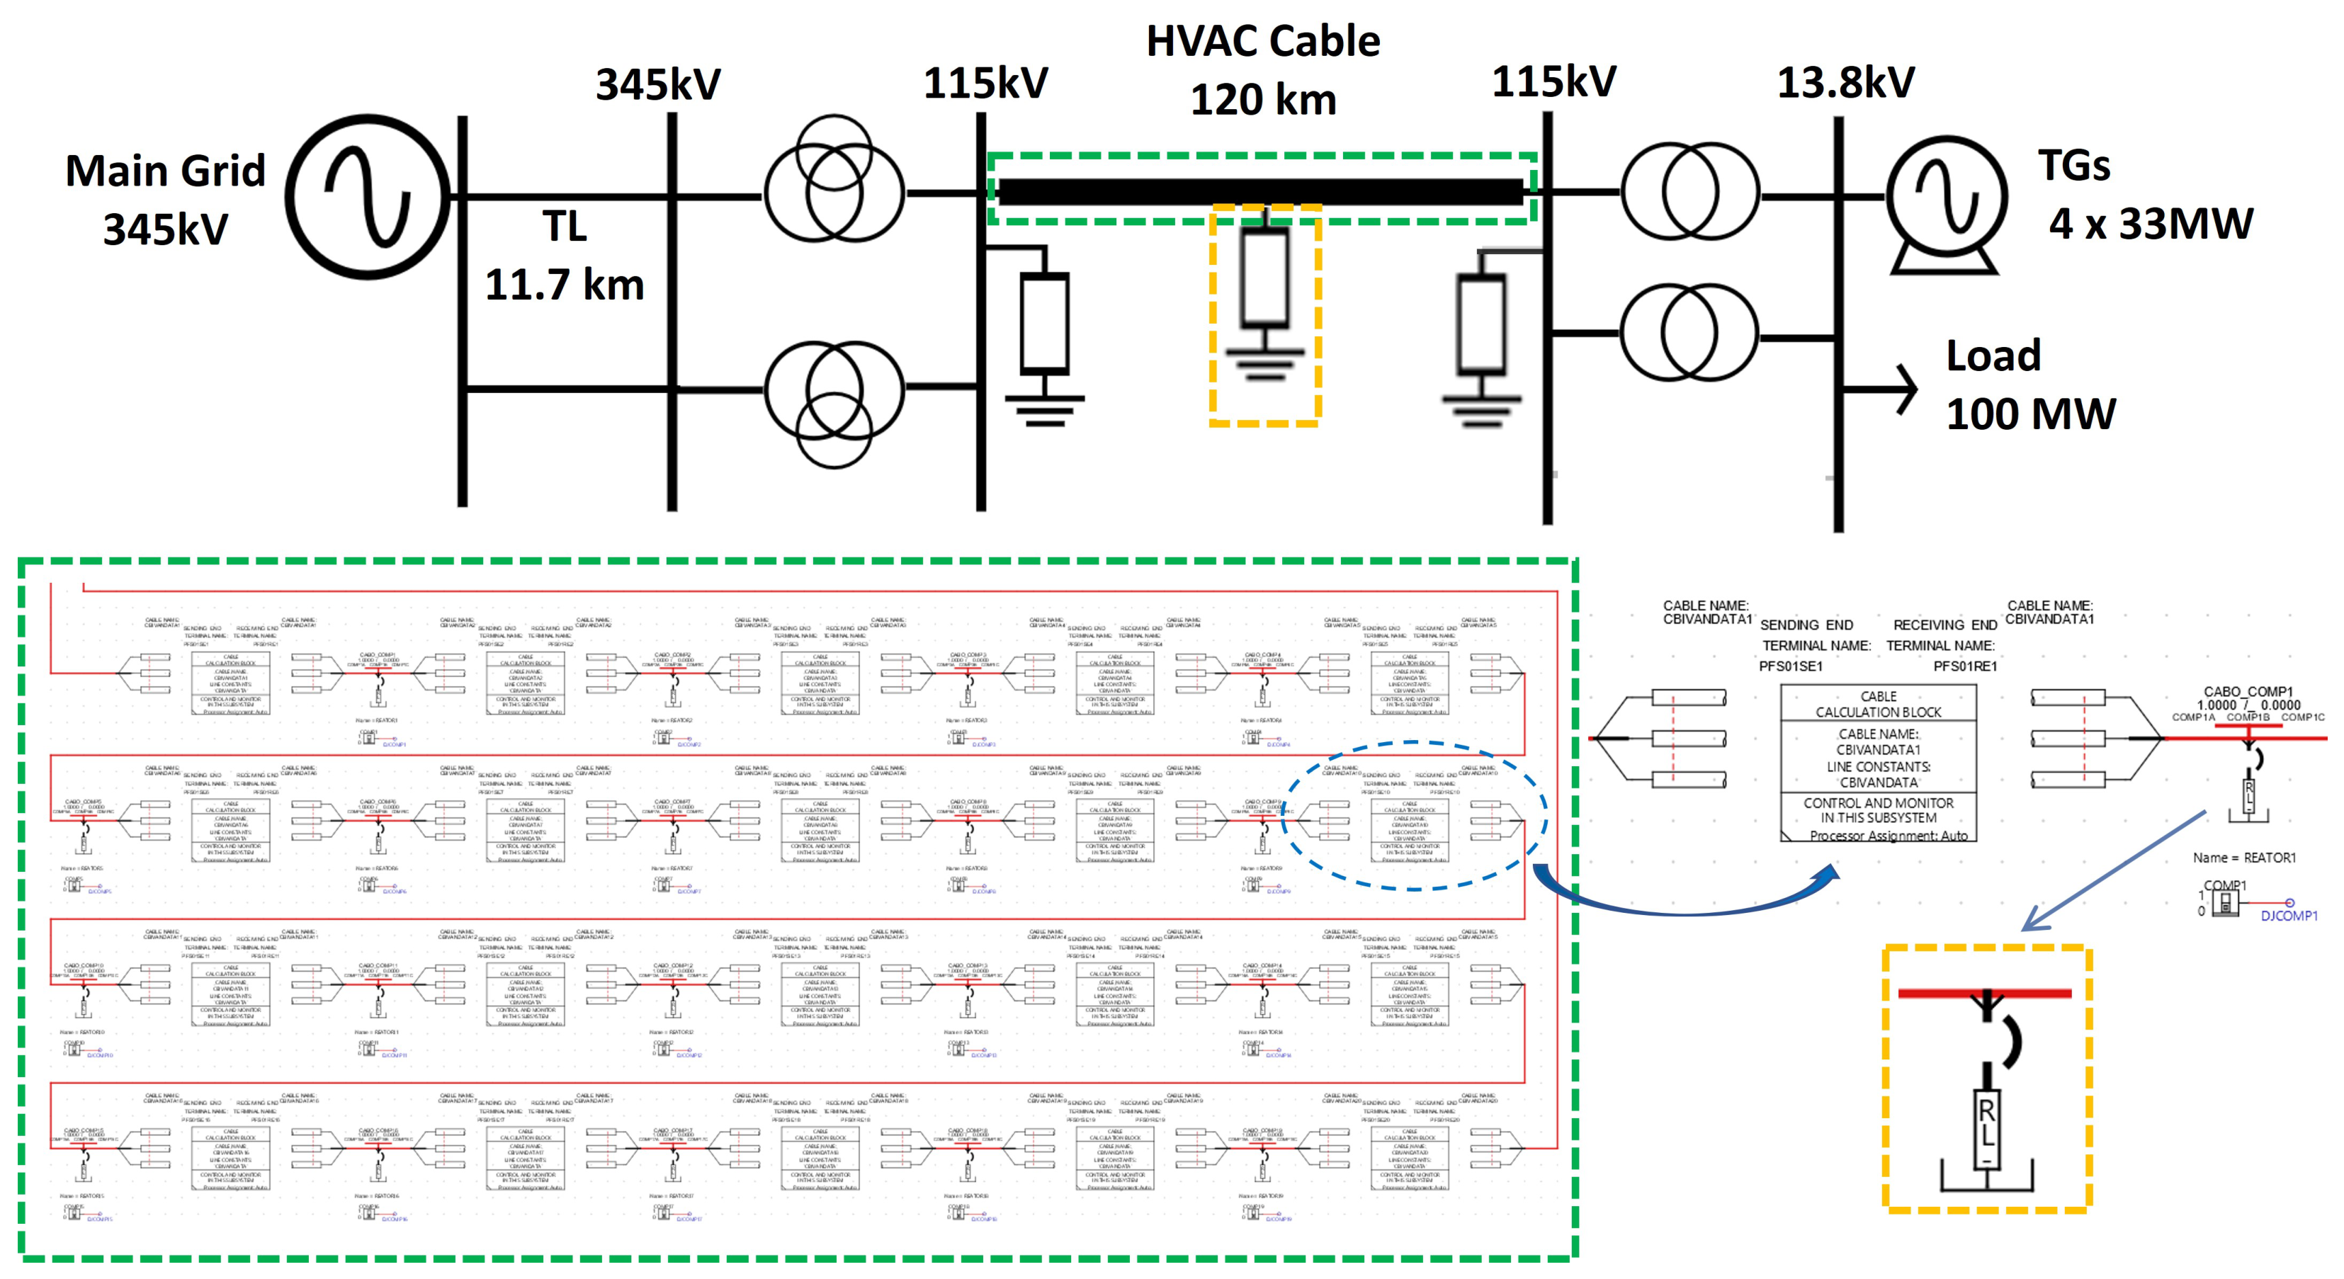
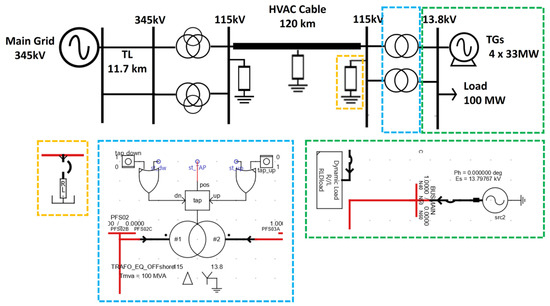
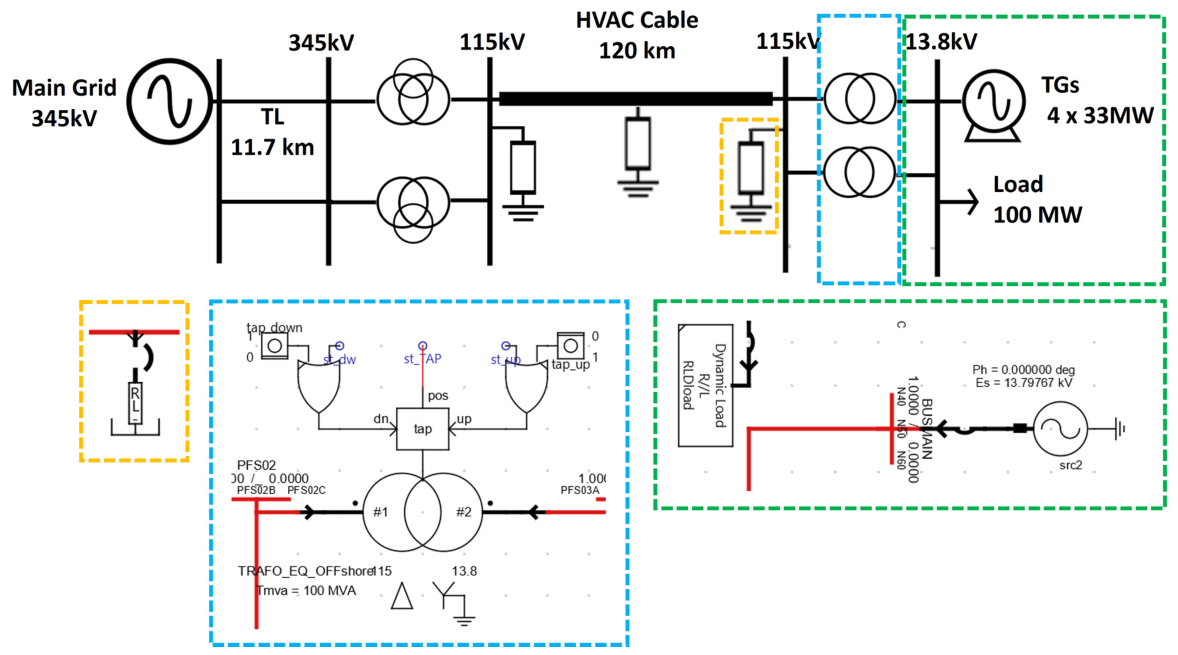
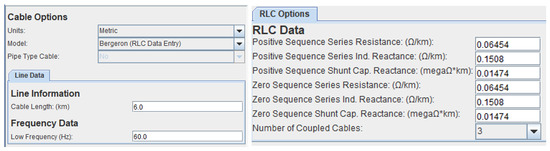
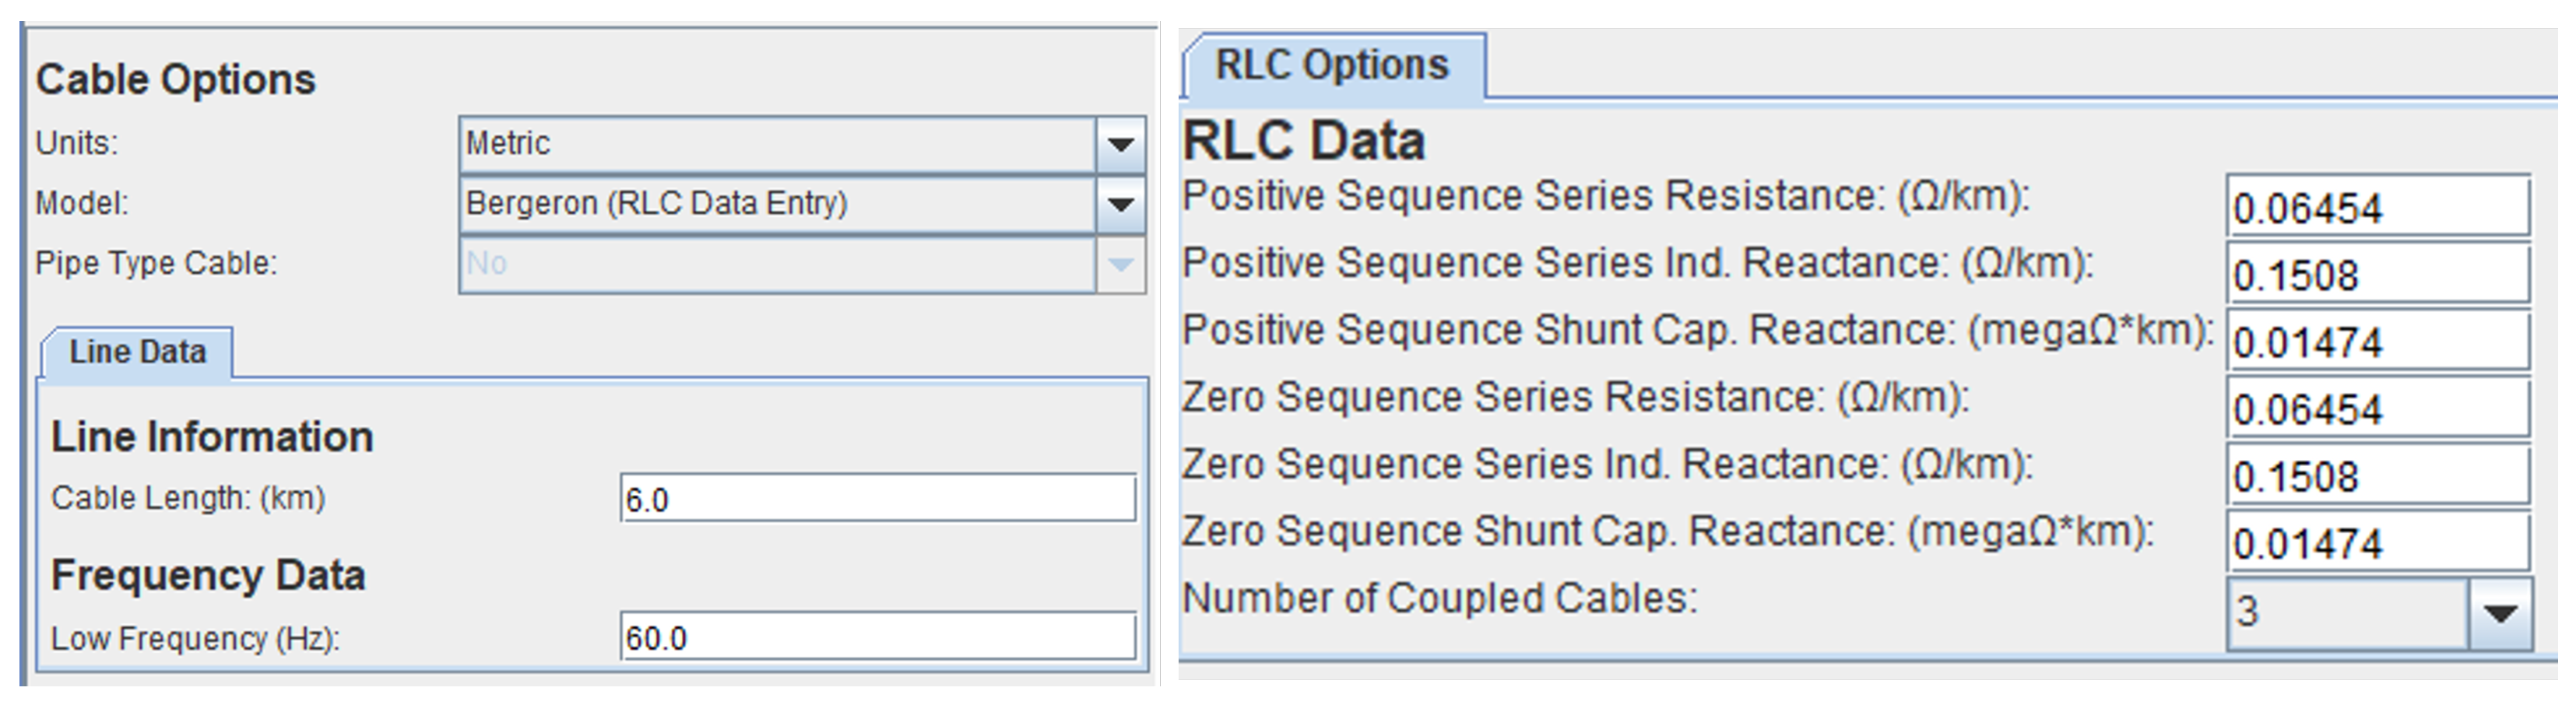
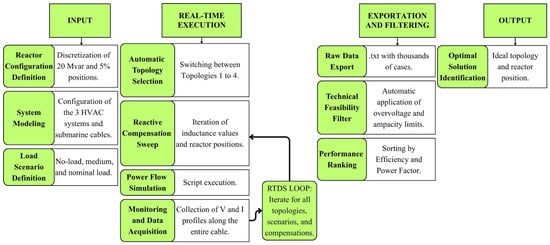
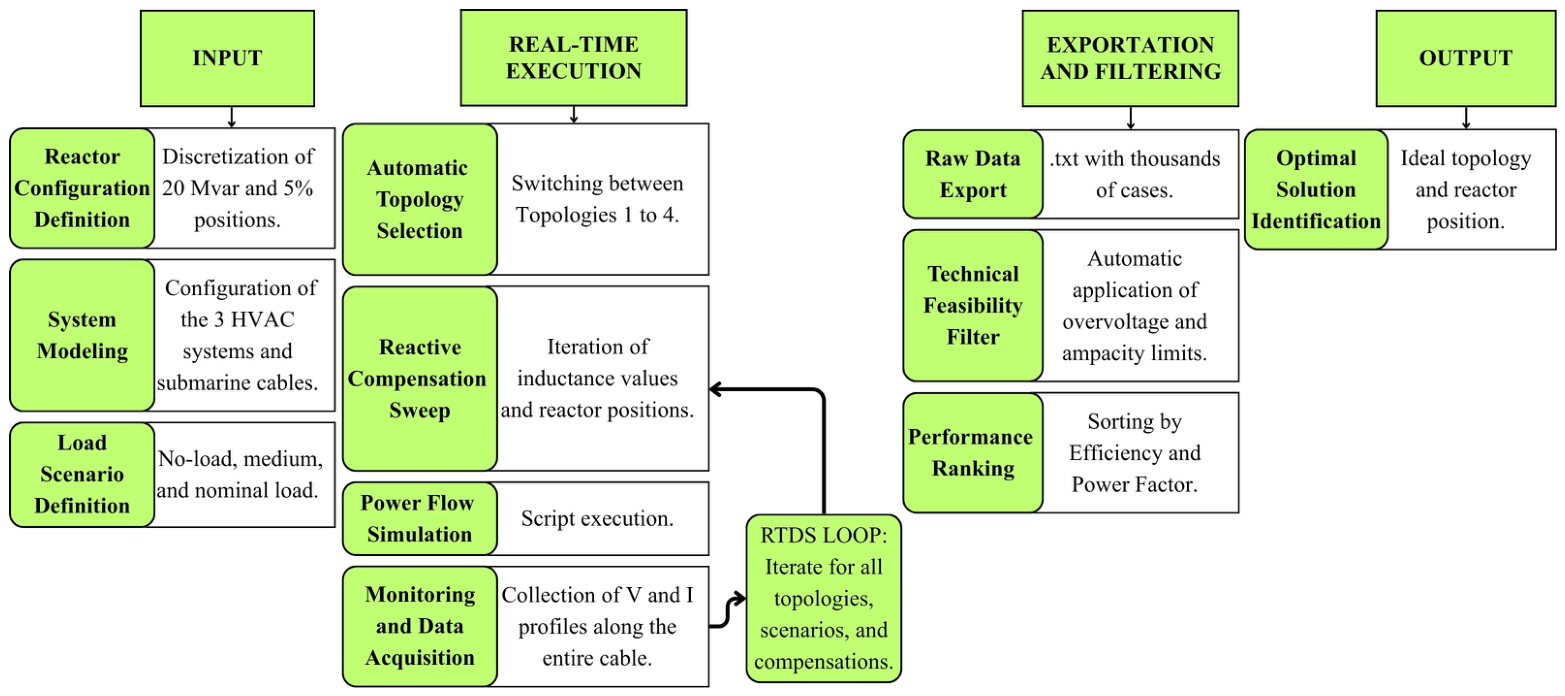
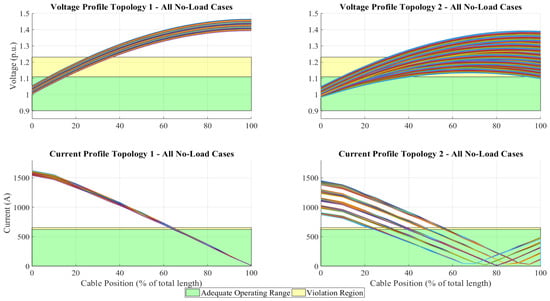
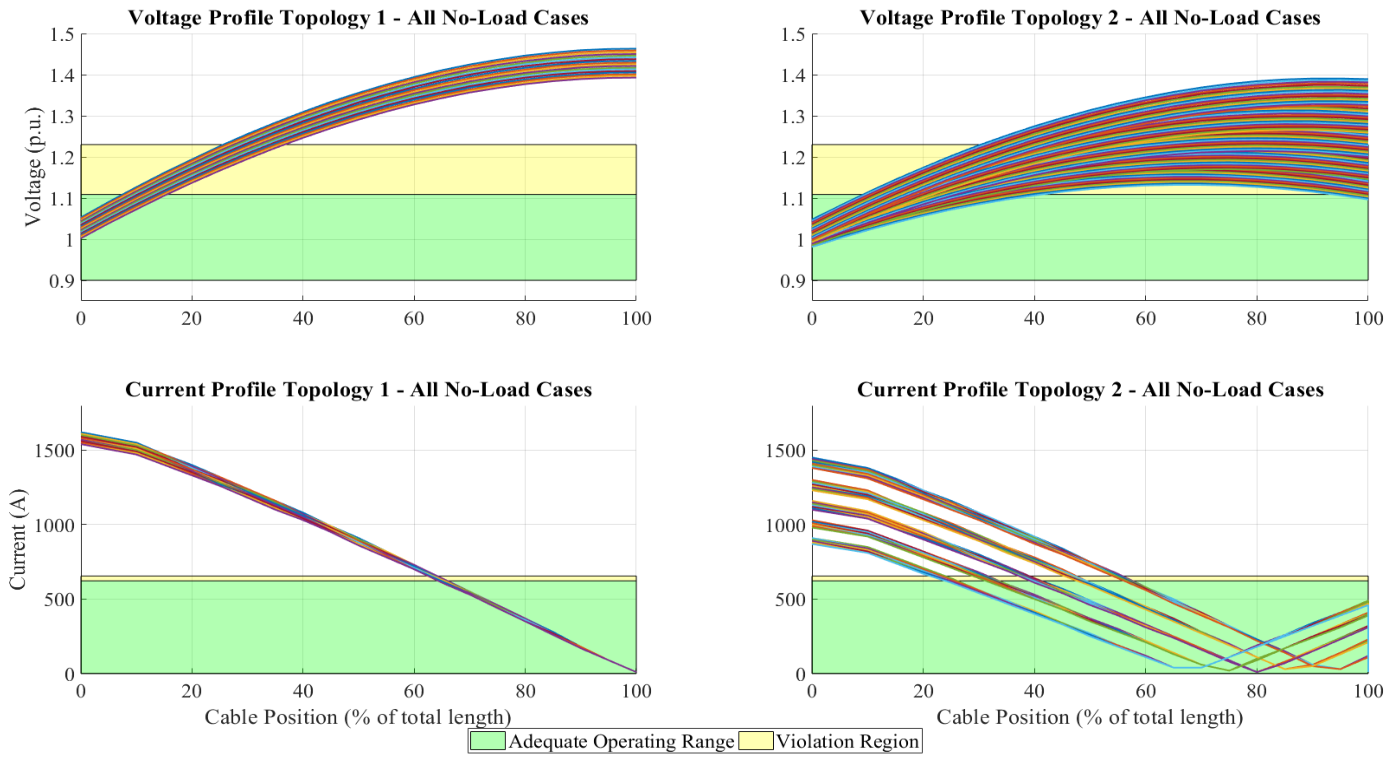
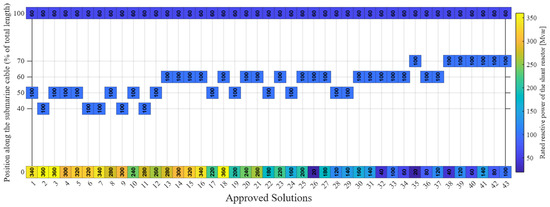
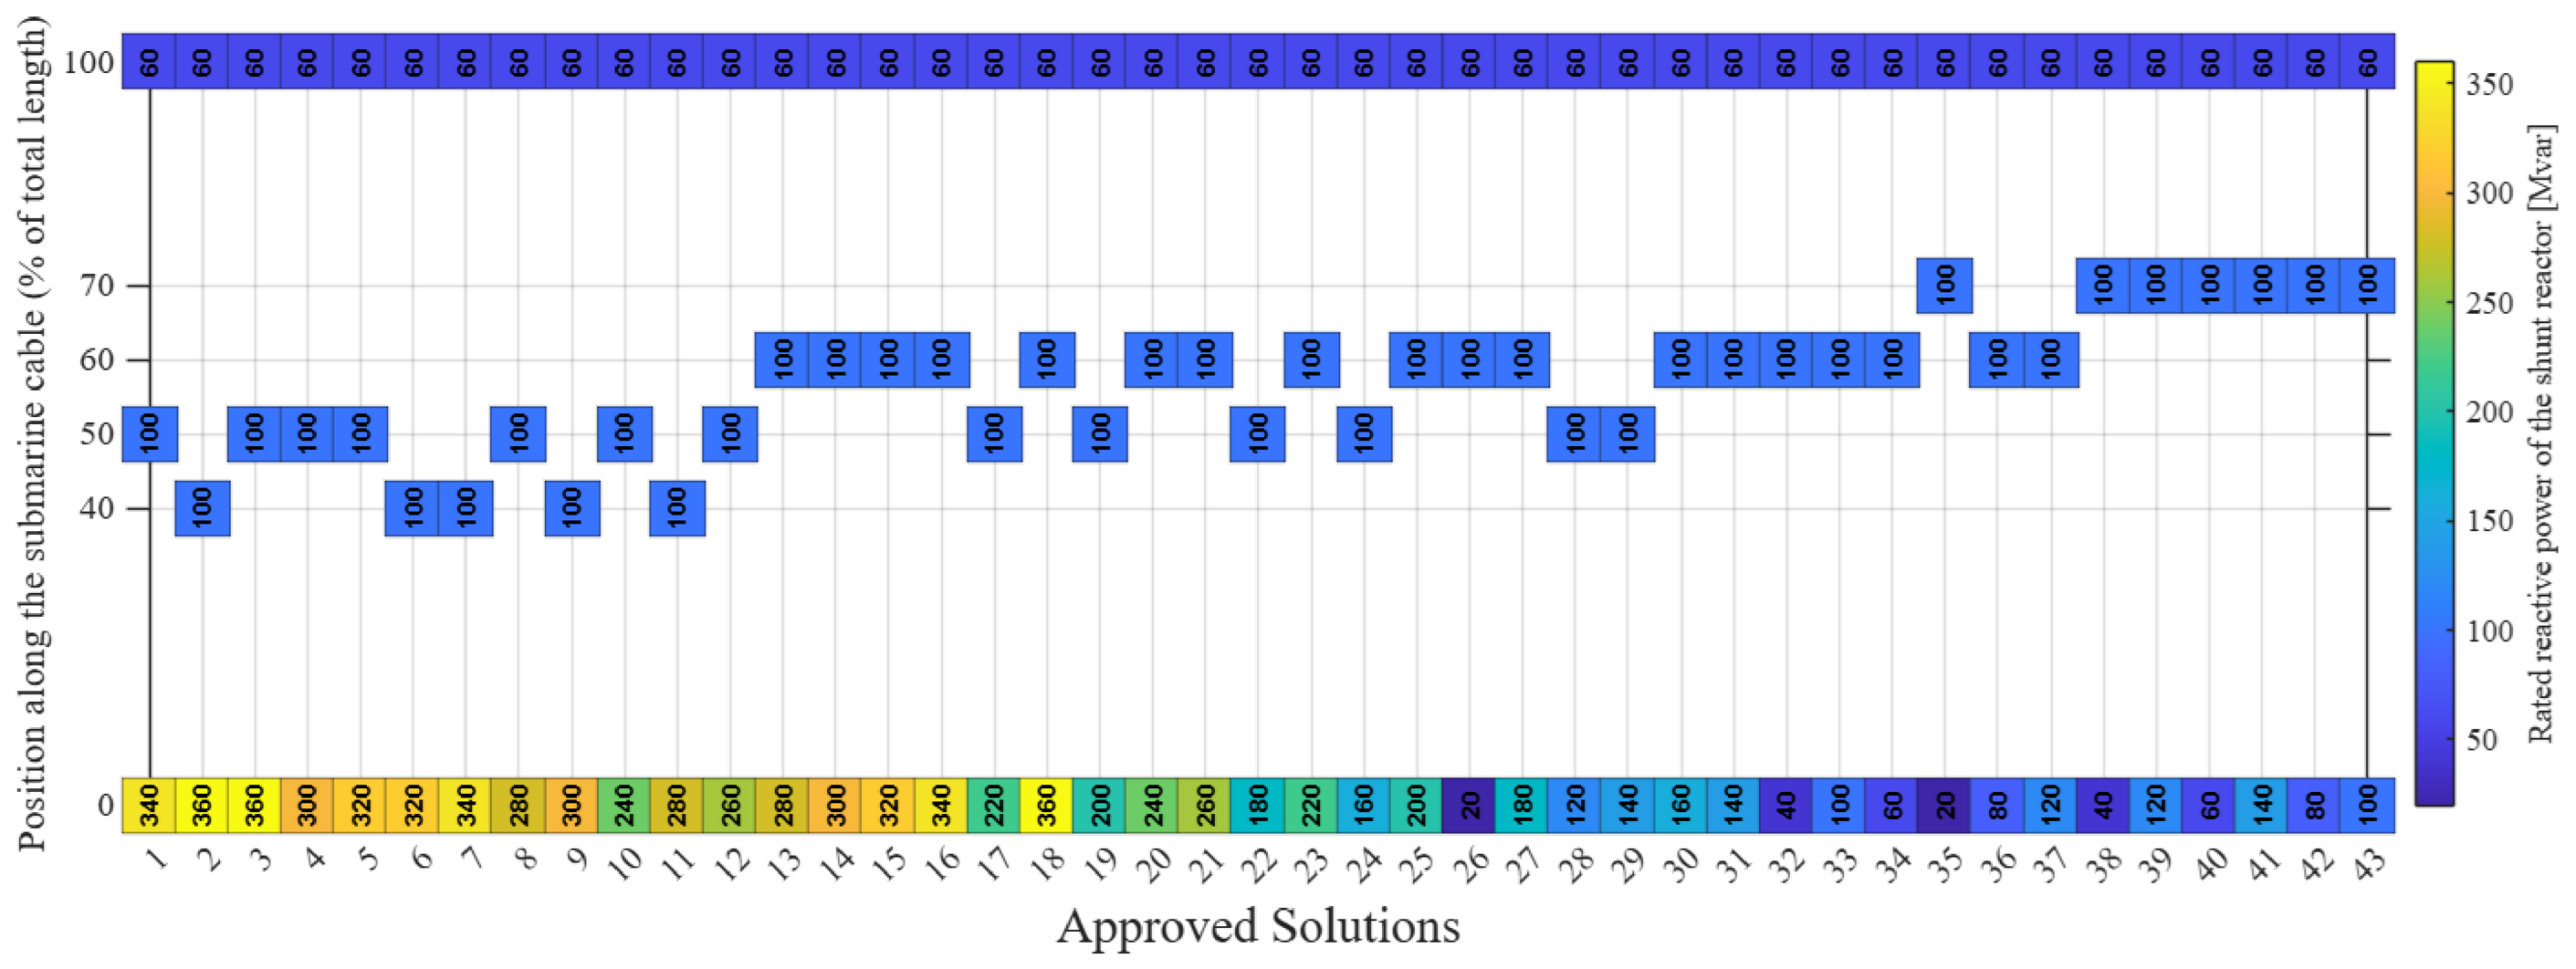
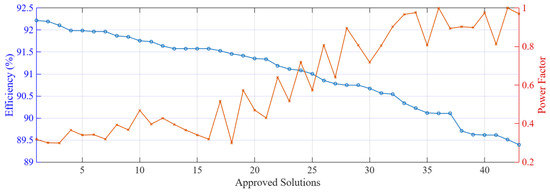
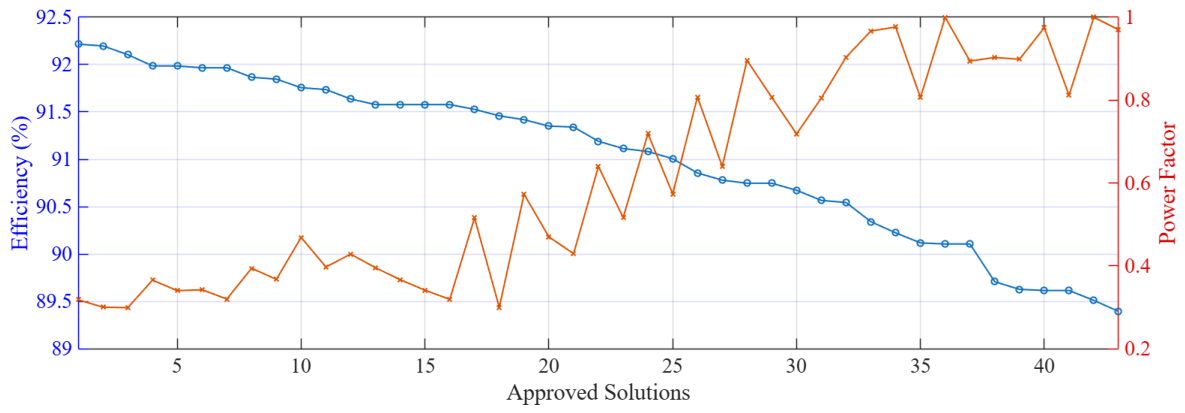
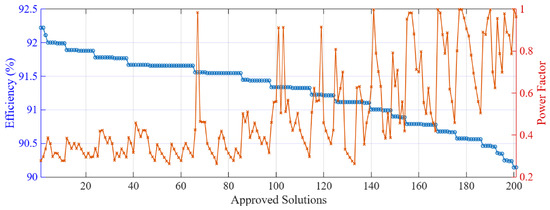
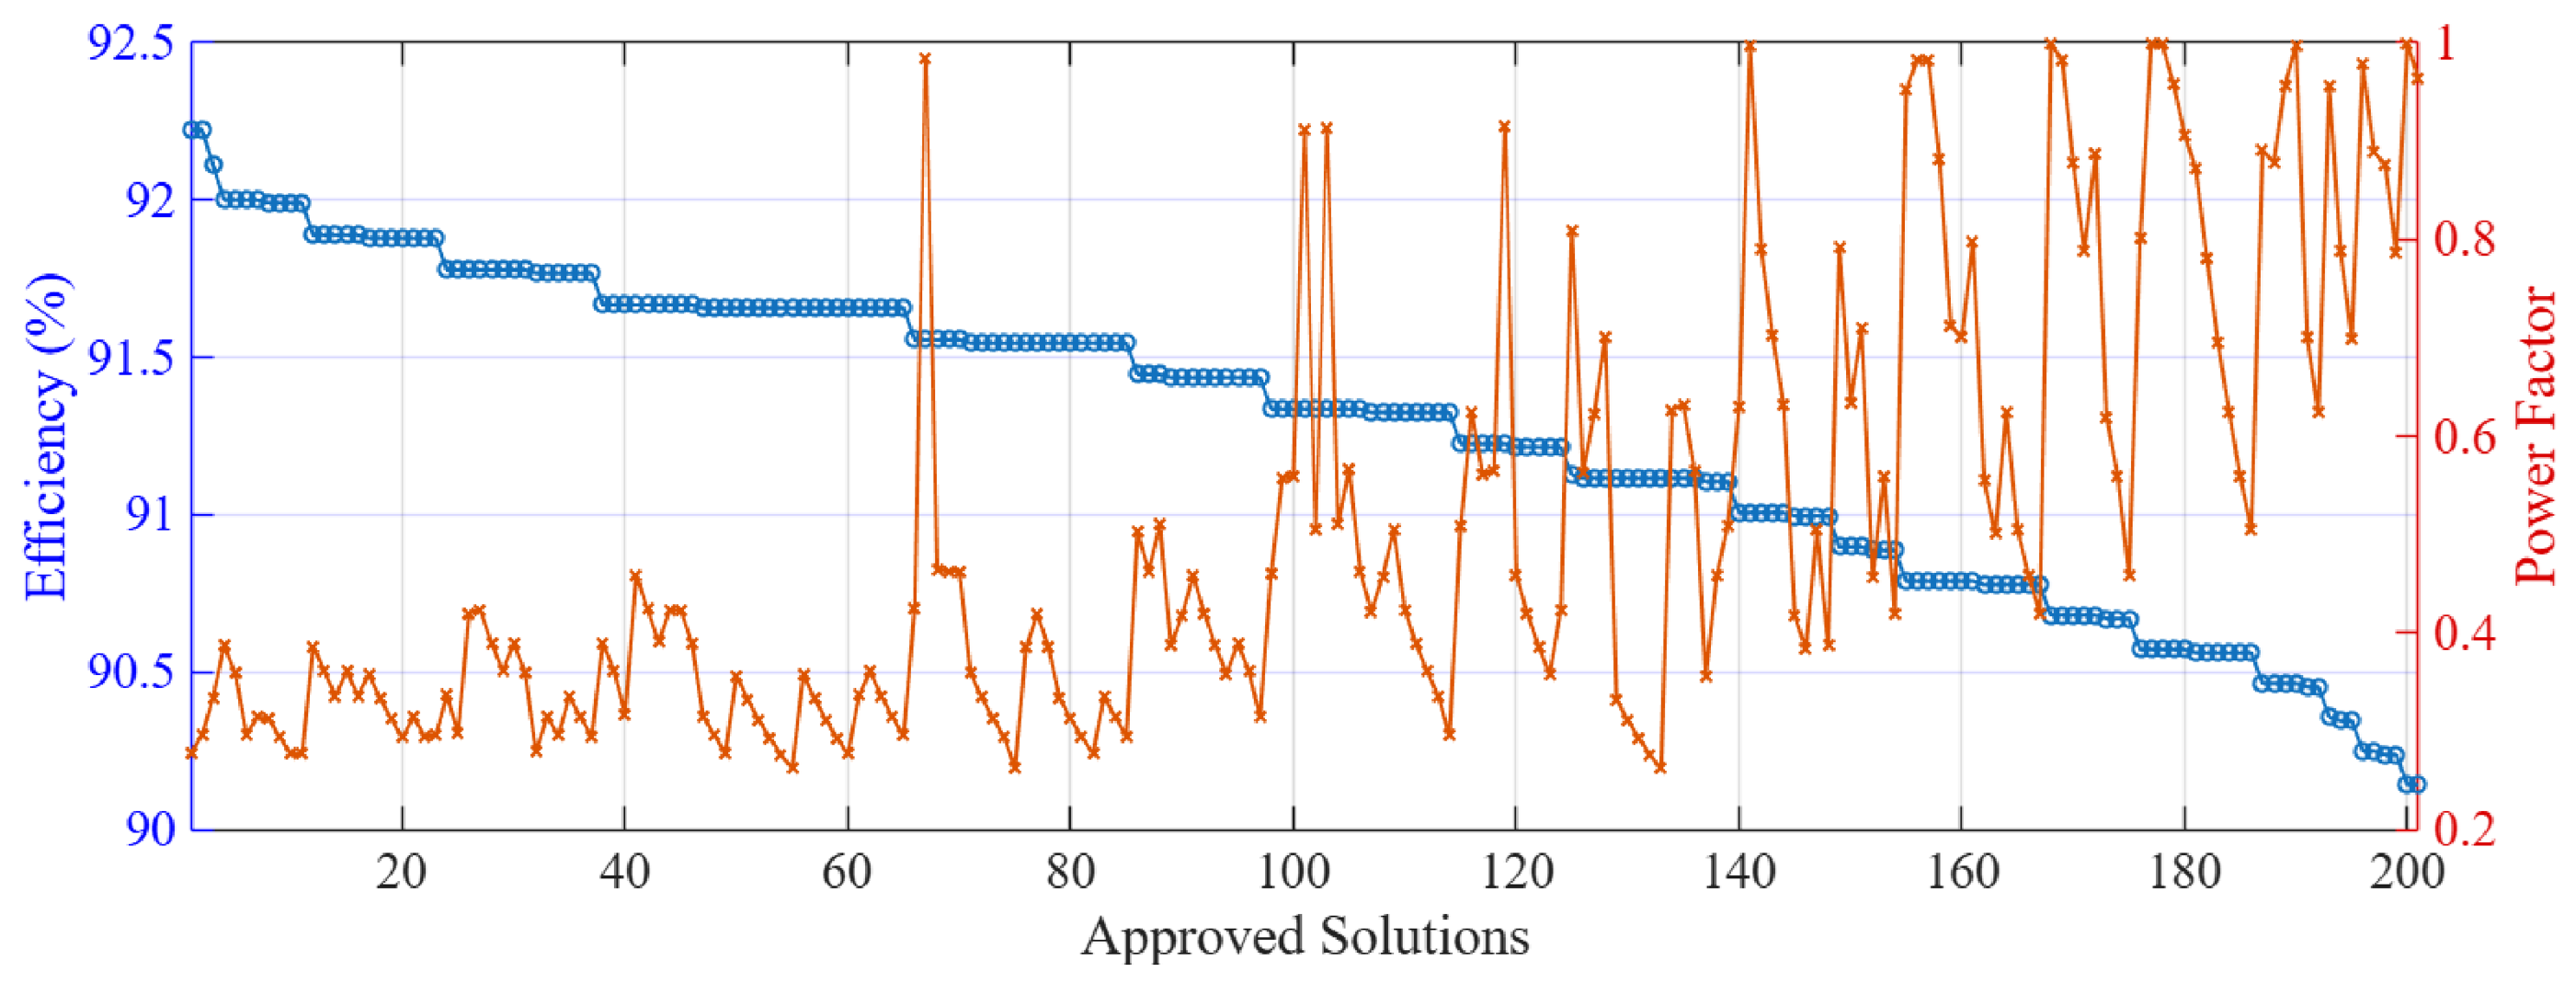
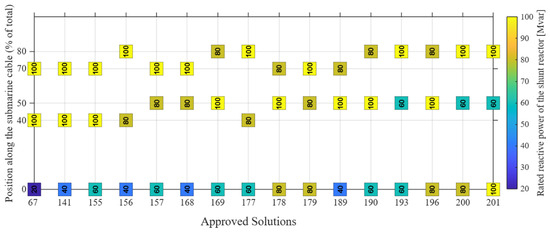
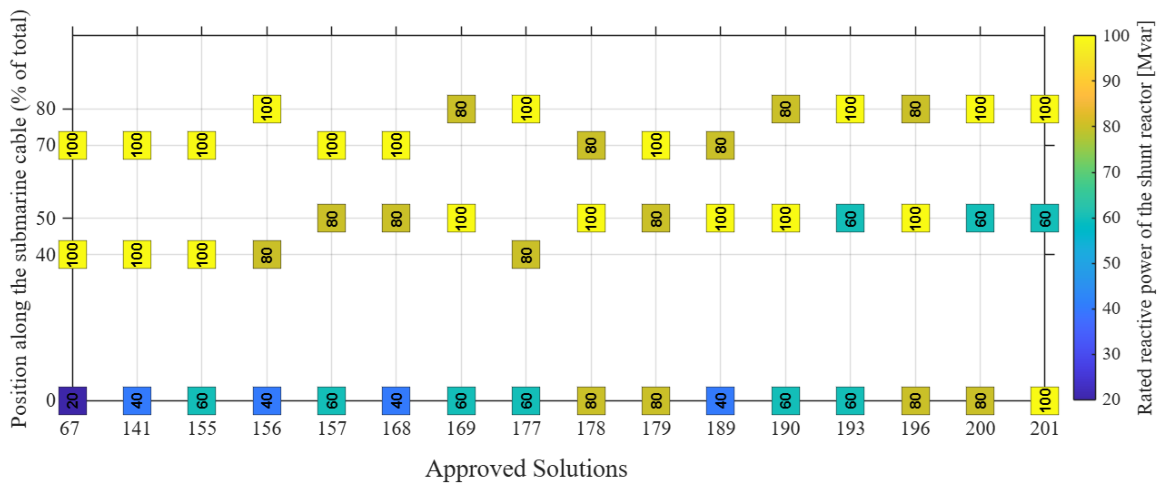
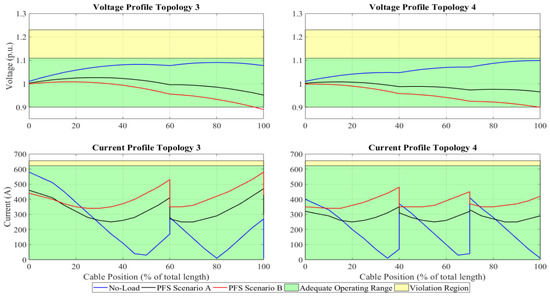
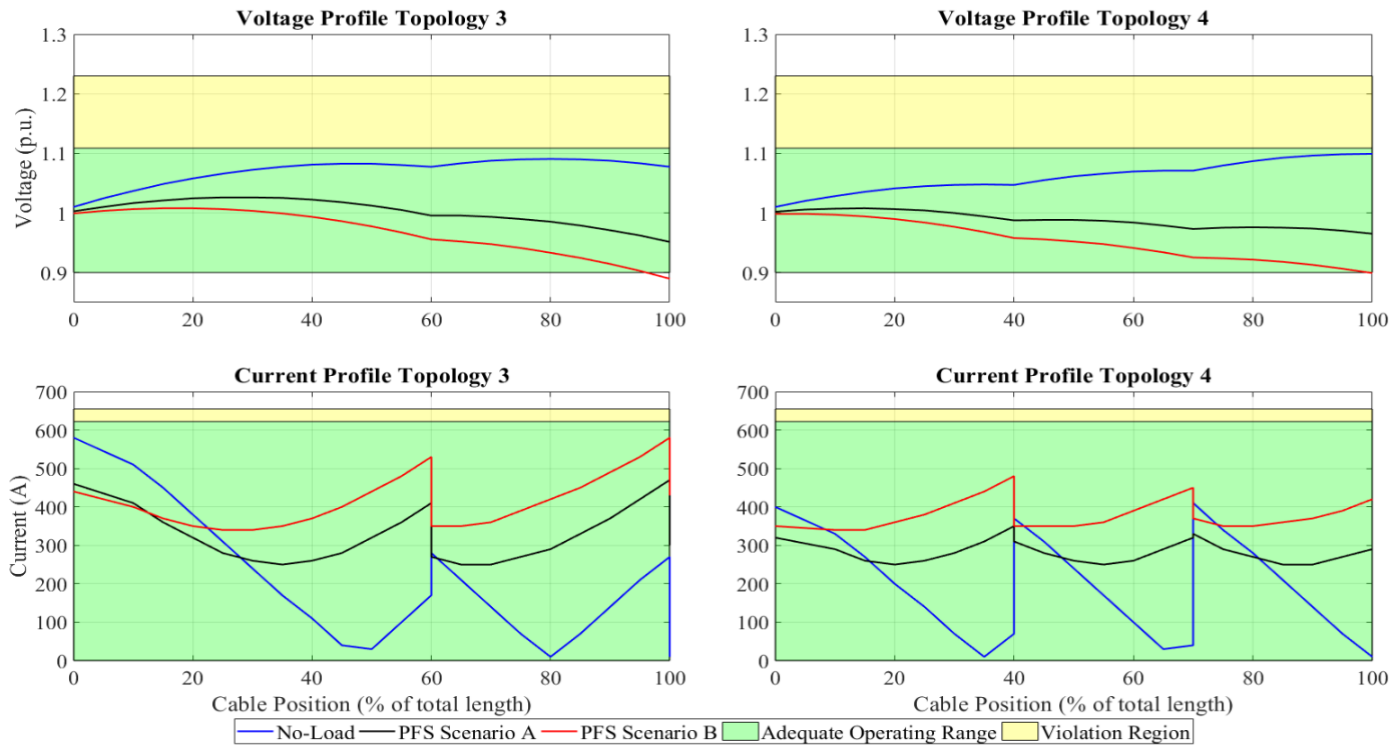
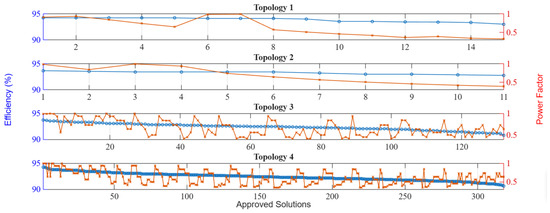
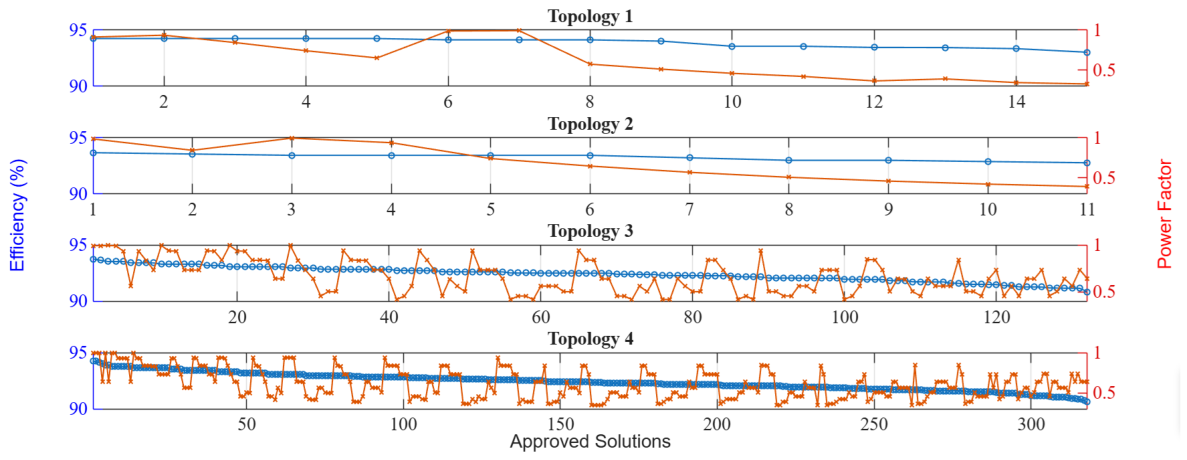
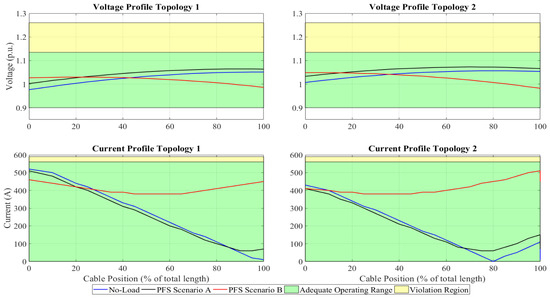
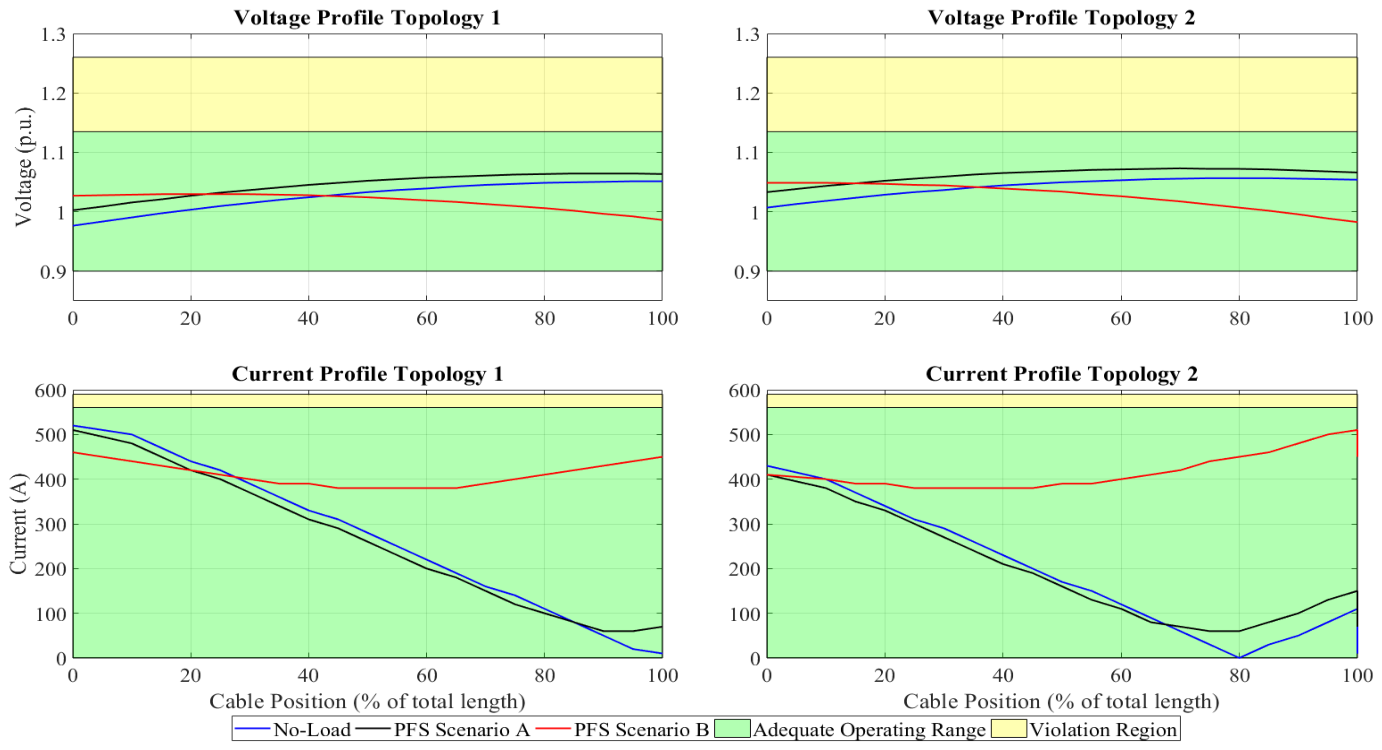
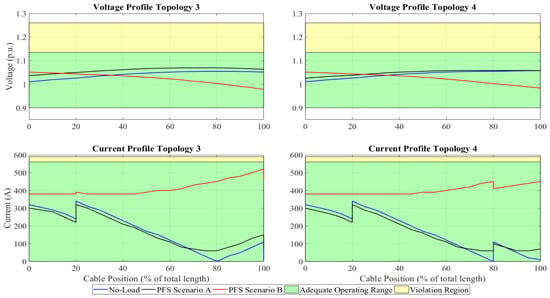
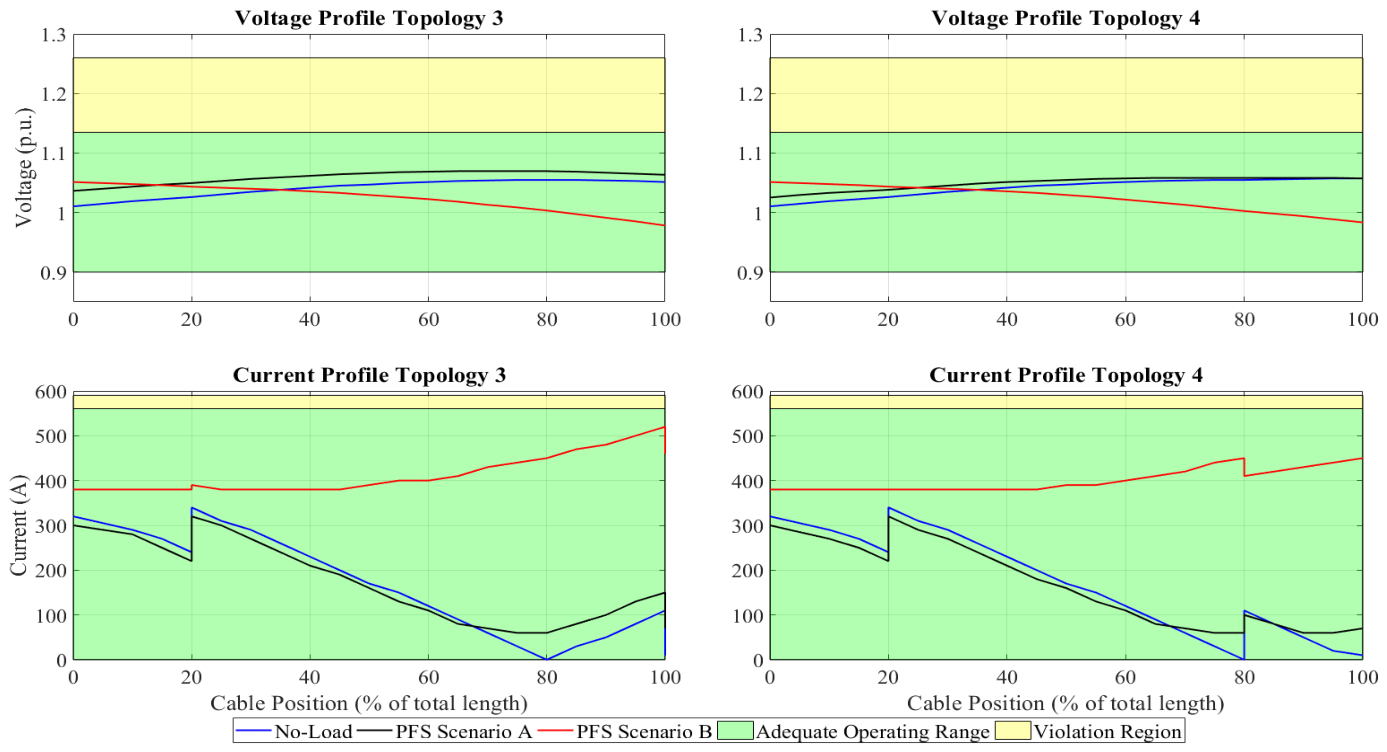
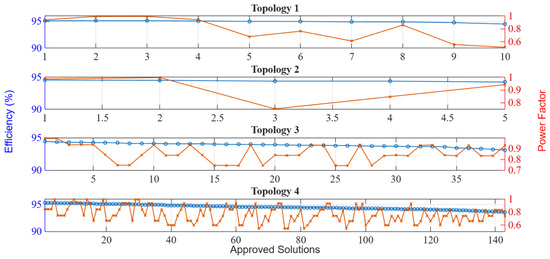
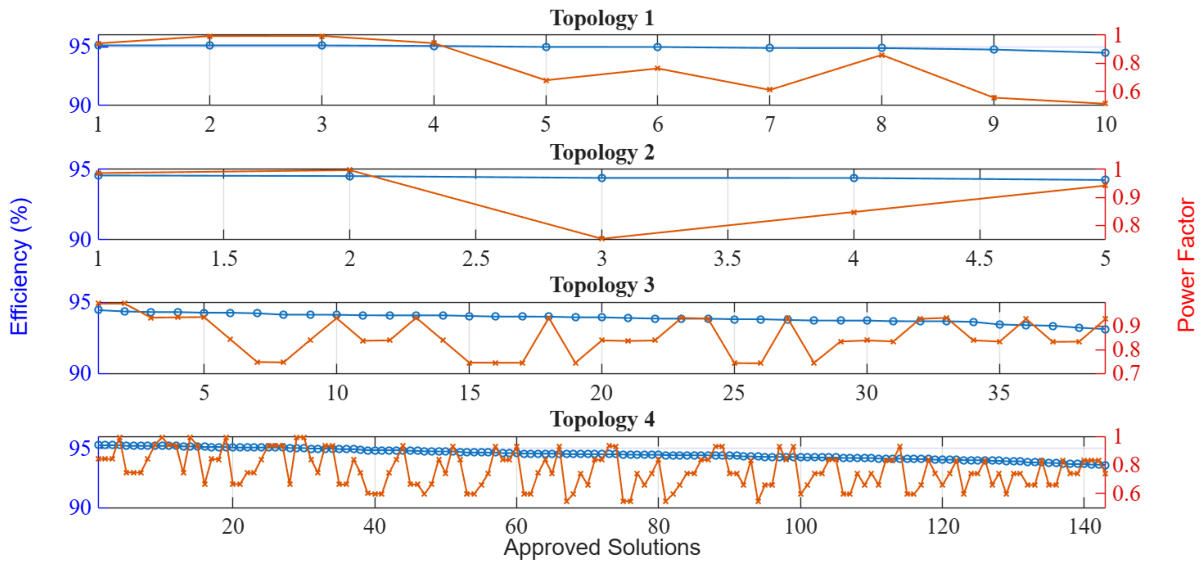
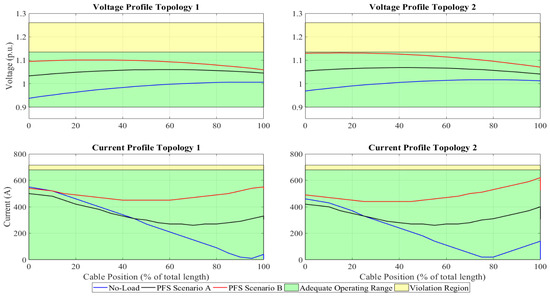
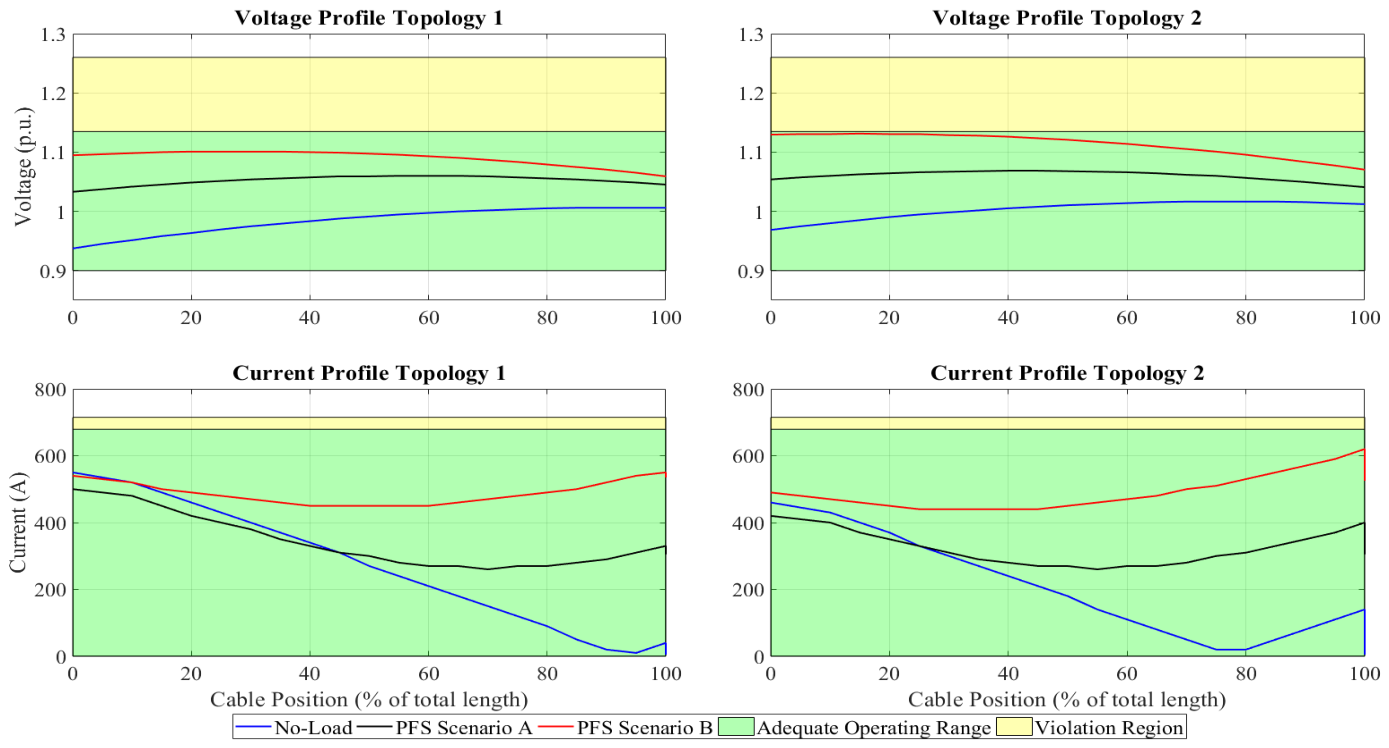
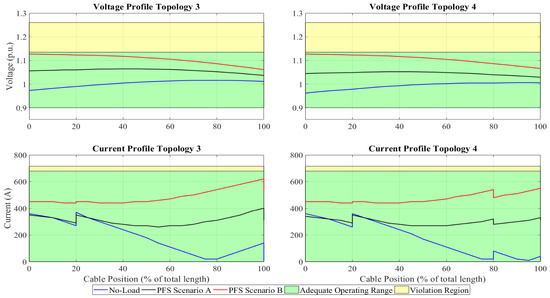
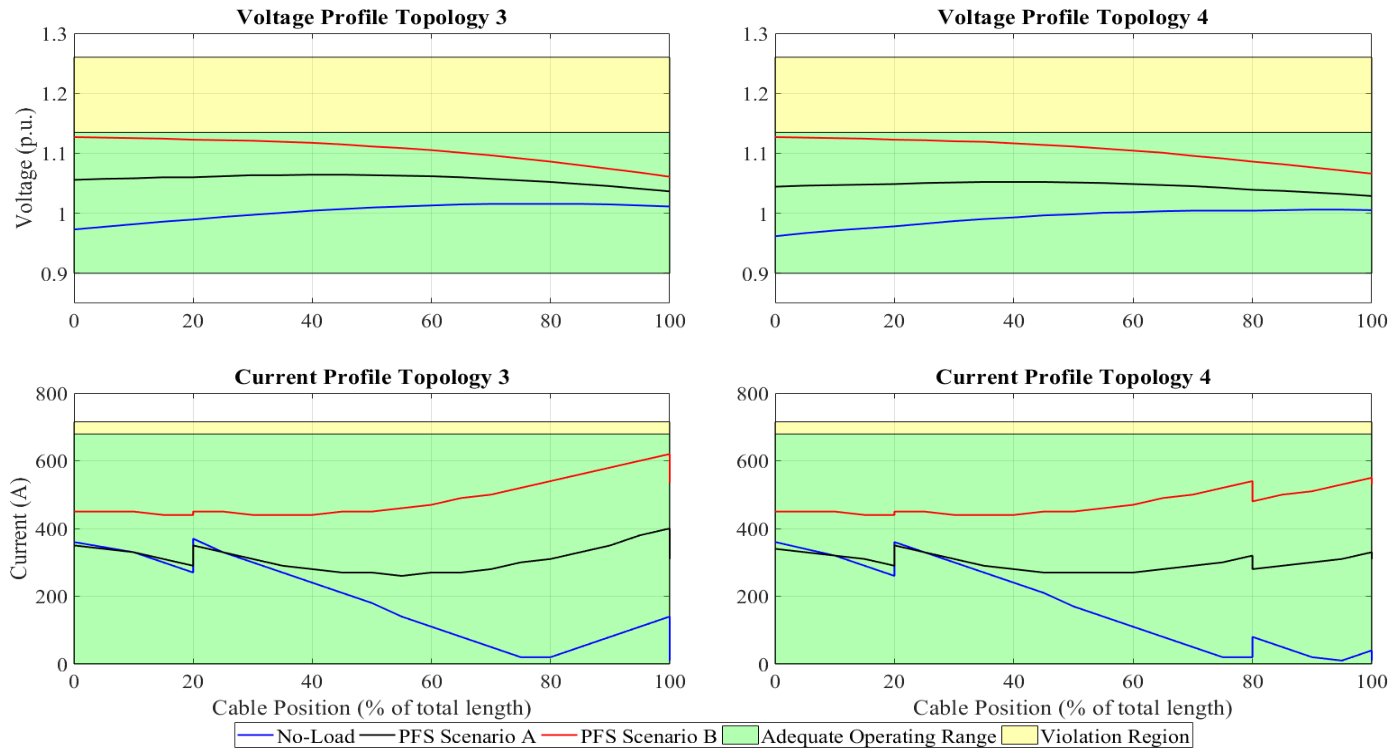

Disclaimer/Publisher’s Note: The statements, opinions and data contained in all publications are solely those of the individual author(s) and contributor(s) and not of MDPI and/or the editor(s). MDPI and/or the editor(s) disclaim responsibility for any injury to people or property resulting from any ideas, methods, instructions or products referred to in the content. |
© 2026 by the authors. Licensee MDPI, Basel, Switzerland. This article is an open access article distributed under the terms and conditions of the Creative Commons Attribution (CC BY) license.