


Abstract
Uncertainties in generation and dynamic load behavior provide new problems for radial distribution systems (RDS) caused by the growing integration of renewable distributed generators (RDGs), including solar photovoltaic (PV) systems and wind turbines (WTs), as well as electric vehicle charging stations (EVCS). This article offers a thorough techno-economic evaluation of how to best distribute RDG resources (solar PV, wind, and EVCS) inside a 28-bus distribution test system in India, taking into account generation volatility due to the seasons. Optimization of installation and operating costs, enhancing voltage stability, and decreasing active power loss are done all at once using a new Catch Fish Optimization Algorithm (CFOA). Integrating beta and Weibull distributions, respectively, into the probabilistic modeling of solar irradiance and wind speed allows for economic analysis to adhere to recognized approaches from contemporary multi-objective optimization frameworks. The simulation findings confirm that the proposed CFOA-based placement method improves economic efficiency, decreases energy loss, and increases system performance.
1. Introduction
Nowadays, the world is moving toward more sustainable and resilient power distribution systems. Hence, the integration of RDGs, like solar PV systems and WTs, as well as EVCS, into radial distribution networks (RDNs) is becoming more important. The integration of renewable energy sources helps to achieve global decarbonization targets, lowering emissions of greenhouse gases and increasing energy security. Nevertheless, there are several operational hurdles to overcome, namely in relation to power losses, voltage stability, and general network dependability, caused by the unpredictable and intermittent characteristic of renewable generation and variable EV charging needs.
To minimize power losses and maintain acceptable RDN voltage profiles, optimal RDG and EVCS size and placement are essential. Analytical and optimization-based methods for DG placement have recently been suggested for various IEEE test systems and in real-world networks, and they successfully decrease reactive and active power losses while improving voltage stability indices (VSIs). As an illustration of the significance of coordinated planning approaches that include grid restrictions and generation variability, improved optimization tactics reduced average power losses by more than 60% when DG was integrated into IEEE 33-bus and 114-bus systems [1].
Distribution network planning has become more difficult as EV charging infrastructure has proliferated. According to recent studies, smart charging techniques, grid-to-vehicle (G2V) and vehicle-to-grid (V2G) operations, and the appropriate placement of EVCS may optimize the usage of local renewable resources and considerably decrease energy draw from the main grid [2]. The need for complex techno-economic models that integrate technical performance with cost outcomes is further emphasized by systematic evaluations that point out new tendencies in EVCS optimization, such as sustainability integration and machine learning (ML)-assisted planning [3].
There is a lack of integrated frameworks that manage generation uncertainty, cost implications, and operational restrictions in a single optimization approach that is appropriate for developing smart grid settings, even though there is a growing amount of literature on RDG and EVCS deployment. Less research has been done on techno-economic analysis that considers uncertainties, real-world distribution test systems, and multi-objective optimization, particularly in the Indian grid context. In this study, seasonal variations, including generation uncertainties, are considered in order to determine the exact output power from RDGs injected into the network, assess the performance of the Indian 28-bus system, and analyze the impact of the EVCS on the network. To work with these limitations, this article presents a techno-economic assessment of the best placement for renewable energy generation gates (RDGs) using solar PV cells, WTs, and EVCS in a 28-bus distribution network. To optimize economic results, including installation and operating expenses, limit active power loss, and increase voltage stability concurrently, a CFOA is set up. The proposed technique incorporates probabilistic modeling of renewable generation, multi-objective optimization, and economic cost assessment drawing from recent state-of-the-art research [4], in contrast to past studies that only analyze isolated elements of placement or cost.
The remainder of this paper is organized as follows: Section 2 presents the literature on some related existing approaches. Section 3 gives the mathematical modeling of RDGs and EVCS under uncertainty. Section 4 describes the CFOA optimization framework. Section 5 presents a case study using the Indian 28-bus system, along with both technical and economic results. Finally, Section 6 concludes with insights and future research directions.
2. Literature Review
The optimal placement and size of EVCSs and RDGs, particularly solar PV and wind systems, in RDSs has recently been the subject of copious study. Aligning with the technological and economic aims of the present research, this literature review synthesizes some existing works.
2.1. Optimal RDG Placement in Distribution Networks
The improvement in network performance is due to less power loss and high voltage profiles. Zangmo et al. [5] explored the optimum placement of RDGs, like WTs and solar PVs, to show how important it is to include uncertainty in placement models. Their work reduced system losses and increased VSIs under fluctuating load circumstances. Likewise, Bouchikhi et al. [1] showed that integrating DG units in the best possible locations reduced power loss and increased VSIs in both the IEEE 33-bus and the 114-bus systems. As per Adegoke et al. [6], by reducing line overloads and improving power quality, optimum DG allocation not only improves technical performance but also delivers environmental and economic advantages. Stochastic optimization models take into account the uncertainty of renewable generation and demand when suggesting the size and placement of DGs. An approach proposed by Hussein Farh et al. [7] helps people make decisions.
The optimization process is much more robust when renewable generation uncertainty is taken into account, as per some existing RDG placement works. To determine DG sizes accurately, new frameworks for stochastic and mixed-integer optimization are emerging. Integration of RDGs with energy storage should be done to reduce power fluctuation and increase resilience. This includes models that combine PV systems with battery energy storage systems (BESS), as per Deeum et al. [8].
2.2. EVCS Placement and Its Impact on Distribution Networks
Motlagh et al. [9] highlighted the importance of uncertainty in charging behavior and renewable generation. Their work examined the operating strategies of smart EVCS, considering market interactions and grid restrictions. The findings confirmed that efficient station design decreases active and reactive power losses when examining EVCS placement in grids integrated with PV and battery systems [8]. The improper location of EVCSs may lead to uneven loads and poor power quality. The need for integrated planning that considers both DGs and EVCSs is highlighted by the negative effects of inadequate EVCS placement on voltage stability and reliability, as given by Lara Leon et al. [10].
The literature on EVCS placement emphasizes the importance of considering power quality issues and load imbalance during EVCS design. Improved solution quality is achieved by using evolutionary and hybrid optimizers in EVCS placement methods as per Izzati et al. [11].
2.3. Joint RDG and EVCS Planning Approaches
The compatibility of renewable energy with electrified transportation loads enables the integration of RDGs and EVCSs. Authors Soliman et al. [12] suggested using advanced evolutionary algorithms to determine the size and placement of DG units and EVCSs simultaneously, which efficiently minimizes voltage variations and system losses. By including DGs, EVCSs, and static compensators into comprehensive optimization, Pagidipala et al. [13] showed gains in many performance indicators, even after accounting for uncertainties and network reconfiguration. The complex correlations between the distribution of demand for electric vehicle (EV) charging and the operation of distribution networks were brought to light in other recent research that expanded cooperative planning to transportation distribution-linked frameworks by Nareshkumar et al. [14].
2.4. Economic and Uncertainty Considerations
Recent works have highlighted the importance of considering economic results and uncertainty effects on RDG and EVCS planning, along with their technical performance. More comprehensive solutions for long-term planning are provided by stochastic and carbon-aware optimization frameworks, which work together to handle investment, operational, and emission costs by Wang et al. [15]. To find a good balance between peak loads and operating costs, refs. [16,17,18,19] investigated the techno-economic assessment of EV charging schemes. Table 1 provides a brief summary of these existing approaches.
Table 1.
Summary of recent literature.
Various seasons covered and real-time data of 28 test systems considered. Not considering the generation uncertainties further, most of the authors treat DG as a constant generation source in this work. Despite the growing body of literature on the deployment of Renewable Distributed Generators (RDGs) and Electric Vehicle Charging Stations (EVCS), there remains a lack of integrated frameworks that simultaneously address generation uncertainty, cost implications, and operational constraints within a single optimization approach suitable for evolving smart grid environments. Moreover, limited research has been conducted on comprehensive techno-economic analyses that incorporate uncertainties, real-world distribution test systems, and multi-objective optimization, particularly in the context of the Indian power grid. In addition, seasonal variations and generation uncertainties are considered in this study to accurately estimate the power output from RDGs and its effective injection into the network. The performance of the Indian 28-bus system is evaluated, along with an assessment of the impact of EVCS integration on overall network operation.
3. System Modeling and Problem Formulation
3.1. Overview of the Distribution System
Most researchers in India use the 28-bus radial distribution test system in India owing to its good representation of a real-world metropolitan power distribution network. The features of this system comprise variable seasonal load demand, a radial topology, a high resistance-to-reactance (R/X) ratio, and a single major substation. Since each bus serves as a load center, the system design is suitable for assessing the effects of DG and EVCS integration on power losses, voltage profiles, and overall system economics. This work integrates three types of distributed resources, including solar PV (SPV)-based DGs, WT-based DGs, and EVCSs.
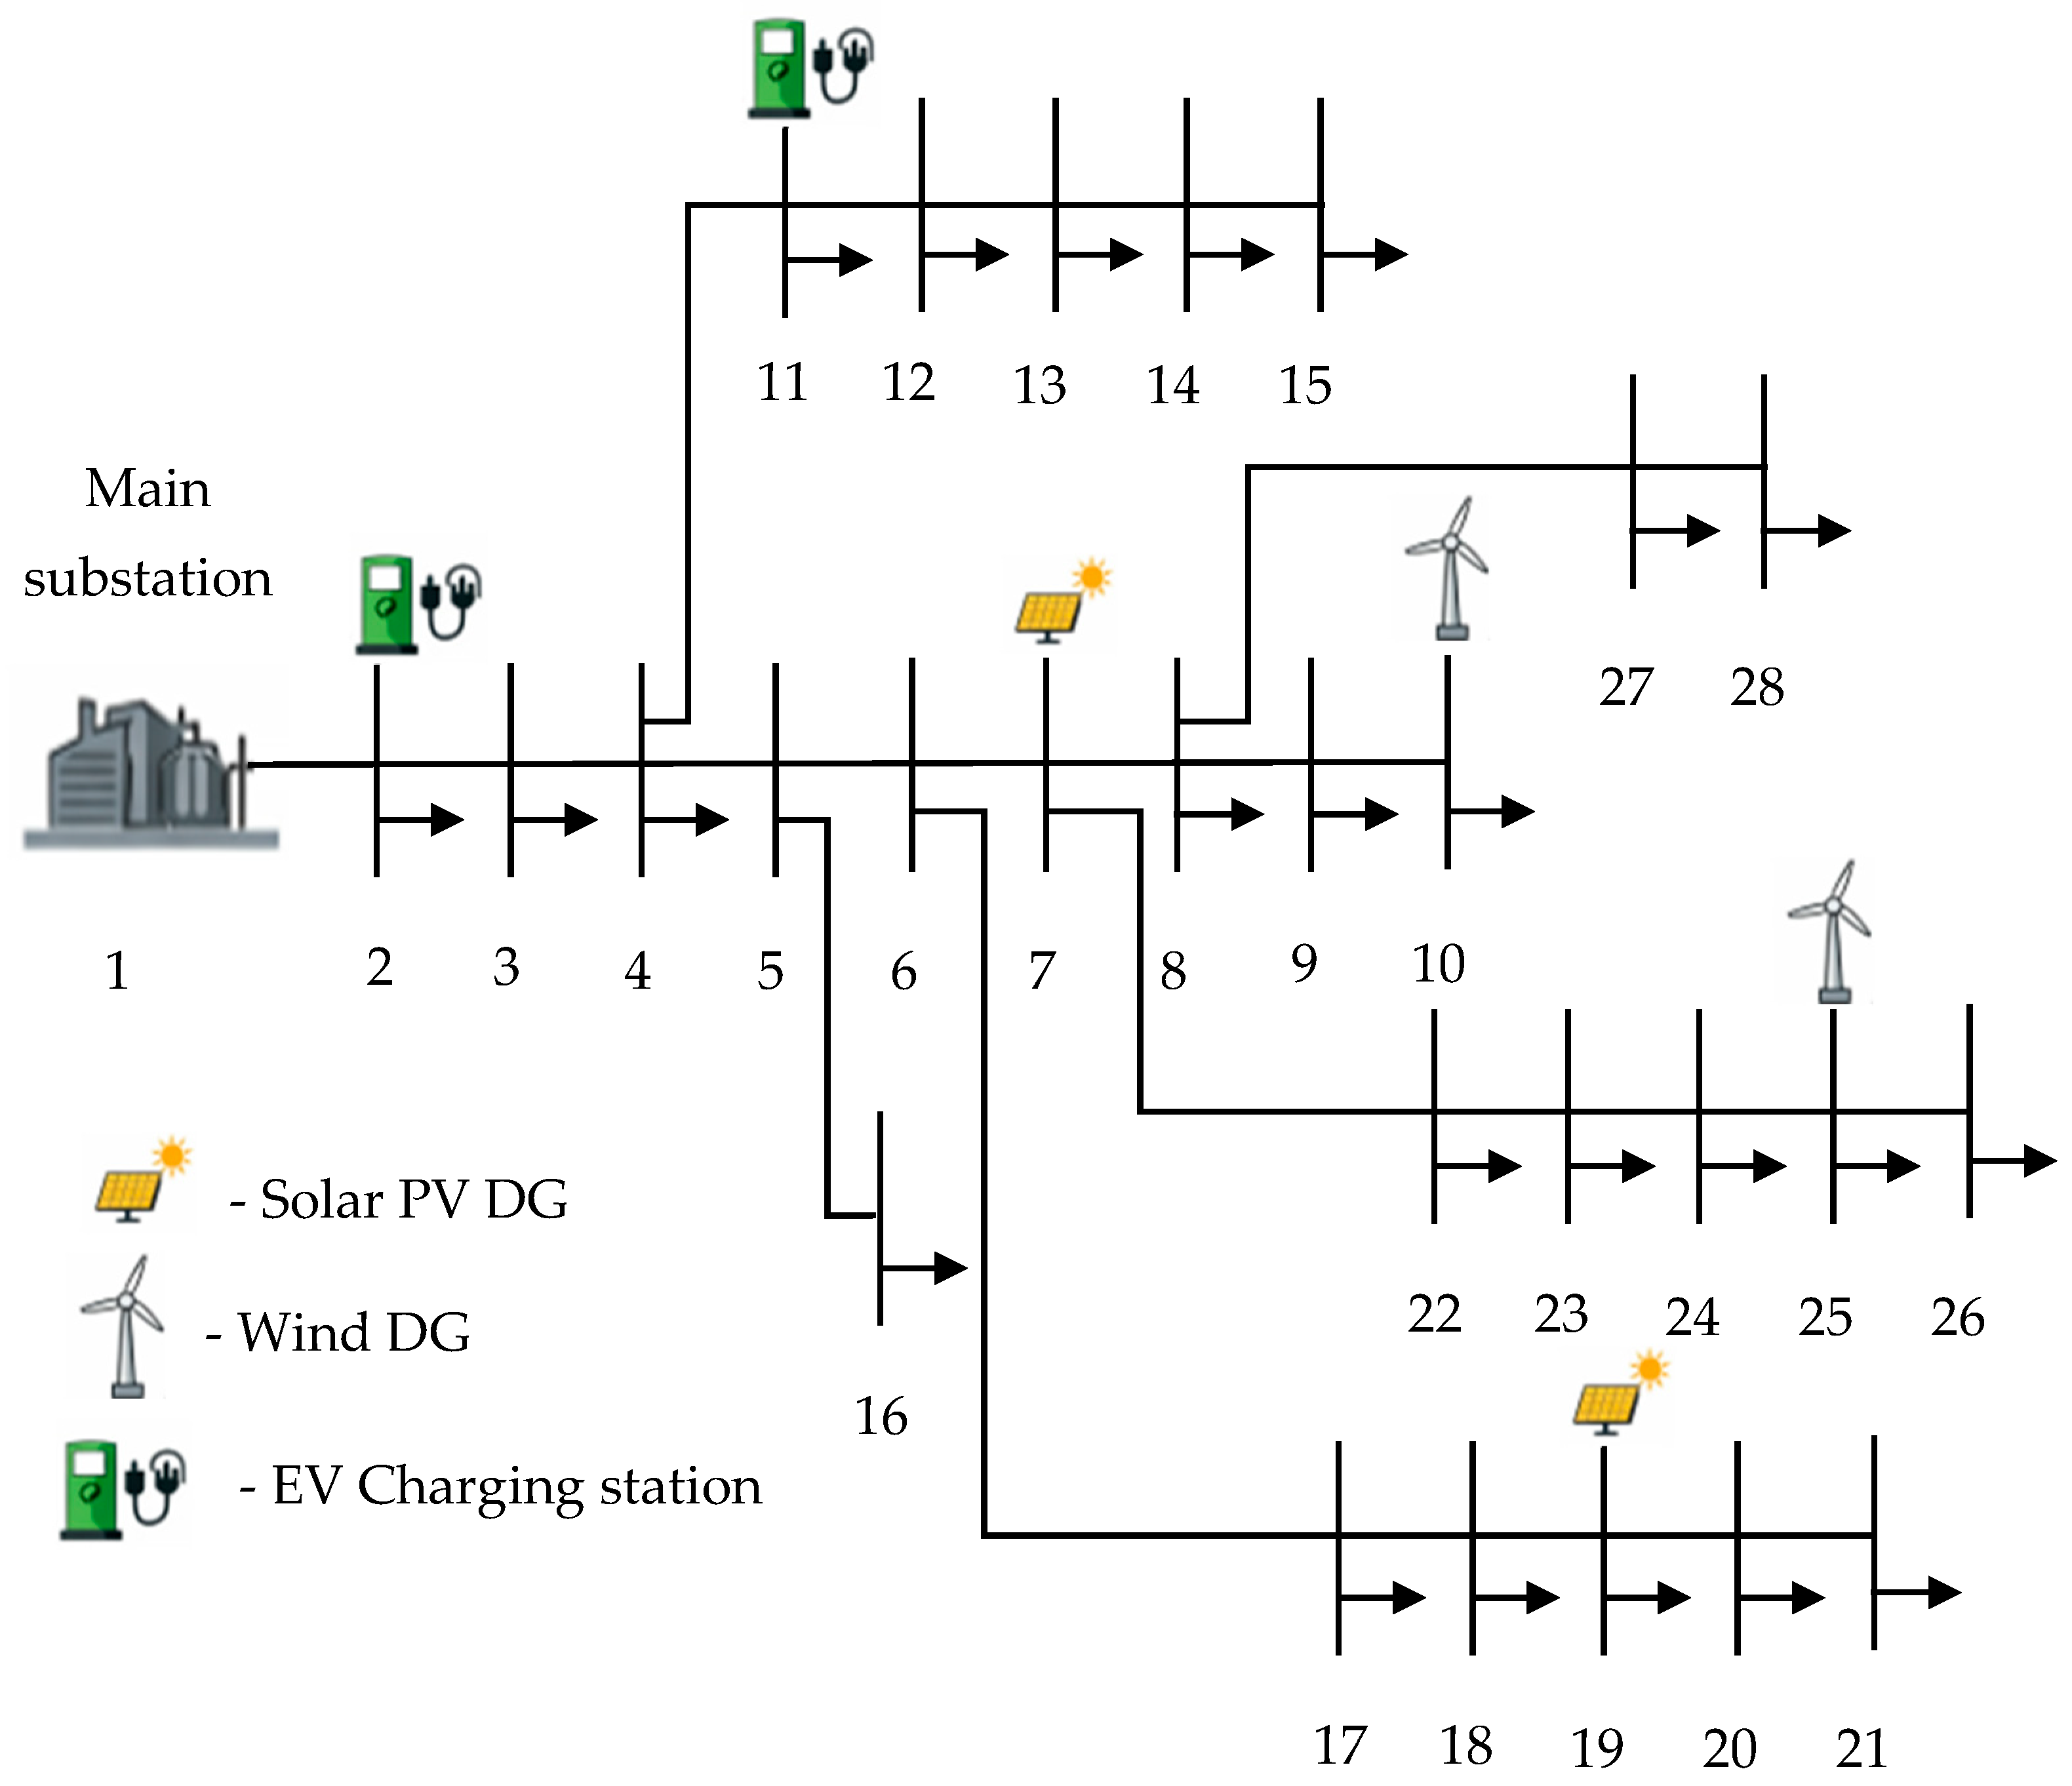
The VSI method is used to choose buses for DG and EVCS placement. Buses with the lowest VSI values are considered weak buses and are assigned to SPV or WT DGs, while buses with the highest VSI values are considered stronger and used for EVCS placement. This placement achieves a balanced load profile, reduces power losses, and improves the system VSI. A visual representation of the 28-bus system is illustrated in Figure 1.
Figure 1.
Schematic of the 28-bus system with integrated SPV, WT, and EVCS nodes.
3.2. Modeling of Renewable Generation Sources
3.2.1. Solar Photovoltaic Modeling
As solar irradiation is fundamentally stochastic, the Beta Probability Density Function (PDF) is used to describe solar PV production. As this model permits seasonal adjustments based on meteorological data, it is essential for assessing uncertainty in multi-season planning. The Beta PDF is expressed by Equation (1):
where is the solar irradiance, and and are estimated from the mean and standard deviation of irradiance. The PV power generation for the -th state is given by Equation (2):
As per standard PV module data, parameters including cell fill factor (FF), cell temperature, and voltage/current coefficients are estimated. The use of seasonal irradiance data to optimize SPV placement is a central component of this modeling technique [5].
3.2.2. Wind Turbine Modeling
The Weibull PDF is used to estimate the power output distribution of WTs. This offers a strong match for wind speed distribution across seasons and regions. Its formulation is given by Equation (3):
where is wind speed, is the shape factor, and is the scale factor, both derived from wind speed mean and standard deviation. The generated wind power is determined based on standard turbine cut-in, rated, and cut-out speeds using Equation (4):
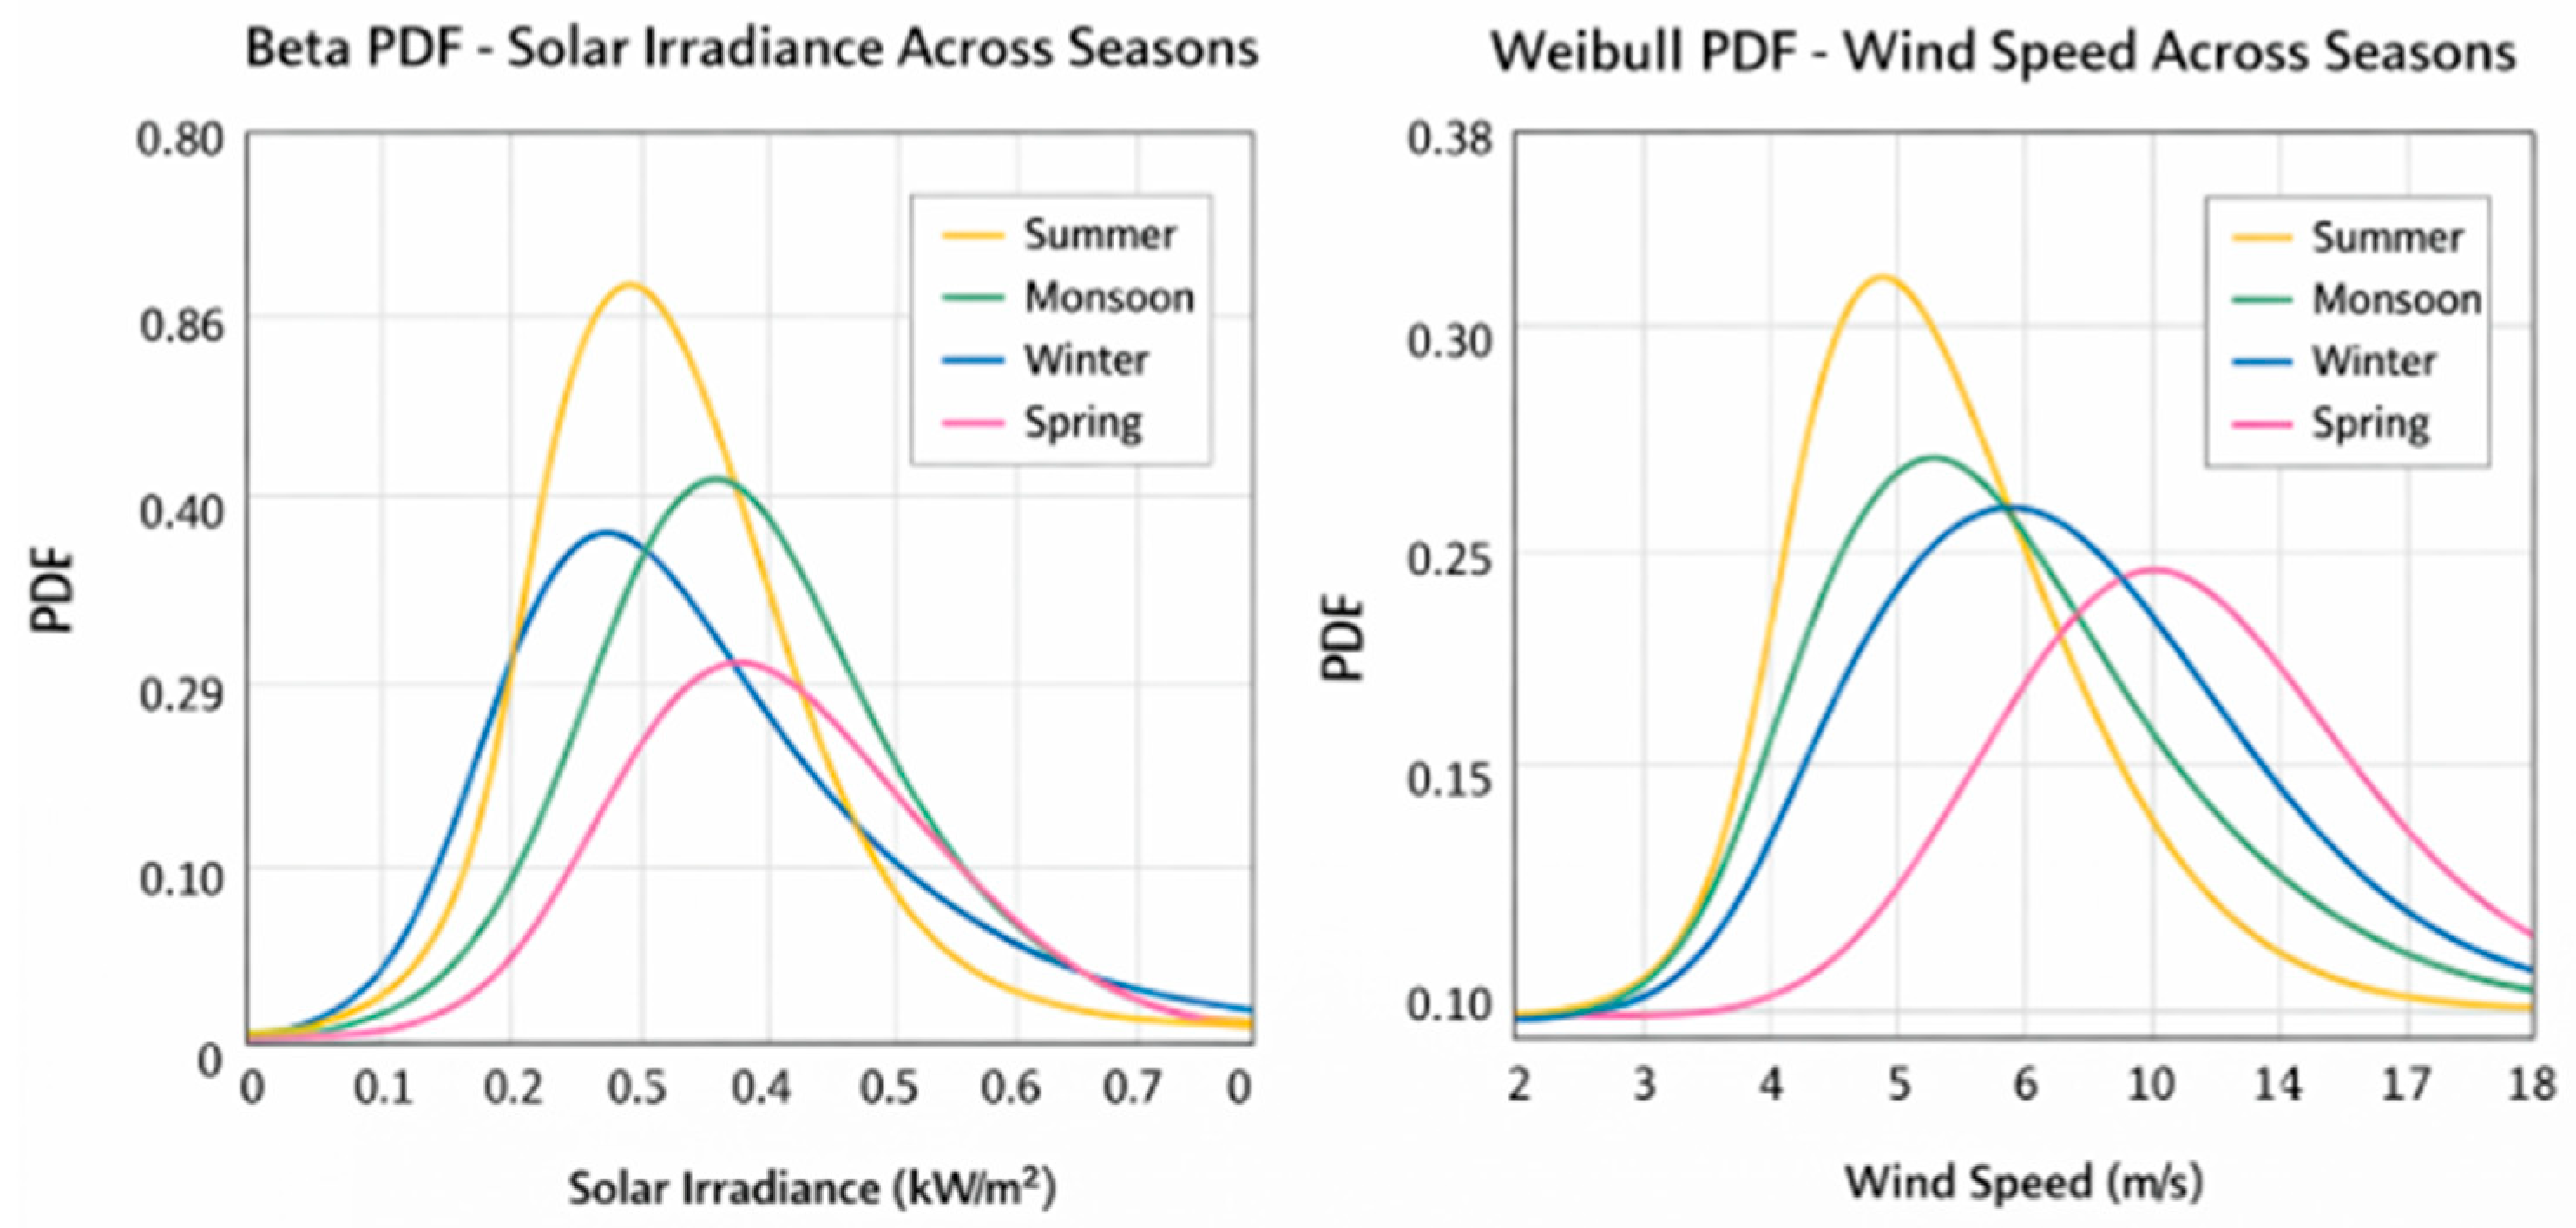
The dynamic simulation of DG outputs is made possible by probabilistic modeling, which is consistent with the stochastic wind analysis utilized in [5,20]. Figure 2 illustrates the Beta and Weibull PDF curves for various seasons.
Figure 2.
Seasonal Beta and Weibull distribution curves.
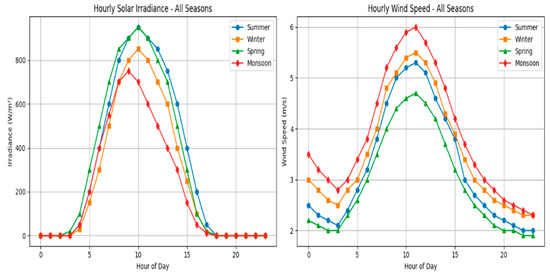
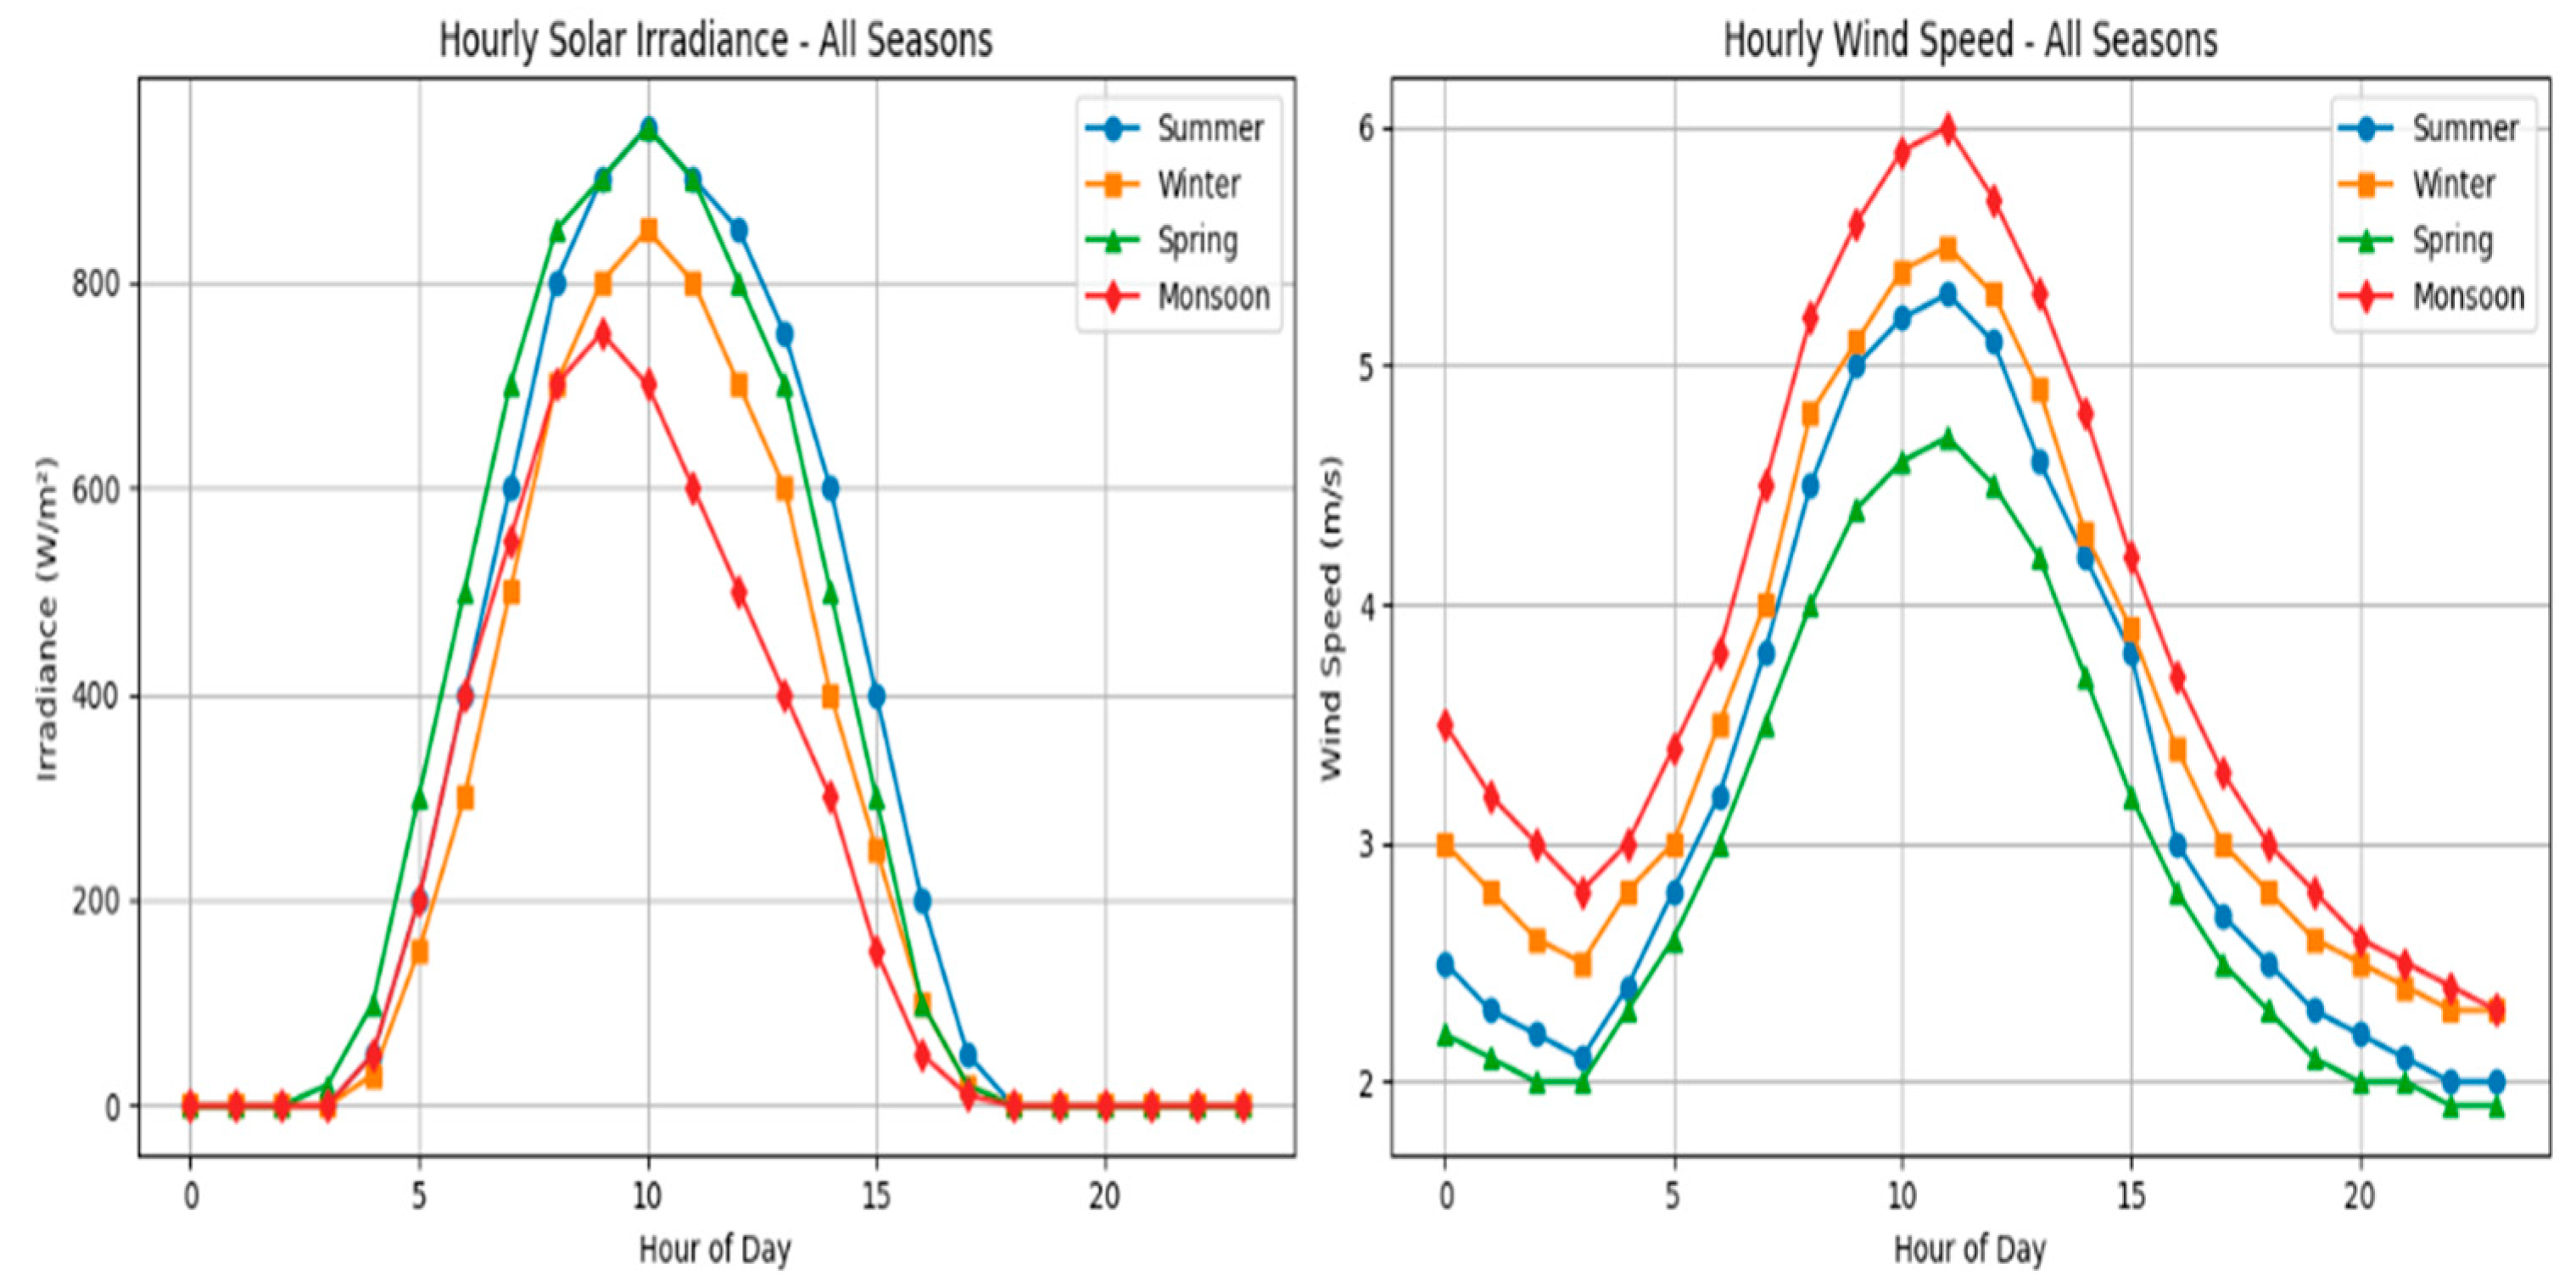
Figure 3 illustrates the hourly solar irradiance variation and wind speed patterns across four seasons. These curves highlight peak generation intervals critical for PV-based DG performance and validate the use of Weibull distribution in modeling WT generation uncertainty.
Figure 3.
Hourly solar irradiance and wind speed curves.
3.3. Modeling of Electric Vehicle Charging Stations
Depending on charging behavior, battery parameters, and vehicle use patterns, EVCSs are treated as dynamic controllable loads. The EV charging demand at a given time is a function of number of daily trips , average trip distance and battery discharge range . The State of Charge (SoC) of the EV battery at the -th hour for the -th EV is modeled by Equation (5):
The constraints for charging and discharging are given by Equation (6):
This keeps the charging of EV batteries within reasonable safety margins and prevents grid overload. Charging behavior estimation is done based on coordinated control and peak-hour demand situations. In this model, EVCS are modeled as variable demand centers that affect grid dynamics and techno-economic performance, following the framework suggested in [5,21].
3.4. Economic Modeling
EVCS and RDGs (solar PV and wind) need income and cost modeling over the entire planning horizon for an appropriate techno-economic assessment. This section explains how to determine the investment, operation and maintenance (O&M), and revenue components for each asset type. This method [22] combines methods from current distribution system optimization research with those from conventional energy economics.
3.4.1. Economic Modeling for SPV and WT DGs
The total annual economic cost for each DG includes capital expenditure (CapEx), O&M costs and annualized cost. For RDGs, the capital cost is typically expressed per unit of installed capacity, as shown in Equation (7):
where denotes initial investment cost, is the cost per kW of rated capacity and signifies DG rated power (kW). To optimize placement based on lifetime cost, this model is often used [23]. In this approach, reduced CapEx may affect site selection. Then, O&M costs are estimated annually using Equation (8):
where is the per-kW annual O&M expense. For renewables, O&M tends to be low relative to fossil generators, but still contributes to long-term cost outcomes. To compare costs over a planning period with a discount rate , annualized cost is computed using Equation (9):
where is the asset lifetime in years. This standardized levelized cost method is widely used in techno-economic studies of DG placement and microgrid design [24,25].
3.4.2. Economic Modeling for EV Charging Stations (EVCS)
EVCS cost modeling includes two major parts, such as infrastructure and operational costs, along with revenue generation from charging services. EVCS capital costs or infrastructure costs include chargers, power electronics, and grid connection upgrades, as shown in Equation (10).
where R is the annual revenue (USD), is the total installed capacity of EVCS in kW, is the daily operation hours, and is indicates the energy price per KWh (USD).
where is the annual operating cost (USD), α indicates the operating cost as a percentage of the investment cost, and is the initial investment cost (USD).
The Net Present Value (NPV) over a planning period at discount rate is calculated using Equation (13):
This formulation works well in studies that compare investment outcomes of grid-connected charging infrastructure.
3.4.3. Combined Techno-Economic Objective
The goal function for optimizing the placement of RDG and EVCS is to minimize the overall cost, as shown in Equation (14):
This net cost reflects the economic burden and benefit of investments in renewable generators and EVCS [26,27,28,29,30].
3.5. Problem Formulation
To improve technical performance and reduce economic costs under generation uncertainty, the primary objective of this study is to determine the best placement and size of solar PV-based DGs, WT-based DGs, and EVCS in the Indian 28-bus distribution network. The optimization problem’s foundational elements are the objective functions, decision variables, and constraints. The optimization problem uses the following decision variables:
- : Rated output of SPV DG placed at bus i;
- : Rated output of WT DG placed at bus j;
- : Binary decision variable for EVCS location at bus k;
- : Bus voltage angle at bus i;
- : Voltage magnitude at bus i.
The multi-objective formulation considers three conflicting objectives, including minimizing active PLoss, minimizing net economic cost, and maximizing the VSI. Reducing active power loss lowers operational costs and improves network efficiency. The distribution system’s power loss is mathematically expressed by Equation (15):
where is the line count, is the resistance of line l, are the active and reactive power in line l, and is the voltage at the receiving end of line l. A high VSI is required to maintain system dependability, particularly with noteworthy penetration of renewable DGs and EVCSs. The VSI is calculated by Equation (16):
where . A higher VSI value that is closer to 1 indicates high voltage profile. Net economic cost represents the total annual cost of SPV DGs, wind DGs, and EVCS after accounting for revenue from charging using Equation (17):
3.5.1. Combined Multi-Objective Formulation
The tackling of multi-objective issues is done using a weighted sum technique to aggregate different goals, as shown in Equation (18):
where are the weights assigned to each objective. The upper and lower bounds of objective values are given by superscripts “max” and “min”. The optimization process is more reliable if all these objectives are normalized.
3.5.2. Constraints
Optimization is done using following technical and economic constraints including power balance, voltage regulation, DG capacity, and EVCS power. At each bus i, active and reactive power must satisfy the power flow, as shown in Equations (19) and (20):
where denote active and reactive generation, denote active and reactive load, are the conductance and susceptance between buses i and j, , and is the total bus count. This ensures that generation, load, and losses are balanced. The constraints for voltage regulation are shown in Equation (21):
where and These limits prevent over-voltage and under-voltage conditions. Investment policies and system dependability constrain the installed capacity of WT and SPV DGs, as shown in Equation (22):
where the bounds are set based on feeder capacities. To prevent feeder overload, the overall EVCS load should not exceed a limit, as shown in Equation (23):
where is the power drawn by EVCS at bus k, and denotes the maximum allowable aggregate EVCS load. This ensures safe and reliable EV charging integration.
3.5.3. Inclusion of Uncertainty in Problem Formulation
An optimization method based on probabilistic scenarios is used to consider the fact that renewable generation (solar irradiance and wind speed) experiences seasonal variations, as shown in Equations (24) and (25):
where is the solar irradiance state from the Beta PDF, and is the wind speed state from the Weibull PDF. This stochastic evaluation ensures the effectiveness of the placement decisions under various environmental conditions.
4. CFOA Optimization Methodology
To address the multi-objective issue specified in Section 3.5, this study uses the CFOA. The Catch Fish Optimization Algorithm (CFOA) is a metaheuristic optimization algorithm derived from conventional rural fishing practices. It emulates the actions of fishers, encompassing solitary searches, collaborative efforts, and communal catches, to address optimization challenges. The Catch Fish Optimization (CFO) algorithm described in [31] is an innovative bio-inspired optimization method that emulates the actions of fishermen attempting to capture fish in a body of water. This approach was designed to tackle intricate optimization issues involving non-linear, multi-modal, and high-dimensional search spaces. The CFO emulates the strategic maneuvers of fishermen, the evasive actions of fish, and the application of bait to enhance the likelihood of successful catches, paralleling the pursuit of optimal or near-optimal solutions within a search area. Due to their capacity to handle non-linear, multi-objective search spaces without needing gradient information, metaheuristic algorithms have been widely adopted for power system optimization [30]. The CFOA improves exploration and exploitation in complicated landscapes, such as distribution network design with dual objectives (technical + economic) and uncertainty in renewable generation, by combining the capabilities of chaotic maps with a fitness-driven search mechanism. Particle Swarm Optimization (PSO), Genetic Algorithm (GA), and Biogeography-Based Optimization (BBO) [31] are just a few of the traditional metaheuristic algorithms that have been used to solve optimization problems in distribution systems, such as DG placement, EVCS allocation, and system reconfiguration [32,33,34]. However, these algorithms may suffer from premature convergence, poor balance between local exploitation and global exploration, and difficulty in handling multiple objectives simultaneously.
4.1. Motivation and Behavioral Comparison
In nature, fishermen employ diverse techniques to capture fish, including casting bait in favorable spots, relocating if no fish are taken, or advancing toward regions with increased activity. Conversely, fish typically evade recognized predators, exhibit random movement or navigate towards food, and react to environmental cues. These interactions constitute the foundation of the CFO algorithm’s exploration and exploitation methods.
- Mathematical Modeling of CFO
Let us examine an optimization problem characterized as follows:
where f(x) is the objective function to be minimized, and is the vector of decision variables in an n-dimensional space.
- Initialization
A population of fishermen and fish is initialized randomly within the defined search space:
where
- is the initial position of the i-th fish or fisherman;
- is a uniformly distributed random number in [0, 1];
- LB and UB are the lower and upper bounds of the search space;
- N is the population size.
- Movement of Fish
Fish tend to move from threats (fishermen) and may be attracted by food (better positions):
where
- is the position of the i-th fish at iteration t;
- is the position of the j-th fisherman;
- is a control parameter for the influence of avoidance;
- is a random number in [0, 1].
- Movement of fishermen (Exploration Strategy)
Fishermen explore the environment by moving toward better locations (exploitation) or randomly (exploration):
where
- is the position of the j-th fisherman at iteration t;
- is the best fish position found so far;
- are learning and randomness coefficients.
Catch probability and update:
The probability of a fisherman catching a fish depends on the distance between them:
If a random number r is less than , the fisherman is assumed to have caught the fish and the position is updated.
= (if catch occurs).
- Updating the Global Best
After each iteration, the best solution is updated as follows:
Algorithm Summary
- Initialize the population of fish and fishermen randomly;
- Evaluate the fitness of all individuals;
- For each fish:
Move to avoid fishermen;
- 4.
- For each fisherman:
Move toward better positions or randomly explore;
Attempt to catch nearby fish;
- 5.
- Update the best position;
- 6.
- Continue steps 3–5 until the criterion for stopping is satisfied.
Advantages
This approach balances exploration and exploitation using separate roles for fish and fishermen.
It is suitable for non-linear, multi-modal, and constrained optimization problems.
Incorporates a probabilistic interaction model, adding stochastic robustness.
4.2. Integration with Multi-Objective Optimization
To solve the multi-objective problem effectively, the CFOA can be paired with either the weighted sum approach or Pareto front generation using dominance principles. This research ensured a balanced search that considered both the technical and economic goals by using the weighted normalization approach (Section 3.5) throughout the CFOA search.
4.3. Performance Considerations
- Handling of Constraints: To guarantee that voltage limitations, power balance, and DG/EVC allocation requirements are met, the CFOA adds constraint management using penalty functions.
- Convergence Stability: Premature stagnation is a recognized problem in basic evolutionary algorithms; chaotic maps inject controlled unpredictability that might help mitigate it.
4.4. Supporting Optimization Literature
To put the CFOA decision into perspective, the following research papers show how relevant situations in power system optimization have used metaheuristics. An existing paper presents an analysis that demonstrates the practicality of algorithms for issues like DG placement, Volt/VAR control, and loss reduction. In distribution networks incorporating DGs, hybrid metaheuristics, such as chaotic PSO versions, enhance reconfiguration and loss reduction [35]. The importance of using a variety of search heuristics has been highlighted in studies investigating new approaches to optimal power flow (e.g., Pelican, Tasmanian Devil, Grey Wolf, etc.) [36,37,38,39,40,41,42].
5. Results and Techno-Economic Analysis
This section shows the optimal positioning and size of SPV DGs, WT DGs, and EVCS in the 28-bus distribution system in India using the CFOA optimization framework. Also, this section describes details regarding implementation of the proposed technique on the Indian 28-bus test system. Figure 1 illustrates the 28-bus test system using a single-line diagram, consisting of 27 branches and 28 buses functioning at a base voltage of 11 kV. The system’s aggregate demand load is 776.42 kVar and 761.04 kW. The solar PV DG system comprises 600 modules rated at 225 W each, totaling 135 kW; one wind turbine (WT) unit rated at 260 kW; and an EV charging station designed for 60 EVs with two stations. This research explores many alternatives, as outlined below:
- Impact of solar photovoltaics and wind turbines on network losses and voltage profile, accounting for unpredictability across several seasons.
- Impact of electric vehicles on system losses and voltage profile in the absence of DGs.
- Impact of DGs and EVs on system losses and voltage profile.
5.1. Impact of Solar Photovoltaics and Wind Turbines on System Losses While Accounting for Power Generation Uncertainty Across Different Seasons
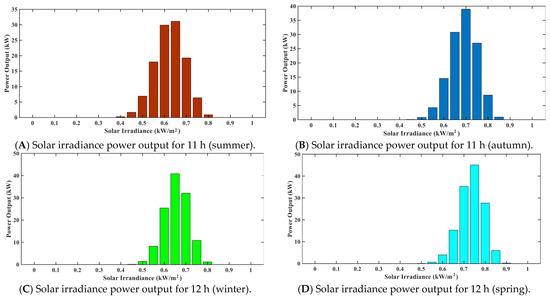
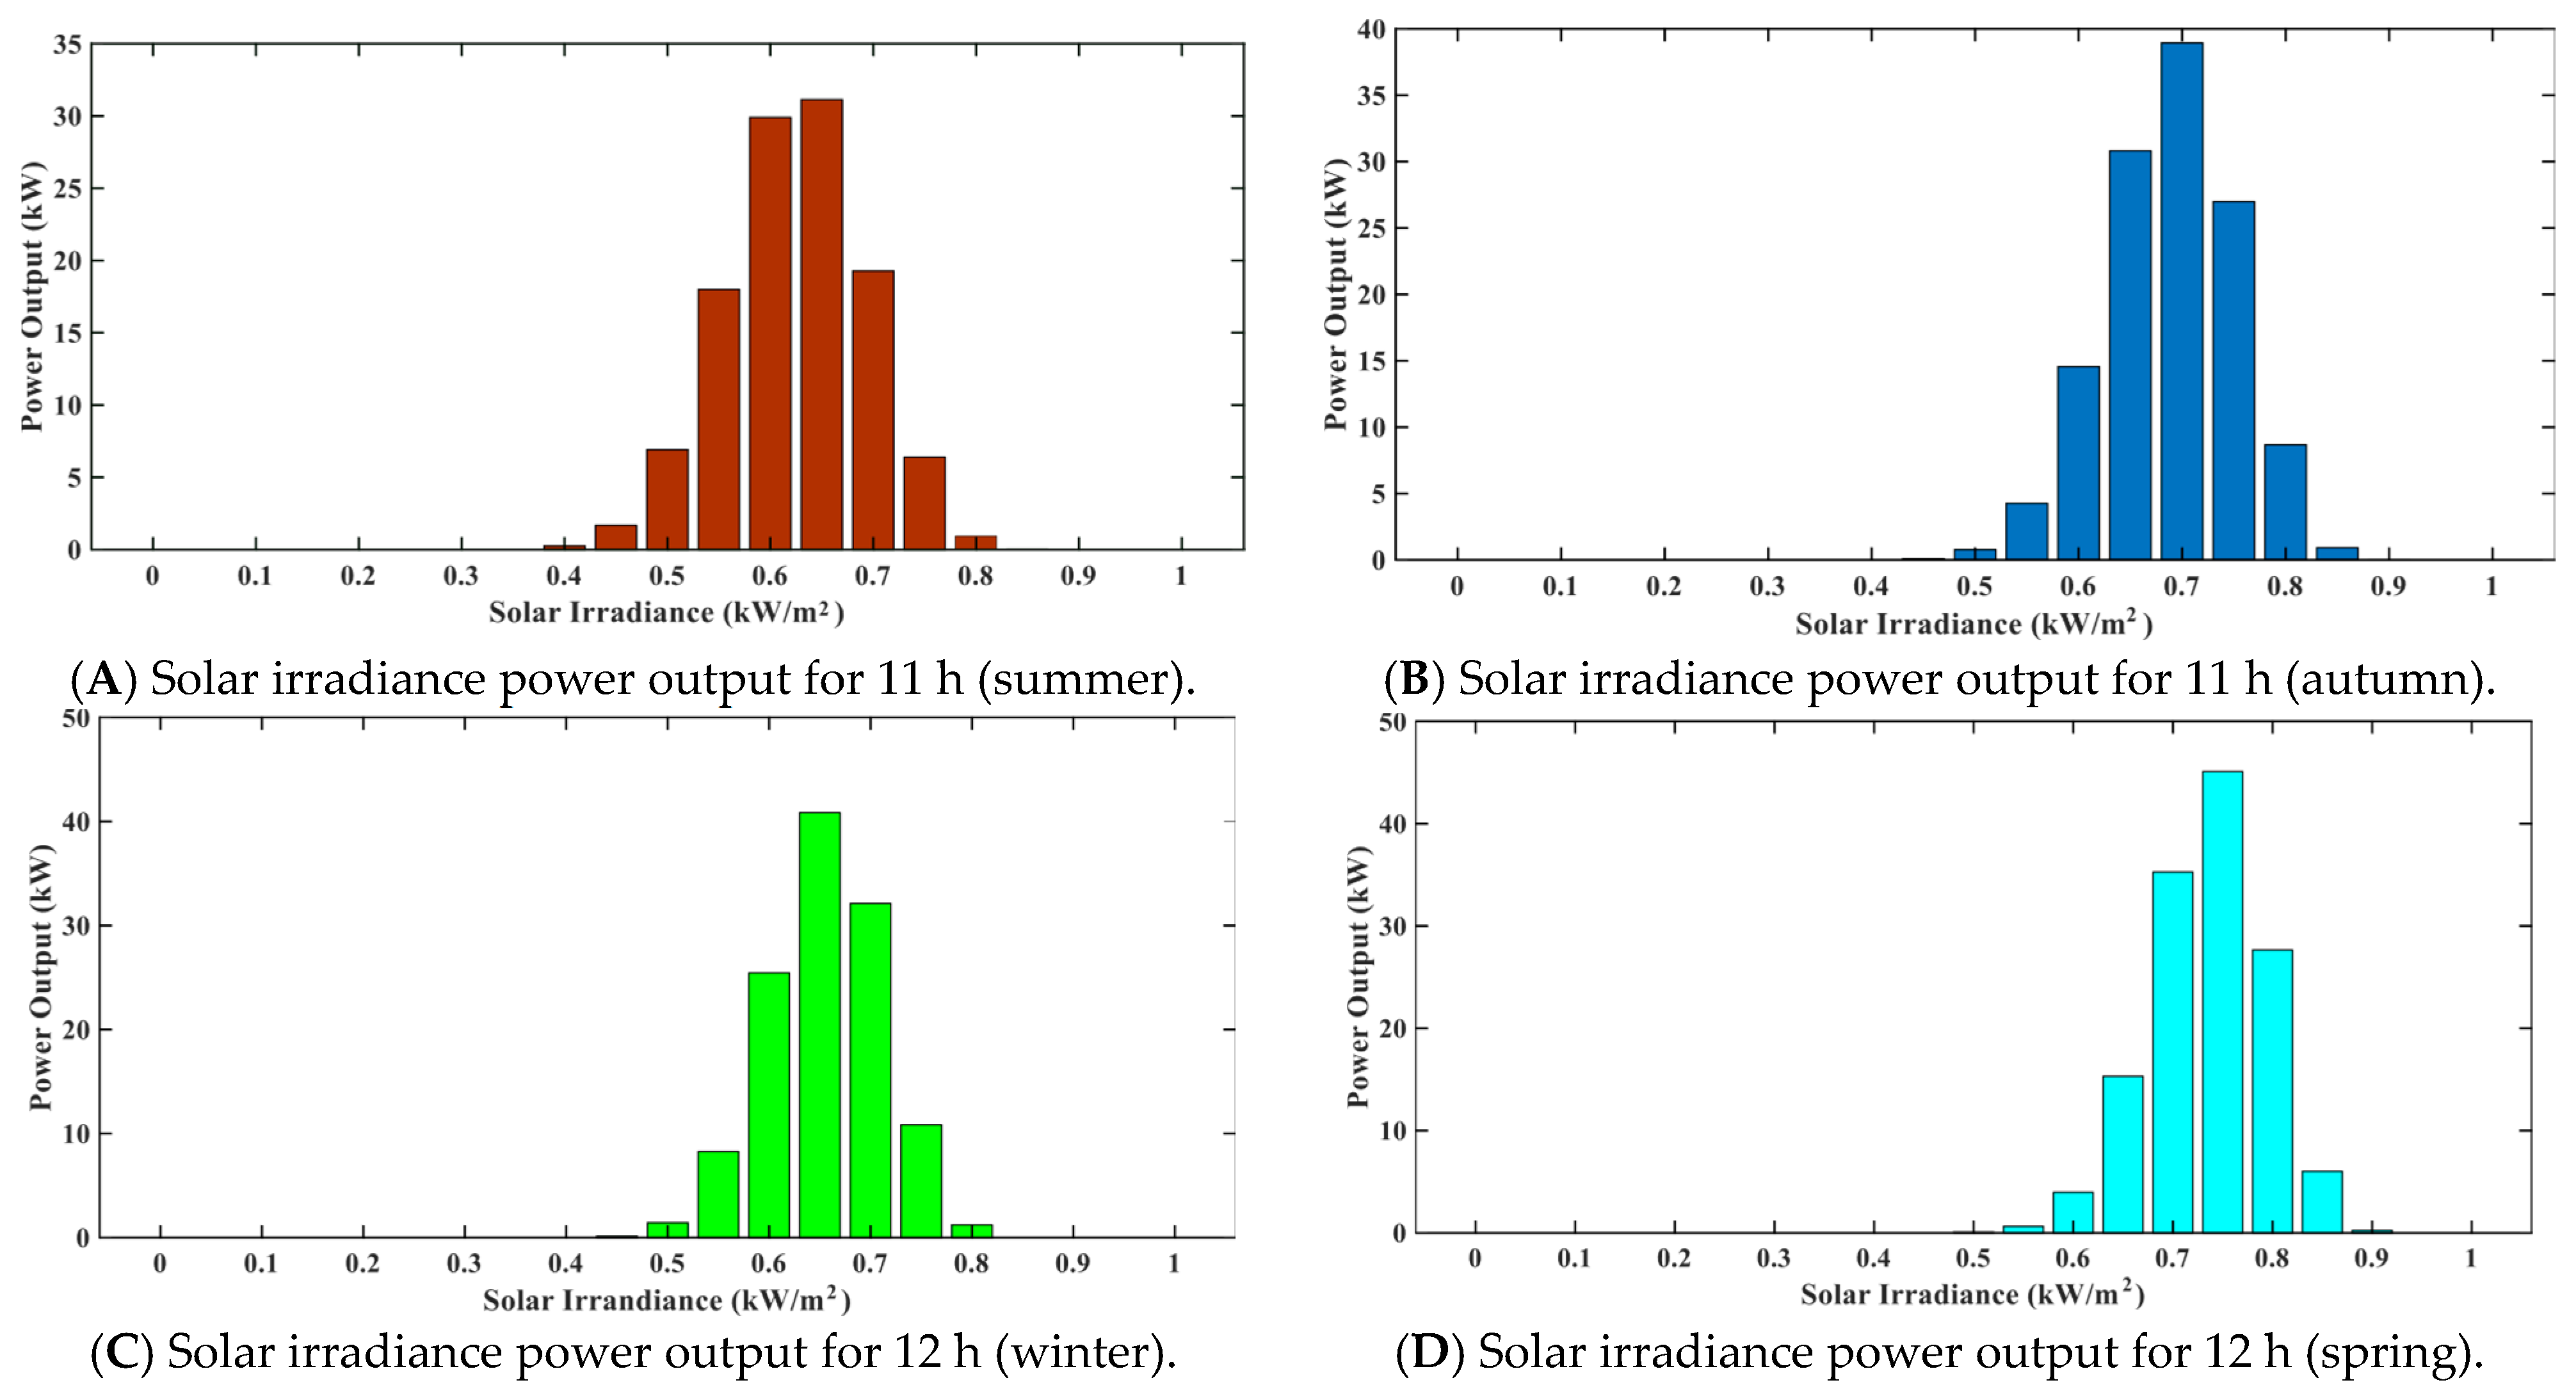
This study employed a 260 kW wind turbine and a 600 PV module 135 kW solar photovoltaic array to accurately examine the irregular and intermittent properties of wind and solar power. A typical day was constructed for each season to represent the erratic behavior of various renewable resources over time. This analysis utilized probability density functions (PDFs), a conventional method for estimating hourly wind speed and sun irradiance data. The two prevalent probability density functions are the Weibull and Beta distributions. Figure 4 depicts the power output of solar irradiance at 11 h in summer and autumn, and at 12 h in winter and spring. The data indicates that sun irradiance peaks at around midday across all seasons.
Figure 4.
Solar irradiance power output across four seasons.
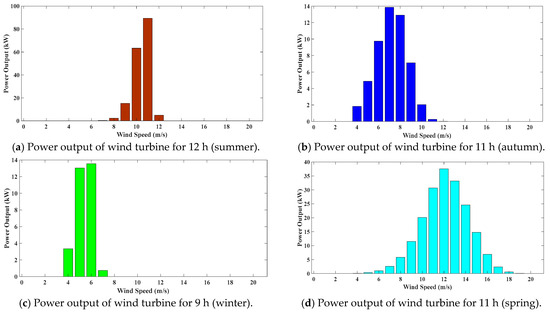
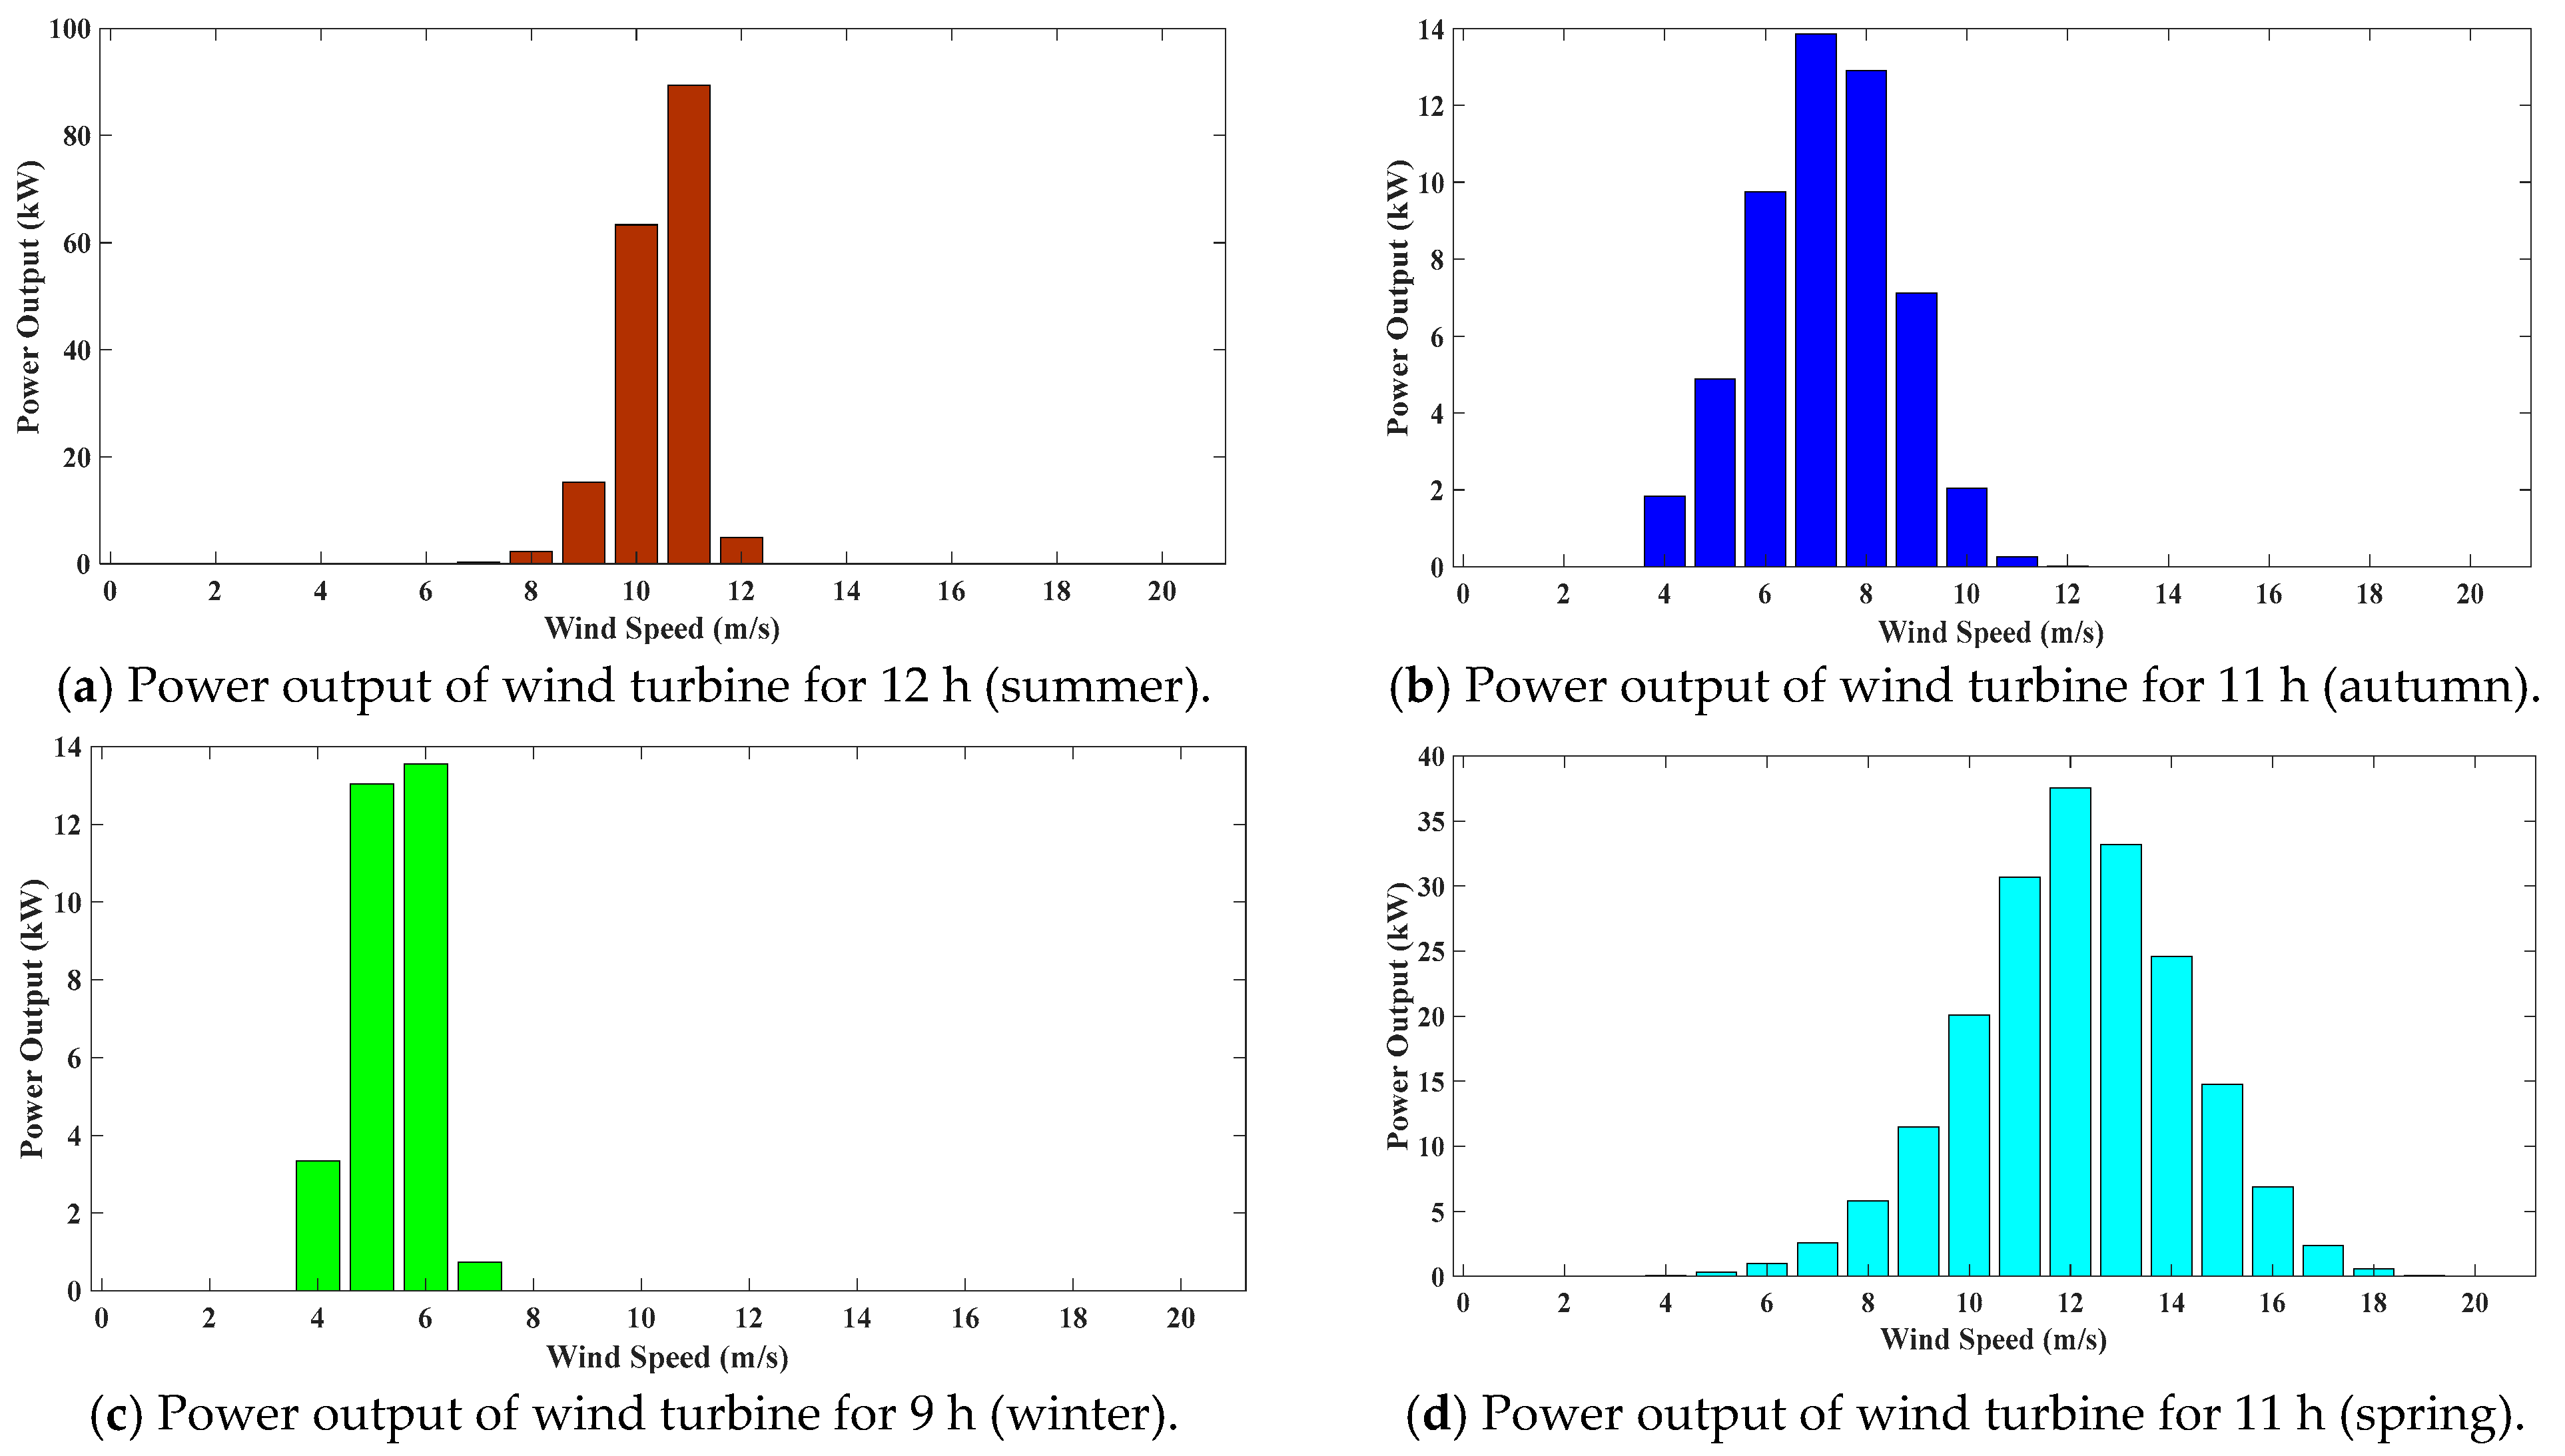
Figure 5 similarly illustrates the power output of wind speed across the four seasons for designated hours. The depictions in this figure provide a thorough visual comprehension of the variations in power output from solar irradiance and wind speed over the course of the year. This figure indicates that wind speed peaks during the summer and spring seasons.
Figure 5.
Power output of wind speed for four seasons.
To evaluate the effects of the distributed generators on power loss, their outputs were integrated into a 28-test system following the acquisition of the real power output from the solar photovoltaic and wind turbine systems. First, a solitary solar photovoltaic system rated at 135 kW was attached to bus site 7 in the 28-test system. To examine the impact of solar irradiance uncertainty, two solar photovoltaic systems were linked to bus sites 7 and 25, respectively. The results are presented in Table 2. The outcomes verify that the integration of single and dual solar PV systems reduced power loss by 43.493 KW and 31.06 KW, respectively, during the 11th hour in summer. This methodology is appropriate throughout all seasons, as solar irradiance reaches its peak at 11 h in each season.
Table 2.
Power loss due to integration of a single SPV and two SPV DGs into DN with solar irradiance variability.
Similar to solar PVs, incorporation of wind turbines into the 28-test system was conducted to assess their impact on power system stability. A 260 kW-rated wind turbine was connected at bus position 7. Subsequently, an analysis was conducted to examine the impact of wind speed variability on the system interconnection of two wind turbines at bus positions 7 and 25. The results of these experiments are precisely recorded in Table 3. According to this table, wind speed peaks in spring, particularly at midday, yielding a PLoss of 50.33 kW. In contrast, wind speeds diminish in fall, leading to a subsequent reduction in PLoss.
Table 3.
Power loss associated with the integration of a single WT and two WT DGs into the DN considering variability in wind speed.
The performance of the CFOA algorithm with the integration of DGs at 1.0 per unit was best, yielding the minimum PLoss and a good voltage profile with less computational time. The same information is shared in Table 4 below.
Table 4.
CFOA performance comparison with other OTs.
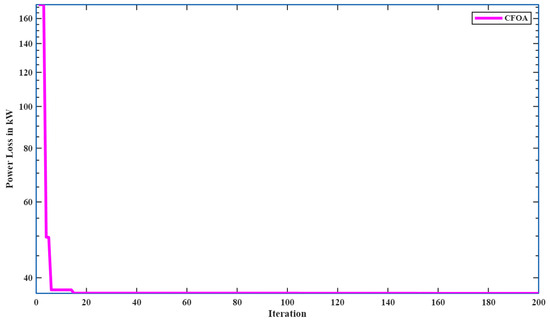
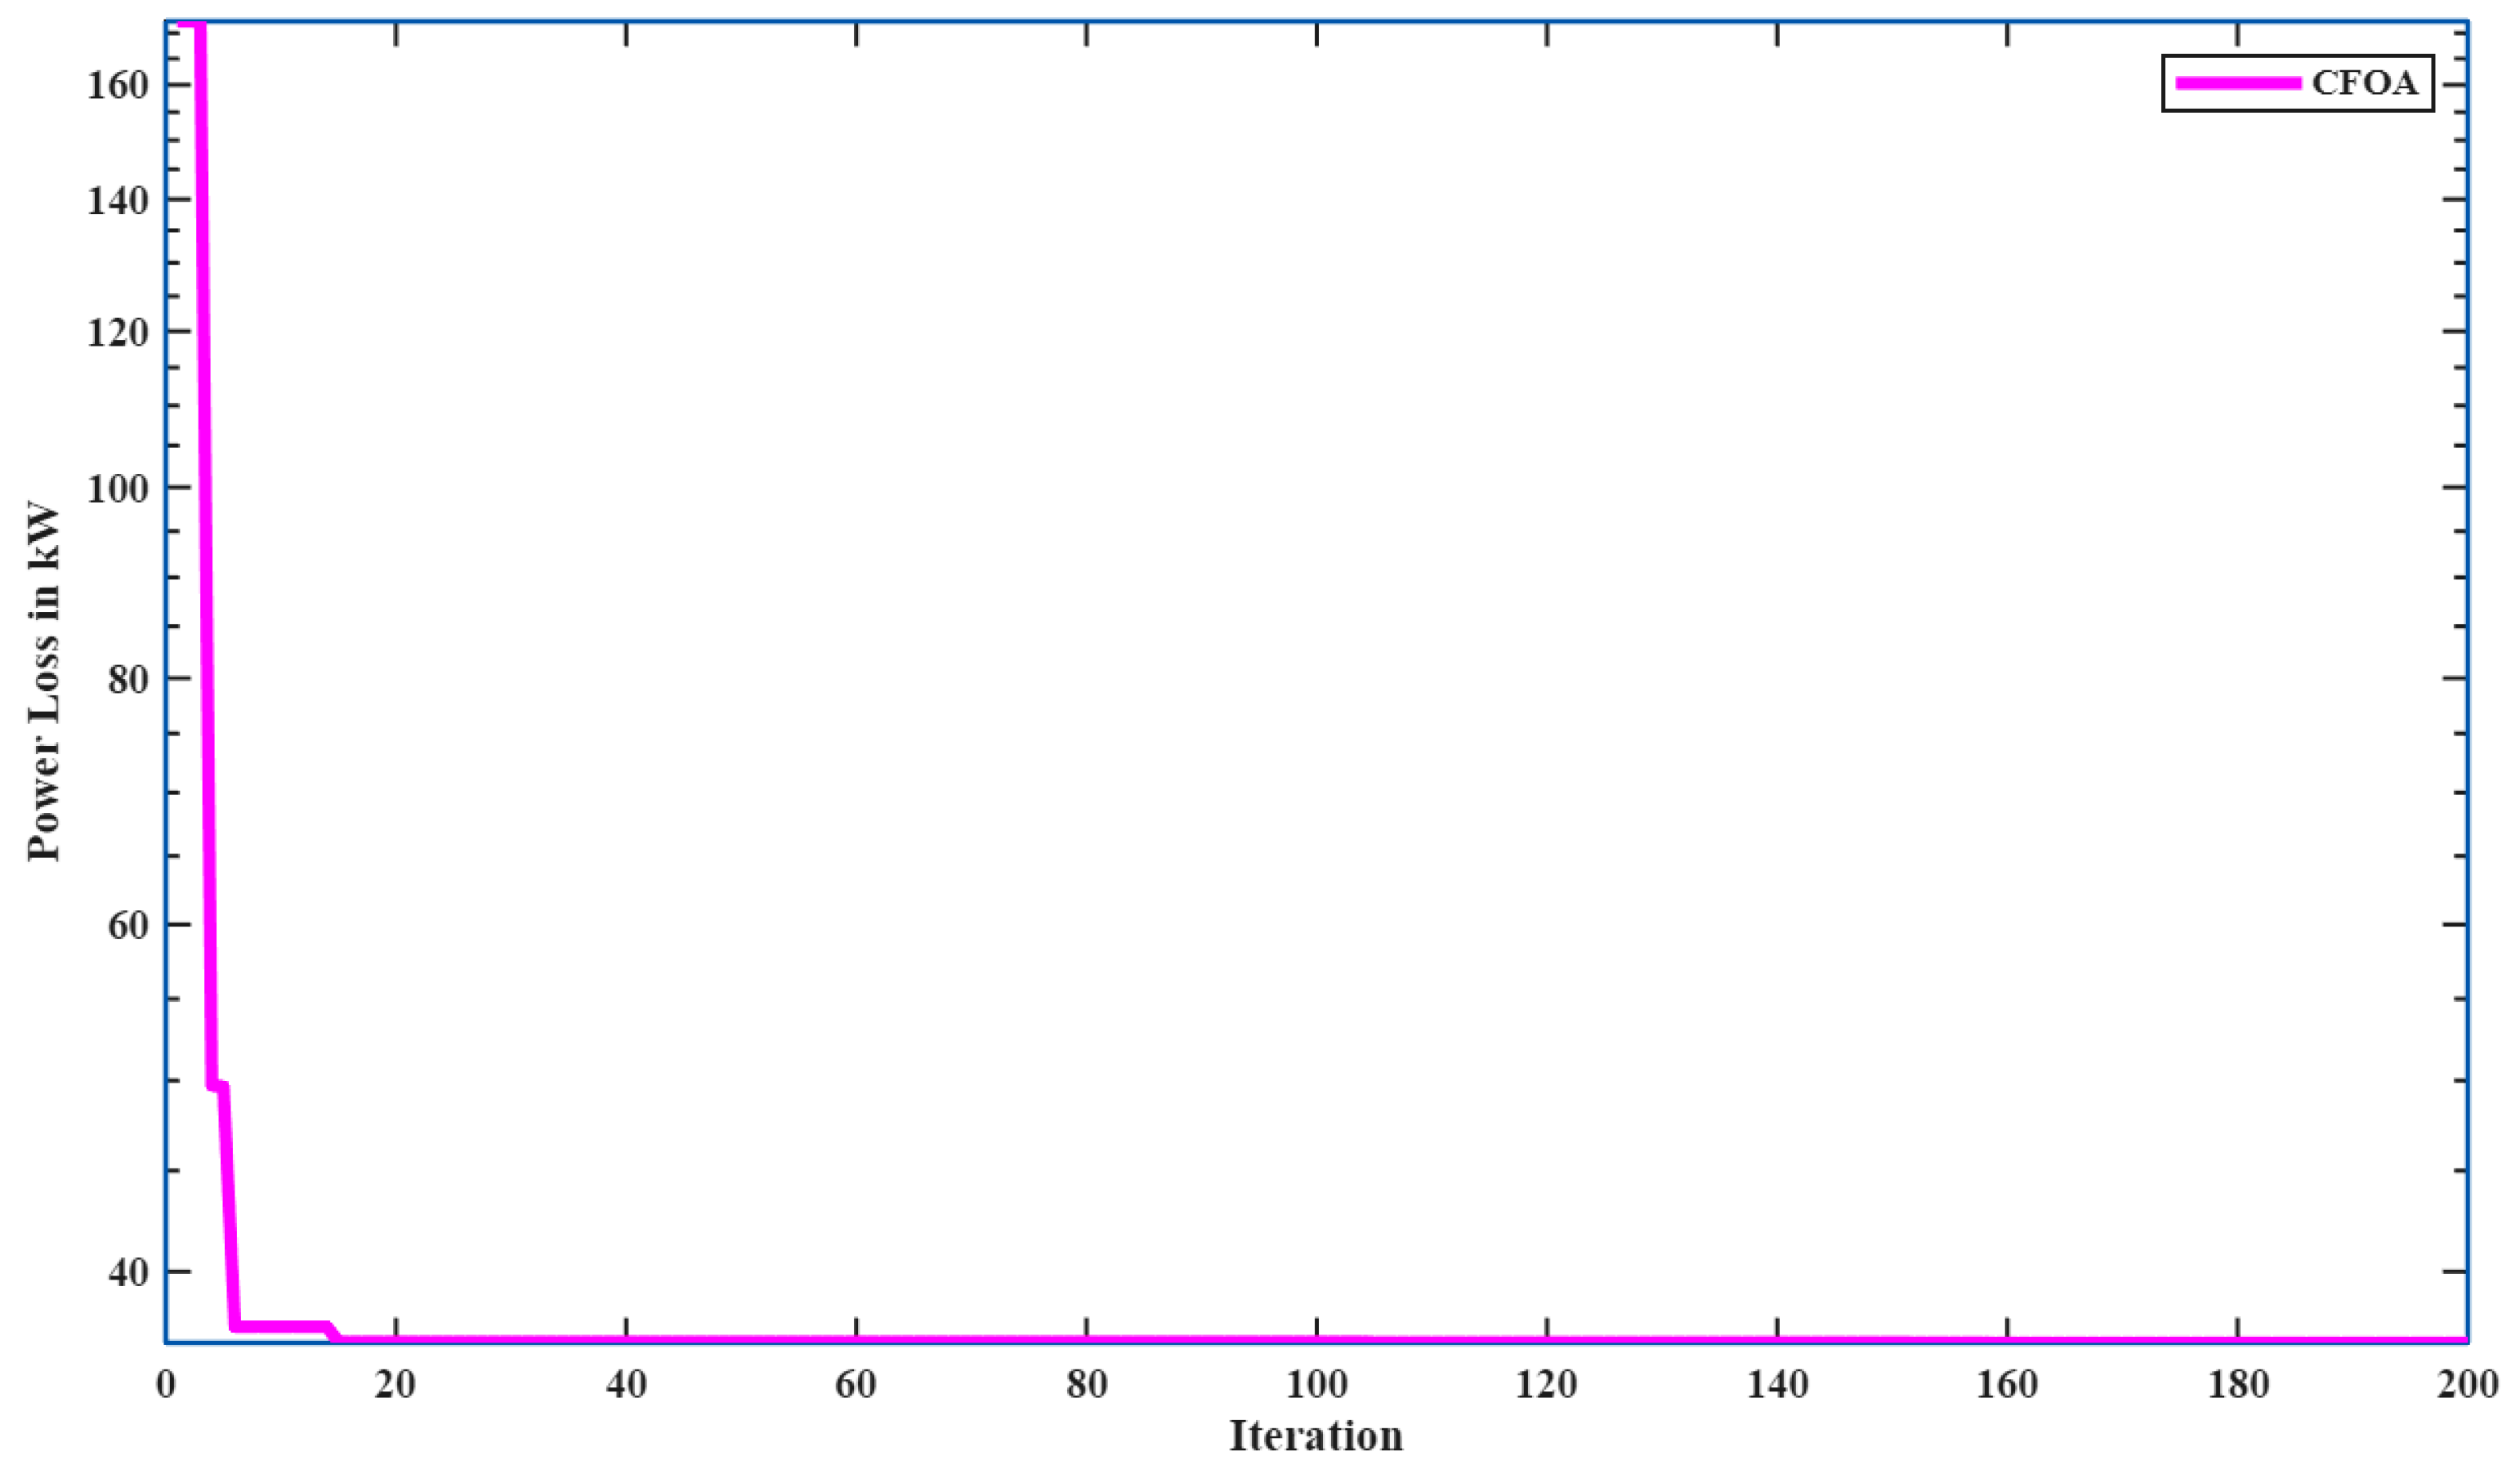
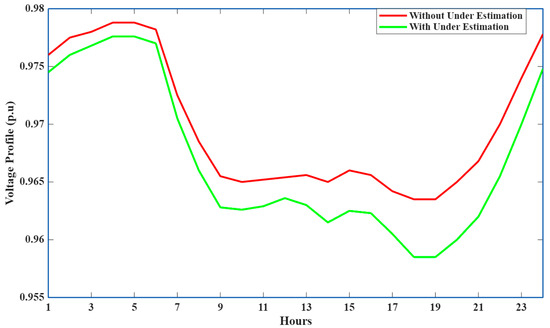
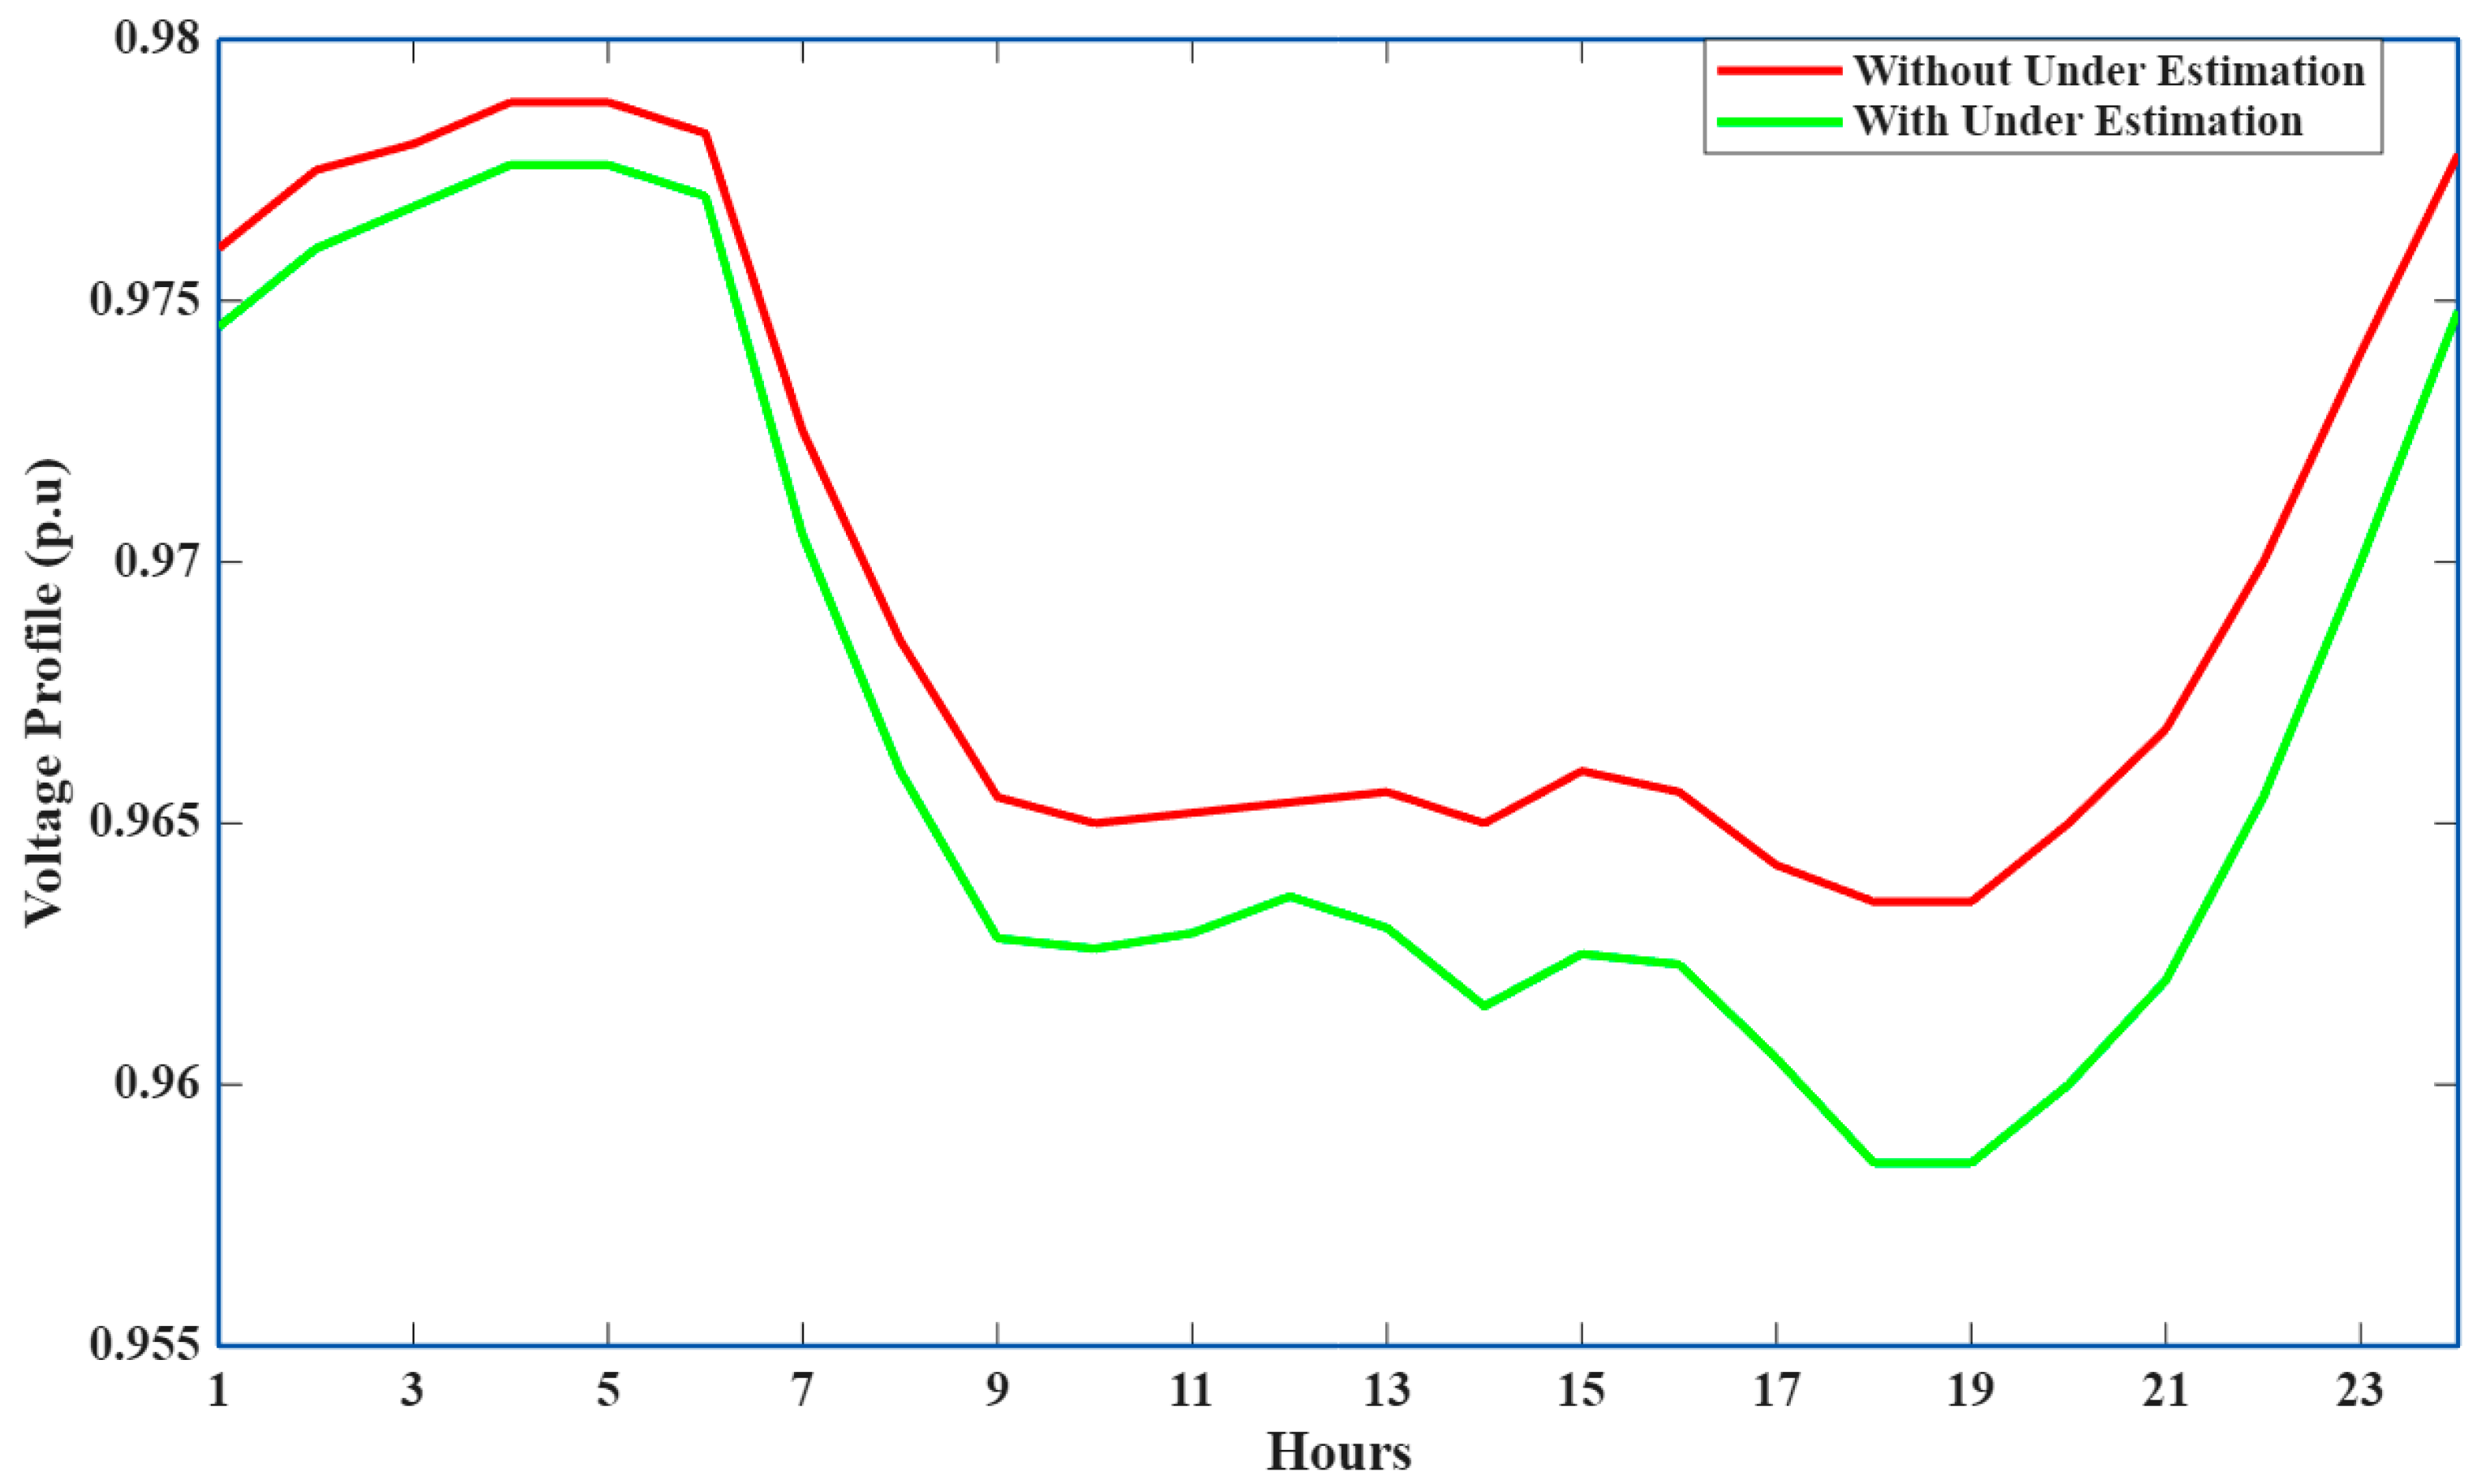
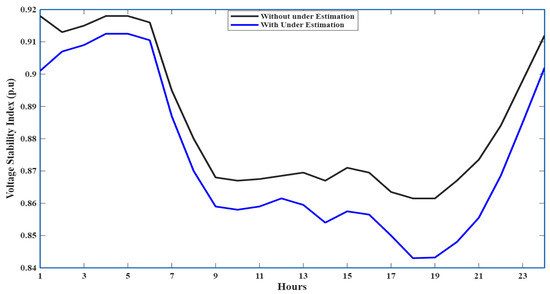
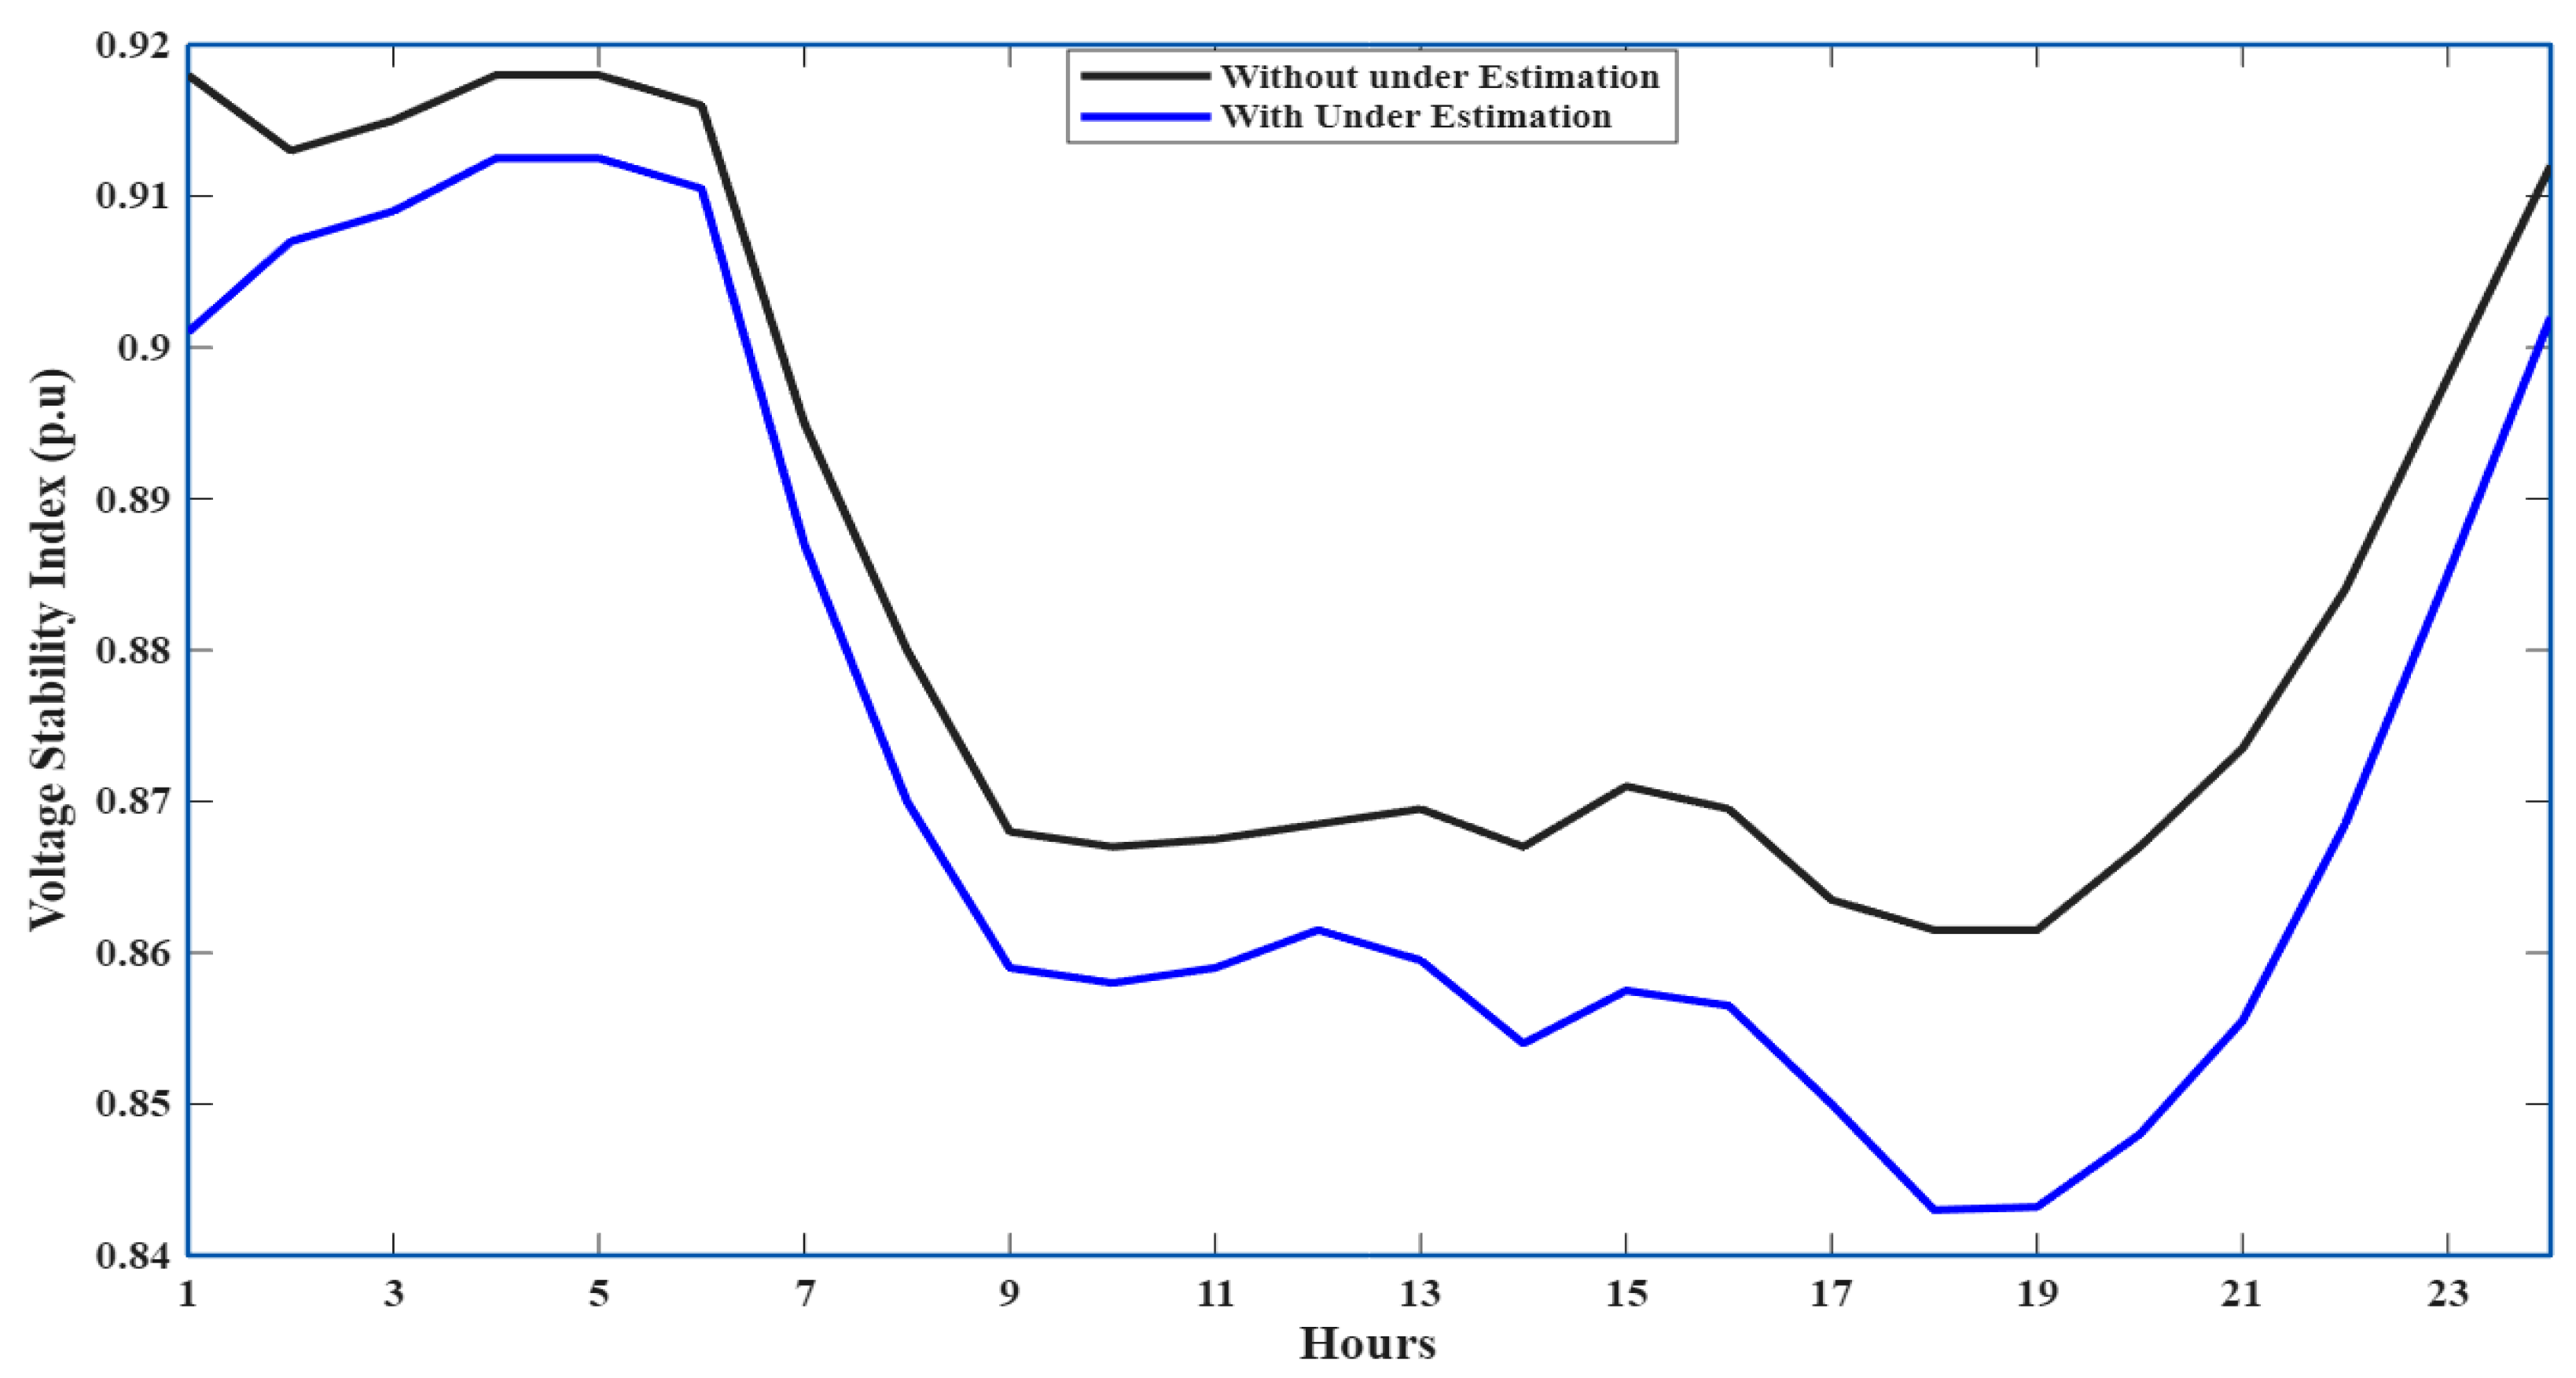
Table 5 compares the statistical performance of various optimization methods (OTs), including PSO, FPA, FA, WOA, DA, POA, and CFOA, using key parameters including best value, worst value, mean, standard deviation, and variance. Based on the results, the proposed CFOA algorithm has the best overall performance. It has the lowest mean value (36.8122), showing better optimization capabilities than the other approaches. Additionally, CFOA has a low standard deviation (0.02049) and variance (0.0004198), indicating good consistency and stability over several runs. Figure 6 shows the convergence characteristic of CFOA. The underestimation and overestimation of the voltage profile and the voltage stability index are given in Figure 7 and Figure 8. Simulated results of DG injecting active and reactive power at varying power factors are presented in Table 6.
Table 5.
Statistical analysis of 28-bus systems with multiple DGs considering different OTs.
Figure 6.
Convergence characteristics of CFOA (PLoss).
Figure 7.
Comparing the characteristics of the voltage profile with and without underestimation.
Figure 8.
Comparing the characteristics of the voltage stability index with and without underestimation.
Table 6.
Simulated results of DG injecting both active and reactive power with different power factors.
5.2. Effects of EVs on System Losses and Voltage Profile Without DGs
The demand to reduce carbon emissions and foster efficient transportation within the distribution network are the main factors motivating the use of electric vehicles. However, the incorporation of these vehicles within the RDS can substantially affect the PLoss and the voltage profile. Consequently, to assess their impact on RDS, EV charging stations were linked to the RDS at various bus sites designated by the VSI. The suggested algorithm in this study examined their impacts on the PLoss and voltage profile. An electric vehicle charging station was originally connected to bus position 2 for charging. Two EV charging stations, rated at 145 kW, were subsequently connected to the RDS at bus positions 2 and 11. The data in Table 7 clearly indicate that the introduction of one EV at position 2 resulted in an increase in the PLoss from 68.8195 kW to 70.6467 kW. Furthermore, adding two EVs to the RDS at 2 and 11 increased the PLoss from 68.8195 kW to 84.3528 kW. However, the incorporation of single and dual EVs into the RDS resulted in a reduction of the voltage profile from 0.9123 (p.u) to 0.9108 (p.u) and 0.9048 (p.u), respectively.
Table 7.
PLoss and voltage profile with EV integration.
5.3. Impact of DGs and EVS on System Losses and Voltage Profile
The method presented in this study offers advantages such as diminished PLoss and enhancements resulting from DG integration. Nevertheless, the incorporation of an EV charging station into RDS resulted in an increase in PLoss and adversely impacted the voltage profile. This study used the VSI to ascertain the ideal placement of DGs and EVs and utilized the CFOA approach to establish their optimal dimensions. An evaluation of the EV charging station was conducted to establish a set rating. Of the 60 electric vehicles, only 30 were included in this analysis at the two bus stops, 2 and 11. The 30 electric vehicles, in conjunction with photovoltaic and wind turbine systems at various locations, were combined, and the simulation results are presented in Table 8. Table 8 indicates that the active and reactive power loss diminished with the incorporation of two distributed generators, since they offset the power consumed by the electric vehicles. The table clearly indicates that the suggested approach yields the optimal (lowest) power loss values and enhances the voltage profile.
Table 8.
Power loss with the integration of DGs and EVs.
5.4. Voltage Stability and Profiles
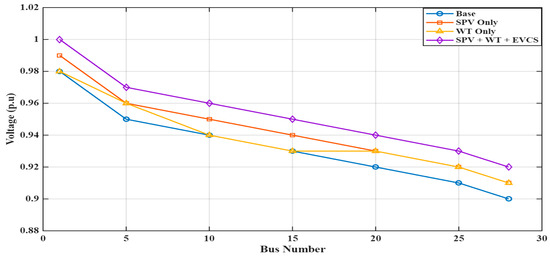
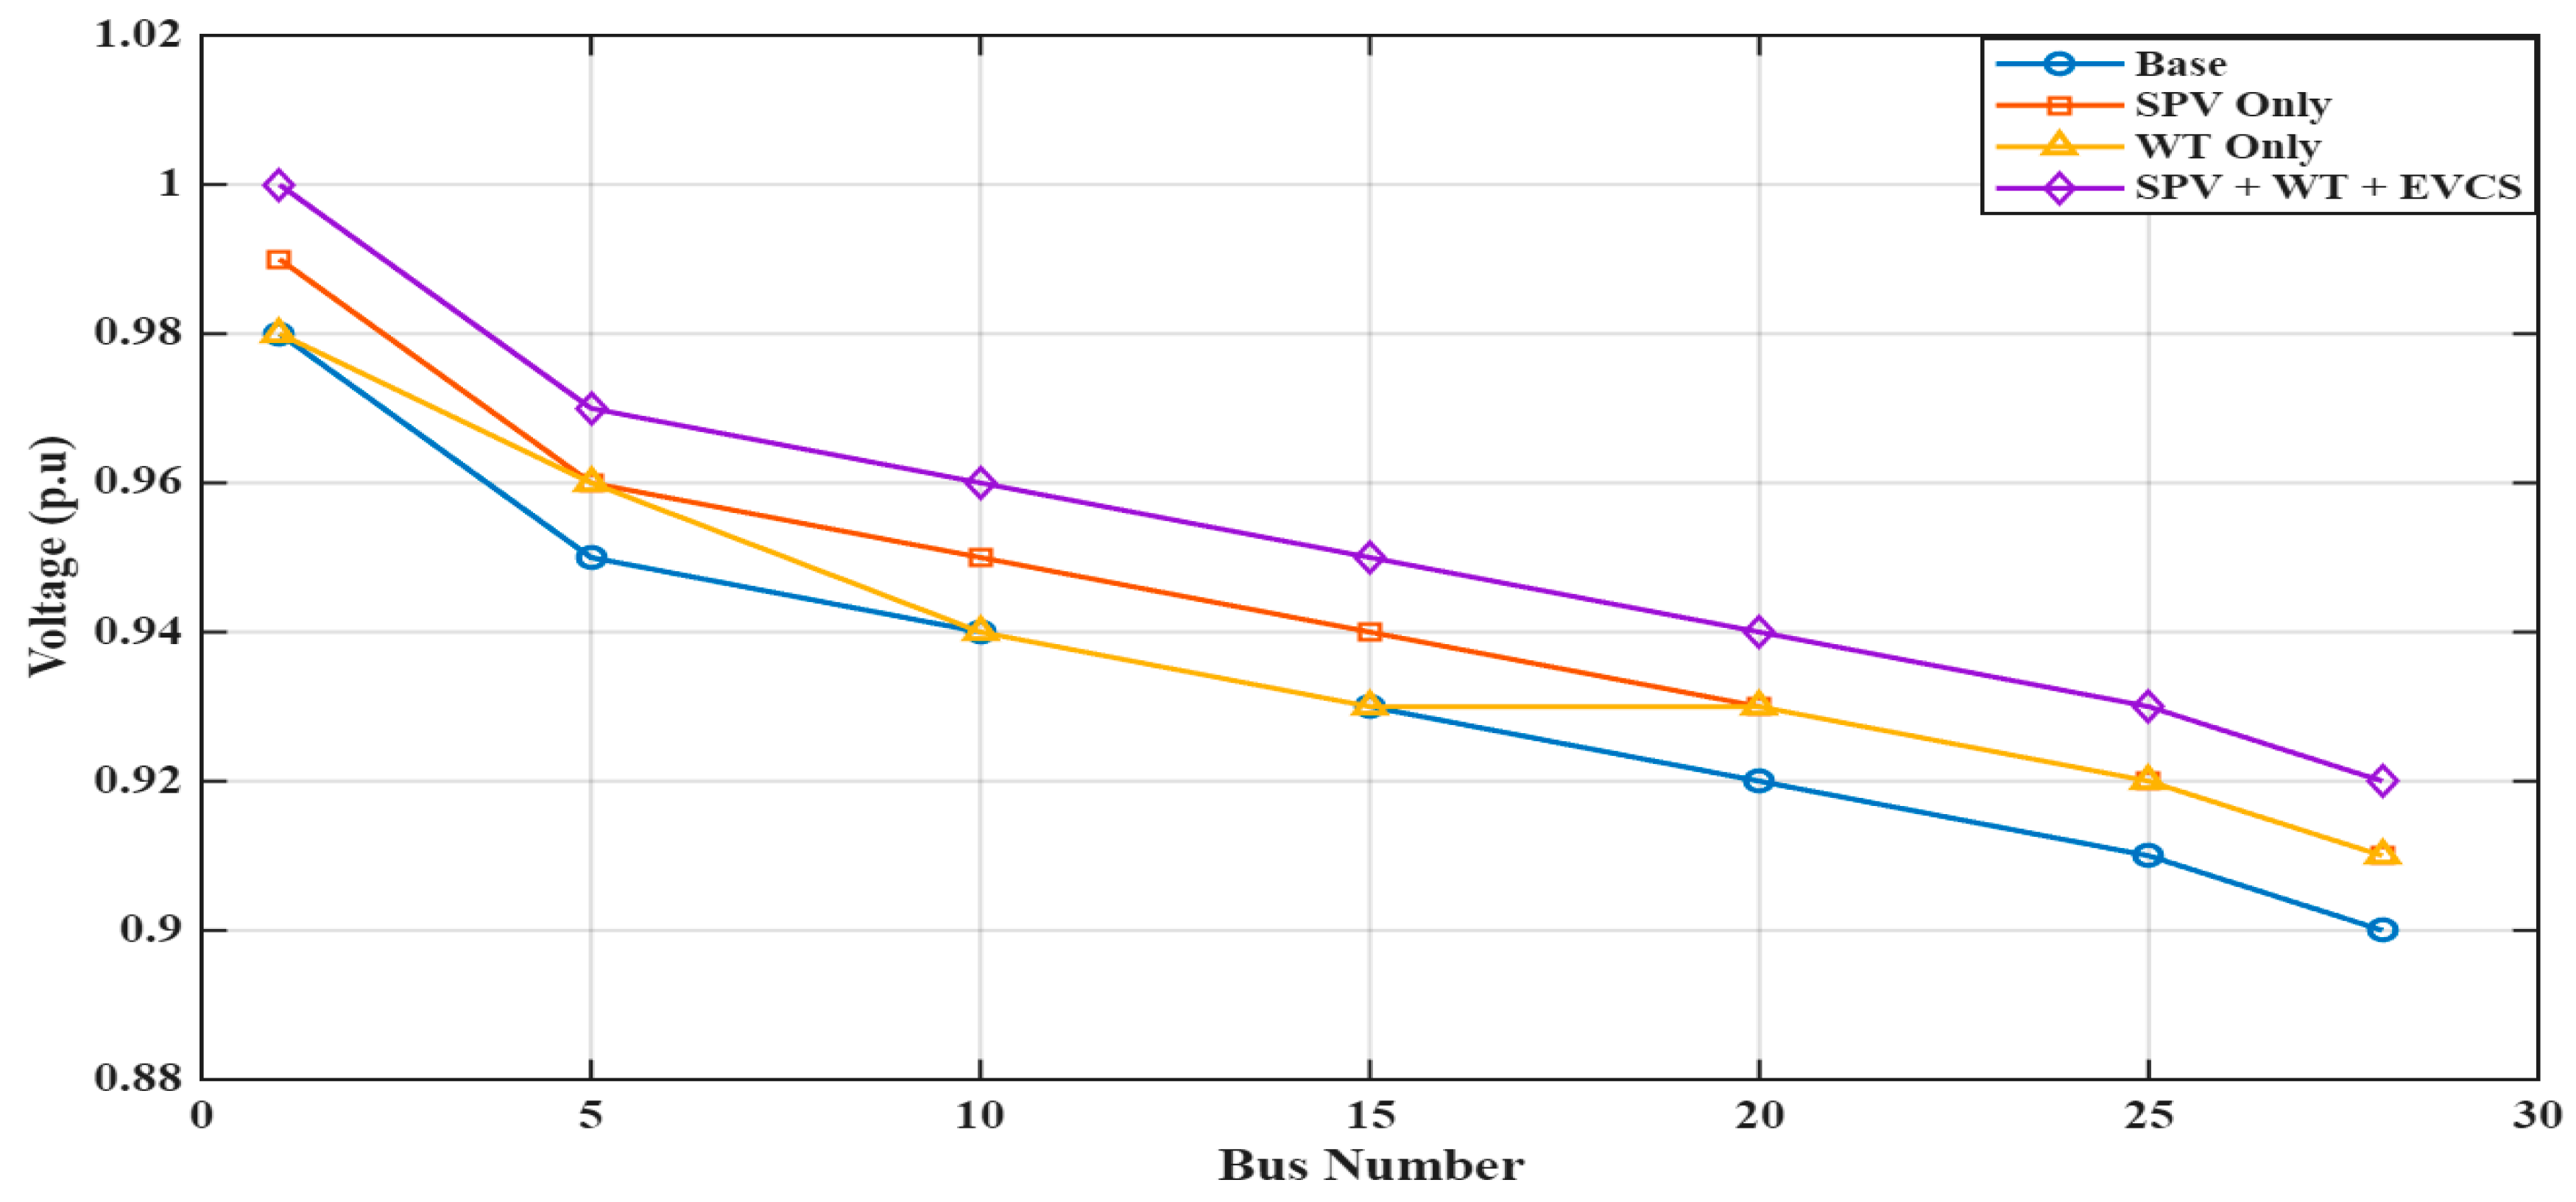
Under various conditions, Figure 9 compares voltage profiles across key buses.
Figure 9.
Voltage profiles (per unit) for selected buses.
Under peak load, the voltage at buses 19 and 24 dropped below 0.95 p.u. as per the base system. The proposed work improved minimum voltages to over 0.97 p.u., which suggests higher voltage support. These enhancements were associated with lower losses and reactive power assistance from DGs.
5.5. Voltage Stability Index
The optimized scenarios show an improvement in the VSI at weak buses. The minimal VSI values for each condition are given in Table 9.
Table 9.
Minimum VSI values.
The proposed integrated method showed the greatest VSI. This proves that coordinated deployment of renewables improves system VSIs.
5.6. Economic Evaluation of Optimal Placement of RDGs
The strategic placement of RDG units throughout the distributed network seeks to minimize energy loss and decrease procurement costs from the grid. Integrating RDGs units requires a significant initial investment, in addition to continuous operational and maintenance costs. The installation costs for RDGs and the O&M costs are presented in Table 10. Table 11 presents the yearly economical cost analysis.
Table 10.
Cost table of different parameters [43].
Table 11.
Annual economic cost analysis.
5.7. Economic Evaluation of Installation of EVCS
A positive NPV indicates that the installed EVCS infrastructure is financially viable in the long run, as shown in Table 12.
Table 12.
Techno-economic feasibility of EVCS was assessed based on Net Present Value (NPV).
5.8. Discussion
The synchronized integration of SPV, WT, and EVCS markedly decreases power loss and enhances voltage profiles. The combined scenario is financially enticing because of the modest yearly costs of DG units and the significant improvement in NPV metrics due to the EVCS income stream. An advantage in multi-objective, uncertainty-aware optimization is that CFOA yields a strong search capacity with quicker and more reliable convergence than conventional algorithms. Placement decisions are robust against seasonal fluctuations based on the use of wind speed and sun irradiation probabilistic models, in line with results from related stochastic planning studies.
6. Conclusions and Future Work
For the optimal placement of DGs based on solar PV, wind, and EVCS in an RDS under seasonal generation uncertainty, this paper proposes a unified techno-economic optimization framework. By using the CFOA and the Indian 28-bus test system, the suggested approach successfully decreases economic cost, improves voltage stability, and minimizes active power loss. The technique guarantees realism and resilience by using probabilistic models (Beta and Weibull distributions) to depict the fluctuation of solar irradiance and wind speed and by somewhat modifying published scientific findings. Significant improvements in VSIs and a decrease in power loss of up to 37% were achieved through the coordinated integration of SPV, WT, and EVCS units. NPV analysis, which was a part of the economic evaluation, also showed that integrating EVCS might be financially beneficial, with an NPV of more than $0.6 million after 10 years. Incorporating renewable and real-time demand profiles, extending the model to unbalanced three-phase systems, integrating energy storage systems, and enabling V2G capabilities are all potential areas for future development. To further improve performance for bigger and more complicated networks, it may be worthwhile to combine the CFOA with other metaheuristics to create hybrid versions. When taken as a whole, the suggested approach offers a practical and effective planning tool for smart distribution systems that include electric mobility and renewable energy sources in the future.
Author Contributions
Conceptualization, S.K.S.; Methodology, B.G., S.K.S., S.M. and N.D.; Software, R.P.; Validation, S.K.S., S.M. and R.B.; Formal analysis, B.G., S.K.S. and N.D.; Investigation, B.G., S.K.S., S.M., N.D. and R.P.; Resources, R.B. and R.P.; Data curation, B.G., S.K.S., S.M., R.B. and R.P.; Writing—original draft, B.G., S.K.S. and N.D.; Writing—review & editing, B.G., S.K.S. and N.D.; Visualization, B.G. and S.K.S.; Supervision, S.K.S., S.M. and N.D.; Project administration, N.D. and R.B.; Funding acquisition, N.D., R.B. and R.P. All authors have read and agreed to the published version of the manuscript.
Funding
This research received no external funding.
Data Availability Statement
The original contributions presented in this study are included in the article. Further inquiries can be directed to the corresponding authors.
Conflicts of Interest
The authors declare no conflict of interest.
References
- Bouchikhi, N.; Boussadia, F.; Bouddou, R.; Salau, A.O.; Mekhilef, S.; Gouder, C.; Adiche, S.; Belabbes, A. Optimal distributed generation placement and sizing using modified grey wolf optimization and ETAP for power system performance enhancement and protection adaptation. Sci. Rep. 2025, 15, 13919. [Google Scholar] [CrossRef] [Scilit]
- Alhasnawi, B.N.; Zanker, M.; Bureš, V. A new smart charging electric vehicle and optimal DG placement in active distribution networks with optimal operation of batteries. Results Eng. 2025, 25, 104521. [Google Scholar] [CrossRef] [Scilit]
- Guerrero-Silva, J.A.; Romero-Gelvez, J.I.; Aristizábal, A.J.; Zapata, S. Optimization and Trends in EV Charging Infrastructure: A PCA-Based Systematic Review. World Electr. Veh. J. 2025, 16, 345. [Google Scholar] [CrossRef] [Scilit]
- Weerasundara, K.M.G.Y.S.; Udayakumar, K.A.C.; Hemapala, K.T.M.U. Optimal Sizing and Placement of Distributed Generators in Unbalanced Distribution Networks: An Analytical Perspective. Eng. J. Inst. Eng. Sri Lanka 2025, 58, 37–51. [Google Scholar] [CrossRef] [Scilit]
- Zangmo, R.; Sudabattula, S.K.; Mishra, S.; Dharavat, N.; Golla, N.K.; Sharma, N.K.; Jadoun, V.K. Optimal placement of renewable distributed generators and electric vehicles using multi-population evolution whale optimization algorithm. Sci. Rep. 2024, 14, 28447. [Google Scholar] [CrossRef] [Scilit] [PubMed]
- Adegoke, S.A.; Sun, Y.; Adegoke, A.S.; Ojeniyi, D. Optimal placement of distributed generation to minimize power loss and improve voltage stability. Heliyon 2024, 10, e39298. [Google Scholar] [CrossRef] [Scilit] [PubMed]
- Farh, H.M.H.; Al-Shamma’a, A.A.; Qamar, A.; Saeed, F.; Al-Shaalan, A.M. Optimal sizing and placement of distributed generation under N-1 contingency using hybrid crow search–particle swarm algorithm. Sustainability 2024, 16, 2380. [Google Scholar] [CrossRef] [Scilit]
- Deeum, S.; Charoenchan, T.; Janjamraj, N.; Romphochai, S.; Baum, S.; Ohgaki, H.; Mithulananthan, N.; Bhumkittipich, K. Optimal placement of electric vehicle charging stations in an active distribution grid with photovoltaic and battery energy storage system integration. Energies 2023, 16, 7628. [Google Scholar] [CrossRef] [Scilit]
- Motlagh, S.G.; Oladigbolu, J.; Li, L. A review on electric vehicle charging station operation considering market dynamics and grid interaction. Appl. Energy 2025, 392, 126058. [Google Scholar] [CrossRef] [Scilit]
- Lara Leon, D.; Gallego Landera, Y.; Garcia Santander, L.; León Viltre, L.T.; Cuaresma Zevallos, O.; Muñoz Jarpa, F.A. Optimal Location of Charging Stations for Electric Vehicles in Distribution Networks: A Literature Review. Energies 2025, 18, 5616. [Google Scholar] [CrossRef] [Scilit]
- Izzati, A.; Mohamad, H.; Naidu, K.; Sapari, N.M.; Awalin, L.J.; Yasin, Z.M. Optimizing electric vehicle charging station placement: Comparative analysis. Int. J. Electr. Electron. Eng. 2025, 12, 241–251. [Google Scholar] [CrossRef] [Scilit]
- Soliman, I.A.; Tulsky, V.; El-Ghany, H.A.A.; ElGebaly, A.E. Optimal allocation of electric vehicle charging stations and distributed generation in radial distribution networks. Eng. Sci. Technol. Int. J. 2024, 60, 101907. [Google Scholar] [CrossRef] [Scilit]
- Pagidipala, S.; Sandeep, V. Optimal planning of electric vehicle charging stations and distributed generators with network reconfiguration in smart distribution networks considering uncertainties. Meas. Sens. 2024, 36, 101400. [Google Scholar] [CrossRef] [Scilit]
- Nareshkumar, K.; Das, D. Optimal location and sizing of electric vehicles charging stations and renewable sources in a coupled transportation-power distribution network. Renew. Sustain. Energy Rev. 2024, 203, 114767. [Google Scholar] [CrossRef] [Scilit]
- Wang, S.; Tan, Q.; Jiang, Q.; Shao, H.; Kouhi, M. Stochastic carbon-aware planning of renewable DGs and EV charging stations with demand flexibility in smart urban grids. Sci. Rep. 2025, 15, 34433. [Google Scholar] [CrossRef] [Scilit] [PubMed]
- Golla, N.K.; Dharavat, N.; Sudabattula, S.K.; Velamuri, S.; Kantipudi, M.V.V.P.; Kotb, H.; Shouran, M.; Alenezi, M. Techno-economic analysis of the distribution system with integration of distributed generators and electric vehicles. Front. Energy Res. 2023, 11, 1221901. [Google Scholar] [CrossRef] [Scilit]
- Wang, H.; Song, Y.; Yang, H.; Liu, Z. Generalized Koopman neural operator for data-driven modelling of electric railway pantograph-catenary systems. IEEE Trans. Transp. Electrif. 2025, 11, 14100–14112. [Google Scholar] [CrossRef] [Scilit]
- Meng, X.; Xie, D.; Lin, H.; Lin, C.; Ge, X.; Liu, Z. Dissipativity-Based Multiport Stability Root-Cause Identification and Mitigation for Solid-State Transformers. IEEE Trans. Ind. Electron. 2026, PP, 1–13. [Google Scholar] [CrossRef] [Scilit]
- Ragab, M.M.; Ibrahim, R.A.; Desouki, H.; Swief, R. Optimal energy management applying load elasticity integrating renewable resources. Sci. Rep. 2023, 13, 15000. [Google Scholar] [CrossRef] [Scilit]
- Kayal, P.; Chanda, C. Optimal mix of solar and wind distributed generations considering performance improvement of electrical distribution network. Renew. Energy 2015, 75, 173–186. [Google Scholar] [CrossRef] [Scilit]
- Atef, A.; Moanes, M.; El-Sehiemy, R.A.; Keshta, H. Multi-objective Transit Search Optimizer for Dynamic Reconfiguration of Standard and Realistic Radial Distribution Networks with Hosted Renewables and EV Charging Stations. Results Eng. 2025, 28, 108079. [Google Scholar] [CrossRef] [Scilit]
- Le, M.H.; Pham, T.D.; Nguyen, T.T. Optimal economic analysis of electric vehicle charging stations, renewable energy technologies, and capacitor banks in distribution networks. IET Gener. Transm. Distrib. 2025, 19, E70010. [Google Scholar] [CrossRef] [Scilit]
- Babu RG, S.; Reddy K, M.V.; S, S.; GS, S.; K, N.; Sharma, A.; Tellez, A.A. Techno-economic assessment of distribution system considering different types of electric vehicles and distributed generators. IET Gener. Transm. Distrib. 2024, 18, 1815–1829. [Google Scholar] [CrossRef] [Scilit]
- Maghfuri, A.M.; Rad, M.A.V.; Kasaeian, A. Techno-economic assessment of renewable-based EV charging stations with green hydrogen production for excess power management under different consumption patterns. Sustain. Energy Technol. Assess. 2025, 81, 104425. [Google Scholar] [CrossRef] [Scilit]
- Alhazmi, Y. Techno-economic design analysis of electric vehicle charging stations powered by photovoltaic technology on the highways of Saudi Arabia. Energies 2025, 18, 315. [Google Scholar] [CrossRef] [Scilit]
- Dharavat, N.; Sudabattula, S.K.; Velamuri, S.; Mishra, S.; Sharma, N.K.; Bajaj, M.; Elgamli, E.; Shouran, M.; Kamel, S. Optimal Allocation of Renewable Distributed Generators and Electric Vehicles in a Distribution System Using the Political Optimization Algorithm. Energies 2022, 15, 6698. [Google Scholar] [CrossRef] [Scilit]
- Bilal, M.; Alsaidan, I.; Alaraj, M.; Almasoudi, F.M.; Rizwan, M. Techno-economic and environmental analysis of grid-connected electric vehicle charging station using AI-based algorithm. Mathematics 2022, 10, 924. [Google Scholar] [CrossRef] [Scilit]
- Poudel, S.; Wang, J.; Zhou, Y.; Reddi, K.; Elgowainy, A. Technoeconomic analysis of distributed energy resources for rapid deployment of the US national charging network. Cell Rep. Sustain. 2025, 2, 100303. [Google Scholar] [CrossRef] [Scilit]
- Bonela, R.; Ghatak, S.R.; Swain, S.C.; Lopes, F.; Nandi, S.; Sannigrahi, S.; Acharjee, P. Analysis of Techno–Economic and Social Impacts of Electric Vehicle Charging Ecosystem in the Distribution Network Integrated with Solar DG and DSTATCOM. Energies 2025, 18, 363. [Google Scholar] [CrossRef] [Scilit]
- Nassef, A.M.; Abdelkareem, M.A.; Maghrabie, H.M.; Baroutaji, A. Review of metaheuristic optimization algorithms for power systems problems. Sustainability 2023, 15, 9434. [Google Scholar] [CrossRef] [Scilit]
- Ma, H.; Simon, D.; Siarry, P.; Yang, Z.; Fei, M. Biogeography-based optimization: A 10-year review. IEEE Trans. Emerg. Top. Comput. Intell. 2017, 1, 391–407. [Google Scholar] [CrossRef] [Scilit]
- Mohammed, H.M.; Rashid, T.A. Chaotic fitness-dependent optimizer for planning and engineering design. Soft Comput. 2021, 25, 14281–14295. [Google Scholar] [CrossRef] [Scilit]
- Shaheen, M.A.; Hasanien, H.M.; Alsaleh, I.; Alassaf, A.; Zhang, M.; Alateeq, A. Optimal power flow in power systems with renewable energy resources uncertainty including geothermal power plants. Ain Shams Eng. J. 2025, 16, 103784. [Google Scholar] [CrossRef] [Scilit]
- Wu, Y.; Liu, J.; Wang, L.; An, Y.; Zhang, X. Distribution network reconfiguration using chaotic particle swarm chicken swarm fusion optimization algorithm. Energies 2023, 16, 7185. [Google Scholar] [CrossRef] [Scilit]
- Sultan, H.M.; Diab, A.A.Z.; Menesy, A.S.; Kassas, M.; Alqahtani, M.; Khalid, M.; Abdul-Ghaffar, H. Enhancing optimal power flow in power systems: A comparative analysis of recent metaheuristic optimization techniques. Energy Rep. 2025, 13, 3957–3999. [Google Scholar] [CrossRef] [Scilit]
- Vadi, S.; Bildirici, M.; Kaplan, O. Performance Comparison of Metaheuristic and Hybrid Algorithms Used for Energy Cost Minimization in a Solar–Wind–Battery Microgrid. Sustainability 2025, 17, 8849. [Google Scholar] [CrossRef] [Scilit]
- Paul, C.; Sarkar, T.; Dutta, S.; Roy, P.K. Integration of optimal power flow with combined heat and power dispatch of renewable wind energy based power system using chaotic driving training based optimization. Renew. Energy Focus 2024, 49, 100573. [Google Scholar] [CrossRef] [Scilit]
- Dixit, M.; Kundu, P.; Jariwala, H.R. Techno-economic analysis-based optimal incorporation of distributed energy resources in distribution network under load uncertainty. Int. J. Ambient. Energy 2021, 42, 605–611. [Google Scholar] [CrossRef] [Scilit]
- Veldman, E.; Verzijlbergh, R.A. Distribution grid impacts of smart electric vehicle charging from different perspectives. IEEE Trans. Smart Grid 2014, 6, 333–342. [Google Scholar] [CrossRef] [Scilit]
- Güven, A.F.; Yörükeren, N.; Tag-Eldin, E.; Samy, M.M. Multi-objective optimization of an islanded green energy system utilizing sophisticated hybrid metaheuristic approach. IEEE Access 2023, 11, 103044–103068. [Google Scholar] [CrossRef] [Scilit]
- Delapedra-Silva, V.; Ferreira, P.; Cunha, J.; Kimura, H. Methods for financial assessment of renewable energy projects: A review. Processes 2022, 10, 184. [Google Scholar] [CrossRef] [Scilit]
- Jin, B.; Song, J.; Liao, Y. Comparative study on the improvement of a distributed energy system performance by optimized operation strategy from design to operation. Energy Rep. 2023, 10, 1726–1738. [Google Scholar] [CrossRef] [Scilit]
- Sankar, M.M.; Chatterjee, K. A posteriori multiobjective approach for techno-economic allocation of PV and BES units in a distribution system hosting PHEVs. Appl. Energy 2023, 351, 121851. [Google Scholar] [CrossRef] [Scilit]

Disclaimer/Publisher’s Note: The statements, opinions and data contained in all publications are solely those of the individual author(s) and contributor(s) and not of MDPI and/or the editor(s). MDPI and/or the editor(s) disclaim responsibility for any injury to people or property resulting from any ideas, methods, instructions or products referred to in the content. |
© 2026 by the authors. Licensee MDPI, Basel, Switzerland. This article is an open access article distributed under the terms and conditions of the Creative Commons Attribution (CC BY) license.