


Abstract
Efficient thermal management of lithium-ion batteries is critical for the safety, performance, and longevity of electric vehicles. This work numerically investigates a battery thermal management system (BTMS) for a LiFePO4 battery, featuring a liquid-cooling plate with novel droplet-shaped turbulators and coolant with different nanofluids. Computational Fluid Dynamics (CFD) simulations were employed to analyze the effects of cooling channel geometry, nanofluid type, nanoparticle volume fraction, coolant inlet velocity, and battery discharge rate on the system’s thermal performance and pressure drop. Results show that the droplet-shaped channel reduces the maximum battery temperature by 1.64 K compared to a conventional straight channel, owing to enhanced turbulence and larger heat-transfer area. Among different coolants, the 6% Cu–water nanofluid demonstrated the highest cooling effectiveness due to its superior thermal conductivity. To balance competing objectives, a multi-objective optimization using Response Surface Methodology (RSM) and the Non-dominated Sorting Genetic Algorithm II (NSGA-II) was performed. The optimal design was achieved with a coolant velocity of 0.097 m/s and a volume fraction of Cu nanoparticle of 3.85%, which maintained the maximum battery temperature of 299.7 K with a minimal pressure drop of 26.27 Pa at a 1.03 C discharge rate. These findings highlight that a BTMS combining droplet-shaped turbulators with a Cu–water nanofluid provides a highly effective and energy-efficient thermal management strategy.
1. Introduction
Over the past few years, as consumption of traditional fossil fuels has risen rapidly, people worldwide have faced environmental pollution and energy shortages [1]. A significant amount of fossil fuels is used in transportation [2]. To cut down carbon emissions, adopting clean and renewable energy in both industrial and transport activities has become essential.
Electric vehicles are regarded as a viable alternative to the widely used fossil fuel-powered vehicles [3]. In contrast to conventional petrol-fueled vehicles, electric cars boast benefits including clean operation, high energy efficiency, zero-pollution running, and minimal noise output. However, they also face challenges, including limited driving range and relatively lower safety standards.
Driven by rapid advancements in energy storage technology, lithium-ion batteries have become the most widely adopted power source in the electric vehicle sector due to their high energy density, long cycle life, and low self-discharge rate [4]. Despite these advantages, the operation of lithium-ion batteries involves complex and time-varying electrochemical reactions. Frequent high-rate discharging under demanding operating conditions generates substantial reaction heat and Joule heating, causing rapid battery temperature increases [5]. Temperature is a critical factor affecting battery module lifespan and capacity. Elevated temperatures significantly reduce module capacity. More critically, elevated temperatures can induce thermal runaway inside a battery pack, which can result in fires or explosions. Therefore, analyzing temperature distribution within battery modules and designing safe, reliable thermal management systems is of paramount importance [6].
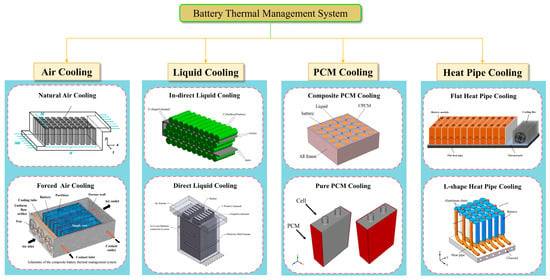
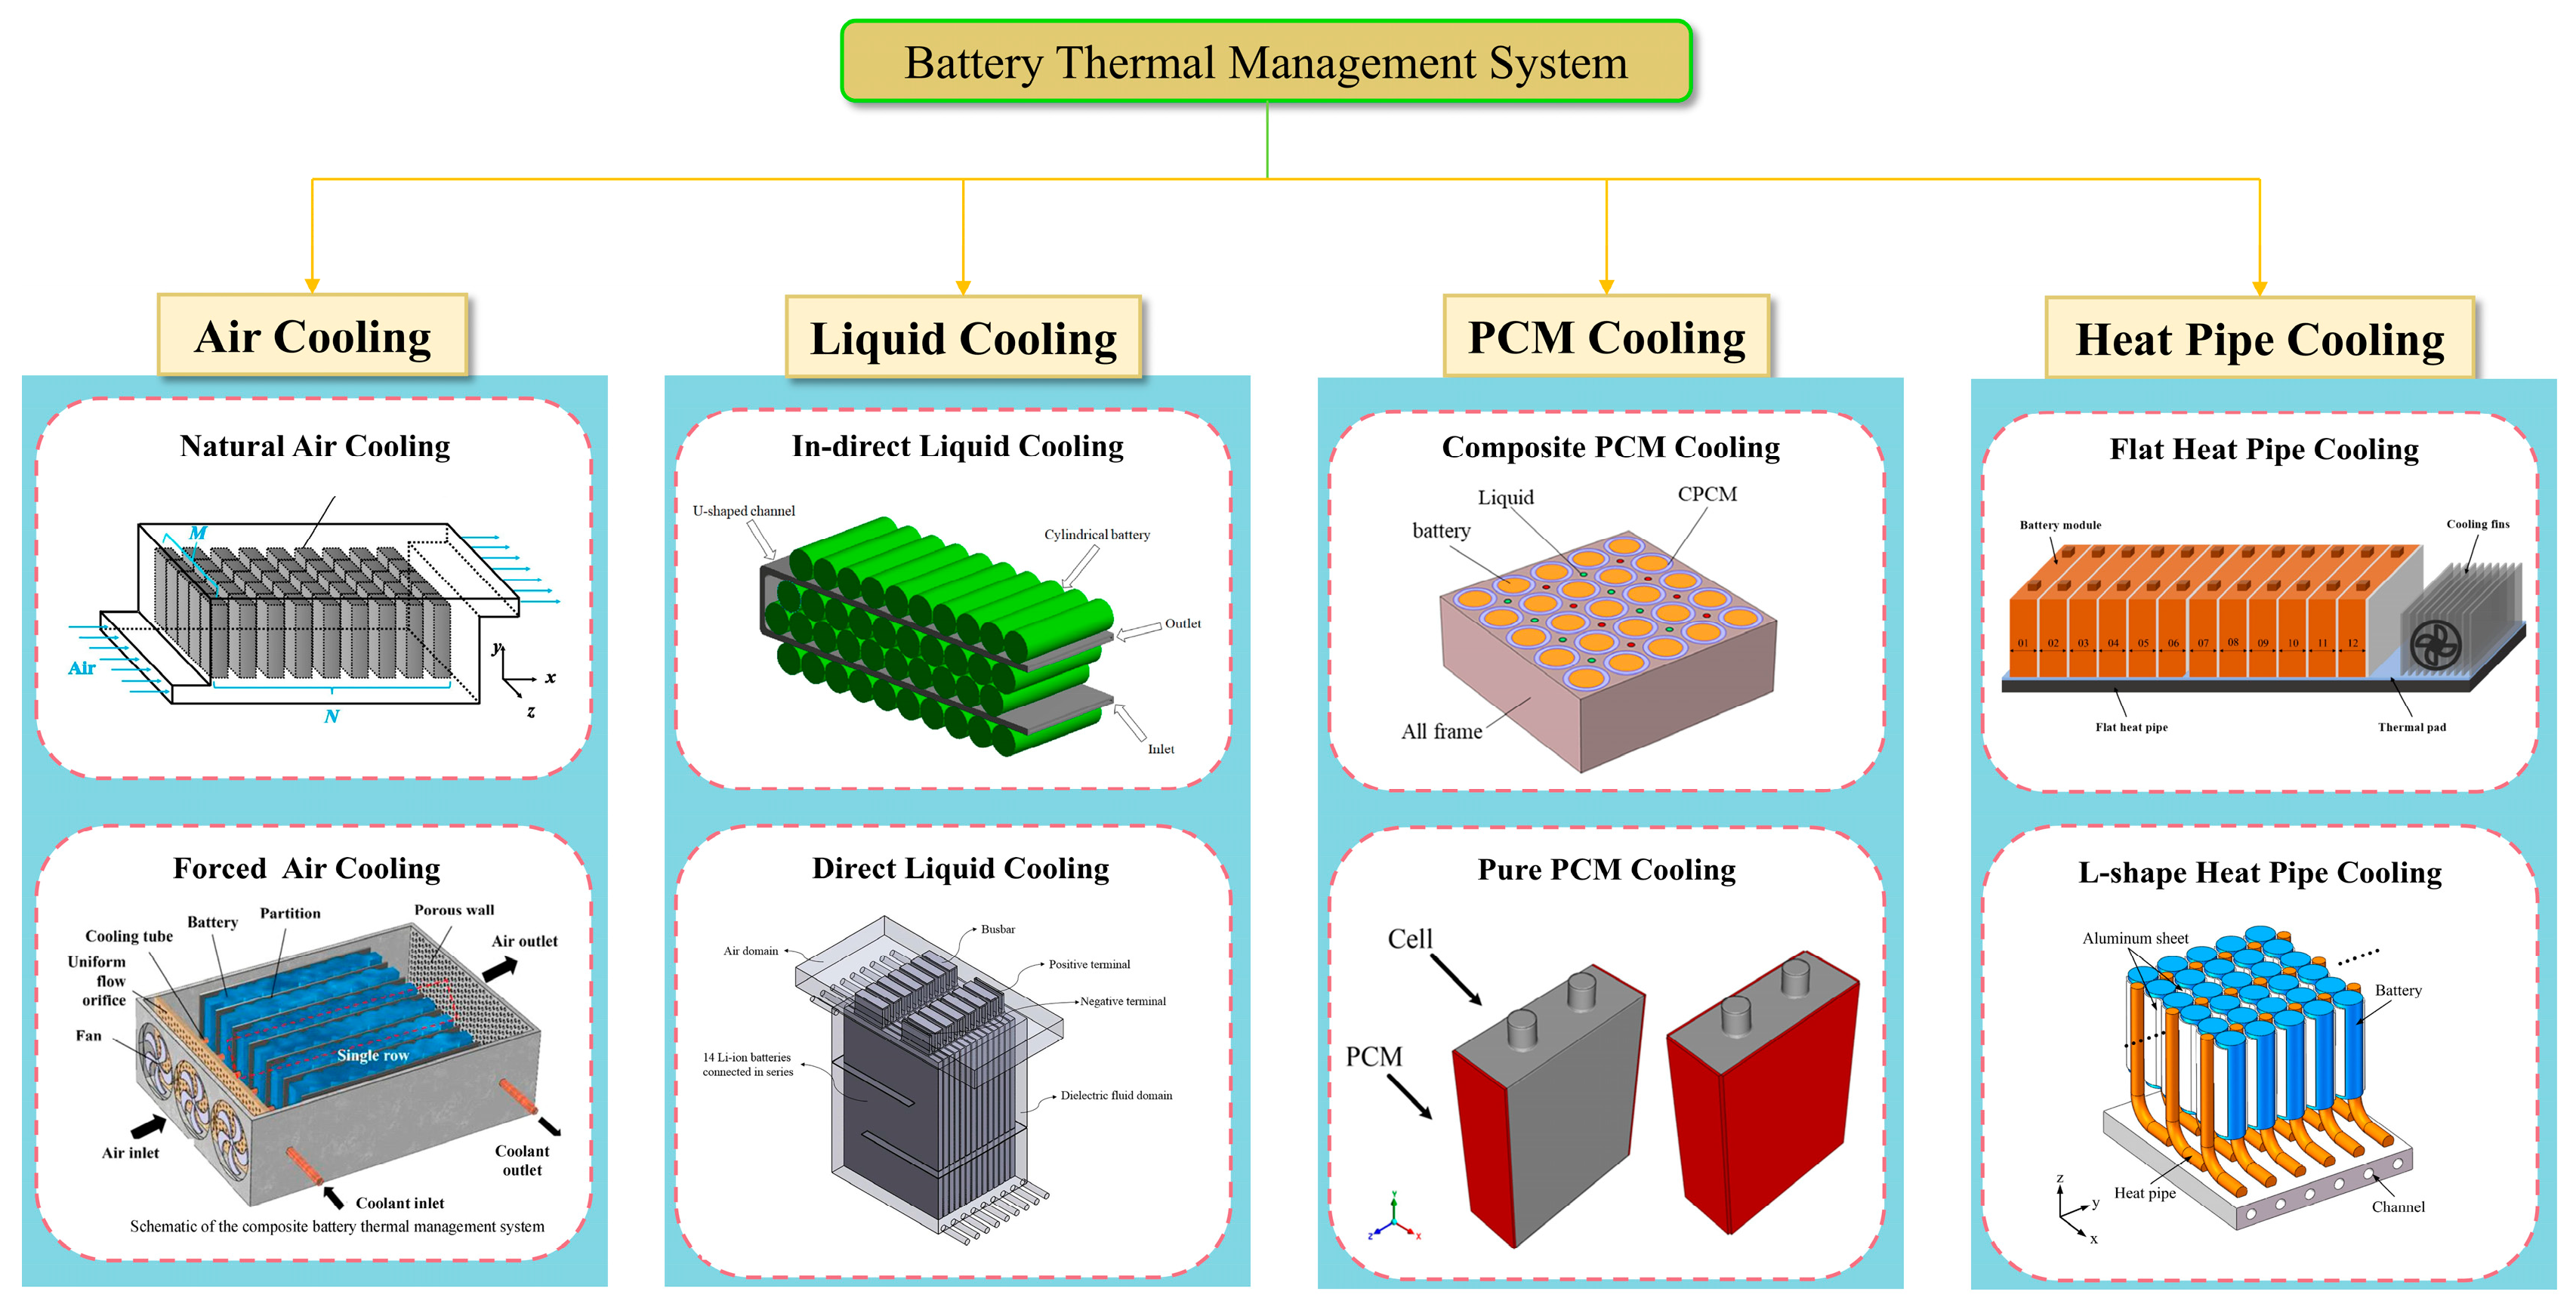
The primary cooling methods for commonly used lithium-ion batteries are categorized as follows: air cooling [7,8], liquid cooling [9,10,11], phase-change material (PCM) cooling [12,13,14], heat pipe cooling [15,16,17], and composite cooling [18,19,20]. Furthermore, the common battery thermal management systems are illustrated in Figure 1.
Figure 1.
Types of current battery-cooling technologies.
Due to its low cost and compact size, air cooling is a popular choice among various thermal management strategies; however, its application is restricted by limited cooling efficiency and poor temperature uniformity [21]. In contrast, PCM cooling features a straightforward configuration, excellent energy efficiency, and consistent temperature regulation. However, its effectiveness is limited by two key factors: the naturally poor thermal conductivity of these materials and the considerable thermal deterioration under elevated temperatures [22]. Heat pipe cooling represents a highly efficient solution that integrates the advantages of both active and passive methods, yet its widespread adoption is impeded by structural complexity and high cost [23]. Therefore, considering the current technological maturity and future application potential, liquid cooling emerges as the most promising solution for advanced thermal management. In terms of contact method, liquid-based thermal management systems are divided into direct and indirect categories. In direct-contact systems, high-viscosity, non-corrosive coolants like mineral oil or fluorinated ether are used, with the battery fully immersed in the liquid [24]. Indirect-contact systems utilize heat-dissipation structures like cooling plates and metal pipes to circulate coolant through microchannels, transferring heat away from the battery without direct fluid contact [25]. In direct-liquid-cooling research, Patil et al. [26] developed a system where battery modules were immersed in mineral oil. Their results showed a 46.3% reduction in maximum cell temperature compared to natural convection cooling, effectively preventing thermal runaway in the battery pack. For 18,650 lithium-ion batteries, Luo et al. developed an immersion cooling configuration that incorporates spacer plates. With a coolant flow rate exceeding 1000 mL/min, the peak temperatures remained below 50 °C [27]. However, direct-liquid-contact cooling systems possess limitations, such as potential leakage and short circuits if improper insulation and encapsulation are employed [28].
Compared to direct systems, indirect cooling offers advantages such as improved safety and easier implementation [29]. Theoretical research has involved numerous scholars analyzing factors that affect the thermal performance of liquid-cooling systems, leading to novel configurations. Among the numerous solutions, structural designs for liquid-cooling plates are relatively common. Turbulators are widely used in convective heat-transfer systems to improve performance. Compared with straight channels, turbulent channels significantly enhance heat-transfer efficiency [30]. This improvement arises from the simultaneous increase in heat-transfer area and enhanced boundary layer disruption [31]. Thus, despite an associated pressure-drop penalty, turbulators remain an effective heat-transfer enhancement method. Zhao et al. proposed a serpentine channel design to increase the contact area between the cooling plate and cylindrical battery surfaces. Their research showed that a U-shaped design improves cooling performance and enhances temperature uniformity within the battery [32]. Monika et al. compared six liquid-cooled plate channel designs, finding that pumpkin-shaped channels had lower power consumption, whereas hexagonal and serpentine channels offered better temperature uniformity [33].
Nanofluids, as refrigerants with superior properties, have thermal conductivity significantly higher than conventional liquids and are less likely to cause blockages, attracting considerable attention in heat-transfer applications [34]. Liu et al. [35] proposed a wave-like serpentine cooling tube for large cylindrical battery modules. Their results indicated that using a 0.75% mass-fraction nanofluid reduced the maximum temperature by 9.8% and the temperature difference by 22.3% compared to pure water cooling. At a nanoparticle mass fraction of 0.75% and a flow velocity of 0.15 m/s, the system met all cooling requirements while reducing power consumption. Yetik et al. [36] utilized Al2O3 to prepare nanofluids for various battery thermal management system configurations, and established two cooling modes with longitudinal and transverse flow directions. The battery module comprised twenty prismatic lithium-ion cells. The two models were compared under different discharge rates, nanofluid volume fractions, inlet velocities, and coolant temperatures. Results indicated that replacing air cooling with nanofluids enabled the battery module to operate within safe temperature ranges. Jilte et al. improved battery cooling by combining spiral flow channels with Al2O3 nanofluid [37]. Ouyang et al. combined phase-change cooling with nanofluid cooling and discussed the effects of the volume fraction of nanoparticles and the flow velocity of the nanofluid on the cooling performance [38].
Existing research has made significant advances in improving battery pack thermal uniformity; however, it is necessary to further investigate effective mitigation strategies for persistent thermal inhomogeneities. This study proposes a novel thermal design that integrates battery cold plates with turbulent flow channels enhanced by nanoparticle-based coolants and droplet-shaped turbulators. While the advantages of turbulators and nanofluids have been studied separately, few studies have investigated their synergistic effect. Therefore, this work employs numerical simulations to systematically examine the influence of nanoparticle type, volume fraction, and inlet velocity on the battery’s thermal performance. To address the inherent trade-off between maximizing heat-dissipation efficiency and minimizing the required pumping power consumption, this study further adopts the Response Surface Methodology (RSM) to establish a mathematical model for the complex thermo-hydraulic characteristics of the battery thermal management system. Subsequently, the Non-dominated Sorting Genetic Algorithm II (NSGA-II) is applied to perform a multi-objective optimization, identifying the ideal design parameters that concurrently minimize both the maximum battery temperature and the fluid pressure drop. The proposed methodology aims to deliver a holistically optimized, energy-efficient thermal management strategy for high-performance batteries.
2. Physical Description
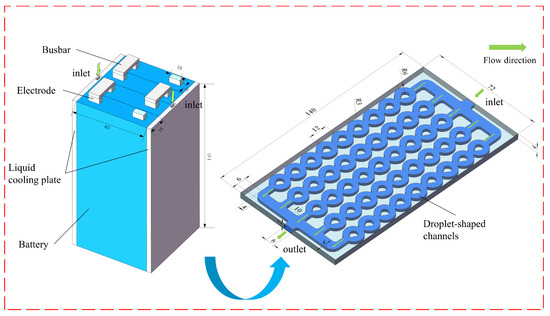
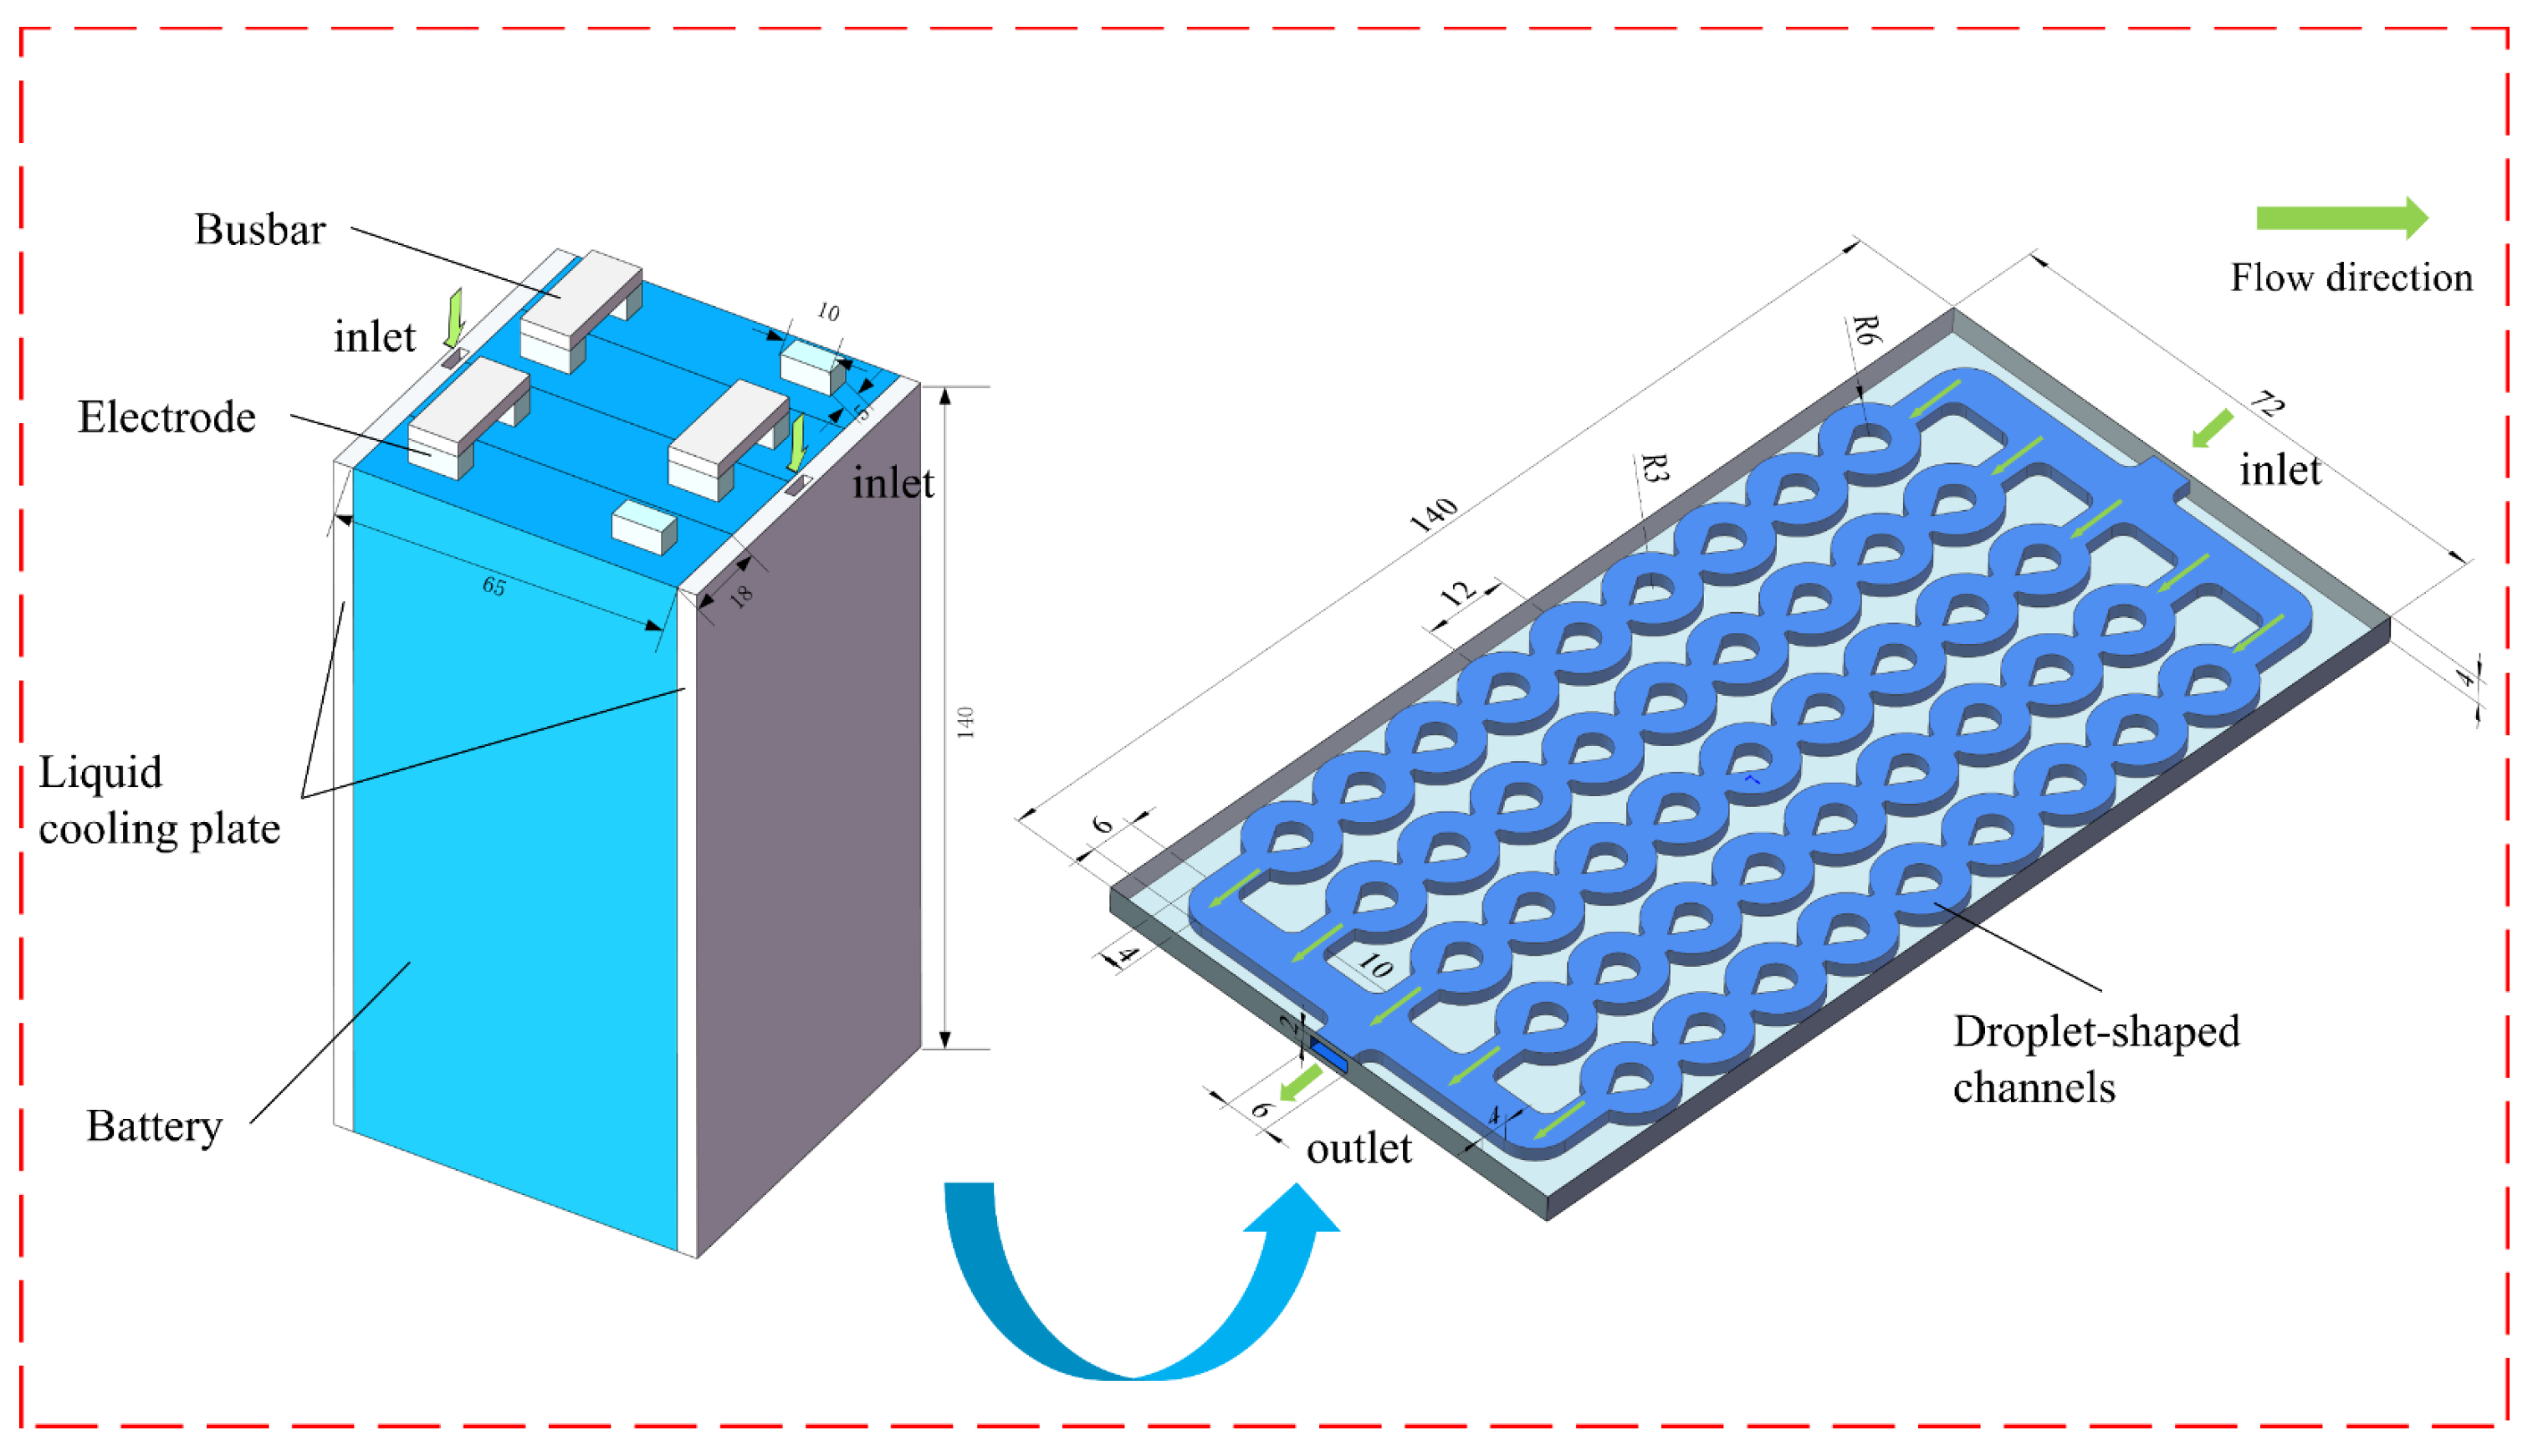
Figure 2 presents the physical model of a droplet-shaped turbulator channel applied in a 15 Ah LiFePO4 battery. The cooling system adopts a cold plate inserted between battery packs to realize efficient heat transfer. The cold plate contains droplet-shaped microchannels where a nanofluid coolant flows for heat exchange. The nanofluid uses deionized water as the base fluid and metal or metal oxide nanoparticles as additives. The dimensions of the battery pack and the cold-plate battery are shown in Figure 2. The battery parameters and nanoparticle properties are listed in Table 1 and Table 2, respectively.
Figure 2.
Geometrical model of the battery with improved multi-channel cold plate.
Table 1.
Physical parameters of the battery [39].
Table 2.
Properties of the nanoparticles [40].
3. Mathematical Model
For the present work, water-based nanofluids were chosen as the coolant. We assume the suspended nanoparticles achieve thermal equilibrium with the base fluid and exhibit no relative motion between phases. Given that the nanoparticles are uniformly dispersed and maintain a stable suspension, we treat the nanofluid as a homogeneous, single-phase fluid. This approach is commonly employed for dilute, well-stabilized nanofluids because it greatly lowers computational demands while still offering satisfactory precision for macroscopic thermal–hydraulic analyses [41].
3.1. Governing Equations
3.1.1. Heat Transfer in Battery
It is assumed that the battery possesses a uniform profile of energy and density, and the temperature of an individual cell can be calculated by [42]
where Qgen is the heat generated by the battery, T is the average battery temperature, ρb represents the battery density, Cp,b represents the battery specific heat, kb is the thermal conductivity, and ∇ is the vector differential operator.
The heat generated by the battery significantly influences the three-dimensional temperature distribution within battery cells. Heat generated within the active region primarily stems from electrochemical reactions occurring internally and from internal resistance caused by current flow. Heat generated in the core region during battery discharge is expressed as [43]
where Qr is the electrochemical reaction heat, and Qj is the Joule heat.
Electrochemical effect heat, as a conclusion of the chemical effect, can be written as [36]
where I is the discharge current, n is the number of electrons, F is the Faraday constant, ΔS is the entropy change, and T is the temperature.
Joule heat generated by the resistance of the battery is given by
where V is the operating voltage, and E is the open-circuit voltage.
According to Equations (2)–(4), Qgen can be expressed as
3.1.2. Coolant Flow in Cold Plates
The flow of coolant in the cold plate adheres to the laws of conservation of mass, momentum, and energy. The governing equations [44] are presented as follows.
The mass conservation equation is
The momentum conversation equation is
The energy conversion equation is
where Tl is the coolant temperature, ρl is the coolant density, u is the flow velocity, p is the coolant pressure, μl is the coolant dynamic viscosity, kl is the coolant thermal conductivity, and Cp,l is the coolant specific heat capacity.
3.2. Nanofluid Properties
3.2.1. Density
The classic solid–liquid blend model can be used to find the nanofluid density, which reads [45]
where ϕ represents the volume fraction of nanoparticles and the subscripts nf, bf, and np demonstrate the nanofluid, base fluid, and nanoparticles, respectively.
3.2.2. Specific Heat
The specific heat is determined by the heat capacity concept [42] which can be defined as
3.2.3. Thermal Conductivity
Various relations exist for the prediction of the thermal conductivity of nanofluids. We select the relation suggested by Corcione [46] to compute the thermal conductivity of nanofluids, that is
where T is the temperature of the nanofluid, Tfr is the freeze point of water, and knp is the thermal conductivity of nanoparticles. Re and Pr symbolize nanoparticle Reynold number and foundation fluid Prandtl number, with Re written as
where B is the Boltzmann constant, B = 1.3807 × 10⁻²³ J/K, ρbf and μbf stand for foundation fluid density, and dnp is the nanoparticle diameter.
3.2.4. Dynamic Viscosity [47]
The dynamic viscosity correlation is calculated as follows:
or
Table 3.
Physical parameters of coolant (298.15 K).
3.3. Numerical Simulation Scheme
Numerical calculations were performed using Ansys Fluent 2024 R1 software. Mesh generation was conducted with MESH 2024 R1 software, employing an unstructured grid. A laminar flow model was adopted, alongside a coupled algorithm to resolve the interaction between the pressure field and velocity field. To define the flow conditions at the boundaries, a velocity inlet was specified for the inlet, while the outlet was set as a pressure outlet. A uniform convective heat-transfer coefficient of 5 W/m·K was applied across all surfaces of both the battery module and the liquid-cooling plate. The temperature at the inlet was fixed at 298.15 K, with inlet velocities configured at five distinct levels: 0.05, 0.1, 0.15, 0.2, and 0.25 m/s.
A second-order upwind scheme was employed to discretize the momentum equation and other spatial terms. The under-relaxation factors for momentum, pressure, energy, and density were set to 0.5, 0.5, 0.75, and 1.0, respectively. For convergence criteria, the relative residuals of the energy and momentum equations were constrained to be less than 10−6, while the relative residual of the continuity equation was restricted to below 10−4.
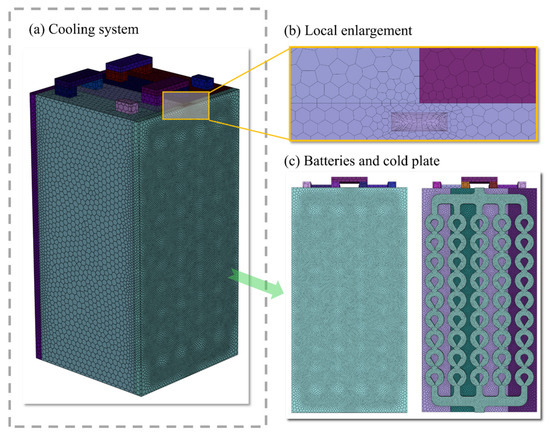
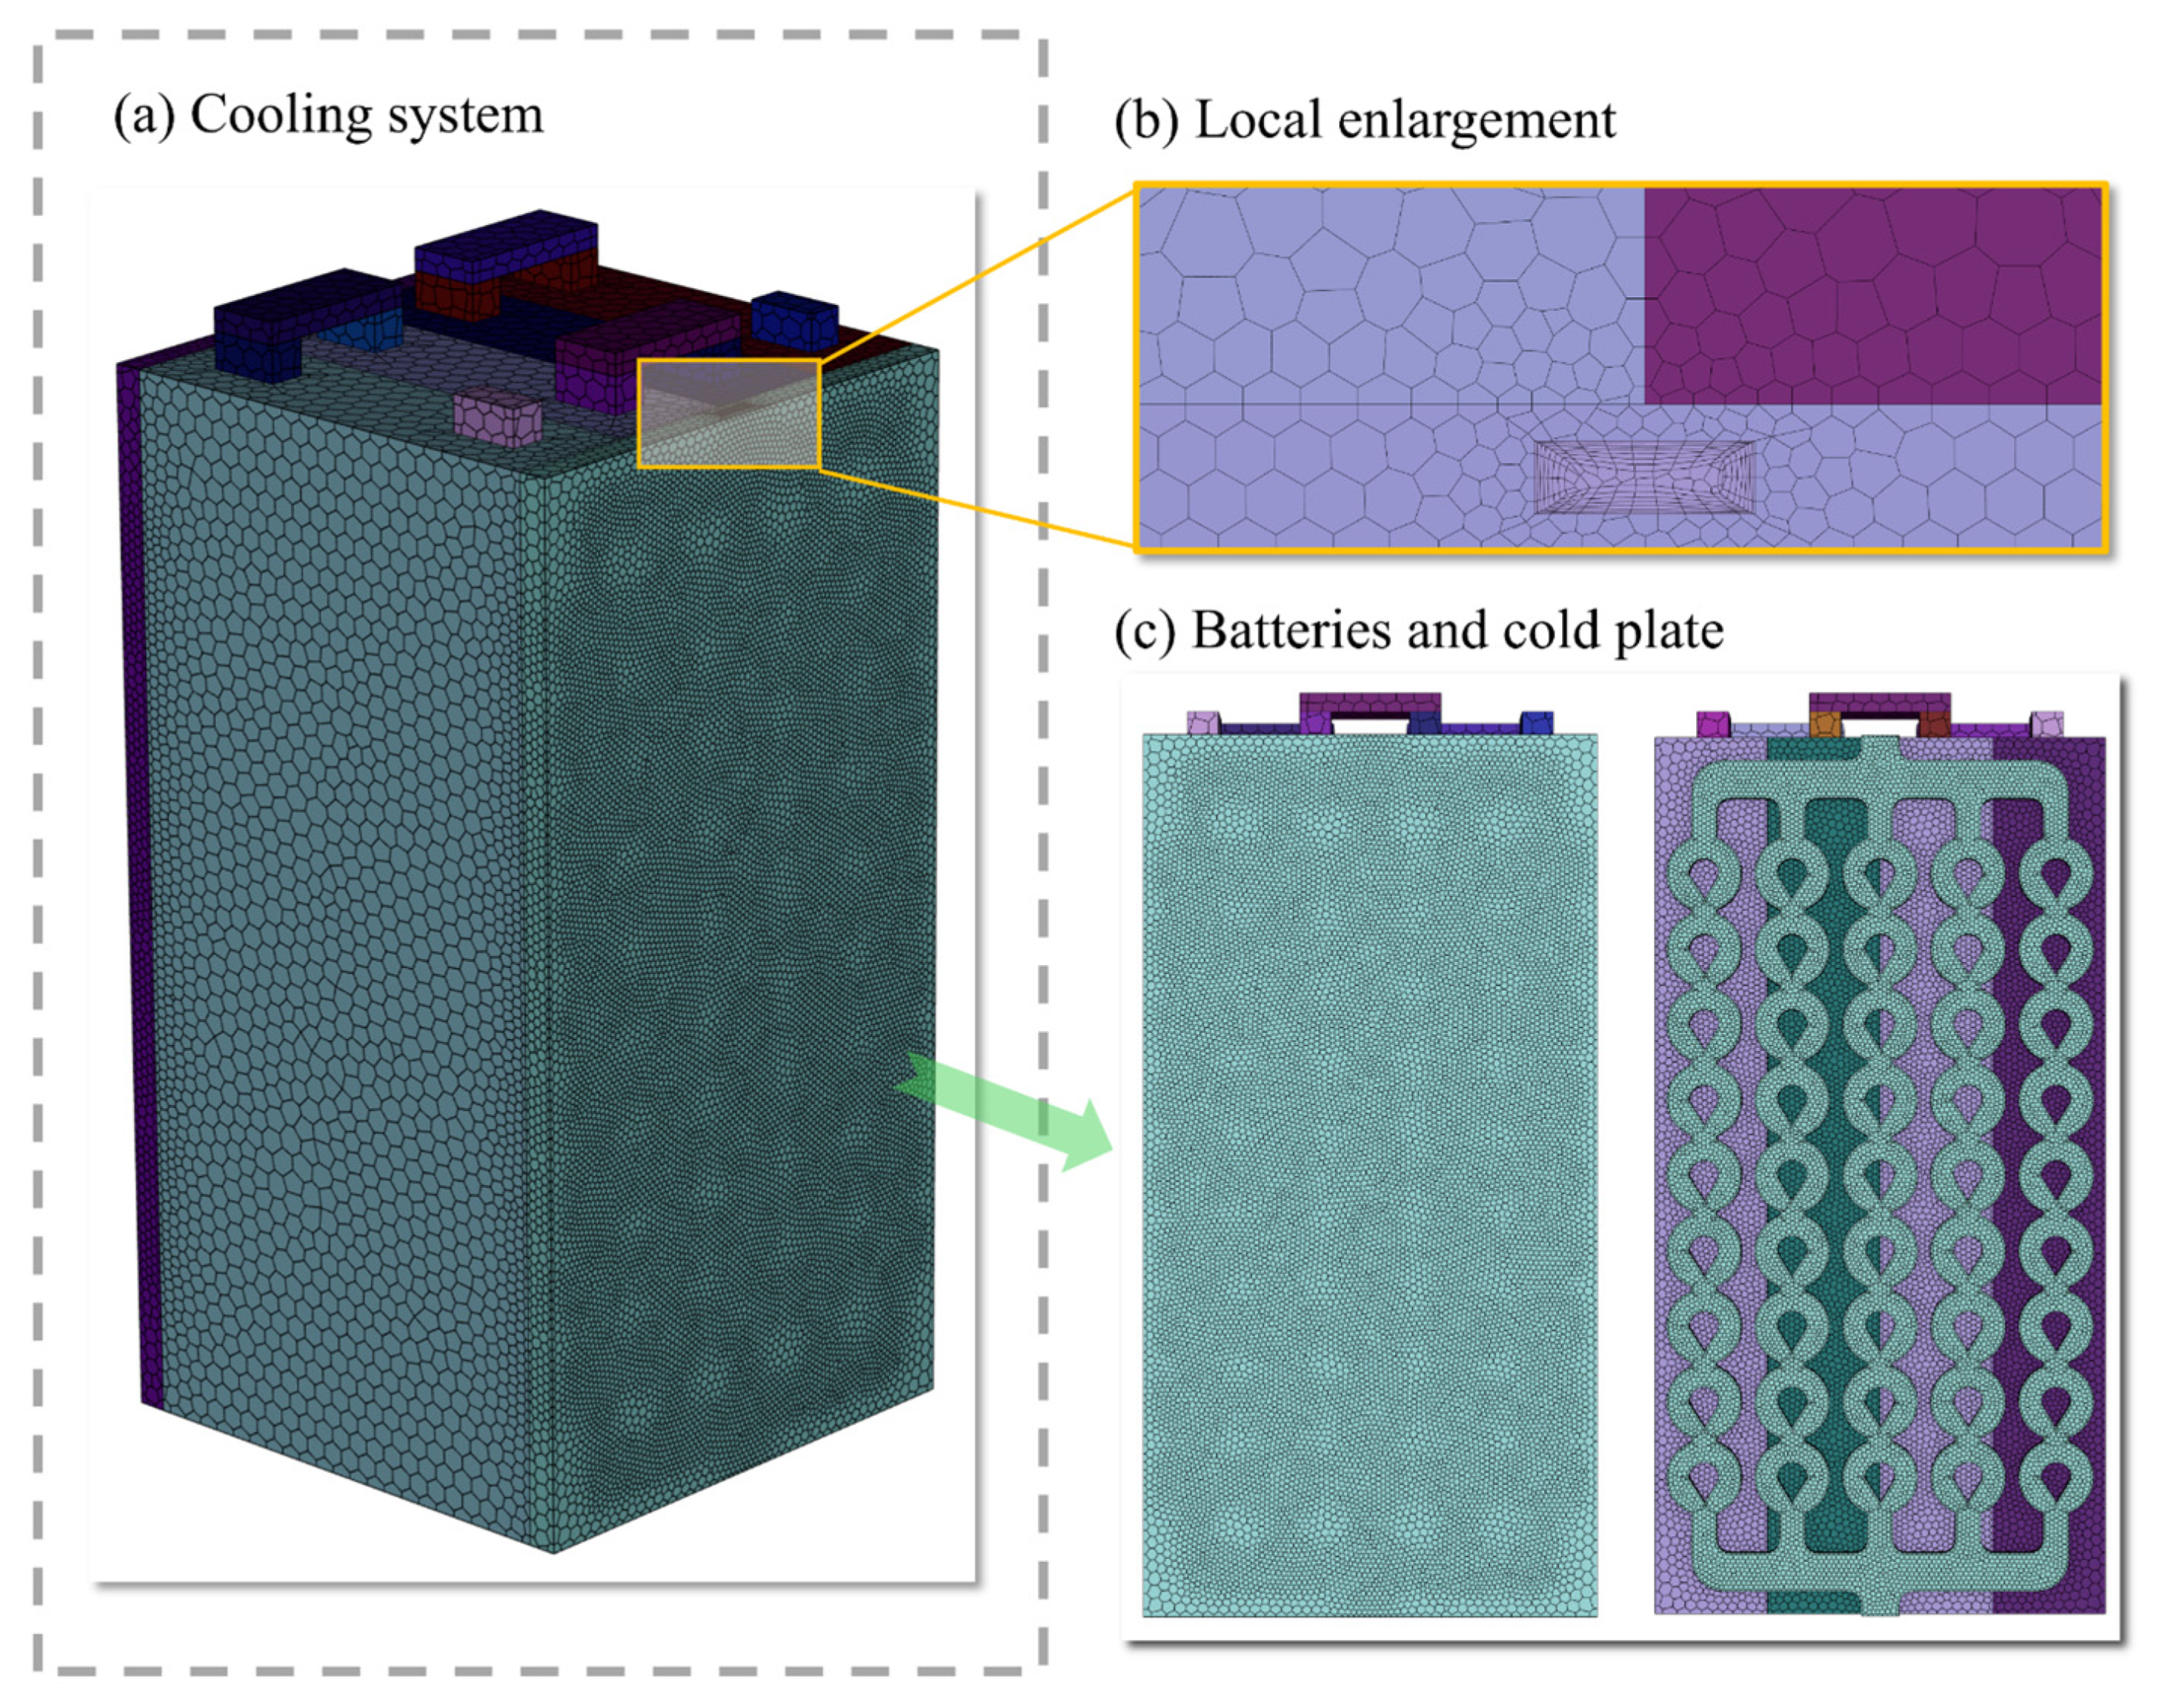
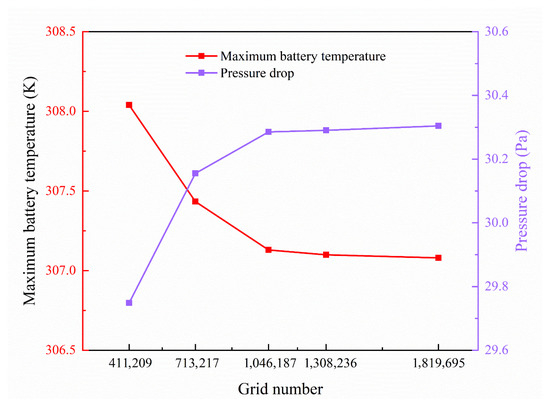
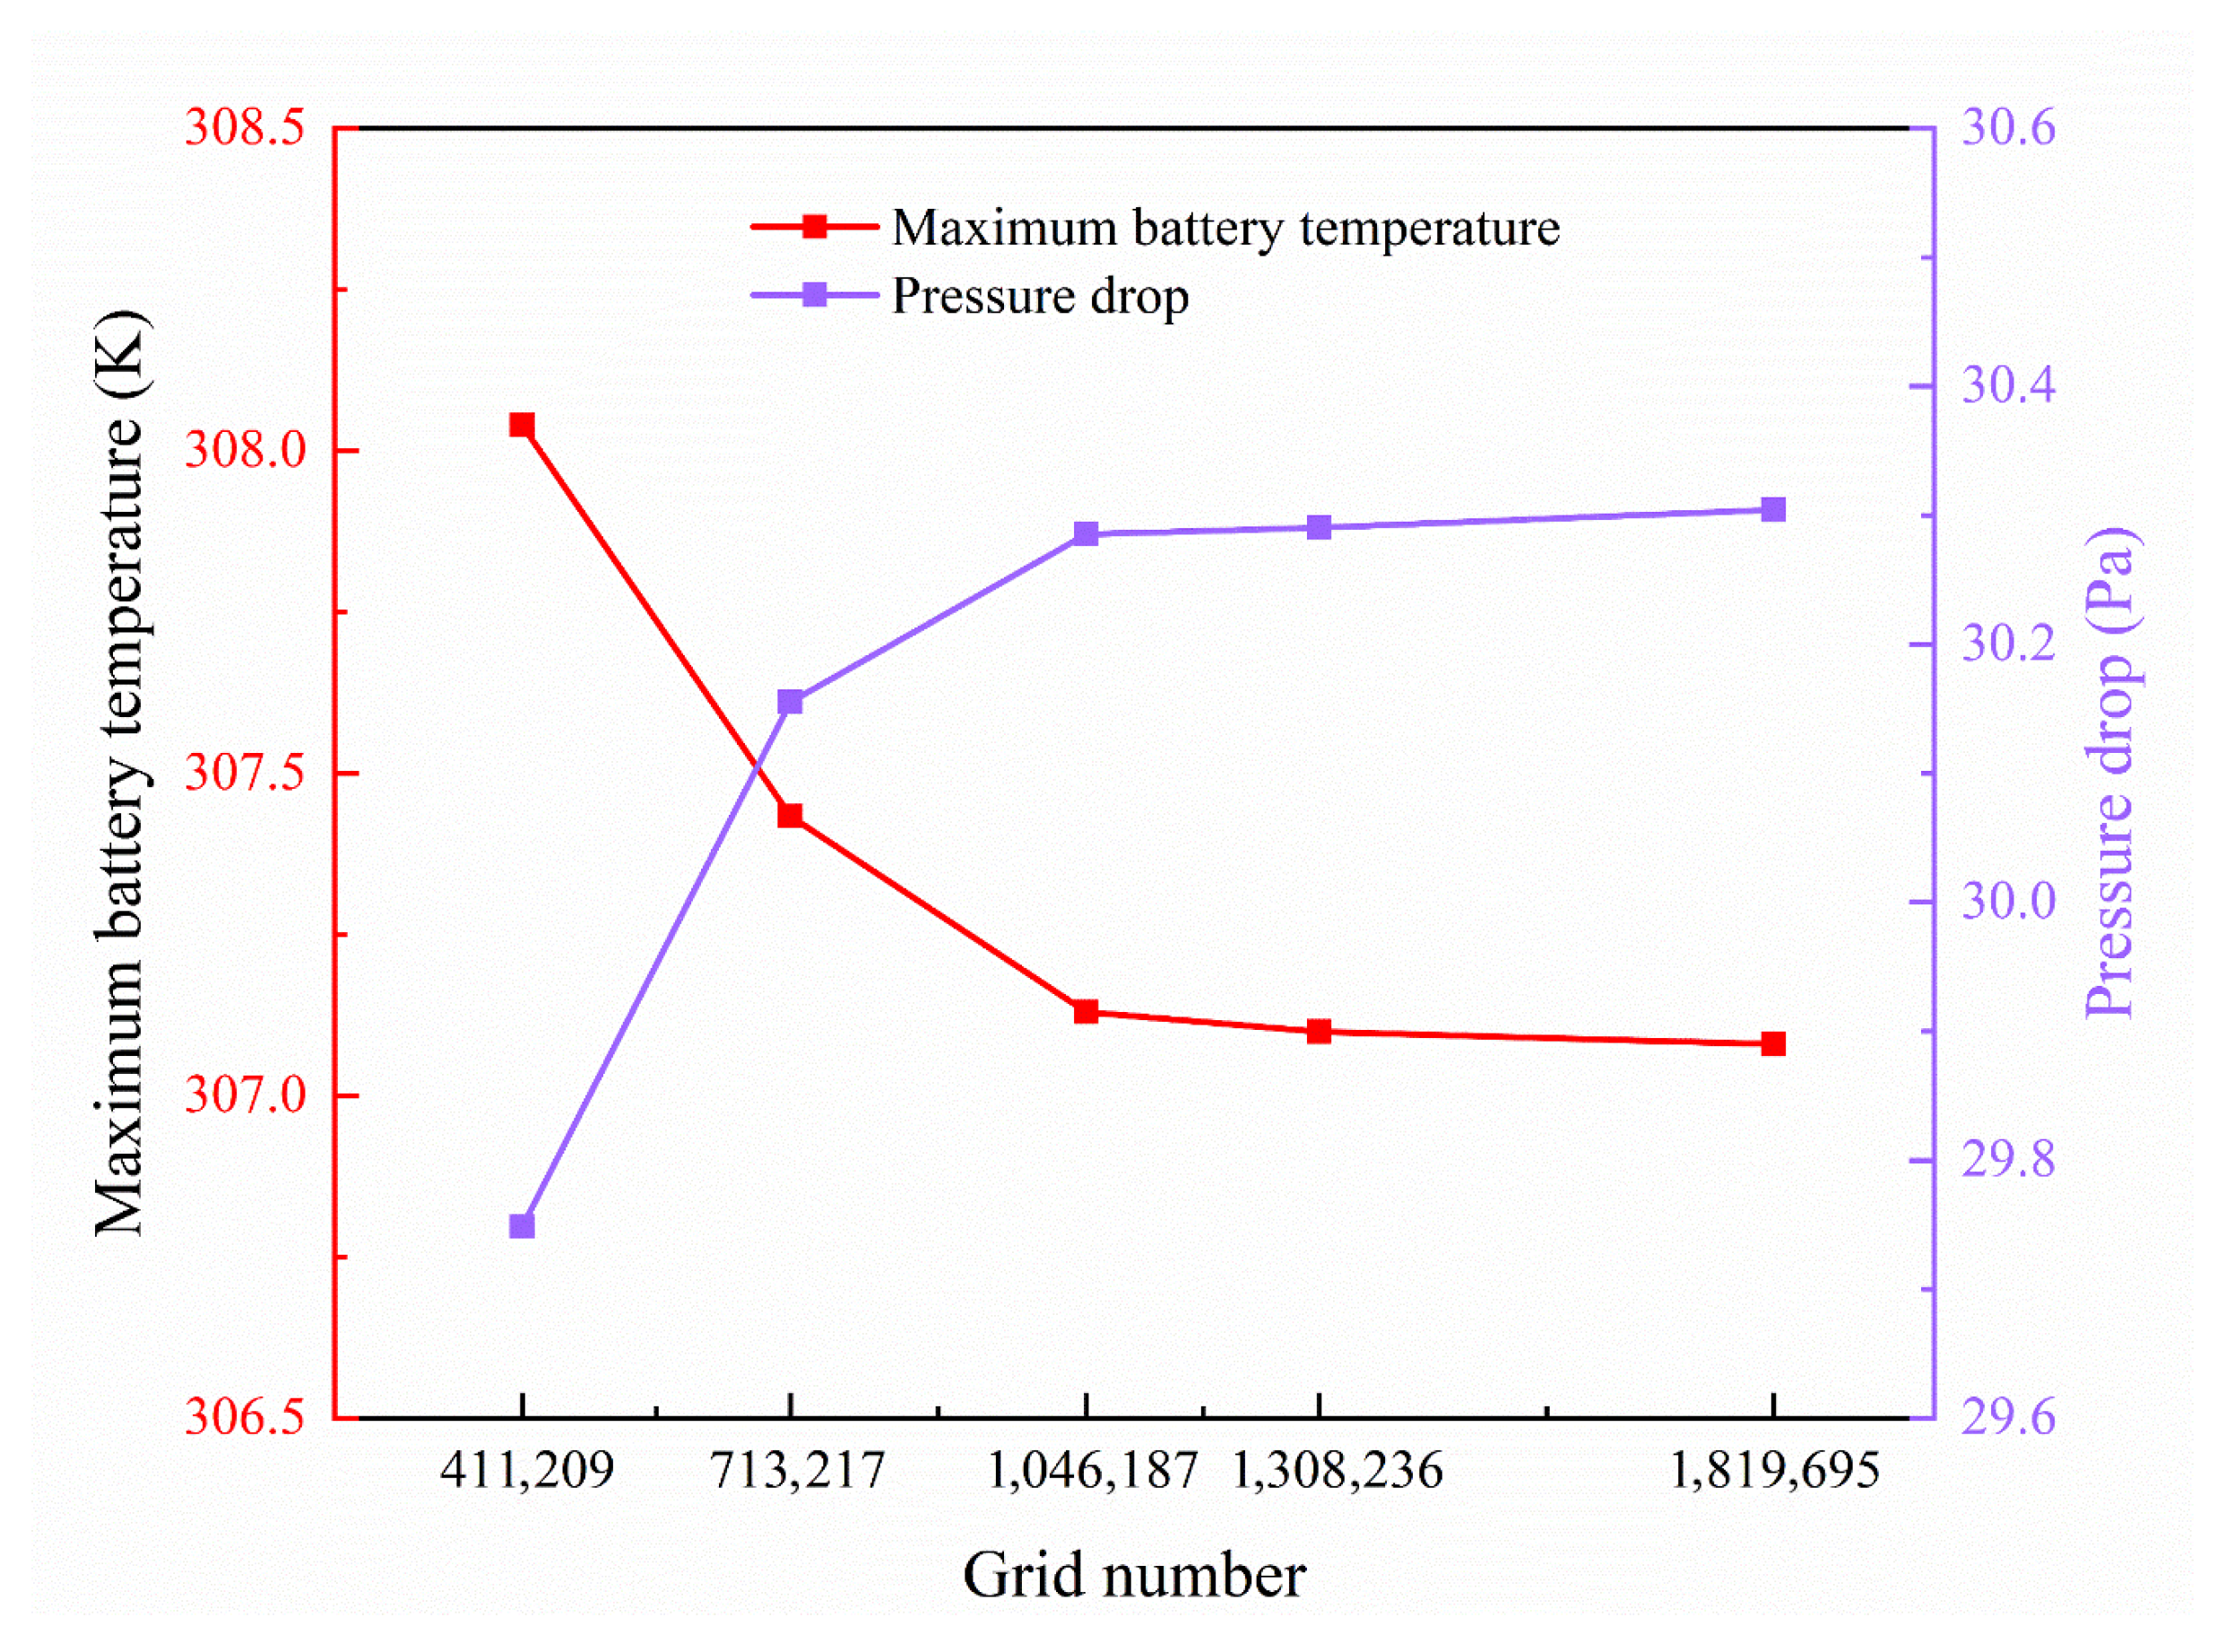
Research on mesh independence is illustrated in Figure 3 and Figure 4. When the grid number increased from 1,046,187 to 1,819,695, the maximum temperature difference only amounted to 1.9%, and the pressure drop difference reached only 0.31%. So, the optimal mesh size of 1,046,187 was identified as the best value, delivering accurate results while maintaining a relatively short computational runtime.
Figure 3.
Grid generation.
Figure 4.
Verification of grid independence.
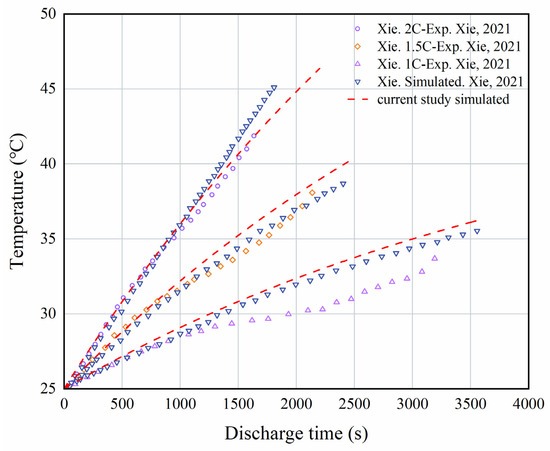
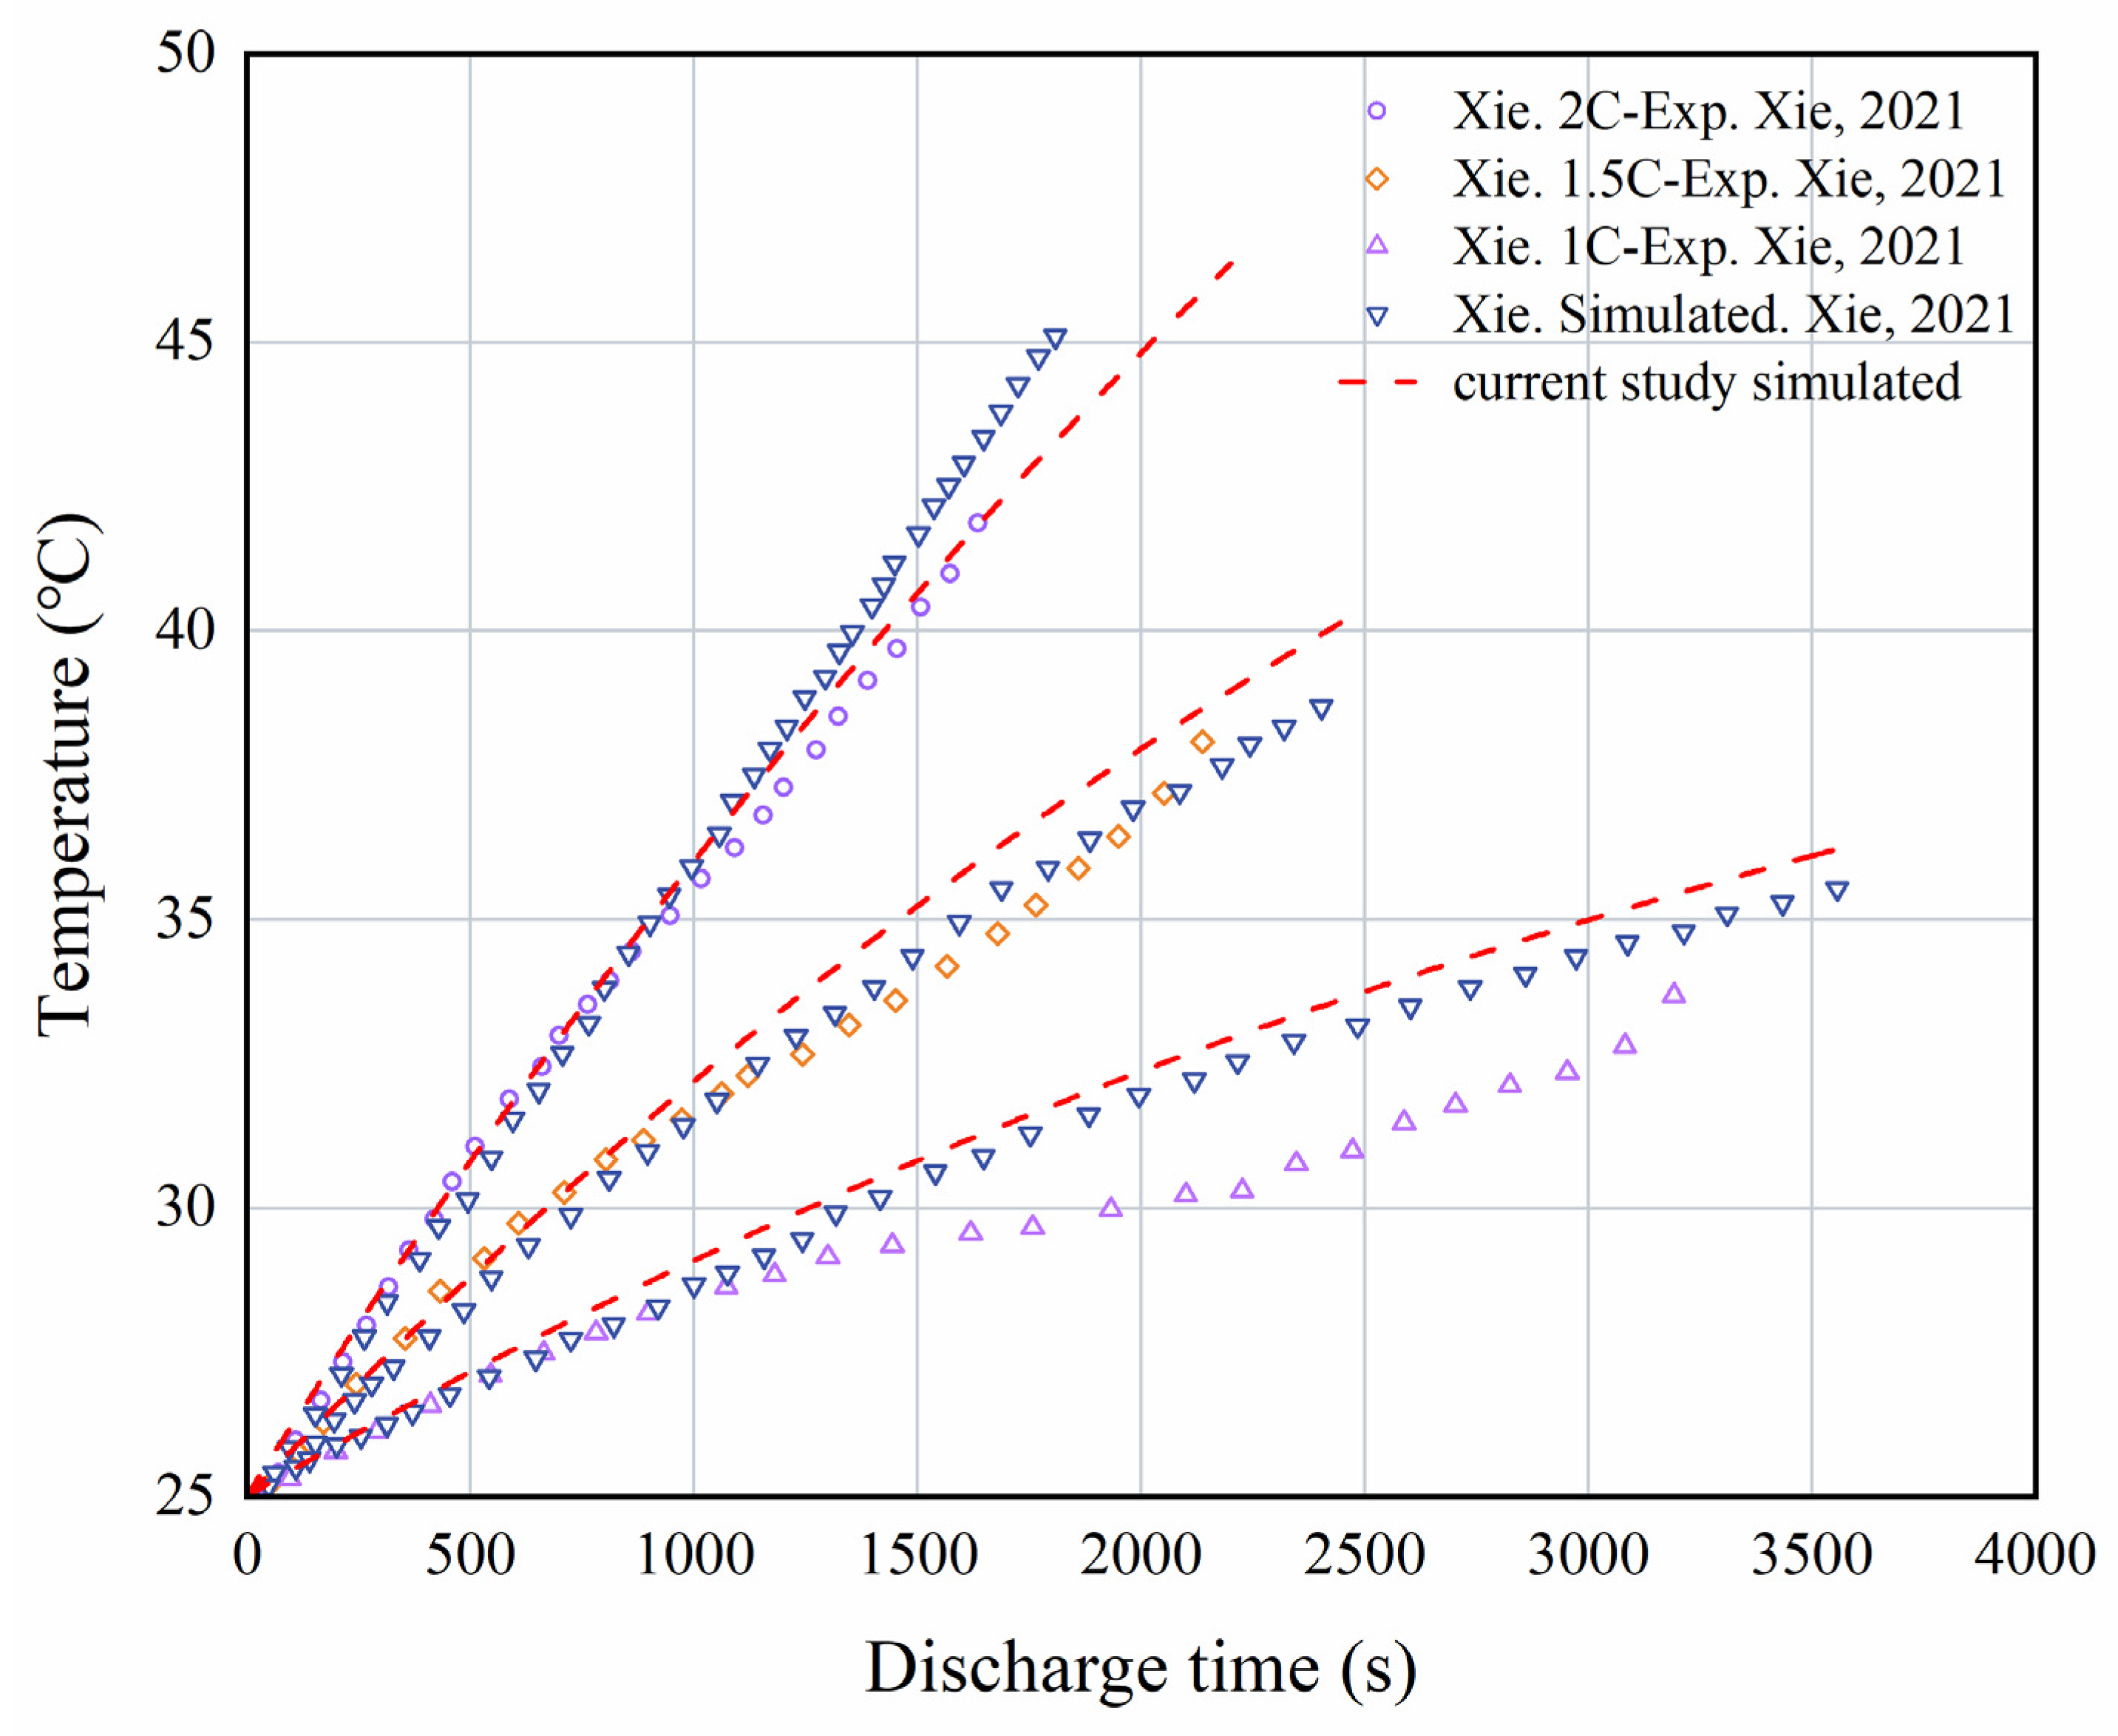
Figure 5 presents a fundamental validation and comparison between the square battery developed in this work and literature data [48], verifying the temporal variation in the battery’s maximum temperature. As illustrated, the experimental and simulated data exhibit substantial consistency, with identical developmental trends. The maximum relative error is limited to 5.4%. Therefore, the numerical model proposed in this study is reliable and applicable to subsequent numerical simulation investigations.
Figure 5.
Comparison of current research data with literature data for individual square cells [48].
4. Analyses of Factors Influencing Heat Transfer
4.1. Channel Types
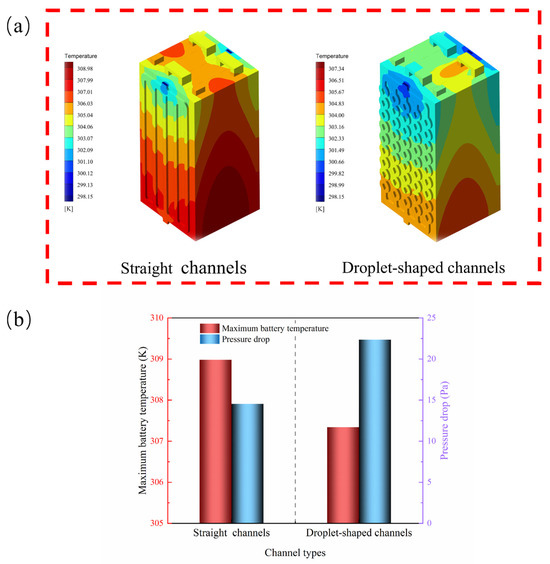
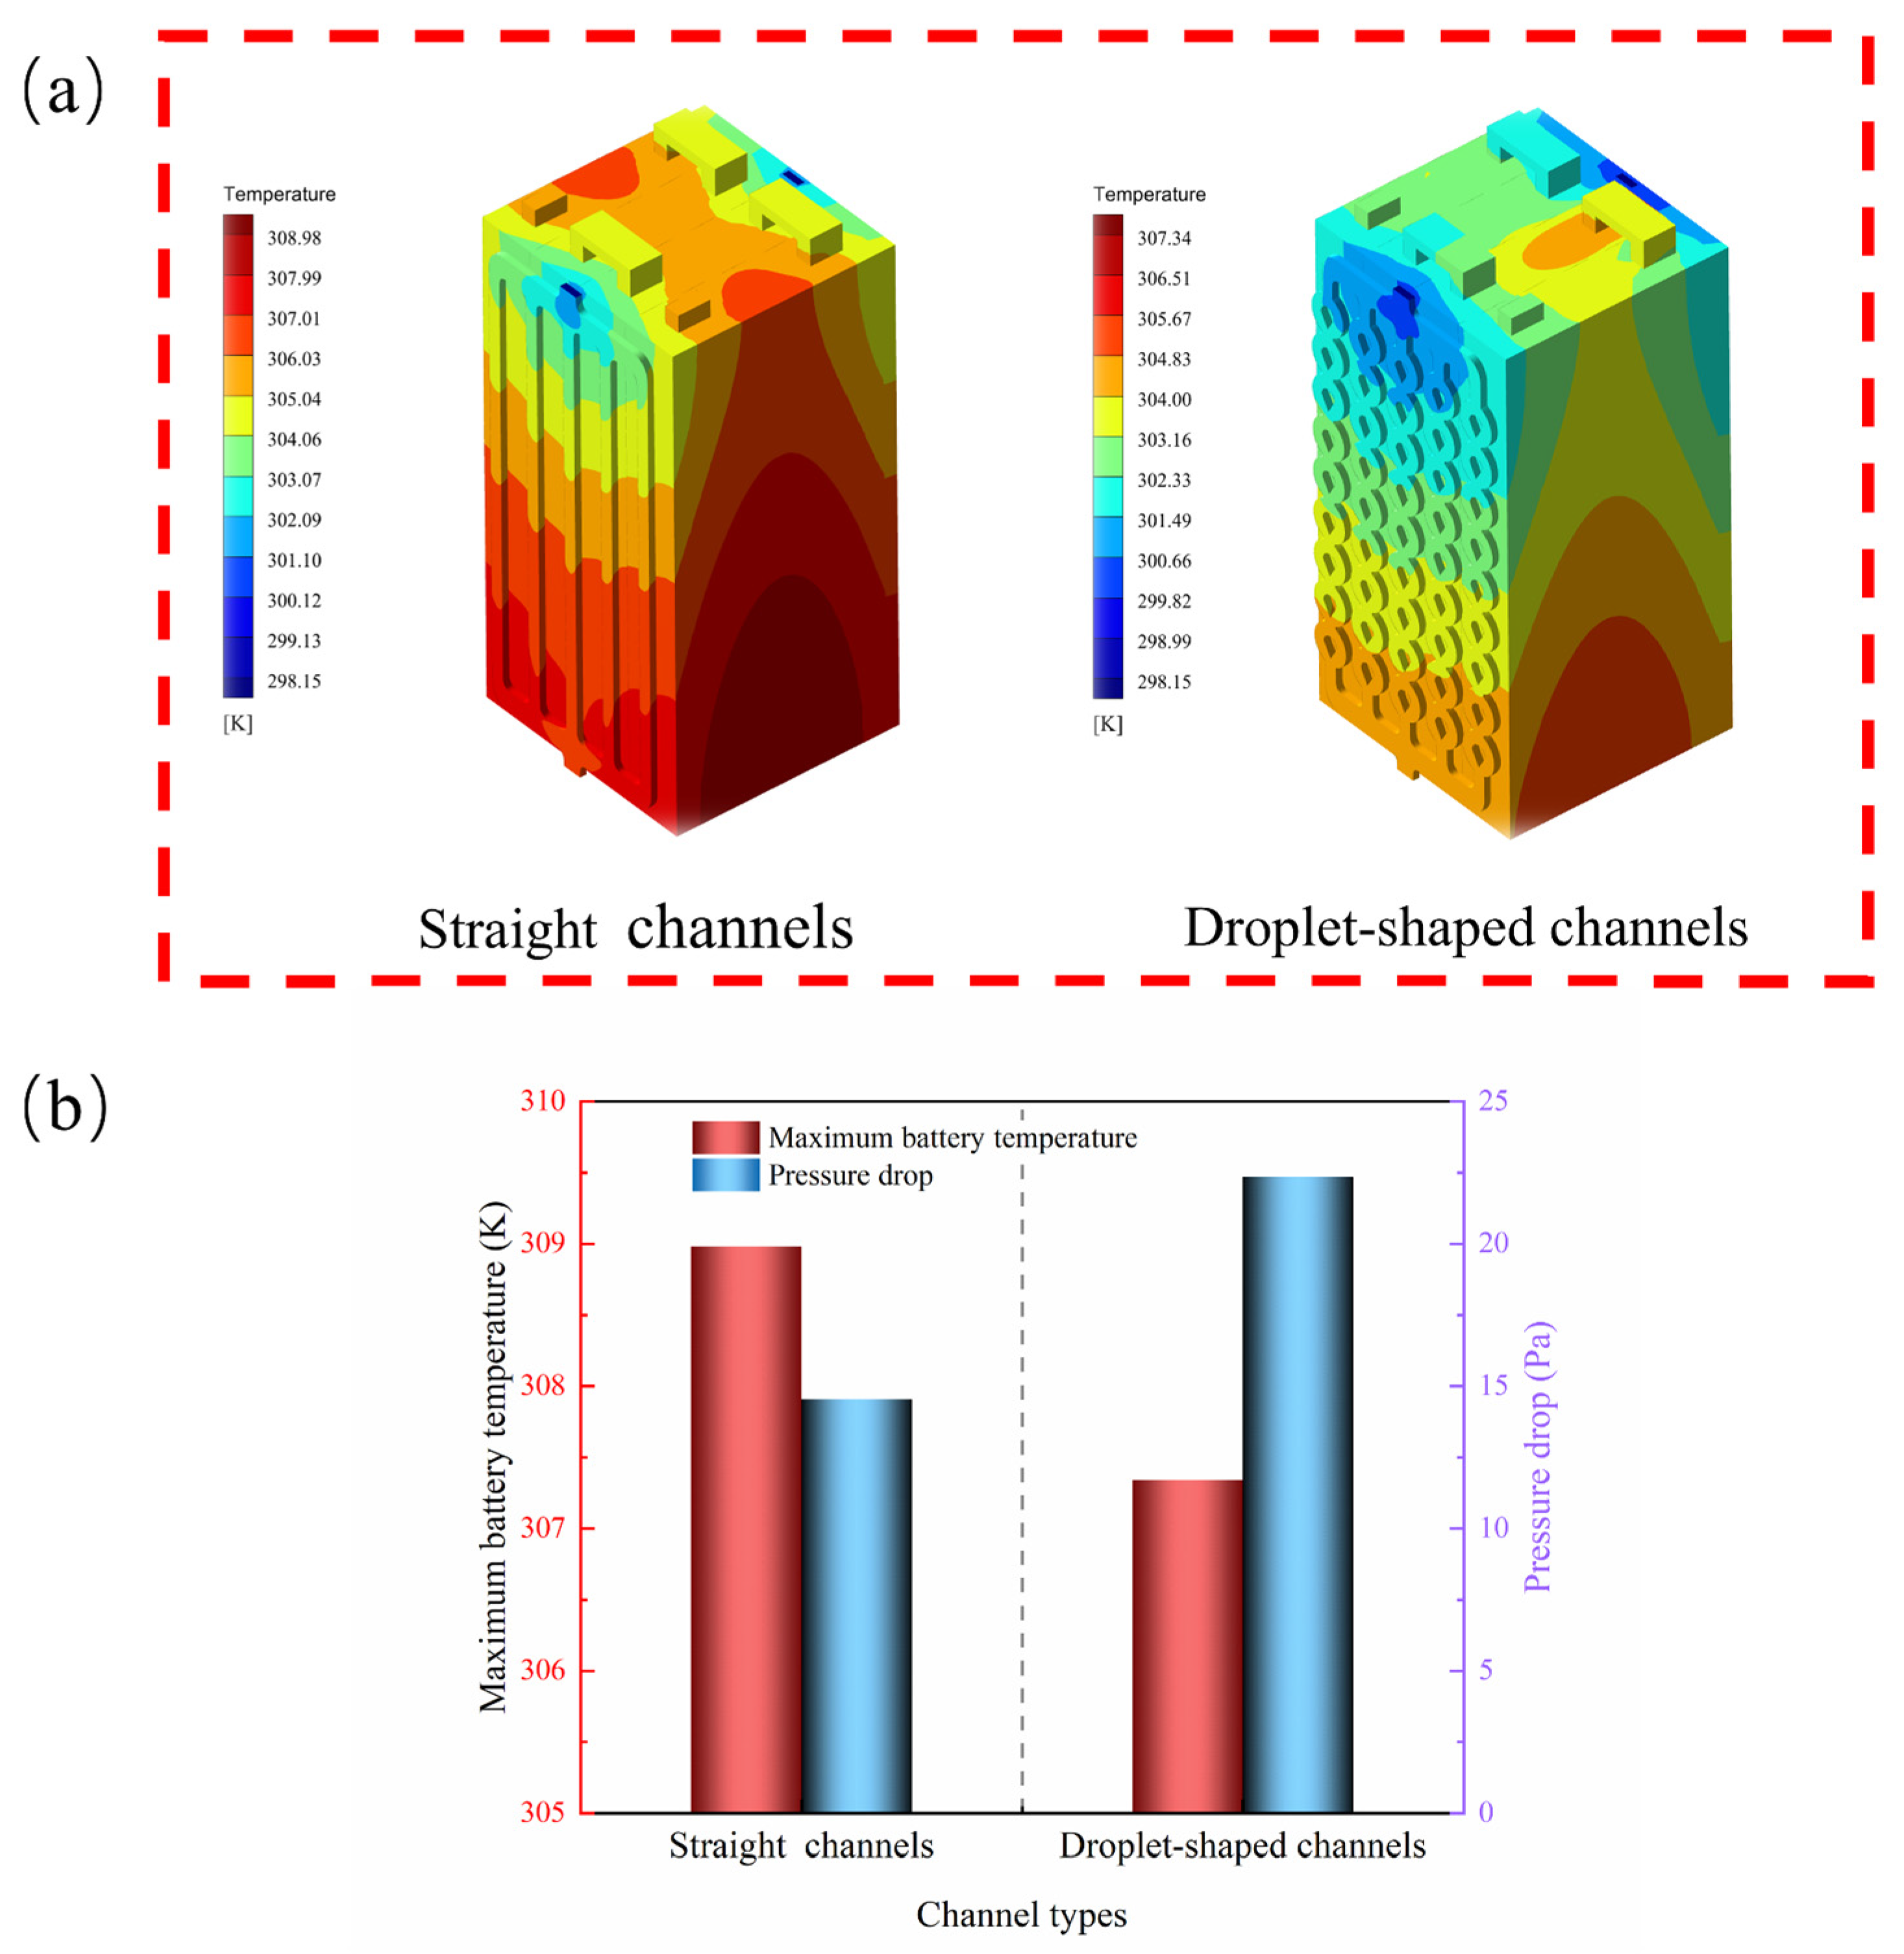
This section presents a comparative analysis of straight channels and a modified droplet-shaped turbulator channel under 3C discharge conditions. Figure 6 illustrates the temperature distribution of the battery cold plate using pure water as coolant at the condition of an inlet velocity of 0.1 m/s and an inlet temperature of 298.15 K. The maximum temperature was 307.34 K in the droplet-shaped turbulator channel and 308.98 K in the straight channel. The droplet-shaped channel thus exhibited a 1.64 K lower maximum temperature than the straight channel, indicating superior cooling efficacy. Confined to a stringent optimal operating range of 293.15–313.15 K, even a slight thermal elevation accelerates the degradation of battery materials and shortens cycle life by 1–2% for every 1 K rise. This 1.64 K temperature reduction thus effectively mitigates battery thermal aging, widens the thermal safety margin, and demonstrates the superior cooling performance of the droplet-shaped turbulator channel. This improved performance is primarily due to increased boundary layer disruption as the fluid flows through the turbulent channel. The turbulator design also increases the heat-transfer surface area. Consequently, the drop-shaped turbulator provides significantly better heat-transfer performance than the straight channel. Under identical inlet conditions, the pressure drop across the straight channel was 7.9 Pa lower than that across the turbulator. However, given the primary objective of enhancing heat transfer, this pressure drop penalty is acceptable. Thus, the droplet-shaped turbulator channel was selected for further investigation. Figure 6 also reveals that the temperature is lower in the initial flow region and increases gradually along the flow path toward the bottom of the cell assembly. This gradient arises because the fluid is heated along the flow direction, reducing its temperature differential with the battery and thus its heat-dissipation capacity. As a result, the upper regions remain cooler while the lower regions become hotter. Hence, achieving a more uniform temperature distribution across the cell assembly is worthy of further research.
Figure 6.
(a) Cold-plate temperature maps of different channels; (b) heat-transfer performance comparison among different types of cold plates.
4.2. Nanoparticle Types
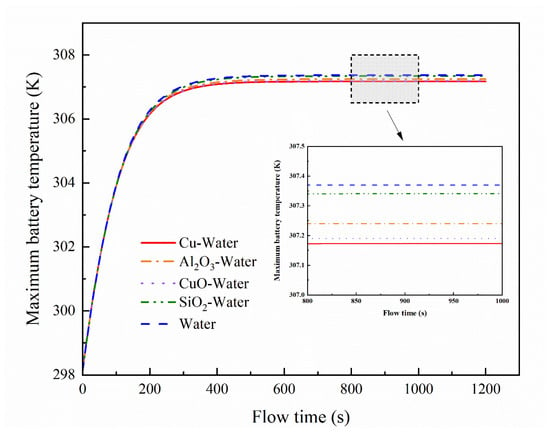
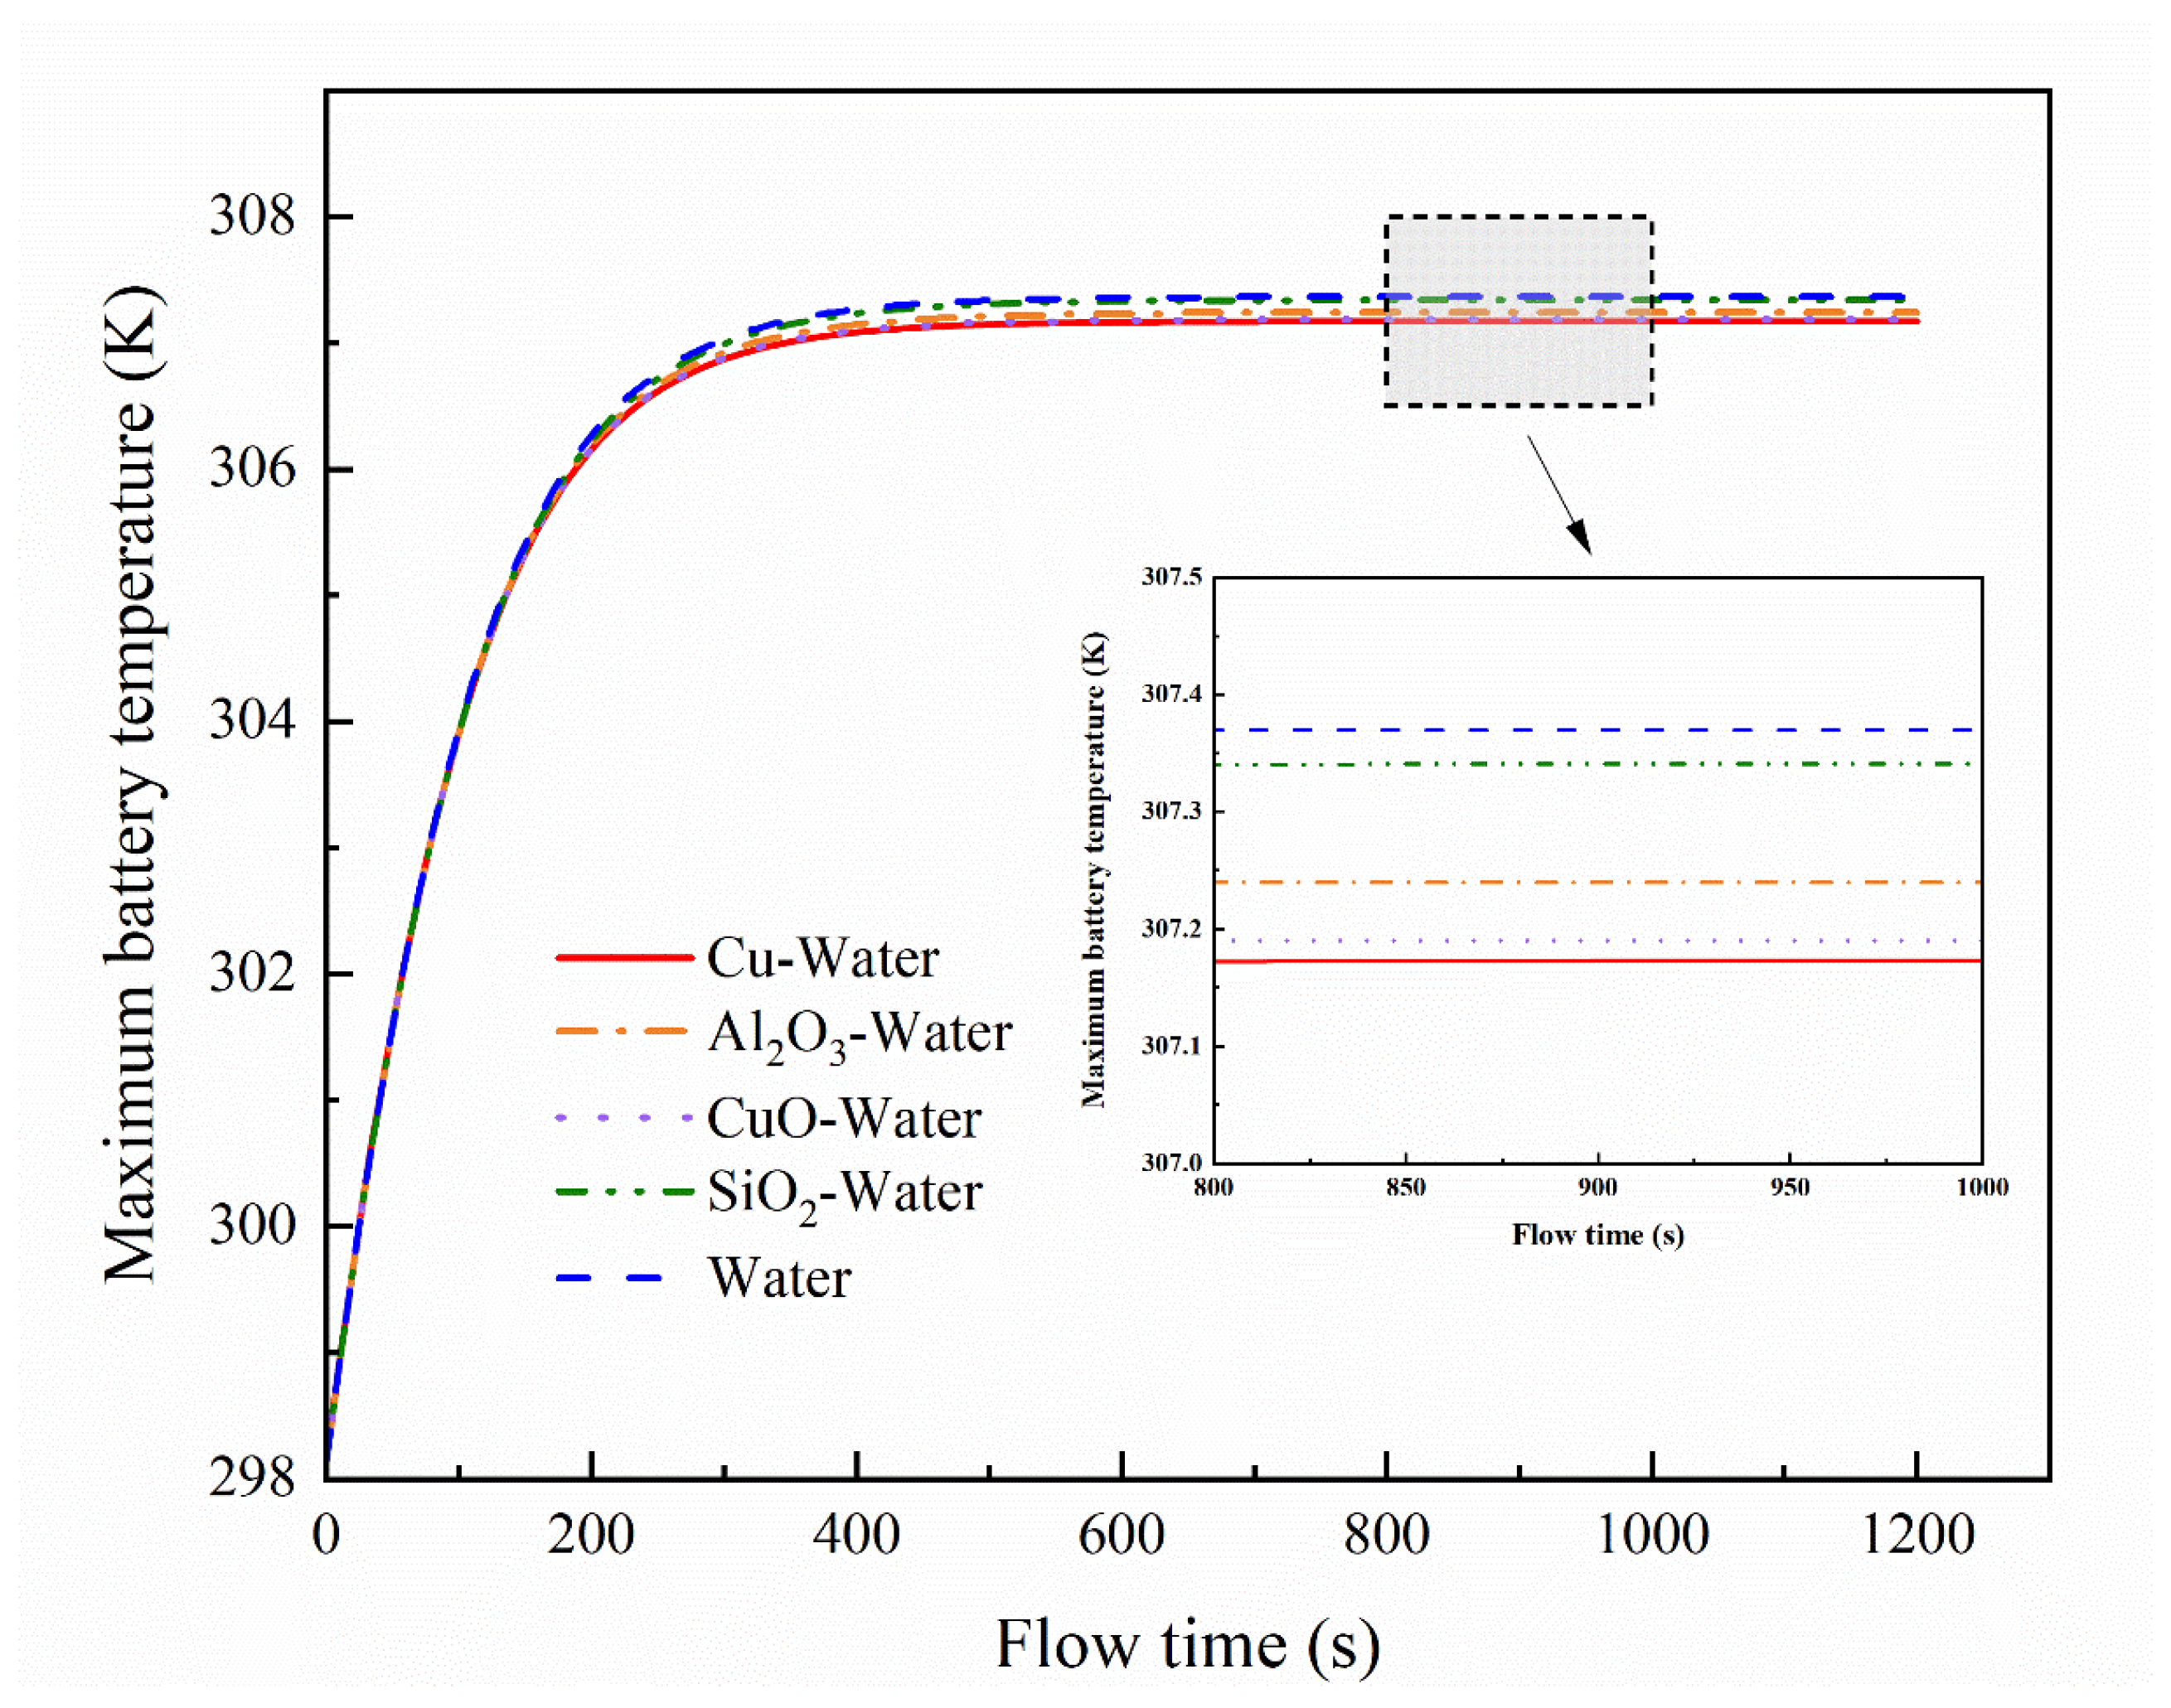
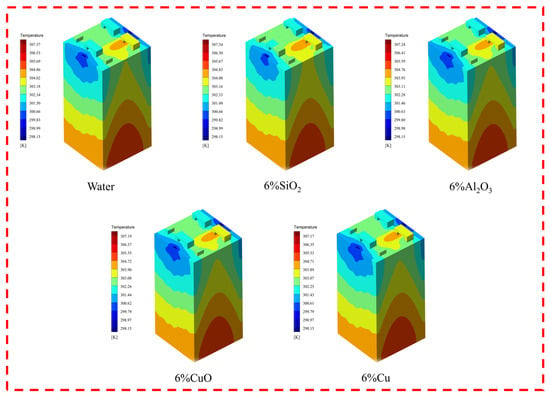
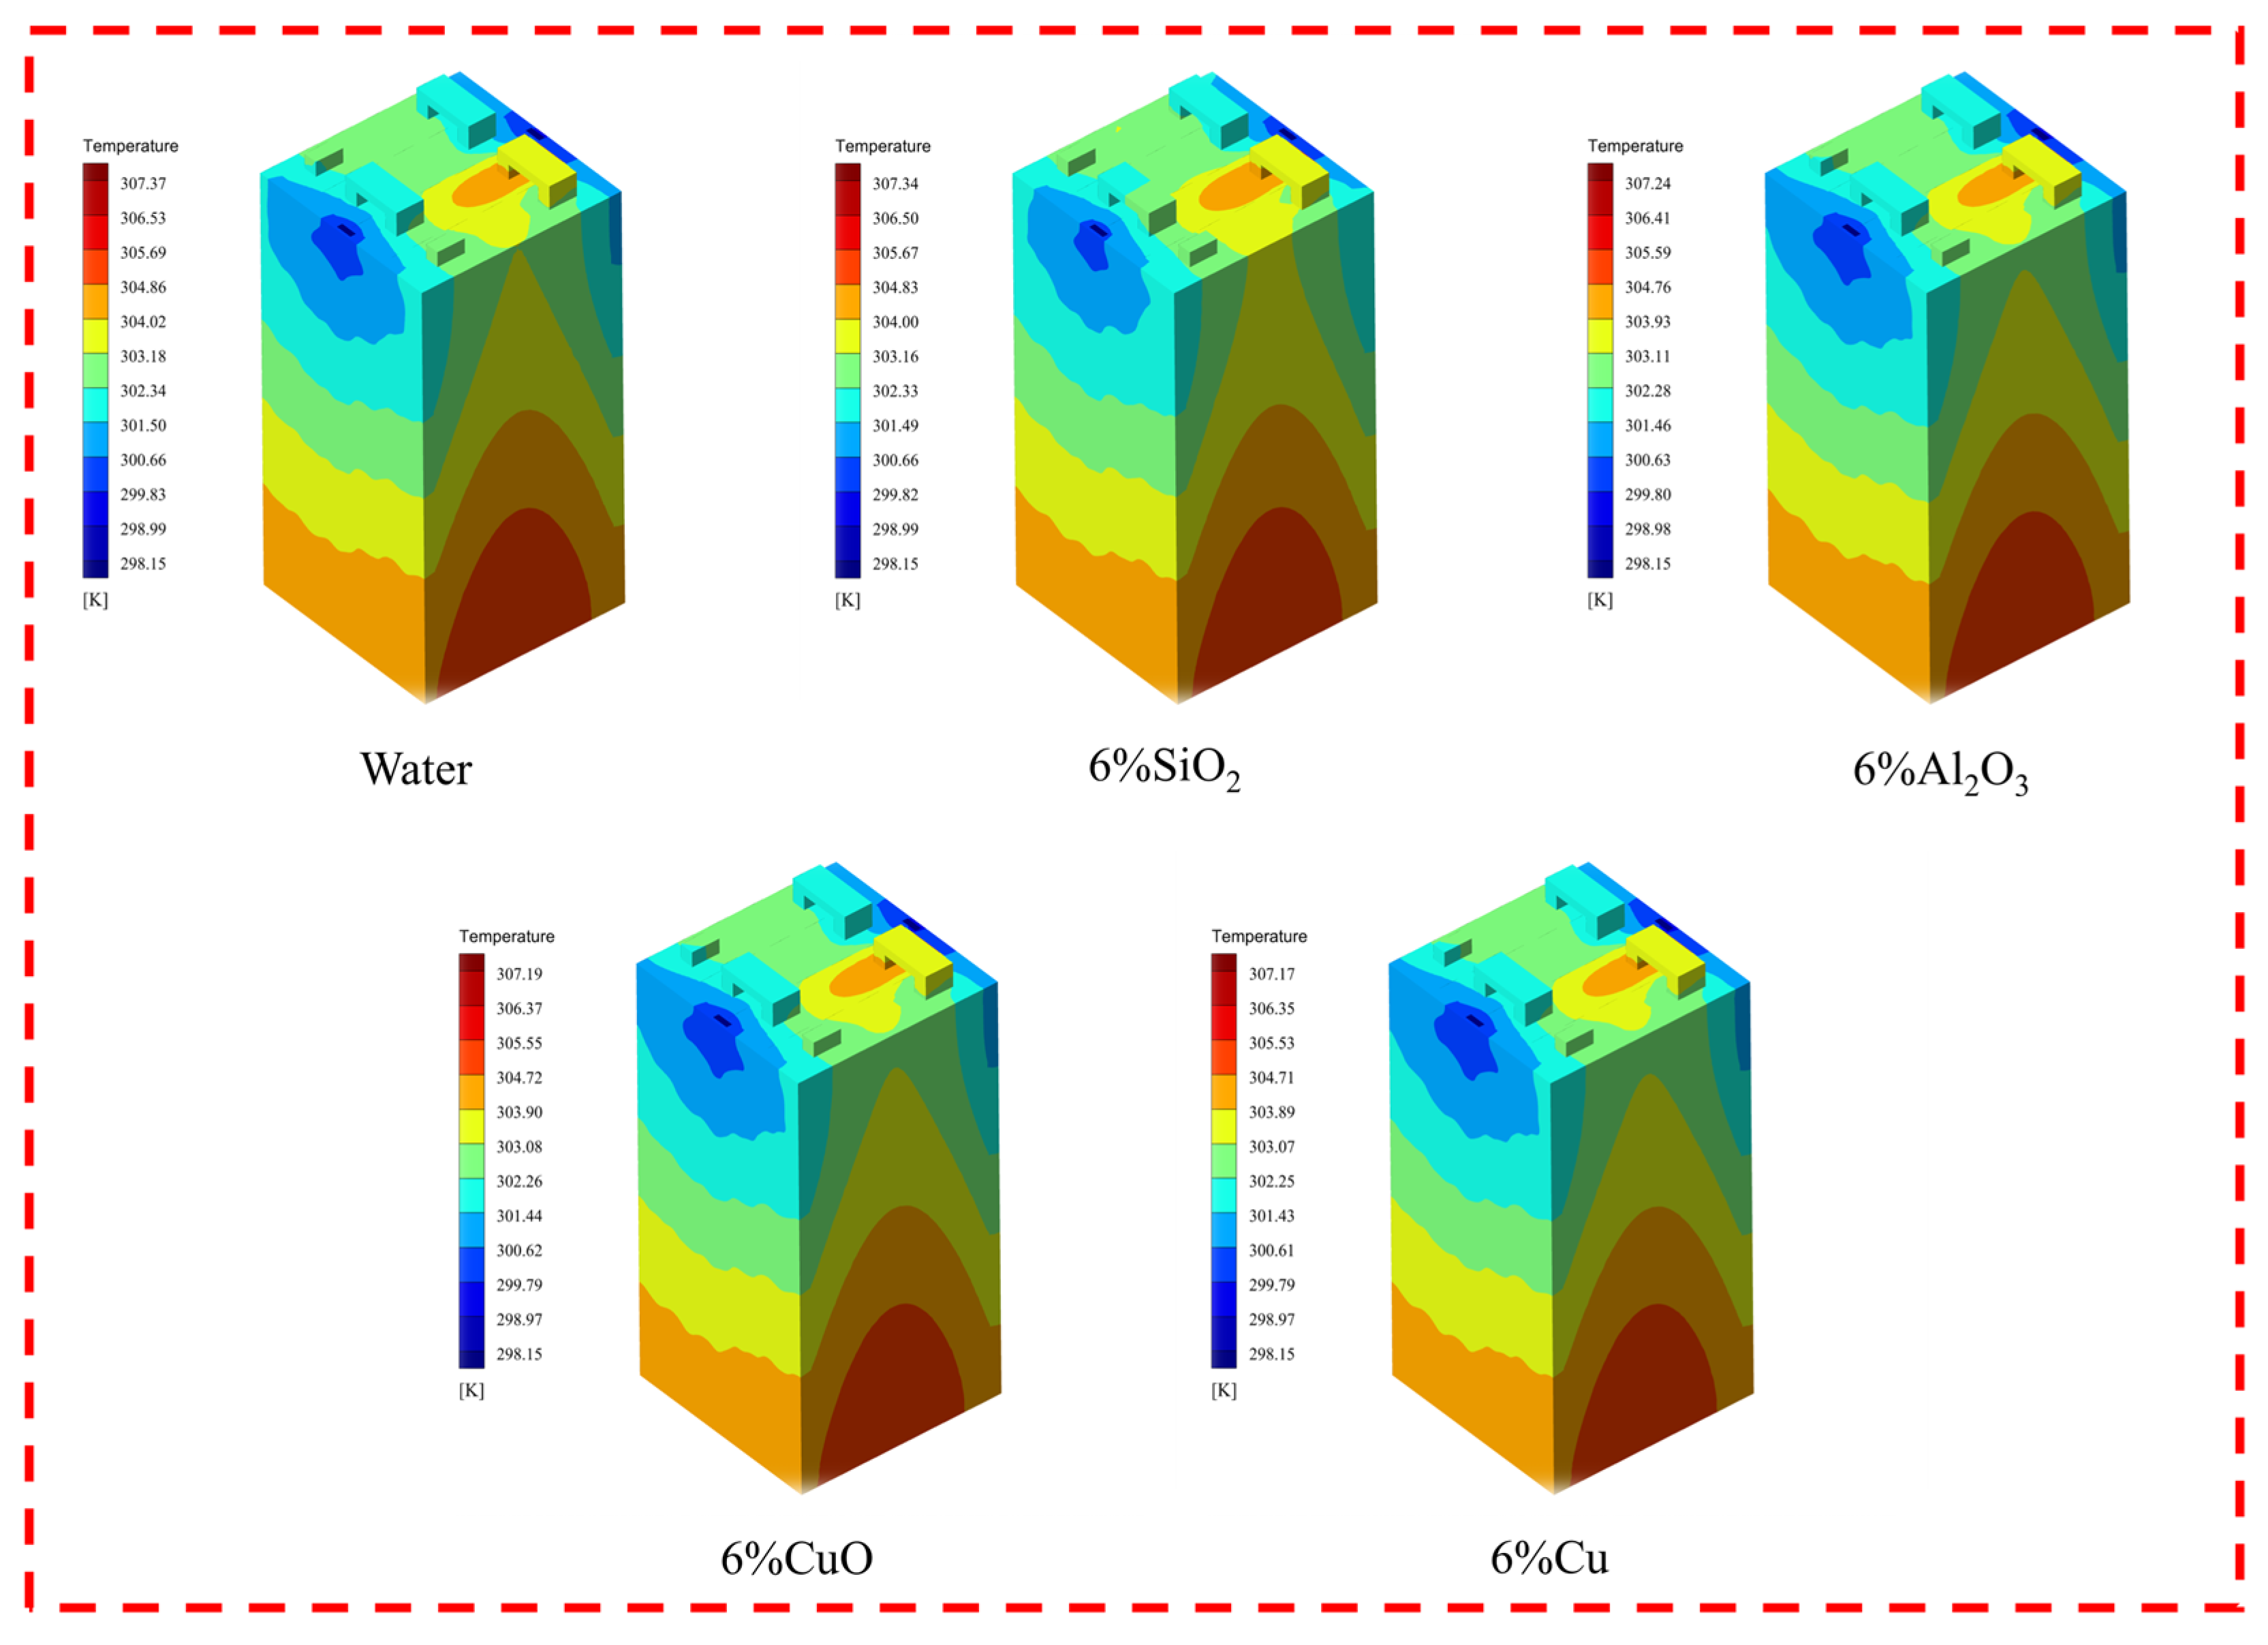
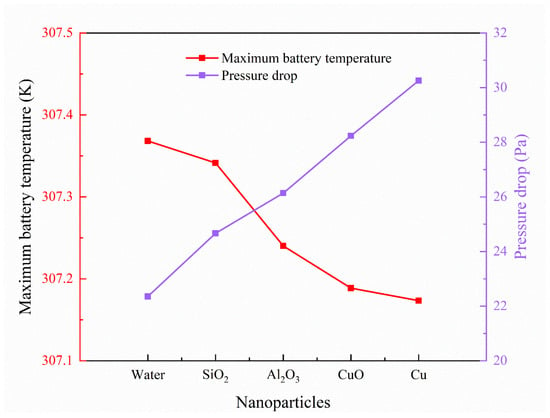
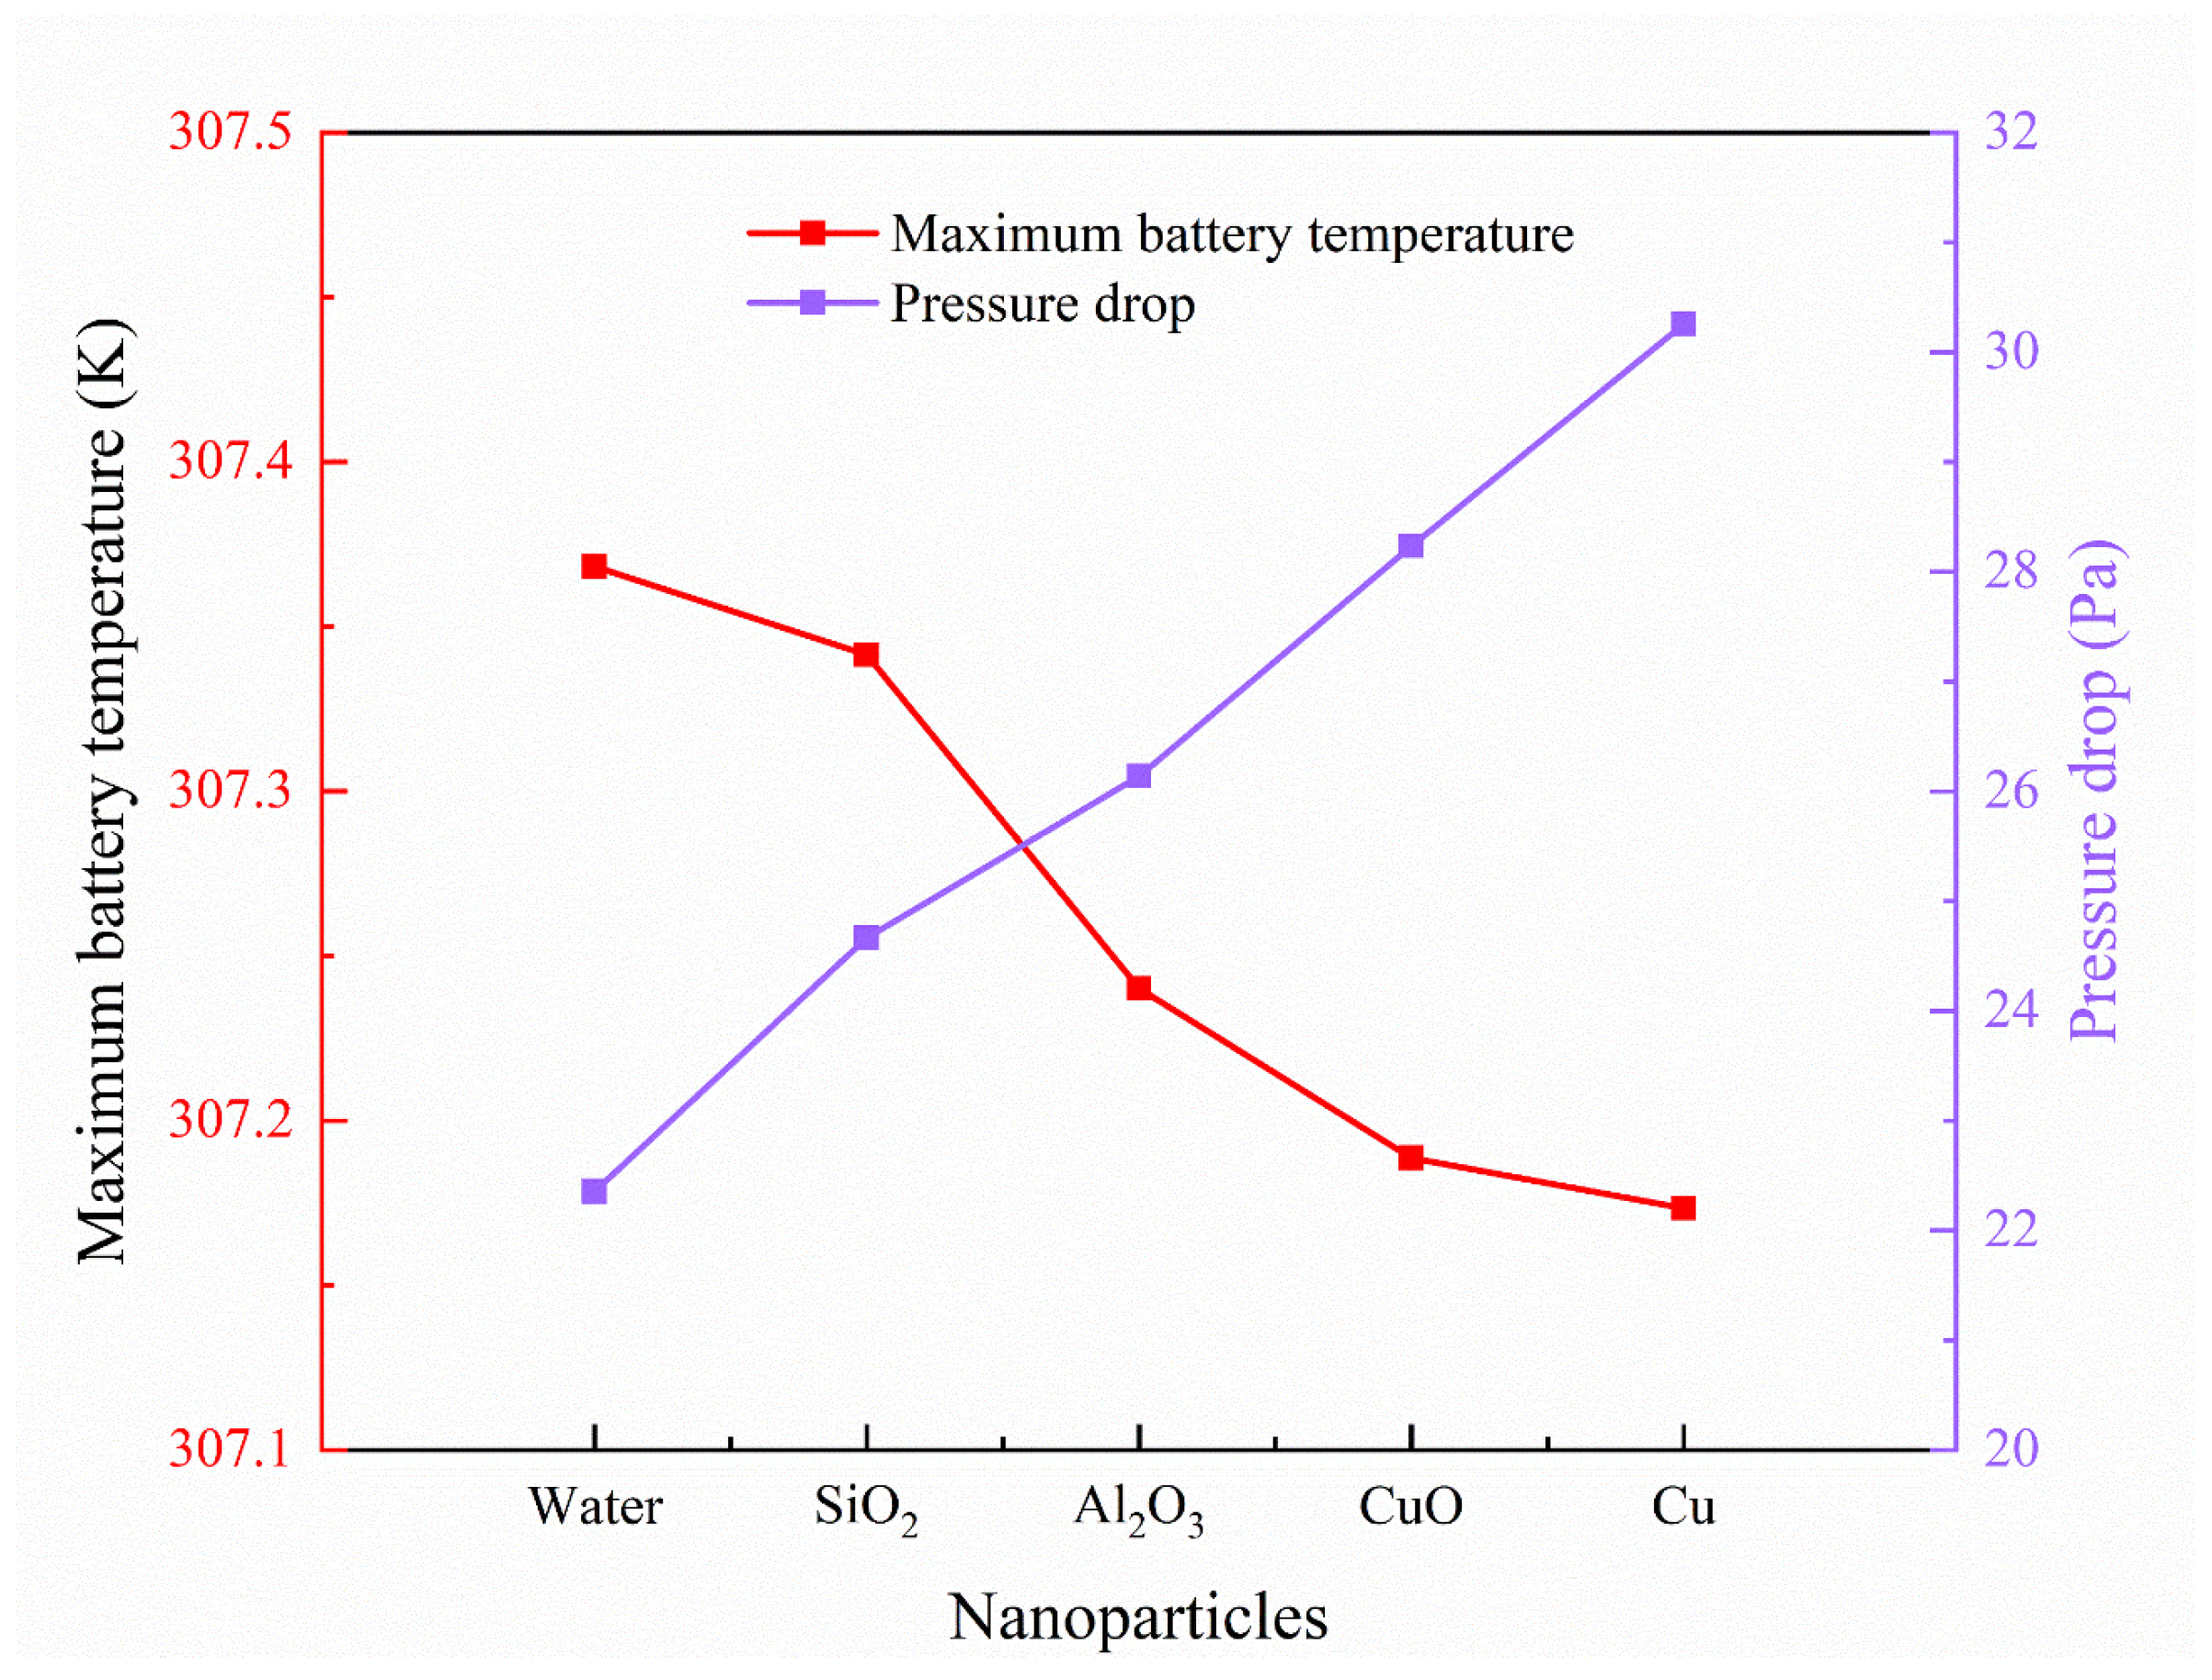
This section employs drop-shaped turbulent channels for analysis. By comparing the thermal performance of various nanofluids to identify the optimal coolant for the BTMS. The coolants analyzed include pure water and several nanofluids containing SiO2, Al2O3, CuO, or Cu nanoparticles, respectively. The coolants under investigation consist of pure water and nanofluids containing SiO2, Al2O3, CuO, or Cu nanoparticles. Simulations were performed for each nanofluid, all having a nanoparticle volume concentration of 6%, under conditions of 0.1 m/s inlet velocity, 3 C discharge rate, and 298.15 K inlet temperature. Figure 7 displays the peak battery temperatures attained using various nanofluids. Among all coolants, the battery employing the 6% Cu nanofluid yielded the lowest maximum temperature, specifically 0.19 K below that observed with pure water. Figure 8 illustrates the contour plots of temperature distribution for batteries subjected to cooling by the distinct nanofluids. The battery utilizing the 6% Cu nanofluid demonstrates both the minimal peak temperature and the broadest region of low temperatures. Across all simulated cases, a consistent observation is that the lower half of the battery experiences elevated temperatures relative to the upper half. From most effective to least, the cooling performance order is: 6% Cu, 6% CuO, 6% Al2O3, 6% SiO2, followed by pure water. This sequence corresponds directly to the nanoparticles’ thermal conductivities, wherein copper exhibits the greatest value, thereby delivering superior cooling. A nanofluid’s cooling efficacy is strongly and positively linked to the thermal conductivity of the nanoparticles it contains. Nevertheless, Figure 9 indicates that the 6% Cu nanofluid also produces the greatest pressure drop. This elevated pressure loss arises from the substantial density of copper nanoparticles, necessitating additional pumping energy. However, the increase in pressure drop for the 6% Cu nanofluid compared to pure water amounts to only 7.9 Pa, which is a comparatively small drawback. Consequently, the Cu–water nanofluid was chosen for subsequent analysis.
Figure 7.
Distribution of the maximum temperature of the battery module as a function of flow time with different nanofluids.
Figure 8.
Cold-plate temperature maps of different nanofluids.
Figure 9.
Heat-transfer characteristics of the battery cold plate with different nanofluids.
4.3. Volume Fraction of Cu in Nanofluid
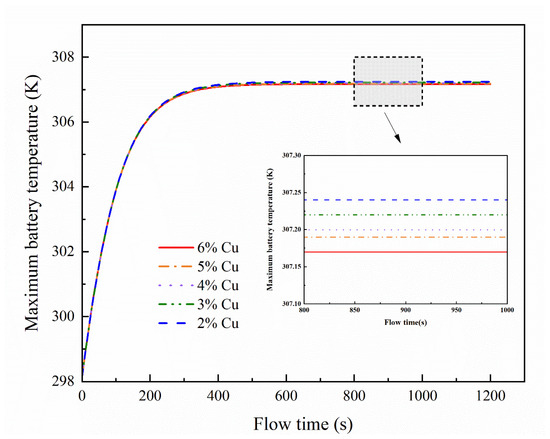
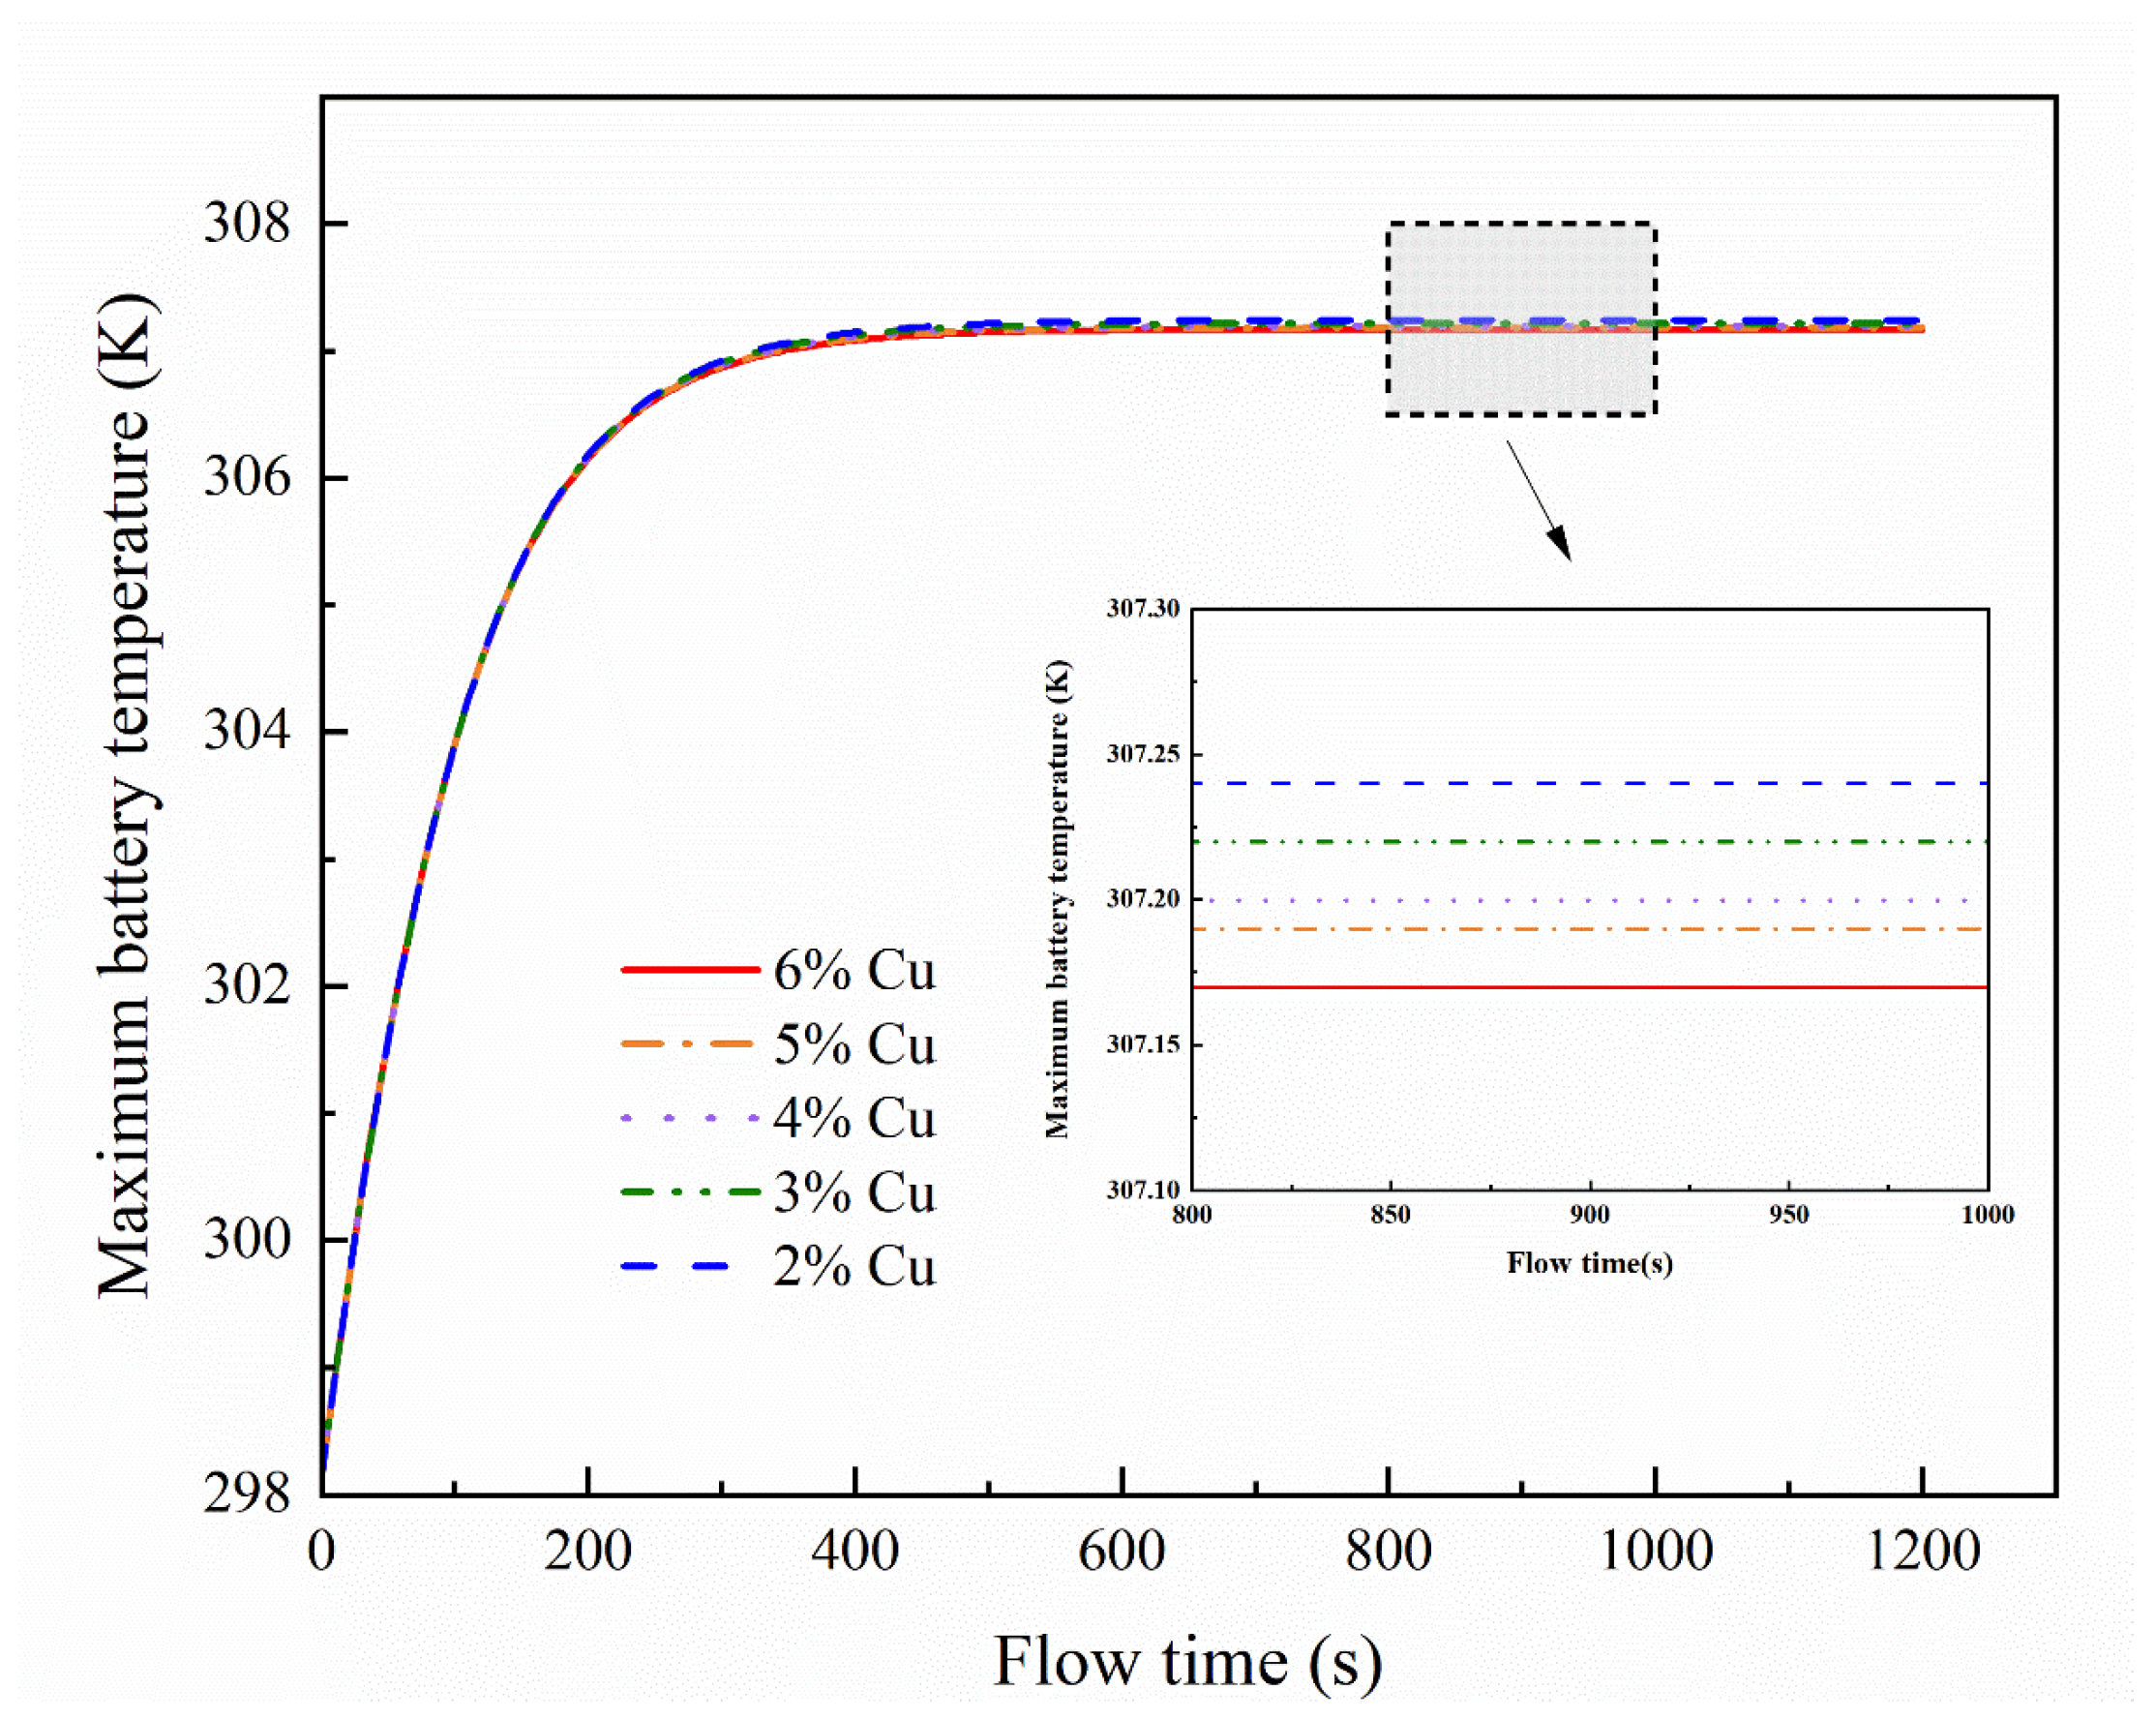
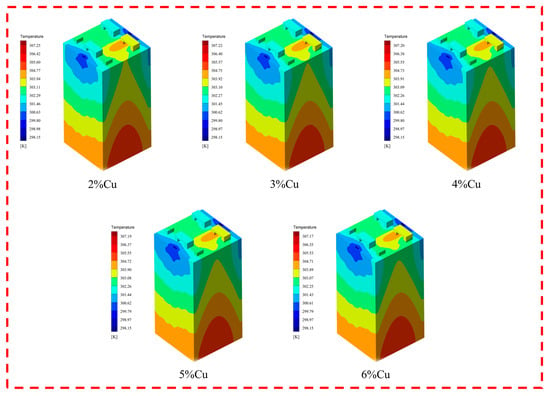
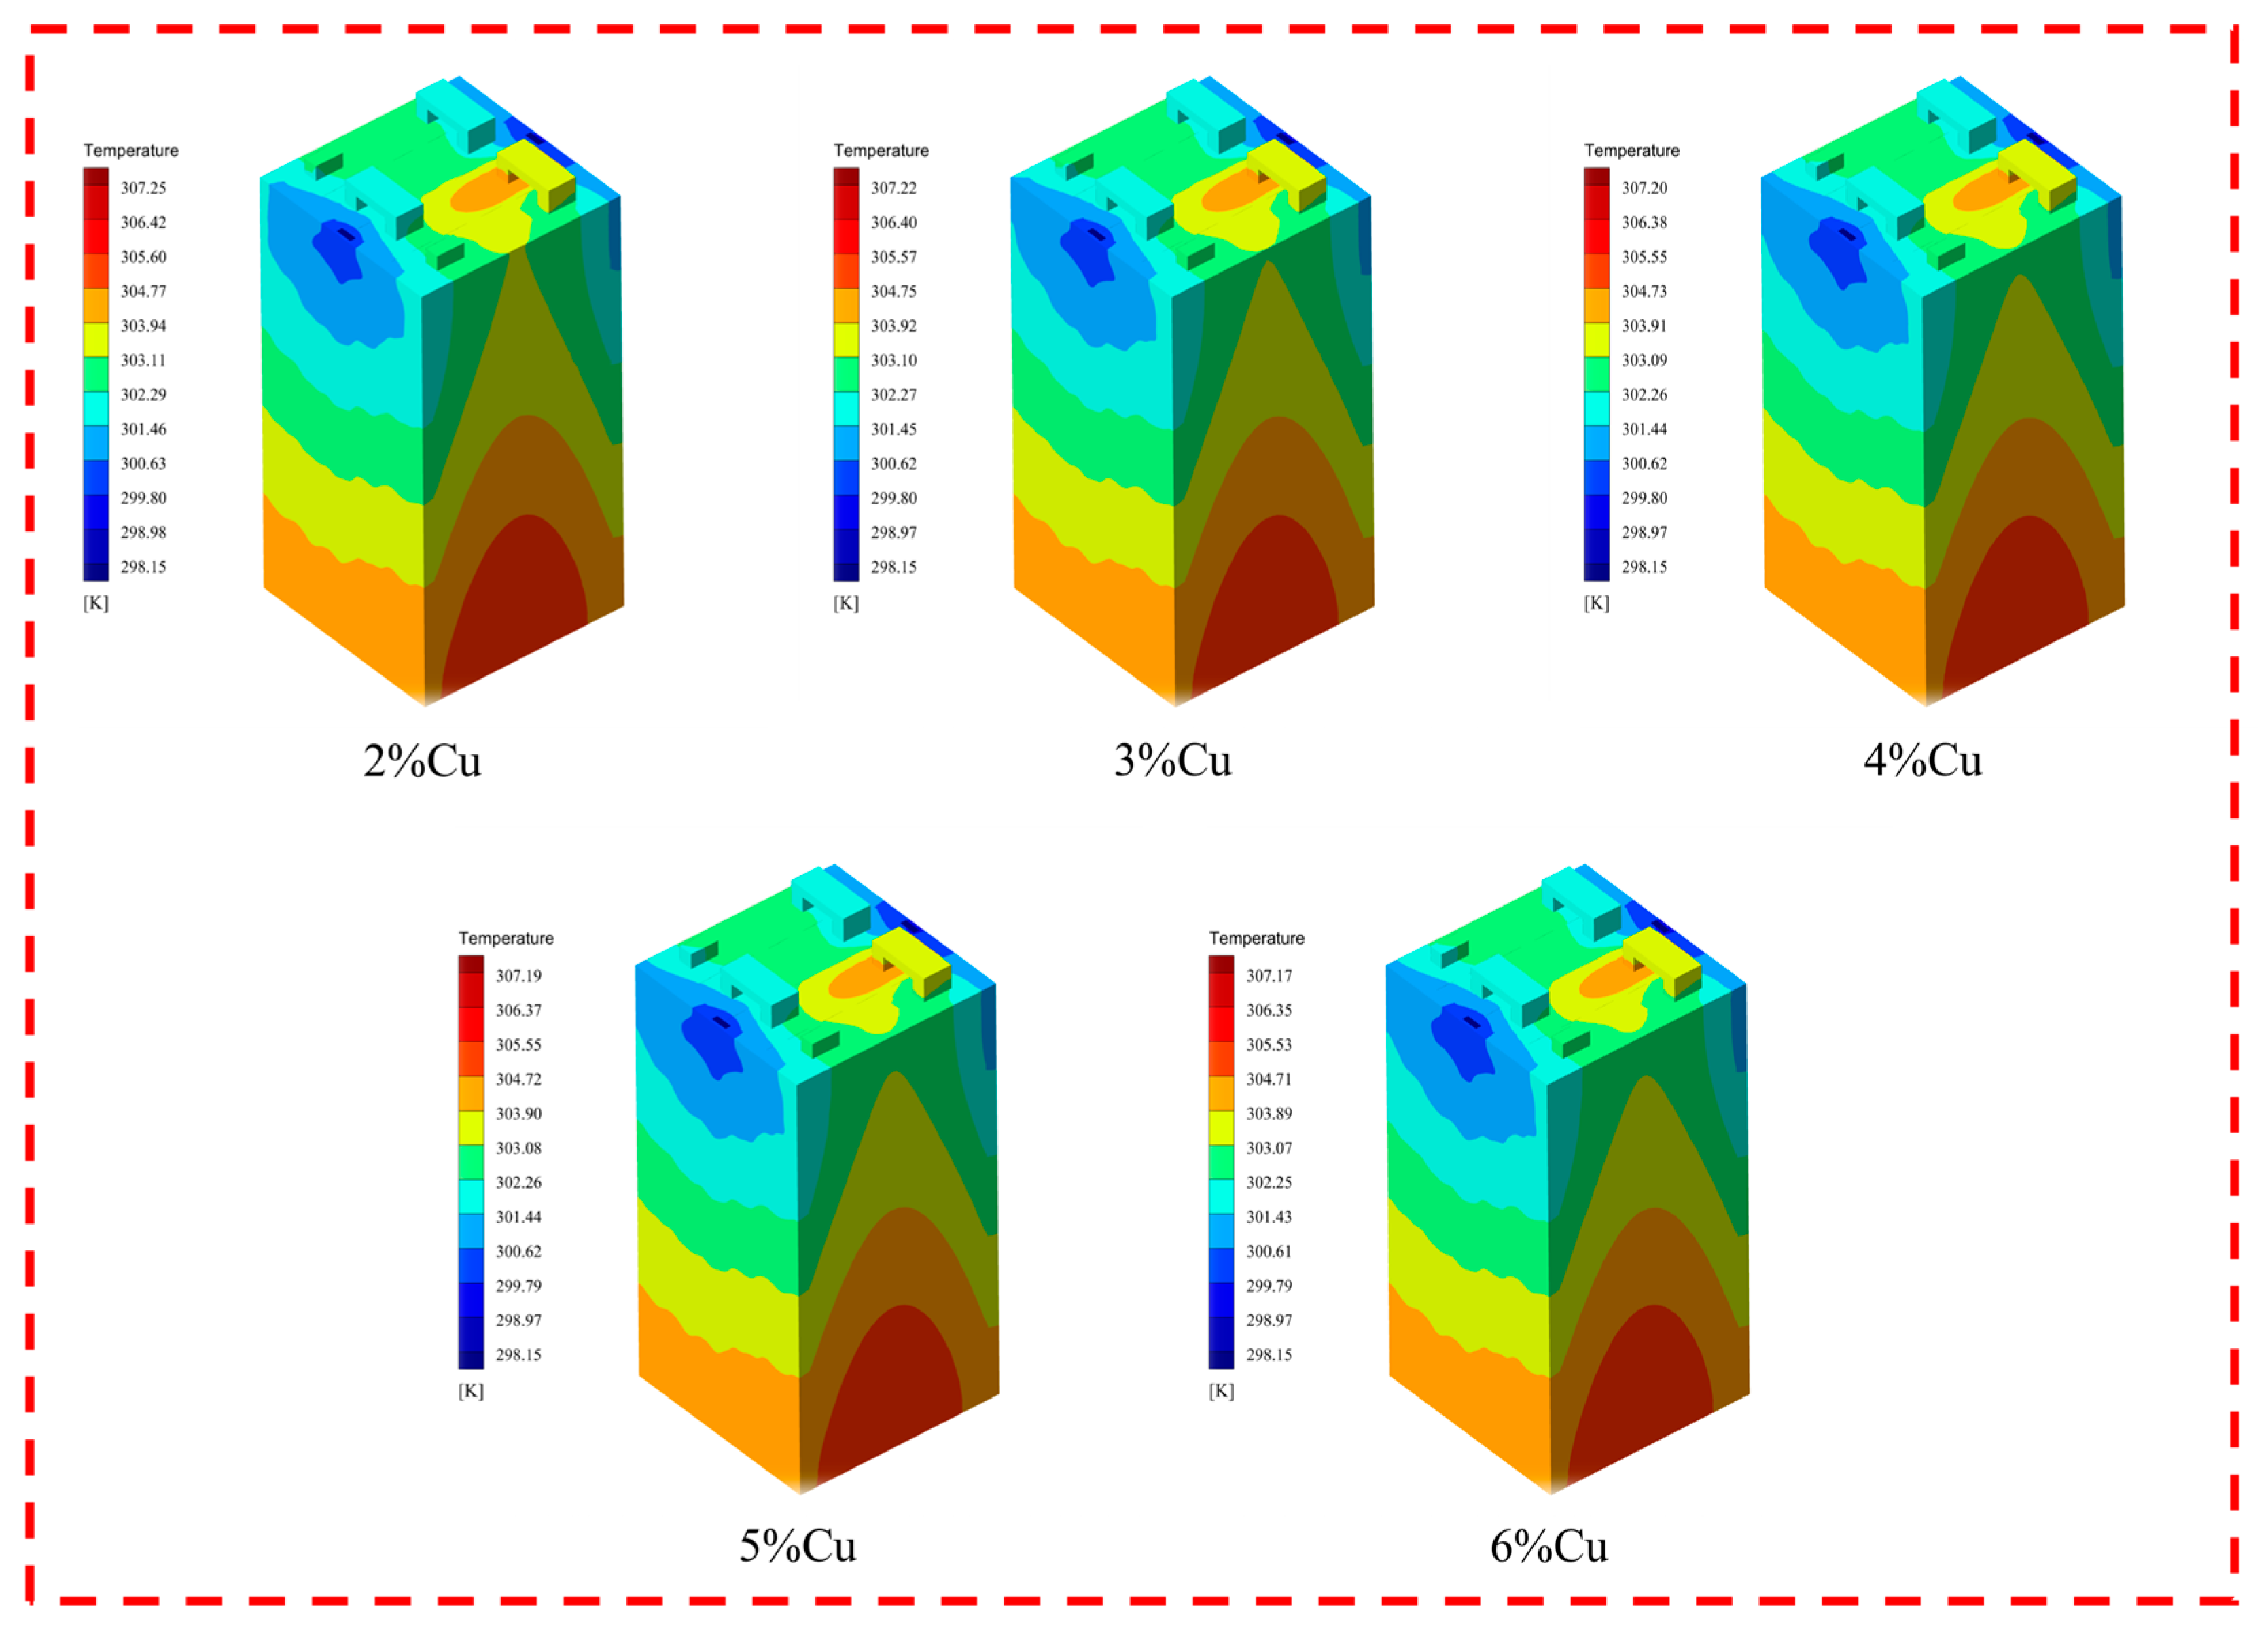
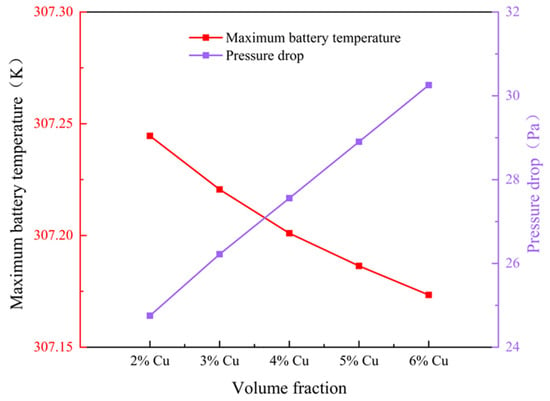
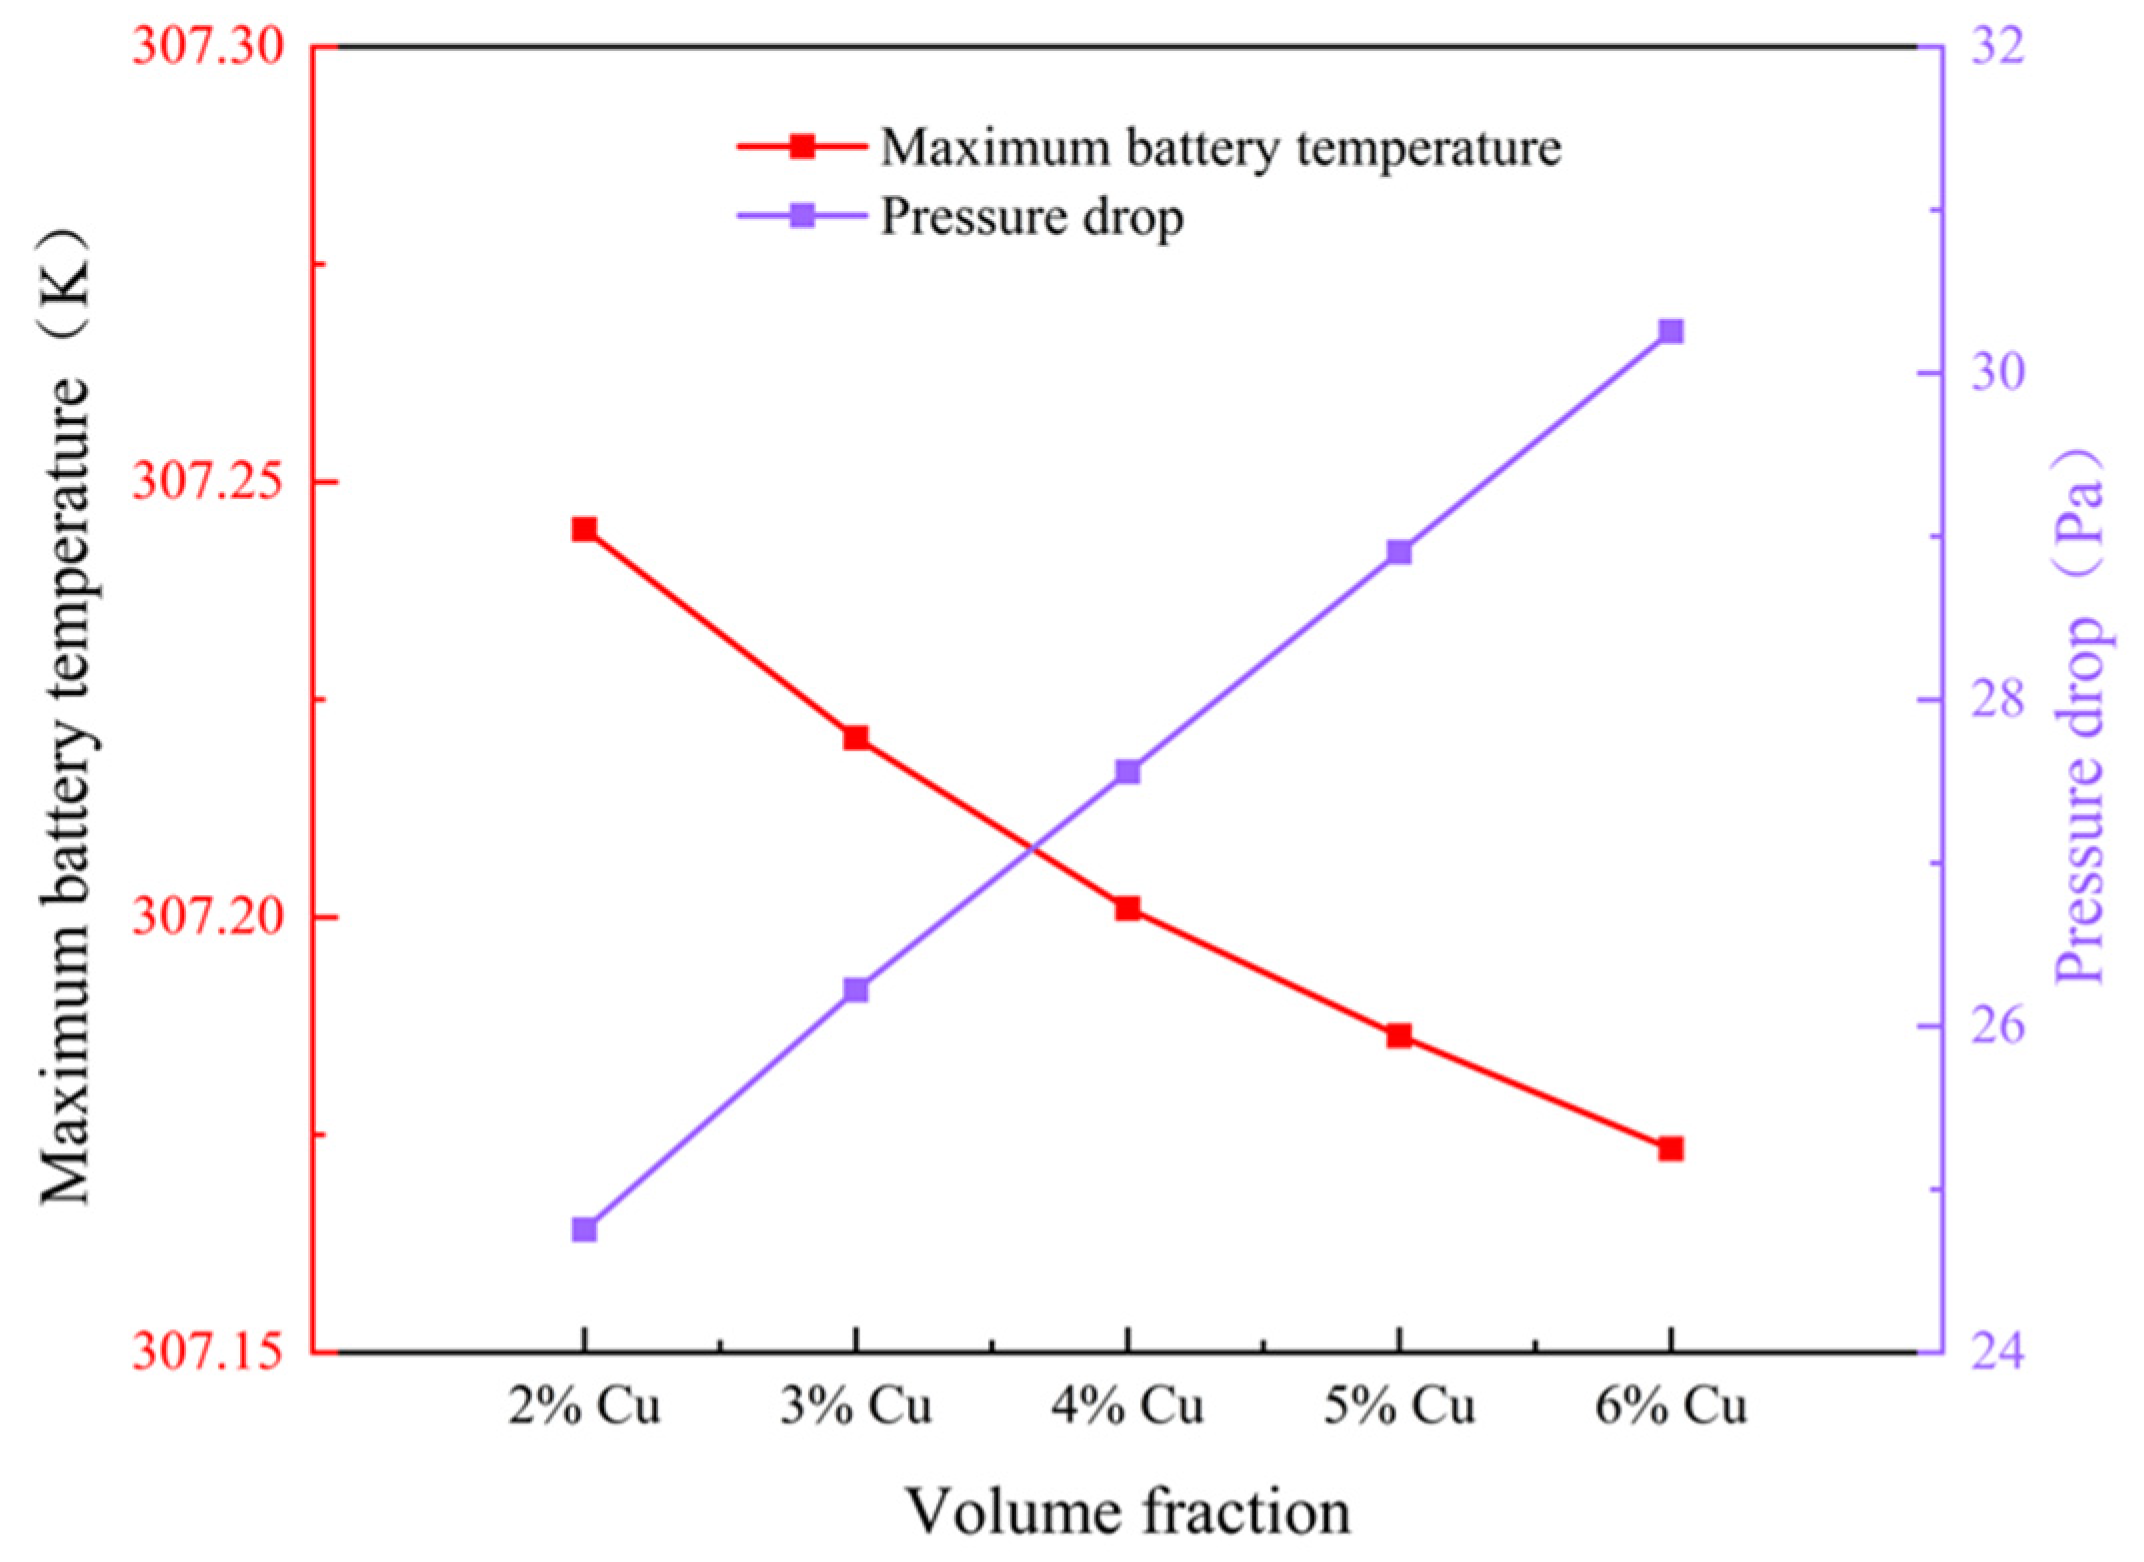
The nanoparticle distribution within a nanofluid, and consequently its heat-transfer performance, are strongly influenced by the nanoparticle volume fraction. This section investigates the heat-transfer performance for five distinct volume fractions of copper–water nanofluids, that is, 2% Cu, 3% Cu, 4% Cu, 5% Cu, and 6% Cu. The volume fraction was set no more than 6% in order to prevent excessive nanoparticle agglomeration and potential microchannel blockage [47]. All simulations were carried out at conditions of a nanofluid inlet temperature of 298.15 K, an inlet velocity of 0.1 m/s, and a battery discharge rate of 3 C. As shown in Figure 10, the maximum battery temperature decreased linearly by approximately 0.07 K per percentage point increase in volume fraction across the range of 2% to 6%. The steady-state temperature contours of the cold plate are presented in Figure 11, while the corresponding data on thermal performance and pressure drop are shown in Figure 12. The results show that the 6% Cu nanofluid achieved the lowest maximum battery temperature. Overall, the peak temperature decreased as the nanoparticle volume fraction increased. Notably, the 6% Cu nanofluid also presented the most extensive low-temperature region. This improvement is attributed to the enhanced thermal conductivity at higher nanoparticle loadings, which boosts the heat-transfer capacity of the cold plate. Furthermore, while the battery temperature exhibited a negative correlation with nanofluid volume fraction, the pressure drop showed a strong positive correlation. The pressure drop increase is primarily due to the elevated viscosity and density of the nanofluid at higher volume fractions.
Figure 10.
Distribution of the maximum temperature of the battery module as a function of flow time with different volume fractions of Cu in nanofluids.
Figure 11.
Cold-plate temperature maps for different volume fractions of Cu in nanofluids.
Figure 12.
Heat-transfer characteristics of battery cold plate with different volume fractions of Cu in nanofluids.
4.4. Inlet Velocities
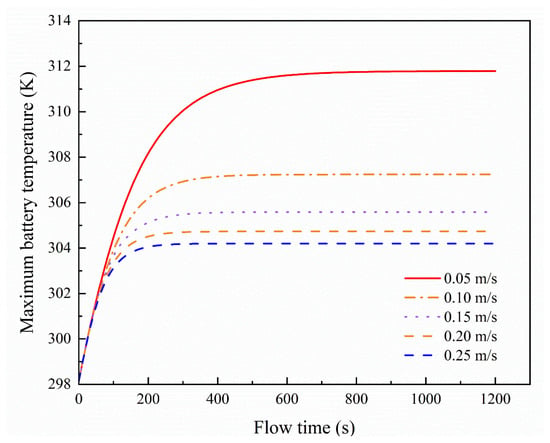
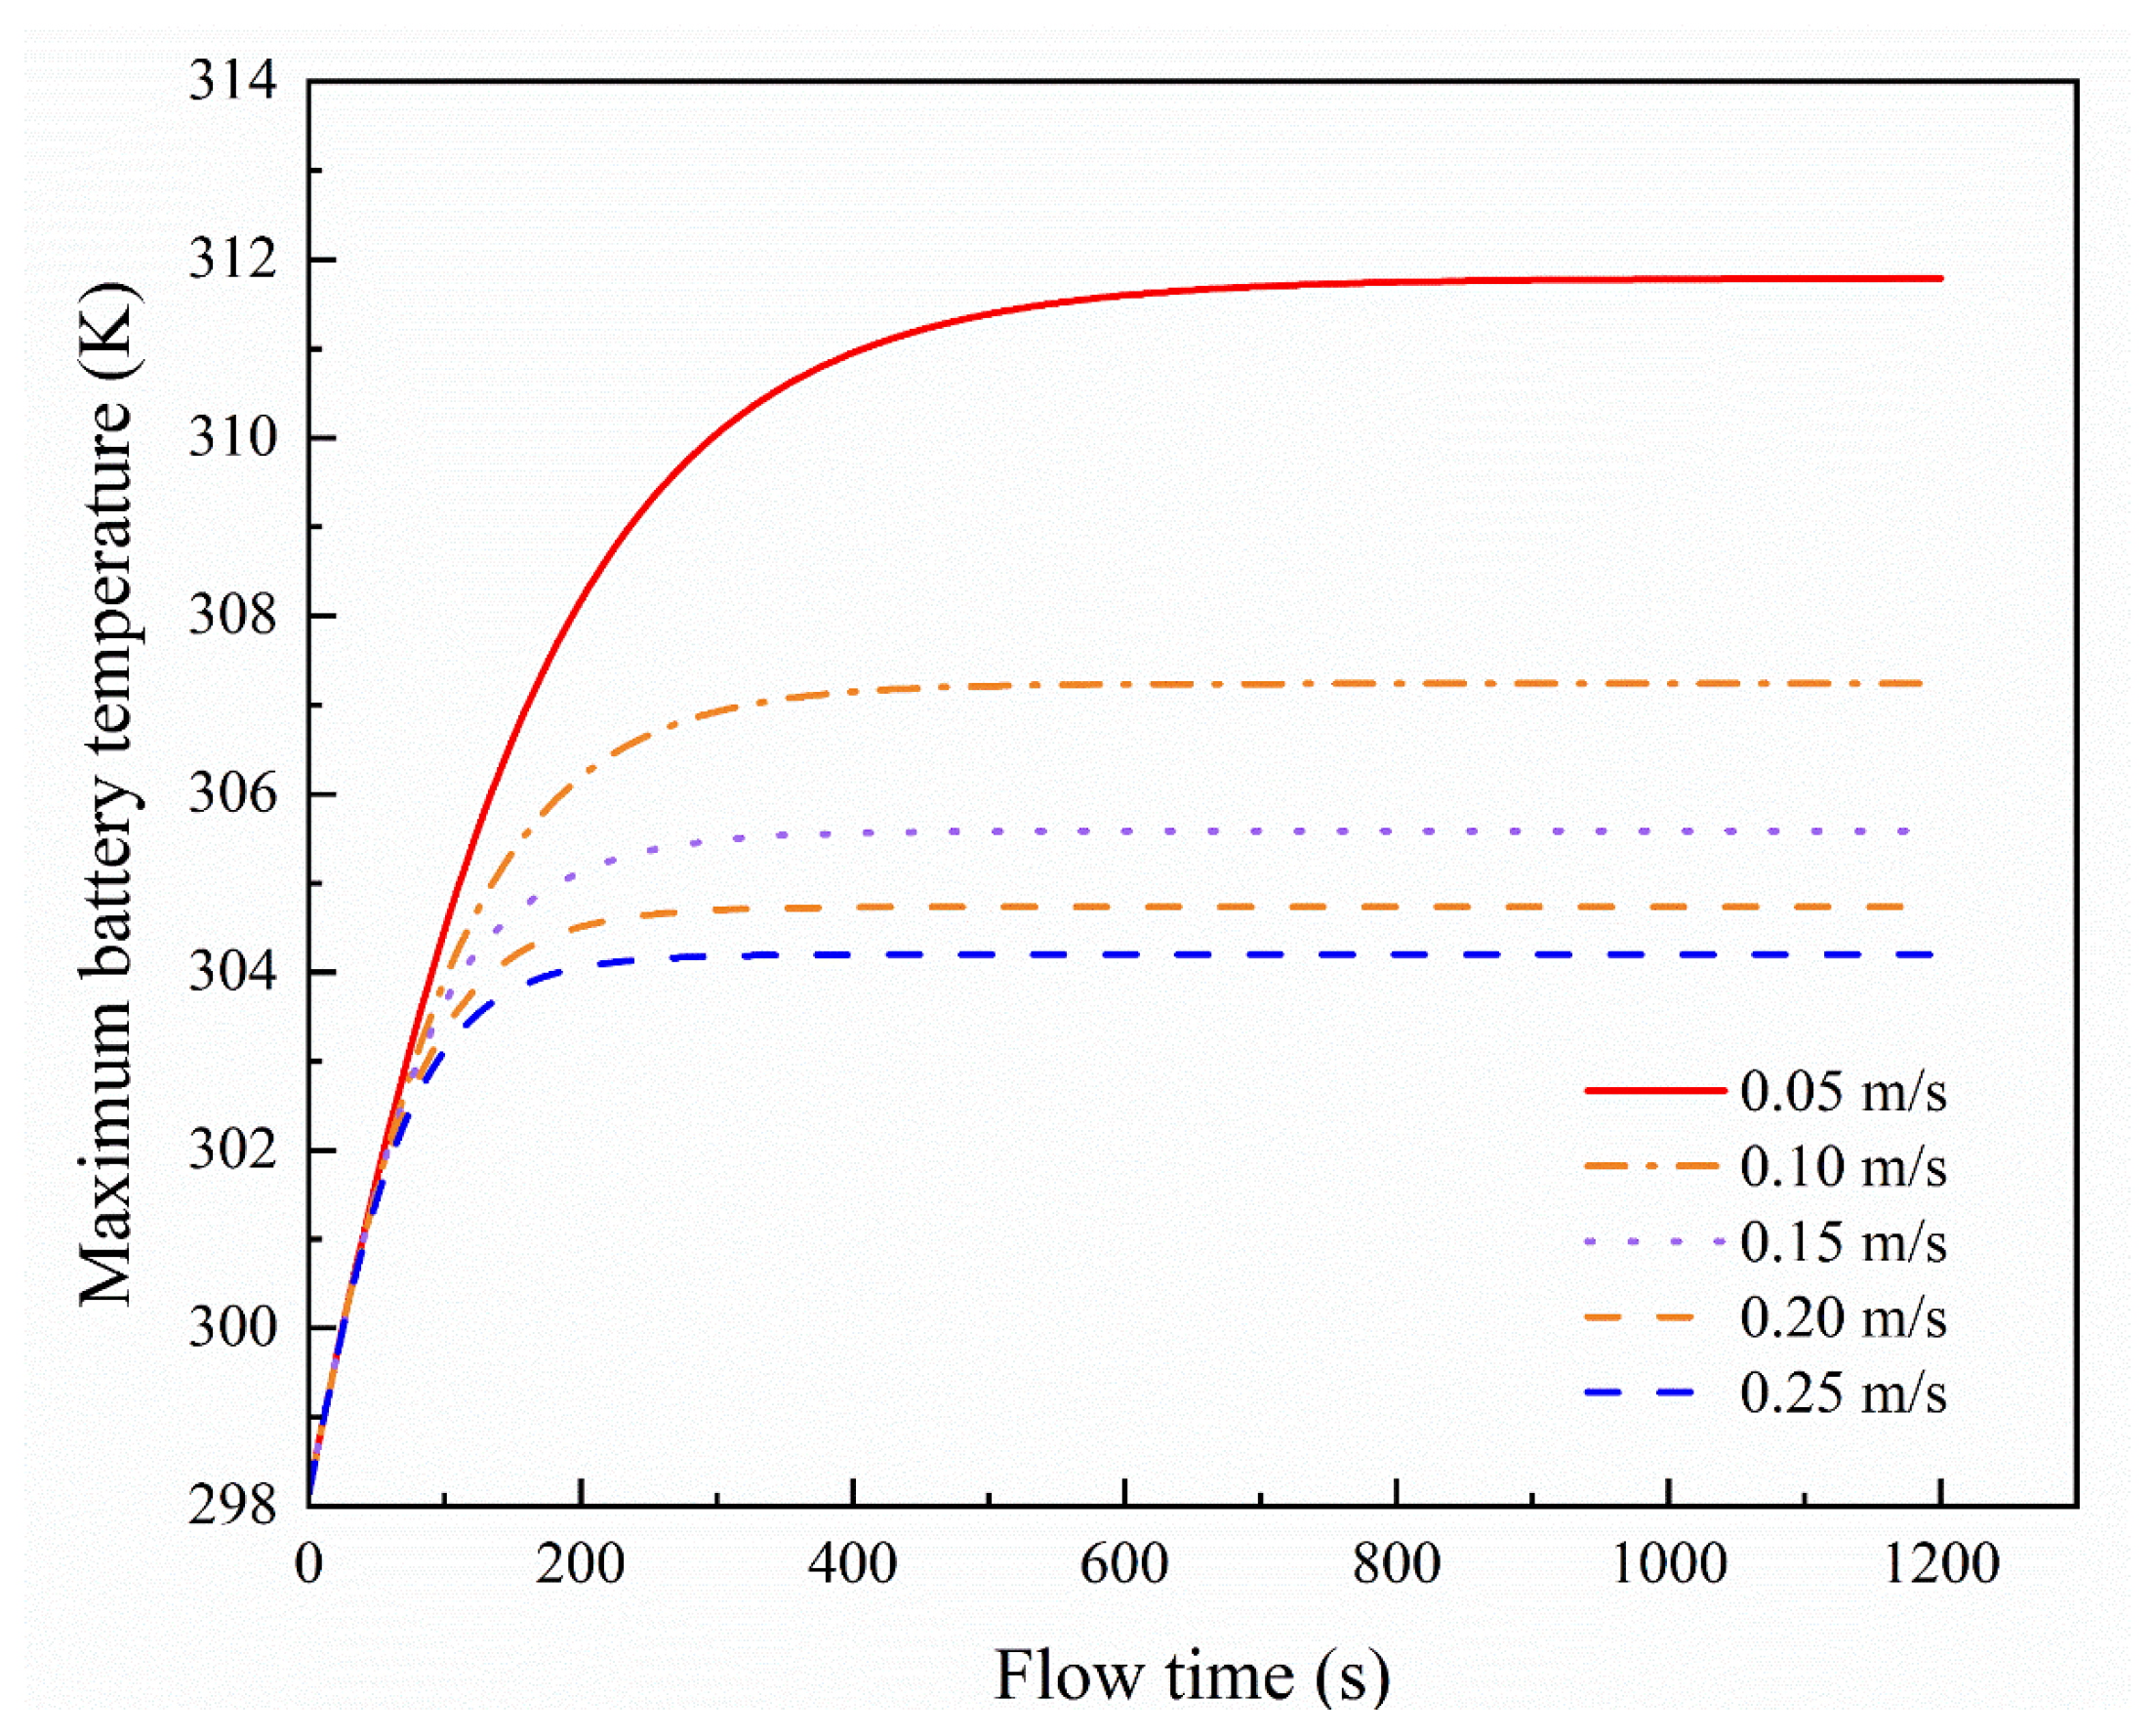
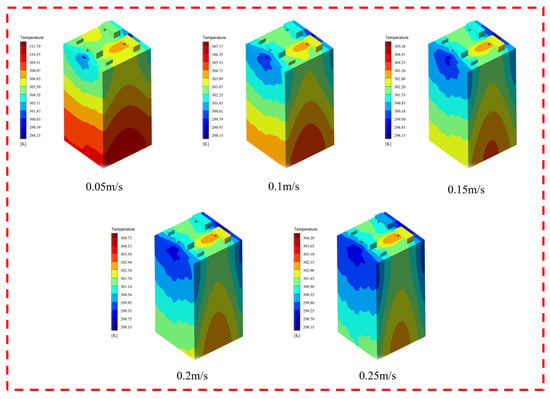
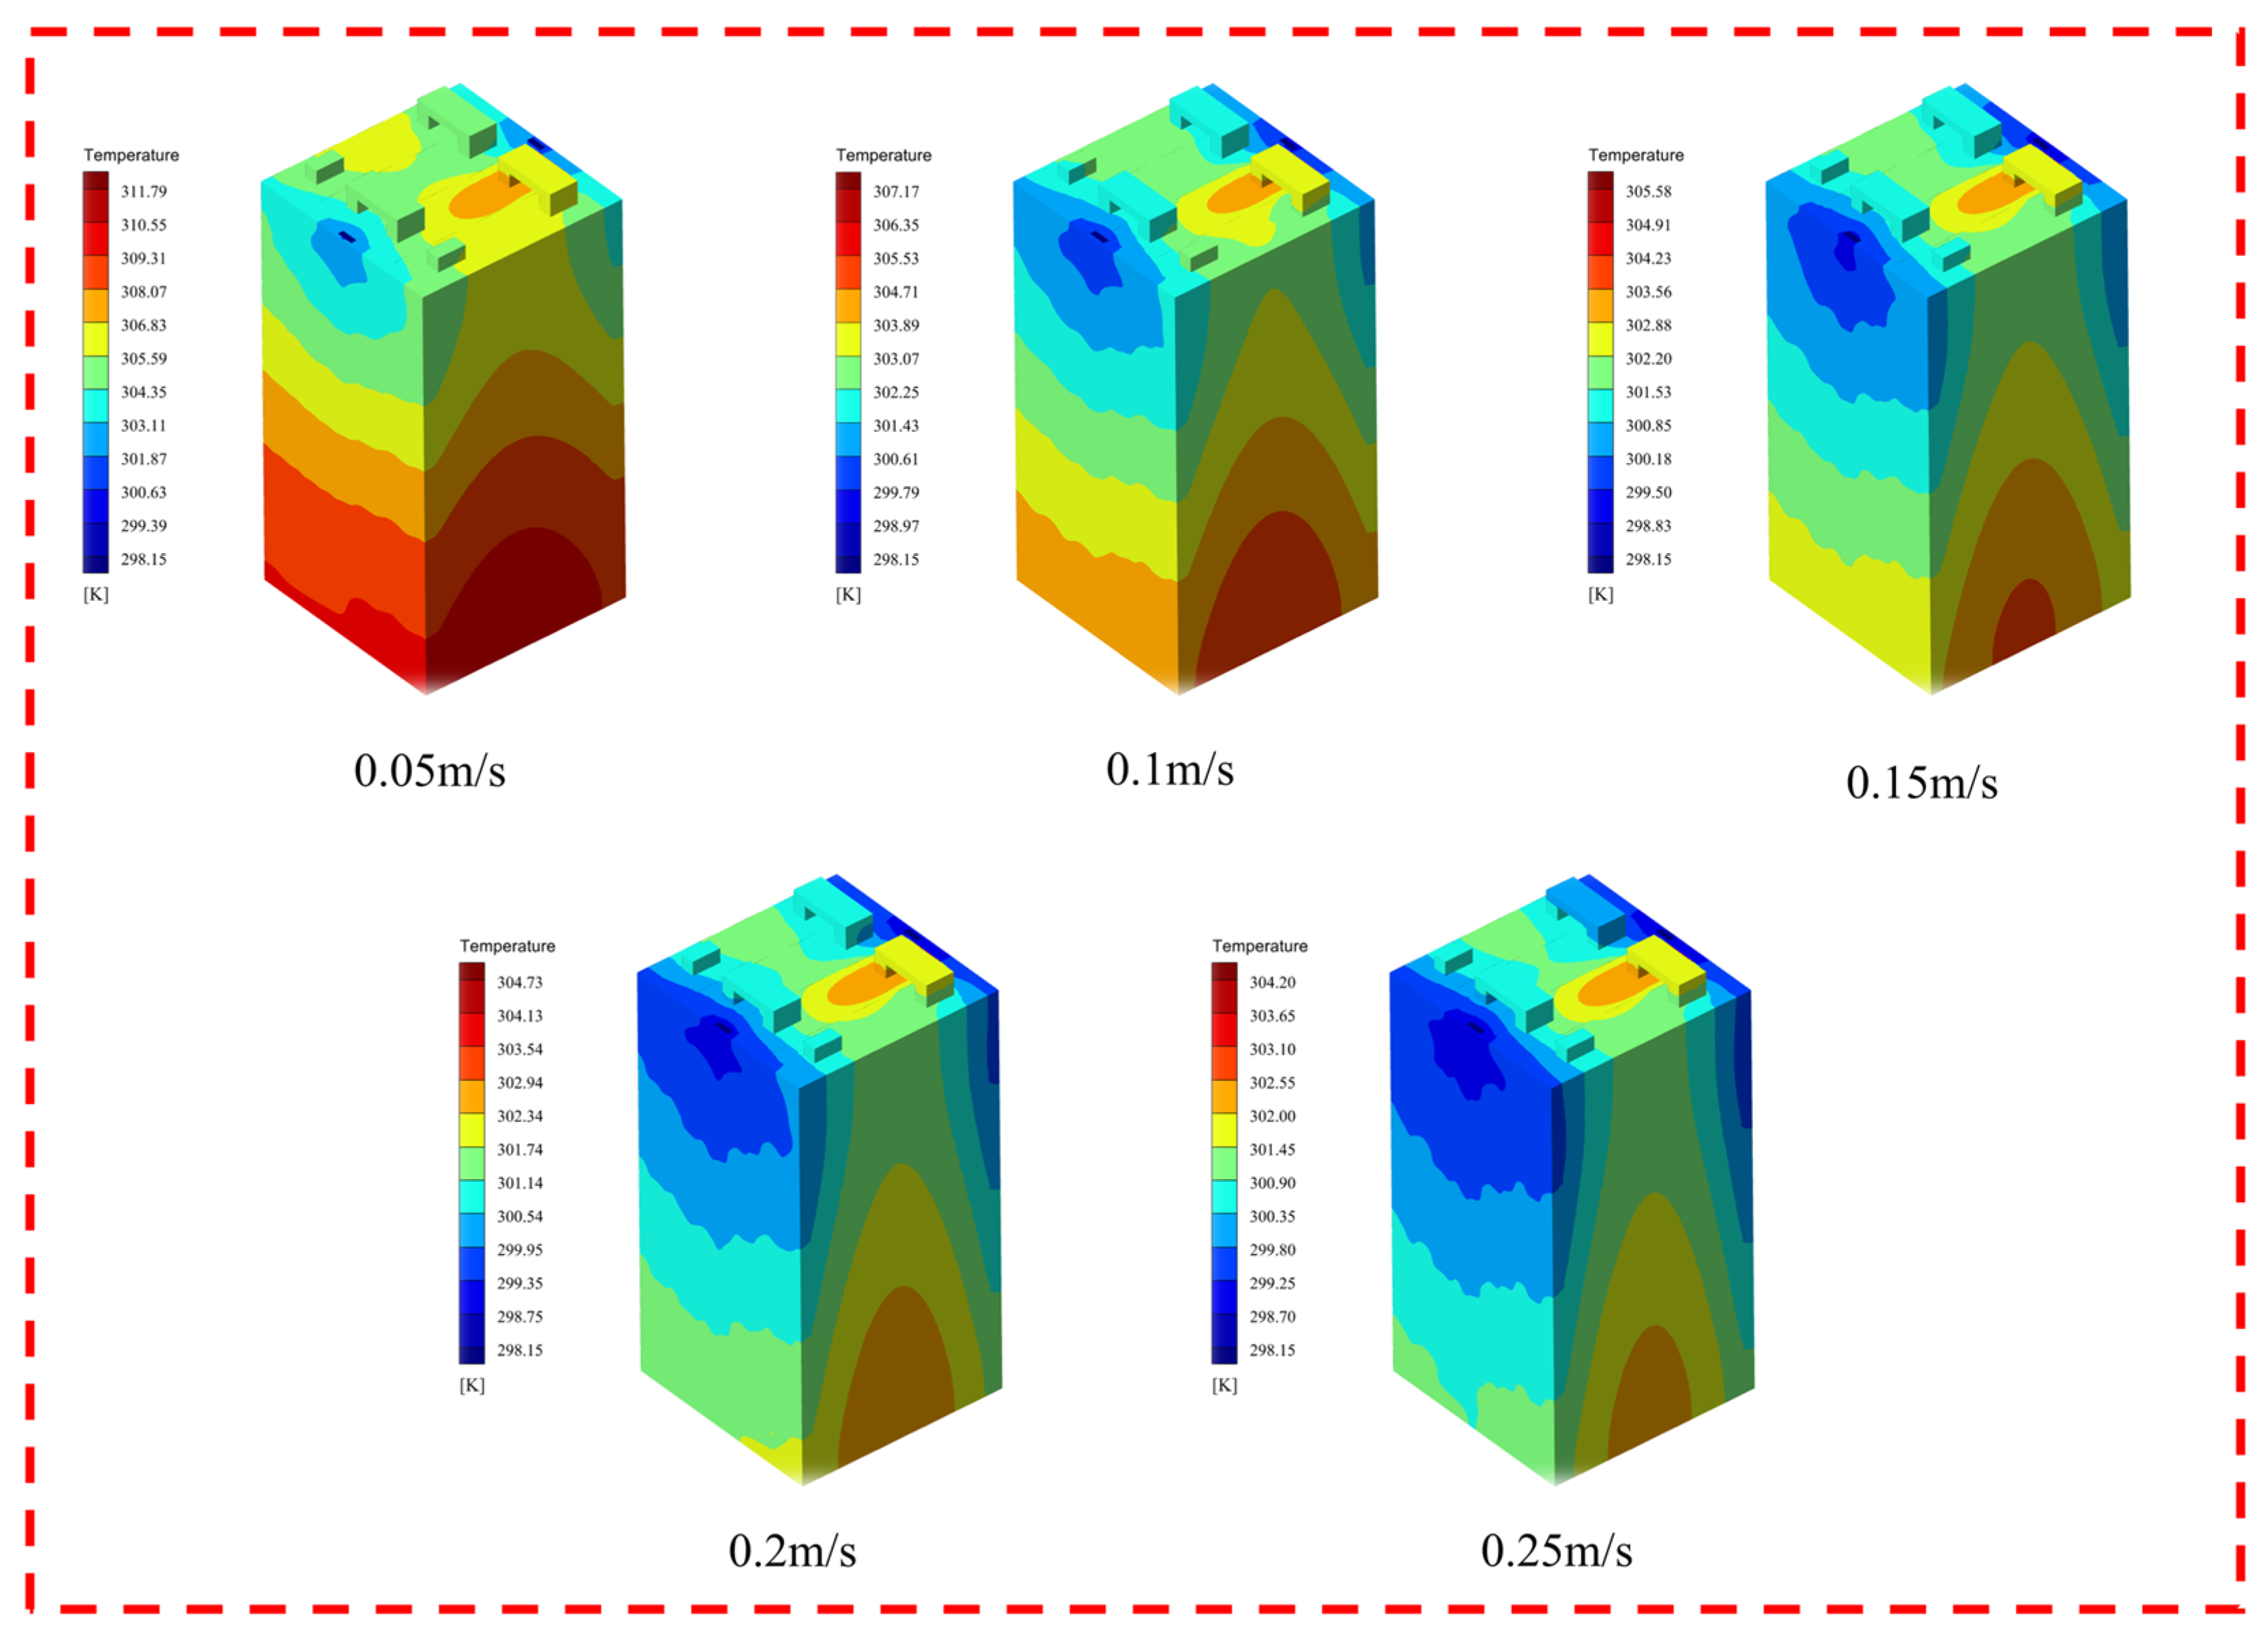
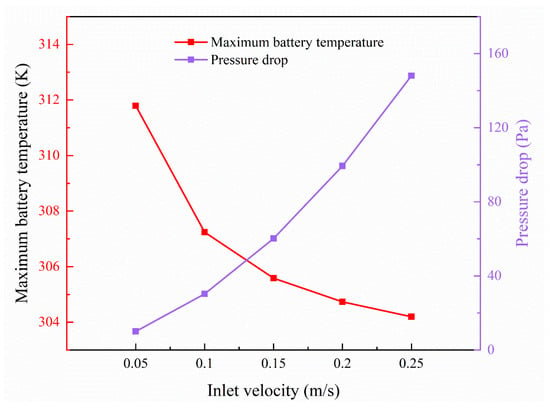
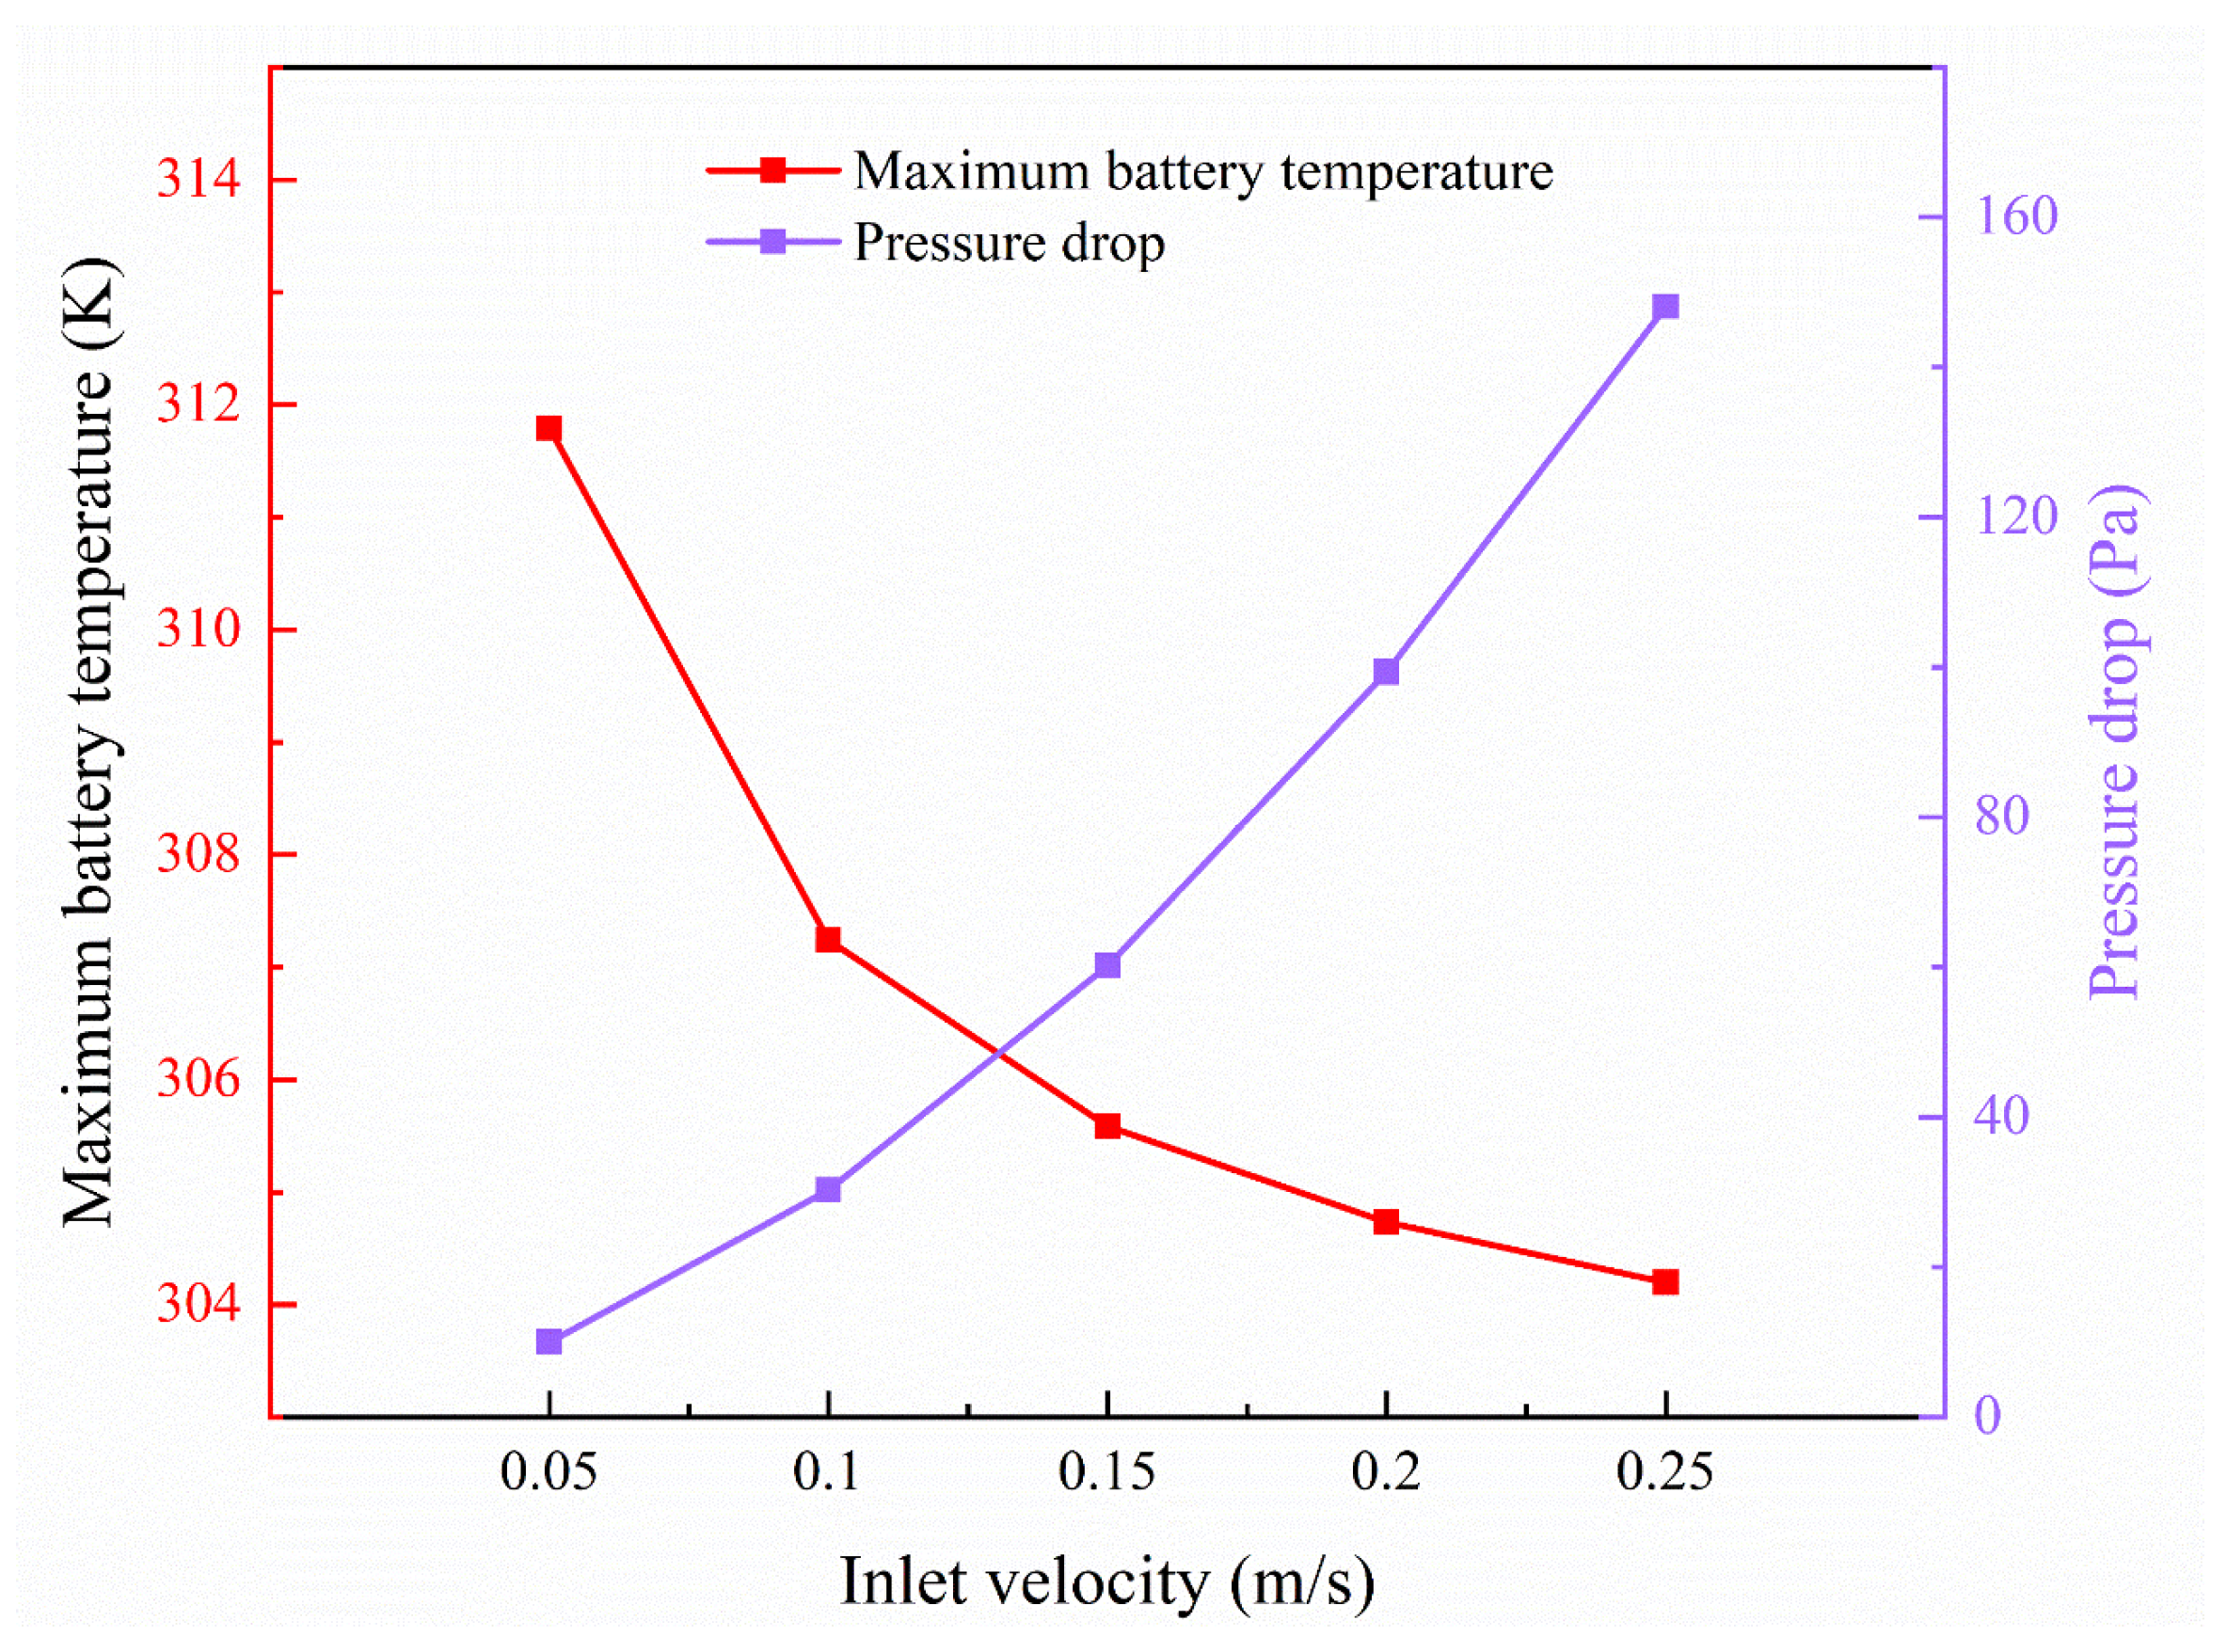
The inlet velocity of the nanofluid is a critical parameter influencing the thermal performance of the BTMS. An excessively low coolant inlet velocity leads to a decrease in the flow rate and convective heat-transfer coefficient. This impedes timely heat dissipation from the battery, which can lead to excessive temperature rise and increase the risk of thermal runaway. Conversely, an excessively high velocity leads to a significant increase in pressure drop. While this lowers the battery temperature further, it results in diminishing returns and unnecessary energy consumption. Therefore, optimizing the coolant inlet velocity is crucial for efficient battery thermal management. Simulations for a 6% Cu–water nanofluid as coolant were conducted with a fixed inlet temperature of 298.15 K and inlet velocities ranging from 0.05 m/s to 0.25 m/s. As shown in Figure 13, the results indicate that at the highest velocity of 0.25 m/s, the maximum cold-plate temperature reached a minimum, showing a reduction of 7.59 K compared to the case at 0.05 m/s. However, this was accompanied by an increase of 138.07 Pa in pressure drop. The decrease in battery temperature is due to the enhanced convective heat dissipation from the battery surface caused by a higher coolant inlet velocity. Conversely, the increased velocity also elevates the pressure drop, which was observed to rise approximately exponentially with velocity in this study. Figure 14 and Figure 15 present the steady-state temperature contours of the cold plate and summarize the associated thermal performance and pressure drop metrics, respectively.
Figure 13.
Distribution of the maximum temperature of the battery module as a function of flow time with different inlet velocities of 6% Cu–water nanofluid.
Figure 14.
Cold-plate temperature maps at different inlet velocities of nanofluid.
Figure 15.
Heat-transfer characteristics of the battery cold plate at different inlet velocities of nanofluid.
4.5. Battery Discharge Rates
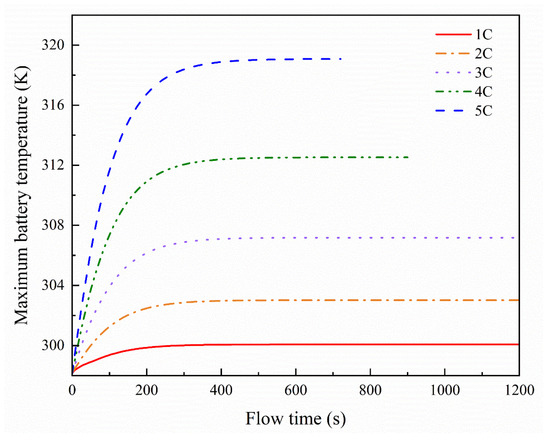
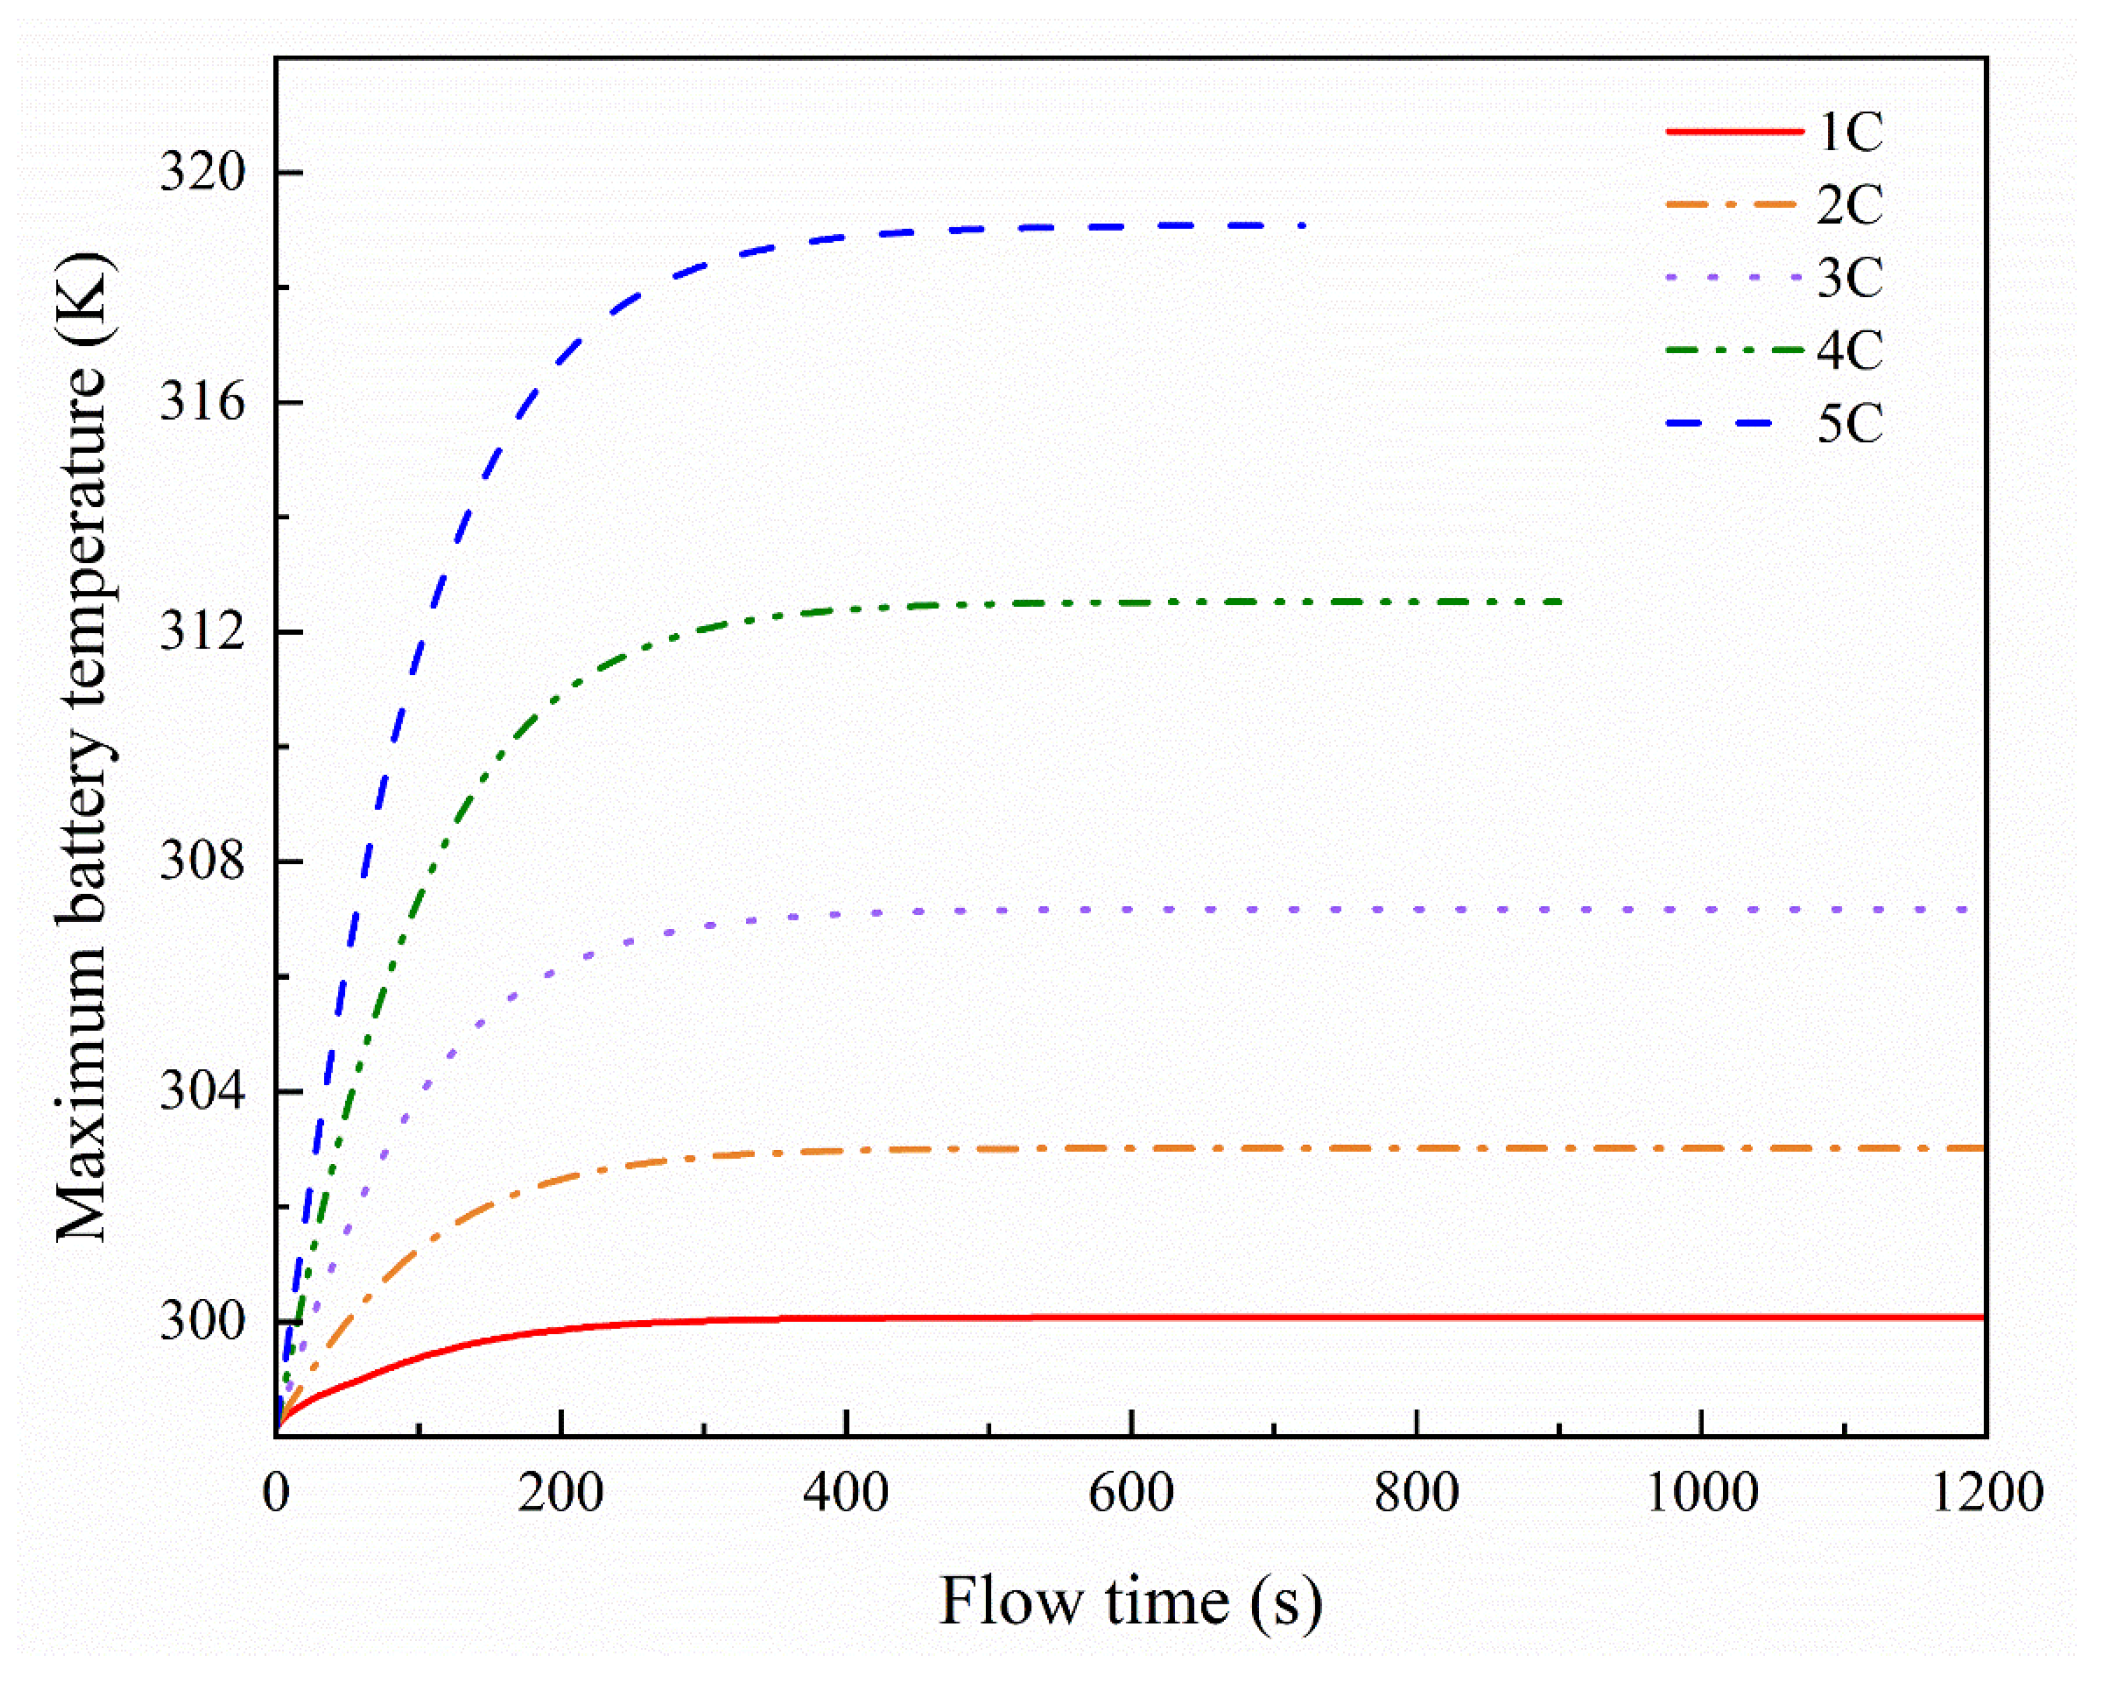
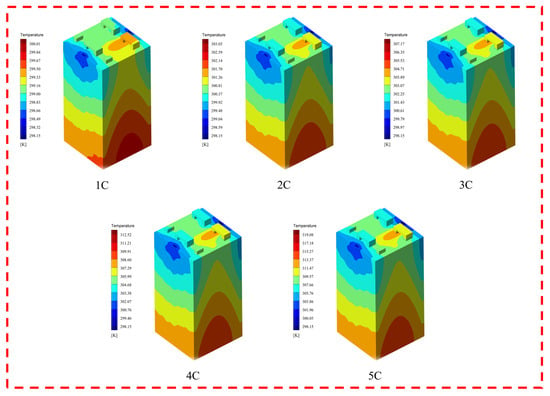
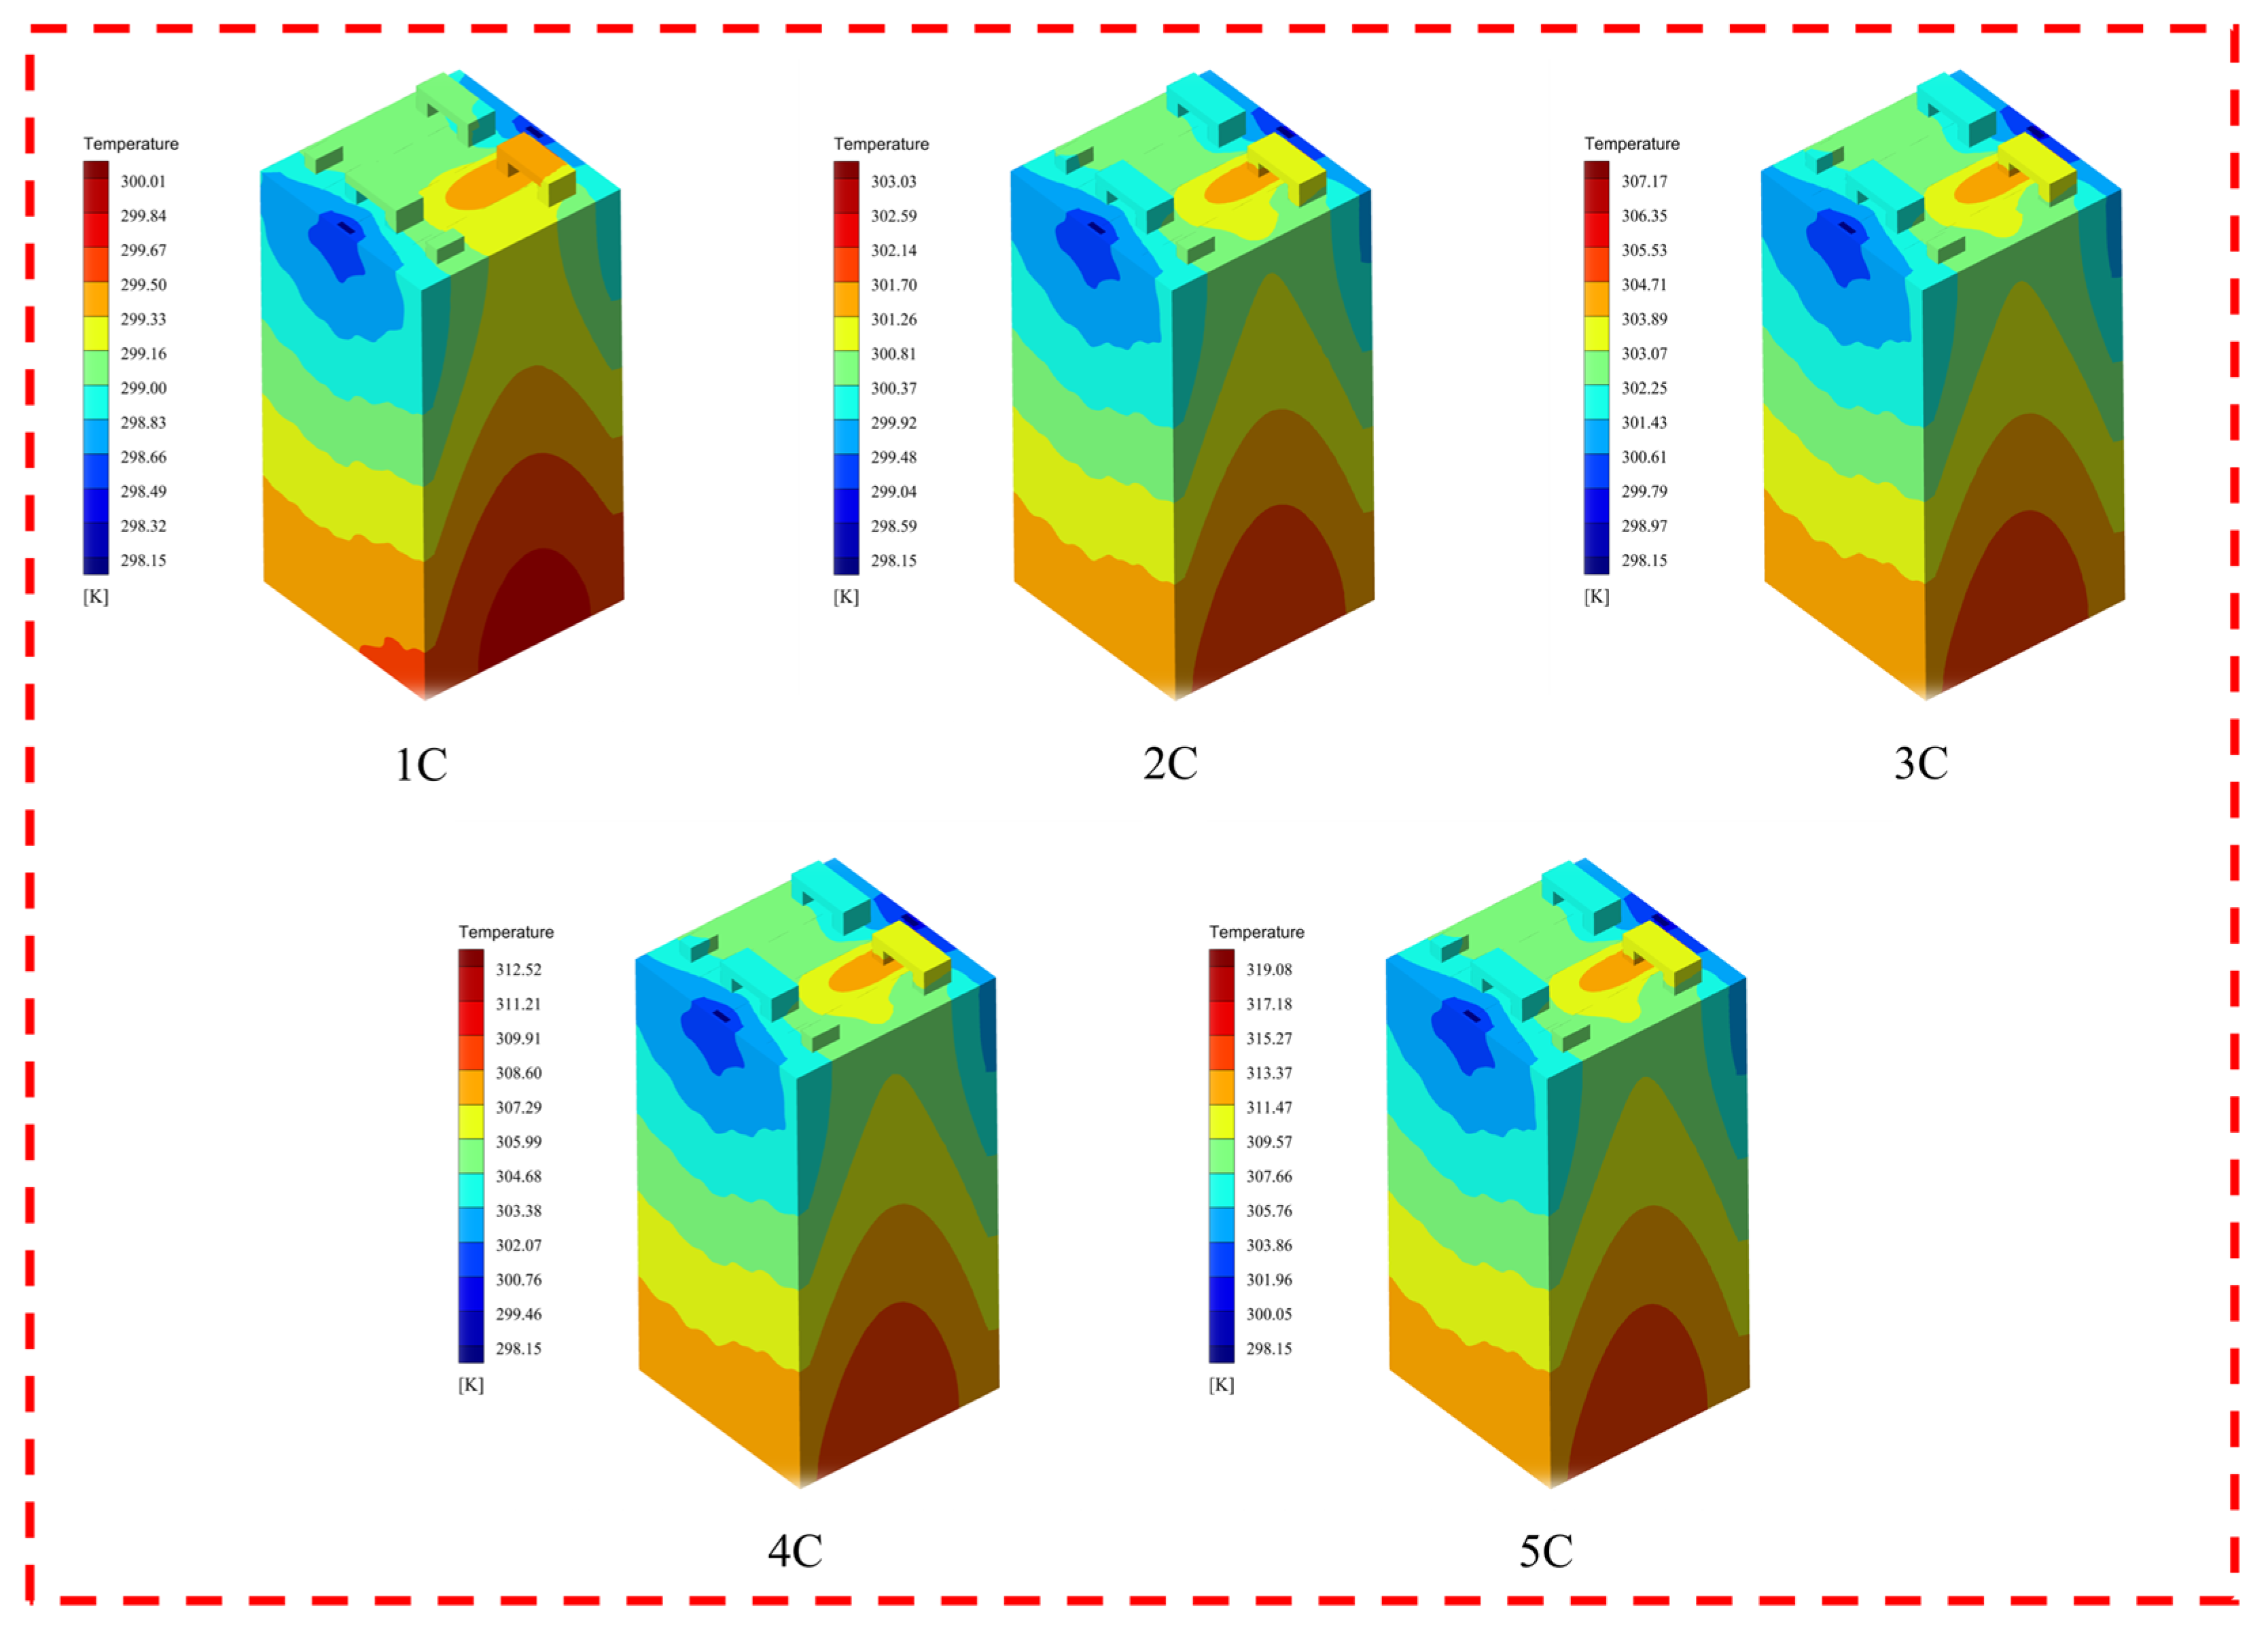
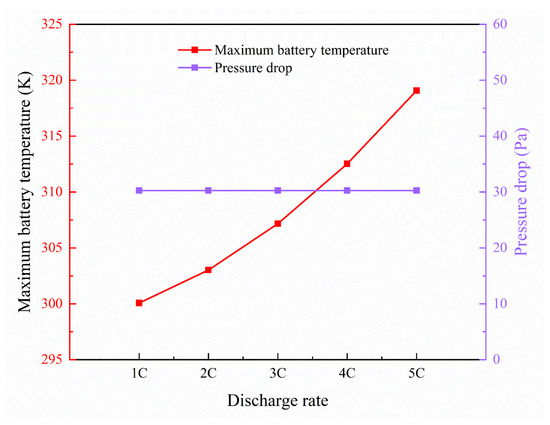
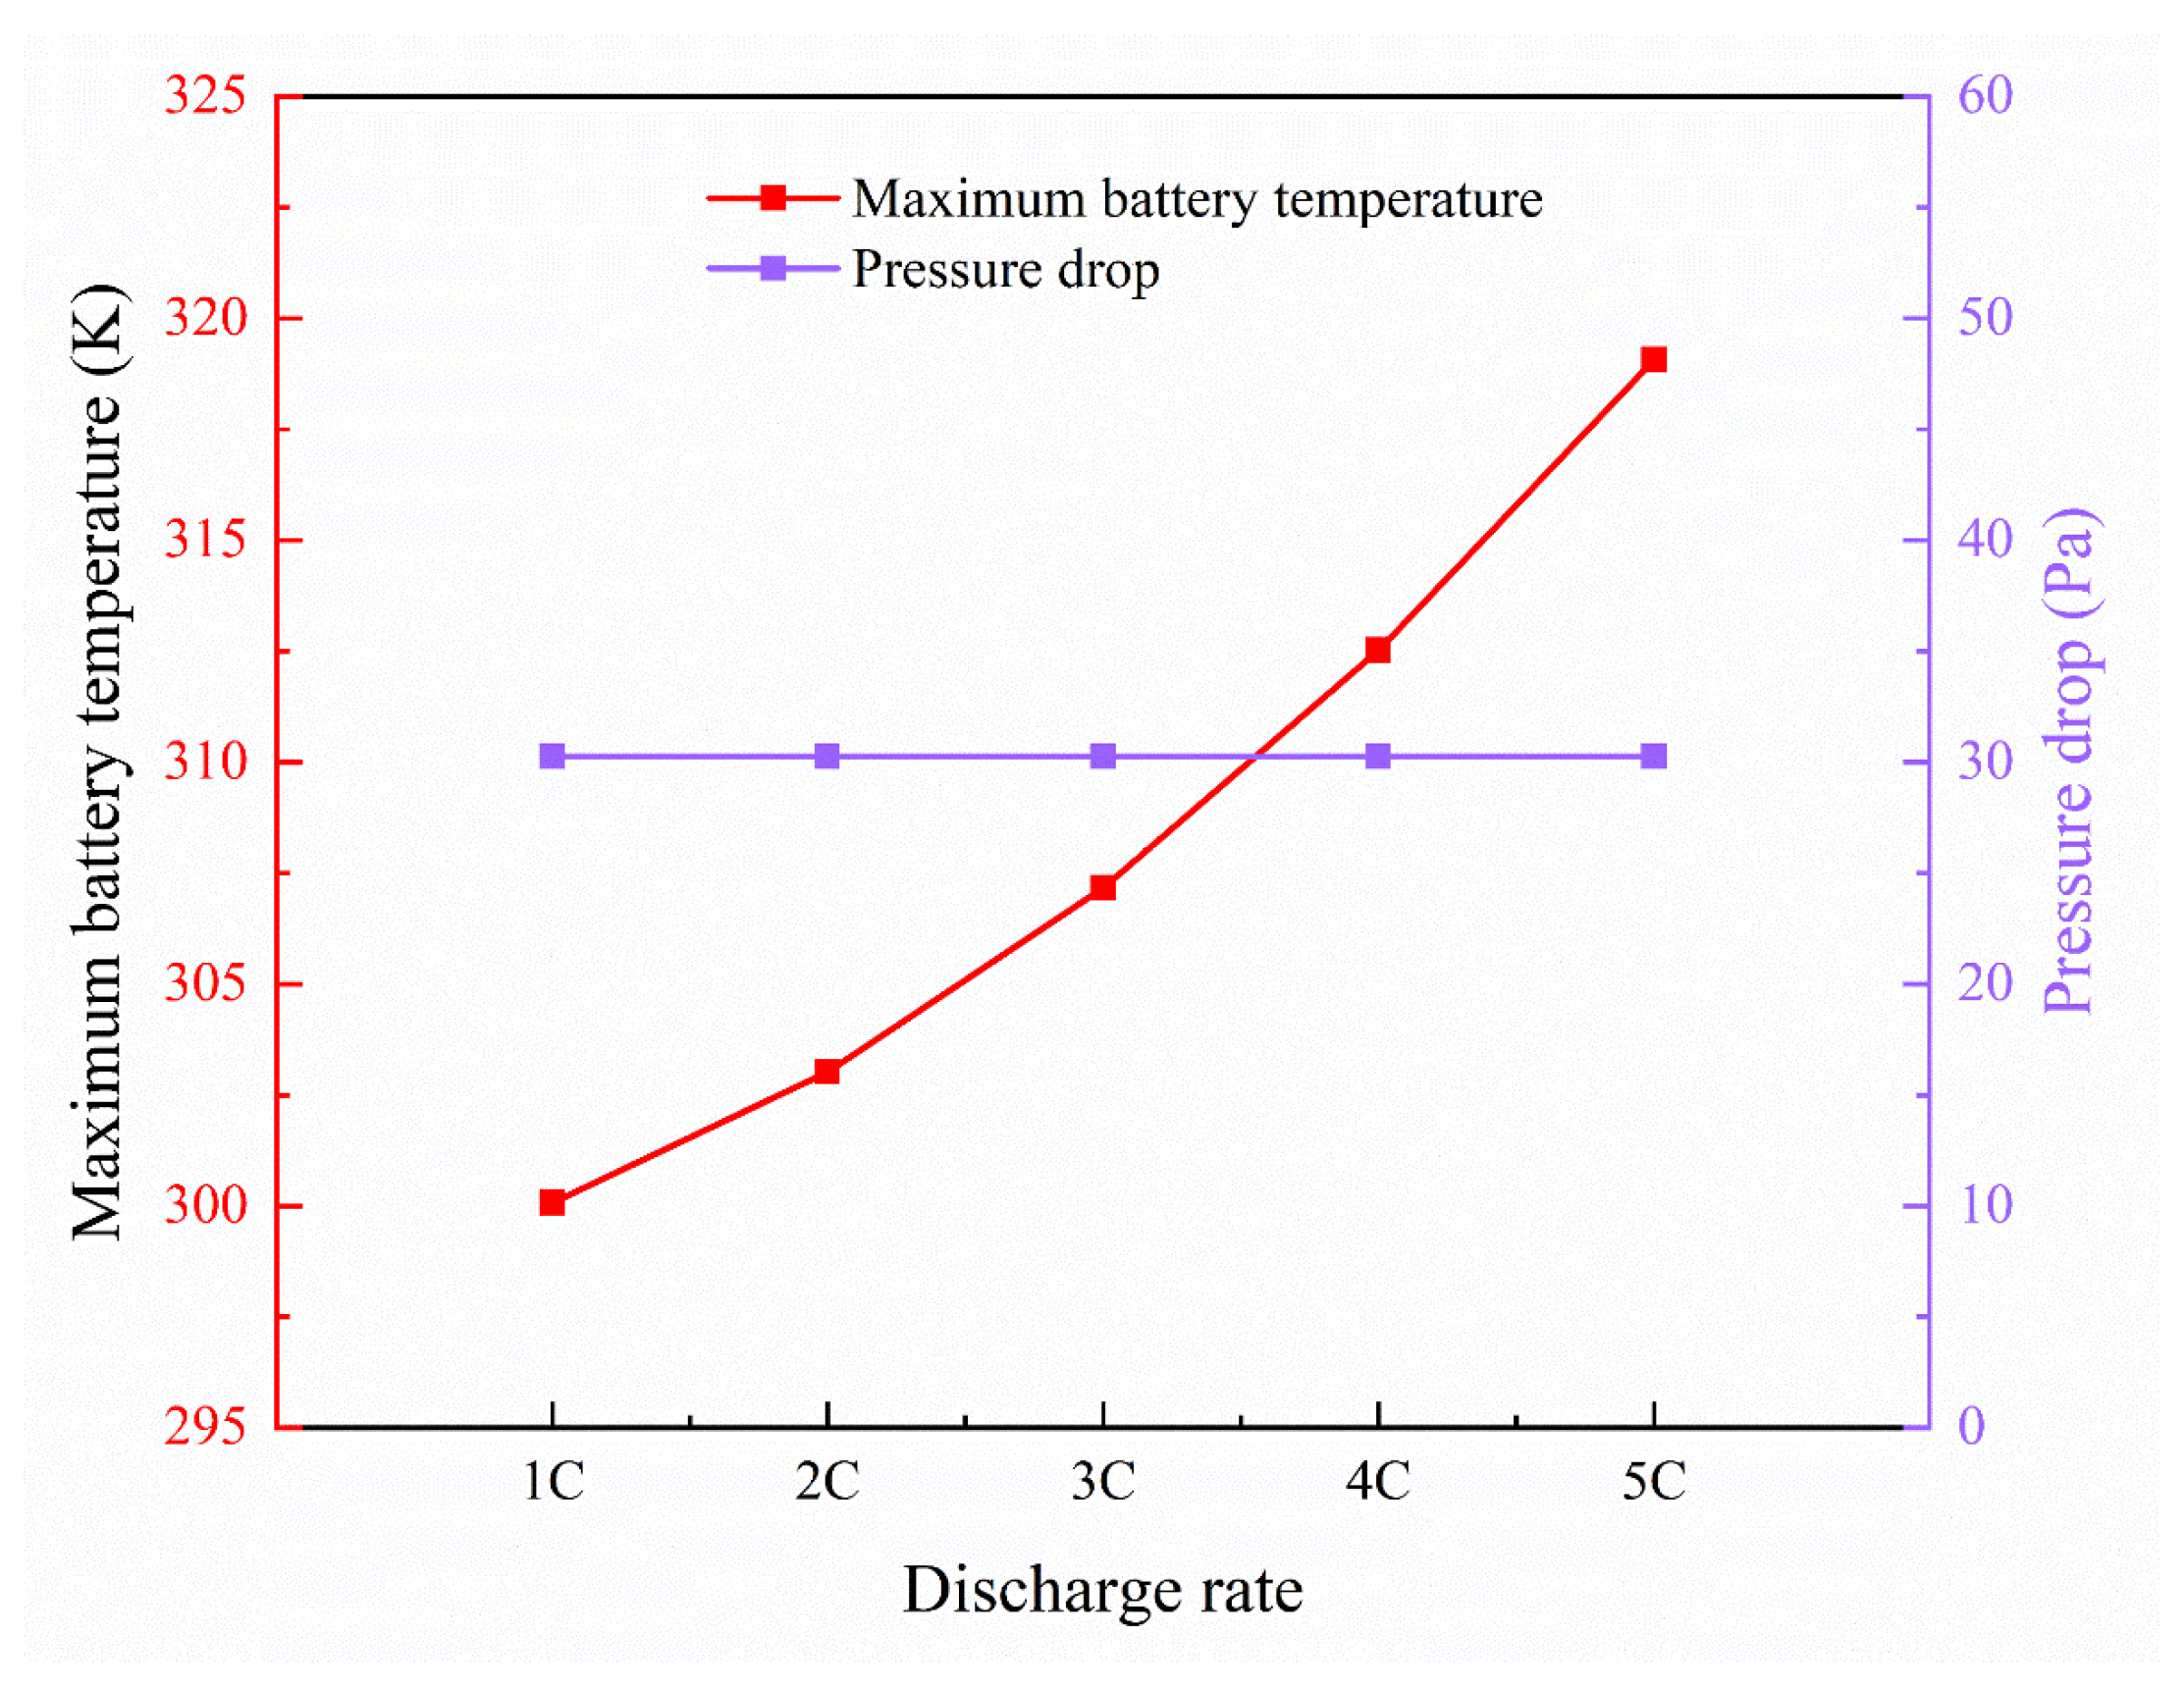
The thermal behavior of the cold plate under varying battery discharge rates is shown in Figure 16. A nanofluid containing 6% Cu nanoparticles was employed as the coolant, and its cooling capability was assessed at discharge rates of 1 C, 2 C, 3 C, 4 C, and 5 C, with a fixed inlet velocity of 0.1 m/s and an inlet temperature of 298.15 K. As can be seen in Figure 16, when the coolant inlet conditions remain unchanged, raising the discharge rate from 1 C to 5 C led to an 18.99 K increase in the battery’s peak temperature. This finding highlights the substantial impact of the discharge rate on temperature rise. The observed increase can be attributed to greater heat generation at higher discharge rates, which consequently raises the heat flux directed toward the cold plate. Optimal battery operation occurs between 20 °C and 40 °C, with an upper safety limit of 60 °C. The temperature contours presented in Figure 17 demonstrate that the proposed cold-plate design effectively maintained the battery temperature within the optimal range across all tested discharge rates, confirming its efficacy. Additionally, as depicted in Figure 18, the pressure drop across the cold plate remained constant despite the increase in discharge rate. This is because the pressure drop is primarily determined by the channel geometry and the coolant’s inlet velocity, both of which were held constant. Additionally, as depicted in Figure 18, the pressure drop across the cold plate remained constant despite the increase in discharge rate. This is because the pressure drop is primarily determined by the channel geometry and the coolant’s inlet velocity, both of which were held constant. Although the calculated pressure drop remained nearly unchanged with increasing discharge rate under constant inlet velocity, it should be noted that this result is based on the assumption of constant coolant properties evaluated at the inlet temperature.
Figure 16.
Distribution of the maximum temperature of the battery module as a function of flow time at different discharge rates.
Figure 17.
Cold-plate temperature maps at different discharge rates.
Figure 18.
Heat-transfer characteristics of the battery cold plate at different discharge rates.
5. Multi-Objective Optimization of BTMS by RSM
The preceding numerical simulations systematically investigated the effects of individual factors—including cooling channel geometry, nanoparticle type, volume fraction of Cu nanofluid, inlet velocity, and battery discharge rate—on the thermal performance and pressure drop of LiFePO4 batteries. These findings clarified both the fundamental mechanisms and the quantitative effects of individual factors. In addition, they revealed an inherent compromise between enhancing thermal performance and controlling hydraulic losses. Nevertheless, relying exclusively on single-factor adjustments is insufficient for the concurrent optimization of thermal behavior and energy efficiency. This dual optimization is, in fact, an essential requirement for the practical engineering deployment of BTMS.
Accordingly, building on the key influencing factors (coolant inlet velocity, Cu nanofluid volume fraction, and battery discharge rate) identified in the preliminary single-factor numerical studies, the critical design parameters for Response Surface Methodology (RSM) were selected and are summarized in Table 4. The Box–Behnken Design (BBD), a widely adopted experimental design approach within RSM, was then employed to characterize the relationships between the BTMS design/operating parameters and its thermo-hydraulic performance, thereby quantifying the variation trends of the system performance with changes in each parameter. To address the inherent trade-off between minimizing the maximum battery temperature and reducing the system pressure drop, the Non-dominated Sorting Genetic Algorithm II (NSGA-II) was further introduced for multi-objective optimization. This integrated approach ultimately yielded the optimal design parameters for the BTMS that balance thermal management effectiveness and hydraulic energy consumption, thus enabling a research progression from the exploration of single-factor influence laws to the engineering-oriented multi-objective optimization of the BTMS.
Table 4.
Design parameters of BBD impact factors.
5.1. Multi-Objective Optimization of Maximum Battery Temperature and Pressure Drop
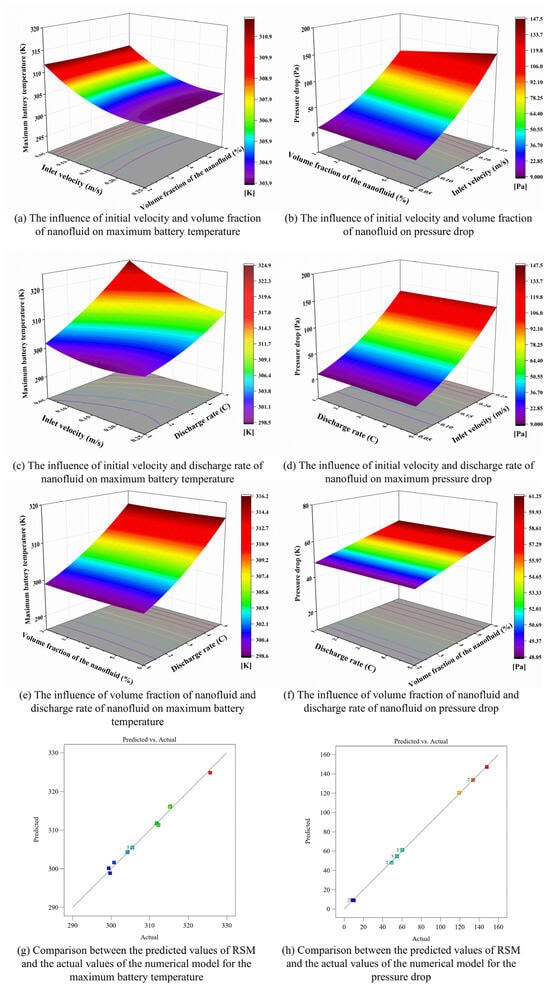
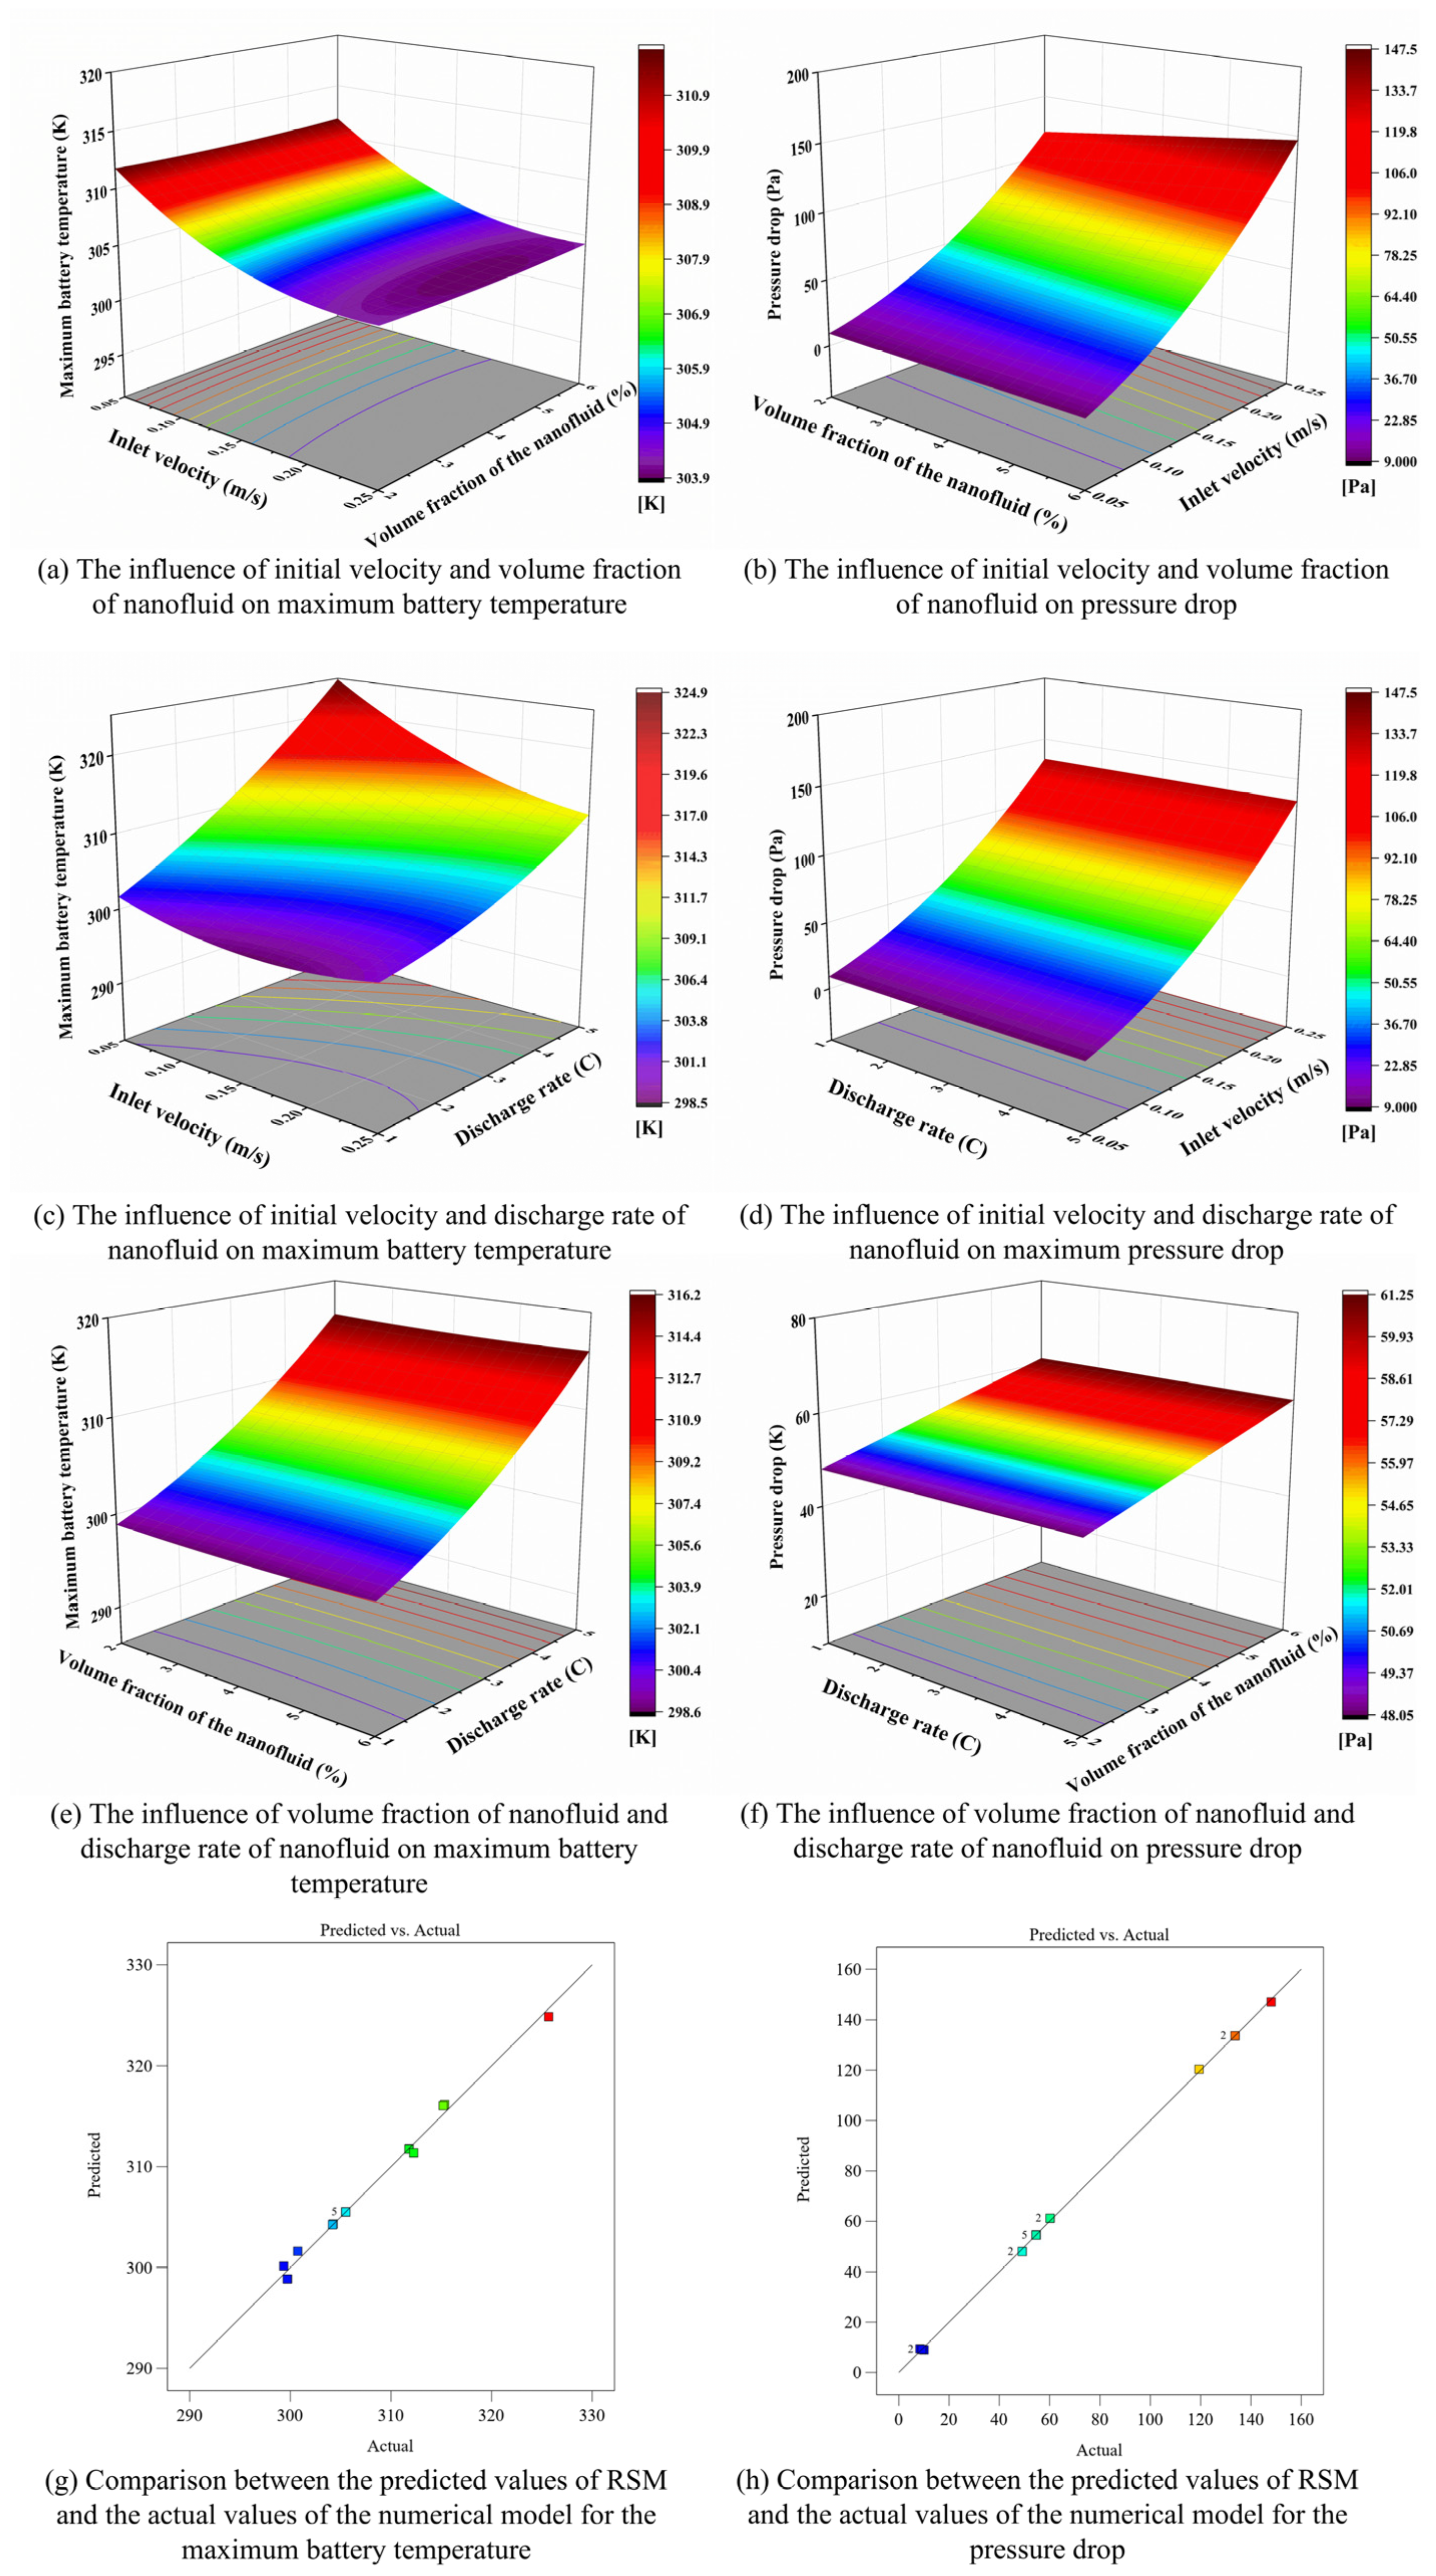
This section outlines the RSM-based optimization design, with the goal of minimizing both the peak battery temperature and the fluid pressure drop. The resulting outcomes are depicted in Figure 19a–h. In Figure 19g,h, a comparison is made between the response surface model’s predicted values and the numerical results obtained from earlier analyses. All data points lie closely along the predicted line, demonstrating strong consistency between the model’s forecasts and the computational results. This close alignment confirms that the RSM achieves satisfactory fitting performance and high predictive accuracy, thereby offering a dependable foundation for subsequent BTMS research and optimization. Figure 19a,b illustrates, respectively, how inlet velocity (A) and nanofluid volume fraction (B) affect the maximum battery temperature and the pressure drop. Raising the inlet velocity and the volume fraction leads to a modest reduction in the maximum battery temperature, because the associated improvement in thermal conductivity is limited and considerably less influential than the effect of velocity. Conversely, both factors cause a marked increase in pressure drop, with inlet velocity playing the dominant role. The increase in volume fraction only moderately elevates fluid viscosity, leading to a slight rise in frictional losses. Figure 19c,d present the effects of inlet velocity and discharge rate (C) on temperature and pressure drop, respectively. Figure 19c shows that increasing the inlet velocity or decreasing the discharge rate can effectively reduce the maximum battery temperature, with the discharge rate exerting a more significant influence. In contrast, Figure 19d illustrates that inlet velocity considerably affects the pressure drop, while the discharge rate has almost no effect. This is further verified by the fitting equation (Equation (16)), where the coefficient for discharge rate is close to zero, confirming its negligible contribution. Subsequently, Figure 19e,f illustrates the interaction between volume fraction of nanofluid and discharge rate on temperature and pressure drop, respectively. Figure 19e shows that the discharge rate acts as a dominant factor influencing temperature, whereas the effect of volume fraction is relatively weak. This is consistent with the fitting results from Equation (15), where the contributions of inlet velocity and discharge rate to temperature are far more significant than that of volume fraction. Meanwhile, Figure 19f indicates that both volume fraction and discharge rate exert only a mild influence on pressure drop, further verifying that pressure drop is mainly governed by inlet velocity. In summary, the grouped analysis demonstrates that inlet velocity is the most dominant factor influencing pressure drop, while discharge rate plays a decisive role in controlling the maximum battery temperature, and the effect of nanofluid volume fraction on both responses is relatively weak. The contribution order of each factor agrees well with the regression results of the fitting Equations (15) and (16), further validating the reliability and accuracy of the RSM model.
Figure 19.
Influence of nanofluid parameters on battery thermal performance and pressure drop, and validation of RSM model.
5.2. Multi-Objective Optimization Based on Non-Dominated Sorting Genetic Algorithm NSGA-II
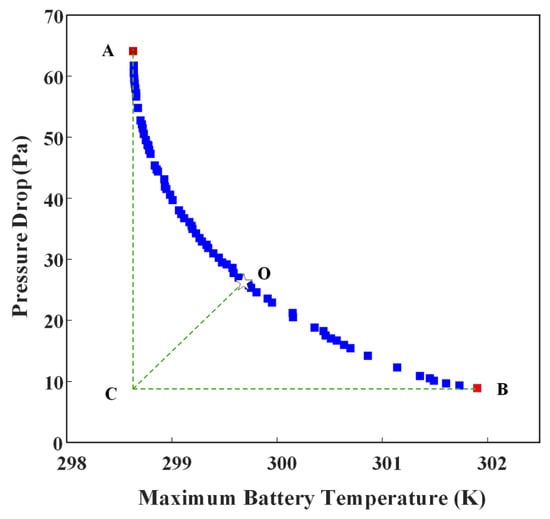
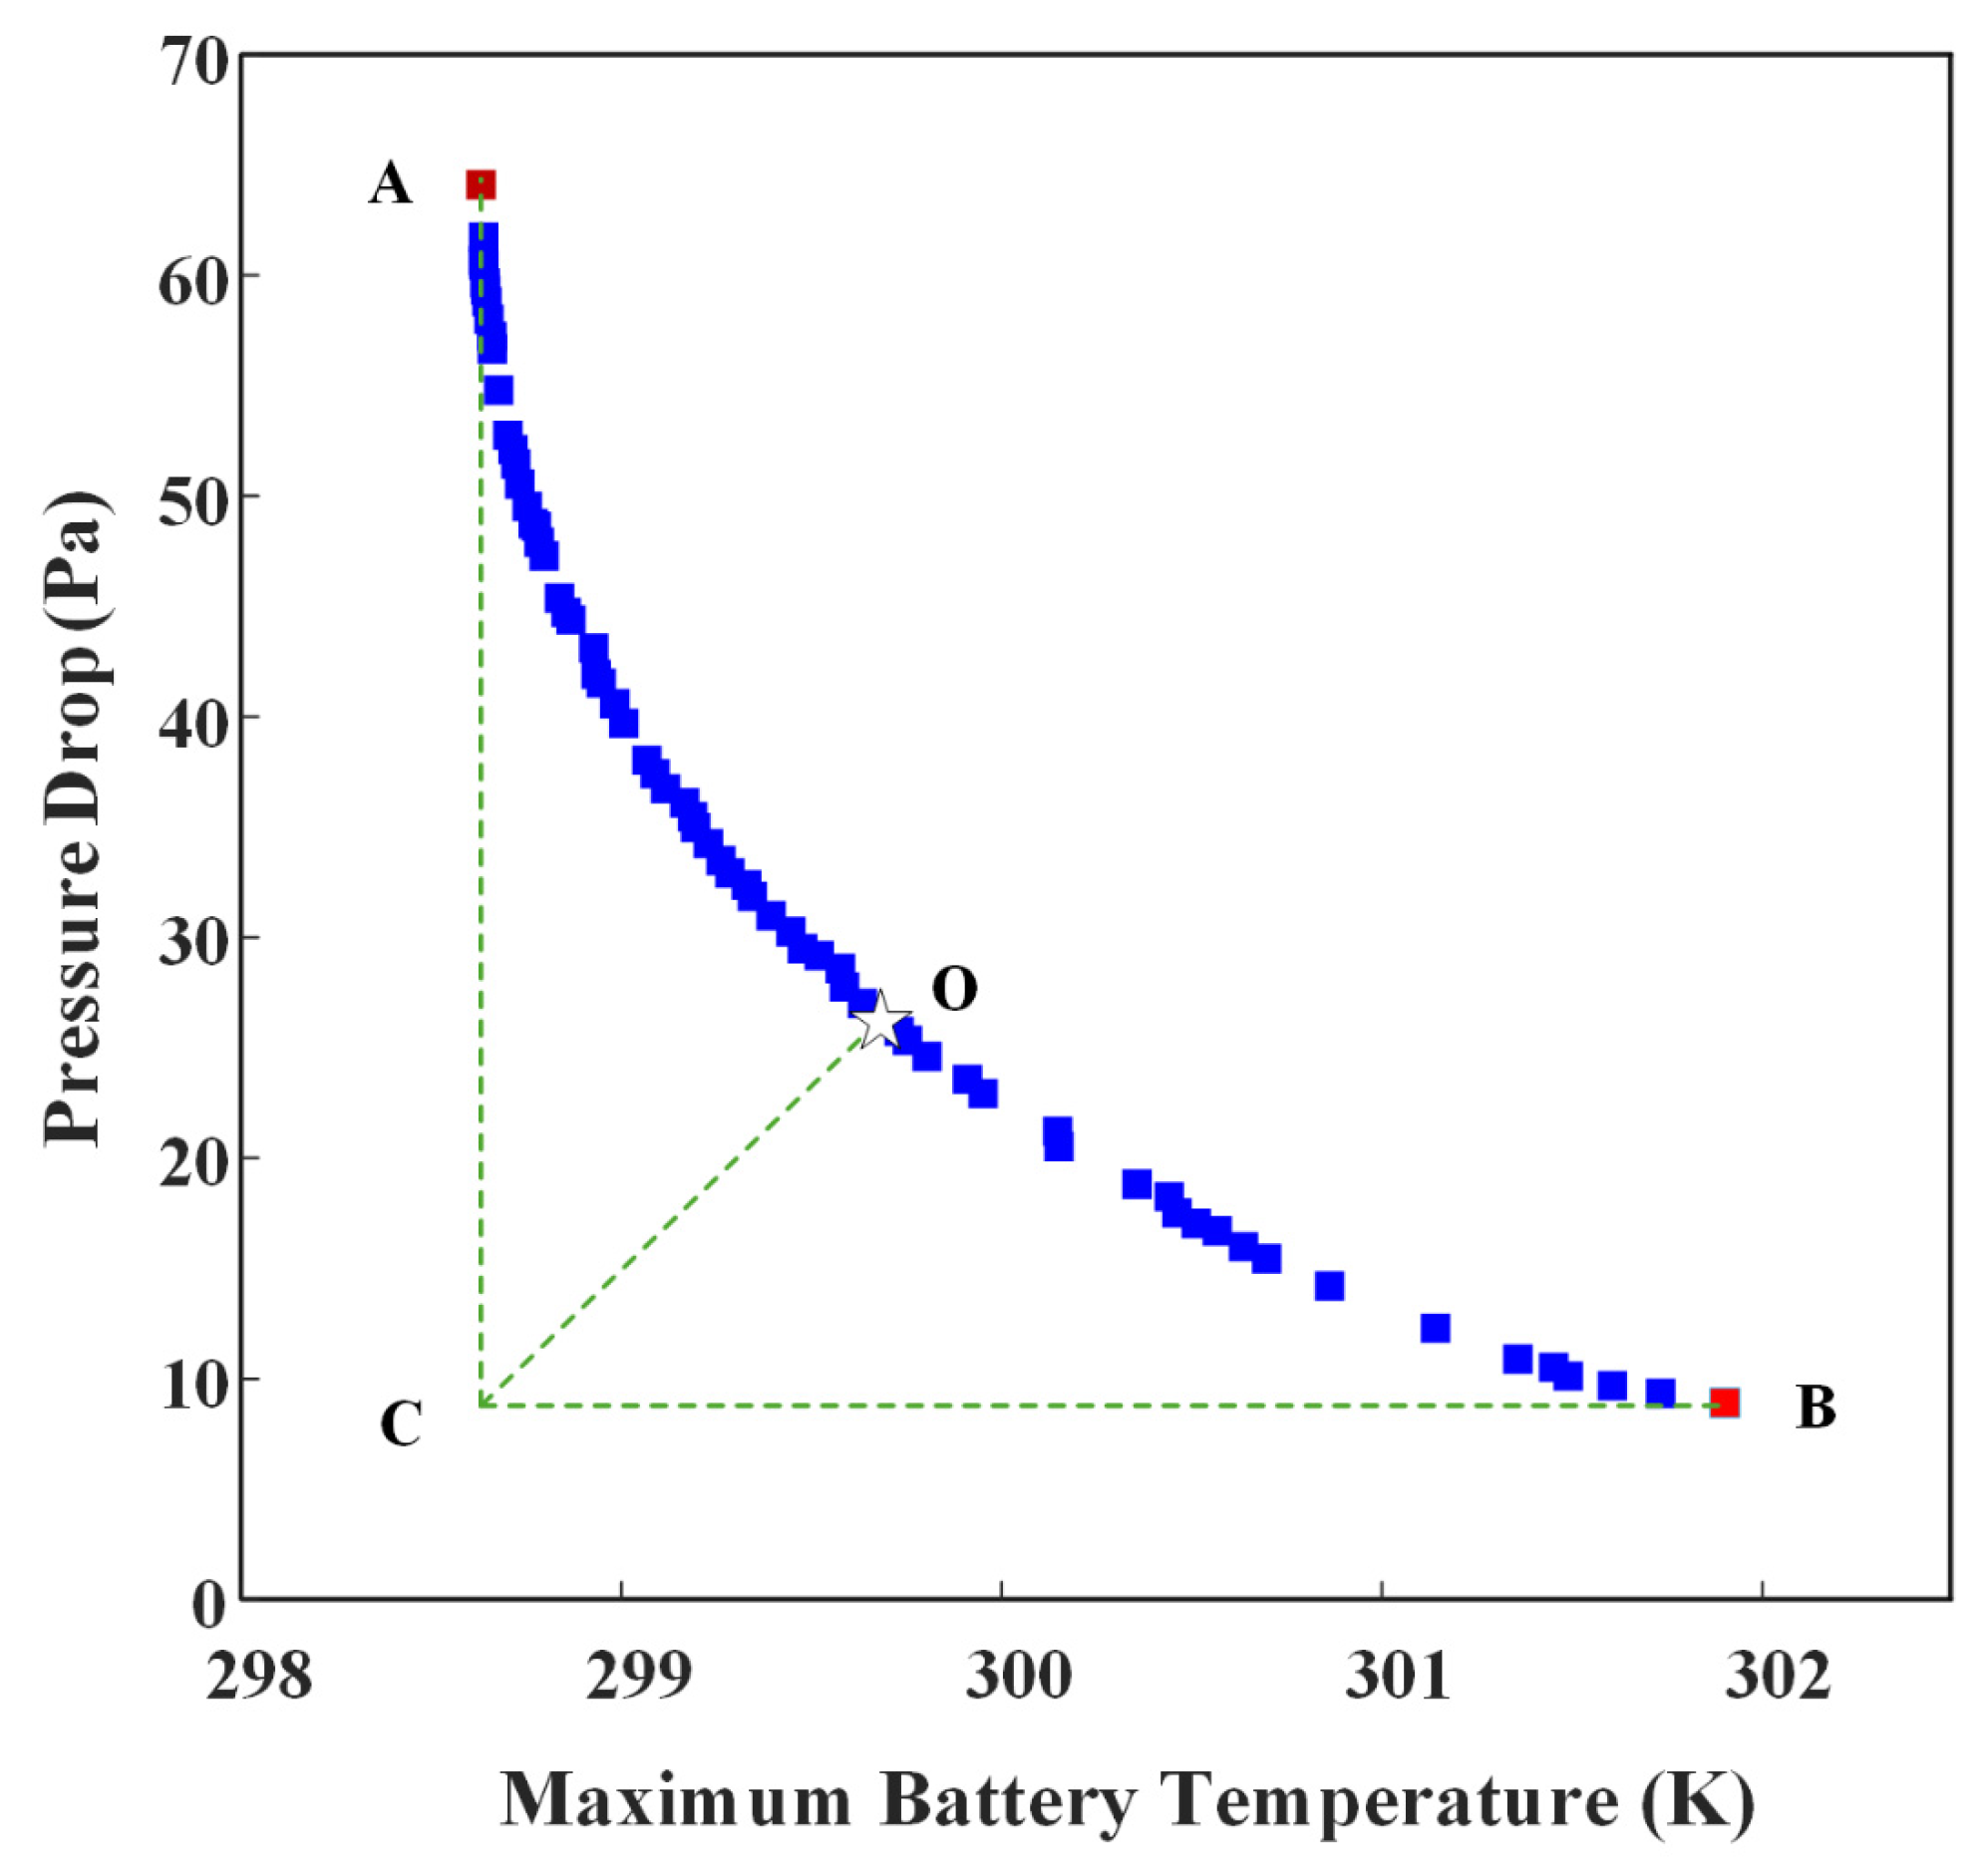
To accelerate convergence while maintaining solution diversity, the NSGA-II algorithm employs three key mechanisms: fast non-dominated sorting, crowding distance computation, and elitist preservation. Table 5 lists the principal parameters used in the present work. As illustrated in Figure 20, the Pareto front was derived from three decision variables: inlet flow velocity (ranging from 0.05 to 0.25 m/s), nanoparticle volume fraction (2–5%), and discharge rate (1 C–5 C). The optimization aimed to simultaneously minimize the peak battery temperature and the fluid pressure drop. Nevertheless, these two objectives are in conflict: a reduction in pressure drop generally leads to a higher maximum battery temperature. In Figure 20, point C denotes a theoretically ideal scenario, with a minimum temperature of 298.1 K and a pressure drop of just 8.91 Pa. However, this combination is unattainable in real applications. Therefore, point O—the closest feasible point along the Pareto front—was selected as the optimal compromise. At point O, the temperature equals 299.7 K, and the pressure drop equals 26.27 Pa, which corresponds to an inlet velocity of 0.097 m/s, a Cu–water nanofluid concentration of 3.85%, and a discharge rate of 1.03 C. It should be noted that the optimal discharge rate of 1.03 C lies near the lower bound of the investigated range (1 C–5 C) because the multi-objective optimization simultaneously minimizes the maximum battery temperature and pressure drop; a lower discharge rate generates less internal heat, which naturally reduces the battery temperature. Therefore, the Pareto-optimal solution tends to favor low discharge rates. For practical operation at higher discharge rates, the same methodology can be applied to obtain a separate set of optimal parameters. Finally, the solution was validated using Ansys Fluent, yielding minimal discrepancies: a temperature deviation of only 0.061% and a pressure drop difference of 0.029%.
Table 5.
The parameter settings of the algorithm.
Figure 20.
Pareto frontiers obtained by multi-objective optimization.
6. Conclusions
This study aimed to design and evaluate an advanced thermal management system for LiFePO4 batteries by numerical investigation on the synergistic effects of droplet-shaped microchannel turbulators and various nanofluids. The main conclusions are drawn as follows:
- (1)
- The novel droplet-shaped turbulator channel demonstrates superior thermal performance over the conventional straight channel, reducing the maximum battery temperature by 1.64 K under identical operating conditions. This improvement is primarily attributed to enhanced boundary-layer disruption and an increased heat-transfer surface area, which collectively intensify the convective heat transfer.
- (2)
- The type of nanoparticle significantly impacts cooling effectiveness. The overall cooling performance, from highest to lowest, is ranked as 6% Cu > 6% CuO > 6% Al2O3 > 6% SiO2 > pure water. This ranking directly correlates with the thermal conductivity of the nanoparticles. While the 6% Cu–water nanofluid provided the best thermal regulation, it also induced the highest pressure drop due to its increased density and viscosity.
- (3)
- The parametric study confirms that increasing the nanofluid volume fraction and inlet velocity lowers maximum battery temperatures, albeit at the expense of a higher pressure drop. Importantly, the proposed BTMS can stably maintain the battery temperature within the optimal operating range (20–40 °C) for all tested discharge rates (1 C to 5 C), which verifies its good robustness under different thermal load conditions.
- (4)
- By combining the RSM and the NSGA-II, an optimal balance between the thermal performance and pressure drop of the system was successfully achieved. The Pareto optimal solution corresponds to an inlet velocity of 0.097 m/s, a Cu–water nanofluid volume fraction of 3.85%, and a 1.03 C discharge rate. This configures the ratio, limits the maximum temperature to a safe value of 299.7 K, and the pressure drop to an energy-efficient value of 26.27 Pa.
Author Contributions
Conceptualization, H.L. and W.L.; data curation, H.L., W.L. and H.Q.; formal analysis, H.L., W.L. and H.Q.; funding acquisition, W.L.; Investigation, H.L., Y.Y. and Q.J.; methodology, H.L. and W.L.; project administration, W.L.; resources, W.L.; software, Y.Y., H.L., H.Q. and S.Y.; supervision, W.L.; validation, Y.Y., H.L., S.Y. and X.W.; visualization, Y.Y., H.L., S.Y. and X.W.; writing—original draft preparation, H.L. and W.L.; writing—review and editing, W.L.; project administration, W.L.; funding acquisition, W.L. All authors have read and agreed to the published version of the manuscript.
Funding
This research was funded by the Guangxi Natural Science Foundation (Grant No. 2026GXNSFDA00640017) and the National Natural Science Foundation of China (Grant No. 52066002).
Data Availability Statement
The data presented in this study are available on request to the authors and will not be made public due to privacy and ethical concerns.
Conflicts of Interest
We have no conflicts of interest to disclose.
Abbreviations
The following abbreviations are used in this manuscript:
| BTMS | Battery Thermal Management System |
| CFD | Computational Fluid Dynamics |
| RSM | Response Surface Method |
| NSGA-II | Non-dominated Sorting Genetic Algorithm II |
| PCM | Phase-change Material |
| BBD | Box–Behnken Design |
References
- Wang, J.; Azam, W. Natural resource scarcity, fossil fuel energy consumption, and total greenhouse gas emissions in top emitting countries. Geosci. Front. 2024, 15, 101757. [Google Scholar] [CrossRef] [Scilit]
- Liu, H.; Wei, Z.; He, W.; Zhao, J. Thermal issues about Li-ion batteries and recent progress in battery thermal management systems: A review. Energy Convers. Manag. 2017, 150, 304–330. [Google Scholar] [CrossRef] [Scilit]
- Shamshirband, M.; Salehi, J.; Gazijahani, F.S. Decentralized trading of plug-in electric vehicle aggregation agents for optimal energy management of smart renewable penetrated microgrids with the aim of CO2 emission reduction. J. Clean. Prod. 2018, 200, 622–640. [Google Scholar] [CrossRef] [Scilit]
- Duan, J.; Tang, X.; Dai, H.; Yang, Y.; Wu, W.; Wei, X.; Huang, Y. Building safe lithium-ion batteries for electric vehicles: A review. Electrochem. Energy Rev. 2020, 3, 1–42. [Google Scholar] [CrossRef] [Scilit]
- Wang, Q.; Ping, P.; Zhao, X.; Chu, G.; Sun, J.; Chen, C. Thermal runaway caused fire and explosion of lithium ion battery. J. Power Sources 2012, 208, 210–224. [Google Scholar] [CrossRef] [Scilit]
- Zhang, T.; Gao, C.; Gao, Q.; Wang, G.; Liu, M.; Guo, Y.; Xiao, C.; Yan, Y. Status and development of electric vehicle integrated thermal management from BTM to HVAC. Appl. Therm. Eng. 2015, 88, 398–409. [Google Scholar] [CrossRef] [Scilit]
- Zhao, L.; Li, W.; Wang, G.; Cheng, W.; Chen, M. A novel thermal management system for lithium-ion battery modules combining direct liquid-cooling with forced air-cooling. Appl. Therm. Eng. 2023, 232, 120992. [Google Scholar] [CrossRef] [Scilit]
- Chen, K.; Song, M.; Wei, W.; Wang, S. Design of the structure of battery pack in parallel air-cooled battery thermal management system for cooling efficiency improvement. Int. J. Heat Mass Transf. 2019, 132, 309–321. [Google Scholar] [CrossRef] [Scilit]
- Wei, W.; Luo, Z.; Qiao, S.; Zhai, J.; Lei, Z. Analysis and design of module-level liquid cooling system for rectangular Li-ion batteries. Int. J. Heat Mass Transf. 2024, 225, 125435. [Google Scholar] [CrossRef] [Scilit]
- Sarchami, A.; Najafi, M.; Imam, A.; Houshfar, E. Experimental study of thermal management system for cylindrical Li-ion battery pack based on nanofluid cooling and copper sheath. Int. J. Therm. Sci. 2022, 171, 107244. [Google Scholar] [CrossRef] [Scilit]
- Kong, W.; Zhu, K.; Lu, X.; Jin, J.; Ni, M. Enhancement of lithium-ion battery thermal management with the divergent-shaped channel cold plate. J. Energy Storage 2021, 42, 103027. [Google Scholar] [CrossRef] [Scilit]
- Li, W.; Li, A.; Yuen, A.C.Y.; Chen, Q.; Chen, T.B.Y.; Cordeiro, I.M.D.C.; Lin, P. Optimisation of PCM passive cooling efficiency on lithium-ion batteries based on coupled CFD and ANN techniques. Appl. Therm. Eng. 2025, 259, 124874. [Google Scholar] [CrossRef] [Scilit]
- Li, K.; Yao, X.; Li, Z.; Gao, T.; Zhang, W.; Liao, Z.; Ju, X.; Xu, C. Thermal management of Li-ion batteries with passive thermal regulators based on composite PCM materials. J. Energy Storage 2024, 89, 111661. [Google Scholar] [CrossRef] [Scilit]
- Xin, Q.; Xiao, J.; Yang, T.; Zhang, H.; Long, X. Thermal management of lithium-ion batteries under high ambient temperature and rapid discharging using composite PCM and liquid cooling. Appl. Therm. Eng. 2022, 210, 118230. [Google Scholar] [CrossRef] [Scilit]
- Zhu, F.; Wang, Y.; Xie, Y.; Chen, H.; Zhang, Y. Analysis on battery thermal management system based on flat heat pipe at high discharging rate. Appl. Therm. Eng. 2024, 254, 123798. [Google Scholar] [CrossRef] [Scilit]
- He, L.; Tang, X.; Luo, Q.; Liao, Y.; Luo, X.; Liu, J.; Ma, L.; Dong, D.; Gan, Y.; Li, Y. Structure optimization of a heat pipe-cooling battery thermal management system based on fuzzy grey relational analysis. Int. J. Heat Mass Transf. 2022, 182, 121924. [Google Scholar] [CrossRef] [Scilit]
- Ye, X.; Zhao, Y.; Quan, Z. Experimental study on heat dissipation for lithium-ion battery based on micro heat pipe array (MHPA). Appl. Therm. Eng. 2018, 130, 74–82. [Google Scholar] [CrossRef] [Scilit]
- Tang, Z.; Yu, P.; Li, M.; Tao, C.; Cheng, J. Thermal management characteristics of a novel cylindrical lithium-ion battery module using liquid cooling, phase change materials, and heat pipes. J. Energy Storage 2024, 99, 113350. [Google Scholar] [CrossRef] [Scilit]
- Mousavi, S.; Zadehkabir, A.; Siavashi, M.; Yang, X. An improved hybrid thermal management system for prismatic Li-ion batteries integrated with mini-channel and phase change materials. Appl. Energy 2023, 334, 120643. [Google Scholar] [CrossRef] [Scilit]
- Yuan, Q.; Xu, X.; Tong, G.; Ding, H. Effect of coupling phase change materials and heat pipe on performance enhancement of Li-ion battery thermal management system. Int. J. Energy Res. 2021, 45, 5399–5411. [Google Scholar] [CrossRef] [Scilit]
- Zhang, S.-B.; Nie, F.; Cheng, J.-P.; Yang, H.; Gao, Q. Optimizing the air flow pattern to improve the performance of the air-cooling lithium-ion battery pack. Appl. Therm. Eng. 2024, 236, 121486. [Google Scholar] [CrossRef] [Scilit]
- Kizilel, R.; Lateef, A.; Sabbah, R.; Farid, M.; Selman, J.; Al-Hallaj, S. Passive control of temperature excursion and uniformity in high-energy Li-ion battery packs at high current and ambient temperature. J. Power Sources 2008, 183, 370–375. [Google Scholar] [CrossRef] [Scilit]
- Zhao, R.; Gu, J.; Liu, J. An experimental study of heat pipe thermal management system with wet cooling method for lithium ion batteries. J. Power Sources 2015, 273, 1089–1097. [Google Scholar] [CrossRef] [Scilit]
- Chen, D.; Jiang, J.; Kim, G.-H.; Yang, C.; Pesaran, A. Comparison of different cooling methods for lithium ion battery cells. Appl. Therm. Eng. 2016, 94, 846–854. [Google Scholar] [CrossRef] [Scilit]
- Zhao, G.; Wang, X.; Negnevitsky, M.; Zhang, H. A review of air-cooling battery thermal management systems for electric and hybrid electric vehicles. J. Power Sources 2021, 501, 230001. [Google Scholar] [CrossRef] [Scilit]
- Patil, M.S.; Seo, J.-H.; Lee, M.-Y. A novel dielectric fluid immersion cooling technology for Li-ion battery thermal management. Energy Convers. Manag. 2021, 229, 113715. [Google Scholar] [CrossRef] [Scilit]
- Luo, M.; Cao, J.; Liu, N.; Zhang, Z.; Fang, X. Experimental and simulative investigations on a water immersion cooling system for cylindrical battery cells. Front. Energy Res. 2022, 10, 803882. [Google Scholar] [CrossRef] [Scilit]
- He, P.; Lu, H.; Fan, Y.; Ruan, H.; Wang, C.; Zhu, Y. Numerical investigation on a lithium-ion battery thermal management system utilizing a double-layered I-shaped channel liquid cooling plate exchanger. Int. J. Therm. Sci. 2023, 187, 108200. [Google Scholar] [CrossRef] [Scilit]
- Wang, N.; Li, C.; Li, W.; Chen, X.; Li, Y.; Qi, D. Heat dissipation optimization for a serpentine liquid cooling battery thermal management system: An application of surrogate assisted approach. J. Energy Storage 2021, 40, 102771. [Google Scholar] [CrossRef] [Scilit]
- Wang, Z.; Geng, X.; Zhou, Y.; Mao, N.; Sun, Y.; Huang, X.; Huang, A.; Hao, M.; Zhong, W. Experimental study of a turbulent topology-optimized cold plate for battery thermal management system. J. Energy Storage 2025, 130, 117426. [Google Scholar] [CrossRef] [Scilit]
- Yuan, L.; Zou, S.; Yang, Y.; Chen, S. Boundary-layer disruption and heat-transfer enhancement in convection turbulence by oscillating deformations of boundary. Phys. Rev. Lett. 2023, 130, 204001. [Google Scholar] [CrossRef] [Scilit]
- Zhao, C.; Sousa, A.C.; Jiang, F. Minimization of thermal non-uniformity in lithium-ion battery pack cooled by channeled liquid flow. Int. J. Heat Mass Transf. 2019, 129, 660–670. [Google Scholar] [CrossRef] [Scilit]
- Monika, K.; Datta, S.P. Comparative assessment among several channel designs with constant volume for cooling of pouch-type battery module. Energy Convers. Manag. 2022, 251, 114936. [Google Scholar] [CrossRef] [Scilit]
- Bhattad, A.; Sarkar, J.; Ghosh, P. Improving the performance of refrigeration systems by using nanofluids: A comprehensive review. Renew. Sustain. Energy Rev. 2018, 82, 3656–3669. [Google Scholar] [CrossRef] [Scilit]
- Liu, Q.; Liu, F.; Liu, S.; Wang, Y.; Panchal, S.; Fowler, M.; Fraser, R.; Yuan, J.; Zhao, J. Improved performance of Li-ion battery thermal management system by ternary hybrid nanofluid. J. Energy Storage 2025, 109, 115234. [Google Scholar]
- Yetik, O.; Yilmaz, N.; Karakoc, T.H. Computational modeling of a lithium-ion battery thermal management system with Al2O3-based nanofluids. Int. J. Energy Res. 2021, 45, 13851–13864. [Google Scholar] [CrossRef] [Scilit]
- Jilte, R.; Afzal, A.; Ağbulut, Ü.; Shaik, S.; Khan, S.A.; Linul, E.; Asif, M. Battery thermal management of a novel helical channeled cylindrical Li-ion battery with nanofluid and hybrid nanoparticle-enhanced phase change material. Int. J. Heat Mass Transf. 2023, 216, 124547. [Google Scholar]
- Ouyang, T.; Liu, B.; Wang, C.; Ye, J.; Liu, S. Novel hybrid thermal management system for preventing Li-ion battery thermal runaway using nanofluids cooling. Int. J. Heat Mass Transf. 2023, 201, 123652. [Google Scholar] [CrossRef] [Scilit]
- Li, X. Design and Optimization of Cooling Structure of Liquid Cooled Power Battery with Coupled Heat Pipe. Master’s Thesis, Chongqing Jiaotong University, Chongqing, China, 2024. [Google Scholar]
- Gowda, R.; Narendra, H.; Rangappa, D.; Prabhakar, R. Effect of nano-alumina on workability, compressive strength and residual strength at elevated temperature of Cement Mortar. Mater. Today Proc. 2017, 4, 12152–12156. [Google Scholar] [CrossRef] [Scilit]
- Mahian, O.; Kolsi, L.; Amani, M.; Estellé, P.; Ahmadi, G.; Kleinstreuer, C.; Marshall, J.S.; Siavashi, M.; Taylor, R.A.; Niazmand, H. Recent advances in modeling and simulation of nanofluid flows-Part I: Fundamentals and theory. Phys. Rep. 2019, 790, 1–48. [Google Scholar] [CrossRef] [Scilit]
- Amiribavandpour, P.; Shen, W.; Mu, D.; Kapoor, A. An improved theoretical electrochemical-thermal modelling of lithium-ion battery packs in electric vehicles. J. Power Sources 2015, 284, 328–338. [Google Scholar] [CrossRef] [Scilit]
- Pesaran, A.A.; Vlahinos, A.; Burch, S.D. Thermal Performance of EV and HEV Battery Modules and Packs; National Renewable Energy Laboratory: Golden, CO, USA, 1997.
- Zuo, W.; Zhang, Y.; Huang, Y.; Li, Q.; Zhou, K.; Zhang, G. Effects of multi-factors on performance of an improved multi-channel cold plate for thermal management of a prismatic LiFePO4 battery. Energy 2022, 261, 125384. [Google Scholar] [CrossRef] [Scilit]
- Pak, B.C.; Cho, Y.I. Hydrodynamic and heat transfer study of dispersed fluids with submicron metallic oxide particles. Exp. Heat Transf. Int. J. 1998, 11, 151–170. [Google Scholar] [CrossRef] [Scilit]
- Corcione, M. Empirical correlating equations for predicting the effective thermal conductivity and dynamic viscosity of nanofluids. Energy Convers. Manag. 2011, 52, 789–793. [Google Scholar] [CrossRef] [Scilit]
- Heris, S.Z.; Esfahany, M.N.; Etemad, S.G. Experimental investigation of convective heat transfer of Al2O3/water nanofluid in circular tube. Int. J. Heat Fluid Flow 2007, 28, 203–210. [Google Scholar] [CrossRef] [Scilit]
- Xie, C.C. Research on Thermal Performance of Battery Pack Based on the Coupling of Composite Phase Change Material and Liquid Cooling. Master’s Thesis, Chongqing Jiaotong University, Chongqing, China, 2021. [Google Scholar]

Disclaimer/Publisher’s Note: The statements, opinions and data contained in all publications are solely those of the individual author(s) and contributor(s) and not of MDPI and/or the editor(s). MDPI and/or the editor(s) disclaim responsibility for any injury to people or property resulting from any ideas, methods, instructions or products referred to in the content. |
© 2026 by the authors. Licensee MDPI, Basel, Switzerland. This article is an open access article distributed under the terms and conditions of the Creative Commons Attribution (CC BY) license.