


Abstract
To mitigate environmental impact, specifically the CO2 emissions associated with conventional thermal and nuclear facilities, renewable energy sources are increasingly being adopted as primary alternatives. However, integrating these renewable sources into the utility grid poses a significant challenge, primarily due to the stochastic and nonlinear nature of weather. Consequently, it is imperative that power systems operate under an intelligent control model to ensure energy output meets strict power quality standards. In this context, accurate forecasting is a cornerstone of smart power management, particularly in off-grid architectures, where predicting Power Quality Parameters (PQPs) is fundamental for system optimization and error correction. This study conducts a comprehensive comparative evaluation of nine different predictive architectures for estimating PQPs. The algorithms analyzed include , , , , , attention mechanisms, , , and . The central objective is to develop a reliable basis for the automated regulation and enhancement of electrical quality in isolated systems. The specific parameters investigated are power voltage (U), Voltage Total Harmonic Distortion (), Current Total Harmonic Distortion (), and short-term flicker severity (). Data for this investigation were acquired from an experimental off-grid setup at VSB-Technical University of Ostrava (VSB-TUO), Czech Republic. To assess model performance, we utilized root mean square error () as the primary accuracy metric, while simultaneously evaluating computational efficiency in terms of processing speed and memory consumption during testing.
1. Introduction
Community power energy is known worldwide and is sometimes called community energy systems or community-based energy. This term refers to energy production, distribution, and consumption approaches rooted in local communities’ cooperation and participation. Community energy uses sustainable and renewable resources not only to mitigate CO2 footprints but also to bolster operational efficiency and strengthen local energy autonomy and safety. Aspects such as local ownership, decision-making, and energy management are also crucial in community energy, which can benefit residents and businesses economically. The approach can also include energy efficiency and conservation programs in homes and businesses. Community energy has enormous potential to encompass photovoltaic (PV) and wind energy system technologies, hydrogen technologies, and electric vehicles with Vehicle-to-Grid (V2G) technology. Such decentralized energy frameworks have gained significant traction among regulators and industry experts, who view them as viable pathways for achieving a shift toward low-carbon infrastructure. Consequently, academic discourse has seen a surge in related terminology, giving rise to concepts variously labeled as energy communities, shared solar initiatives, or cooperative wind projects. However, a community of power energy projects faces several challenges, including technical, regulatory, financial, and social barriers. With growing interest in sustainable development and support from public policies and technological advances, community energy is becoming an increasingly important element of the energy mix in many countries, especially in the Czech Republic and other Central European countries [1,2].
One barrier to the widespread deployment of community energy is the difficulty of estimating the behavior of the small microgrids that comprise it. The fundamental problem is that most microgrids rely on PV power as their primary source of electricity. This type of plant generates electricity based on local weather conditions. It is, therefore, a source of electricity that supplies electricity in a highly stochastic manner.
To obtain quality power from renewable sources, the power system should be operated under a smart control model.
To build a smart model, one should consider two main parts: (1) power quality forecasting and (2) optimize and correct the quality of the power. First, the power quality parameters (PQPs) should be forecasted using weather conditions and power loads. In the second step, the predicted PQPs from the first part will be used to optimize the quality of the power. Therefore, the prediction of PQPs is a difficult part due to the nonlinearity of the weather condition; there are many studies focused on resolving this issue, but the improvement of the precision and reliability of the forecasting process is still required. As can be seen in Figure 1, which illustrates the diagram of a smart control model that can be used to operate an off-grid system.
Figure 1.
Diagram of a Smart Control Model.
There are large volumes of data for forecasting processes, such as solar wind power forecasting, power quality parameter forecasting, and power load forecasting. e.g., in [3] proposed a model for forecasting voltage total harmonic distortion () using a dataset collected by smart meters. The study tested some forecasting models, and the outcome shows that the autoregressive and feed-forward neural networks have better results than others in forecasting.
In the South African context, ref. [4] implemented a predictive framework to estimate fluctuations in caused by diverse renewable sources, such as wind, solar, hydro, and ocean energy. The methodology utilized moving window segmentation for feature extraction, followed by a Long Short-Term Memory (LSTM) deep learning network for the actual signal prediction. Their findings demonstrated that the LSTM architecture effectively forecasted with minimal error rates.
Alternatively, research by [5] developed a forecasting architecture utilizing Artificial Neural Networks (ANN) to predict Current Total Harmonic Distortion () originating from PV systems. The authors evaluated six distinct model configurations, varying the count of hidden layers and input features. Optimal performance was achieved with a specific configuration that employed two hidden layers and three input parameters.
In [6], the authors investigated six hybrid model variations integrating Artificial Neural Networks (ANN) with Adaptive Neuro-Fuzzy Inference Systems (ANFIS) to predict both voltage and current harmonics. Model efficacy was validated through a comparative analysis of their outputs. Furthermore, the study suggested replicating this methodology across diverse geographical locations to verify the reliability and robustness of the proposed designs.
Frequency, voltage, , and [7] assessed four distinct machine learning approaches—specifically, varying linear regression techniques, ensemble decision trees, and neural networks—for the purpose of predicting power quality. The target variables included power line frequency, voltage, and the total harmonic distortion for both voltage and current. When comparing computational efficiency and accuracy, the decision tree algorithms yielded precise predictions. Conversely, in terms of execution time, the neural network was the most computationally intensive, whereas the linear models were the fastest.
Comparative research in [8] evaluated four hybrid systems for power load forecasting, specifically pairing K-means and K-medoids clustering with either ANNs or Decision Trees. The methodology followed a three-stage process: clustering, distance measurement between samples and cluster centers, and the final forecasting phase. Performance evaluation relied on Mean Absolute Percentage Error (MAPE). The results indicated that the K-medoids algorithm integrated with ANN outperformed the others, achieving the lowest error rate of approximately 8%.
The authors of [9] proposed a novel demand power forecasting system rooted in Artificial Neural Networks (ANN), optimized via the Golden Ratio Optimization Method (GROM). When benchmarked against conventional ANN architectures, the proposed system demonstrated a significant performance enhancement, improving prediction accuracy by 41%.
Research presented in [10] conducted a comparative evaluation between Deep Neural Networks (DNN) and Recurrent Neural Networks (RNN) targeting power demand prediction. The validity of their proposed framework was assessed over forecasting horizons spanning both days and weeks, utilizing a historical dataset covering a four-year period.
A composite architecture utilizing multi-layer Bidirectional Recurrent Neural Networks—specifically integrating Long Short-Term Memory (LSTM) and Gated Recurrent Units (GRU)—was investigated in [11] for the purpose of power load estimation. The system underwent testing across two distinct datasets, with empirical results demonstrating its superiority over existing methodologies.
Reference [12] conducted a comparative assessment of two distinct architectures—the Back-Propagation (BP) neural network and the Elman neural network—for the purpose of short-term power load estimation. The outcomes of this investigation indicated that the Elman network performed better than the standard BP model.
Focusing on the power grid in Great Britain, ref. [13] utilized a Long Short-Term Memory (LSTM) framework to predict grid frequency fluctuations. By applying multiple performance metrics, the study validated the efficacy and reliability of the proposed approach.
In a Turkish case study [14], researchers implemented and contrasted two specific models, Long Short-Term Memory (LSTM) and Gated Recurrent Units (GRU), to forecast . The system inputs integrated active power, current harmonics, and calendar data. The findings revealed that the LSTM architecture provided higher accuracy, resulting in lower error rates than the GRU model.
Quantile Regression (QR) was deployed in [15] to predict short-term current harmonics. When tested on real-world data from a low-voltage power grid, the proposed method demonstrated a significant improvement in prediction accuracy, reducing errors by approximately 21%.
Ref. [16] introduced a hybrid methodology named “Mycielski-Markov” for solar generation forecasting. This architecture synthesizes the Mycielski signal processing algorithm with probabilistic Markov chains. The evaluation concluded that the system performed reliably, achieving a Coefficient of Determination () of approximately 0.87.
The integration of Genetic Algorithms with Support Vector Machines (GASVM) to predict short-term PV power output was investigated in [17]. Performance was assessed via Root Mean Square Error (RMSE) and Mean Absolute Percentage Error (MAPE), with results showing that the optimized GASVM surpassed the predictive capabilities of the standard SVM.
In the context of wind power in China, ref. [18] developed a composite model incorporating wavelet transforms, Deep Convolutional Neural Networks (CNNs), and ensemble methods. Verified against empirical wind farm data, the study demonstrated the model’s capacity to effectively capture and learn the inherent uncertainties within wind energy generation.
Finally, ref. [19] evaluated a deep learning approach utilizing Long Short-Term Memory (LSTM) algorithms for solar power forecasting. This method was benchmarked against a Multi-Layer Perceptron (MLP) network using criteria such as Mean Absolute Error (MAE), MAPE, RMSE, and R-Squared (). The conclusion highlighted the LSTM model’s superior predictive performance compared to the MLP in the context of solar energy.
Research conducted by [20] utilized a Nonlinear Autoregressive Neural Network (NAR) to predict reactive power fluctuations. The architecture underwent rigorous testing involving varying input vector dimensions and diverse neuron configurations within the hidden layer. Ultimately, the investigation substantiated the efficacy of this proposed model for accurately forecasting reactive power in electrical grid systems.
A hybrid architecture integrating Variational Mode Decomposition (VMD), Gated Recurrent Units (GRU), and Time Convolutional Networks (TCN) was investigated in [21] for short-term power load prediction. By benchmarking against established methods such as LSTM, Prophet, and XGBoost, the authors demonstrated the model’s reliability. Specifically, the proposed hybrid approach significantly enhanced precision, lowering forecasting errors to 36.20% and 10.8% across two distinct datasets.
The integration of K-means clustering with Support Vector Machines (SVM) for short-term load estimation was proposed in [22]. In this workflow, K-means was used to partition the dataset into two distinct clusters, which were then processed by the SVM for the final prediction. Empirical data indicate that this dual-stage system offers superior performance in both prediction accuracy and computational efficiency compared to conventional methodologies.
To refine the precision of short-term load forecasts, ref. [23] introduced a hybrid framework merging Convolutional Neural Networks (CNN), LSTM, and attention mechanisms. When applied to demand power prediction across two thermal power plants, this attention-enhanced model (CNN-LSTM-A) demonstrated a marked advantage over standard LSTM architectures. The study reported accuracy improvements of 7.3% and 5.7%, respectively.
In an Australian case study, ref. [24] developed a deep learning ensemble designed for wind power forecasting. The architecture comprised convolutional layers, GRU layers, and a fully connected neural network. The system’s efficacy was rigorously tested on two datasets against alternative models, including SVM, LSTM, ARIMA, and standalone GRU. Simulation results showed that this hybrid design yielded the most accurate predictions, reducing Mean Absolute Error (MAE) by up to 1.59% compared to the baselines.
In [25], a Multilayer Perceptron (MLP) Artificial Neural Network was employed to predict Total Harmonic Distortion () within power grids. The research involved an extensive optimization process, varying the input variables, hidden layer counts, and neuron density. The optimal configuration—utilizing two hidden layers with current, apparent power, reactive power, and active power as inputs—attained a peak correlation coefficient of 95.5%.
A study in [26] proposed a hybrid system for forecasting short-term power load. The model combined adaptive mode decomposition with improved support vector machines and a genetic algorithm to optimize the SVM weights. The system achieved an MAPE error of 1.78%, slightly better than others.
1.1. Research Gap and System-Level Novelty
While existing literature has extensively explored various machine learning (ML) and deep learning (DL) architectures for power load and harmonic forecasting [3,9], a significant research gap remains regarding the practical integration of these multi-parameter control frameworks.
First, most prior studies focus primarily on isolated accuracy metrics, such as Root Mean Square Error (RMSE), without evaluating computational trade-offs or defining how such predictions enable automated, proactive decision-making in resource-constrained off-grid architectures [10,11]. This lack of “operational context” often renders models unsuitable for deployment on low-power embedded microgrid controllers. Second, there is a lack of comprehensive benchmarking that compares classical ML models (e.g., DT, SVM, XGBoost) against modern DL architectures (e.g., BiLSTM, CNN-LSTM) specifically for high-frequency Power Quality Parameters (PQPs). Most research focuses on either load or frequency, neglecting the interconnected nature of voltage and harmonic distortion in residential settings.
This study addresses this gap by proposing a forecast-to-control integration framework. The primary novelty lies in the simultaneous benchmarking of nine architectures to serve as the “intelligence layer” for Smart Grid Control. In a practical operational use case, U, , , and to transition from reactive error correction to anticipatory regulation [20,21]. For instance, if high is predicted based on stochastic renewable generation and appliance states, the framework enables the hybrid inverter to preemptively adjust its operation or modulate battery discharge profiles [27,28]. This approach ensures microgrid stability and strict adherence to power quality standards before disturbances propagate, providing a scalable, resilient solution for decentralized energy communities [1,2]. Consequently, the core objective of this work is not only to model the behavior of energy parameters but also to validate their utility for proactive microgrid management within the Researcher’s Microgrid Platform (RMP) ecosystem [29].
This work addresses all three gaps through the following novel contributions:
- A unified multi-parameter benchmark is established, in which nine architectures spanning classical machine learning approaches (DT, SVM, XGBoost) and deep learning models (LSTM, GRU, DNN, CNN1D-LSTM, BiLSTM, Attention) are evaluated simultaneously across four interrelated power quality parameters (U, , , and ). All models operate under identical input features, preprocessing steps, and testing conditions, ensuring a rigorous and fair comparison.
- The analysis incorporates both prediction accuracy and computational efficiency, evaluating model performance not only by RMSE but also by inference time and memory consumption per sample. This dual-perspective assessment provides practical insights for deployment.
- The proposed framework integrates forecasting with control, with the benchmarked models serving as the intelligence layer of a Smart Grid Control architecture. This enables the system to evolve from reactive error correction toward anticipatory regulation based on predicted disturbances [20,28].
- All evaluated models are validated using real-world experimental data obtained from measurements at the RMP at VSB-TUO, representing an operational off-grid residential system. This ensures that the findings maintain strong practical relevance beyond purely simulation-based studies.
1.2. Operational Use Case
To explicitly connect the forecasting objective with practical microgrid operation, this subsection outlines the intended operational use case of the proposed benchmark. In the RMP off-grid architecture, the hybrid inverter serves as the central control unit responsible for maintaining power quality on the AC BUS within the limits prescribed by EN 50160 and IEC 61000 standards [27,28]. Under conventional reactive control, the inverter responds to power quality violations only after they are detected—introducing unavoidable correction latency that may temporarily exceed permissible distortion thresholds.
The forecasting framework proposed in this study enables a transition from reactive to anticipatory control. Specifically, at each one-minute time step t, the trained model ingests the current meteorological conditions (temperature, humidity, wind speed, dew point), the encoded appliance states, and the lagged output value to produce a one-step-ahead prediction of , , , and . These predictions are then evaluated against predefined operational thresholds prior to the actual disturbance occurring.
The resulting control actions may include several anticipatory strategies to maintain power quality and system stability.
- Battery discharge modulation can be applied in situations where an elevated is predicted due to an expected increase in non-linear appliance load, such as the activation of a microwave oven or lighting systems. In such cases, the inverter can proactively adjust the battery discharge profile to compensate for the anticipated harmonic injection [28].
- Voltage regulation pre-adjustment is triggered when a drop in voltage U below the nominal threshold of 230 V ± 3.
- Flicker mitigation scheduling can be implemented when an increase in the short-term flicker severity index is anticipated, typically as a result of rapid switching of electrical appliances. In this case, the controller enables load-shifting strategies, redistributing consumption to time intervals with lower predicted flicker levels.
This forecast-to-control pipeline directly addresses the operational deficiency identified in the research gap: the absence of an explicit link between PQP prediction and actionable microgrid management. The benchmark results reported in this study—evaluating nine architectures on accuracy, inference time, and memory consumption—are therefore interpreted not only as model performance metrics, but as deployment feasibility indicators for integration into the RMP control loop. Models that combine high predictive accuracy with low inference latency (e.g., DNN, GRU) are implemented within the Smart Grid Control framework illustrated in Figure 1.
1.3. Research Objectives and Article Organization
The core objective of this work is to accurately model the behavior of energy parameters within microgrids, thereby enabling proactive responses to potential system disturbances. Consequently, this article focuses on forecasting selected power quality parameters by systematically benchmarking nine predictive models. These models span classical machine learning approaches (DT, SVM, XGBoost) and advanced deep learning architectures (LSTM, GRU, DNN, CNN1D-LSTM, BiLSTM, and attention-based networks). Particular emphasis is placed on DT, SVM, and LSTM as representative baseline models for analyzing accuracy–complexity trade-offs. This research represents the initial phase of a broader investigation into predicting power quality for community energy systems. The present study employs a smaller-scale experimental architecture, the RMP at VSB-TUO, to validate and compare forecasting methodologies under controlled conditions. This approach allows for rigorous algorithm assessment and model refinement before scaling to more complex infrastructures. The subsequent phase of this research will extend the validated methodologies to the advanced facilities of the Centre for Energy and Environmental Technologies-Explorer (CEETe) at VSB-TUO. Figure 2 shows CEETe.
Figure 2.
CEETe—Community Energy Systems Research [29].
CEETe provides comprehensive research infrastructure encompassing four key areas: energy accumulation, transformation, and control; materials for energy and environmental technologies; utilization of secondary resources and alternative energy sources; and environmental aspects and technologies. This progression from pilot-scale testing to full-scale implementation within CEETe’s integrated research environment will enable comprehensive validation of forecasting models across diverse microgrid configurations and community energy architectures, ultimately contributing to the development of robust power quality management systems for decentralized energy communities [29].
The article is divided into seven sections. Section 1 introduces the main topic, the author’s motives and goals, and related previous studies. Section 2 describes the description of the experimental platform. Section 3 describes the mathematical description of the models used in this article. Section 4 explains the designed method. Section 5 presents the results of the study. Section 6 analyzes the results of the experiment, and Section 7 represents the conclusion of the article.
2. Platform Description
The research utilized the RMP, which simulates a standard residential household in the Czech Republic. All computational models and data processing procedures were implemented in MATLAB (MathWorks, Natick, MA, USA). The deep learning architectures (LSTM, GRU, BiLSTM, CNN1D-LSTM, and Attention-based models) were developed using the Deep Learning Toolbox, while classical machine learning models (Decision Tree, Support Vector Machine, and XGBoost) were implemented using the Statistics and Machine Learning Toolbox.
The experimental setup includes the following equipment: hybrid inverter Conext XW + 8548 (Schneider Electric, Rueil-Malmaison, France), PV inverter Xantrex XW MPPT 80 600 (Schneider Electric, Rueil-Malmaison, France), battery Hawker 12XFC115 (EnerSys, Arras, France), and power quality analyzer SMC 144 (KMB Systems, Prague, Czech Republic). The RMP is located on the VSB-TUO Campus. It operates in off-grid mode and connects to the distribution grid when energy is not available. The platform is being developed with links to smart grids and the energy sector. In this experiment, only the RMP component is included, but Figure 3 illustrates the overall concept of this technology.
Figure 3.
Scheme of an RMP infrastructure for a community energy system.
The location of renewable sources in the physical model of the microgrid is shown in Figure 4. The main energy source for the RMP is the electricity generated by the two-watt PV string and, if necessary, the distribution network. The RMP is an off-grid system based on a hybrid AC/DC BUS architecture. Located around a hybrid inverter, the infrastructure supports a rated power of 6.8 kW. The AC part is powered by a 230 V BUS, and the DC part is powered by a 48 V BUS. The main parameters of this hybrid inverter can be seen in Table 1, and the main parameters of the PV MPPT inverter can be seen in Table 2. Figure 5 Hybrid inverter Conext XW+ 8548 and PV inverters Xantrex XW 80 600 [30].
Figure 4.
Location of renewable sources in the physical model of the RMP.
Table 1.
Hybrid inverter Conext XW+ 8548 main parameters [27,28].
Table 2.
PV inverter Xantrex XW 80 600 parameters [28,31].
Figure 5.
Hybrid inverter Conext XW + 8548 and PV inverters Xantrex XW 80 600.
The RMP stationary batteries are shown in Figure 6. The battery type is Hawker 12XFC115, with a nominal voltage of 12 V and a nominal capacity of 115 Ah. The RMP storage batteries are connected in a serial-parallel configuration into four groups, each containing four batteries. Power Quality (PQ) measurements using the KMB SMC 144 PQ analyzer on the AC BUS. The data is stored on the server.
Figure 6.
RMP battery Hawker 12XFC115.
The main parameters of the RMP battery can be seen in Table 3. Table 4 shows a list of appliances used in the experiment.
Table 3.
RMP battery Hawker 12XFC115 parameters [28,32].
Table 4.
Table of appliances/home consumption [7].
3. Formal Methods
3.1. Support Vector Machine (SVM)
Support Vector Machines represent a category of supervised learning algorithms utilized for both categorical labeling and continuous value estimation. In a regression context, the algorithm identifies an optimal hyperplane that encompasses the maximum number of data points within a defined boundary, effectively capturing the underlying trends of the time-series data while bounding the prediction error [33,34,35]. In classification, the objective is to discover a hyperplane that effectively divides data points into distinct categories [34]. In regression, the goal is to identify a hyperplane that accurately captures the data with a wide margin surrounding it [35].
In the Support Vector Machine, the two most fundamental concepts are Margins and Support Vectors [36]: The ’margin’ is the distance between the hyperplane and the closest data points on either side (these are the support vectors). SVMs aim to maximize this margin, leading to better generalization.
Regarding SVM for regression (Support Vector Regression, SVR), it can be used as a time-series prediction model, as it finds the hyperplane that best fits the data points while minimizing error. Thus, it can handle non-linear relationships in the data and is therefore effective at capturing complex patterns in time-series data.
In this study, SVR will be used to predict continuous numeric values like power voltage, , , and .
- The goal of SVR is to create a function that can forecast a continuous target output, as well as maximize the margin between the forecasted and measured samples.
- SVR determines a margin around the forecasting line, while the objective is to create a line inside this margin, as well as minimizing the error between actual and predicted values.
- Data points that are very near the regression line are called support vectors, and these vectors have an important role in creating the regression approach.
Suppose the dataset for creating the model is as follows: input features () and the target output are ()
The main goal of SVR is to build a model (), that will forecast the target output (y).
The optimum fit of the SVR model can be via minimizing an amount of conditional to:
where , is the number of dataset points. As can be seen in Figure 7, more details about SVM can be found in [36].
Figure 7.
Support Vector Machine basic principle. The green and red points illustrate the data points that are used to construct the hyperplanes.
For the SVM model used in our paper, a Radial Basis Function (RBF) kernel was employed, as defined by:
The RBF kernel was selected over linear or polynomial alternatives because of its superior capacity to model the highly non-linear, stochastic interactions inherent in residential power quality parameters. The model was configured with standard hyperparameters (penalty parameter and ) to balance margin maximization and error minimization. In contrast, the deep learning architectures (LSTM, GRU, DNN) were trained on the original three-dimensional sequences to leverage the inherent temporal dependencies of the 1-min sampling interval. This dual-pipeline approach allows for a rigorous performance comparison between sequence-aware deep learning models and non-linear regression-based machine learning baselines. We adopt the same type of model for all four considered output problems.
3.2. Long Short-Term Memory (LSTM) Networks
Recurrent Neural Networks (RNNs) are a class of deep learning models widely used for tasks involving sequential data and time-series analysis. Their application spectrum is broad, encompassing natural language processing and speech recognition [37,38], as well as visual content interpretation such as image captioning [39,40,41,42] and video analytics [43,44]. Distinct from standard networks, RNNs are engineered to process sequences by establishing recurrent connections that effectively create an internal memory of antecedent inputs. This mnemonic capacity enables the system to accommodate input sequences of variable durations and to extract temporal dependencies embedded within the data. Consequently, in the realm of time-series forecasting, RNNs are capable of synthesizing historical data points to project future trends.
To address the “vanishing gradient” issue found in standard , the Long Short-Term Memory (LSTM) and Gate recurrent unit (GRU) cells utilize a gated architecture. These components—the input, forget, and output gates—regulate the flow of information, allowing the model to retain dependencies across extensive temporal sequences [45,46].
Between these two cells, LSTM is the most popular integrated cell in RNNs due to its ability to learn longer sequences with more complex patterns, whereas GRU is only suitable for short sequences with simple patterns. Since our research’s power quality parameters are signals with very long sequences and complex patterns, LSTM is the most suitable choice for our Deep learning approach experiment.
Structurally, an LSTM unit is defined by four core elements: a central Cell state and three regulatory mechanisms, known as gates (the Forget, Input, and Output gates) [47]. These gates function as sophisticated filters that modulate data flow. In theoretical terms, their specific roles are the following: the Input gate regulates the admission of new data into the memory cell; the Forget gate identifies and purges irrelevant information from the cell; and the Output gate dictates the final signal to be emitted by the LSTM unit.
To formalize the mathematical framework, we let X represent the sequential input data, while h and c denote the hidden state and cell state, respectively. The temporal notation uses to indicate the current time step and to represent the immediate predecessor. The learnable parameters are categorized into three sets corresponding to the gates: the forget gate parameters (), the input gate parameters (), and the output gate parameters (). These weight matrices and bias vectors are essential for preserving and transforming information derived from the previous hidden state [48]. Furthermore, and correspond to the sigmoid and hyperbolic tangent activation functions, respectively. The interaction between these three gates and their internal mechanisms is visually depicted in Figure 8 [47,48,49] below.
Figure 8.
A typical Long Short-Term Memory (LSTM) cell. The symbol (⊗) denotes element-wise multiplication, acting as a filter to regulate information flow; the symbol (⊕) denotes element-wise addition, representing the memory update process.
The Forget Gate: Represented by , this mechanism filters the cell state to remove irrelevant data. It employs a sigmoid function to output a value between 0 and 1; effectively, a value of 0 implies complete erasure of the previous information, while 1 signifies complete retention.
The Input Gate: Denoted as , this component regulates the extent to which new information is incorporated into the memory cell.
The Output Gate: Symbolized by , this gate controls the flow of information from the current cell state to the subsequent hidden state, filtering the internal data to determine the final output.
We define as the output of the layer within the input gate; this represents a vector of new candidate values that could potentially be added to the cell state. Furthermore, we denote the operator as the Hadamard product (element-wise multiplication) and as the hyperbolic tangent activation function. Consequently, the final cell state and the hidden state are computed via the following expressions:
Figure 9 depicts the comprehensive architecture of the LSTM framework developed for this study.
Figure 9.
The LSTM model used in this contribution.
Regarding the internal structure, the model incorporates a dual-layer LSTM configuration designed to identify temporal correlations within the training and testing sequences. Subsequently, two dense layers are employed to integrate these extracted features into a unified vector prior to the final output stage. The input tensor is defined with the dimensions (None, 1, 7); this indicates that the model processes sequences containing seven distinct input variables to generate a forecast for a single future time step.
To optimize the network parameters—specifically the weights and biases associated with the gates and cell states—the system utilizes forward and backward propagation algorithms. In the context of RNNs, the optimization technique is distinctively known as Backpropagation Through Time (BPTT). This method works by conceptually expanding the network’s structure across the temporal dimension to handle sequences, enabling weight updates at every time step. This contrasts with standard backpropagation typically found in spatial neural networks. BPTT is the critical mechanism that enables RNNs, and by extension LSTMs, to adjust parameters while preserving the sequential integrity of the input data. Further theoretical details regarding BPTT can be explored in [50].
To capture the temporal dependencies in the 1-min sampled power quality dataset, we implemented a sequential deep learning architecture composed of stacked Long Short-Term Memory (LSTM) layers followed by dense regression layers. The model is initialized with an input layer accepting a tensor of shape , corresponding to the batch size, the single-step look-back window, and the seven primary input features (meteorological data, appliance status, and lagged outputs). Figure 9 describes the structure of the LSTM model used in our paper.
The architecture is structured as follows:
- Recurrent Layers: The first layer utilizes 32 LSTM units with return_sequences = True, preserving the temporal sequence for the subsequent layer. The second LSTM layer contains 16 units with return_sequences = False, which compresses the temporal information into a single feature vector of dimension 16.
- Dense Layers: Following the recurrent units, two dense layers are employed to map the extracted temporal features to the target output. The first dense layer acts as a hidden feature integration layer with 8 neurons, utilizing the Rectified Linear Unit (ReLU) activation function to introduce non-linearity.
- Output Stage: The final dense layer consists of a single linear neuron, providing the continuous regression output for the power quality parameter (e.g., the or ).
- Optimizer: To optimize training stability, the model employs the RMSprop optimizer with a gradient clipping value of 1.0. The Mean Absolute Error (MAE) loss function is utilized to provide a robust objective measure during the training phase.
This configuration balances model depth with computational efficiency. By constraining the complexity of the dense layers , the model avoids overfitting on short-term transients while maintaining sufficient capacity to perform point-forecasting in the RMP environment.
3.3. The Gated Recurrent Unit (GRU)
An alternative architecture within the RNN family is the Gated Recurrent Unit (GRU). Designed as a streamlined evolution of the LSTM, the GRU effectively mitigates the vanishing gradient phenomenon common in traditional RNNs. Unlike the LSTM, the GRU operates without a distinct cell state and utilizes a simplified gating structure. This architectural efficiency enables the model to capture long-term temporal dependencies with reduced computational overhead.
The operational logic of the GRU is primarily governed by two specific control mechanisms: the update gate and the reset gate. The functional steps are detailed in [51,52] as follows:
- (1)
- Update Gate (): This component regulates the retention of historical data, determining the extent to which information from previous time steps is preserved for the future.
- (2)
- Reset Gate (): Functioning as a filter, this gate identifies which aspects of the previous information are irrelevant and should be discarded.
- (3)
- Candidate Activation (): This represents the provisional hidden state, encompassing new features extracted from the input and the reset-filtered history.
- (4)
- Final Memory at Time t (): The resulting hidden state is computed as a linear interpolation between the previous state and the new candidate activation.
The Gated Recurrent Unit (GRU) architecture was configured to provide an alternative to the LSTM for modeling sequential temporal dependencies. Its structural design mirrors the LSTM setup, using two stacked GRU layers to process the input tensor of shape , as shown in Figure 10.
Figure 10.
The GRU’s structure used in this paper.
The configuration is summarized as follows:
- Recurrent Layers: The first GRU layer consists of 32 units with return_sequences = True, maintaining the temporal dimensionality of the input data. The second GRU layer reduces the sequence to a 16-dimensional feature vector (return_sequences = False), thereby extracting salient temporal features from the input window.
- Dense Layers: Two subsequent dense layers (8 and 1 neurons, respectively) perform the final mapping, transforming the compressed feature space into a continuous regression estimate for the target PQP.
- Compilation: Similar to the LSTM model, the GRU model also applies the RMSprop optimizer with a gradient clipping value of 1.0, for a fair evaluation with the other models.
By using a simplified gating mechanism compared to the LSTM, the GRU architecture is investigated for its potential to reduce computational overhead while maintaining comparable forecasting precision for high-frequency microgrid transients.
3.4. The Structure of 1-Dimensional Convolutional Long Short-Term Memory Conv1D-LSTM
This hybrid architecture synergises the 1-Dimensional Convolutional (Conv1D) layer with the LSTM network. Initially, the Conv1D module applies convolutional filters to the input sequence to isolate local patterns and features. The resulting output effectively serves as a high-level feature map. Following this extraction phase, the data is forwarded to the LSTM layer, which analyzes the sequential feature maps to identify and learn long-term temporal dependencies. The computational process for this composite 1-Dimensional Convolutional Long Short-Term Memory (Conv1D-LSTM) model is bifurcated into two phases, calculated as follows [53,54,55]:
- (1)
- Compute 1D Convolution Operation:where: is the output of the convolution at time t, is the input sequence at time t, K is the size of the convolution kernel, is the weights of the convolution kernel, and b is the bias term.
- (2)
- Combine with the LSTM calculation: To combine Conv1D with LSTM, the Conv1D layer is applied to the input of the input sequence before passing the resulting feature maps to an LSTM layer. The equations then become:
Then, all the in equations from (2) to (7) will be replaced with to create the Conv1DLSTM as below. Notice that ∗ is the convolution operation between two parameters.
Input Gate:
Forget Gate:
Cell State Update:
Output Gate:
Hidden State Update:
The CNN1D extracts features from the input sequence, which the LSTM then processes to capture temporal dependencies in both dimensions.
The architecture is shown in Figure 11 and is configured as follows:
Figure 11.
The structure of ConvLSTM network used in our experiment.
- Convolutional-Recurrent Layer: The core of this model is the ConvLSTM1D layer, configured with 32 filters and a kernel size of 3. This layer uses ‘same’ padding to preserve the temporal dimensions of the input sequence while applying spatial filters to extract localized feature representations. The use of the ReLU activation function within the convolution ensures the capture of nonlinear signal variations.
- Feature Integration: By applying a 1D convolution over the time-series data, the model effectively learns “local” correlations between the weather variables and appliance states before these inputs are passed into the recurrent processing unit of the LSTM.
- Regression Head: Similar to the previous deep learning architectures, the output of the ConvLSTM1D layer is flattened and passed through two dense layers (with 8 and 1 neurons, respectively) to generate the final PQP forecast.
The inclusion of the ConvLSTM1D architecture is motivated by the hypothesis that Power Quality transients are not just temporal but also feature-dependent, where specific combinations of weather and appliance inputs trigger sudden shifts in harmonic distortion. The RMSprop optimizer with gradient clipping (1.0) is utilized to ensure training stability, similar to the above models.
3.5. The Bidirectional Long Short-Term Memory
In a Bidirectional Long Short-Term Memory (BiLSTM), two LSTM layers are created: one processes the input sequence from the start to the end (forward LSTM), and the other processes it from the end to the start (backward LSTM). The outputs from both layers are then concatenated or summed to form the final output. The computation of BiLSTM is described as [56,57,58]:
Let be the hidden state from the forward LSTM and be the hidden state from the backward LSTM. The final output at time t is given by:
where ⊕ represents the concatenation operation.
Putting it all together, the equations for a BiLSTM can be summarized as:
Forward LSTM:
Backward LSTM:
Final Output:
For this paper, the used architecture of the Bidirectional-LSTM, which is shown at Figure 12, is summarized as follows:
Figure 12.
The BiLSTM structure used within this paper.
- Bidirectional Recurrent Layers: The architecture employs two stacked Bidirectional wrappers surrounding LSTM layers. The first layer consists of 32 units, outputting a tensor of shape , effectively doubling the feature space compared to a standard LSTM due to the concatenated forward and backward hidden states. The second BiLSTM layer compresses these temporal features to 32 units, resulting in an output shape of .
- Feature Mapping: The extracted contextual information is passed to a dense layer with 8 neurons, serving as a bottleneck to integrate the bidirectional features.
- Final Regression: The output is mapped through a final linear dense layer to generate the PQP forecast.
The BiLSTM configuration is specifically designed to address scenarios where the internal relationships within the input vector—such as the correlation between weather conditions and appliance switching—may be better understood by analyzing the sequence bidirectionally. Similar to the other recurrent models, this architecture uses the RMSprop optimizer with gradient clipping (1.0) and Mean Absolute Error (MAE) loss to ensure robust convergence during the training process.
3.6. The RNNs with Attention Mechanism
In RNNs that use GRUs or LSTMs, attention mechanisms help these models focus on specific parts of the input sequence when generating outputs. The key functions of attention in RNNs are Dynamic Focus: Instead of processing the entire input sequence equally, attention allows the model to weigh the importance of different inputs at each time step, enabling it to focus on relevant information; Handling Long Sequences: Attention helps RNNs manage longer sequences more effectively by allowing them to bypass limitations related to memory and vanishing gradients, which can occur in standard RNNs; and Improved Performance: By selectively attending to relevant parts of the input, attention mechanisms can lead to better performance in tasks like translation, summarization, and image captioning. These functions help the RNNs to model complex dependencies in sequential data [59,60].
Given an input sequence of vectors , the RNN processes these vectors to produce hidden states . The RNN with attention layer’s work can be shortly described as follows [59,60,61]:
Calculating Attention Scores: For each hidden state (where t is the current time step), we calculate attention scores for each input :
The scoring function can be a simple dot product normalized, a feedforward neural network, or any other function that quantifies the relevance of –.
Softmax Normalization: The attention scores are then normalized using the softmax function to obtain the attention weights :
Context Vector: The context vector for the current time step t is computed as a weighted sum of the hidden states:
Output Generation: Finally, the context vector is used along with the hidden state to generate the output :
The model structured from the above theory is shown in Figure 13, which can be explained as follows:
Figure 13.
The used Attention model.
- Initial Feature Extraction: The process begins with a preliminary LSTM layer (32 units) that generates a hidden state representation .
- Attention Mechanism: A custom attention layer computes a score for each feature vector using a non-linear transformation: . These scores are passed through a Softmax function to obtain normalized attention weights , which are then applied to the input . This layer produces a “context-aware” vector that highlights the most critical input variables.
- BottleNeck Transformation: A RepeatVector layer is utilized to restructure the context-aware attention output for integration with subsequent recurrent layers.
- Recurrent Processing and Output: The focused context vector is processed by a secondary LSTM layer (16 units) and two dense layers (8 and 1 neurons) to generate the final PQP forecast.
By dynamically calculating attention weights, this model minimizes the influence of irrelevant or redundant data points, offering a significant advantage in handling the stochastic variability of residential energy consumption. Similar to previous configurations, the model is compiled using the RMSprop optimizer with a clipping value of 1.0 to ensure convergence during the training of the non-linear attention weights.
3.7. The Extreme Gradient Boosting XGBoost
Extreme Gradient Boosting (XGBoost) is rooted in the ensemble boosting methodology, which constructs a robust predictive model by aggregating multiple ‘weak’ learners, predominantly decision trees. The fundamental concept involves an iterative process, where new models are introduced to rectify residual errors left by preceding iterations. While the computational mechanics of XGBoost are intricate, the core algorithm can be summarized as follows [62,63,64]:
- (1)
- Objective Function: The primary optimization target in XGBoost is formulated as:In this context, L represents the cumulative loss, where n denotes the total sample count. The term l refers to the specific loss metric (such as Mean Squared Error), while and represent the predicted and actual values, respectively. Furthermore, K signifies the total count of trees, and denotes the regularization penalty applied to the k-th tree .
- (2)
- Regularization: To govern model complexity and mitigate overfitting, a regularization term is employed, defined by:Here, T corresponds to the leaf count within a tree, and represents the leaf weights. The parameter acts as the threshold for minimum loss reduction necessary to authorize a new split, while serves as the L2 regularization coefficient.
- (3)
- Gradient and Hessian: To optimize the learning trajectory, XGBoost leverages the first-order (gradient) and second-order (Hessian) derivatives of the loss function. The iterative update rule for predictions is expressed as:In this equation, represents the learning rate (shrinkage), and denotes the newly added tree structure at iteration t.
- (4)
- Tree Construction: The structural expansion of each tree is driven by maximizing the gain score, calculated via:Within this formula, and correspond to the first and second derivatives of the loss function for instance j. Additionally, L and R identify the instance sets assigned to the left and right child nodes following a split.
For the model used within our paper, to maximize the predictive performance of the XGBoost regressor, a Grid Search with 5-fold Cross-Validation (CV) was employed. This systematic optimization evaluated the parameter space (max_depth , n_estimators, and learning_rate). The process identified the optimal configuration as learning_rate = 0.01, max_depth = 20, and n_estimators = 500, which minimized the objective RMSE. This automated tuning ensures that the ensemble baseline provides a highly competitive benchmark against the deep learning models.
3.8. Regression Decision Tree
A decision tree (DT) is one of the machine learning tools that has been applied successfully for classification and regression applications [65,66]. The three components of a decision tree are: Internal Nodes: Represent tests or questions on features (attributes) of your data. Branches: Represent the possible outcomes of each test. Leaf Nodes: Represent the final classification or prediction (i.e., the answers).
A regression decision tree creates a regression model in a tree mode. The process divides a dataset into small subsets with an associated decision, and these subsets will be split further into other small subsets until the final step. The results will be a tree structure consisting of decision nodes and leaf nodes. A decision node will split the sample into two or more branches, and a leaf node has one numerical decision.
Learning Process: Decision trees are built by recursively splitting the data based on features that best separate the different classes or reduce prediction error [67]. In classification, the Gini Impurity, a measure of the homogeneity of the nodes, will be used to find the features that separate the data best [68]. In regression, instead, Decision trees typically use metrics like mean squared error or variance reduction to make splitting decisions [69]. Regarding the regression task, to avoid the complexity and the unnecessary long explanation, the learning process can be briefly described as [67]:
- Root Node: As before, the entire dataset starts at the root.
- Splitting Criteria: regression Decision trees generally use variance reduction. This algorithm looks to minimize the variance of the target variable within each node in order to choose the split that leads to the greatest reduction in the variance of the target variable within the subsets. By choosing splits that result in the largest reduction in variance, the algorithm aims to create homogeneous subsets that lead to more accurate predictions. The variance reduction can be illustrated as:where: S is the subset of data. N is the number of instances in the subset. is the target value of instance i. is the mean target value in the subset.
- Recursive Partitioning: After the initial split, each subset is further divided into smaller subsets using the same splitting criteria. This process continues recursively until a stopping criterion is met, such as reaching a maximum tree depth or a minimum number of samples in a node. Steps 2 and 3 are repeated on each newly formed subset.
- Prediction: Finally, to make predictions on new data points, the input features are passed down the tree, and the average target value of the corresponding leaf node is used as the predicted output. When a stopping criterion is met, leaf nodes are created. Instead of assigning a class, each leaf node predicts the average target value of the training data points within that node.
Based on the above theory. The configuration for the DT regressor within our paper is defined by:
- Recursive Partitioning: The model utilizes a max_depth parameter of 30, allowing the tree to capture complex, non-linear interactions within the feature set. This depth is chosen to provide sufficient granularity in mapping meteorological inputs and appliance states to target PQP values.
- Determinism: To ensure the reproducibility of the benchmarking results, the random_state parameter is set to 1. This keeps the splitting process consistent across the different target variables ().
- Input Processing: Similar to the SVR model, the DT input data was preprocessed using np.squeeze to convert the temporal sequences into a two-dimensional feature matrix , facilitating an efficient, non-parametric regression approach.
At this point, it is necessary to summarize the noticeable settings of all the methods for better understanding. The configurations of the predictive models are summarized in Table 5:
Table 5.
Hyperparameter configurations for the predictive models.
This comprehensive setup allows for a rigorous benchmarking of deep learning and machine learning architectures, ensuring that the parameters used for each model are optimized for the high-frequency stochastic data generated by the microgrid. To ensure methodological transparency, we categorized the models into two distinct paradigms:
- Deep Learning Architectures: These models utilize adaptive recurrent or convolutional mechanisms to capture temporal and spatio-temporal dependencies within the time-series data. The model weights are optimized dynamically via the RMSprop optimizer using the Mean Absolute Error (MAE) loss function.
- Classical Machine Learning Baselines: These models, including the Decision Tree, SVR, and XGBoost, are deployed as non-parametric regression baselines. While the XGBoost model underwent systematic hyperparameter tuning using Grid Search to establish a competitive performance ceiling, the Decision Tree and SVR were configured with fixed complexity settings to serve as high-granularity benchmarks for evaluating the impact of depth and kernel density.
To ensure a robust and unbiased comparison across the nine predictive architectures, all models were evaluated under identical experimental conditions. The input features, preprocessing pipeline, and forecasting horizon were standardized across the entire ensemble.
Specifically, the forecasting configuration was constrained to a single-step look-back window () and a single-step forecast horizon (). This standardization serves a critical experimental purpose: while recurrent architectures (e.g., LSTM, GRU, Conv1D-LSTM, BiLSTM) are natively capable of processing long-range temporal sequences and multi-step forecasting, classical machine learning baselines such as the Decision Tree, SVM, and DNN are restricted to mapping immediate input-output relationships. By aligning all models to the same minimum temporal window, we ensure that the performance evaluation reflects the predictive power of the model architecture itself, rather than the ability to ingest a larger feature space. This “baseline-parity” approach prevents potential bias towards complex recurrent models and guarantees that the benchmarking results provide a fair assessment of each model’s inherent capacity for real-time tracking in the RMP environment.
Because of the use of a single-step prediction in the future, it is natural that there are no later time steps for recursion occur; hence, the just and only way to approach the problem is through Teacher Forcing (ground truth) for every single step, which is a one-step-ahead rolling prediction, rather than a recursive multi-step prediction.
4. Proposed Model
The study compared the performance of nine forecasting models: LSTM, GRU, DNN, CNN1DLSTM, B1LSTM, Attention, DT, SVM, and XGBOOST to forecasting four types of PQPs, these parameters are power voltage (U), total harmonic distortion of voltage (), total harmonic distortion of current (), and short-term flicker severity (). All models were evaluated using identical input features and prediction horizons to ensure a fair comparison across different power quality parameters.
4.1. Dataset, Data Preprocessing and Forecasting Configuration
The dataset utilized in this study consists of time-series measurements acquired at a one-minute sampling interval from the off-grid RMP at VSB-TUO. This high-resolution temporal scale is specifically justified by the need to capture rapid fluctuations in Power Quality Parameters (PQPs) caused by the stochastic nature of renewable generation and the transient switching states of residential appliances, as documented in similar high-frequency monitoring studies [3,7].
For the forecasting methodology, the study defines a single-step input window size () and a short-term forecast horizon of one minute (). This means the models utilize measured features from time t to predict the state at time . The evaluation follows a rolling prediction approach across the test days of 21–23 January 2023, where the model predicts the subsequent minute and is then updated with the actual measured ground truth for the next iteration. This approach serves a dual experimental purpose. First, it is a technique widely recognized in short-term load and power quality forecasting for ensuring models are assessed on their ability to provide real-time tracking and error correction within a continuous 24-h operational cycle [9,14]. Second, it enforces “baseline-parity” across the diverse predictive architectures. While recurrent architectures (e.g., LSTM, GRU, Conv1D-LSTM, BiLSTM) are natively capable of processing extended temporal sequences, classical machine learning baselines (DT, SVM, DNN) are restricted to immediate input-output mappings. By constraining all models to a minimal temporal window (), we ensure an unbiased evaluation where performance variance is attributed to the model’s architectural capacity rather than the ability to ingest a larger feature space. This standardized framework guarantees that our benchmarking results provide a fair, objective assessment of each model’s inherent capacity for real-time microgrid monitoring.
For the Methodology, we proceeded with data Partitioning and Validation Strategy to ensure the robustness and temporal integrity of the predictive model. The dataset was partitioned into training and validation subsets using a chronological splitting approach. This method prevents ‘look-ahead bias’ by ensuring the model is evaluated on data that succeeds the training window:
- Training Set: Data spanning from 1 January 2023 to 20 January 2023 23:59:00 was utilized for model development. This subset comprises 28,800 samples, representing approximately 64.5% of the total available observations.
- For testing, we used the set of 3 datasets of the collected within 3 separate days 21st, 22nd, 23rd to be the testing set for all the algorithms.
The test period of 21–23 January 2023 was selected on the basis of three criteria. First, these days represent typical winter operating conditions for RMP in the Czech Republic, characterized by low ambient temperatures, reduced and intermittent photovoltaic generation, and elevated household appliance usage—conditions that maximize the stochastic variability of the target PQPs and thus constitute a demanding evaluation scenario. Second, complete and gap-free synchronized recordings of both the power and meteorological datasets were available for this period, satisfying the data integrity requirements of the rolling prediction protocol. Third, the three consecutive days provide sufficient temporal diversity—including day-to-day variation in irradiance and load profiles—to assess model generalization beyond a single operating condition, while remaining computationally tractable for a nine-model benchmark.
The dataset consists of two parts: The power dataset and the weather dataset. The dataset was available for every one-minute time step and provided from the off-grid system at VSB-TUO, the power dataset included the current consumption of home appliances and the status of the battery, U, , , and while the weather dataset included weather conditions: air temperature, dew point, Humidity, air pressure, and wind speed.
To ensure methodological transparency and model convergence, a multi-stage preprocessing pipeline was implemented. Data synchronization was maintained via the native one-minute timestamps provided by the RMP monitoring system [28]. First, to reduce input dimensionality while preserving behavioral patterns, the binary states of the four primary household appliances (AC, Lights, Fridge, and TV) were transformed into a single decimal “Status” variable using a binary-to-decimal conversion function. This feature engineering approach is effective for capturing appliance-driven load dependencies in residential microgrids [8]. Second, all numerical features, including meteorological data and the calculated status variable, were normalized using Min-Max Scaling, a standard procedure to stabilize gradient descent in neural network architectures [10,11].
For a more specific and understandable explanation, a brief presentation of the preprocessing results can be shown as follows:
- Data Synchronisation: The dataset was verified for temporal continuity. Analysis of the time-series index revealed a consistent sampling frequency of 1 min () across all 44,639 records, ensuring no synchronization gaps between meteorological features and electrical grid parameters. As illustrated in Figure 14, the multi-panel overlay of exogenous weather inputs and load statuses against grid metrics confirms that every signal, regardless of its physical domain, aligns perfectly at each discrete time step. This eliminates phase-shift errors and maintains strict consistency between internal variables and external outputs.
- Missing Data Treatment: A comprehensive null-value scan was performed across all input features. The results confirmed a complete dataset with 0% missing values, precluding the need for interpolation or imputation techniques. Figure 15 shows a heat chart of data points availability across the main categories of consideration.
- Normalization: To accelerate gradient descent convergence and prevent features with larger magnitudes from dominating the loss function, all variables were scaled to the range using Min-Max Normalization as shown in Figure 16, defined as:
- Outlier Handling: Statistical outlier detection was conducted using the Interquartile Range (IQR) method with a threshold. While the voltage () and harmonic distortion () displayed high stability, the flicker intensity () exhibited transient peaks. These were intentionally preserved in the training set to allow the recurrent model to learn the physical dynamics of sudden load switching and grid disturbances; hence, they are treated as normal data points instead of outliers. Figure 17 illustrates the outlier detection results in the process.
Figure 14.
Global synchronization of target PQPs (blue) against scaled input features. The figure illustrates the temporal alignment of input variables (appliance states and weather) with the corresponding output responses.
Figure 15.
The heatmap of variable appearance between each parameter inside the data we used. The plain purple covering all the map shows there is no missing data.
Figure 16.
Normalization applied to the four considered parameters. The blue lines indicate the raw parameters’ signals before being normalized, and the red lines represent the corresponding signals after being normalized between the range 0 and 1.
Figure 17.
The Statistical Outlier Analysis for Main Grid Parameters using the IQR Method. The outliers in were purposely kept to illustrate the flicker in power quality datasets due to motor starts or sudden load changes to ensure the models can handle the real-world fluctuation.
4.2. Experiment Setup
The experiments were carried out using the following input variables: air temperature, Dew Point, Humidity, air pressure, wind speed, previous value of the output, and states (on = 1, off = 0) of the 4 types of home appliances (AC heating, Lights, Fridge, TV). The states of home appliances (0 or 1) were converted into an equivalent decimal number, e.g., the device states 0 0 0 0 converted into the equivalent decimal no. 0 and 1 1 1 1 converted into 15, and likewise for the rest of the cases [30]. This encoding was adopted to reduce input dimensionality; however, all models were evaluated consistently using the same representation to ensure a fair comparison. The previous value of the output is the mean one step back of the output used with input variables, e.g., in the voltage forecasting model for forecasting voltage at the time step t () with mentioned weather conditions and statutes of home appliances at the same time step t will add the previous value of the voltage (), as can be seen in the scheme of the proposed model in Figure 18, and variables description in Table 6.
Figure 18.
Scheme of the Proposed Model.
Table 6.
Input and output variables used in this study.
The dataset of days from 1 to 20 January 2023 is used for training the models, while the dataset of days 21, 22, 23 of January 2023 are used for testing the models. The dataset used has some limitations:
- the dataset was collected from one location that has the weather conditions and home appliances specialized with the Czech Republic.
- it was difficult to record the dataset for the whole year; therefore, another issue is that the data were available only for a specific season.
- the model should train with all the weather diversity of a whole year; however, the available dataset did not cover all seasonal variations and weather diversity.
5. Numerical Results
The Root Mean Square Error (RMSE), mean absolute percentage error (MAPE), and the R-squared () were calculated during the experiments, as can be seen in Table 7, Table 8, Table 9 and Table 10.
Table 7.
The average of forecasting results (RMSE, MAPE, and ) of power voltage U on days 21, 22, 23 of January 2023.
Table 8.
The average of forecasting results (RMSE, MAPE, and ) of on days 21, 22, and 23 of January 2023.
Table 9.
The average of forecasting results (RMSE, MAPE, and ) of on days 21, 22, and 23 of January 2023.
Table 10.
The average of forecasting results (RMSE, MAPE, and ) of on days 21, 22, and 23 of January 2023.
In this study, the root mean square error (RMSE), has been used to evaluate the tested models and compare their performance as in (35),
where m, and r are the measured and model result values, respectively, n size of the data sample.
The forecasting results can be seen in Table 7, Table 8, Table 9 and Table 10, which showed the average of RMSE, MAPE, and achieved by tested models of days 21, 22, and 23 of January 2023, for forecasting U, , and , respectively.
When the experiments ran, the computational complexity (execution time and memory usage) for testing one sample was calculated in the testing phase for forecasting each parameter, as can be seen in Table 11.
Table 11.
Computational Complexity: computation time (seconds) and Memory (KB).
Uncertainty Analysis and Prediction Intervals
To address the requirement for a probabilistic evaluation of the forecasting models, this study calculates the 95% Prediction Intervals (PI) for each predicted parameter. While the RMSE provides a point estimate of the average error, the PI quantifies the uncertainty of the forecasts by defining a range within which the actual measured value is expected to fall at a specified confidence level. Assuming a normal distribution of the residuals, the 95% Prediction Interval is defined as:
where represents the forecasted value and 1.96 is the coverage factor for the 95% confidence level. In the context of the updated Table 12, Table 13, Table 14 and Table 15 the column “Avg. PI (95%)” represents the operational safety buffer for each architecture. For instance, the Attention model’s narrow interval of for indicates a high degree of predictive reliability, whereas the larger intervals for baseline models like SVM () highlight significant uncertainty in capturing high-frequency transients.
Table 12.
The Forecasting results of power voltage on days 21, 22, and 23 of January 2023.
Table 13.
The Forecasting results of on days 21, 22, and 23 of January 2023.
Table 14.
The Forecasting results of on days 21, 22, and 23 of January 2023.
Table 15.
The Forecasting results of on days 21, 22, and 23 of January 2023.
6. Discussion
6.1. Forecasting Error
Root-mean-square deviation (RMSE) was used to evaluate and compare forecasting models’ performance.
The performance of the forecasting designed models was analyzed and compared as follows:
- Power Voltage: The forecasting error of power voltage ranges from 0.16 to 1.71. As shown in Figure 19, good predicting accuracy for power voltage was observed in the , , and models, followed by the and architectures.
- : The RMSE of was verified between 0.1999 and 0.6337. Figure 20 shows the RMSE error of , when comparing the results, the smallest forecasting error was obtained from DNN, B1LSTM, Attention, LSTM, GRU, and then CNN1DLSTM. While xGBOOST, DT, and SVM achieved the biggest errors.
- : The performance of GRU, LSTM, CNN1DLSTM, DNN, Attention, and B1LSTM for forecasting was approximately the same and achieved an error between 5.02 and 5.20. Then came SVM and XGBOOST, with the DT ranked last, showing errors of 5.91 to 9.87, as seen in Figure 21.
- : Figure 22 shows the performance of GRU, LSTM, Attention, B1LSTM, DNN, and CNN1DLSTM for estimating close to each other and achieving an error less than 0.1. Then came the XGBOOST, SVM, and DT, which accomplished an error between 0.27 and 1.06.
Figure 19.
Comparison of average RMSE for power voltage.
Figure 20.
Comparison of average RMSE for .
Figure 21.
Comparison of average RMSE for .
Figure 22.
Comparison of average RMSE for .
In Figure 23, another method can be seen that uses a radar graph to represent the comparison of the performance models.
Figure 23.
The radar graph shows the comparison of the RMSE errors of the U, , , and that are achieved by studied models.
As reported in Section 5, all Deep Learning (DL) models achieved remarkably similar RMSE values for , ranging from 5.02 to 5.20 Table 14. Physically, in an off-grid residential microgrid is highly volatile due to the diverse non-linear loads (e.g., microwaves with 56.8% THD and lights with 77.6% THD) Table 4. Because these appliances switch on and off rapidly, the signal contains high-frequency stochastic noise.
Among these models, DNN and LSTM stand out as the most noticeable candidates for having highly predictive effectiveness. The investigated architectures possess sufficient non-linear mapping capabilities to reach a similar performance “floor” determined by the 1-min temporal resolution of the dataset. This behavior can be observed clearly via Figure 24 and Figure 25, where the tracking performance provides deeper insight into the model behaviors for . Based on the Figure 24 and Figure 25, we can see that both models adopt quite a similar pattern and trend of change in the signal for their prediction in the next moment. However, the DNN’s results show more approximate predictions to actual values across the rush hours from 6:00 to 10:00 and from 13:00 to 16:00 of the 21st and 22nd; and from 13:00 to 18:00 of the 23rd with slightly narrower gaps between the blue and orange lines, indicating a better prediction than the LSTM’s results. On the other hand, the LSTM result also shows some fairly good results compared to the DNN models during the calm time between 17:00 and before 24:00 of those 3 days. The difference is small, indicating all models well captured the general pattern to a good degree, but still emphasizing the superiority of the DNN model over the LSTM.
Figure 24.
The prediction performed on the next 3 days across 24 h by model DNN.
Figure 25.
The prediction performed on the next 3 days across 24 h by model LSTM.
Another case showing how DNN performed better than LSTM is forecasting, the temporal tracking illustrated in Figure 26 (DNN) and Figure 27 (LSTM) provides a clear physical justification for the observed performance metrics. Both architectures demonstrate high fidelity in capturing the transient peaks associated with high-distortion load switching, represented by very similar trends of blue and orange segments during the day working hours and afternoon working hours (e.g., from 6:00 to 11:00, and 12:00 to 17:00), physically showing that the near-identical performance of these models stems from the forecasting configuration. The part where the DNN model started to show a greater efficiency over LSTM is in the rest hours (evening and night time) from 17:00 to 24:00, where we obviously see the DNN model’s orange prediction line lie very close to the actual blue line, while the LSTM model’s one stays far apart from the actual blue line. This indicates the ability to capture the pattern and makes predictions better for the DNN model than the LSTM when it comes to having very few clues to base predictions on (Minimum 1 step in the past to base predictions on).
Figure 26.
The prediction performed on the next 3 days across 24 h by model DNN.
Figure 27.
The prediction performed on the next 3 days across 24 h by model LSTM.
From the two most noticeable cases above, we come down to a brief explanation: Since the study utilizes a one-minute input window size (), the internal memory mechanisms of the LSTM are not fully leveraged for capturing long-term dependencies as mentioned in Section 4.2 and Section 6. Mathematically, this confirms that for 1-min-ahead forecasts, long-term temporal dependency is minimal. Consequently, the gated memory cells of the LSTM do not yield visual or statistical improvements over the fully connected layers of the DNN. This result is significant for practical deployment, as it justifies the use of computationally lighter DNN models to achieve high-precision monitoring without the latency overhead of recurrent architectures.
Furthermore, in several cases, the standard DNN achieved lower RMSE than the LSTM and GRU architectures (see Table 12 and Table 13). This can be interpreted through the lens of the forecasting configuration. Since the study utilizes a look-back window of one minute (), the “memory” benefits of gated recurrent units are less pronounced Section 4.1 and Section 4.2. For near-instantaneous mapping of weather variables (temperature, humidity) and appliance status to voltage levels, the fully connected layers of a DNN provide a more direct and efficient gradient path. The LSTM, while superior for capturing long-term seasonal trends, introduces additional complexity through its forget and input gates that may not enhance precision for 1-min-ahead point forecasts where immediate inputs dominate the output state.
The significant failure of classical machine learning models (DT and SVM) in forecasting—evidenced by negative values—stems from the complex nature of short-term flicker severity. is a statistical representation of voltage fluctuations over time. The shallow decision boundaries of DT and SVM are unable to generalize the high-dimensional nonlinear interactions between fluctuating solar irradiance (weather data) and the resulting transient voltage drops, whereas DL models utilize multiple layers of abstraction to capture these latent patterns.
6.2. Computational Complexity
The computation time and memory usage in the testing phase were calculated to test one sample, as can be seen in Table 11, Figure 28 and Figure 29.
Figure 28.
Time measurement for one sample.
Figure 29.
Memory measurement for one sample.
The Deep Learning neural network group of models uses more time and memory to execute 1 sample than the Machine Learning group of models.
Overall, DT and SVM emerge as the most efficient algorithms, excelling in both speed and memory usage. This makes them strong candidates for this task, especially in resource-constrained environments. DNN appears to be the least efficient in both time and memory, suggesting potential areas for optimization or alternative model choices.
Deep Learning models, such as LSTM and DNN, while potentially slower and more memory-intensive, might offer higher accuracy or better performance in certain tasks, justifying the increased resource consumption.
These complexity measurements and previous accuracy measurement results clearly show the trade-offs between the two different types of models. While ML models can process faster with better memory efficiency, DL models provide more accurate predictions. The choice of which models to use depends on which strengths your system prefers most.
However, the dataset used faced some limitations, as previously mentioned in the future investigation, which will take into account these limitations.
7. Conclusions
This article presents a systematic benchmark of machine learning and deep learning methods for multiple power quality parameters, complemented by a practical analysis of computational complexity on a real off-grid microgrid. To maximize the benefits of renewable energies and reduce environmental pollution, given climate change, an optimization model is needed to maintain power quality within stipulated limits. Power quality parameter forecasting in an off-grid system is a fundamental foundation that enables optimization of power quality, thereby reflecting the reliability, economy, and safety of the power grid. With climate fluctuations, integrating renewable energy into power grids to reduce environmental pollution is challenging. The power parameters forecasting process represents an essential element in the smart control model, which can operate an off-grid system that is currently considered part of Energy Communities.
In this study, nine forecasting models (Long short-term memory (LSTM), Gated Recurrent Uni (GRU), DNN, CNN1DLSTM, Bidirectional Long Short-Term Memory (BiLSTM), Attention, Decision Tree (DT), Support Vector Machine (SVM), and Extreme Gradient Boosting (XGBOOST)) have been investigated for forecasting the following power quality parameters: power voltage (U), voltage total harmonic distribution (), current total harmonic distribution (), and short-term flicker severity (). The main goal of these experiments is to identify relationships between input variables and power quality parameters. The experiments used a real dataset from an off-grid system constructed at VSB-TUO. Weather conditions, the status of home appliances, and a one-step lag in output are used as input parameters. Using the status (on or off) of home appliances as input variables will enable optimizing power quality. The Root Mean Square Error (RMSE) was utilized to evaluate the forecasting results, and the Computational Complexity (execution time and memory usage) was calculated and considered during the testing phase. When comparing the results, the DNN, B1LSTM, Attention, GRU and CNN1D-LSTM models achieved better forecasting results for U, DNN, BiLSTM, Attention, LSTM, GRU, and CNN1D-LSTM methods accomplished good forecasting results, while the performance of GRU, LSTM, CNN1D-LSTM, DNN, Attention, and B1LSTM in forecasting was better and approximately similar to each other, however, good results of estimating were obtained from GRU, LSTM, Attention, B1LSTM, DNN, and CNN1D-LSTM.
From a practical deployment perspective, the results of this study provide concrete guidance on selecting forecasting architectures for resource-constrained off-grid microgrid controllers. Deep learning models, particularly DNN, GRU, BiLSTM, and Attention, demonstrated superior predictive accuracy across all four PQPs, making them well-suited for deployment in systems where prediction precision is the primary requirement and sufficient computational resources are available. Conversely, classical machine learning models—DT and SVM—offer inference times two orders of magnitude lower than their deep learning counterparts (approximately 0.001–0.003 s versus 0.076–0.145 s per sample) and substantially reduced memory footprints, rendering them viable candidates for embedded controllers operating under strict latency and memory constraints. The failure of DT and SVM in forecasting, evidenced by negative values, however, indicates that these models are unsuitable for flicker severity prediction and should not be deployed for this parameter without architectural augmentation. XGBoost represents a balanced intermediate option, offering moderate accuracy with low computational overhead. Based on these findings, a recommended deployment strategy for community energy microgrids is a hybrid architecture: DNN or GRU models for parameters requiring high precision (U, , ), complemented by DT or SVM for rapid anomaly detection in scenarios where inference latency is critical. This layered approach enables proactive power-quality regulation within the Smart Grid Control framework while remaining feasible for implementation on commercially available embedded platforms.
The next step in our future research will be to extend this methodology to the advanced infrastructure of the CEETe at VSB-TUO, which provides unique laboratory facilities for research on low-carbon and sustainable energy systems and environmental technologies. Integration of our forecasting models with CEETe’s research areas, including energy accumulation, transformation, and control; materials for energy and environmental technologies; and the use of secondary resources and alternative energy sources, will enable comprehensive testing and validation across more complex microgrid configurations and community energy systems.
Author Contributions
Conceptualization, I.J., K.N.D.D., and V.S.; methodology, I.J., K.N.D.D., and V.B.; software, I.J. and K.N.D.D.; validation, I.J., K.N.D.D., and V.B.; formal analysis, I.J., I.P., and K.N.D.D.; investigation, K.N.D.D.; resources, V.S., F.M., and A.M.; data curation, I.J.; writing—original draft preparation, I.J., I.P., K.N.D.D., and V.B.; writing—review and editing, A.M., V.B., and I.P.; visualization, I.J. and K.N.D.D.; supervision, V.S., S.M., and F.M.; project administration, S.M., V.S., and F.M.; funding acquisition, V.B. and S.M. All authors have read and agreed to the published version of the manuscript.
Funding
This article has been supported by EU funds under the project “Increasing the resilience of power grids in the context of decarbonisation, decentralisation and sustainable socioeconomic development”, CZ.02.01.01/00/23_021/0008759, through the Operational Programme Johannes Amos Comenius, and Libyan Authority for Scientific Research.
Data Availability Statement
The data presented in this study are openly available in Zenodo at https://doi.org/10.5281/zenodo.18197625 and Github http://github.com/Sal0043/Data_set_3 (accessed on 12 April 2026).
Acknowledgments
The authors use AI-based tools, specifically Grammarly, to assist in grammar checking and language refinement during the preparation of this manuscript. The authors are fully responsible for the content and scientific conclusions presented in the article.
Conflicts of Interest
The authors declare no conflicts of interest.
Abbreviations
The following abbreviations are used in this manuscript:
| U | Amplitude of power voltage (Output variable) |
| Voltage Total Harmonic Distortion (Output variable) | |
| Current Total Harmonic Distortion (Output variable) | |
| Short-term flicker severity (Output variable) | |
| DT | Decision Tree |
| SVM | Support Vector Machine |
| power quality parameters | |
| RMSE | Root mean square Error |
| R-Squared | |
| LSTM | Long Short-Term Memory |
| DNN | Deep Neural Network |
| GRU | Gated Recurrent Unit |
| 1D-LSTM | 1-Dimensional Convolutional Long Short-Term Memory |
| BiLSTM | Bidirectional Long Short-Term Memory |
| XGBoost | Extreme Gradient Boosting XGBoost |
| MAPE | Mean Absolute Percentage Error |
| The previous step of the output (Input variable) | |
| Tem | Air temperature (Input variable) |
| Dep | Dew point (Input variable) |
| Hud | Humidity (Input variable) |
| Ws | Wind speed (Input variable) |
| Homap | Status of home appliances (Input variable) |
References
- Bauwens, T.; Schraven, D.; Drewing, E.; Radtke, J.; Holstenkamp, L.; Gotchev, B. Yildiz: Conceptualizing community in energy systems: A systematic review of 183 definitions. Renew. Sustain. Energy Rev. 2022, 156, 111999. [Google Scholar] [CrossRef] [Scilit]
- Koirala, B.P.; Koliou, E.; Friege, J.; Hakvoort, R.A.; Herder, P.M. Energetic communities for community energy: A review of key issues and trends shaping integrated community energy systems. Renew. Sustain. Energy Rev. 2016, 56, 722–744. [Google Scholar] [CrossRef] [Scilit]
- Rodríguez-Pajarón, P.; Hernández Bayo, A.; Milanović, J.V. Forecasting voltage harmonic distortion in residential distribution networks using smart meter data. Int. J. Electr. Power Energy Syst. 2022, 136, 107653. [Google Scholar] [CrossRef] [Scilit]
- Kuyunani, E.; Hasan, A.N.; Shongwe, T. Improving voltage harmonics forecasting at a wind farm using deep learning techniques. In Proceedings of the 2021 IEEE 30th International Symposium on Industrial Electronics (ISIE); IEEE: New York, NY, USA, 2021; pp. 1–6. [Google Scholar]
- Žnidarec, M.; Klaić, Z.; Šljivac, D.; Dumnić, B. Harmonic distortion prediction model of a grid-tie photovoltaic inverter using an artificial neural network. Energies 2019, 12, 790. [Google Scholar] [CrossRef] [Scilit]
- Al Hadi, F.M.; Aly, H.H.; Little, T. Harmonics forecasting of wind and solar hybrid model based on deep machine learning. IEEE Access 2023, 11, 100438–100457. [Google Scholar] [CrossRef] [Scilit]
- Jahan, I.S.; Blazek, V.; Misak, S.; Snasel, V.; Prokop, L. Forecasting of power quality parameters based on meteorological data in small-scale household off-grid systems. Energies 2022, 15, 5251. [Google Scholar] [CrossRef] [Scilit]
- Jahan, I.S.; Prilepok, M.; Misak, S.; Snasel, V. Intelligent system for power load forecasting in off-grid platform. In Proceedings of the 2018 19th International Scientific Conference on Electric Power Engineering (EPE); IEEE: New York, NY, USA, 2018; pp. 1–5. [Google Scholar]
- Alasali, F.; Foudeh, H.; Ali, E.M.; Nusair, K.; Holderbaum, W. Forecasting and modelling the uncertainty of low voltage network demand and the effect of renewable energy sources. Energies 2021, 14, 2151. [Google Scholar] [CrossRef] [Scilit]
- Din, G.M.U.; Marnerides, A.K. Short term power load forecasting using deep neural networks. In Proceedings of the 2017 International Conference on Computing, Networking and Communications (ICNC); IEEE: New York, NY, USA, 2017; pp. 594–598. [Google Scholar]
- Tang, X.; Dai, Y.; Wang, T.; Chen, Y. Short-term power load forecasting based on multi-layer bidirectional recurrent neural network. IET Gener. Transm. Distrib. 2019, 13, 3847–3854. [Google Scholar] [CrossRef] [Scilit]
- Zheng, X.; Ran, X.; Cai, M. Short-term load forecasting of power system based on neural network intelligent algorithm. IEEE Access 2020, 8, 156660–156666. [Google Scholar]
- Yurdakul, O.; Eser, F.; Sivrikaya, F.; Albayrak, S. Very short-term power system frequency forecasting. IEEE Access 2020, 8, 141234–141245. [Google Scholar] [CrossRef] [Scilit]
- Bozdag, I.; Efe, S.B.; Ozer, I. Short-Term Forecasting of Power Quality Distortions in Electrical Energy Systems with LSTM and GRU Networks. Sci. Iran. 2023. [Google Scholar] [CrossRef] [Scilit]
- Bracale, A.; Caramia, P.; De Falco, P.; Domagk, M.; Meyer, J. Probabilistic forecasting of current harmonic distortions in distribution systems. In Proceedings of the 2023 IEEE PES Innovative Smart Grid Technologies Europe (ISGT EUROPE); IEEE: New York, NY, USA, 2023; pp. 1–5. [Google Scholar]
- Serttas, F.; Hocaoglu, F.O.; Akarslan, E. Short term solar power generation forecasting: A novel approach. In Proceedings of the 2018 International Conference on Photovoltaic Science and Technologies (PVCon); IEEE: New York, NY, USA, 2018; pp. 1–4. [Google Scholar]
- VanDeventer, W.; Jamei, E.; Thirunavukkarasu, G.S.; Seyedmahmoudian, M.; Soon, T.K.; Horan, B.; Mekhilef, S.; Stojcevski, A. Short-term pv power forecasting using hybrid gasvm technique. Renew. Energy 2019, 140, 367–379. [Google Scholar] [CrossRef] [Scilit]
- Wang, H.-Z.; Li, G.-Q.; Wang, G.-B.; Peng, J.-C.; Jiang, H.; Liu, Y.-T. Deep learning based ensemble approach for probabilistic wind power forecasting. Appl. Energy 2017, 188, 56–70. [Google Scholar] [CrossRef] [Scilit]
- Elsaraiti, M.; Merabet, A. Solar power forecasting using deep learning techniques. IEEE Access 2022, 10, 31692–31698. [Google Scholar] [CrossRef] [Scilit]
- Błaszczok, D.; Trawiński, T.; Szczygieł, M.; Rybarz, M. Forecasting of reactive power consumption with the use of artificial neural networks. Electronics 2022, 11, 2005. [Google Scholar] [CrossRef] [Scilit]
- Cai, C.; Li, Y.; Su, Z.; Zhu, T.; He, Y. Short-term electrical load forecasting based on vmd and gru-tcn hybrid network. Appl. Sci. 2022, 12, 6647. [Google Scholar] [CrossRef] [Scilit]
- Dong, X.; Deng, S.; Wang, D. A short-term power load forecasting method based on k-means and svm. J. Ambient. Intell. Humaniz. Comput. 2022, 13, 5253–5267. [Google Scholar] [CrossRef] [Scilit]
- Wan, A.; Chang, Q.; AL-Bukhaiti, K.; He, J. Short-term power load forecasting for combined heat and power using cnn-lstm enhanced by attention mechanism. Energy 2023, 282, 128274. [Google Scholar] [CrossRef] [Scilit]
- Hossain, M.A.; Chakrabortty, R.K.; Elsawah, S.; Ryan, M.J. Very short-term forecasting of wind power generation using hybrid deep learning model. J. Clean. Prod. 2021, 296, 126564. [Google Scholar] [CrossRef] [Scilit]
- Ugwuagbo, E.; Balogun, A.; Ray, B.; Anwar, A.; Ugwuishiwu, C. Total harmonics distortion prediction at the point of common coupling of industrial load with the grid using artificial neural network. Energy AI 2023, 14, 100281. [Google Scholar] [CrossRef] [Scilit]
- Guo, W.; Liu, J.; Ma, J.; Lan, Z. Short-Term Power Load Forecasting Using Adaptive Mode Decomposition and Improved Least Squares Support Vector Machine. Energies 2025, 18, 2491. [Google Scholar] [CrossRef] [Scilit]
- SchneiderElectric: Conext XW+ Hybrid Inverter/Charger. 2017. Available online: https://s3.amazonaws.com/ecodirect_docs/SCHNEIDER/Conext-XW/230V/DS20170928_Conext-XW-230V-Datasheet.pdf (accessed on 10 April 2024).
- Blazek, V.; Vantuch, T.; Slanina, Z.; Vysocky, J.; Prokop, L.; Misak, S.; Piecha, M.; Walendziuk, W. A novel approach to utilization vehicle to grid technology in microgrid environment. Int. J. Electr. Power Energy Syst. 2024, 158, 109921. [Google Scholar] [CrossRef] [Scilit]
- Misák, S.; Prokop, L.; Blazek, V.; Pergl, I.; Bajaj, M. Centre for Energy and Environmental Technologies-Explorer (CEETe): Advanced Scientific Perspectives and Applications. In Proceedings of the 14th International Conference on Smart Cities and Green ICT Systems (SMARTGREENS 2025), Porto, Portugal, 2–3 April 2025; pp. 215–221. [Google Scholar]
- Jahan, I.; Mohamed, F.; Blazek, V.; Prokop, L.; Misak, S.; Snasel, V. Power Quality Parameters Forecasting Based on SOM Maps with KNN Algorithm and Decision Tree. In Proceedings of the 2023 23rd International Scientific Conference on Electric Power Engineering (EPE), Brno, Czech Republic, 24–26 May 2023; pp. 1–6. [Google Scholar] [CrossRef] [Scilit]
- SchneiderElectric: MPPT PV. 2013. Available online: https://solar.se.com/us/wp-content/uploads/sites/7/2021/10/MPPT-100-600-and-MPPT-80-600-Datasheet.pdf (accessed on 10 April 2024).
- EnerSys: Hawker XFC. 2013. Available online: http://nrgsource.eu/wp-content/uploads/2015/08/xfcbloc_gb.pdf (accessed on 12 April 2026).
- Ghosh, S.; Dasgupta, A.; Swetapadma, A. A study on support vector machine based linear and non-linear pattern classification. In Proceedings of the 2019 International Conference on Intelligent Sustainable Systems (ICISS), Palladam, India, 21–22 February 2019; pp. 24–28. [Google Scholar] [CrossRef] [Scilit]
- Hearst, M.A.; Dumais, S.T.; Osuna, E.; Platt, J.; Scholkopf, B. Support vector machines. IEEE Intell. Syst. Their Appl. 1998, 13, 18–28. [Google Scholar] [CrossRef] [Scilit]
- Awad, M.; Khanna, R. Support Vector Regression; Apress: Berkeley, CA, USA, 2015; pp. 67–80. [Google Scholar]
- Smola, A.J.; Schölkopf, B. A tutorial on support vector regression. Stat. Comput. 2004, 14, 199–222. [Google Scholar] [CrossRef] [Scilit]
- Oruh, J.; Viriri, S.; Adegun, A. Long short-term memory recurrent neural network for automatic speech recognition. IEEE Access 2022, 10, 30069–30079. [Google Scholar] [CrossRef] [Scilit]
- Shashidhar, R.; Patilkulkarni, S.; Puneeth, S. Combining audio and visual speech recognition using lstm and deep convolutional neural network. Int. J. Inf. Technol. 2022, 14, 3425–3436. [Google Scholar] [CrossRef] [Scilit]
- Song, J.; Li, X.; Gao, L.; Shen, H.T. Hierarchical lstms with adaptive attention for visual captioning. arXiv 2018, arXiv:1812.11004. [Google Scholar] [CrossRef] [Scilit]
- Zhao, B.; Li, X.; Lu, X. Cam-rnn: Co-attention model based rnn for video captioning. IEEE Trans. Image Process. 2019, 28, 5552–5565. [Google Scholar] [CrossRef] [Scilit]
- Yue, W.; Xiaojie, W.; Yuzhao, M. First-feed lstm model for video description. J. China Univ. Posts Telecommun. 2016, 23, 89–93. [Google Scholar] [CrossRef] [Scilit]
- Yadav, N.; Naik, D. Generating short video description using deep-lstm and attention mechanism. In Proceedings of the 2021 6th International Conference for Convergence in Technology (I2CT), Maharashtra, India, 2–4 April 2021; pp. 1–6. [Google Scholar] [CrossRef] [Scilit]
- Orozco, C.; Xamena, E.; Buemi, M.; Berlles, J. Human action recognition in videos using a robust cnn lstm approach. Cienc. Tecnol. 2020, 20, 23–36. [Google Scholar] [CrossRef] [Scilit]
- Pienaar, S.W.; Malekian, R. Human activity recognition using lstm-rnn deep neural network architecture. In Proceedings of the 2019 IEEE 2nd Wireless Africa Conference (WAC), Pretoria, South Africa, 18–20 August 2019; pp. 1–5. [Google Scholar] [CrossRef] [Scilit]
- Hu, Y.; Huber, A.; Anumula, J.; Liu, S.-C. Overcoming the vanishing gradient problem in plain recurrent networks. arXiv 2019, arXiv:1801.06105. [Google Scholar] [CrossRef] [Scilit]
- Rehmer, A.; Kroll, A. On the vanishing and exploding gradient problem in gated recurrent units. IFAC-PapersOnLine 2020, 53, 1243–1248. [Google Scholar] [CrossRef] [Scilit]
- Chen, A.; Fu, Y.; Zheng, X.; Lu, G. An efficient network behavior anomaly detection using a hybrid dbn-lstm network. Comput. Secur. 2022, 114, 102600. [Google Scholar] [CrossRef] [Scilit]
- Gonzalez, J.; Yu, W. Non-linear system modeling using lstm neural networks. IFAC-PapersOnLine 2018, 51, 485–489. [Google Scholar] [CrossRef] [Scilit]
- Lindemann, B.; Müller, T.; Vietz, H.; Jazdi, N.; Weyrich, M. A survey on long short-term memory networks for time series prediction. Procedia CIRP 2021, 99, 650–655. [Google Scholar] [CrossRef] [Scilit]
- Werbos, P.J. Backpropagation through time: What it does and how to do it. Proc. IEEE 1990, 78, 1550–1560. [Google Scholar] [CrossRef] [Scilit]
- Nguyen-Thanh, P.; Cho, M.-Y.; Chang, C.-L.; Chen, M.-J. Short-term three phase load prediction with advanced metering infrastructure data in smart solar microgrid based convolution neural network bidirectional gated recurrent unit. IEEE Access 2022, 10, 68686–68699. [Google Scholar] [CrossRef] [Scilit]
- Tang, G.; Xue, X.; Saeed, A.; Hu, X. Short-term wind speed interval prediction based on ensemble gru model. IEEE Trans. Sustain. Energy 2019, 11, 1370–1380. [Google Scholar] [CrossRef] [Scilit]
- Sánchez-Reolid, R.; López de la Rosa, F.; López, M.T.; Fernández-Caballero, A. One-dimensional convolutional neural networks for low/high arousal classification from electrodermal activity. Biomed. Signal Process. Control 2022, 71, 103203. [Google Scholar] [CrossRef] [Scilit]
- Shao, Q.; Li, W.; Han, G.; Hou, G.; Liu, S.; Gong, Y.; Qu, P. A deep learning model for forecasting sea surface height anomalies and temperatures in the south china sea. J. Geophys. Res. Ocean. 2021, 126, e2021JC017515. [Google Scholar] [CrossRef] [Scilit]
- Messaoudi, F.; Loukili, M.; Ghazi, M.E. Demand prediction using sequential deep learning model. In Proceedings of the 2023 International Conference on Information Technology (ICIT), Amman, Jordan, 9–10 August 2023; pp. 577–582. [Google Scholar] [CrossRef] [Scilit]
- Ren, S.; Sun, J.; Zhang, X.; Liu, Y.; Wang, D. Fault prediction method based on improved bidirectional long short-term memory combined with sample entropy for battery. In Proceedings of the 2023 IEEE 6th Information Technology, Networking, Electronic and Automation Control Conference (ITNEC), Chongqing, China, 24–26 February 2023; Volume 6, pp. 186–190. [Google Scholar] [CrossRef] [Scilit]
- Ullah, F.U.M.; Ullah, A.; Haq, I.U.; Rho, S.; Baik, S.W. Short-term prediction of residential power energy consumption via cnn and multi-layer bi-directional lstm networks. IEEE Access 2020, 8, 123369–123380. [Google Scholar] [CrossRef] [Scilit]
- Huang, C.-G.; Huang, H.-Z.; Li, Y.-F. A bidirectional lstm prognostics method under multiple operational conditions. IEEE Trans. Ind. Electron. 2019, 66, 8792–8802. [Google Scholar] [CrossRef] [Scilit]
- Zhang, H.; Zhang, Q.; Shao, S.; Niu, T.; Yang, X. Attention-based lstm network for rotatory machine remaining useful life prediction. IEEE Access 2020, 8, 132188–132199. [Google Scholar] [CrossRef] [Scilit]
- Chen, Z.; Wu, M.; Zhao, R.; Guretno, F.; Yan, R.; Li, X. Machine remaining useful life prediction via an attention-based deep learning approach. IEEE Trans. Ind. Electron. 2021, 68, 2521–2531. [Google Scholar] [CrossRef] [Scilit]
- Shih, C.-S.; Huang, P.-W.; Yen, E.-T.; Tsung, P.-K. Vehicle speed prediction with rnn and attention model under multiple scenarios. In Proceedings of the 2019 IEEE Intelligent Transportation Systems Conference (ITSC), Auckland, New Zealand, 27–30 October 2019; pp. 369–375. [Google Scholar] [CrossRef] [Scilit]
- Chen, M.; Liu, Q.; Chen, S.; Liu, Y.; Zhang, C.-H.; Liu, R. Xgboost-based algorithm interpretation and application on post-fault transient stability status prediction of power system. IEEE Access 2019, 7, 13149–13158. [Google Scholar] [CrossRef] [Scilit]
- Zhang, Y.; Shi, X.; Zhang, S.; Abraham, A. A xgboost-based lane change prediction on time series data using feature engineering for autopilot vehicles. IEEE Trans. Intell. Transp. Syst. 2022, 23, 19187–19200. [Google Scholar] [CrossRef] [Scilit]
- Paliari, I.; Karanikola, A.; Kotsiantis, S. A comparison of the optimized lstm, xgboost and arima in time series forecasting. In Proceedings of the 2021 12th International Conference on Information, Intelligence, Systems Applications (IISA), Chania Crete, Greece, 12–14 July 2021; pp. 1–7. [Google Scholar] [CrossRef] [Scilit]
- Bertsimas, D.; Dunn, J.; Paschalidis, A. Regression and classification usingoptimal decision trees. In Proceedings of the 2017 IEEE MIT Undergraduate Research Technology Conference (URTC), Cambridge, MA, USA, 3–5 November 2017; pp. 1–4. [Google Scholar] [CrossRef] [Scilit]
- Jena, M.; Dehuri, S. Decisiontree for classification and regression: A state-of-theart review. Informatica 2020, 44, 405–420. [Google Scholar] [CrossRef] [Scilit]
- Breiman, L.; Friedman, J.H.; Olshen, R.A.; Stone, C.J. Classification and regression trees. Biometrics 1984, 40, 874. [Google Scholar]
- Lee, S.; Lee, C.; Mun, K.G.; Kim, D. Decision tree algorithm considering distances between classes. IEEE Access 2022, 10, 69750–69756. [Google Scholar] [CrossRef] [Scilit]
- Jain, A.; Smarra, F.; Mangharam, R. Data predictive control using regressiontrees and ensemble learning. In Proceedings of the 2017 IEEE 56th Annual Conference on Decision and Control (CDC), Melbourne, VIC, Australia, 12–15 December 2017; pp. 4446–4451. [Google Scholar] [CrossRef] [Scilit]
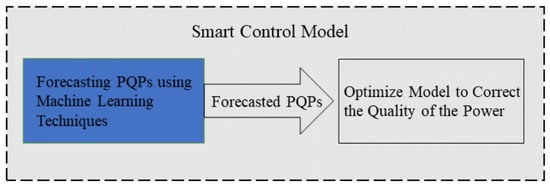
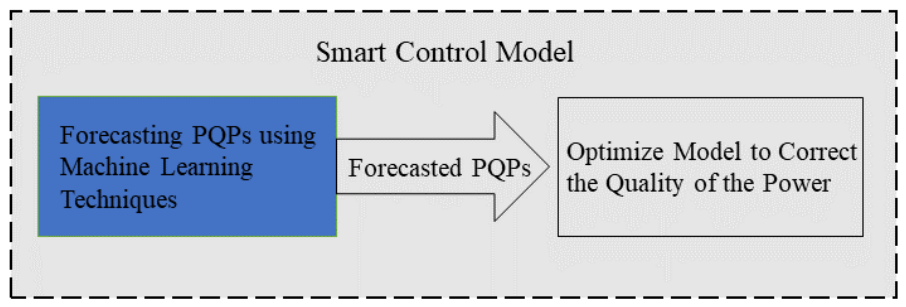
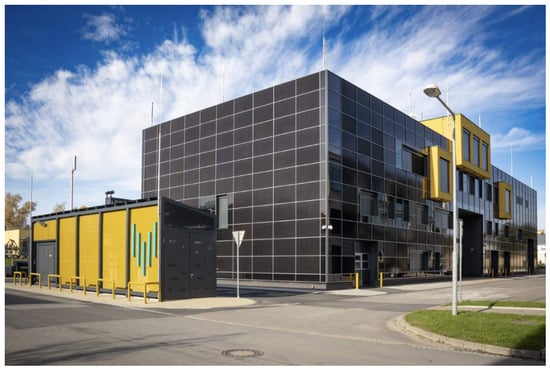
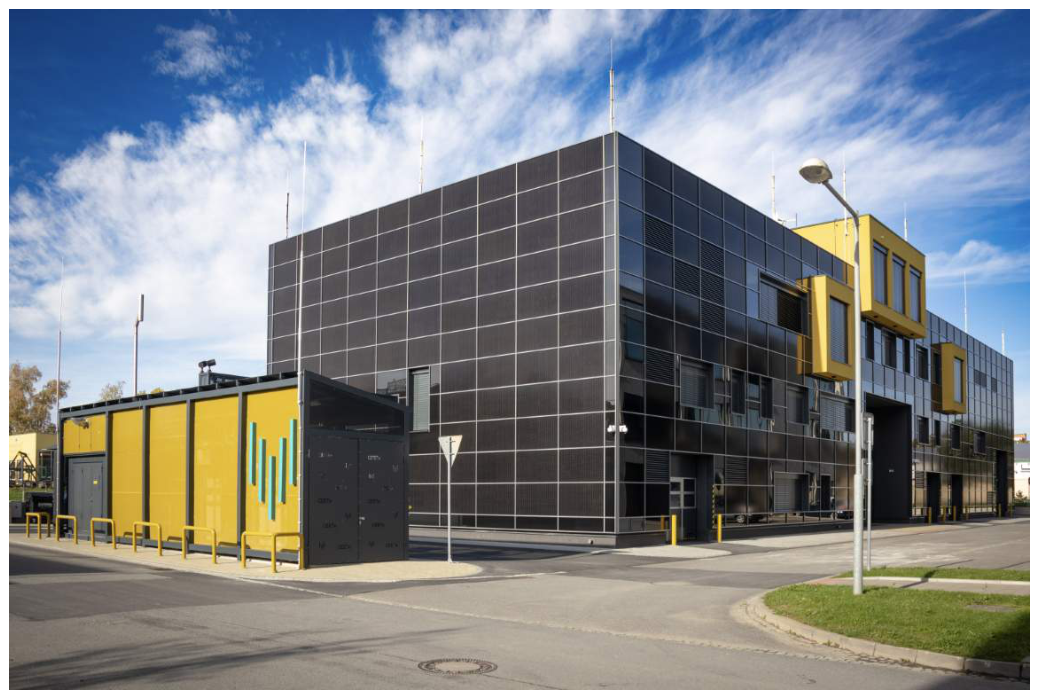
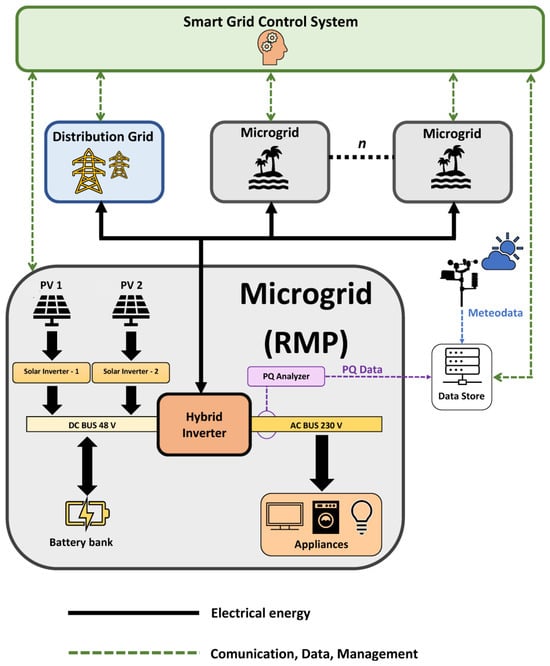
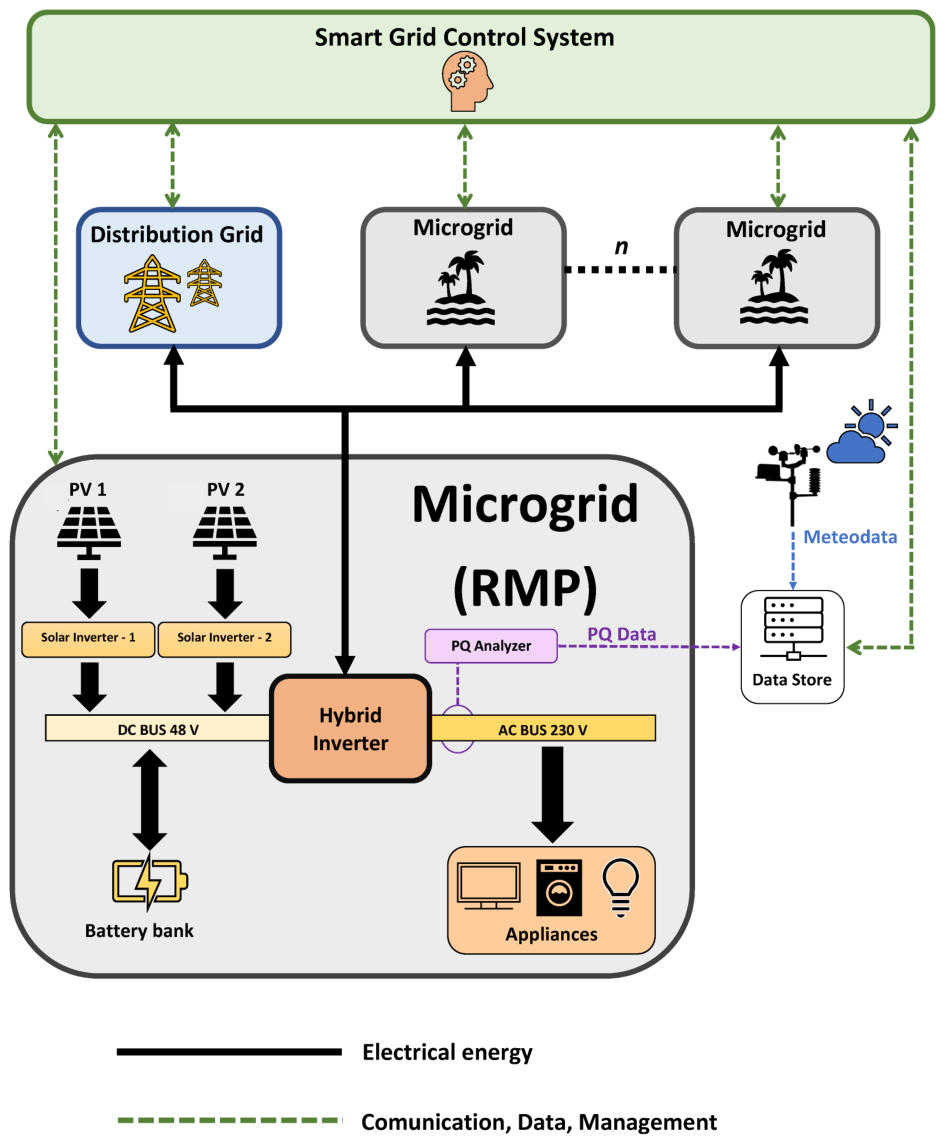
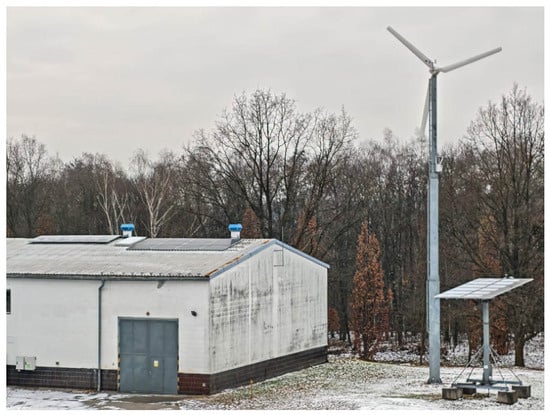
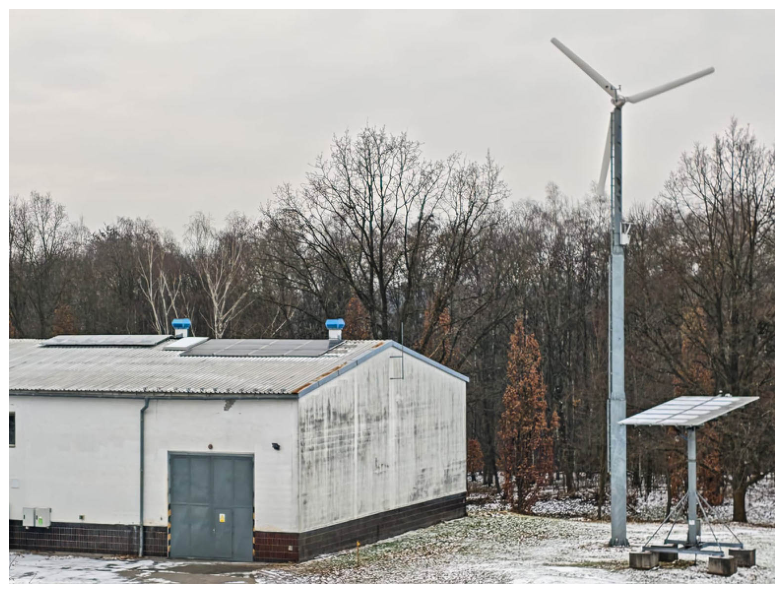
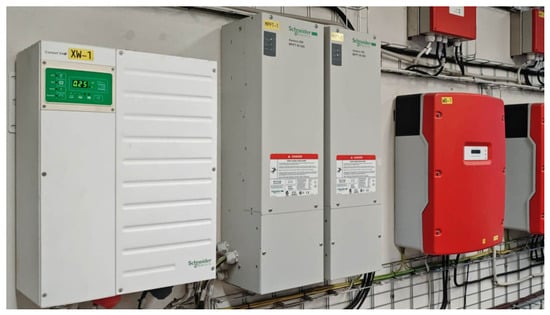
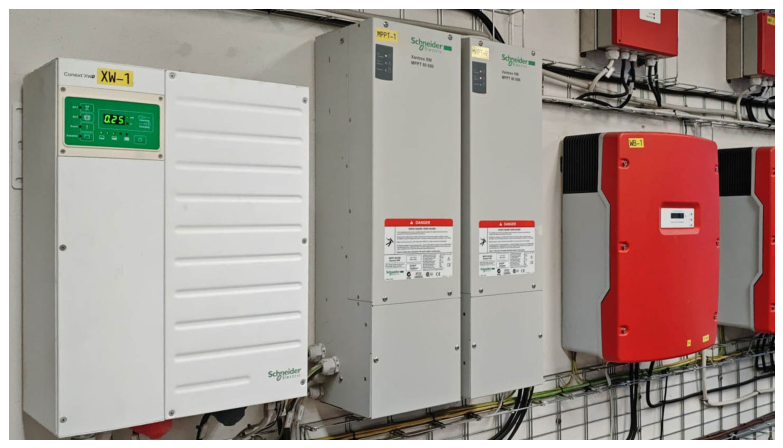
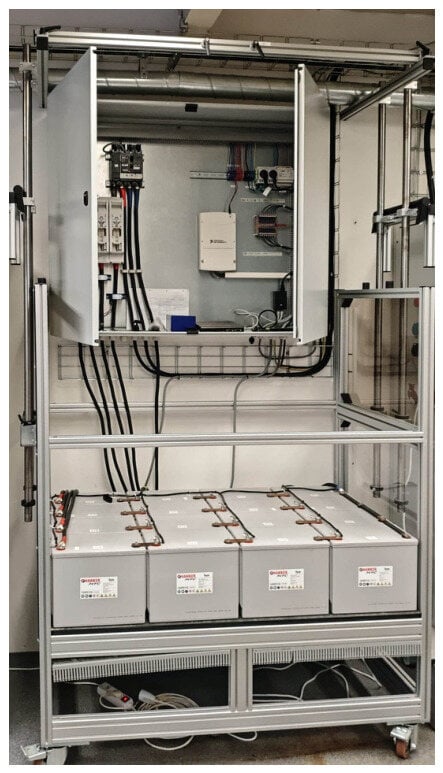
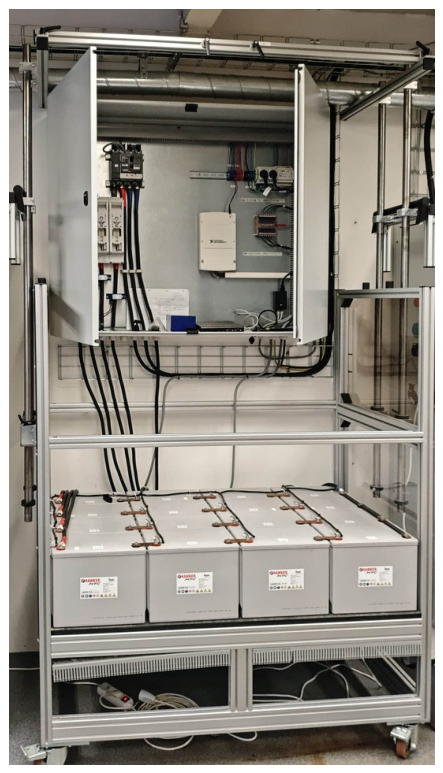
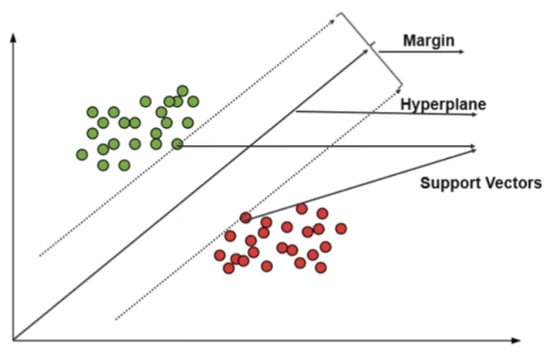
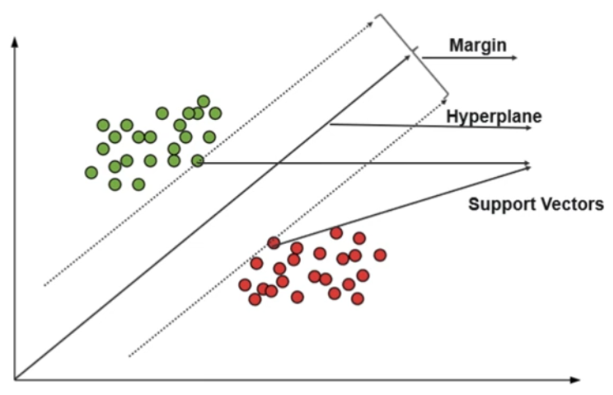
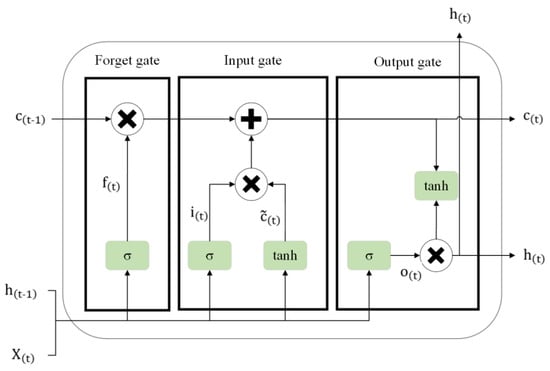
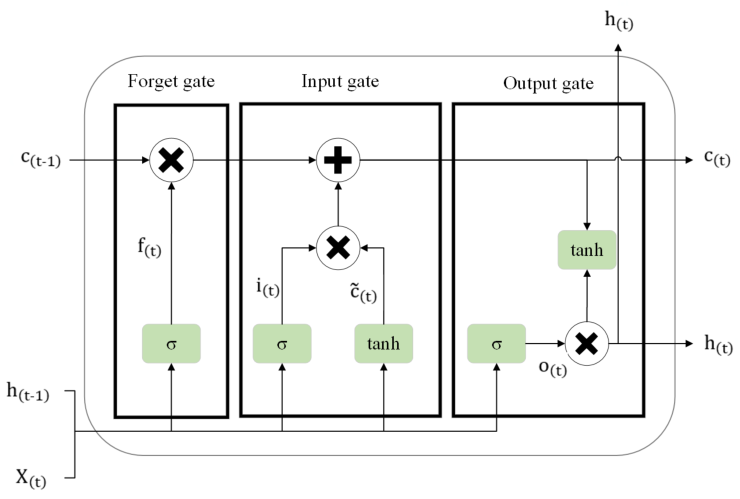
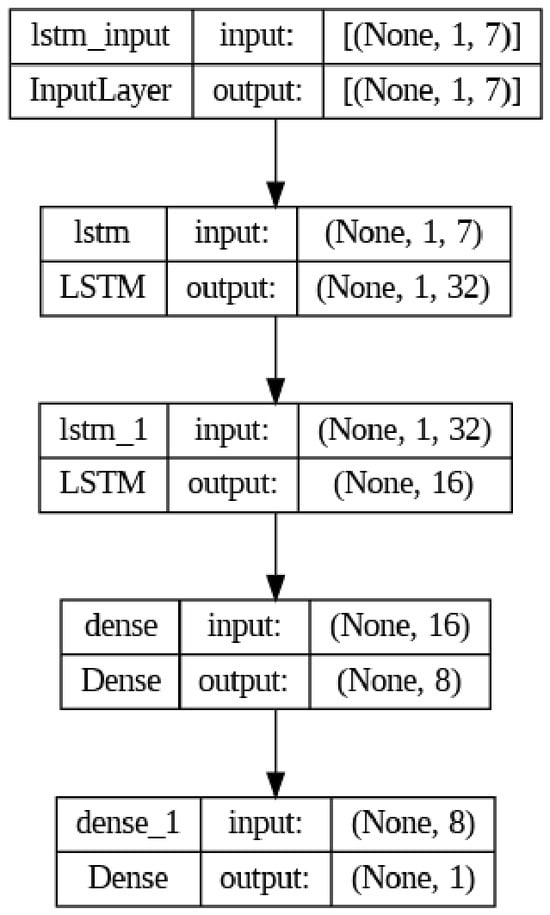
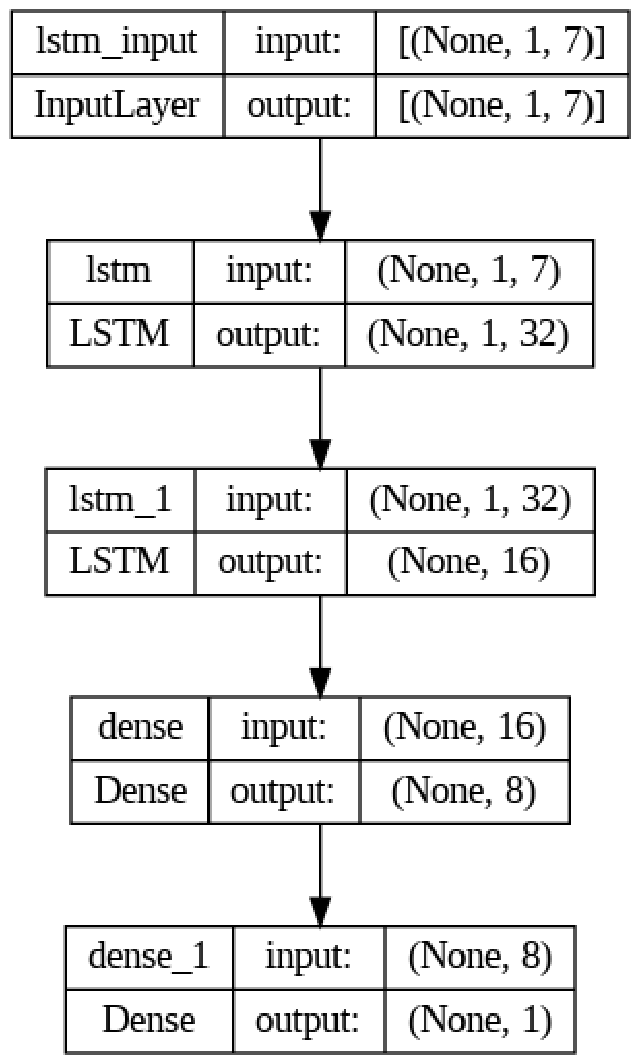
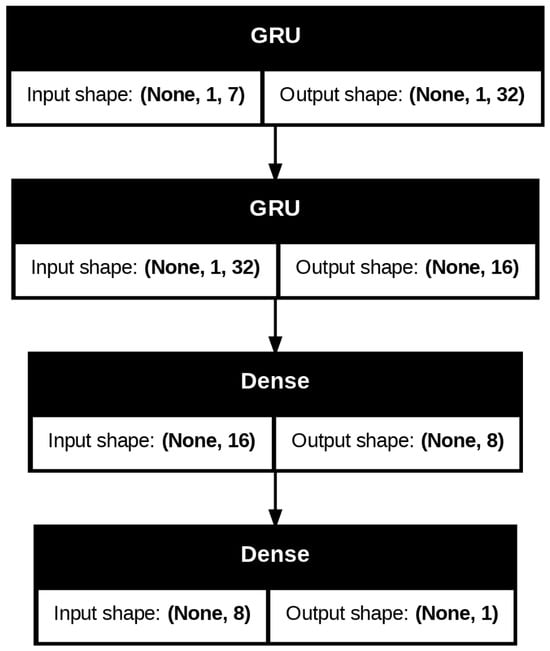
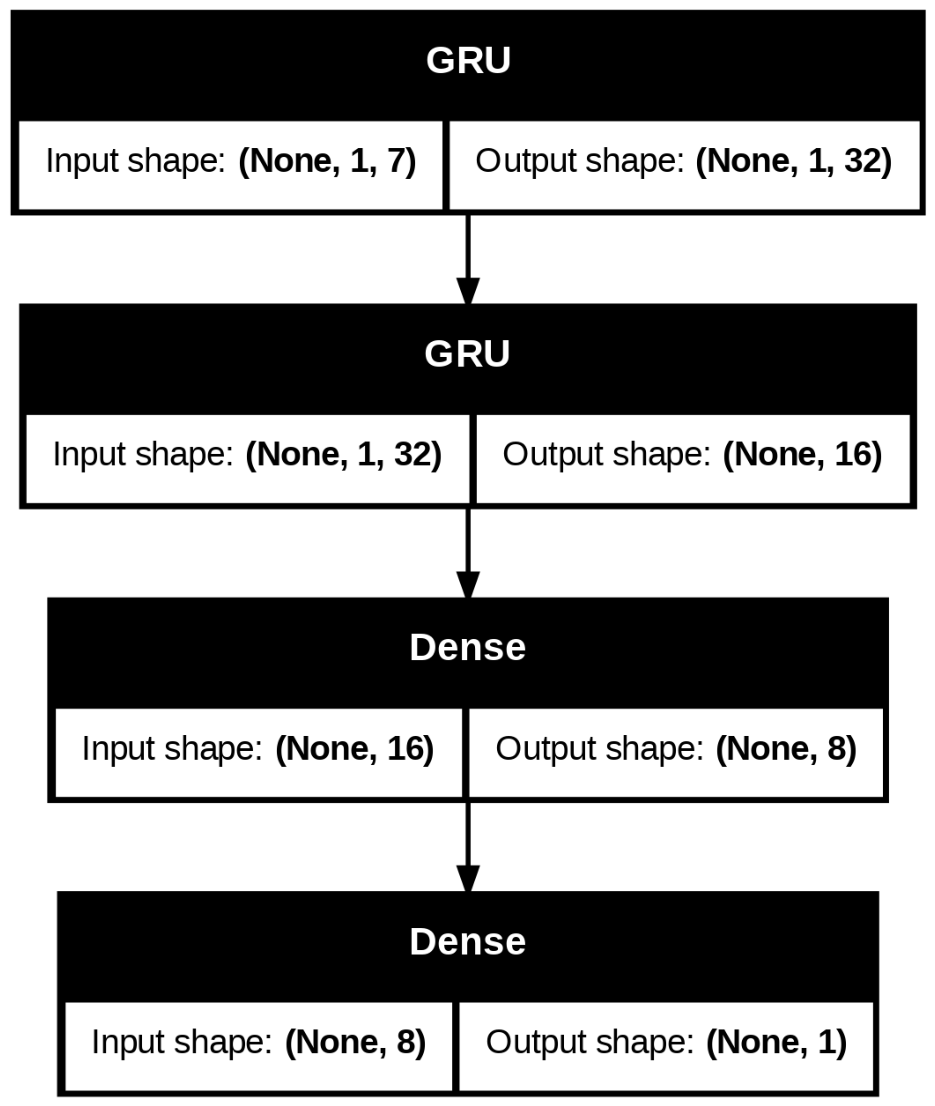
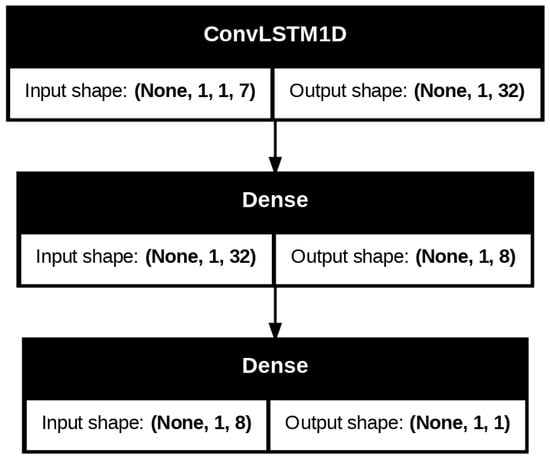
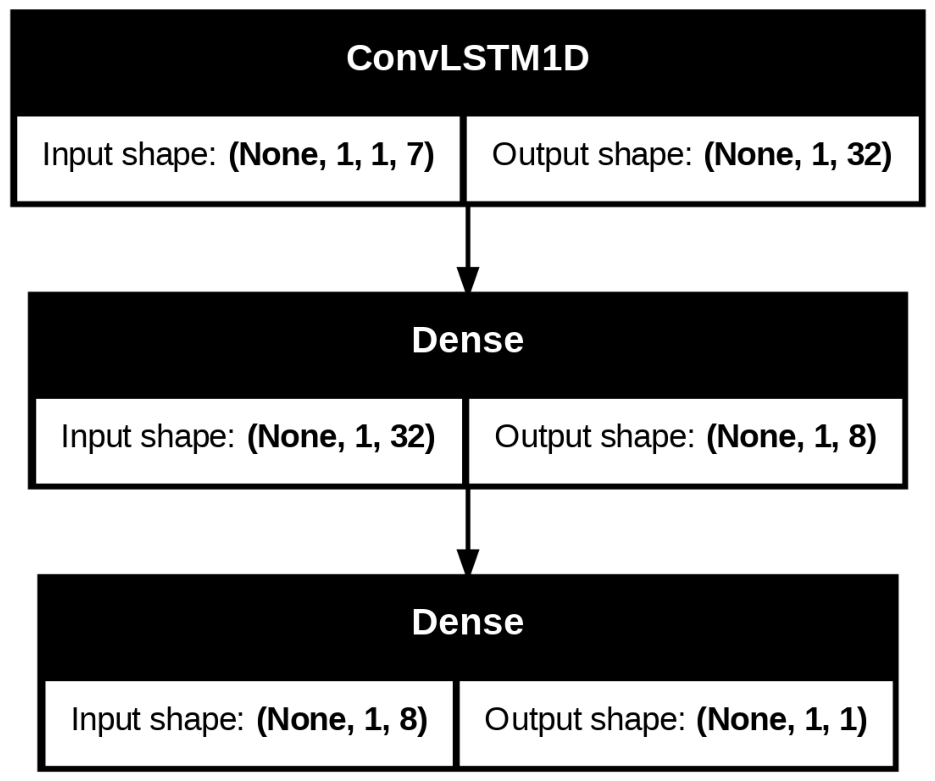
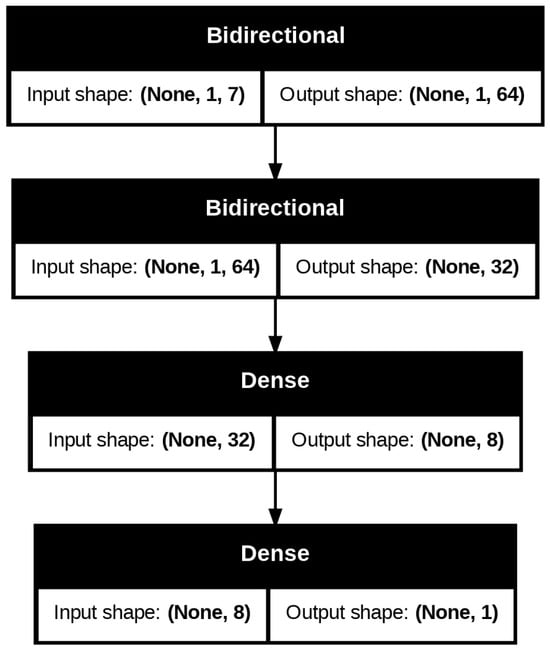
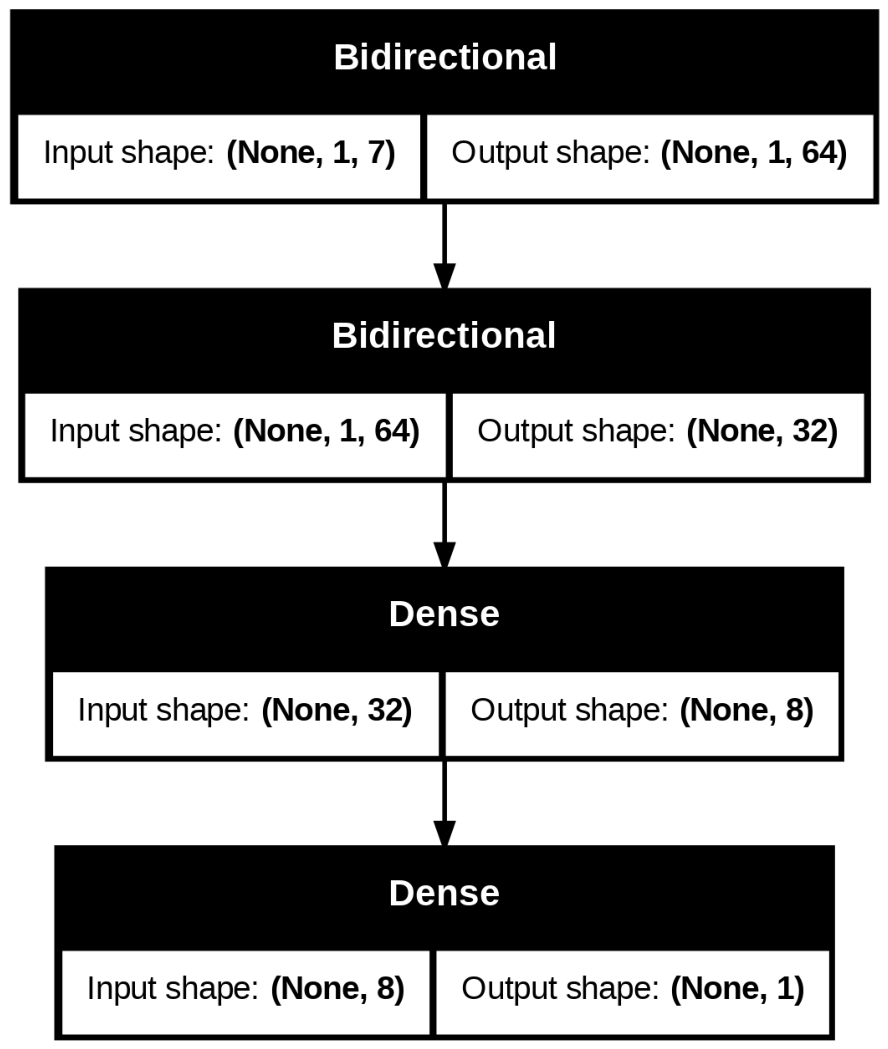
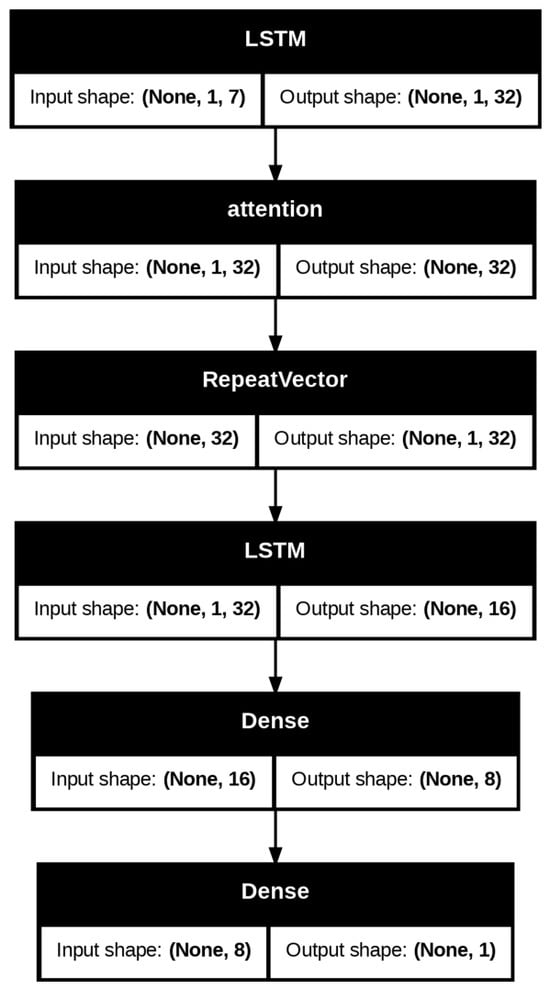
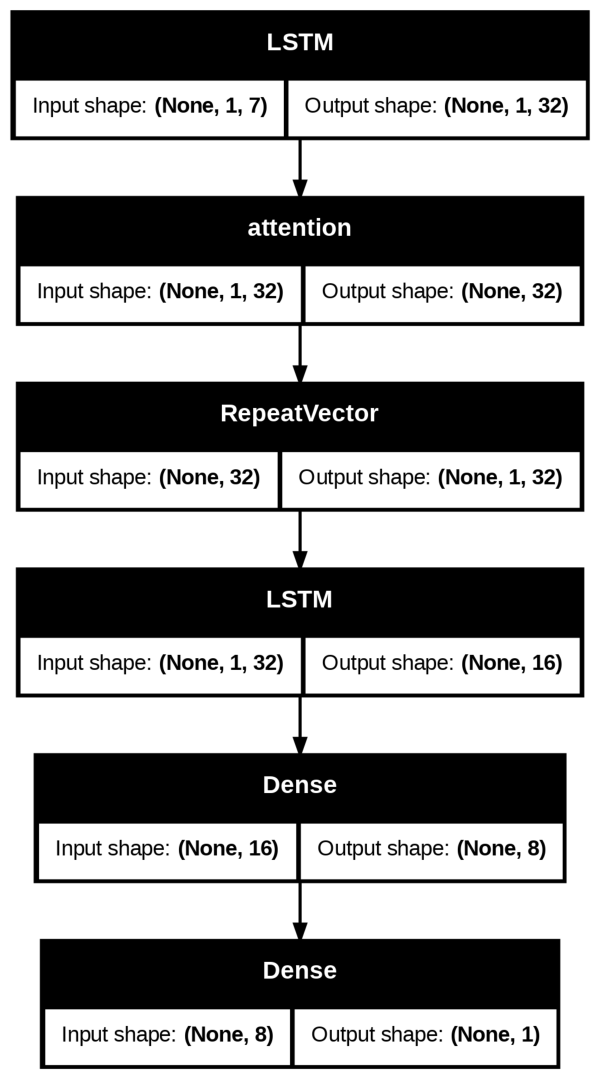
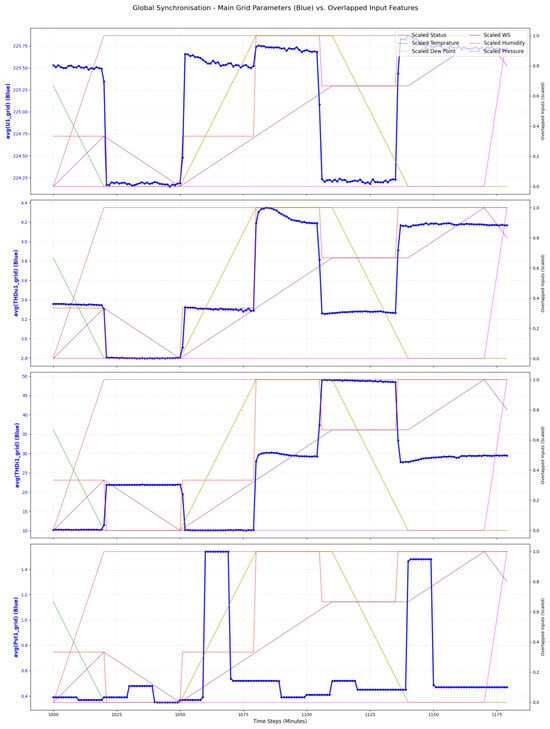
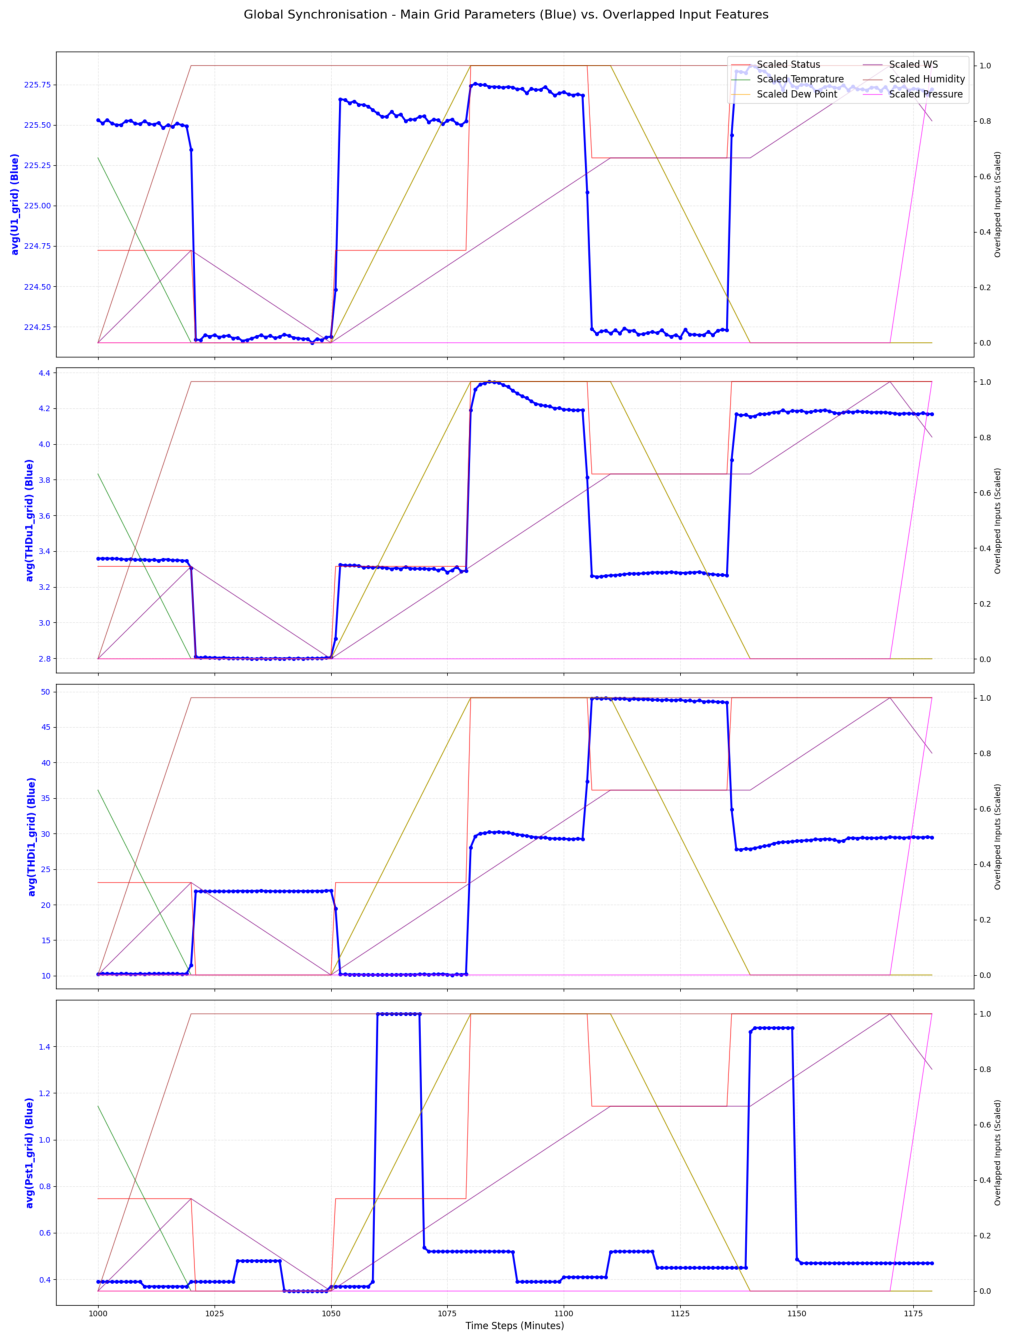
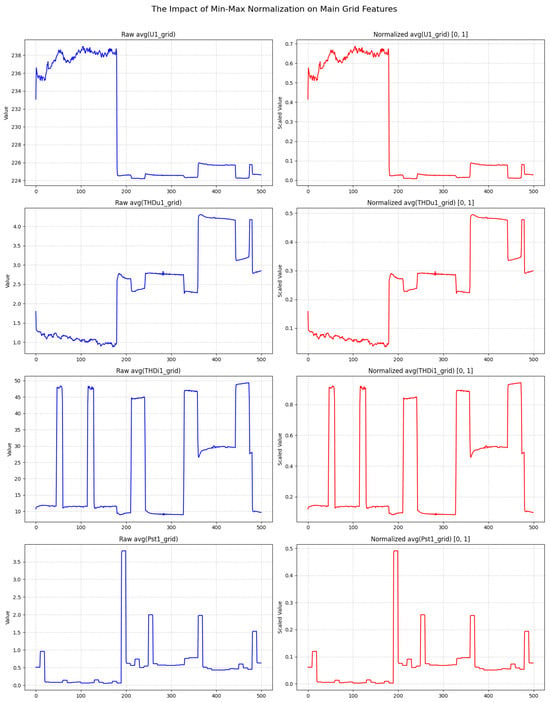
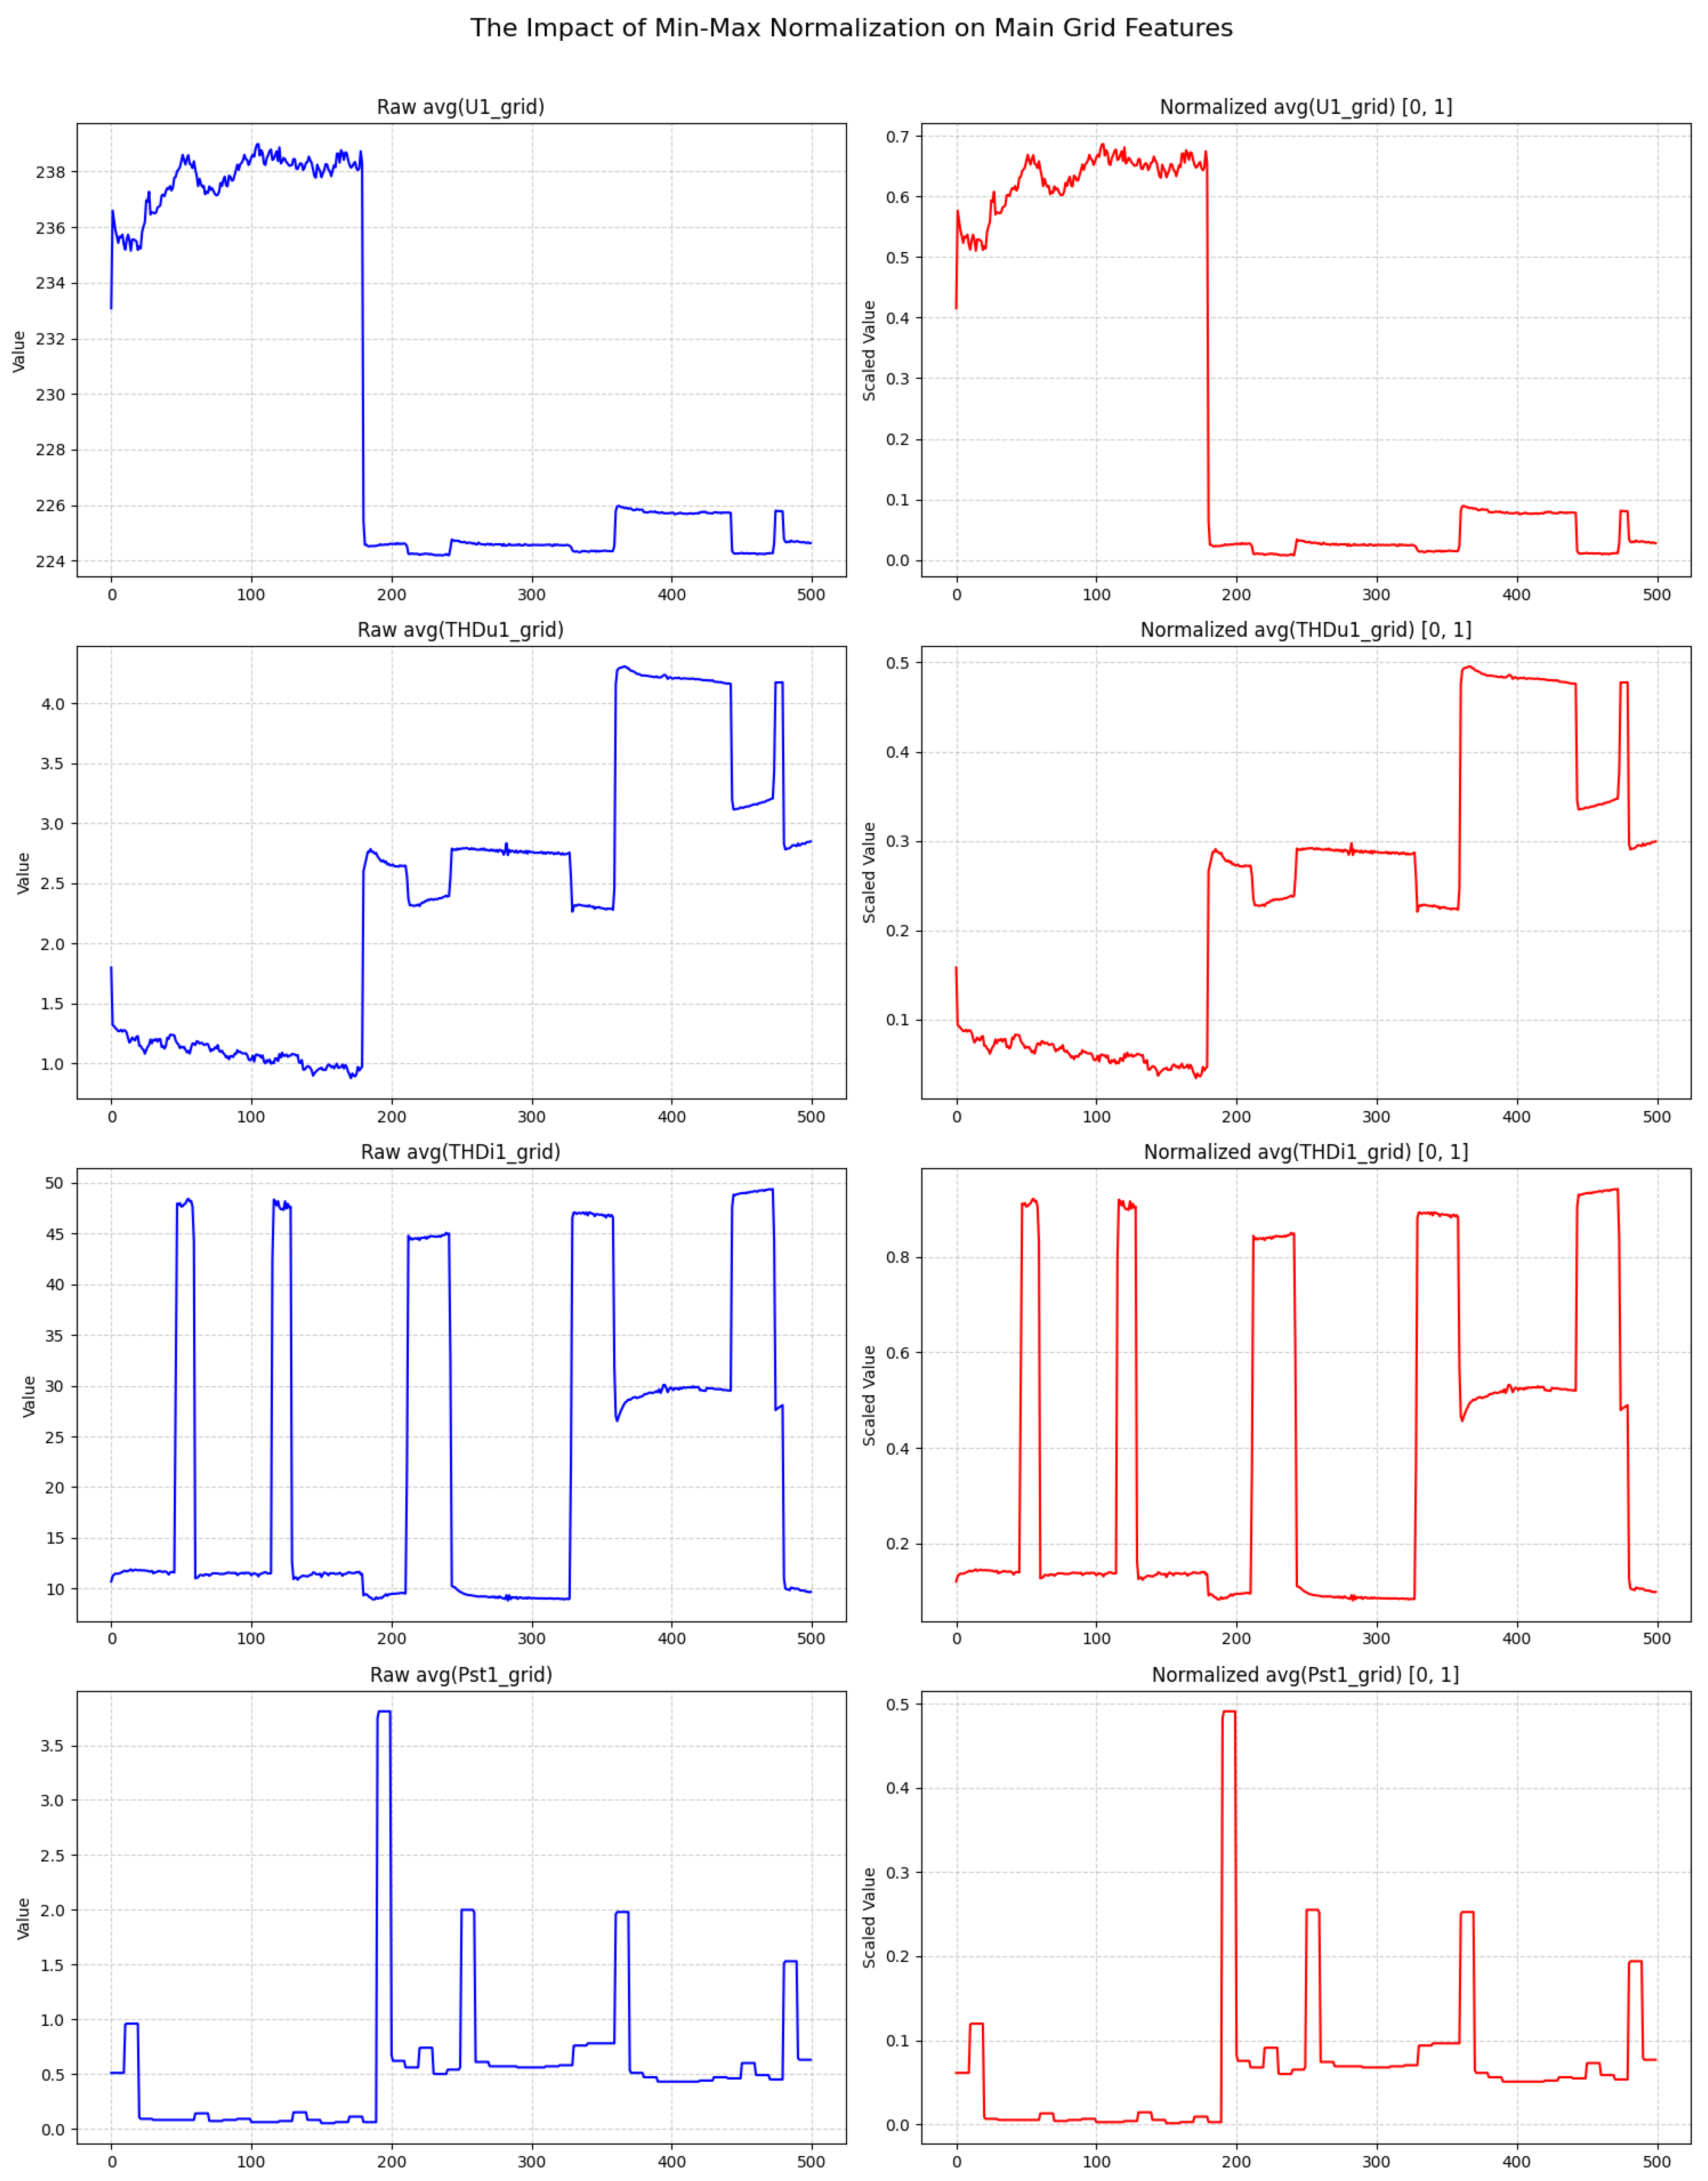
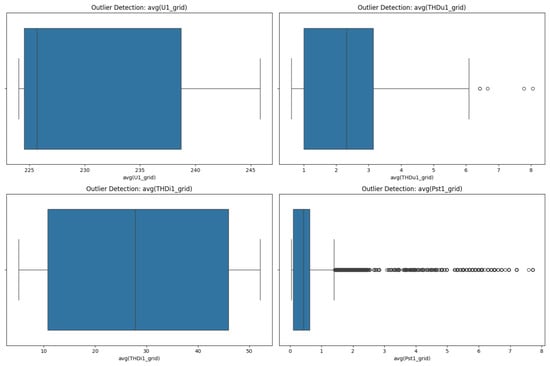
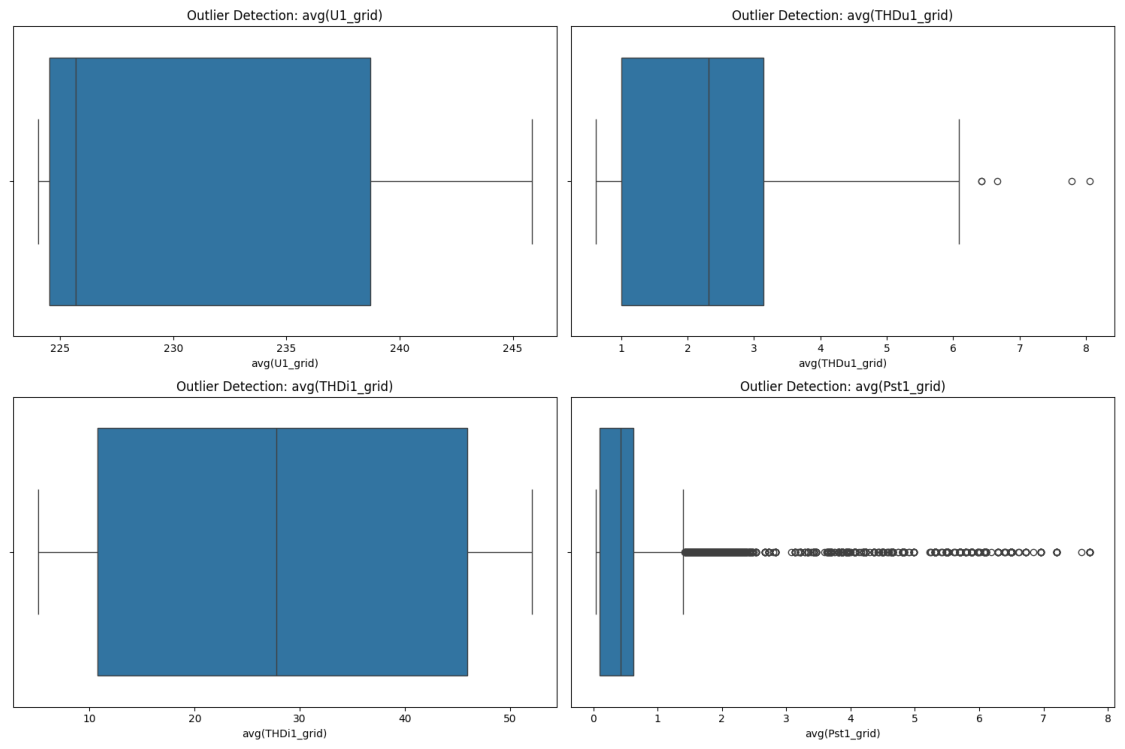
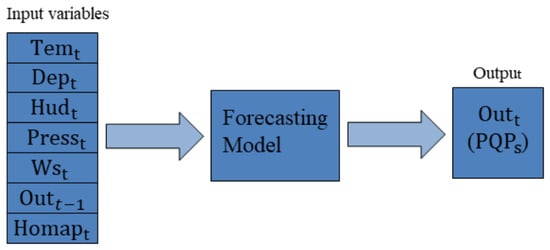
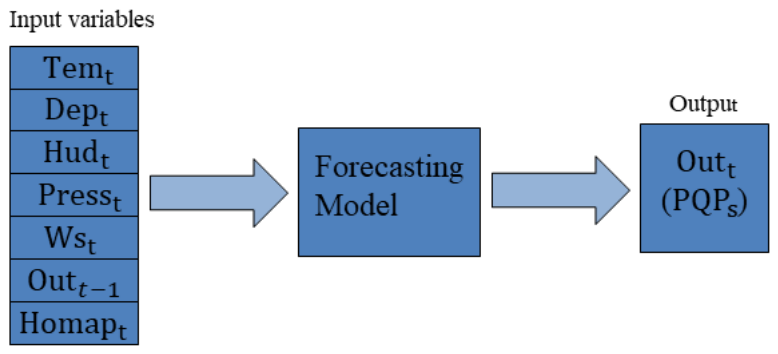
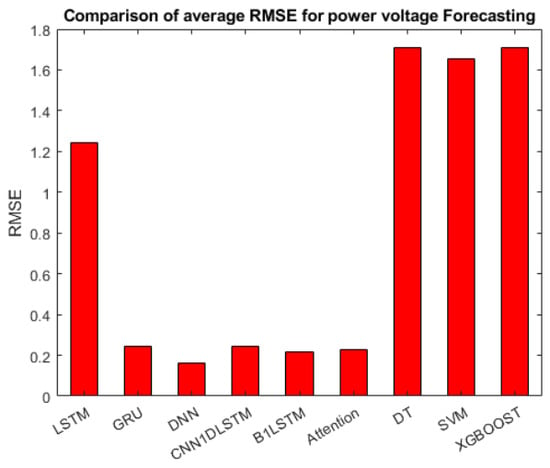
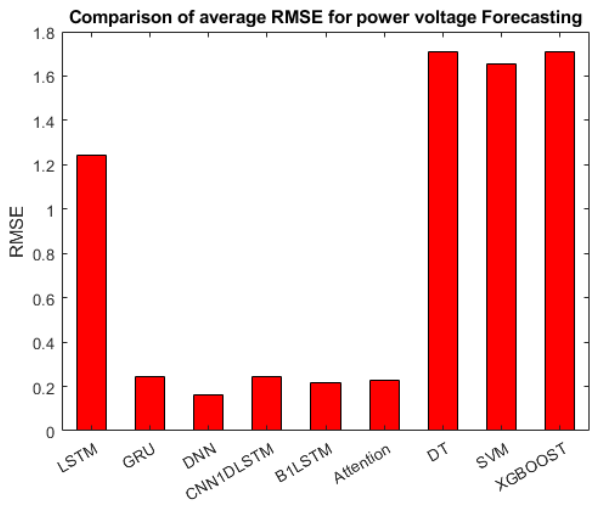
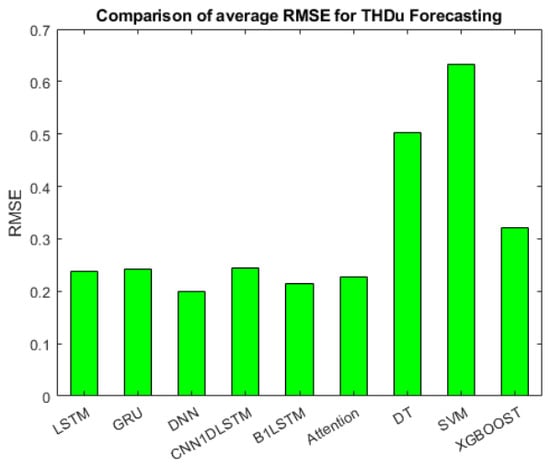
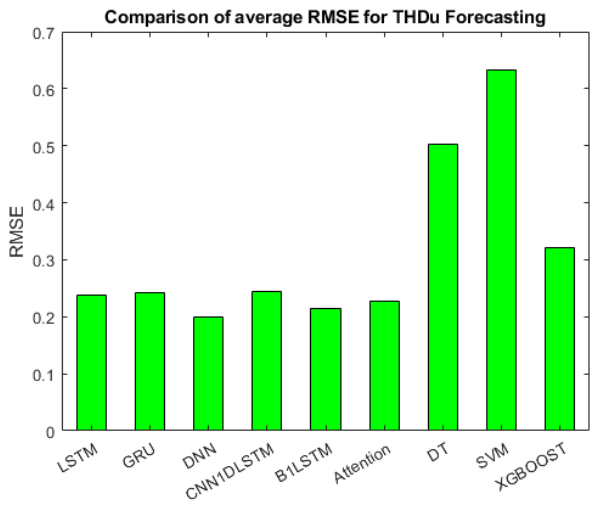
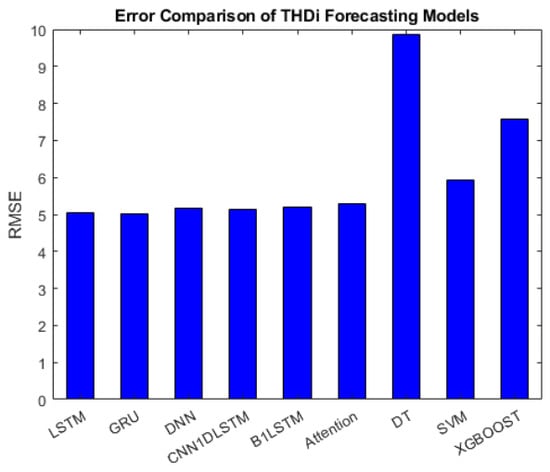
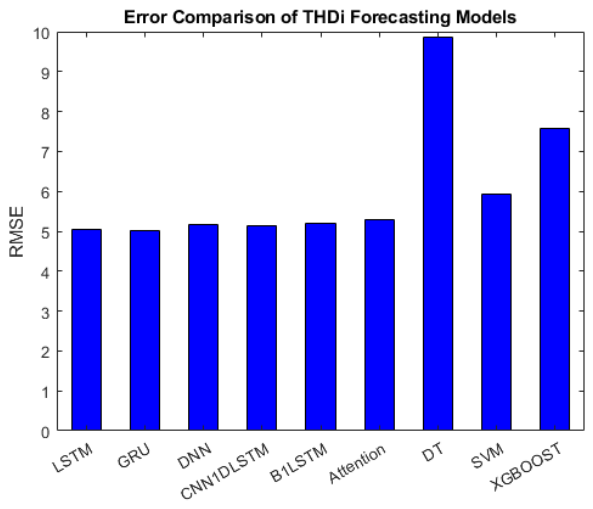
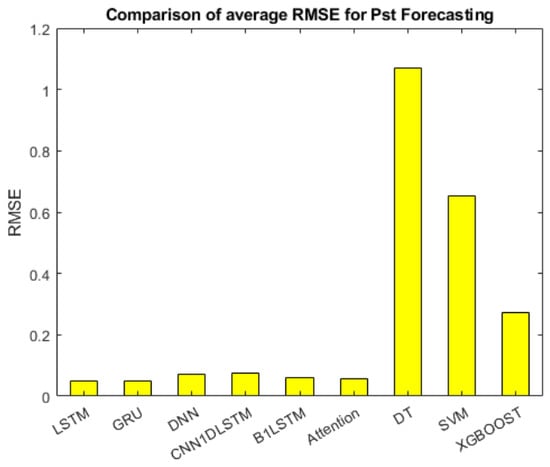
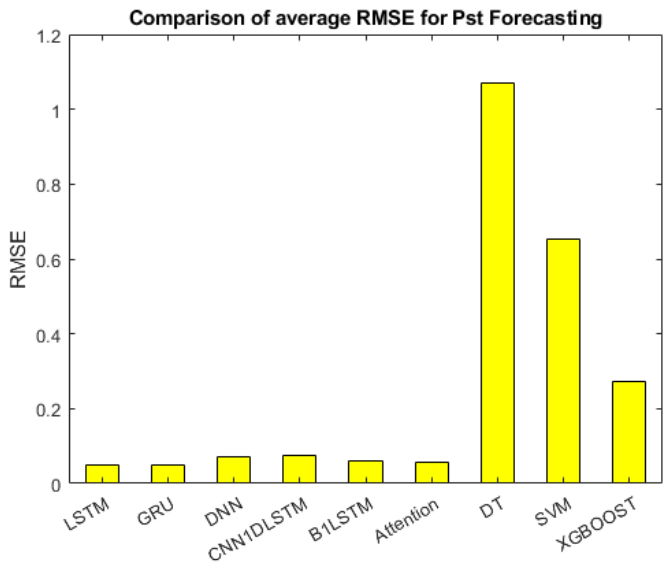
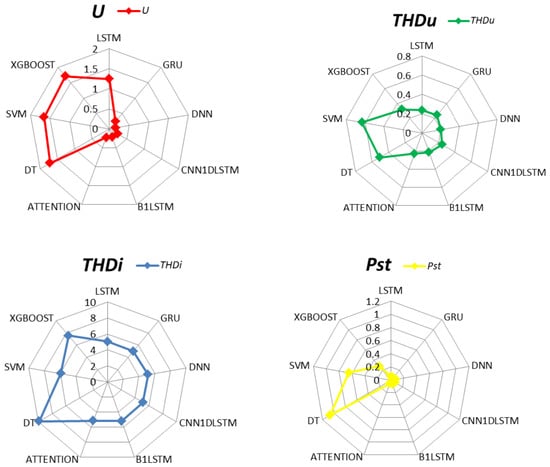
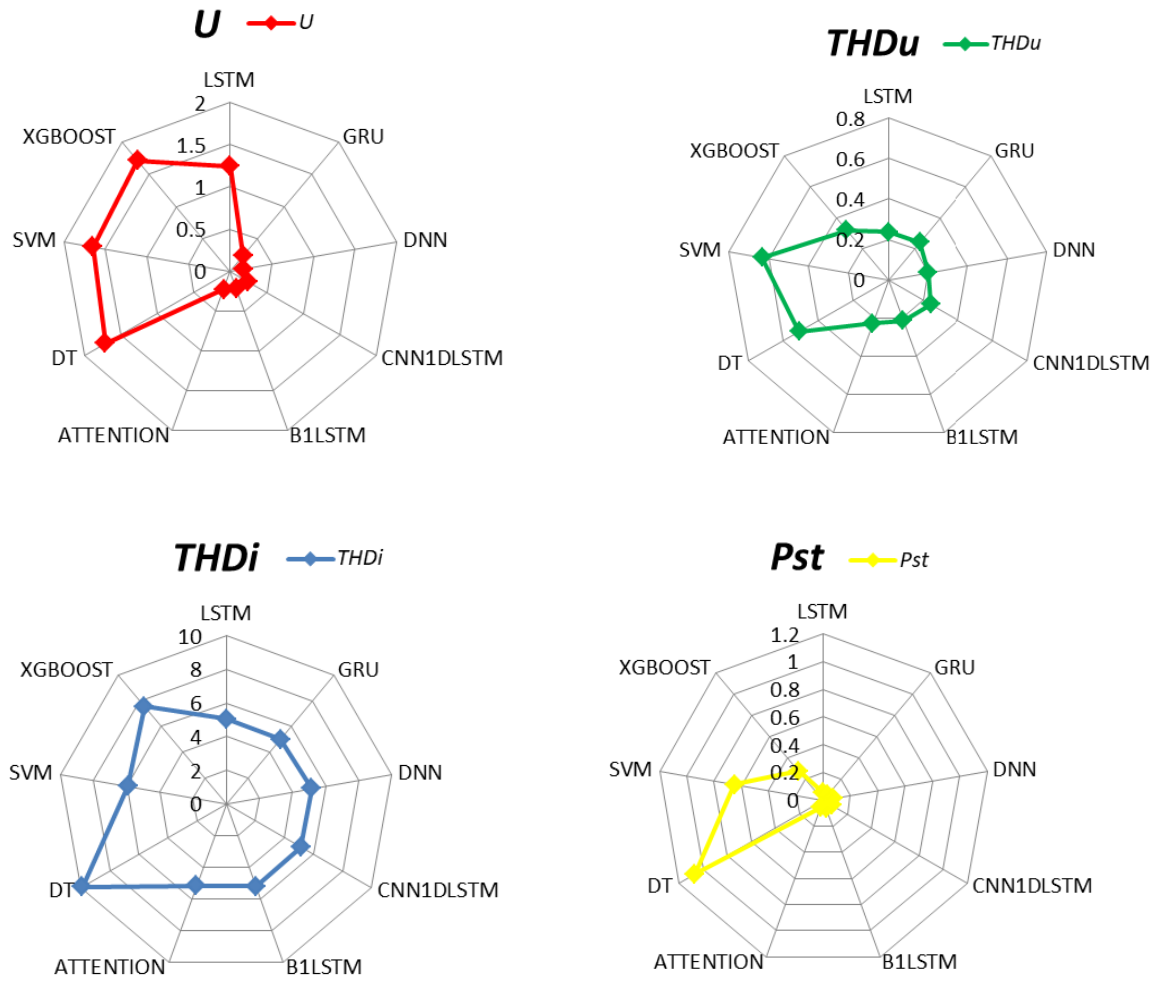
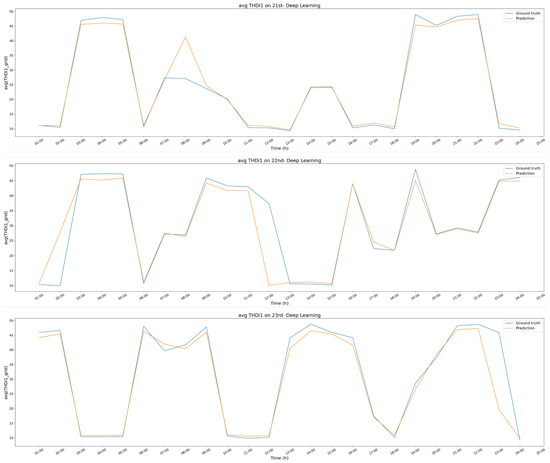
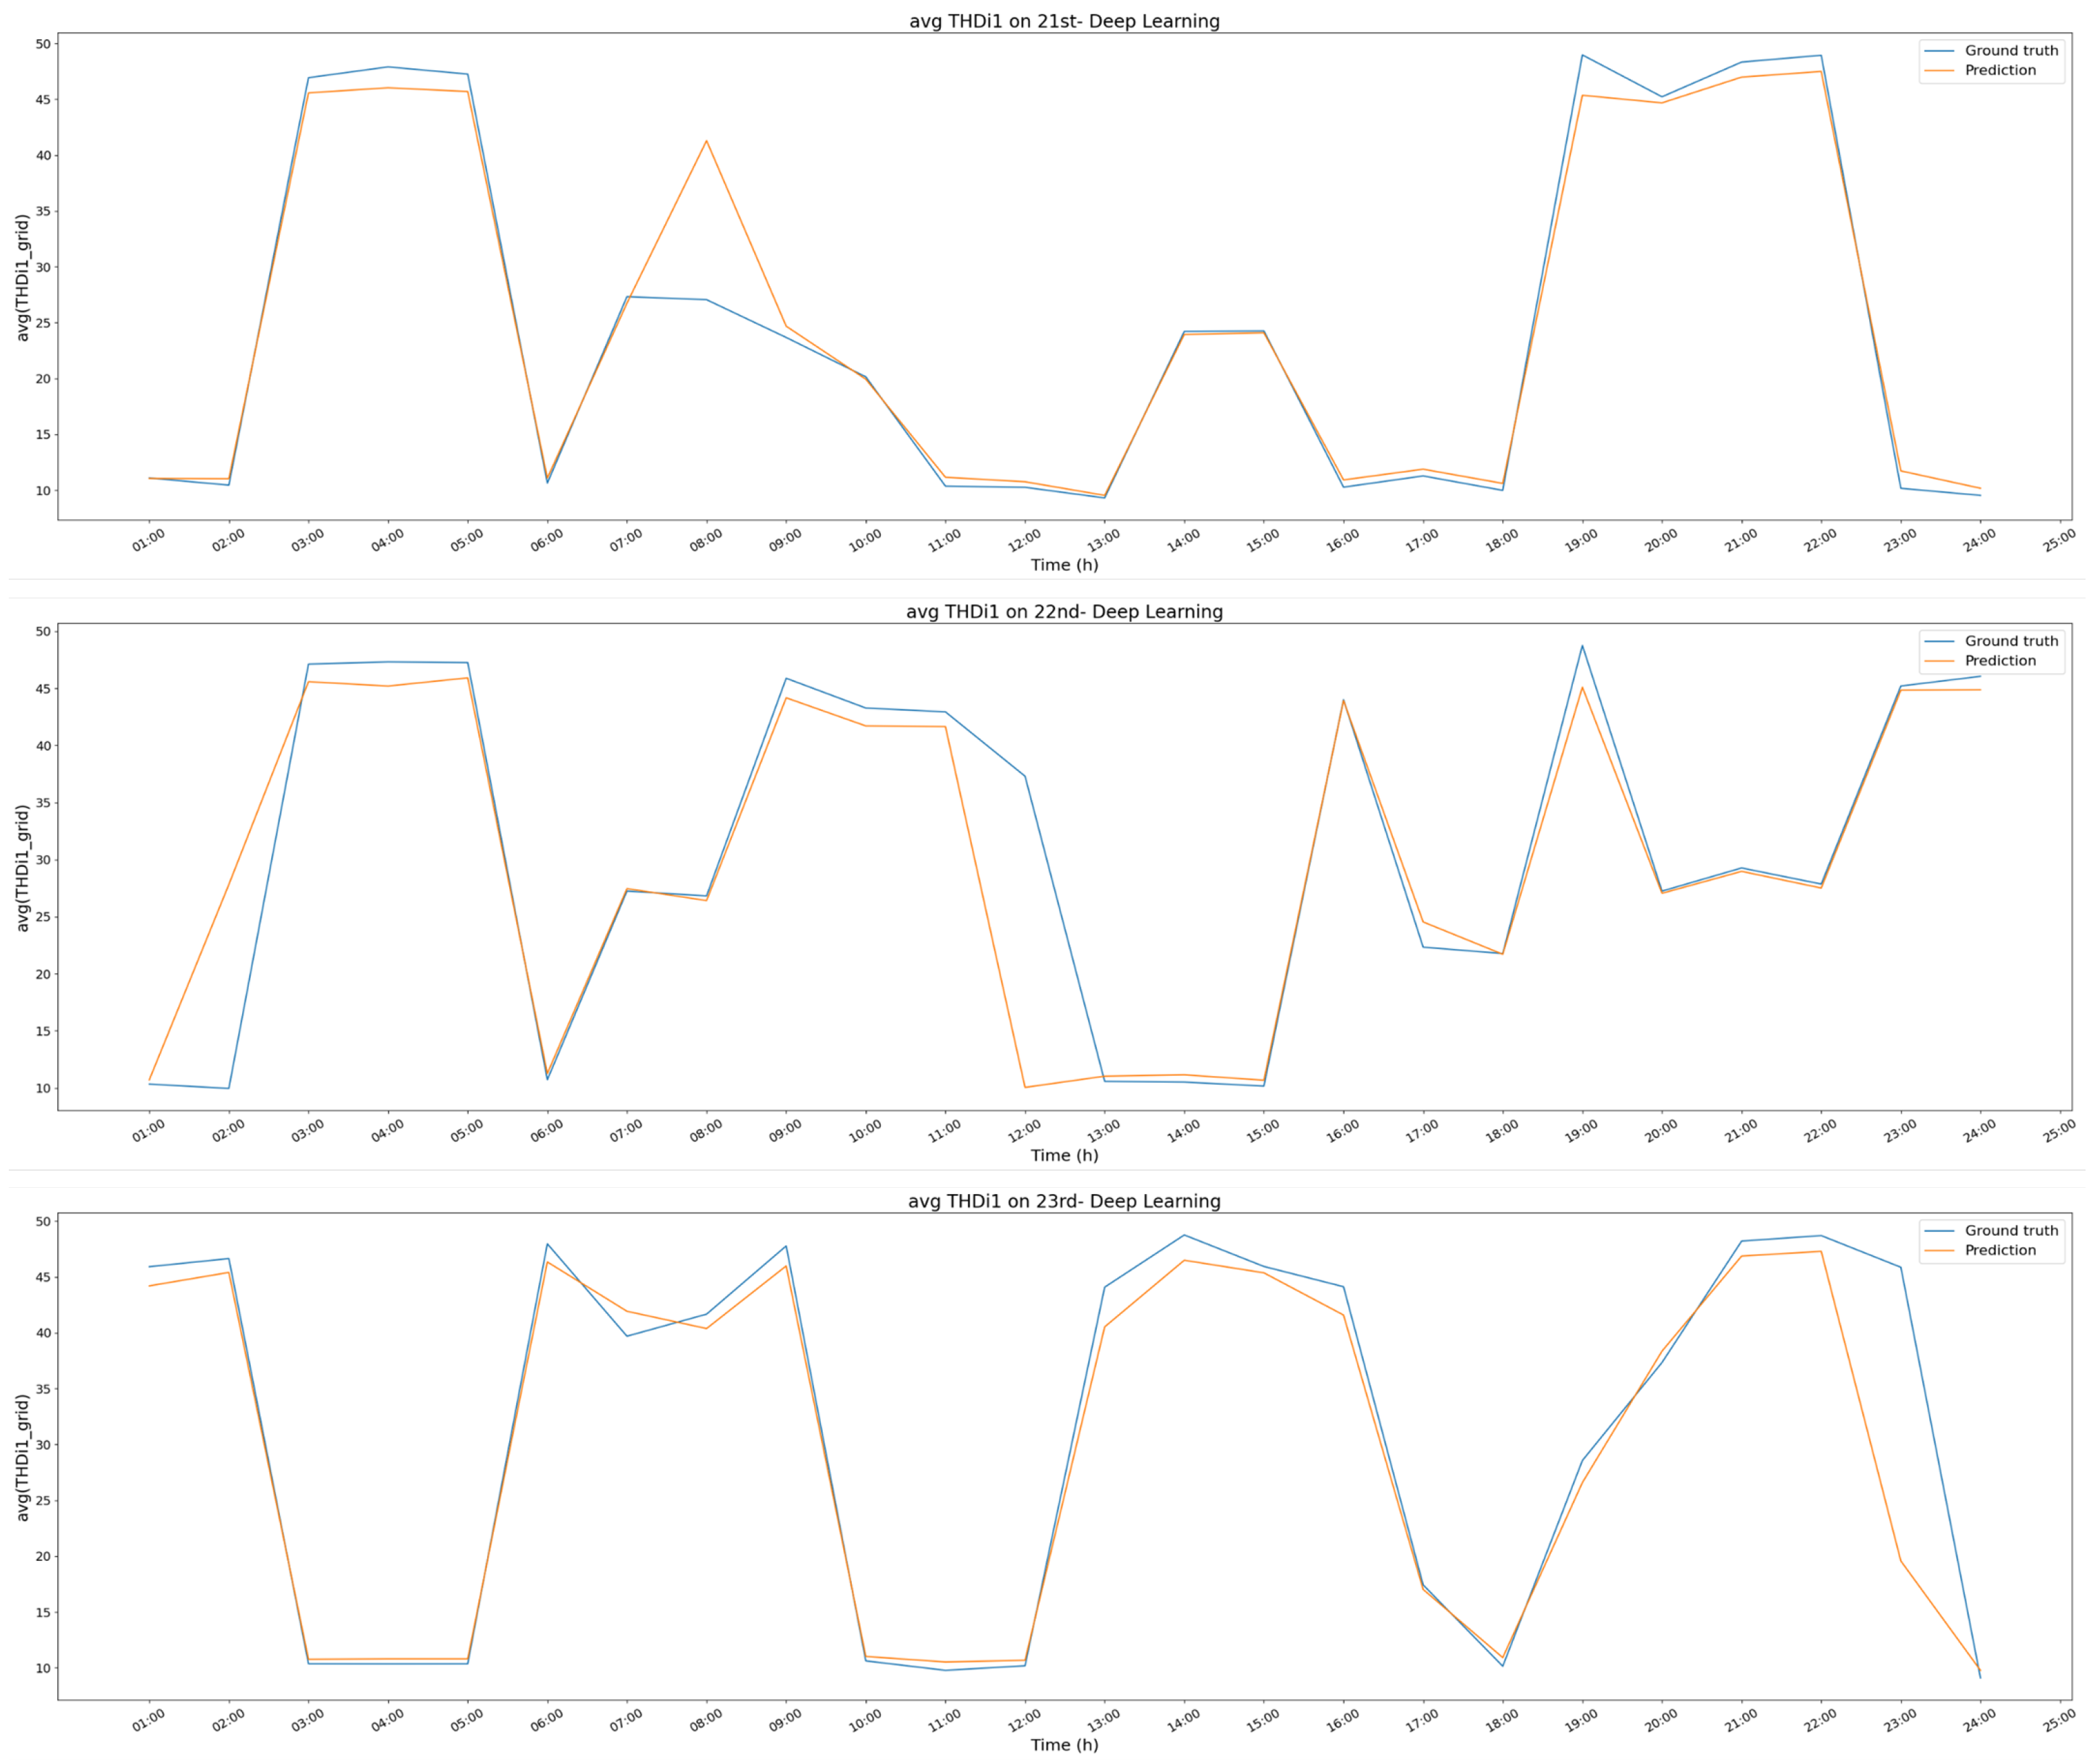
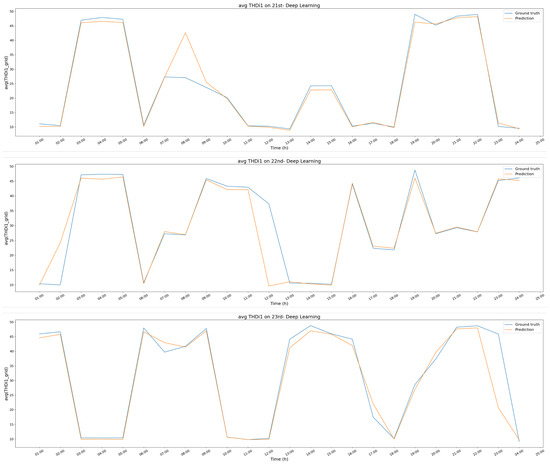
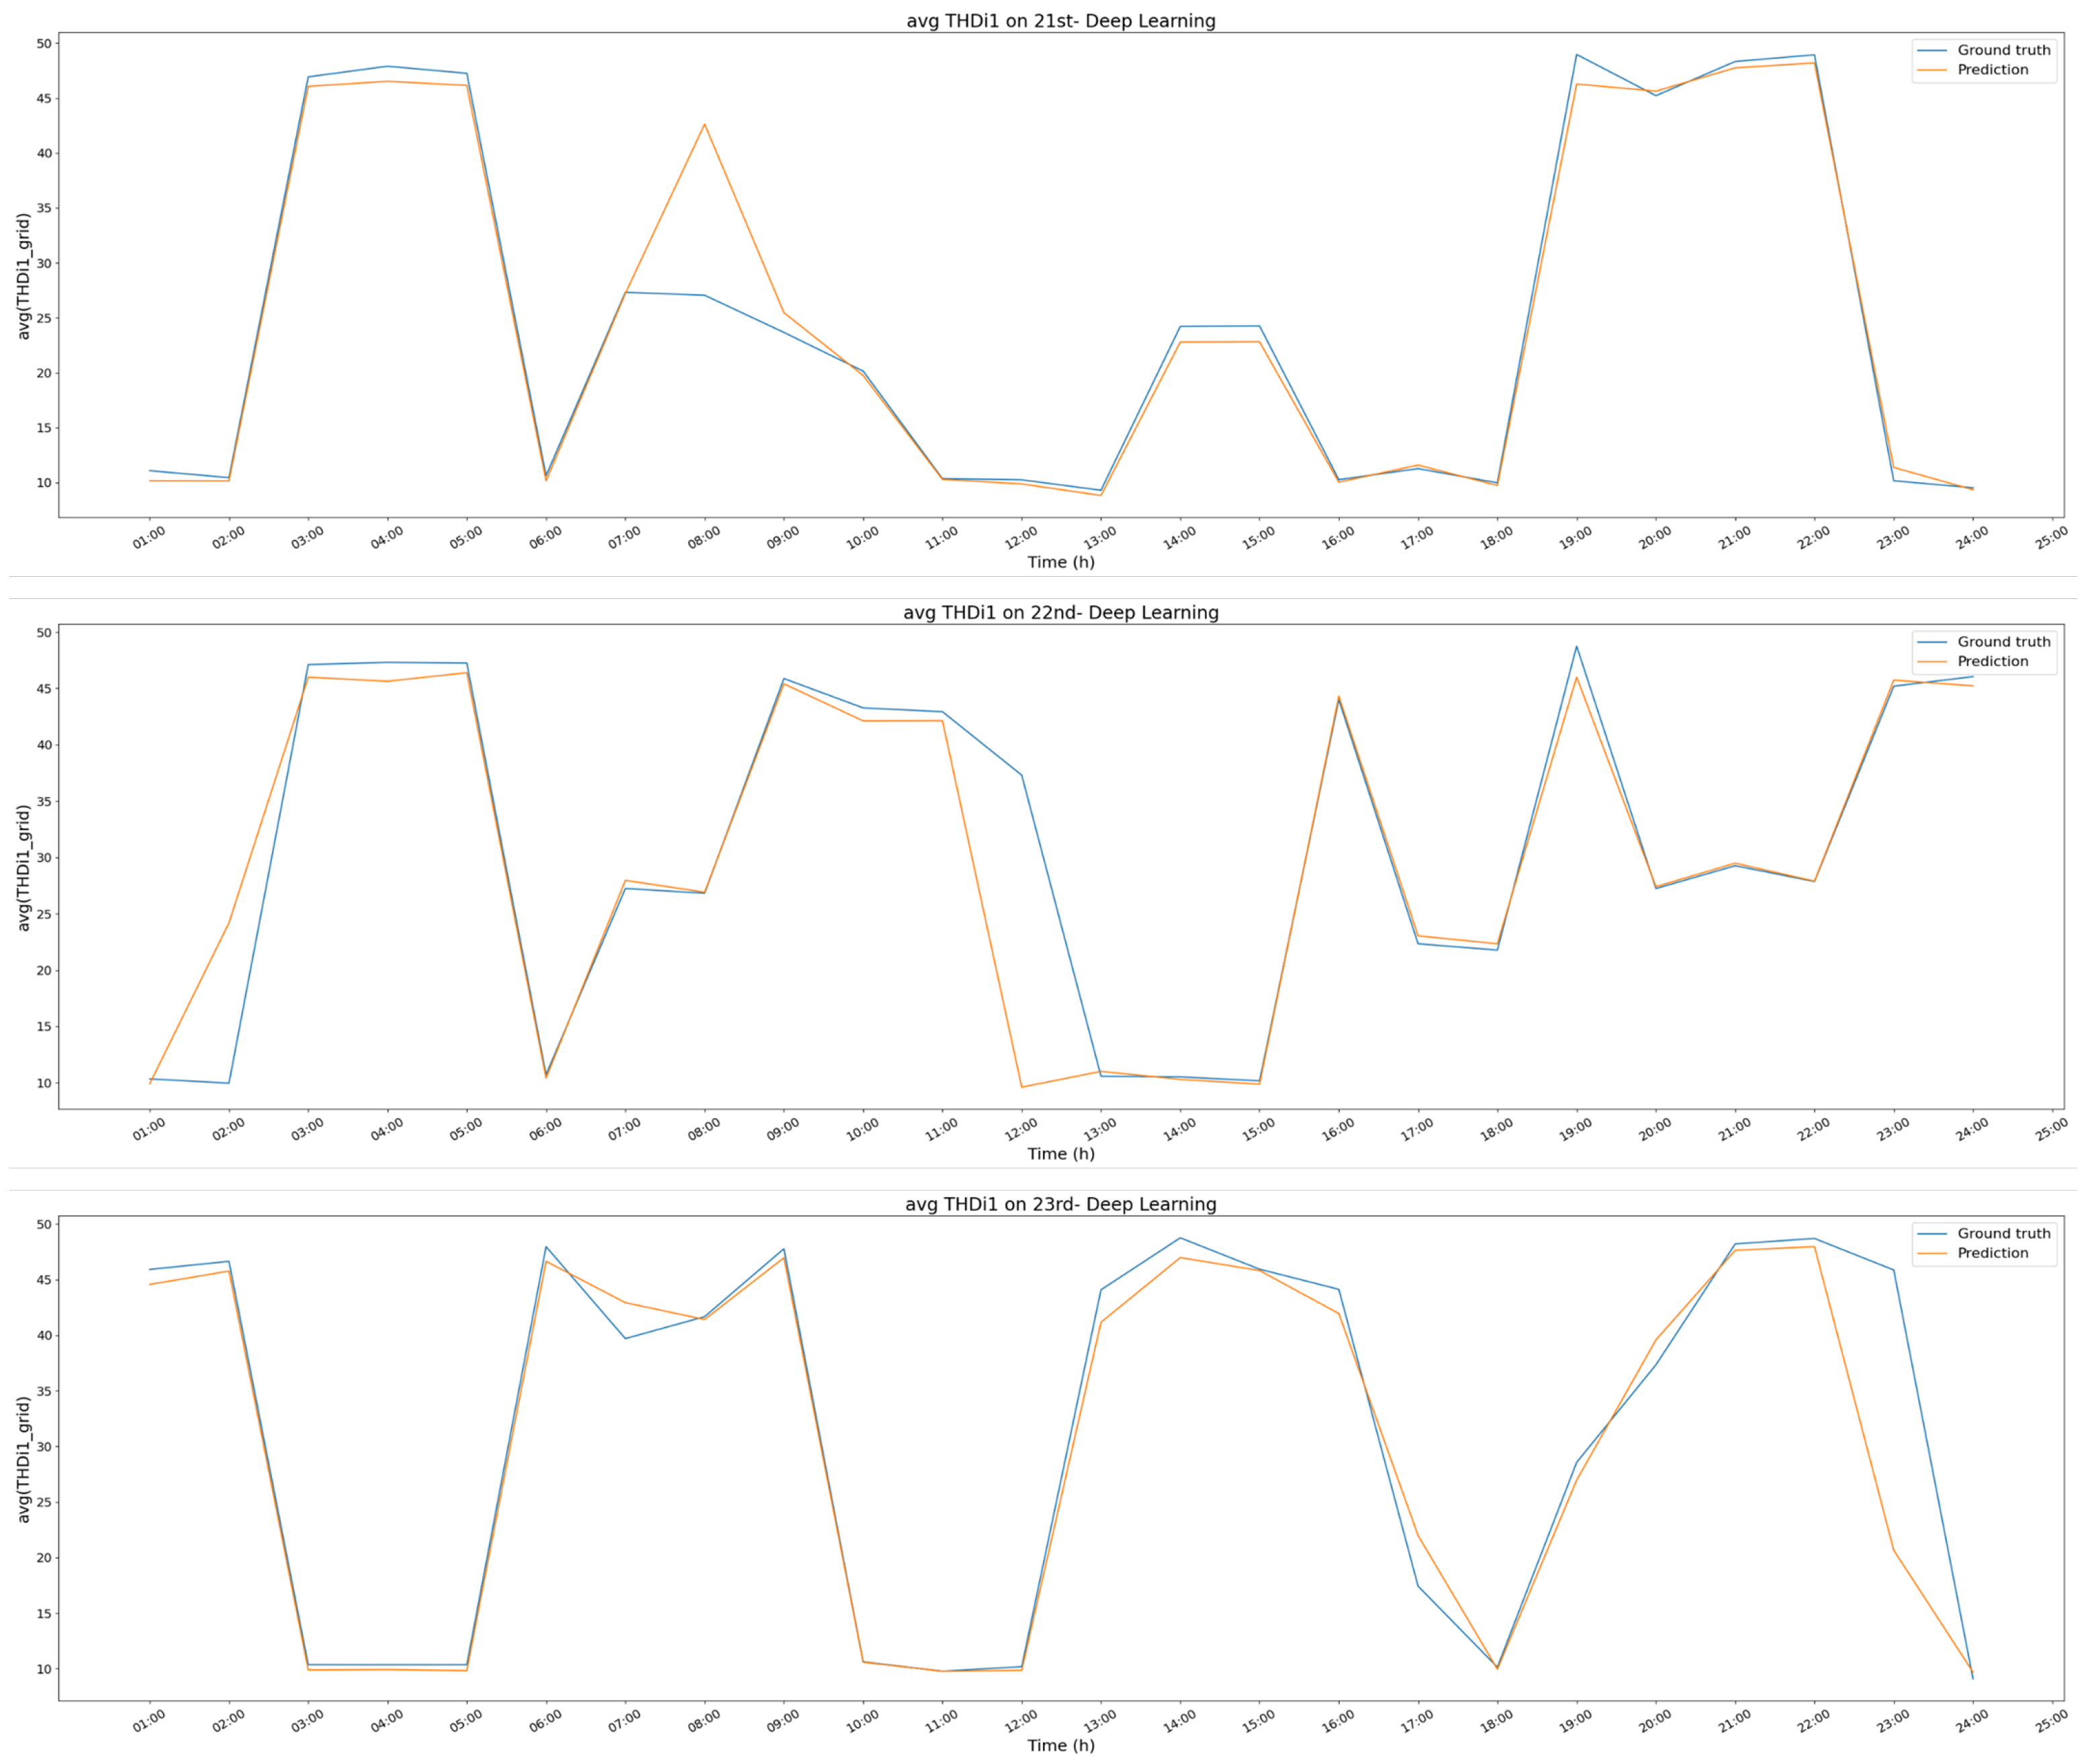
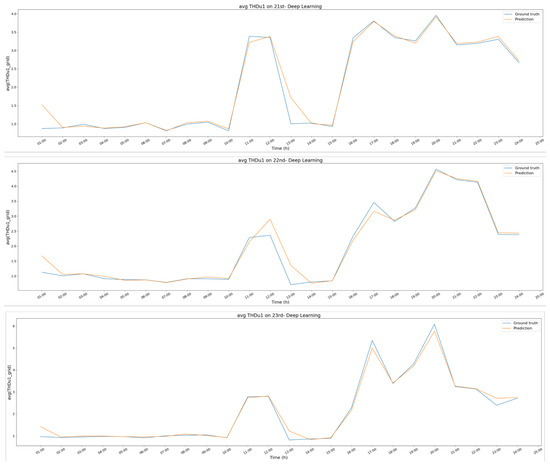
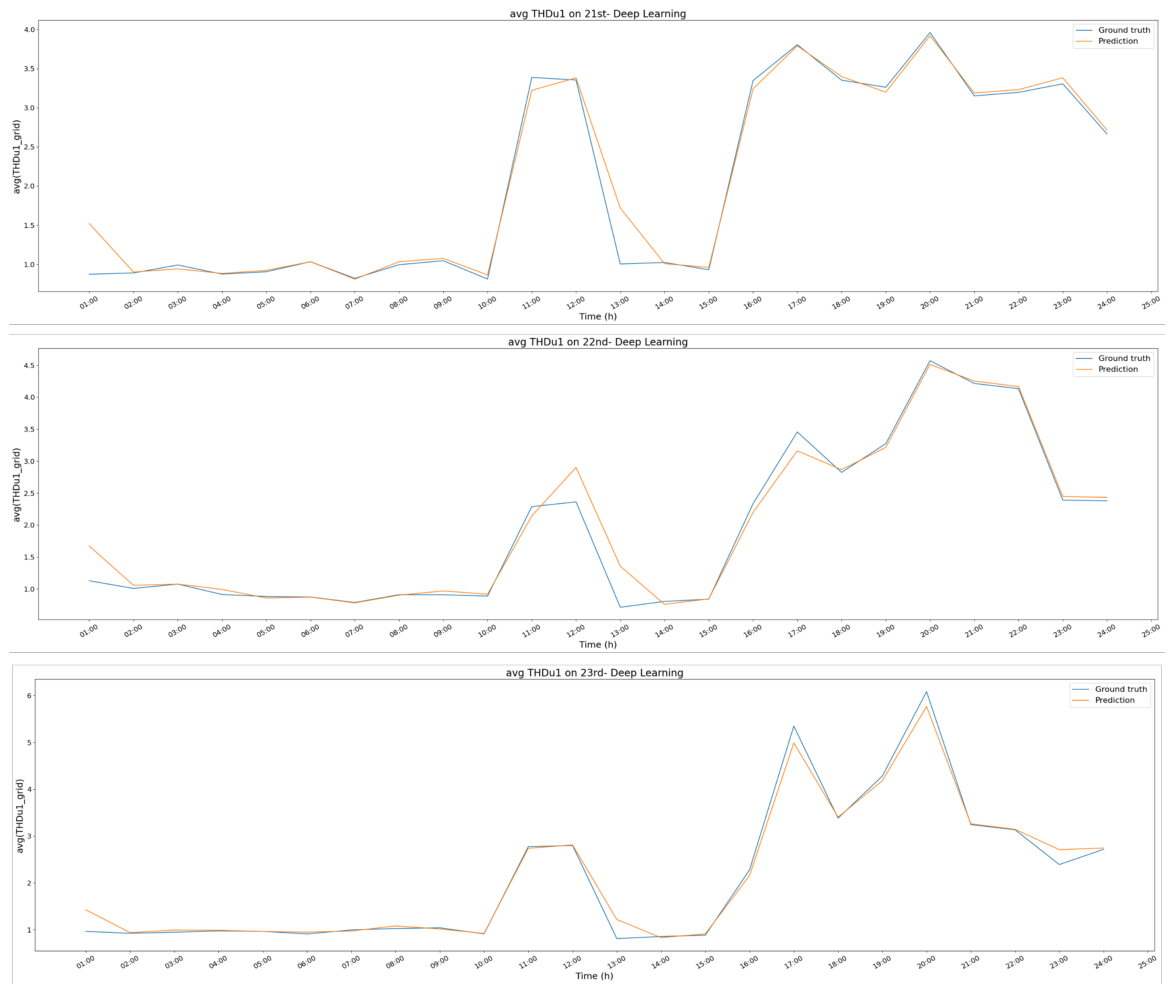
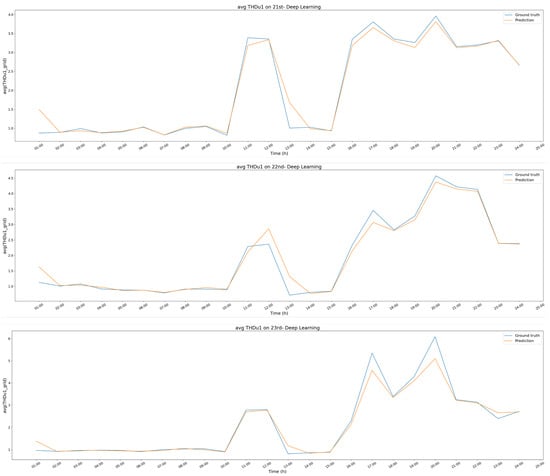
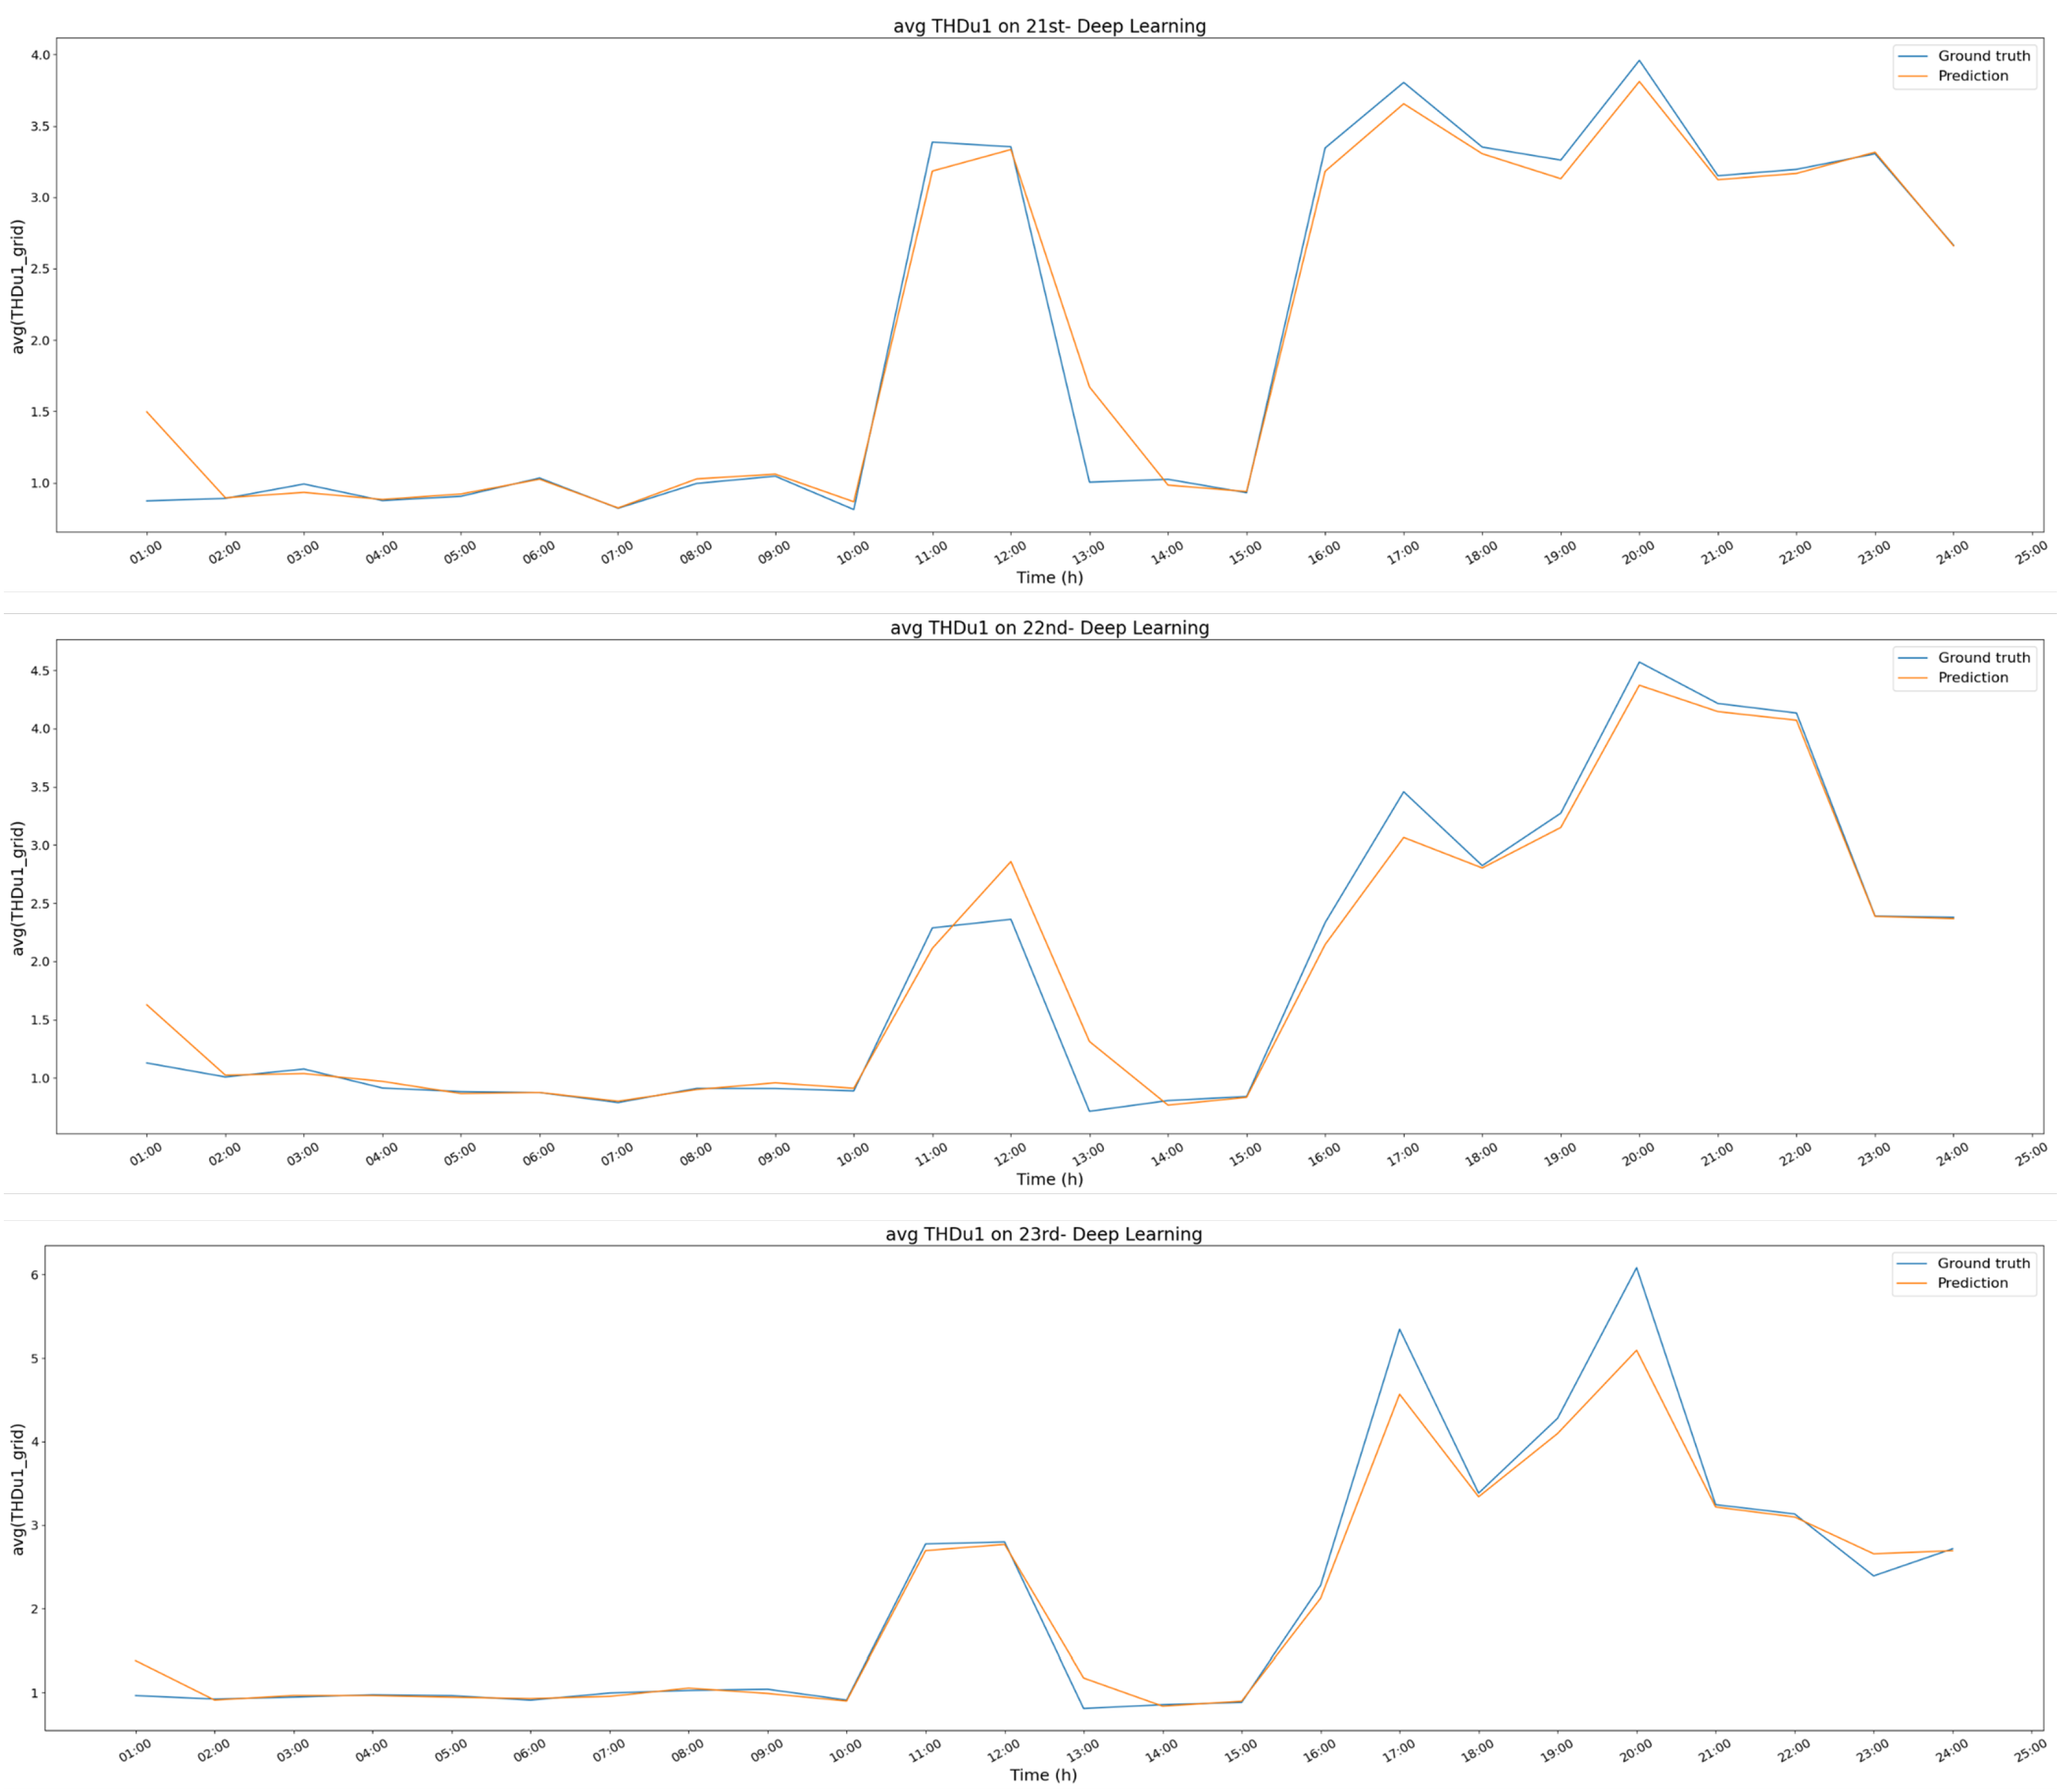
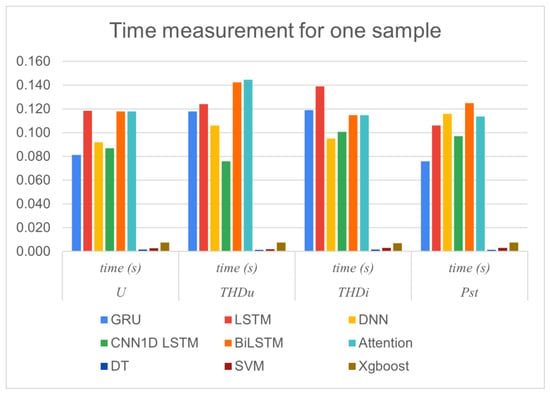
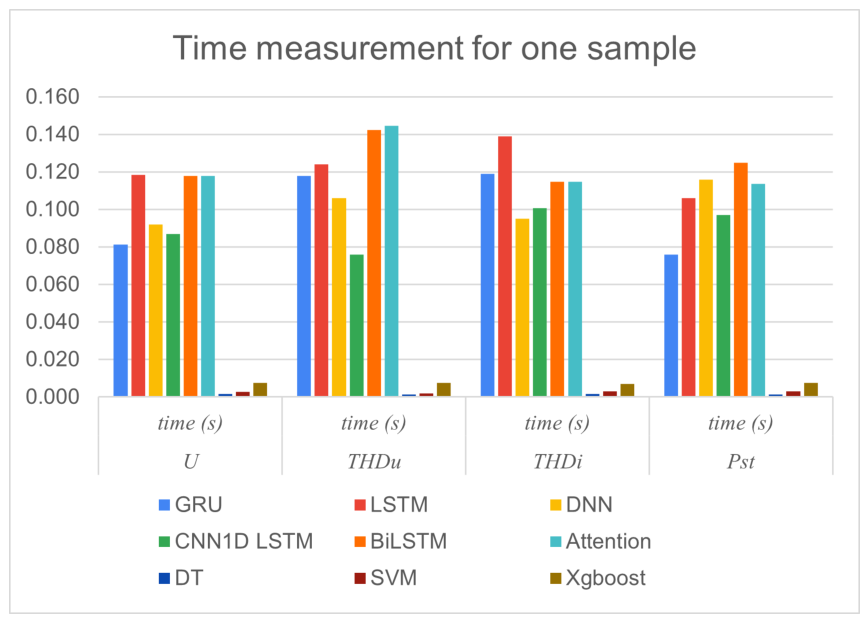
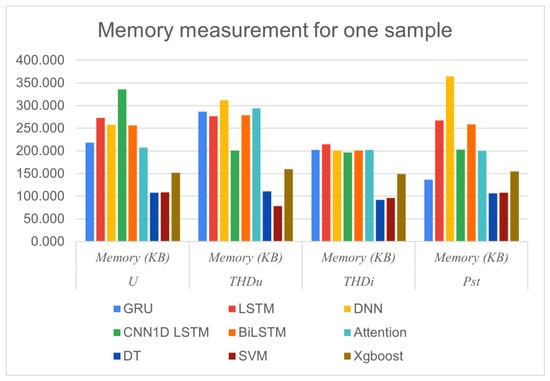
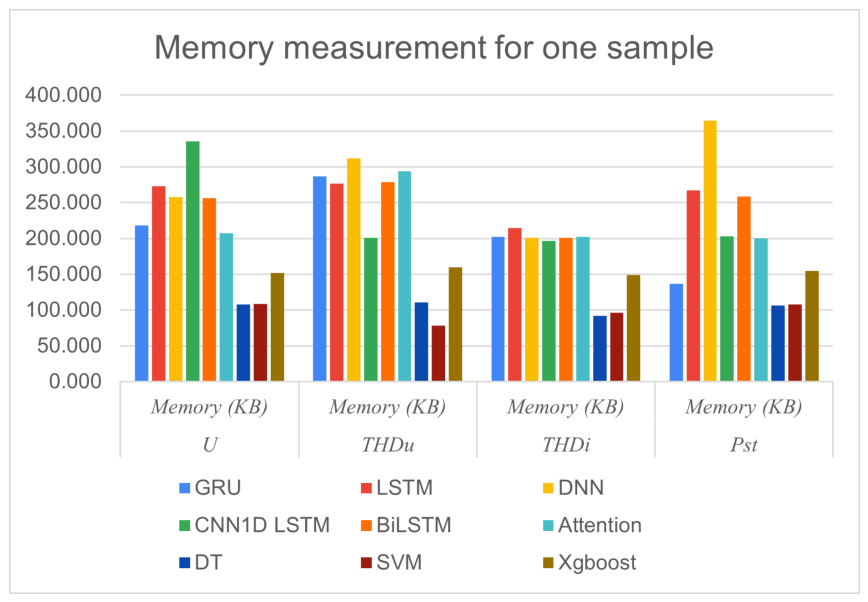

Disclaimer/Publisher’s Note: The statements, opinions and data contained in all publications are solely those of the individual author(s) and contributor(s) and not of MDPI and/or the editor(s). MDPI and/or the editor(s) disclaim responsibility for any injury to people or property resulting from any ideas, methods, instructions or products referred to in the content. |
© 2026 by the authors. Licensee MDPI, Basel, Switzerland. This article is an open access article distributed under the terms and conditions of the Creative Commons Attribution (CC BY) license.