


Abstract
Agrivoltaic systems offer a pathway to simultaneously produce food and electricity, yet their effectiveness depends on how photovoltaic configurations influence crop productivity under specific environmental conditions. This study evaluated land-use efficiency in an Andean–Amazon transition region using monofacial, bifacial, and semitransparent photovoltaic configurations integrated with a maize–bean intercrop. Land-use efficiency was quantified through the Land Equivalent Ratio (LER), combining agricultural yield and electrical energy production. All configurations achieved LER values above 1.0, confirming a clear advantage over separate land use. The semitransparent configuration showed the highest LER (1.95–1.99), followed by bifacial (1.66–1.90) and monofacial systems (1.51–1.72). LER variation was driven primarily by crop productivity rather than energy yield, while normalized photovoltaic performance remained stable across configurations. These results demonstrate that agrivoltaic performance is governed by system-level crop response, emphasizing the role of photovoltaic design in optimizing food–energy systems under tropical mountain conditions.
1. Introduction
Agrivoltaic systems have emerged as a promising approach because they enable dual land use and reduce direct competition between energy infrastructure and agriculture. As first formalized by Dupraz et al. [1], the agrivoltaic concept is based on the joint optimization of crop production and photovoltaic generation within the same land area.
Subsequent reviews have confirmed that agrivoltaic systems can improve land-use efficiency, although system performance depends strongly on site conditions, crop type, and photovoltaic design [2,3].
A central issue in agrivoltaic research is that system performance cannot be evaluated from electrical generation alone. Rather, the key question is how effectively photovoltaic output is balanced with agricultural productivity under a given environmental setting. For this reason, the Land Equivalent Ratio (LER) has become one of the most widely used indicators in agrivoltaic assessment, as it integrates agricultural and energy outputs into a single land-use metric and allows dual-use performance to be compared with separate agricultural and photovoltaic production [1,4]. Recent studies have shown positive land-use advantages for bifacial, elevated, tracked, and semitransparent systems, but also that the magnitude of this advantage varies substantially depending on crop retention and design intensity [5,6].
Despite rapid progress in agrivoltaic research, humid tropical mountain environments remain poorly represented. In the Andean–Amazon transition region of Peru, strong topographic variability, persistent atmospheric moisture, cloudiness, and seasonal fluctuations in solar radiation can affect both photovoltaic performance and crop response, making direct extrapolation from temperate, arid, or highly managed systems inappropriate. Weselek et al. [3] and Mamun et al. [7] emphasized that agrivoltaic outcomes are highly site-dependent, while more recent reviews have further highlighted the need for climate-specific and technology-specific assessment [8,9]. This limitation is particularly relevant in Peru, where photovoltaic development is gaining importance, but agrivoltaic evidence from the Andean–Amazon transition remains scarce [10]. In Amazonas, solar irradiation is spatially and temporally heterogeneous, reinforcing the need for site-specific evaluation of agrivoltaic systems under real operating conditions [11,12].
Technology choice is another unresolved issue. Monofacial, bifacial, and semitransparent modules differ not only in nominal power and electrical response, but also in the way they redistribute incident radiation within the production system. Garrod and Ghosh [13] and Jahangir et al. [14] showed that bifacial systems respond to distinct radiative conditions compared with conventional opaque modules, whereas Gorjian et al. [15] and Hu et al. [16] highlighted that semitransparent modules introduce an explicit trade-off between electricity generation and radiation transmission to the crop layer. These differences are particularly relevant in agrivoltaic systems because land-use efficiency depends on the combined response of both system components rather than on the maximization of either one in isolation.
This study forms part of a broader experimental research platform on agrivoltaic systems established in an Andean–Amazon transition region of Peru to evaluate microclimatic dynamics, environmental performance, and climate–energy–water–food nexus interactions under real operating conditions. Within this framework, the present study assesses land-use efficiency by integrating agricultural productivity and photovoltaic energy generation in agrivoltaic systems equipped with monofacial, bifacial, and semitransparent photovoltaic modules. Specifically, this study evaluates how different photovoltaic configurations within an agrivoltaic system influence the balance between food and electricity production in a maize–common bean intercrop under humid tropical mountain conditions, using the Land Equivalent Ratio (LER) as an integrated indicator.
2. Materials and Methods
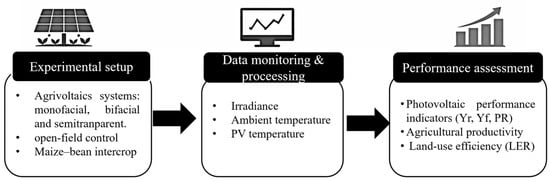
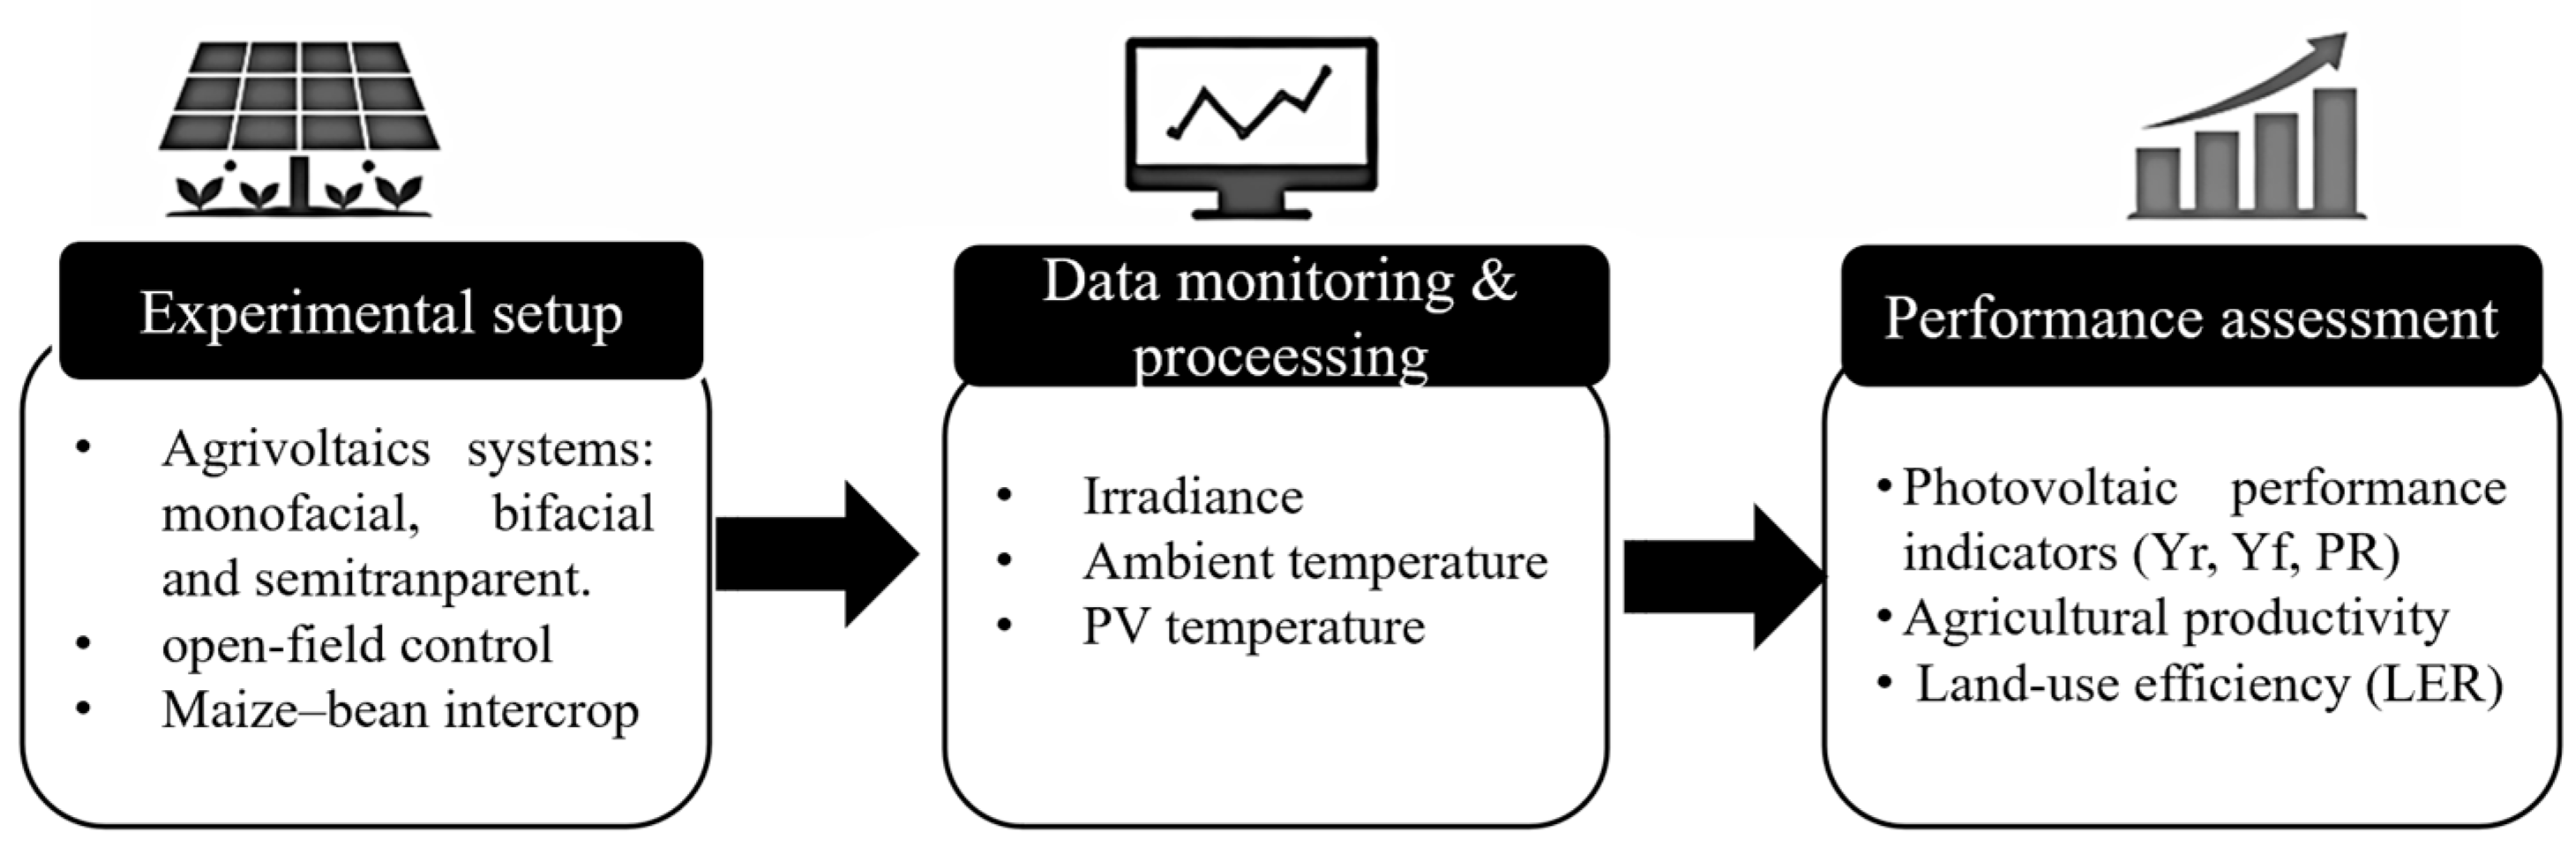
The methodological framework of this study is organized into three main stages, as illustrated in Figure 1. These include the experimental setup of the agrivoltaic systems and control conditions, the monitoring and processing of climatic data, and the subsequent performance assessment integrating photovoltaic indicators, agricultural productivity, and land-use efficiency.
Figure 1.
Methodological framework of this study.
2.1. Experimental Details
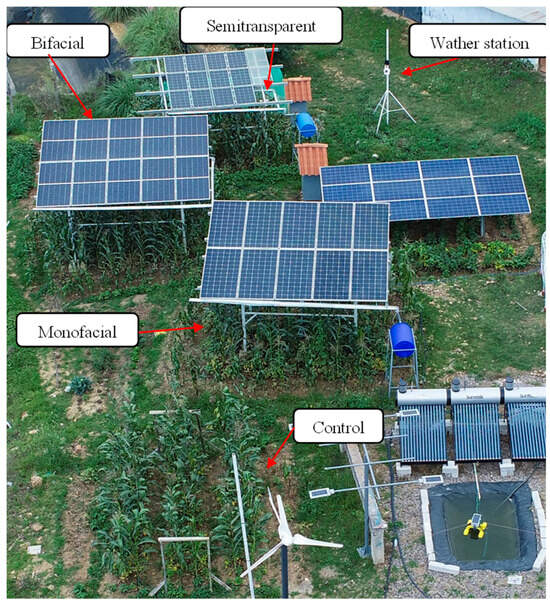
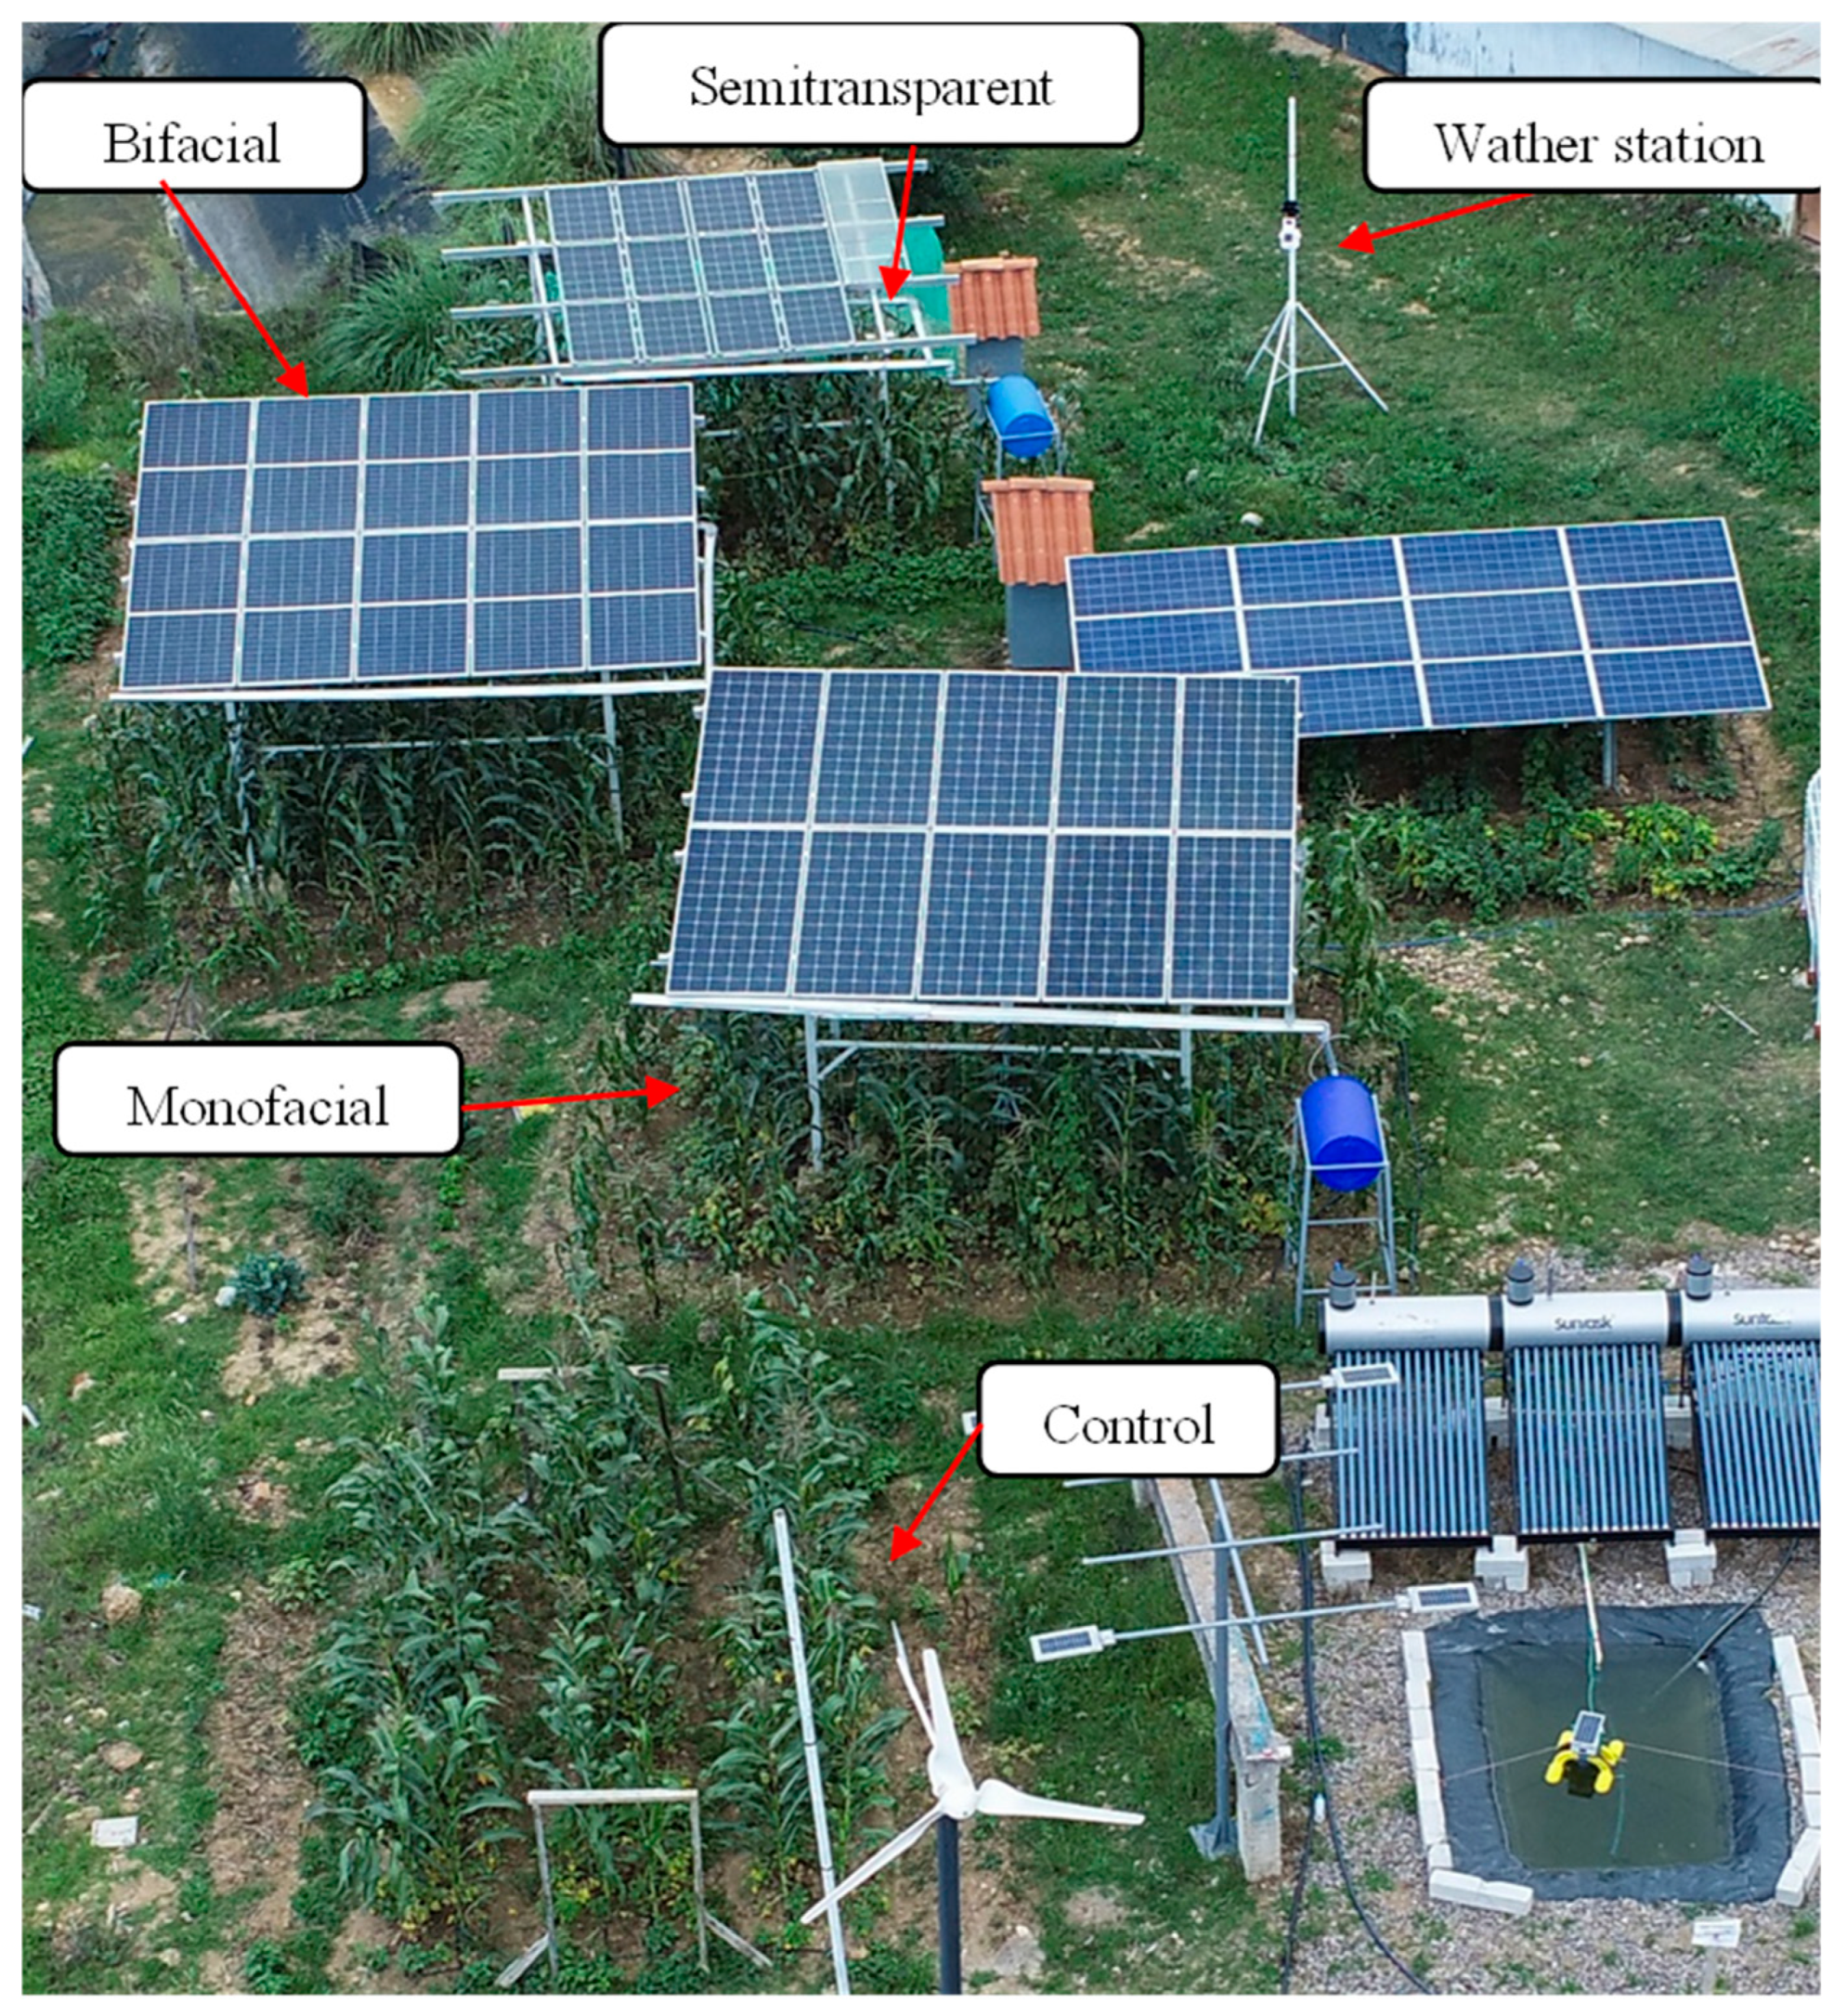
The study was conducted at the campus of the Toribio Rodríguez de Mendoza National University of Amazonas, in Chachapoyas, Amazonas, Peru (6°14′ S, 77°51′ W; 2300 m a.s.l.), located in the Andean–Amazon transition region (Ceja de Selva). The experimental setup consisted of three agrivoltaic configurations using monofacial, bifacial, and semitransparent photovoltaic modules together with a control plot without photovoltaic coverage (Figure 2).
Figure 2.
Experimental agrivoltaic systems.
The monofacial and bifacial systems each included 10 modules arranged in two rows of five modules, whereas the semitransparent configuration consisted of 12 modules. All modules were installed with a north–south orientation and a tilt angle of 15° on elevated metallic structures with a minimum ground clearance of approximately 2.40 m, allowing crop cultivation beneath the panels. The agrivoltaic installation operated as an autonomous photovoltaic system with battery storage, including an MPPT charge controller (Studer VarioTrack VT-65, Studer Innotec SA, Sion, Switzerland), a 48 V battery bank (RITAR RA12-100DG, Ritar International Group, Shenzhen, China), and a hybrid inverter (Studer Xtender XTM 2600-48, Studer Innotec SA, Sion, Switzerland). Although the system operated in off-grid configuration, photovoltaic performance was evaluated following methodologies commonly applied to grid-connected systems to calculate standardized performance indicators. The main technical specifications of the photovoltaic modules, system configuration, and electrical components are summarized in Table 1.
Table 1.
Main technical specifications of the agrivoltaic systems.
In the semitransparent configuration, manufacturer-reported optical properties were additionally considered to better describe crop light availability under the module. These included a visible light transmittance of 27.56% in the 380–780 nm range, a UV transmittance of 1.50% in the 300–380 nm range, an opacity of 72.44%, and external/internal reflectance values of 8.00% and 15.00%, respectively. However, in situ spectral transmittance was not directly measured in the present study.
2.2. Climatic Monitoring
Global solar radiation was measured using EKO MS-80 (EKO Instruments Co., Ltd., Tokyo, Japan) pyranometers, including a sensor installed in the plane of the photovoltaic modules at a tilt angle of 15°, corresponding to the inclination of the agrivoltaic structures. The operating temperature of the photovoltaic modules was monitored using a temperature data logger (YOWEXA SSN22ET, SHENZHEN YOWEXA SENSOR SYSTEM CO. LTD., Shenzhen, China). The external cylindrical probe was attached to the rear surface of a representative photovoltaic module near the central cell area to approximate module back-surface temperature under real operating conditions. The internal temperature recorded by the same sensor was used as a proxy for local ambient temperature at the panel level within each agrivoltaic configuration. All measurements were recorded at 1 min intervals and subsequently aggregated to 5 min intervals for data processing and analysis.
2.3. Energy Performance Assessment
Photovoltaic energy performance was evaluated using irradiance measured in the plane of the photovoltaic modules together with temperature data obtained from field monitoring. Two temperature conditions were considered: (i) the measured module back-surface temperature obtained from the external probe installed on a representative photovoltaic module, and (ii) the reference module operating temperature estimated from ambient temperature using the nominal module operating temperature (NMOT) provided by the manufacturer [17]. The latter was used to estimate a reference energy production scenario for comparison with measured operating conditions.
This reference scenario was selected because NMOT provides a standardized thermal baseline that links module temperature to ambient conditions and irradiance using manufacturer-specific operating characteristics. In this study, it was used to construct a configuration-specific reference condition for the energy component of LER, thereby allowing measured agrivoltaic operation to be evaluated against a normalized photovoltaic benchmark rather than against absolute energy output alone.
For the reference scenario, module temperature was estimated using Equation (1):
where is the estimated module temperature (°C), is the ambient temperature at panel level (°C), is the nominal module operating temperature (°C), and is the irradiance in the plane of the modules (W m−2).
The instantaneous photovoltaic power output was estimated using the rated module power under standard test conditions (STC), corrected according to irradiance and module operating temperature, as shown in Equation (2) [18]:
where is the instantaneous photovoltaic power (W), is the rated module power under STC (W), is the irradiance measured in the plane of the modules (W m−2), is the reference irradiance under STC (1000 W m−2), is the power temperature coefficient of the module (°C−1), and is the module operating temperature (°C). For the measured scenario, , where is the measured module back-surface temperature. For the reference scenario, , where was estimated from and .
The generated photovoltaic energy was obtained by temporal integration of the calculated power according to Equation (3):
where is the generated photovoltaic energy (kWh), is the average power during the time interval (kW), and corresponds to the measurement time step.
Because the agrivoltaic systems operated as autonomous off-grid photovoltaic systems with battery storage, balance-of-system (BOS) losses were considered in the estimation of usable electrical energy. The BOS efficiency included the combined performance of the battery–charge controller subsystem and the inverter. A round-trip efficiency of 92% was assumed for the battery–controller subsystem, while the inverter conversion efficiency was assumed as 94%, corresponding to the typical operating efficiency of the Studer Xtender XTM 2600-48 inverter (Studer Innotec SA, Sion, Switzerland). The resulting overall BOS efficiency was therefore estimated as 86.48%.
Because the agrivoltaic configurations differed in photovoltaic technology, installed capacity, and array configuration, absolute energy production values are not directly comparable. Therefore, normalized performance indicators were calculated according to the definitions established in IEC 61724-1 [19] for photovoltaic system performance monitoring, allowing a technically consistent assessment of system behavior under different agrivoltaics configurations.
The reference yield ( was calculated as Equation (4):
where is the total in-plane irradiation (kWh m−2).
The final yield ( was calculated as Equation (5):
where is the nominal installed capacity of the photovoltaic system (kW). The final yield corresponds to the specific energy yield of the system, expressed as the generated electrical energy per unit of installed capacity (kWh kWp−1).
The performance ratio (PR) was then calculated using Equation (6):
2.4. Agricultural Productivity Assessment
Agricultural productivity was evaluated under different agrivoltaic configurations and a control treatment without photovoltaic coverage. The cropping system consisted of a maize (Zea mays L.)–bean (Phaseolus vulgaris L.) intercrop, a traditional agroecological practice characterized by complementary interactions that enhance resource-use efficiency and soil fertility, where maize provides structural support and beans contribute to biological nitrogen fixation [20]. The maize variety used was purple maize INIA 601, developed by the National Institute of Agrarian Innovation (INIA) of Peru, while the bean corresponded to accession PER1003561 from the INIA Germplasm Bank. Both crops were cultivated under agrivoltaic structures and in an open-field control plot using similar agronomic management practices [21,22].
Crop productivity was determined as fresh harvested yield per unit of cultivated area and expressed in kilograms per square meter (kg m−2). Harvested production from each treatment was recorded at the end of each cropping cycle and normalized by the corresponding cultivated area to obtain comparable productivity indicators. Two cropping cycles were evaluated during the monitoring period: C1 (August 2024–January 2025) and C2 (March–August 2025). February 2025 was excluded from the cropping sequence due to soil preparation activities.
2.5. Land Equivalent Ratio (LER)
Land-use efficiency of the agrivoltaic systems was evaluated using the Land Equivalent Ratio (LER), which quantifies the combined productivity of agricultural production and photovoltaic energy generation within the same land area relative to separate conventional systems [1]. LER values greater than 1 indicate that the agrivoltaic system provides a more efficient use of land than separate agricultural and photovoltaic systems, as expressed in Equation (7):
where is the agricultural yield obtained under the agrivoltaic system (kg m−2), is the agricultural yield obtained in the open-field control treatment (kg m−2), is the accumulated AC electrical energy generated by the agrivoltaic system under measured operating conditions (kWh), and represents the accumulated AC reference photovoltaic energy estimated for the corresponding agrivoltaic configuration under the NMOT-based reference scenario (kWh).
For the agricultural component, yield was calculated for each cropping cycle as the combined fresh harvested production of maize and common bean under each agrivoltaic configuration relative to the combined yield of the open-field control. For the energy component, was calculated as the accumulated AC electrical energy under measured operating conditions, whereas was calculated as the accumulated AC electrical energy under the NMOT-based reference energy scenario.
The crop cycles were defined as C1 (August 2024–January 2025) and C2 (March–August 2025). However, because the photovoltaic monitoring period used for energy accumulation started in September 2024, the energy component of LER for C1 was accumulated from September 2024 to January 2025. February 2025 was excluded from the LER calculation because no crop production occurred during that month due to soil preparation activities.
In this study, the energy term of LER was defined using the configuration-specific NMOT-based reference scenario as a normalized photovoltaic benchmark. Because the agrivoltaic configurations differed in photovoltaic technology, installed capacity, and module dimensions, land-use efficiency was interpreted as a system-level balance between agricultural retention and configuration-specific energy performance, rather than as a strict comparison of absolute productivity among electrically non-equivalent systems.
3. Results
3.1. Solar Radiation and Energy Potential
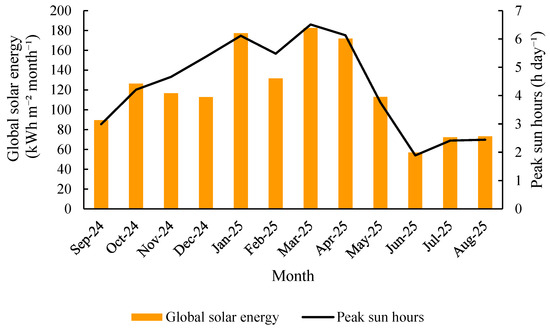
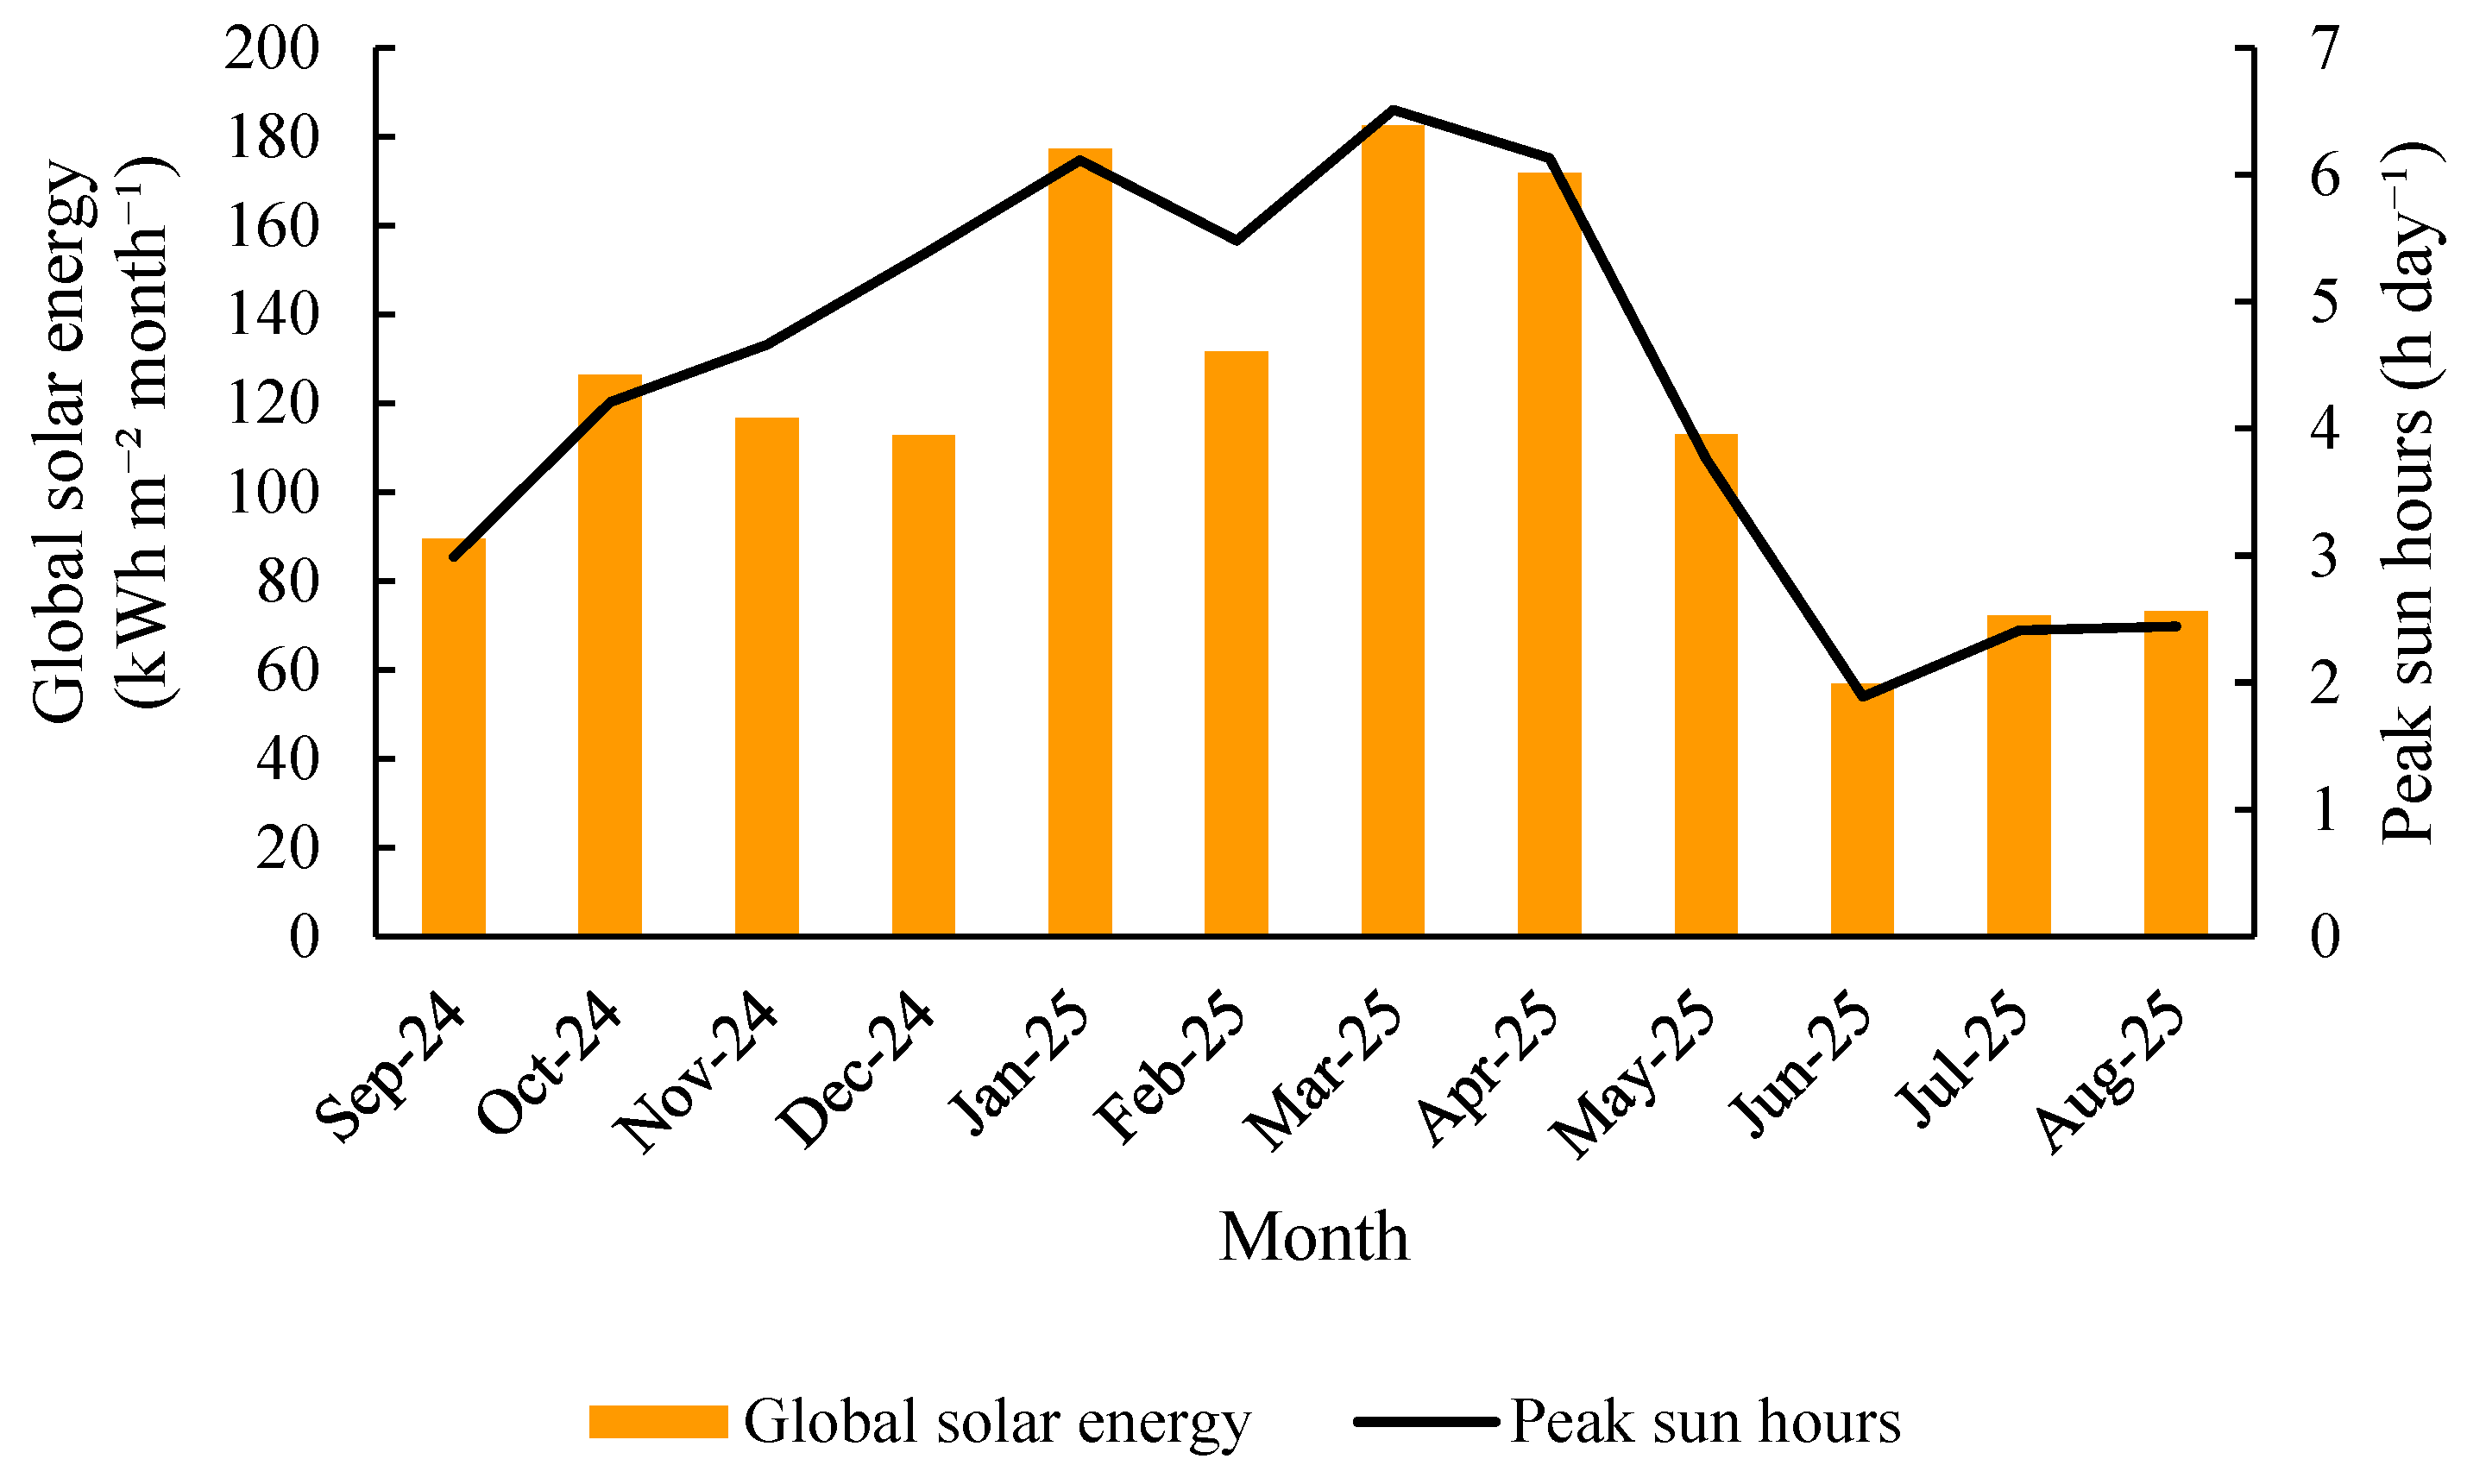
Global solar energy and peak sun hours exhibited marked seasonal variability during the photovoltaic evaluation period (September 2024–August 2025) (Figure 3). Monthly global solar energy ranged from 56.80 kWh m−2 month−1 in June 2025 to 182.34 kWh m−2 month−1 in March 2025, while peak sun hours varied from 1.89 to 6.51 h day−1 (Table S1, Supplementary Information). This distribution indicates a seasonally differentiated radiative regime, with greater solar availability from January to April 2025 and lower values during June–August 2025.
Figure 3.
Monthly global solar energy and peak sun hours.
3.2. Photovoltaic Energy Performance
3.2.1. Reference Energy Scenario
The monthly DC and AC electrical energy estimated under the NMOT-based reference energy scenario is summarized in Table 2. In all agrivoltaic configurations, the estimated energy output followed the seasonal pattern of solar resource availability, with maximum values between January and April 2025 and minimum values during June–August 2025. AC energy ranged from 182.45 to 612.30 kWh in the monofacial system, from 194.84 to 659.82 kWh in the bifacial system, and from 75.05 to 251.80 kWh in the semitransparent system. Because the configurations differed in installed capacity and module design, these values represent configuration-specific reference estimates rather than directly comparable performance indicators.
Table 2.
Monthly DC and AC electrical energy estimated under the NMOT-based reference energy scenario for the agrivoltaic configurations.
3.2.2. Energy Output Under Measured Operating Conditions
The monthly DC and AC electrical energy estimated under measured operating conditions is summarized in Table 3. Although absolute AC energy differed among configurations, these values should be interpreted descriptively because the systems differed in installed capacity, module design, and array configuration. For this reason, the comparative assessment of photovoltaic performance was based primarily on normalized indicators, which provide a more appropriate basis for evaluating system behavior under non-equivalent agrivoltaic configurations. In all agrivoltaic configurations, energy production followed the seasonal pattern of solar resource availability, with maximum values recorded between January and April 2025 and minimum values during June–August 2025. AC energy ranged from 176.72 to 630.29 kWh in the monofacial system, from 189.00 to 680.19 kWh in the bifacial system, and from 72.93 to 263.91 kWh in the semitransparent system. These values represent configuration-specific electrical energy estimated under field conditions using measured module temperature.
Table 3.
Monthly DC and AC electrical energy estimated under measured operating conditions for the agrivoltaic configurations.
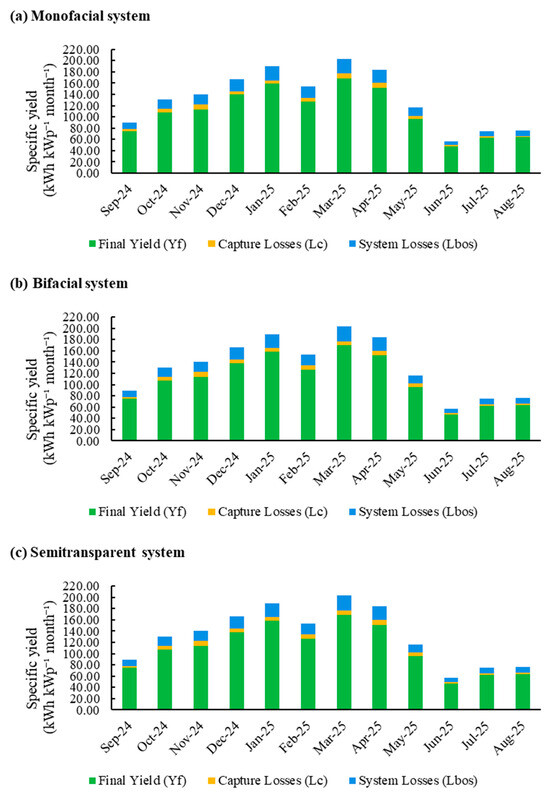
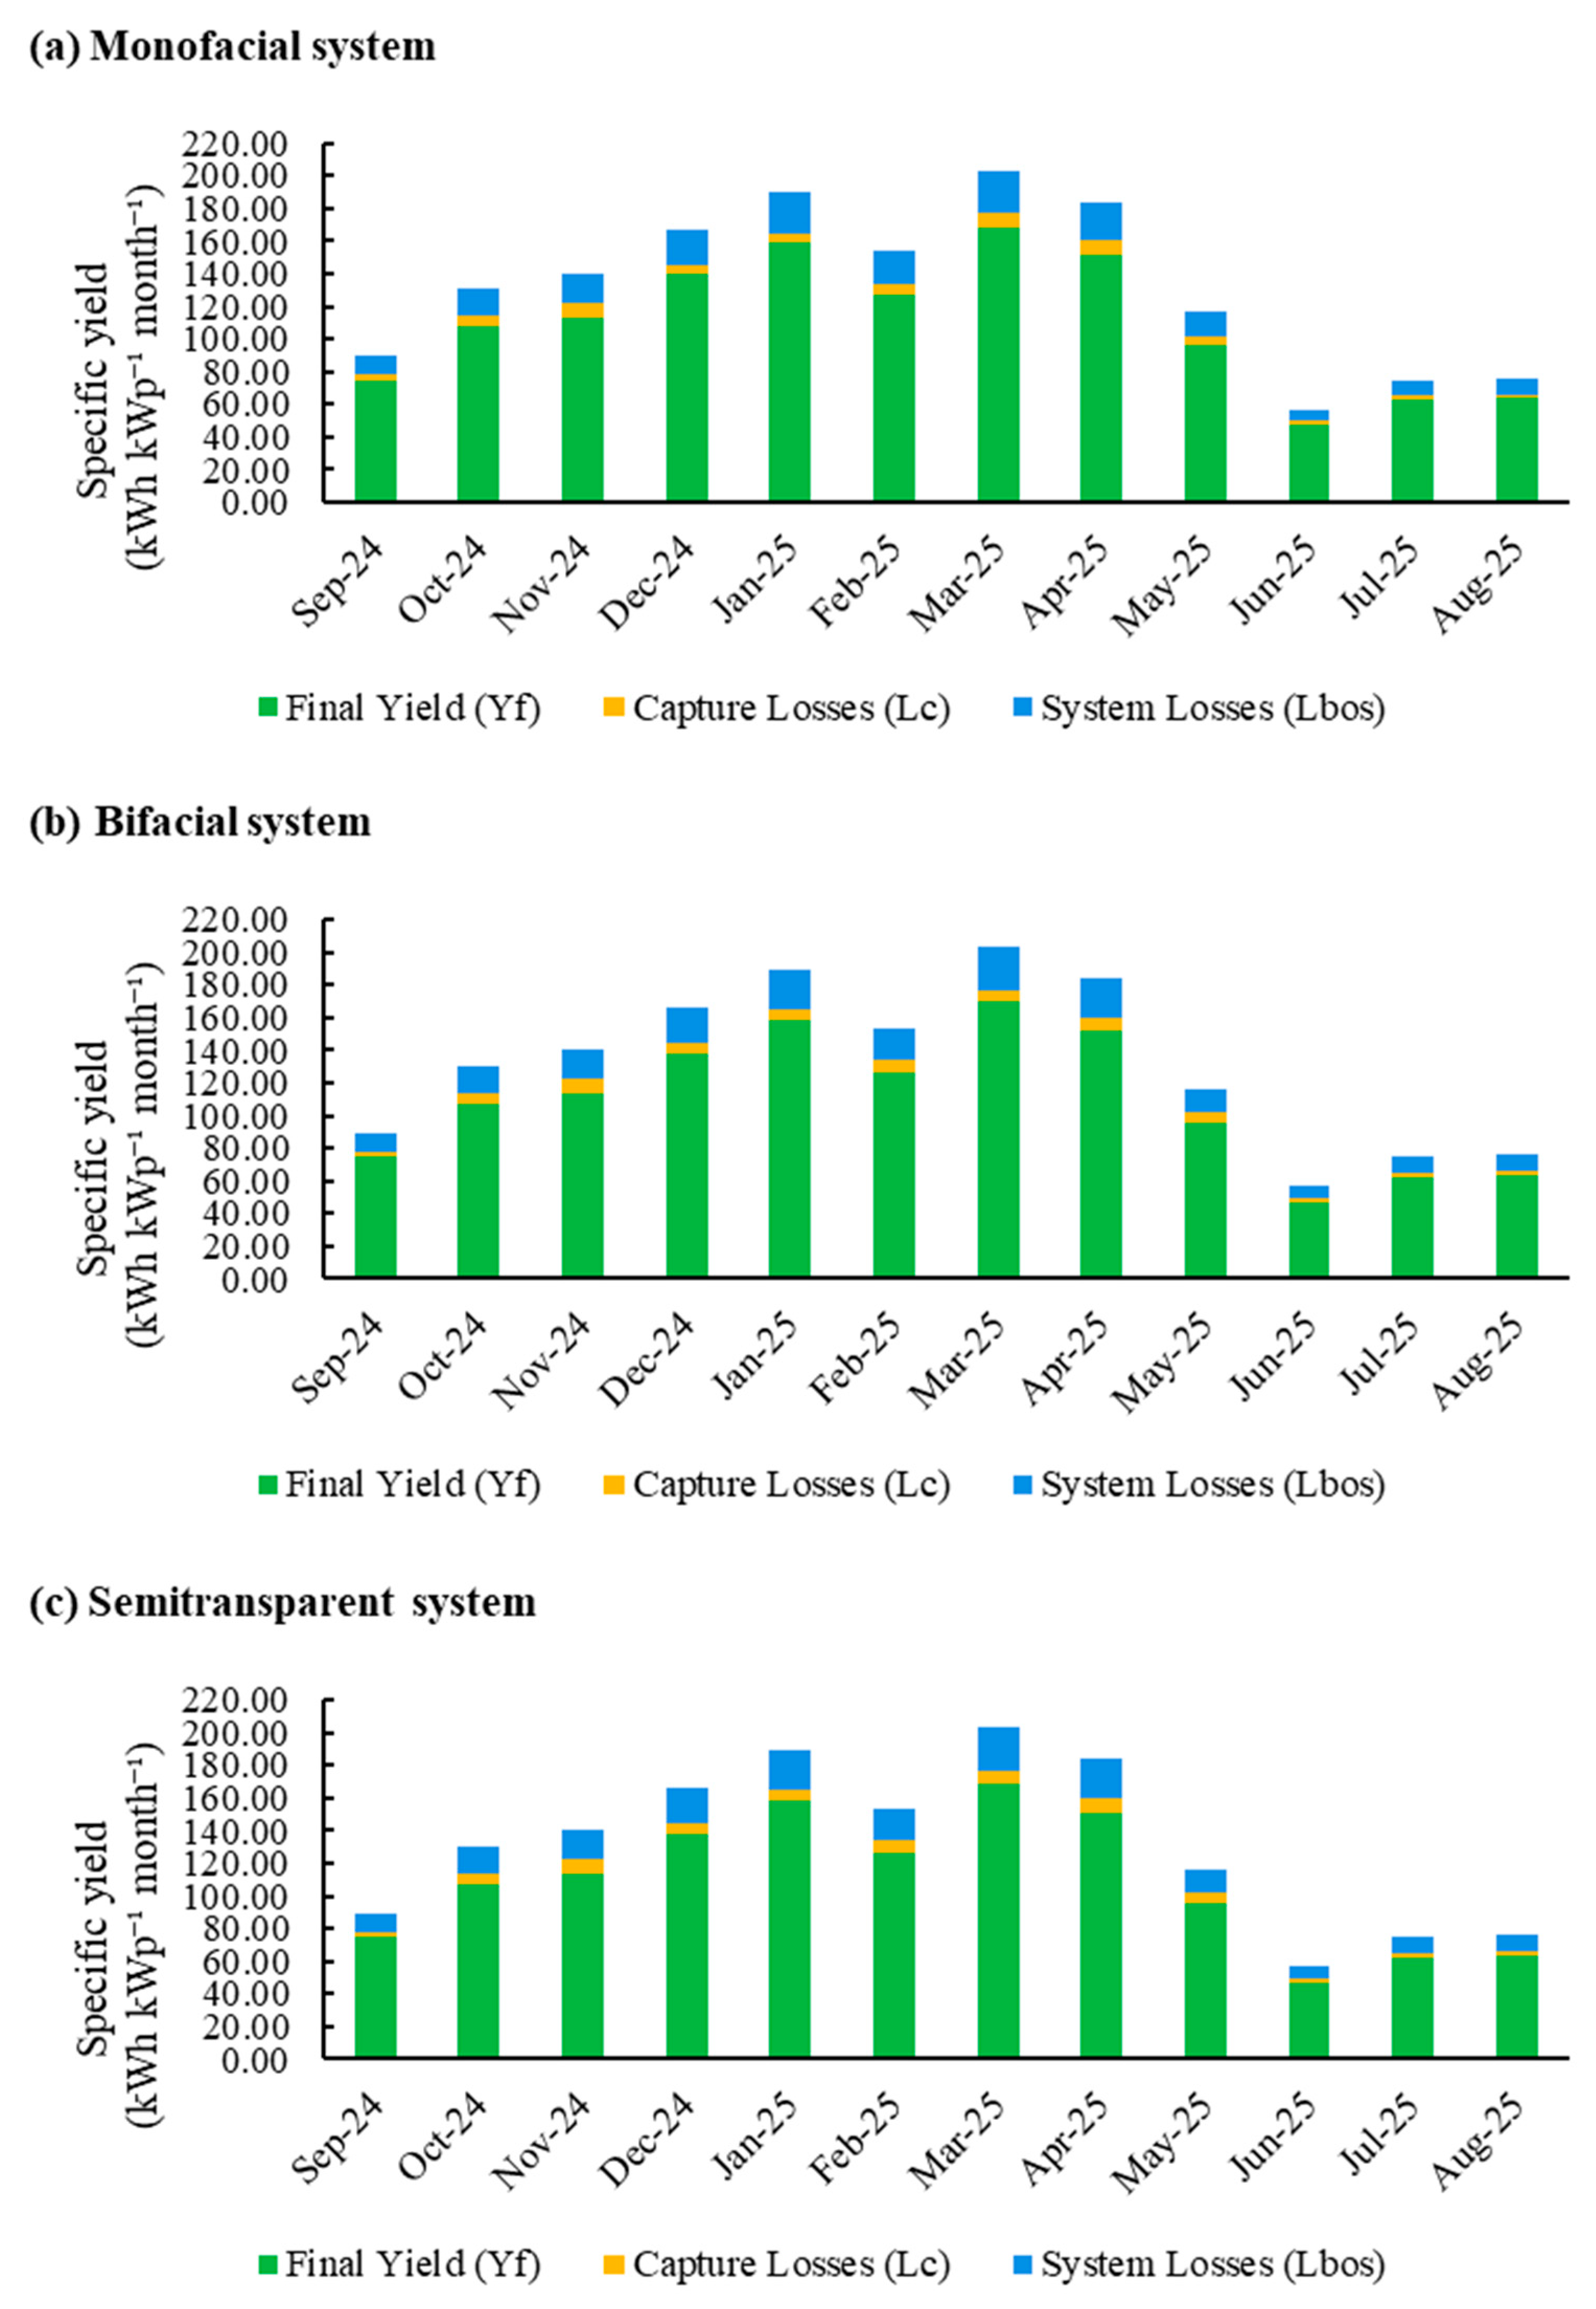
The corresponding normalized energy indicators are shown in Figure 4. In all configurations, final yield was the dominant component, whereas capture losses and system losses remained comparatively smaller. The highest final yield values occurred between January and April 2025, followed by a marked decline during June–August 2025 (Table S2, Supplementary Information). Despite differences in installed capacity and module architecture, the three technologies exhibited a broadly similar seasonal pattern in their normalized indicators.
Figure 4.
Monthly normalized energy indicators under measured operating conditions for the (a) monofacial system, (b) bifacial system, and (c) semitransparent system.
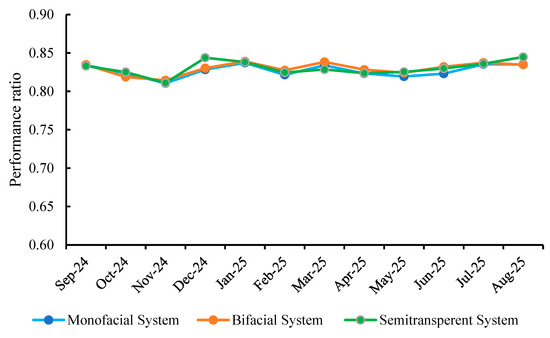
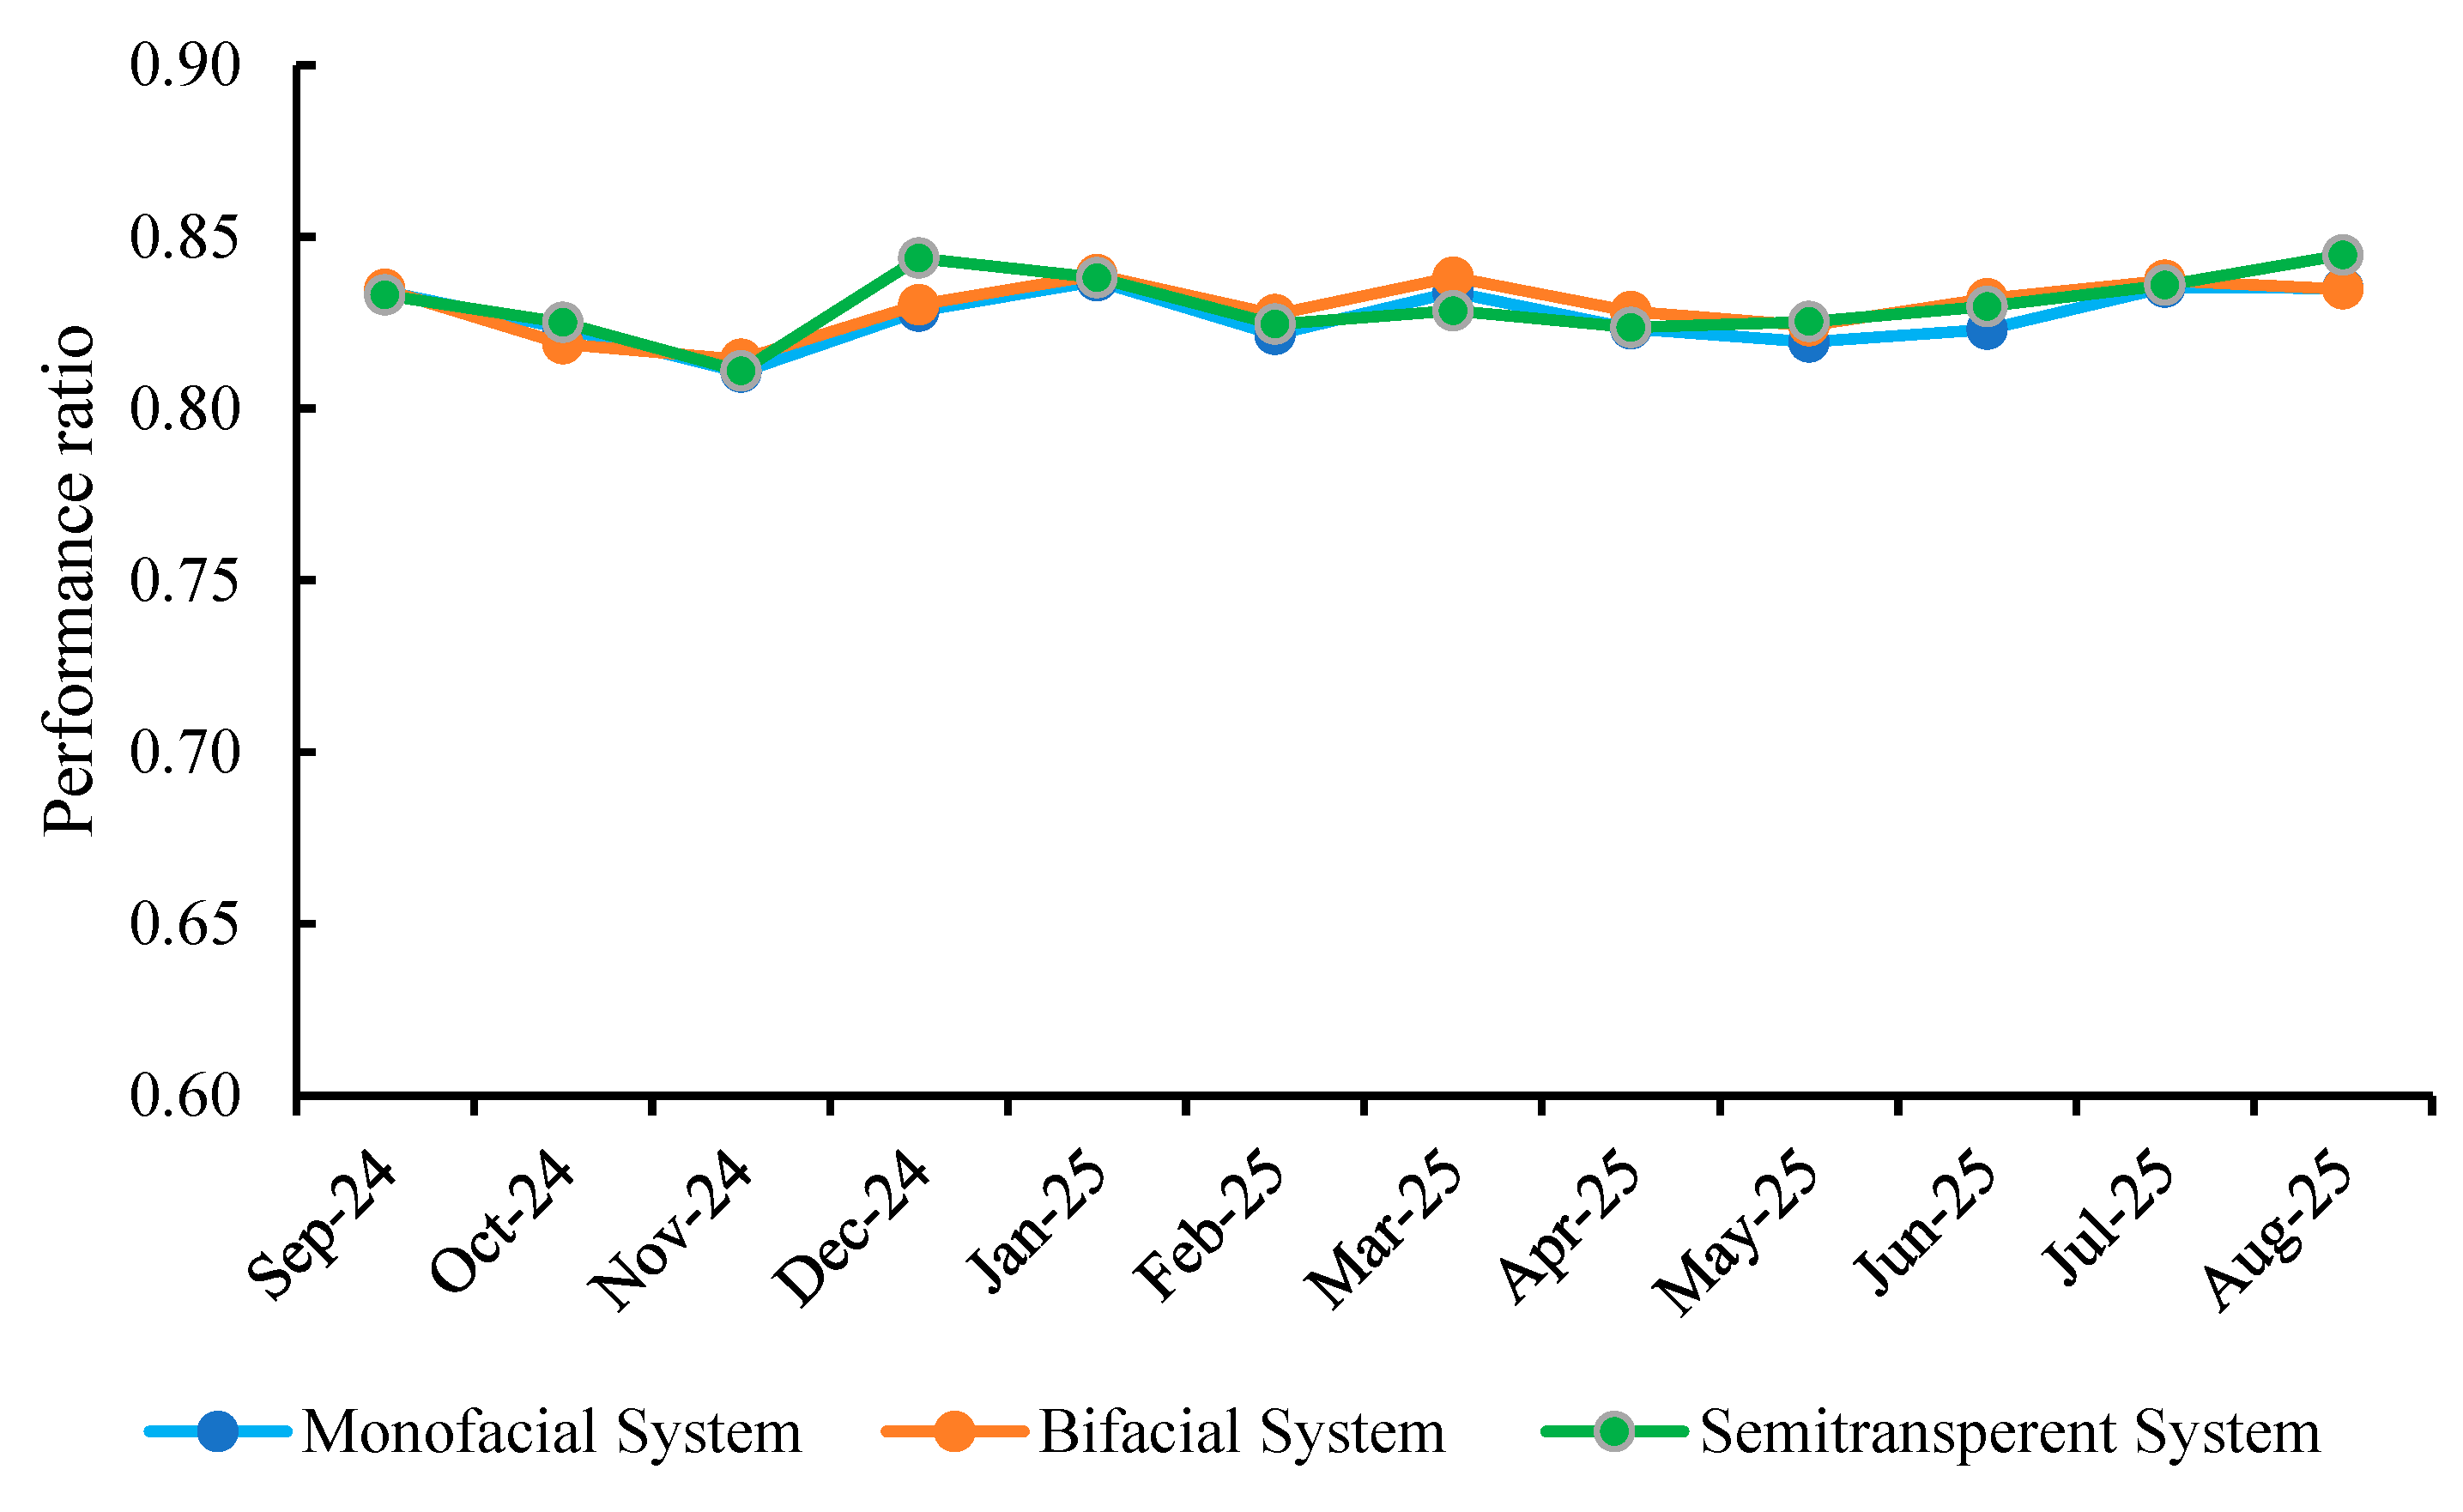
The monthly performance ratio (PR) values are presented in Figure 5. The PR values ranged from 0.81 to 0.84 in the monofacial system, 0.81 to 0.84 in the bifacial system, and 0.81 to 0.84 in the semitransparent system (Table S2, Supplementary Information). In all configurations, the performance ratio remained relatively stable throughout the monitoring period, with only minor monthly fluctuations.
Figure 5.
Monthly performance ratio under measured operating conditions for the monofacial, bifacial, and semitransparent systems.
3.3. Agricultural Productivity
Agricultural productivity of maize and common bean was evaluated under the four experimental treatments during two cropping cycles (C1 and C2). Yield was expressed as fresh harvested production per unit cultivated area (kg m−2). In maize, yields were higher in C1 than in C2 across all treatments. The control reached 1.520 kg m−2 in C1 and 1.012 kg m−2 in C2, while the semitransparent configuration remained closest to the control in both cycles, with 1.415 and 0.994 kg m−2, respectively. The monofacial system showed the lowest maize yield, particularly in C2 (0.450 kg m−2). In common bean, yield differences among treatments were smaller, ranging from 0.173 to 0.219 kg m−2 in C1 and from 0.150 to 0.190 kg m−2 in C2 (Table 4).
Table 4.
Agricultural productivity of maize and common bean under the experimental treatments (kg m−2).
3.4. Land-Use Efficiency
The land-use efficiency of the agrivoltaic systems was evaluated by combining the agricultural and energy components of the Land Equivalent Ratio (LER) for each cropping cycle (Table 5). In all cases, LER exceeded 1.0, indicating that agrivoltaic production used land more efficiently than separate agricultural and photovoltaic systems.
Table 5.
Land Equivalent Ratio (LER) of the agrivoltaic systems by cropping cycle.
The semitransparent configuration achieved the highest LER in both cycles (1.95 in C1 and 1.99 in C2), followed by the bifacial system (1.90 and 1.66) and the monofacial system (1.72 and 1.51). The main source of variation was the agricultural component, which ranged from 0.50 to 0.97, whereas the energy component remained close to unity in all configurations (1.00–1.02). Thus, under the conditions of this study, land-use efficiency was controlled primarily by the extent to which crop productivity was preserved.
Therefore, the higher LER values observed in the semitransparent and bifacial configurations should not be interpreted as evidence of strict horizontal equivalence in absolute photovoltaic productivity among systems. Rather, they indicate that, under the conditions evaluated, these configurations achieved a more favorable balance between crop productivity retention and configuration-specific photovoltaic performance.
Overall, the semitransparent configuration showed the most favorable system-level response, achieving the highest LER in both cropping cycles and maintaining maize productivity closest to the open-field control. The bifacial system showed intermediate performance, whereas the monofacial configuration produced the strongest crop-yield penalty and the lowest LER values. In contrast, normalized photovoltaic indicators and performance ratio remained relatively stable across the three technologies, indicating that the main differences in agrivoltaic performance were driven primarily by the agricultural component.
4. Discussion
The observed variability is consistent with previous studies showing that energy potential in agrivoltaic systems is primarily governed by the magnitude and temporal distribution of solar irradiance, while its local expression is further modulated by atmospheric and geographic controls [23,24]. In Peru, solar resource availability is influenced by cloudiness, topography, shading, aerosol concentration, and air moisture, generating marked spatial and seasonal contrasts in photovoltaic potential [10]. Such seasonal behavior is particularly relevant because solar radiation constitutes the primary resource sustaining both photovoltaic conversion and crop development in the maize–common bean association [25,26]. In this context, the higher solar energy values recorded between January and April 2025 identify the period of greatest solar resource availability for both energy conversion and crop growth, whereas the lower values observed during June–August 2025 reflect a seasonal contraction of the radiative resource available to both system components. This interpretation is consistent with recent analyses for the Andean region of Amazonas, where spatiotemporal variability in solar irradiation strongly influences photovoltaic output, as well as with broader evidence indicating that complex terrain and heterogeneous microclimates require site-specific assessment of solar energy potential [11,12]. Under these humid tropical mountain conditions, agrivoltaic performance depended not only on solar resource availability but also on how cloudiness, atmospheric moisture, and seasonal variability altered the balance between crop light access and photovoltaic conversion across the evaluated configurations.
Within this environmental context, the NMOT-based scenario provides a theoretical thermal baseline by linking module temperature to ambient temperature and in-plane irradiance under standardized assumptions [17,18]. Accordingly, the estimated output depends not only on solar resource availability and installed capacity but also on technology-specific thermal sensitivity [27,28]. The higher reference values of the bifacial configuration should be interpreted in relation to its configuration-specific module characteristics and installed capacity within the common evaluation framework adopted in this study, rather than as a direct quantification of rear-side irradiance contribution [13,14]. By contrast, the semitransparent configuration reflects the trade-off between optical transmittance and electrical conversion, leading to lower reference output but greater light availability for the crop layer [15,16]. In this sense, Table 2 establishes a technology-sensitive reference scenario that serves both as a basis for comparison with measured operating conditions and as a benchmark for estimating the energy component of land-use efficiency. This interpretation is also consistent with the manufacturer-reported optical properties of the module, which indicate partial visible-light transmission to the crop layer while reducing the fraction of incident radiation converted into electricity.
Table 3, in turn, presents electrical energy estimated under measured module temperature rather than under the NMOT-based thermal assumption. As such, these results reflect how each technology converts the available solar resource into electricity under actual operating conditions [27,28]. The monofacial configuration represents the response of a conventional opaque module operating with front-side irradiance. The bifacial configuration is assessed under the same framework, but its output is further conditioned by its installed capacity and module-specific electrical and thermal characteristics under the actual installation setting [29]. The semitransparent configuration follows a different optical–electrical response, since part of the incoming radiation is transmitted through the module rather than converted into electricity, contributing to lower estimated electrical energy under the same radiative forcing [30]. Overall, the variation in Table 3 results from the combined influence of solar radiation, measured module temperature, installed capacity, and the technical characteristics of each photovoltaic technology.
This interpretation is reinforced by the normalized indicators shown in Figure 4. Variability in normalized production was governed primarily by changes in final yield, while capture and system losses remained secondary. Under IEC 61724, final yield normalizes AC production by installed capacity, whereas capture and system losses separate resource-related effects from array- and system-level losses [27]. In the present study, the three agrivoltaic configurations showed a closely aligned normalized behavior, with final yield consistently accounting for most of the specific production and both loss terms remaining secondary. Comparable analyses in Latin America have shown that yield-based indicators reduce the masking effect of nominal capacity and allow technically consistent comparison among PV systems operating under different climatic and technological conditions. Similar results have also been reported for Chilean and Colombian conditions, where normalized indicators clarified the operational response of contrasting photovoltaic systems beyond absolute power differences [31,32,33]. Thus, Figure 4 indicates that the three technologies operated within a broadly similar normalized performance envelope, differing mainly in how each module architecture translated the available solar resource into useful specific output [34].
A similar pattern emerges from Figure 5, which confirms that the three technologies maintained a stable normalized operating response under field conditions. PR is widely used to evaluate photovoltaic performance independently of installed capacity because it relates useful electrical output to the available solar resource after accounting for system losses [35]. The narrow PR range observed here indicates that temporal changes in electricity production were primarily associated with resource availability rather than unstable conversion performance [27]. Similar PR-based interpretations have been reported for monitored PV systems in Latin America [31] and in recent multi-climate evaluations in Peru [36]. Accordingly, the monofacial, bifacial, and semitransparent configurations preserved similar normalized operational quality, while differences in absolute output are better explained by technology-specific design and conversion logic.
The agricultural response also showed a clear internal structure. Table 4 shows that the agricultural response was both crop-specific and campaign-dependent. Maize exhibited stronger variation among configurations and a clearer decline from C1 to C2, indicating greater sensitivity to the modified light environment created by the photovoltaic structures [37]. Common bean, by contrast, showed a narrower yield range, suggesting a more stable response within the maize–bean association. This pattern is agronomically consistent because productivity in maize–bean intercrops is strongly influenced by radiation interception and radiation use efficiency, and the dominant crop commonly exhibits the clearest response when light availability changes [38,39]. In this context, the semitransparent configuration maintained productivity closer to the control, especially in maize, which is consistent with field evidence showing that semitransparent agrivoltaic panels can preserve crop productivity by allowing partial radiation transmission to the canopy [16]. Overall, the agricultural effect of the evaluated technologies was expressed mainly through their influence on light availability within the maize–common bean association.
These patterns are directly reflected in the LER results. The present findings are consistent with the recent literature showing that LER should be interpreted as a balance metric rather than as an energy-dominant metric [4]. Recent empirical studies have generally reported LER values above unity, but with strong dependence on crop response and system design. In Belgium, vertical, tracked, and elevated arable systems reached LER values between 1.00 and 1.22, while another temperate-climate assessment reported a maximum of 1.20 [40,41]. In rice-based bifacial agrivoltaic systems, LER increased to 1.58, although balanced configurations were identified around 1.39–1.40 because higher values were associated with stronger crop-yield penalties [5]. In semitransparent pear systems, a LER of 1.44 was obtained despite consistent yield reduction [6].
Within this broader context, the values obtained here are comparatively high and reinforce the importance of crop retention in determining agrivoltaic advantage. The key point is not that one technology maximized electricity generation, but that the semitransparent configuration maintained the most favorable balance between agricultural and energy performance. Similar conclusions have been reported in recent modeling studies for tropical climates and Sub-Saharan Africa, where land-use gains were maximized when crop access to light and electrical generation were jointly optimized rather than when either component was prioritized in isolation [42,43].
From this perspective, the higher absolute electrical production observed in one configuration does not necessarily imply superior agrivoltaic performance at the system level. Rather, overall performance depends on the balance achieved between electricity generation and crop productivity retention, which is why the interpretation of agrivoltaic effectiveness in this study relies primarily on normalized photovoltaic indicators together with LER.
This study has some limitations that should be considered when interpreting the results. First, the analysis was based on field monitoring at a single experimental site in the Andean–Amazon transition region, which limits broader extrapolation to other agrivoltaic contexts. Second, the agricultural evaluation covered two cropping cycles, while the photovoltaic monitoring period used for the energy component of LER started in September 2024, restricting the temporal overlap for C1. Third, although normalized indicators were used, the evaluated configurations differed in installed capacity, module architecture, and array design, which limits strict cross-configuration comparison based on absolute output. Finally, the optical interpretation of the semitransparent module relied on manufacturer-reported properties, since in situ spectral transmittance was not directly measured. Future research should address these limitations through longer monitoring periods, replicated trials, and direct optical characterization under field conditions.
5. Conclusions
This study demonstrated that agrivoltaic systems can improve land-use efficiency under the environmental conditions of the Andean–Amazon transition region of Peru. All evaluated configurations achieved Land Equivalent Ratio (LER) values above 1.0 in both cropping cycles, confirming that the combined production of food and electricity can be more efficient than separate agricultural and photovoltaic systems under the conditions assessed. Land-use efficiency was driven primarily by the agricultural component of LER, while the energy component remained close to unity across all configurations. In addition, normalized photovoltaic indicators and performance ratio values remained relatively stable, indicating that temporal changes in electricity production were mainly associated with seasonal solar resource variability rather than major differences in normalized operational performance.
Overall, the results show that agrivoltaic performance in this humid tropical mountain environment depends largely on the extent to which crop productivity is maintained within the system, with maize yield playing a central role in determining overall land-use efficiency. In this sense, this study expands the empirical evidence for the application of agrivoltaic systems in tropical mountain regions and supports their potential as integrated food–energy systems under conditions of strong climatic variability. Although these findings support the potential of agrivoltaic systems in humid tropical mountain environments, they should be interpreted in light of the study limitations, particularly the single-site design, the relatively short monitoring period, and the non-equivalent photovoltaic configurations evaluated. Future research should extend this approach through longer-term monitoring, replicated trials, and environmental impact assessment in order to support a more comprehensive sustainability evaluation of agrivoltaic systems in complex environments.
Supplementary Materials
The following supporting information can be downloaded at https://www.mdpi.com/article/10.3390/en19081881/s1. Table S1: Monthly global solar energy and peak sun hours during the photovoltaic evaluation period. Table S2: Data underlying Figure 4 and Figure 5.
Author Contributions
Conceptualization, W.G.A.; methodology, W.G.A., Y.M.S., M.O.-C., F.I.E.C., O.A.G.-T. and M.Á.B.G.; formal analysis, W.G.A.; investigation, W.G.A., H.S.G., M.Y.C., D.C.M.S. and C.O.R.; validation, M.O.-C., F.I.E.C., O.A.G.-T., M.Á.B.G. and D.A.L.S.; data curation, W.G.A. and Y.M.S.; writing—original draft preparation, W.G.A.; writing—review and editing, Y.M.S. and D.A.L.S.; visualization, W.G.A.; supervision, M.O.-C., F.I.E.C., O.A.G.-T., M.Á.B.G. and D.A.L.S. All authors have read and agreed to the published version of the manuscript.
Funding
This research was funded by the National Council for Science, Technology and Technological Innovation (CONCYTEC), Peru, through the National Program for Scientific Research and Advanced Studies (PROCIENCIA), under the call “Undergraduate and Graduate Thesis in Science, Technology and Innovation” (E073-2024-01), according to Contract No. PE501089696-2024-PROCIENCIA. The APC was funded by the Vice-Rectorate for Research of the Toribio Rodríguez de Mendoza National University of Amazonas.
Data Availability Statement
The data presented in this study are available on request from the corresponding author.
Acknowledgments
The authors thank the Centro de Investigación en Climatología, Energías Renovables, Tecnología Ambiental y Construcciones Sostenibles (CINCERCOS), the Instituto de Investigación para el Desarrollo Sustentable de Ceja de Selva (INDES-CES) of the Toribio Rodríguez de Mendoza National University of Amazonas, Peru, and the Research Group on Sustainability Engineering (EngS Group), Federal University of São Carlos (UFSCar), Sorocaba, Brazil.
Conflicts of Interest
The authors declare no conflicts of interest.
Abbreviations
The following abbreviations are used in this manuscript:
| AC | Alternating Current |
| BOS | Balance of System |
| C1 | Cropping Cycle 1 |
| C2 | Cropping Cycle 2 |
| DC | Direct Current |
| IEC | International Electrotechnical Commission |
| LER | Land Equivalent Ratio |
| NMOT | Nominal Module Operating Temperature |
| PR | Performance Ratio |
| PV | Photovoltaic |
| STC | Standard Test Conditions |
References
- Dupraz, C.; Marrou, H.; Talbot, G.; Dufour, L.; Nogier, A.; Ferard, Y. Combining solar photovoltaic panels and food crops for optimising land use: Towards new agrivoltaic schemes. Renew. Energy 2011, 36, 2725–2732. [Google Scholar] [CrossRef] [Scilit]
- Dinesh, H.; Pearce, J.M. The potential of agrivoltaic systems. Renew. Sustain. Energy Rev. 2016, 54, 299–308. [Google Scholar] [CrossRef] [Scilit]
- Weselek, A.; Ehmann, A.; Zikeli, S.; Lewandowski, I.; Schindele, S.; Högy, P. Agrophotovoltaic systems: Applications, challenges, and opportunities. A review. Agron. Sustain. Dev. 2019, 39, 35. [Google Scholar] [CrossRef] [Scilit]
- Vaverková, M.D.; Kousal, M.; Kosakiewicz, M.; Krysińska, K.; Winkler, J. Agrivoltaics for sustainable land use: A critical review of synergistic and antagonistic effects. Renew. Sustain. Energy Rev. 2026, 226, 116482. [Google Scholar] [CrossRef] [Scilit]
- Yoo, S.; Lee, K. Integrated Assessment Framework for Rice Yield and Energy Yield in Bifacial Agrivoltaic Systems. Energies 2025, 18, 6359. [Google Scholar] [CrossRef] [Scilit]
- Reher, T.; Willockx, B.; Schenk, A.; Bisschop, J.; Huyghe, Y.; Nicolaï, B.M.; Martens, J.A.; Diels, J.; Cappelle, J.; Van de Poel, B. Agrivoltaic cultivation of pears under semi-transparent panels reduces yield consistently and maintains fruit quality in Belgium. Agron. Sustain. Dev. 2025, 45, 25. [Google Scholar] [CrossRef] [Scilit]
- Al Mamun, M.A.; Dargusch, P.; Wadley, D.; Zulkarnain, N.A.; Aziz, A.A. A review of research on agrivoltaic systems. Renew. Sustain. Energy Rev. 2022, 161, 112351. [Google Scholar] [CrossRef] [Scilit]
- Asa’A, S.; Reher, T.; Rongé, J.; Diels, J.; Poortmans, J.; Radhakrishnan, H.; van der Heide, A.; Van de Poel, B.; Daenen, M. A multidisciplinary view on agrivoltaics: Future of energy and agriculture. Renew. Sustain. Energy Rev. 2024, 200, 114515. [Google Scholar] [CrossRef] [Scilit]
- Chopdar, R.; Sengar, N.; Giri, N.C.; Halliday, D. Comprehensive review on agrivoltaics with technical, environmental and societal insights. Renew. Sustain. Energy Rev. 2024, 197, 114416. [Google Scholar] [CrossRef] [Scilit]
- Cacciuttolo, C.; Guardia, X.; Villicaña, E. Implementation of Renewable Energy from Solar Photovoltaic (PV) Facilities in Peru: A Promising Sustainable Future. Sustainability 2024, 16, 4388. [Google Scholar] [CrossRef] [Scilit]
- Iliquin-Fernandez, R.E.; Veneros, J.; Angeles, W.G.; Mori-Mestanza, D.; Medina-Mendoza, M.; Vela-Vargas, K.J.; Gomez, H.S.; Barrena-Gurbillón, M.Á. Solar irradiation variability in the high Andean region of Amazonas-Peru: Spatiotemporal climatic perspective to evaluate the potential for solar energy implementation. Energy Rep. 2026, 15, 109149. [Google Scholar] [CrossRef] [Scilit]
- Han, J.-Y.; Kan, Y.-H.; Vohnicky, P. A framework for PV yield-based solar energy mapping in mid-low latitude regions with complex topography. Renew. Energy 2026, 256, 124512. [Google Scholar] [CrossRef] [Scilit]
- Garrod, A.; Ghosh, A. A review of bifacial solar photovoltaic applications. Front. Energy 2023, 17, 704–726. [Google Scholar] [CrossRef] [Scilit]
- Bin Jahangir, J.; Mahmud, A.; Shakir, S.S.; Haque, A.; Alam, M.A.; Khan, M.R. A Critical Analysis of Bifacial Solar Farm Configurations: Theory and Experiments. IEEE Access 2022, 10, 47726–47740. [Google Scholar] [CrossRef] [Scilit]
- Gorjian, S.; Bousi, E.; Özdemir, Ö.E.; Trommsdorff, M.; Kumar, N.M.; Anand, A.; Kant, K.; Chopra, S.S. Progress and challenges of crop production and electricity generation in agrivoltaic systems using semi-transparent photovoltaic technology. Renew. Sustain. Energy Rev. 2022, 158, 112126. [Google Scholar] [CrossRef] [Scilit]
- Hu, Y.; Zhang, X.; Ma, X. Agrivoltaics with semitransparent panels can maintain yield and quality in soybean production. Sol. Energy 2024, 282, 112978. [Google Scholar] [CrossRef] [Scilit]
- Skoplaki, E.; Palyvos, J. Operating temperature of photovoltaic modules: A survey of pertinent correlations. Renew. Energy 2009, 34, 23–29. [Google Scholar] [CrossRef] [Scilit]
- Skoplaki, E.; Palyvos, J.A. On the temperature dependence of photovoltaic module electrical performance: A review of efficiency/power correlations. Sol. Energy 2009, 83, 614–624. [Google Scholar] [CrossRef] [Scilit]
- IEC 61724-1:2021; Photovoltaic system performance—Part 1: Monitoring. International Electrotechnical Commission (IEC): Geneva, Switzerland, 2021.
- Benrey, B.; Bustos-Segura, C.; Grof-Tisza, P. The mesoamerican milpa system: Traditional practices, sustainability, biodiversity, and pest control. Biol. Control 2024, 198, 105637. [Google Scholar] [CrossRef] [Scilit]
- Medina Hoyos, A.E. Guía de Manejo del Cultivo de Maíz Morado (Zea mays L.); Instituto Nacional de Innovación Agraria: Lima, Peru, 2022.
- Vásquez García, J.; Vilca Valqui, N.C.; Malqui Ramos, R.F. Manual de Manejo Agronomico de Frijol en Regiones Andinas; Instituto Nacional de Innovación Agraria: Lima, Peru, 2023.
- Prăvălie, R.; Patriche, C.; Bandoc, G. Spatial assessment of solar energy potential at global scale. A geographical approach. J. Clean. Prod. 2019, 209, 692–721. [Google Scholar] [CrossRef] [Scilit]
- Bamisile, O.; Acen, C.; Cai, D.; Huang, Q.; Staffell, I. The environmental factors affecting solar photovoltaic output. Renew. Sustain. Energy Rev. 2025, 208, 115073. [Google Scholar] [CrossRef] [Scilit]
- Widmer, J.; Christ, B.; Grenz, J.; Norgrove, L. Agrivoltaics, a promising new tool for electricity and food production: A systematic review. Renew. Sustain. Energy Rev. 2024, 192, 114277. [Google Scholar] [CrossRef] [Scilit]
- Tan, Y.; Liu, J.; Li, W.; Yin, J.; Chen, H.; Peng, Y.; Tan, J.; Wei, M. Agrivoltaics development progresses: From the perspective of photovoltaic impact on crops, soil ecology and climate. Environ. Res. 2025, 266, 120540. [Google Scholar] [CrossRef] [Scilit]
- Sánchez-Jiménez, J.; Jiménez-Castillo, G.; Rus-Casas, C.; Martínez-Calahorro, A.; Muñoz-Rodriguez, F. Performance evaluation of photovoltaic self-consumption systems on industrial rooftops under continental Mediterranean climate conditions with multi-string inverter topology. Energy Rep. 2025, 14, 1020–1042. [Google Scholar] [CrossRef] [Scilit]
- Al-Smairan, M.; Odat, A.-S.; Olimat, M.; Khawaldeh, H.A. Experimental Analysis of Weather Condition Effects on Photovoltaic Systems’ Performance: A Jordan Case Study. J. Eng. 2024, 2024, 9321648. [Google Scholar] [CrossRef] [Scilit]
- Dias, D.L.; Rampinelli, G.A.; Garrido, G.N.; Tejero, J.A.; Ortín, M.S.d.C.; Bremermann, L.E. Performance assessment of bifacial and monofacial PV systems on different types of soils in a low-latitude site. Renew. Energy 2025, 246, 122868. [Google Scholar] [CrossRef] [Scilit]
- Moreno, A.; Chemisana, D.; Fernández, E. Energy performance and crop yield production of a semitransparent photovoltaic greenhouse. Appl. Energy 2025, 382, 125285. [Google Scholar] [CrossRef] [Scilit]
- de Lima, L.C.; de Araújo Ferreira, L.; de Lima Morais, F.H.B. Performance analysis of a grid connected photovoltaic system in northeastern Brazil. Energy Sustain. Dev. 2017, 37, 79–85. [Google Scholar] [CrossRef] [Scilit]
- Ferrada, P.; Araya, F.; Marzo, A.; Fuentealba, E. Performance analysis of photovoltaic systems of two different technologies in a coastal desert climate zone of Chile. Sol. Energy 2015, 114, 356–363. [Google Scholar] [CrossRef] [Scilit]
- Mulcué-Nieto, L.F.; Echeverry-Cardona, L.F.; Restrepo-Franco, A.M.; García-Gutiérrez, G.A.; Jiménez-García, F.N.; Mora-López, L. Energy performance assessment of monocrystalline and polycrystalline photovoltaic modules in the tropical mountain climate: The case for Manizales-Colombia. Energy Rep. 2020, 6, 2828–2835. [Google Scholar] [CrossRef] [Scilit]
- Angulo, J.R.; Berastain, A.; Conde, L.A.; Carhuavilca, A.; Pleshcheva, V.; Montes-Romero, J.; García, M.A.; Campos-Falcon, V.; Montoya, A.; Gosgot, W.; et al. Yield and performance analysis of PERC, HIT, and CIGS photovoltaic systems in five Peruvian city-climates. Sol. Energy 2026, 304, 114204. [Google Scholar] [CrossRef] [Scilit]
- Srivastava, R.; Tiwari, A.N.; Giri, V.K. An overview on performance of PV plants commissioned at different places in the world. Energy Sustain. Dev. 2020, 54, 51–59. [Google Scholar] [CrossRef] [Scilit]
- Angulo, J.R.; Conde, L.A.; Pleshcheva, V.; García, M.A.; Gosgot, W.; Barrena, M.; Muñoz-Cerón, E.; de la Casa, J.; Töfflinger, J.A. Effective DC power rating of PV arrays under challenging operating conditions in desert and tropical regions. Renew. Energy 2026, 258, 124981. [Google Scholar] [CrossRef] [Scilit]
- Maruyama, N.; Nozawa, M.; Tomioka, H.; Tachibana, K.; Magami, T.; Kurasaka, H.; Akimoto, M.; Fukano, Y. On-farm agrivoltaic impacts on main crop yield: The roles of shade avoidance, cultivation practices, and varieties. npj Sustain. Agric. 2026, 4, 12. [Google Scholar] [CrossRef] [Scilit]
- Tsubo, M.; Walker, S. Comparisons of radiation use efficiency of mono-/inter-cropping systems with different row orientations. Agric. For. Meteorol. 2001, 71, 17–29. [Google Scholar] [CrossRef] [Scilit]
- Tsubo, M.; Walker, S. A model of radiation interception and use by a maize–bean intercrop canopy. Agric. For. Meteorol. 2002, 110, 203–215. [Google Scholar] [CrossRef] [Scilit]
- Reher, T.; Lavaert, C.; Willockx, B.; Huyghe, Y.; Bisschop, J.; Martens, J.A.; Diels, J.; Cappelle, J.; Van de Poel, B. Potential of sugar beet (Beta vulgaris) and wheat (Triticum aestivum) production in vertical bifacial, tracked, or elevated agrivoltaic systems in Belgium. Appl. Energy 2024, 359, 122679. [Google Scholar] [CrossRef] [Scilit]
- Asa’A, S.-N.; Lu, S.M.; Kaaya, I.; Dupon, O.; de Jong, R.; van der Heide, A.; Bouguerra, S.; Radhakrishnan, H.S.; Poortmans, J.; Campana, P.E.; et al. Evaluating the influence of different agrivoltaic topologies on PV energy, crop yields and land productivity in a temperate climate. Renew. Energy 2025, 252, 123528. [Google Scholar] [CrossRef] [Scilit]
- Maity, R.; Kumarasamy, S.; Razak, A.A.; Minelli, F. Solar energy analysis for agrivoltaic system design in tropical climates: A new integrated modeling framework. Energy 2026, 344, 139970. [Google Scholar] [CrossRef] [Scilit]
- Ayitey, N.O.; Alam, H.; Nelson, J.; Winchester, B.; Beath, H. Optimising the design of agrivoltaic systems for enhanced land productivity and electricity supply in Sub-Saharan Africa. Environ. Res. Commun. 2026, 8, 025029. [Google Scholar] [CrossRef] [Scilit]

Disclaimer/Publisher’s Note: The statements, opinions and data contained in all publications are solely those of the individual author(s) and contributor(s) and not of MDPI and/or the editor(s). MDPI and/or the editor(s) disclaim responsibility for any injury to people or property resulting from any ideas, methods, instructions or products referred to in the content. |
© 2026 by the authors. Licensee MDPI, Basel, Switzerland. This article is an open access article distributed under the terms and conditions of the Creative Commons Attribution (CC BY) license.