


Abstract
This paper presents a multimodal transformer-based framework for the joint prediction of indoor thermal comfort and energy efficiency using real-world building management system (BMS) datasets. Unlike traditional comfort models that rely on fixed physical assumptions and subjective surveys, the proposed approach adopts physics-guided, data-driven learning to capture nonlinear and time-dependent interactions among environmental conditions, HVAC operation, and occupancy-related variables. Thermal comfort labels are computed using the PMV–PPD formulation defined by ASHRAE Standard 55, assuming standard metabolic rate and clothing insulation due to the lack of direct measurements in routine BMS data. A temperature-driven baseline HVAC energy proxy is derived using change-point regression. The proposed transformer architecture fuses multivariate temporal sequences to jointly predict both comfort and energy baseline targets through a dual-head regression formulation. The model is validated on two complementary datasets representing steady-state and dynamically perturbed thermal conditions. The proposed approach consistently outperforms linear regression, random forest, and LSTM baselines, achieving mean absolute errors below 0.03 and values exceeding 0.98 with corresponding RMSE values below 0.035 for both targets. Residual and calibration analyses confirm stable, unbiased prediction behavior across wide temperature ranges. The results highlight the strong potential of attention-based multimodal learning for future comfort-aware building energy optimization and digital twin integration.
1. Introduction
Buildings account for a large share of global energy use, with electricity and fuel devoted to heating, ventilation, and air conditioning (HVAC) dominating operational consumption [1]. Yet occupants evaluate buildings by their perceived comfort and environmental quality. Improving efficiency at the expense of comfort is unsustainable. Operating a building thus becomes a multi-objective control problem, constrained by uncertain weather, occupancy, and the nonlinear interactions between the building envelope, mechanical systems, and human behavior.
An essential first step toward comfort–efficiency optimization is the definition of comfort itself. The Predicted Mean Vote (PMV) and Predicted Percentage of Dissatisfied (PPD) models, introduced by Fanger [2] and formalized in ASHRAE Standard 55 [3] and ISO 7730 [4], remain the international benchmarks for quantifying thermal comfort. These standards relate air temperature, radiant temperature, air speed, humidity, clothing insulation, and metabolic rate to a quantitative comfort index, providing a physics-based and reproducible alternative to subjective surveys. Similarly, degree-day and change-point inverse models have become standard tools for establishing energy baselines and evaluating HVAC efficiency [5,6]. They provide interpretable, physics-informed approximations of building energy dynamics.
Traditional building control and forecasting systems have relied on rule-based schedules or linear regression models. Such approaches, while interpretable, fail to capture the complex nonlinear relationships among temperature, humidity, occupancy, and energy use [7]. The advent of data-driven methods has advanced building analytics substantially. Machine learning models such as random forests, gradient boosting, and support vector regression have demonstrated improved accuracy in short-term load forecasting and indoor temperature prediction [7,8]. However, these methods treat time as a static feature and do not adequately model sequential dependencies.
Deep learning has addressed some of these limitations. Recurrent neural networks (RNNs) and long short-term memory (LSTM) models [9] learn temporal dependencies directly from time-series data and have been applied successfully to energy forecasting, occupancy estimation, and indoor climate modeling. Nonetheless, RNN-based models often struggle with long-term dependencies and are computationally inefficient when handling large multivariate datasets. More recently, the introduction of the transformer architecture [10] and its time-series extensions such as the Temporal Fusion Transformer (TFT) [11] has significantly advanced sequence modeling by enabling parallel attention-based learning of long-range temporal dependencies. Early studies applying transformers to building analytics have shown promising improvements in forecasting accuracy and interpretability, but they predominantly focus on single-target prediction—most commonly energy demand—without explicitly modeling occupant thermal comfort as a primary learned variable.
Several recent studies have explored multi-output or multi-task learning paradigms in building applications, including joint modeling of temperature and energy demand or simultaneous prediction of multiple indoor environmental variables [12,13]. While these approaches demonstrate improved data efficiency and representation sharing, thermal comfort is typically treated as a constraint, proxy, or post-processing metric rather than as a standardized physiological target learned jointly with energy consumption.
In this study, we present a physics-guided, multimodal transformer framework for the joint prediction of thermal comfort and energy efficiency using routine building management system (BMS) data. Unlike prior approaches that rely on occupant surveys or black-box comfort metrics, we derive the thermal comfort score directly from ASHRAE 55/ISO 7730 standards by computing PMV and PPD values, and define a bounded equal to . The model simultaneously learns a physics-informed baseline energy proxy, , obtained via change-point regression. A compact transformer is trained to fuse multivariate inputs, including indoor and outdoor temperatures, relative humidity, setpoints, CO2 concentration, occupancy, and past energy readings, and predict both targets jointly.
Unlike conventional studies that model either thermal comfort or energy consumption independently, this work adopts a unified multi-output learning formulation that jointly estimates both indoor comfort and baseline energy demand within a shared latent temporal representation. Joint modeling enables the network to learn the intrinsic coupling between HVAC operation, occupant comfort response, and thermal inertia, which cannot be fully captured by independent regression pipelines. Independent comfort and energy predictors often optimize conflicting objectives and ignore delayed cause–effect relations between power input and perceived comfort response. By contrast, the proposed dual-head transformer preserves shared physical dynamics while enabling task-specific refinement at the output stage. Moreover, joint optimization reduces representational redundancy, enforces physically consistent learning across both outputs, and mitigates error propagation commonly observed when comfort and energy models are trained independently.
The novelty of this work lies in three aspects. First, to the best of our knowledge, it is among the first frameworks to jointly learn a standardized PMV/PPD-based comfort metric and a physics-informed energy baseline as equal regression targets within a single end-to-end deep learning model. Second, it integrates physics-based label generation, enabling reproducible comfort assessment without reliance on surveys or simulation engines. Third, it leverages attention-based temporal fusion to capture long-term dependencies across environmental and operational variables. Using real-world BMS data, the proposed model achieves low mean absolute errors and stable temporal tracking for both comfort and energy baselines, offering a scalable pathway toward autonomous, comfort-aware building energy management.
2. Materials and Methods
2.1. Dataset
Two real-world building datasets were used in this study. The first dataset is the “Smart Building PRBS and Thermostat Dataset” [14], which provides high-resolution indoor environmental measurements and HVAC power signals collected from a multi-zone building under both normal operation and pseudo-random binary excitation. The second dataset is the “Bldg59 Energy and Thermal Dynamics Dataset” [15] that contains zone temperatures, humidity, CO2 concentration, occupancy states, HVAC operational setpoints, and whole-building electrical consumption over several months. Both datasets contain timestamped measurements and were resampled to a uniform 5-minute resolution to enable model training.
Table 1 summarizes the main variables extracted from each dataset and the corresponding missing-data handling strategies adopted in this study.
Table 1.
Summary of dataset variables and missing-data handling procedures applied in this study for the Smart Building PRBS dataset [14] and the Bldg59 dataset [15].
Thermal comfort was estimated using the Predicted Mean Vote (PMV) and Predicted Percentage of Dissatisfied (PPD) indices as described in the ASHRAE Standard 55 for indoor environmental acceptability [3]. PMV is a heat balance model that incorporates dry-bulb air temperature (), mean radiant temperature (), relative humidity (RH), air velocity (v), metabolic rate (met), and clothing insulation (clo). Because radiant temperature was not directly measured, we assumed , consistent with prior literature for mechanically conditioned indoor spaces [2].
Metabolic rate and clothing insulation were assigned typical office activity values:
corresponding to light seated work with standard indoor clothing. Using these inputs, PMV was computed using the thermal comfort formulation:
where denotes the Fanger comfort model [2]. PPD was then derived from PMV using the ASHRAE exponential dissatisfaction model:
Finally, we defined a comfort score inverted from dissatisfaction:
This formulation maps ideal comfort to 100 and discomfort to lower values, providing a continuous and interpretable ground-truth scale ranging from 0 to 100.
To evaluate the robustness of the comfort labeling process with respect to occupant-related assumptions, a sensitivity analysis [16] was conducted by perturbing both the metabolic rate and clothing insulation values by around their nominal settings. The resulting variation in the computed ComfortScore remained within points across the dataset, indicating that the proposed framework is not overly sensitive to moderate inter-occupant variability and remains stable under realistic fluctuations in human thermal behavior.
To separate the temperature-driven HVAC thermal load from internal gains and behavioral variation, we estimated a baseline power model following a linear outdoor-air temperature regression approach widely used in load-shape analysis and building energy benchmarking [5]. For each day, we searched for an optimal change-point base temperature such that:
where is the outdoor dry-bulb temperature and are obtained via least-squares fitting. This baseline represents the expected heating/cooling energy required solely to maintain thermal equilibrium given outdoor conditions, independent of dynamic occupancy-related fluctuations.
This baseline model allows the proposed transformer to learn energy behavior conditioned on actual thermal load patterns rather than raw consumption.
2.2. Proposed Pipeline
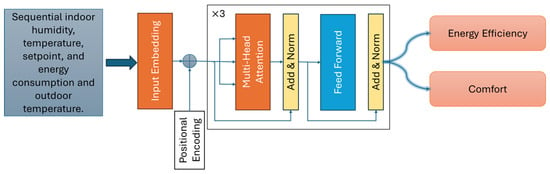
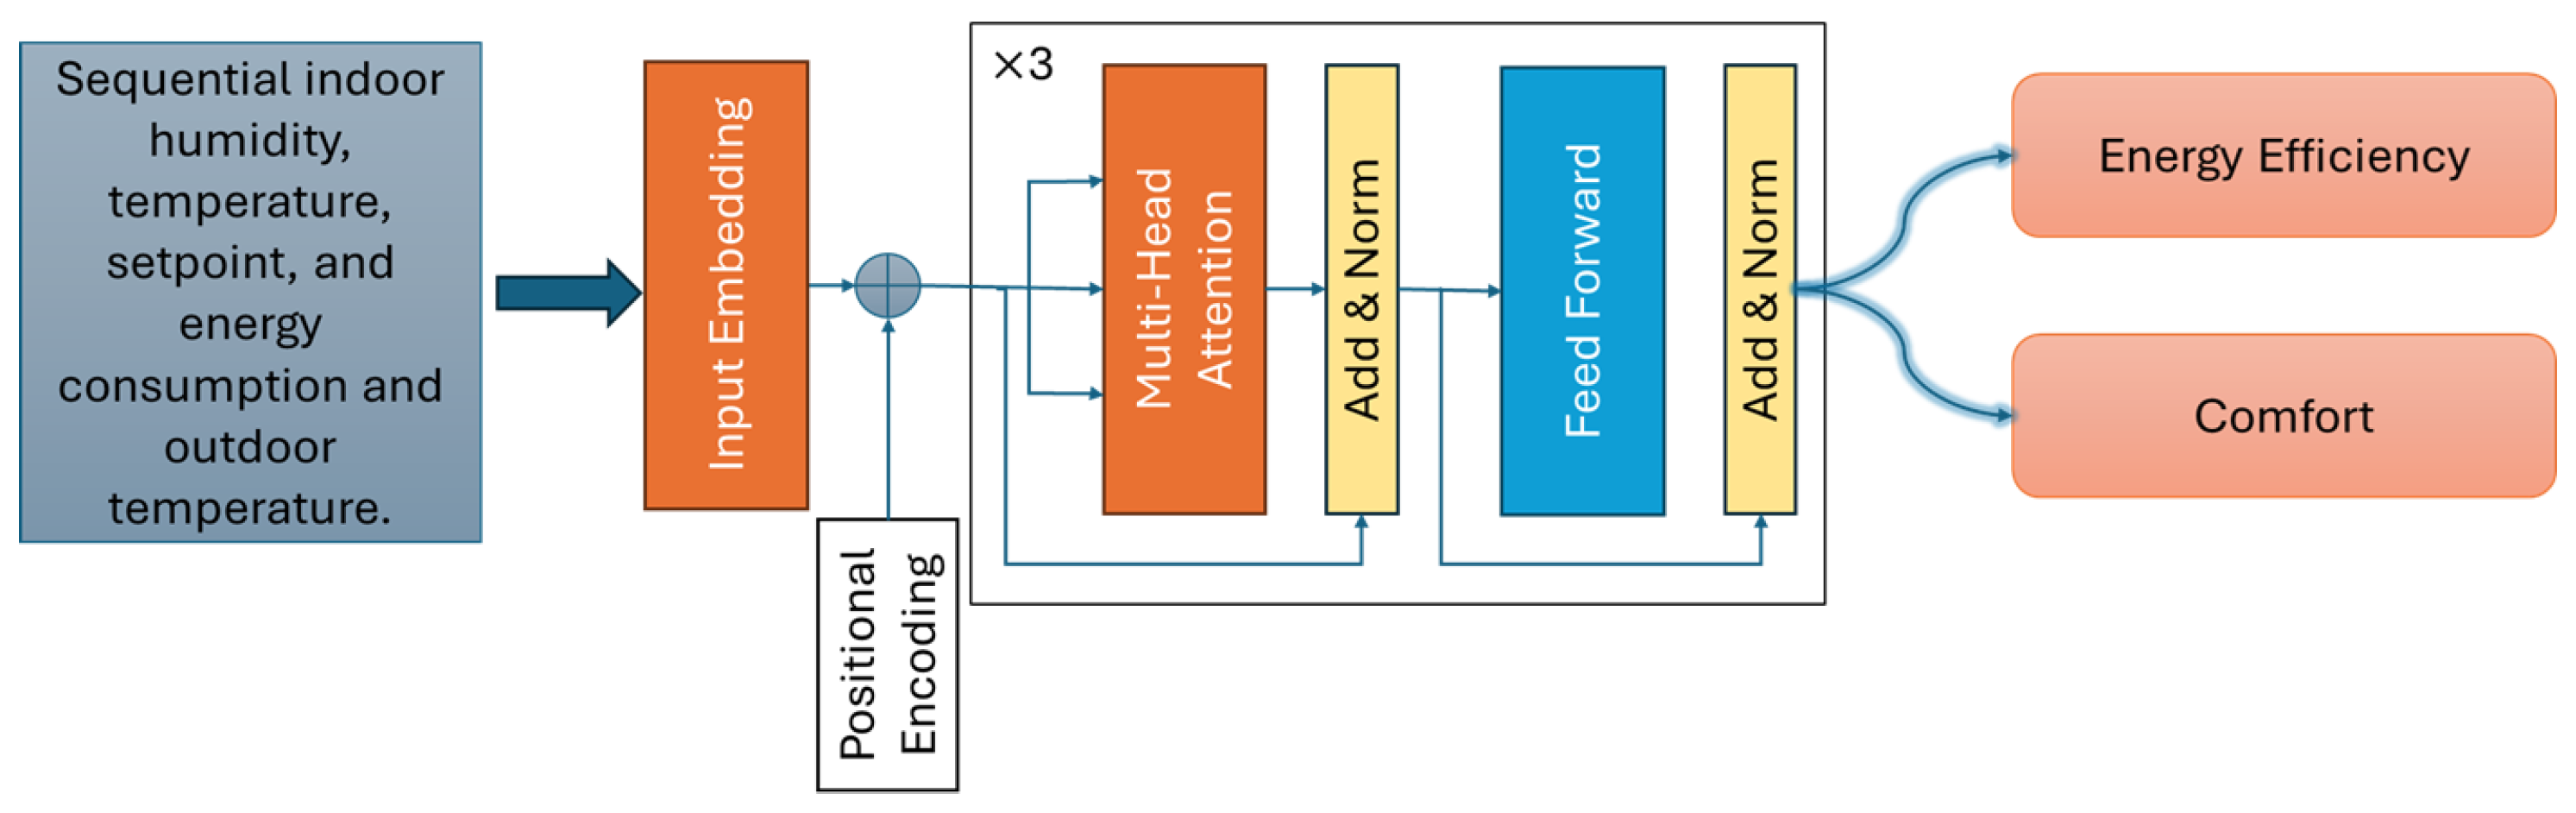
The objective of the proposed framework is to jointly predict thermal comfort and baseline temperature-dependent energy consumption using a unified multimodal temporal modeling architecture. The pipeline consists of three main stages. Firstly, data preprocessing and temporal alignment are done, followed by feature embedding and positional encoding. Then, transformer-based temporal representation is used to learn a dual-output regression for comfort and energy estimation. The overall structure of the proposed model is illustrated in Figure 1.
Figure 1.
Overview of the proposed multimodal transformer architecture for joint comfort and energy baseline prediction.
At each timestamp t, we consider a sequence of past measurements over a sliding temporal window of length T. The temporal input length was selected as time steps, corresponding to a two-hour history at 5-minute resolution. This choice reflects typical thermal settling time constants of HVAC systems and indoor zone temperature response, which commonly range between 60 and 120 min depending on the building envelope and airflow rates. Among window sizes , we choose as the optimal trade-off between predictive accuracy and computational cost. The input multivariate sequence is defined as
where F denotes the number of sensor features (indoor temperature, relative humidity, setpoints, CO2 concentration when available, outdoor weather, and HVAC power consumption). Each feature is normalized using min–max scaling to stabilize training and reduce variable magnitude imbalance.
To enable the transformer to process multivariate time series in a continuous embedding space, each feature vector is linearly projected into a latent dimension d:
In our implementation, the embedding size is set to , providing sufficient capacity to encode multimodal building states while keeping the model compact for real-time deployment. Since the transformer is inherently permutation-invariant, temporal ordering is introduced using sinusoidal positional encoding, which injects relative temporal structure into the model.
The encoded sequence is passed through L stacked transformer encoder blocks. Each block consists of multi-head self-attention followed by a position-wise feed-forward network, both wrapped with residual connections and layer normalization. We use encoder blocks, each with attention heads and a feed-forward hidden dimension of 256, and apply a dropout rate of 0.1 after the attention and feed-forward sub-layers. The self-attention mechanism enables the model to selectively assign higher weights to time steps that are more predictive of comfort and energy behavior, allowing it to capture short-term fluctuations and longer-term trends. These architectural hyperparameters were selected based on preliminary validation experiments, balancing predictive performance and computational complexity.
The final time-pooled representation (obtained via temporal mean pooling) is passed to two parallel regression heads:
where and are two-layer fully connected networks. The comfort head predicts perceived comfort level, while the energy head estimates the temperature-dependent HVAC load baseline, forming the basis for energy efficiency assessment.
This dual-output formulation allows the model to learn latent relationships between indoor conditions and energy performance, reflecting the inherent trade-offs between comfort and energy use in real buildings.
2.3. Implementation
All experiments were implemented in Python 3.8 using the PyTorch 1.13.1 deep learning framework. Data streams were cleaned, resampled to a uniform 5-min resolution, and synchronized by timestamp. The missing-data handling interpolation was applied for sparse control signals, as described in Table 1. The dataset was chronologically partitioned into 80% for training and 20% for validation to avoid temporal leakage.
Training and inference were conducted on a workstation equipped with an NVIDIA RTX 3060 GPU with 6 GB VRAM. The Huber loss was used as the loss function for optimizing the proposed network due to its reduced sensitivity to outliers compared to the mean squared error cost function [17]. The network was trained using the Adam optimizer with decoupled weight decay [18] and an initial learning rate of . Training was performed for a maximum of 30 epochs with early stopping triggered after 15 consecutive epochs without validation loss improvement. A batch size of 64 was used for all experiments.
The transformer architecture employed an input temporal window of time steps, an embedding dimension of , four self-attention heads, and three stacked encoder layers. The feed-forward network dimension was set to 256 with a dropout rate of 0.1. The final architecture contains approximately trainable parameters, resulting in a total offline training time of about 3 min per dataset, highlighting the computational efficiency of the proposed framework.
For real-time operation, the trained model was deployed in a streaming inference mode using a sliding temporal window of length . At each new 5-min sensor update, the input buffer is incrementally updated and passed through the transformer to generate simultaneous predictions of thermal comfort and baseline HVAC energy consumption. Under this online inference configuration, the average single-sample prediction latency was measured to be below 15 ms on the GPU, which is negligible relative to the 5-minute sensing interval. The model testing code is available at https://github.com/Almadani92/Multimodal_DT.git, accessed on 10 November 2025.
This runtime behavior is consistent with real-time execution constraints previously demonstrated in fast transformer-based biomedical signal processing systems, where full inference is achieved in a small fraction of the physical signal duration. The low-latency inference, coupled with stable predictive performance, enables seamless integration of the proposed model into real-time monitoring, supervisory control, and predictive digital twin analytics pipelines.
2.4. Evaluation Metrics
To assess prediction performance, we report the following metrics.
Mean Absolute Error (MAE):
Root Mean Squared Error (RMSE):
Coefficient of Determination ():
MAE measures absolute prediction error in interpretable engineering units and is robust to outliers, while RMSE emphasizes larger deviations and therefore reflects peak error behavior. The coefficient of determination quantifies the proportion of variance in the ground truth explained by the model.
3. Results
The proposed transformer-based pipeline was evaluated on two distinct datasets to assess its performance under both steady-state and dynamic building operating conditions. The first dataset is the Bldg59 Energy and Thermal Dynamics Dataset [15], which represents long-term measurements of building thermal and electrical behavior under naturally varying loads. The second dataset is the Smart Building PRBS and Thermostat Dataset [14], which captures rapid thermal responses to controlled pseudo-random binary sequence (PRBS) perturbations in thermostat setpoints. These complementary datasets allowed a comprehensive validation of model robustness, accuracy, and generalization.
3.1. Performance on the Bldg59 Dataset
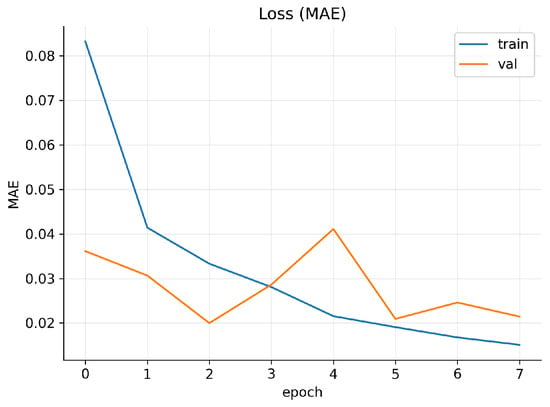
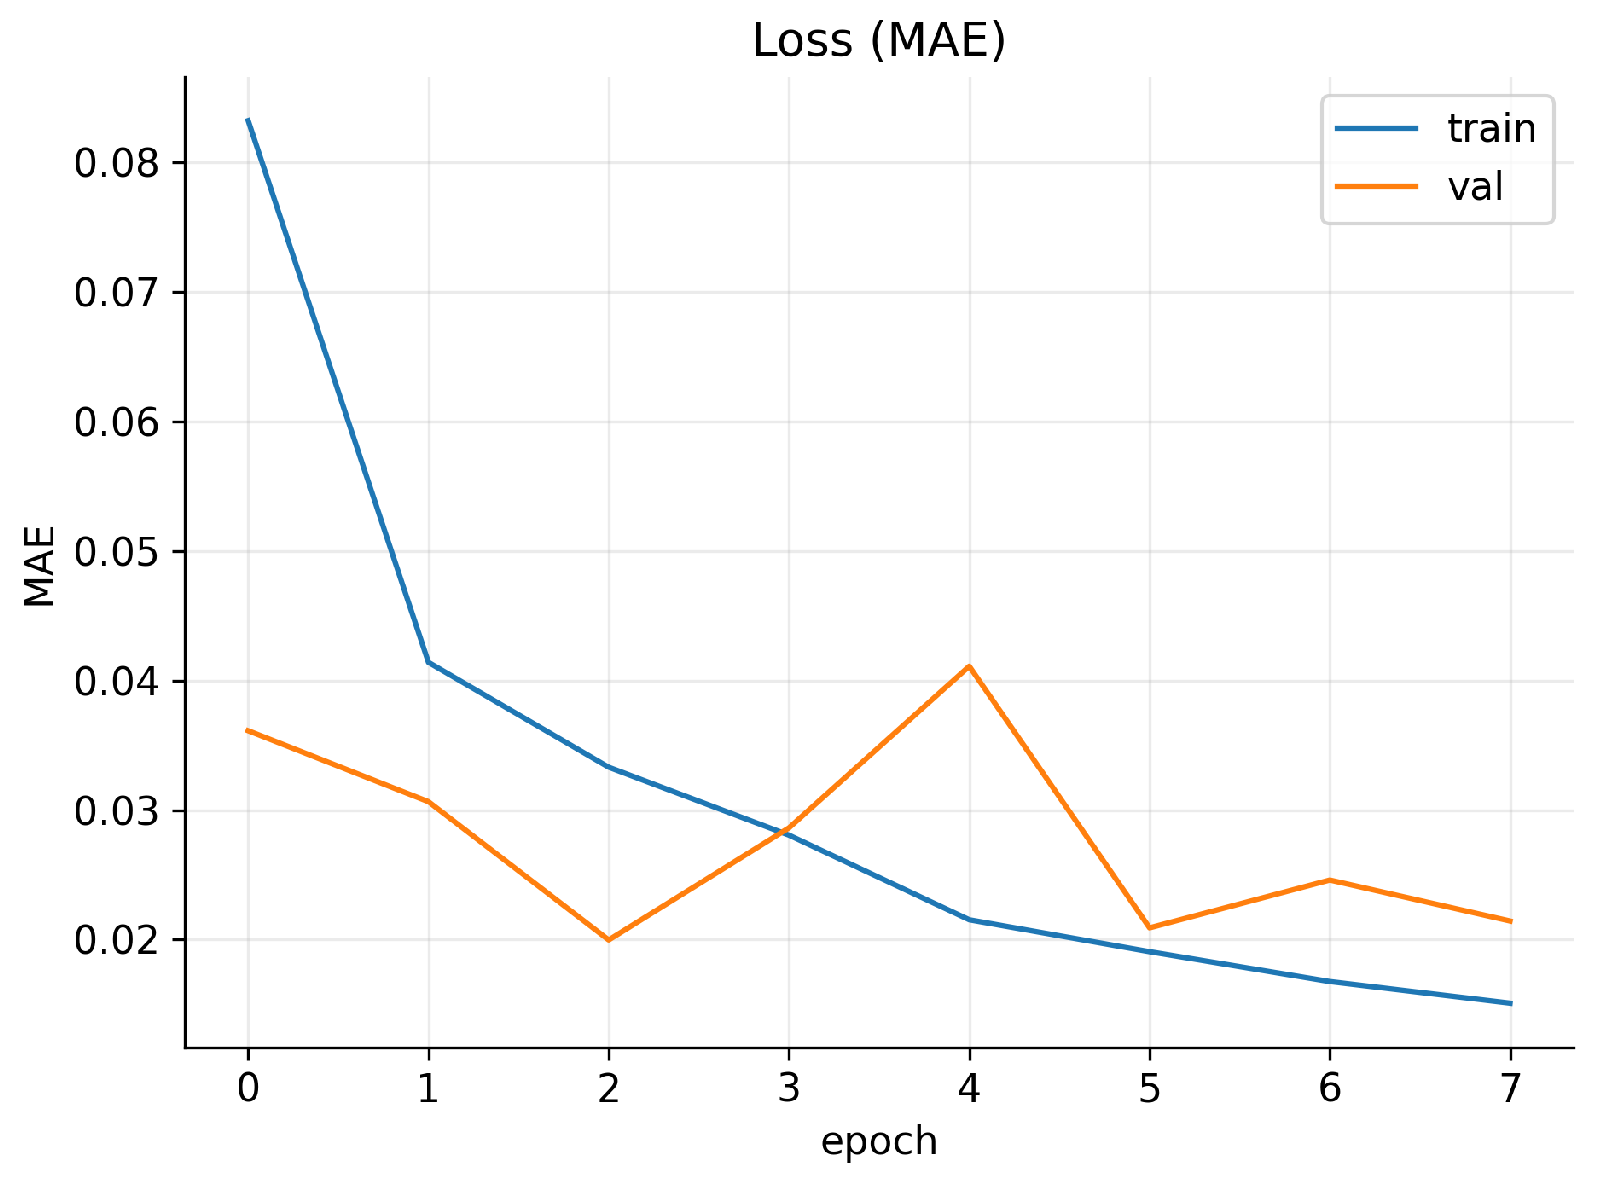
The transformer model demonstrated smooth and stable convergence during training. As illustrated in Figure 2, both training and validation losses decreased consistently and plateaued after approximately 20 epochs, indicating well-generalized learning without overfitting.
Figure 2.
Training and validation loss (MAE) curves across epochs for the Bldg59 dataset. The model converged smoothly, with validation loss stabilizing after approximately 20 epochs, demonstrating excellent generalization.
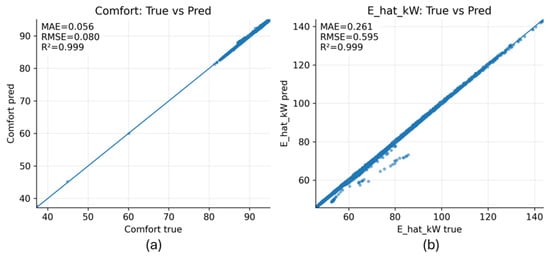
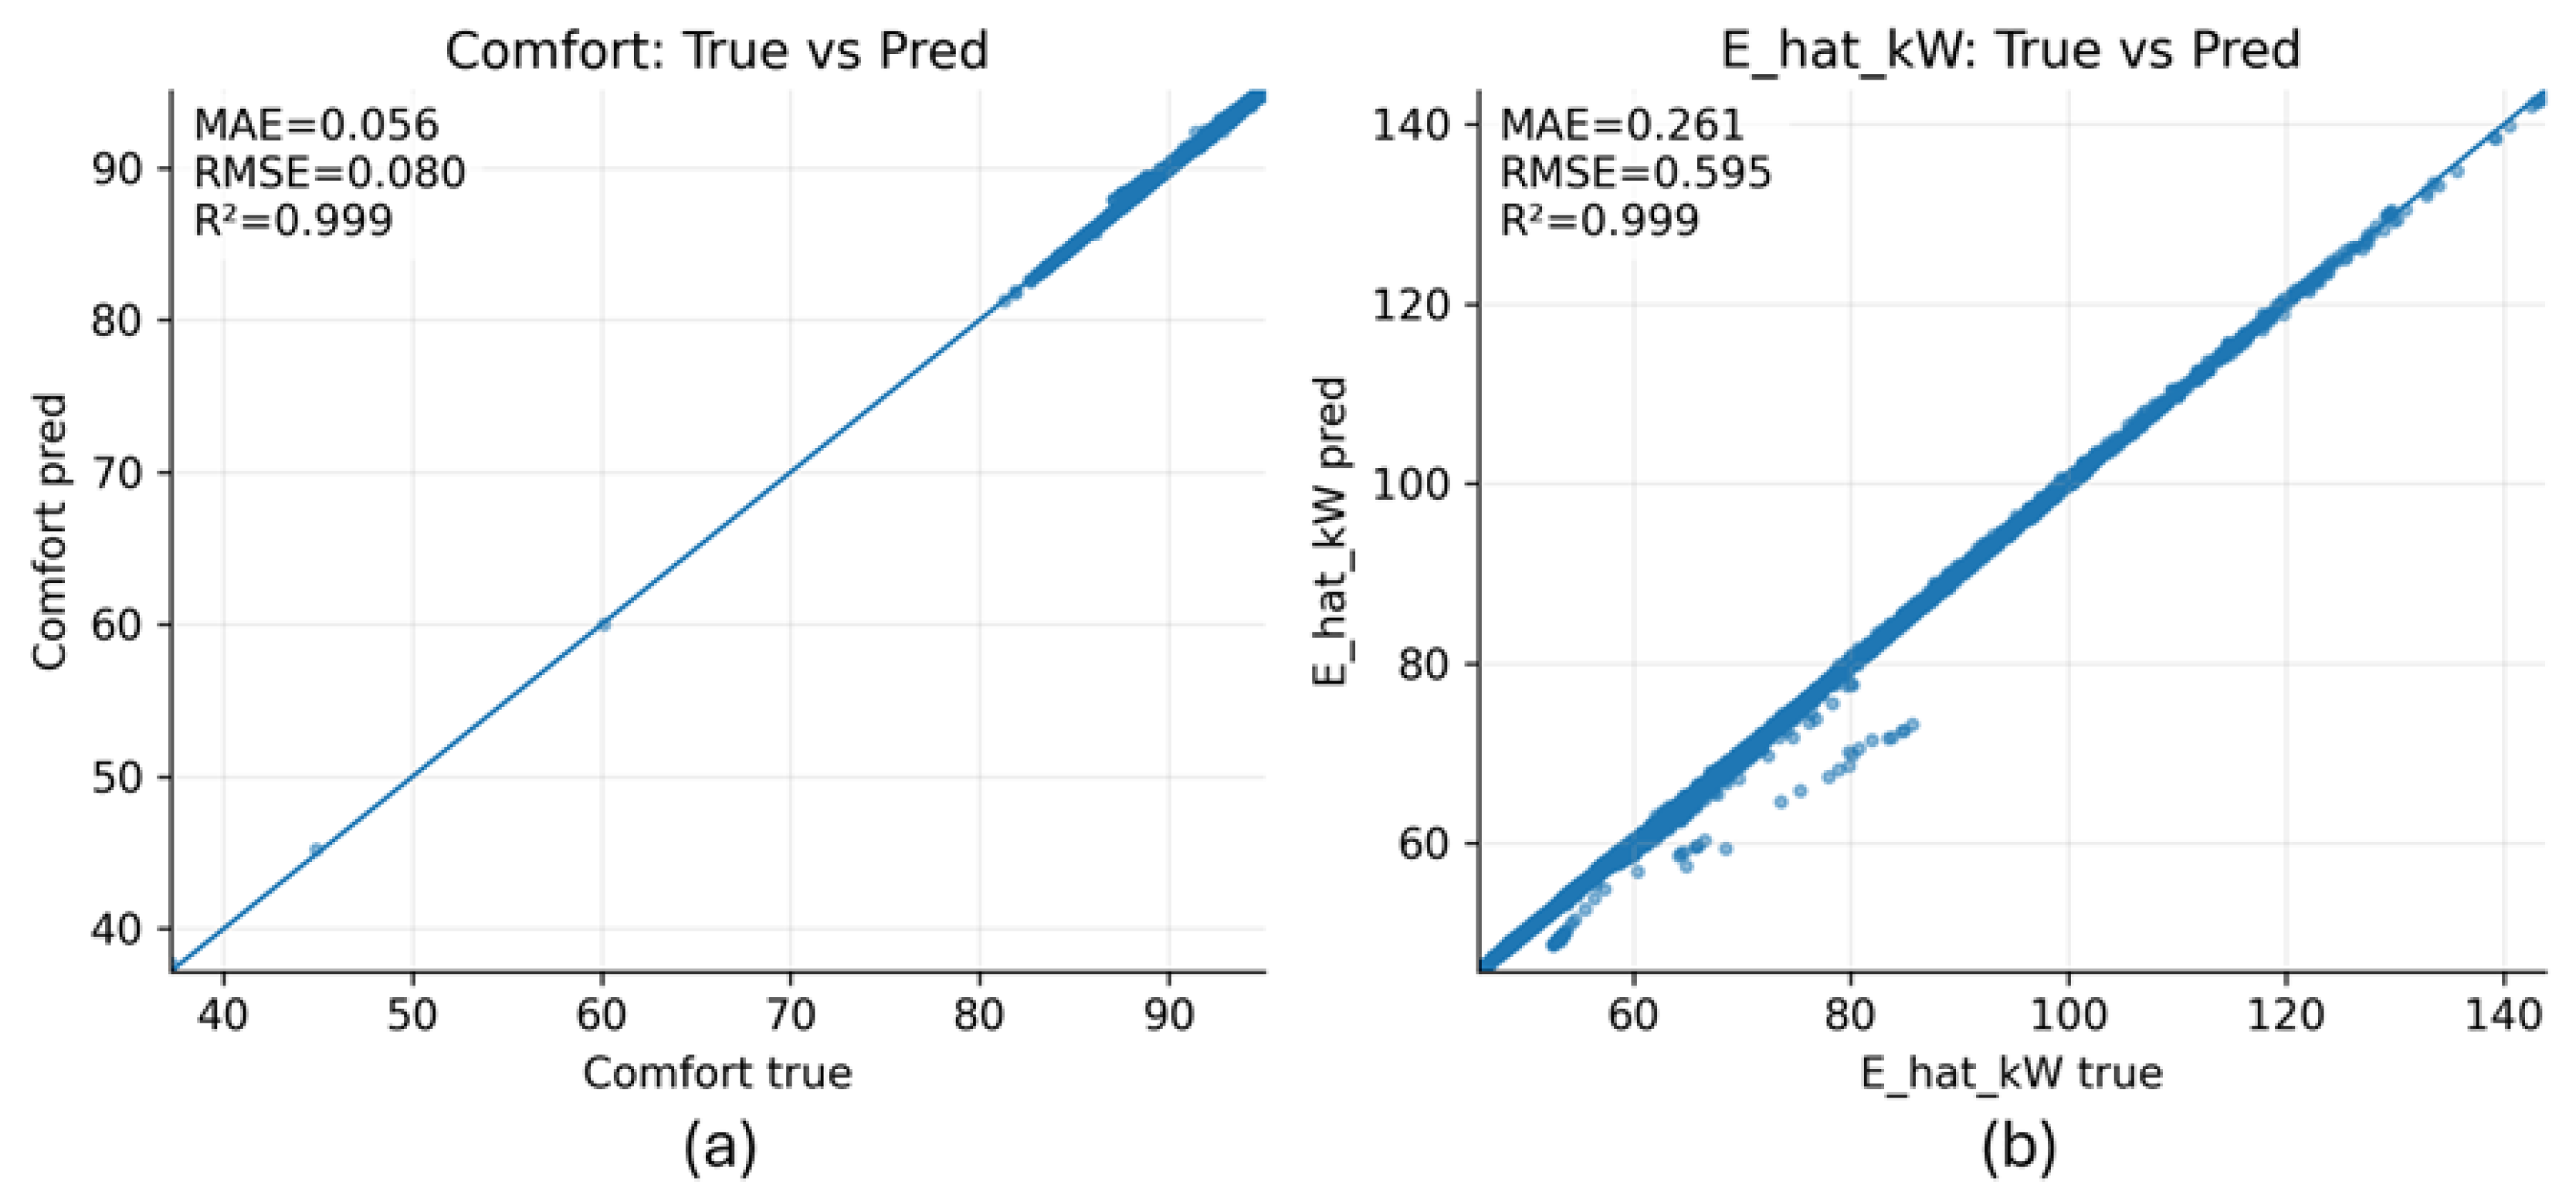
Figure 3 shows that both predicted comfort and predicted energy consumption values closely follow the diagonal reference line, indicating that the model produces unbiased and well-calibrated predictions across the full range of observed conditions.
Figure 3.
Comparing between predicted and true values for comfort in (a) and energy consumption in (b) in the Bldg59 dataset [15]. The near-diagonal alignment indicates excellent calibration and minimal prediction bias.
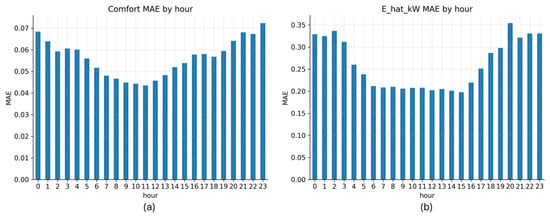
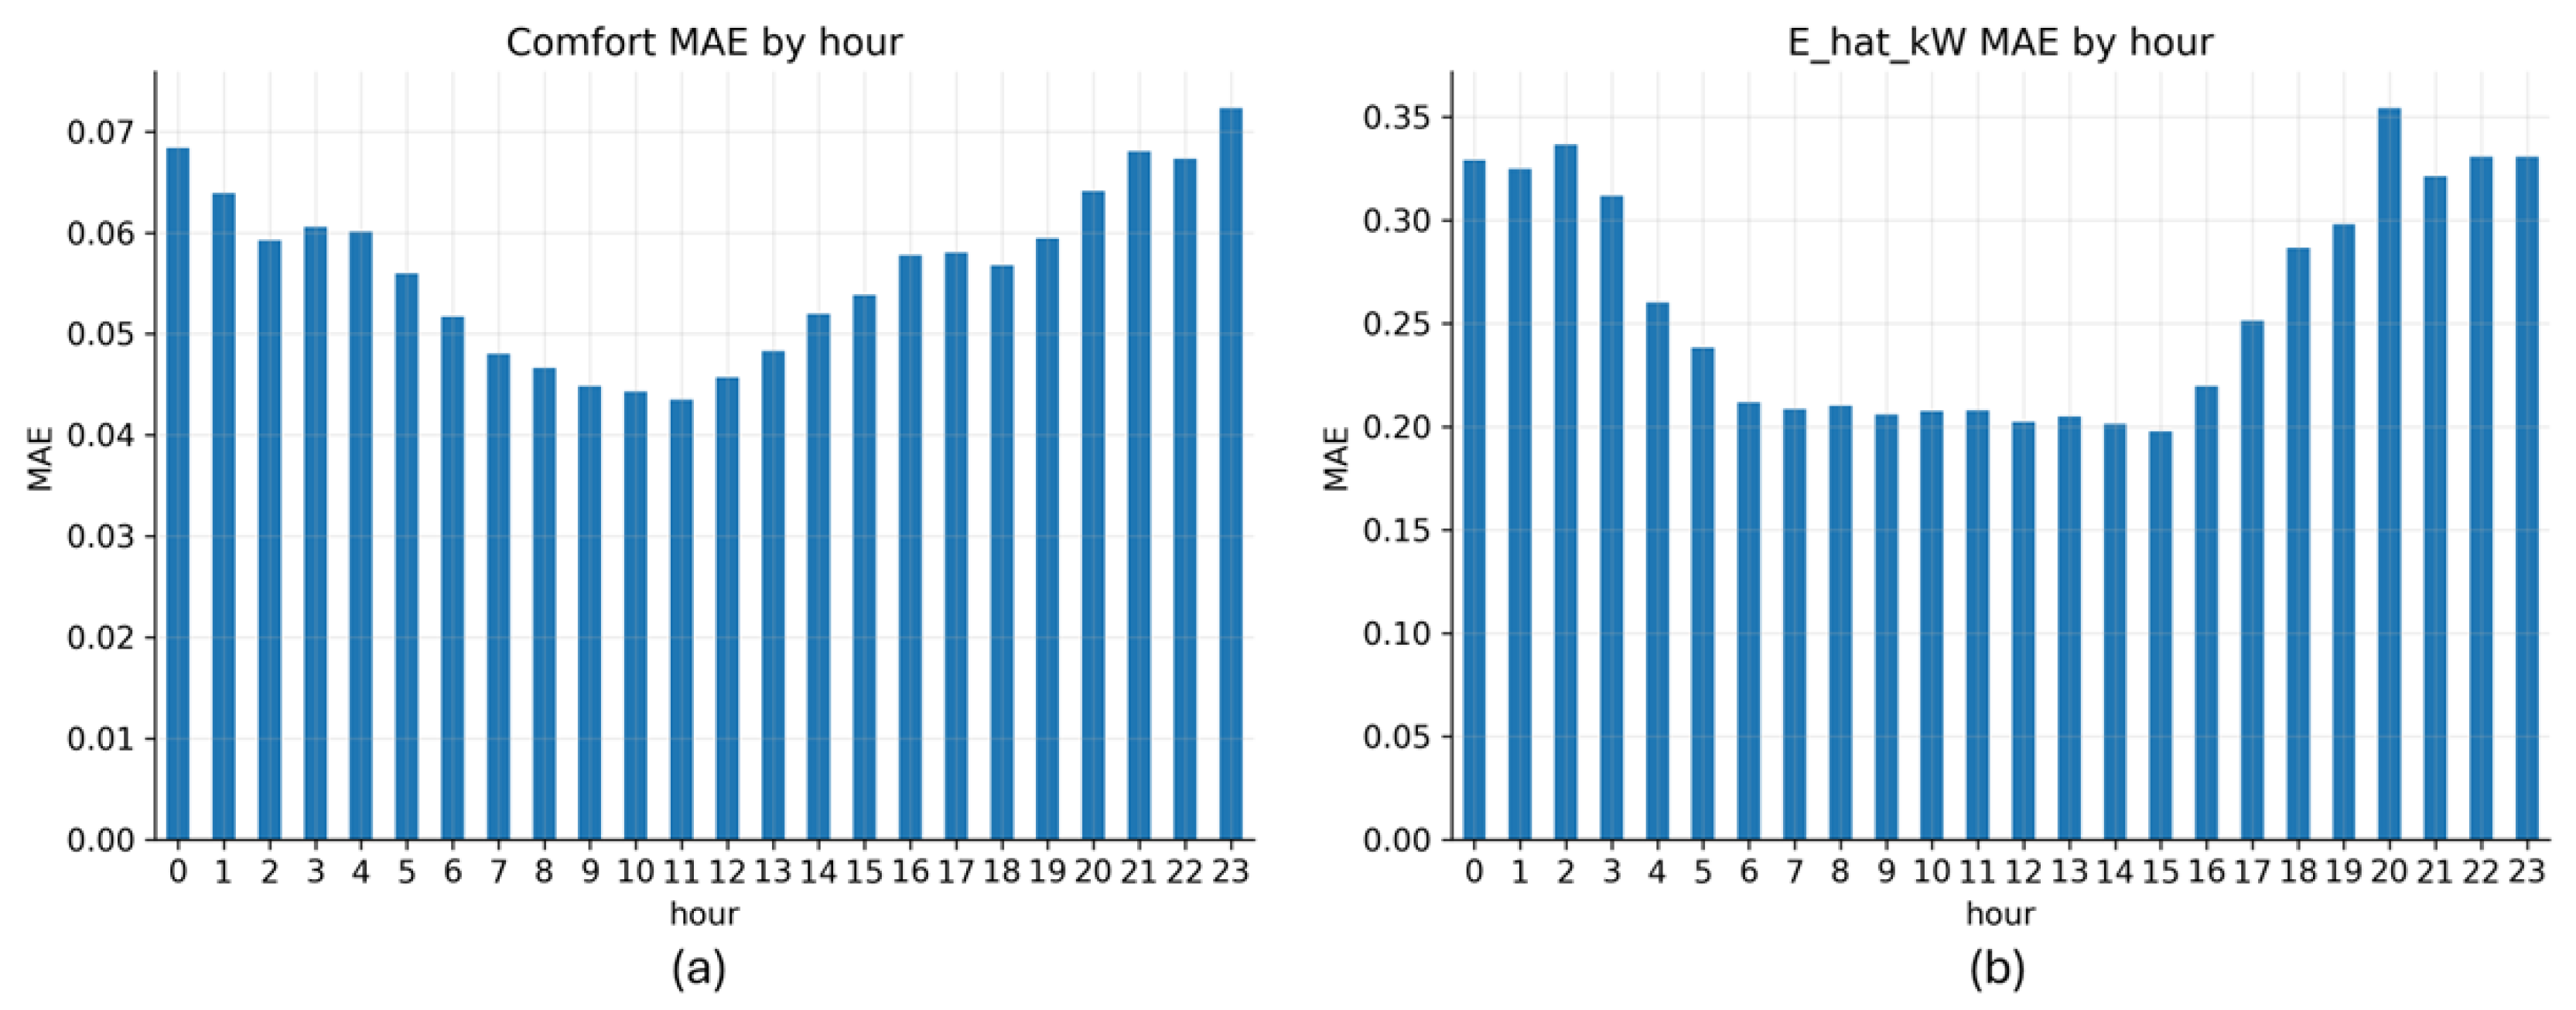
The model’s hourly error analysis revealed systematic variations in predictive accuracy throughout the day. Figure 4 shows the mean absolute error (MAE) distribution across the 24-h cycle for the Bldg59 dataset [15]. The lowest errors occurred during daytime periods (07:00–14:00), corresponding to stable HVAC operation and consistent occupancy, while errors slightly increased during nighttime hours due to dynamic thermal recovery and unoccupied cooling cycles.
Figure 4.
Hourly mean absolute error (MAE) for predicted comfort in (a) and energy consumption in (b). Lower errors are observed during daytime periods, corresponding to steady occupancy and HVAC regulation.
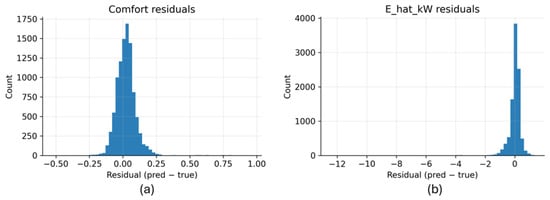
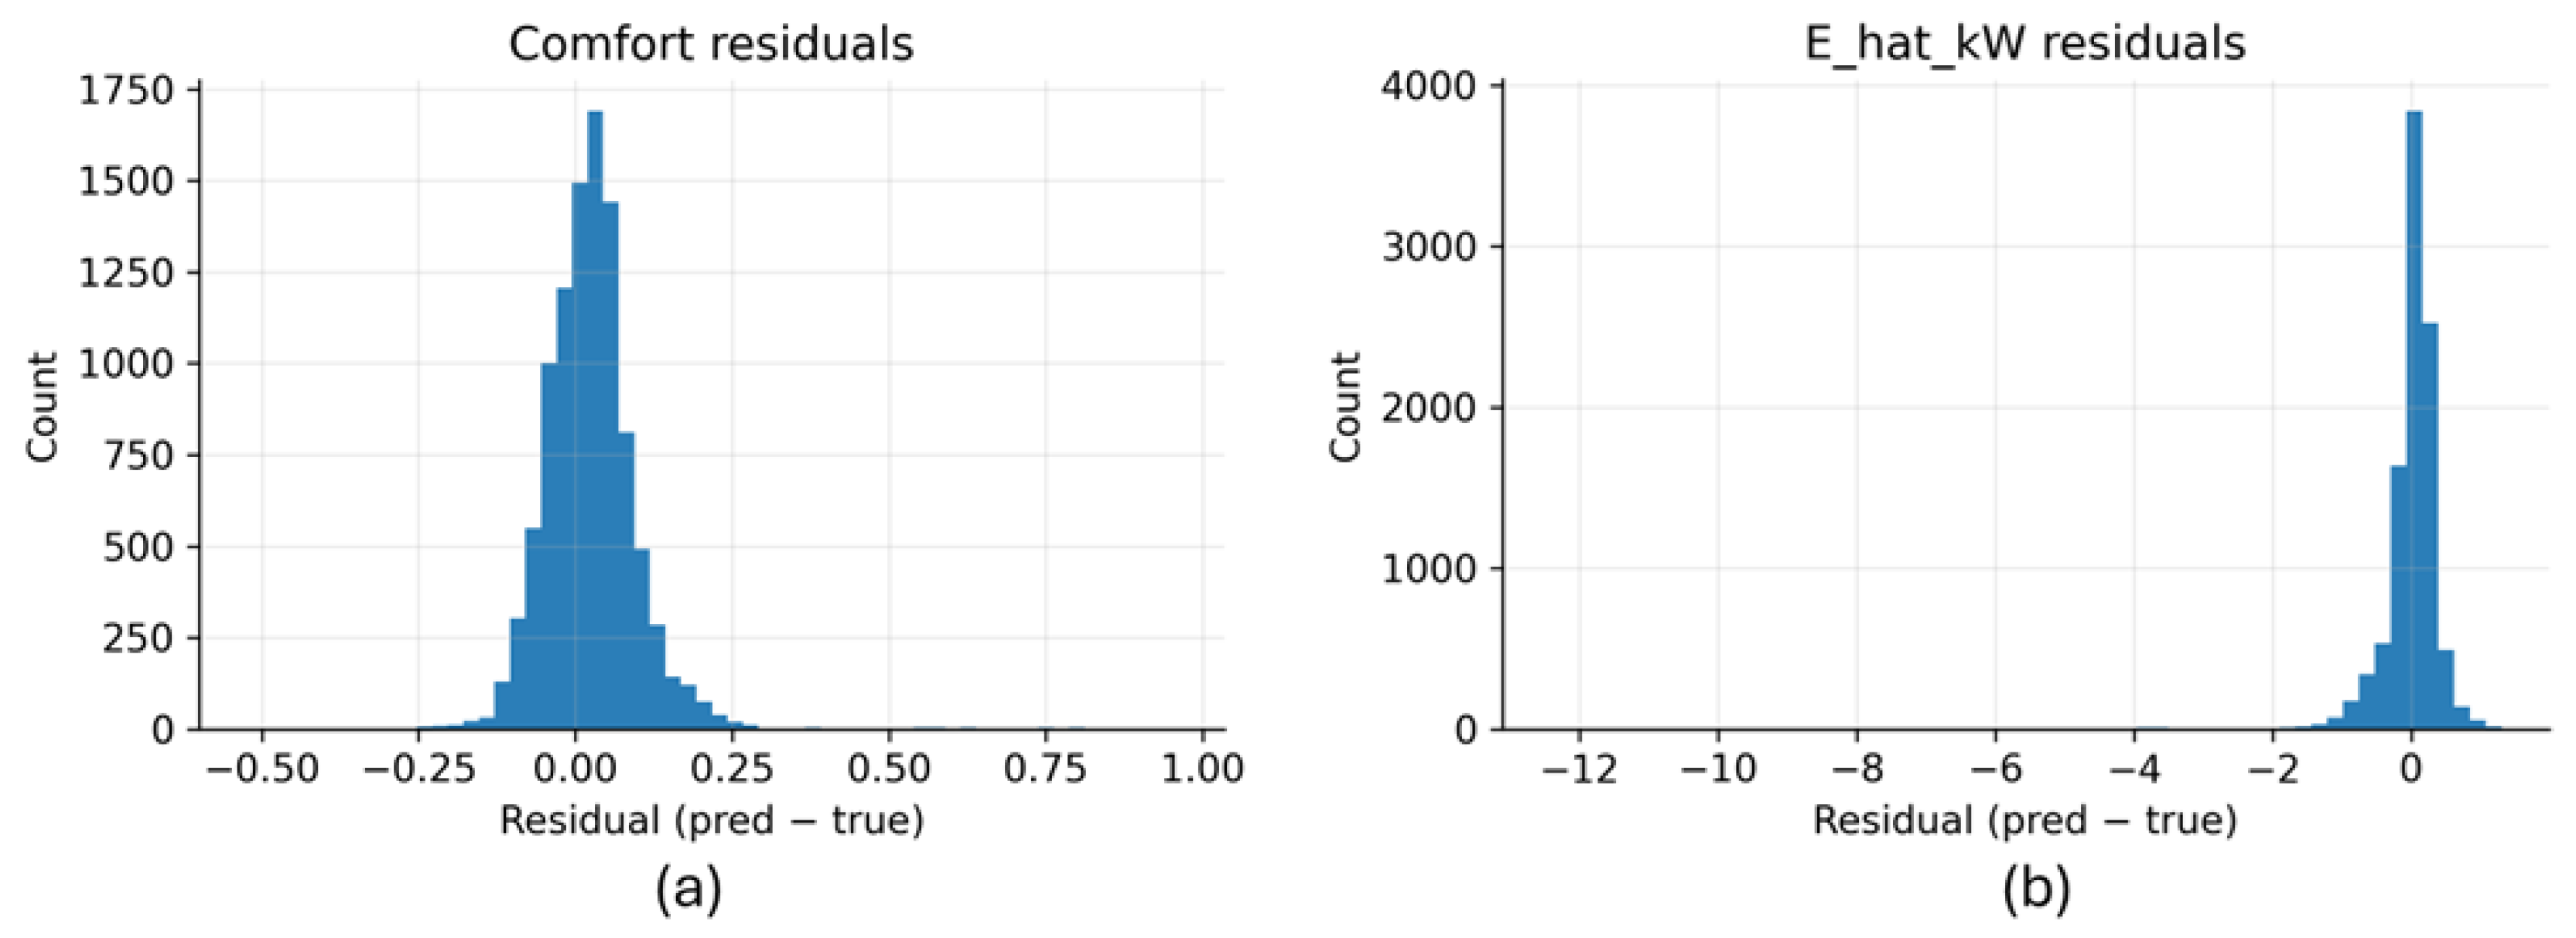
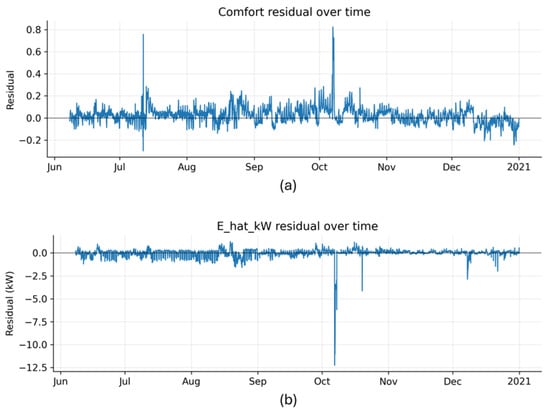
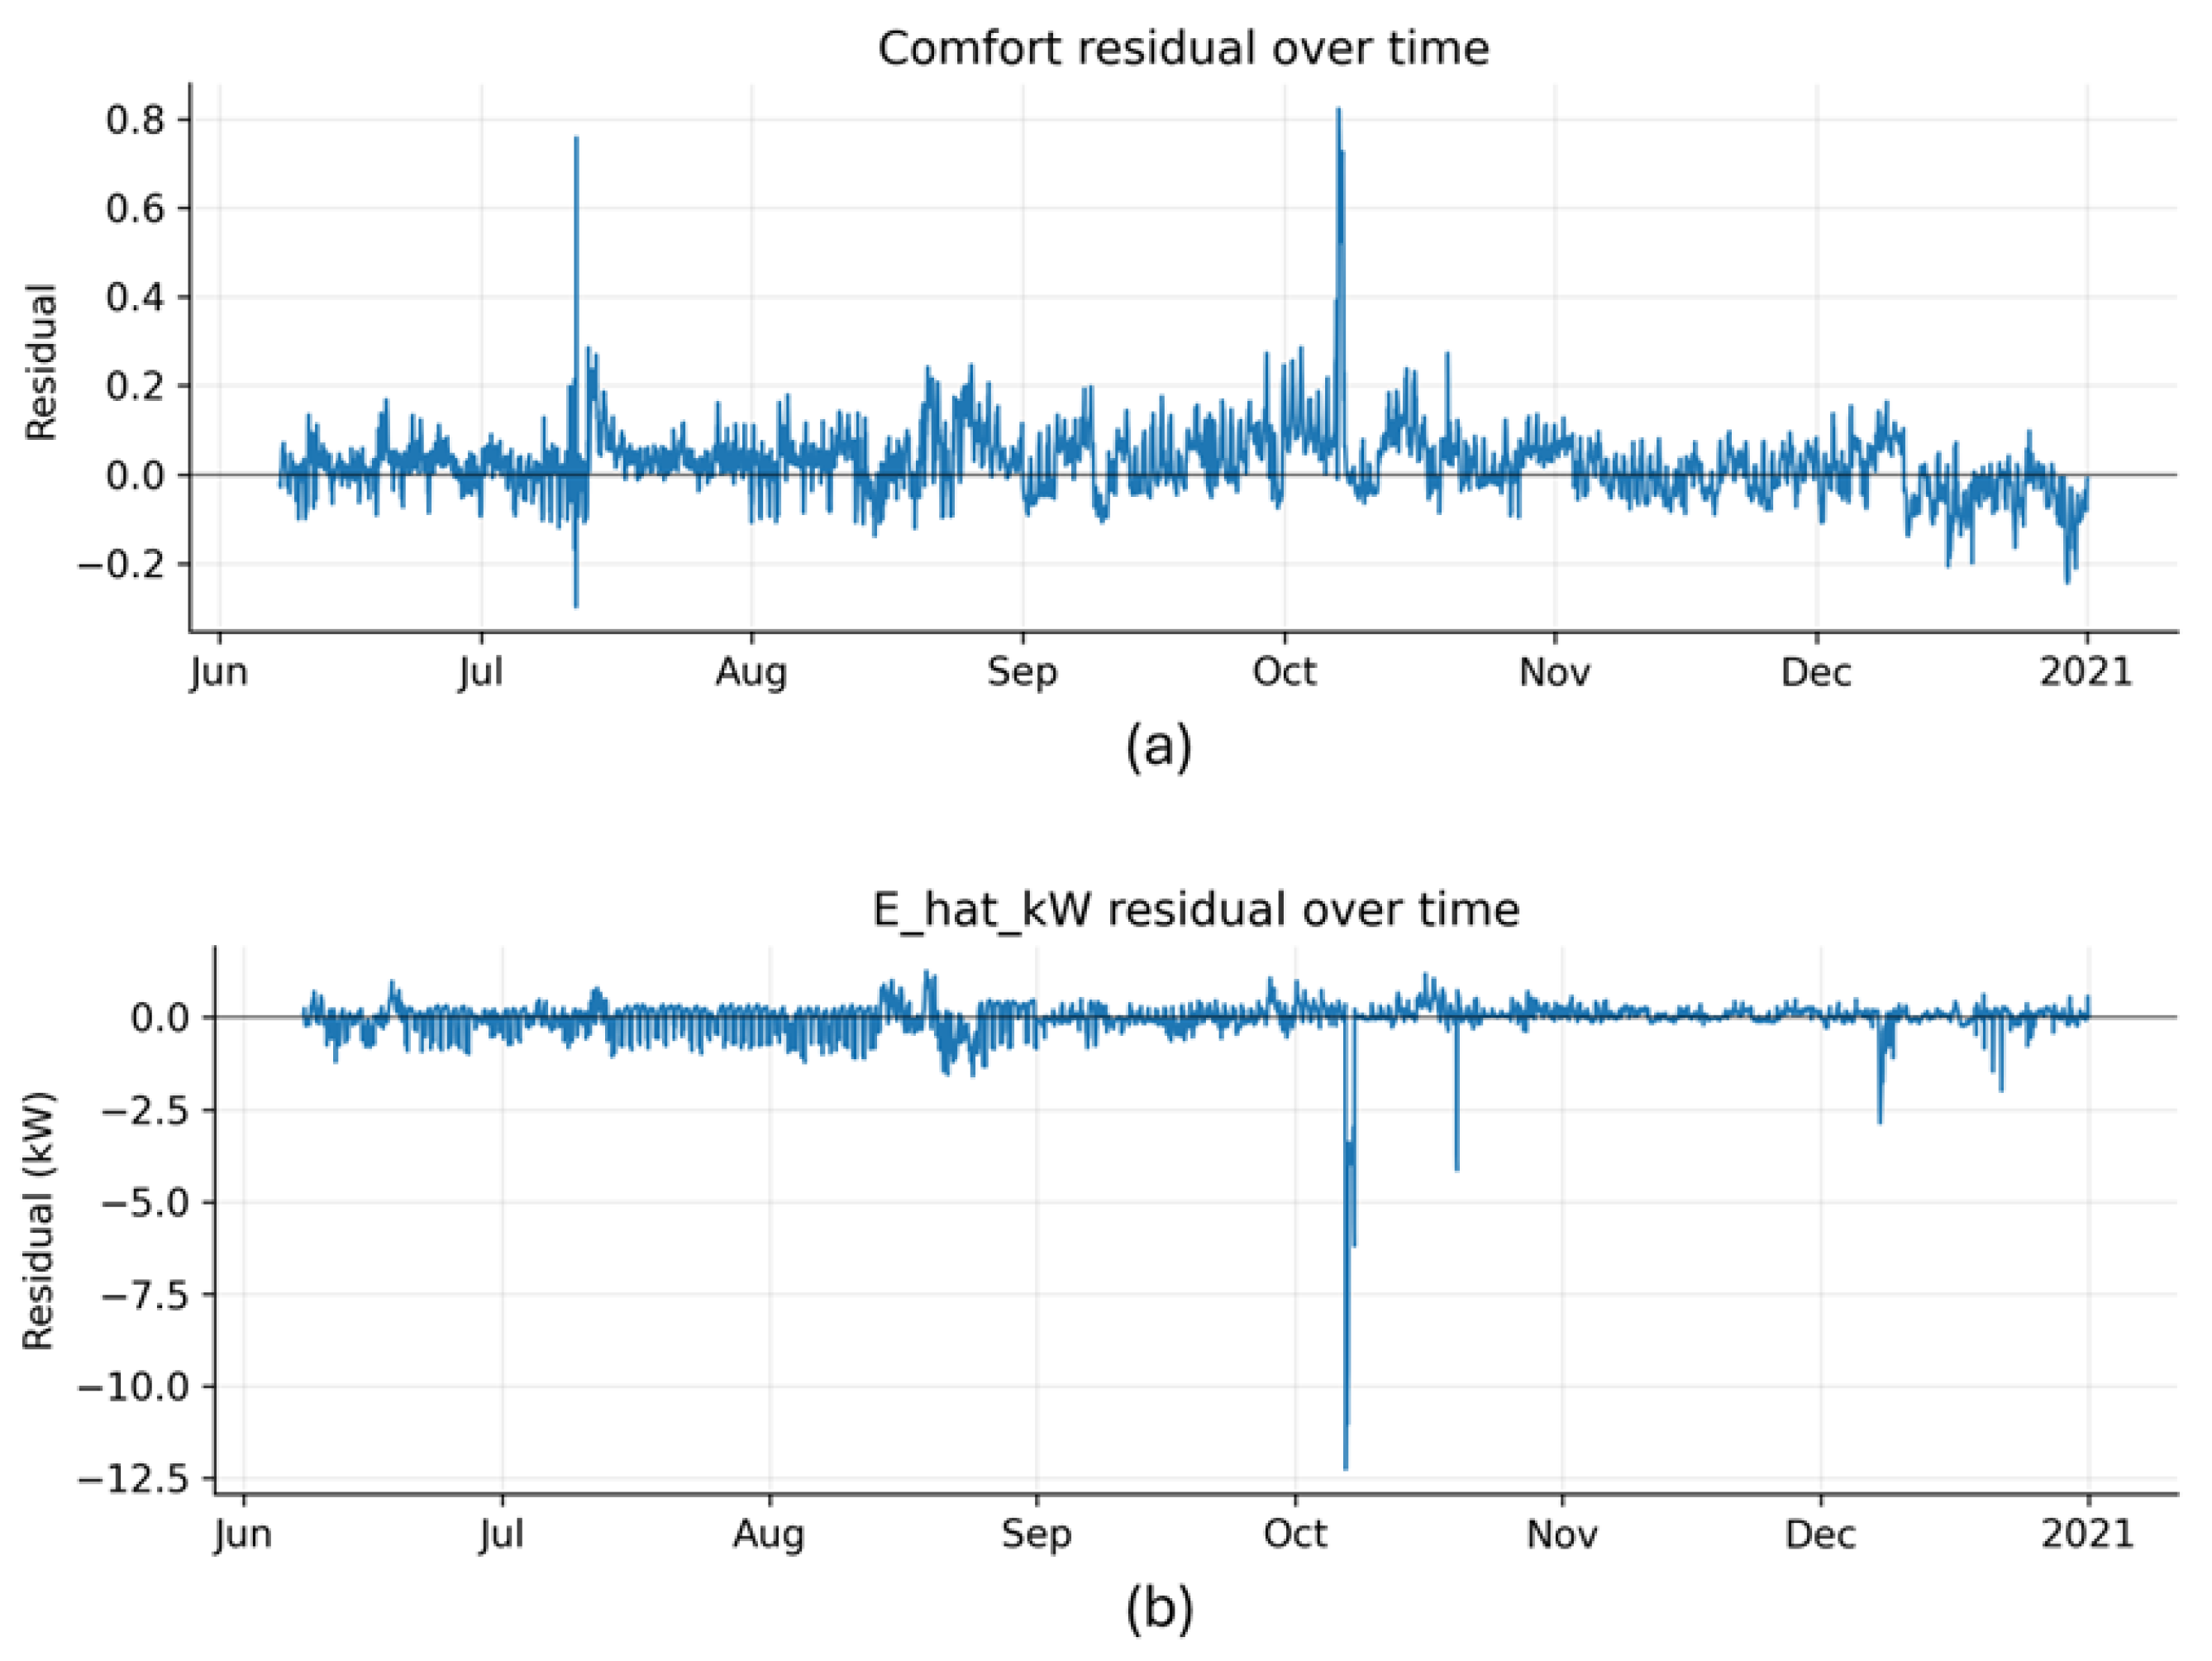
The residual distributions for both predictions are shown in Figure 5. They are approximately Gaussian and centered around zero, confirming the absence of systematic over- or under-prediction. However, temporal residual trends shown in Figure 6 demonstrate that prediction deviations are sporadic and correspond to abrupt HVAC transients rather than long-term bias.
Figure 5.
Histogram of residuals (predicted–true) for comfort and energy consumption prediction in (a) and (b), respectively. The near-symmetric, zero-centered distribution indicates unbiased model behavior.
Figure 6.
Temporal residuals of (a) comfort and (b) energy consumption prediction for the validation period. The residuals remain near zero, with small transient spikes linked to abrupt indoor temperature fluctuations.
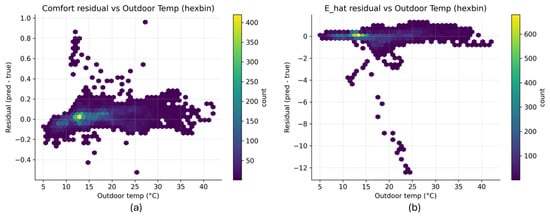
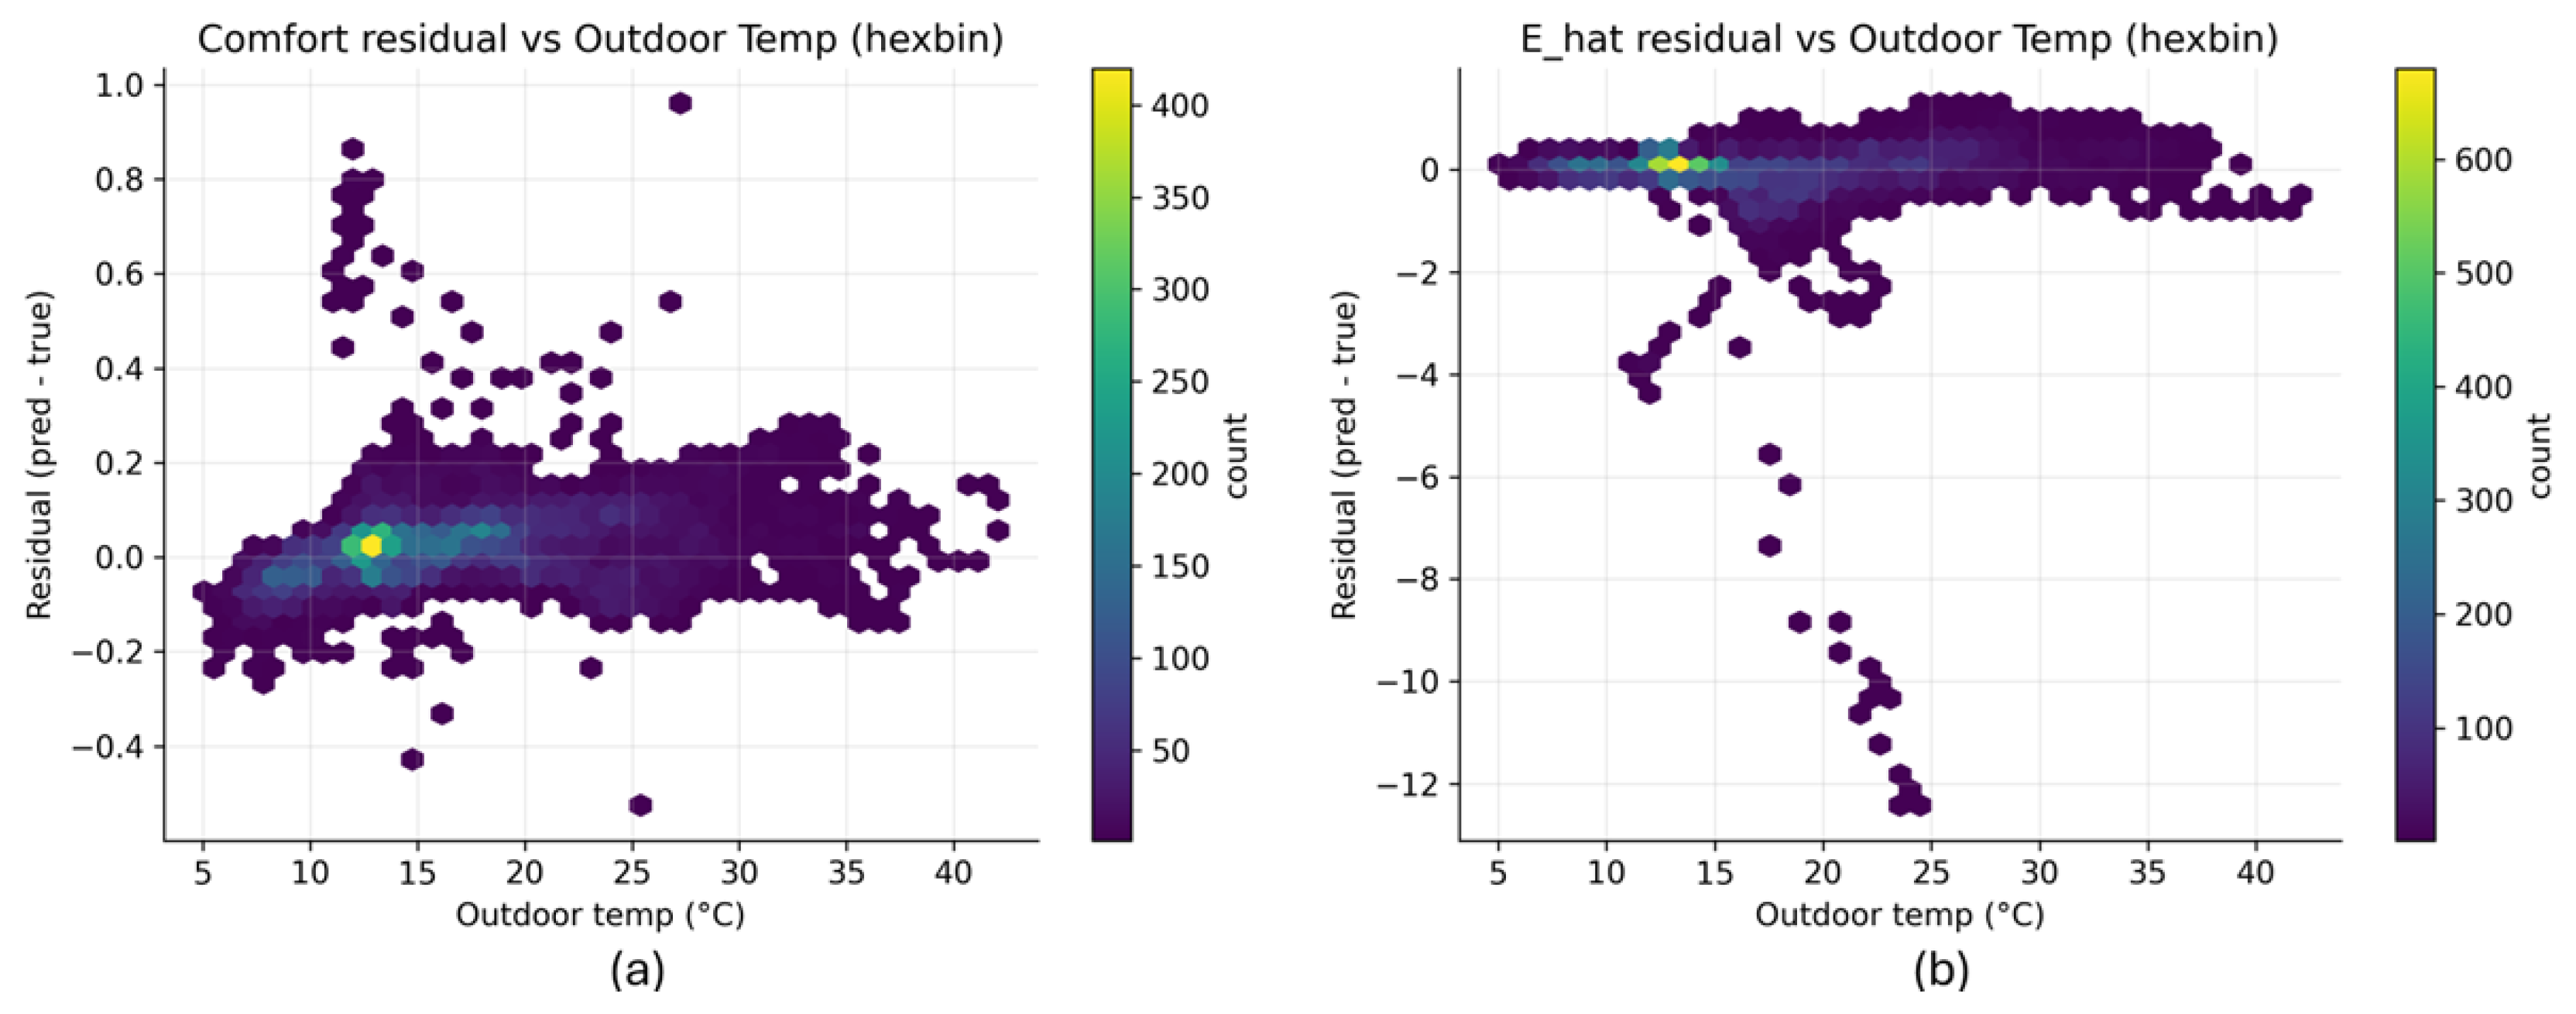
To enrich interpretability, the prediction–ground truth residuals versus outdoor temperature plots in Figure 7 further illustrate the stability of predictions across climatic conditions. Comfort residuals remain symmetrically distributed around zero across all temperature ranges, while energy consumption residuals show slight underestimation at higher outdoor temperatures, reflecting rare high-load conditions in the dataset.
Figure 7.
Residuals of (a) comfort and (b) energy consumption prediction as a function of outdoor temperature. The residuals remain balanced across the full 5–40 °C range, indicating strong model generalization.
3.2. Performance on the Smart Building PRBS and Thermostat Dataset
The transformer model was further evaluated on the Smart Building PRBS and Thermostat Dataset, which contains short-term controlled experiments where thermostat setpoints were perturbed using a pseudo-random binary sequence (PRBS). This dataset imposes highly dynamic thermal and comfort conditions, testing the model’s ability to generalize beyond steady-state operation.
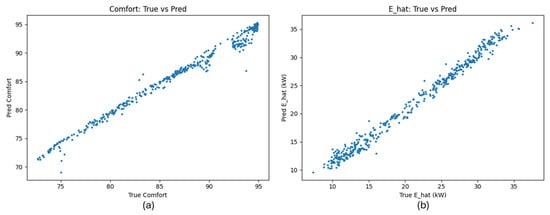
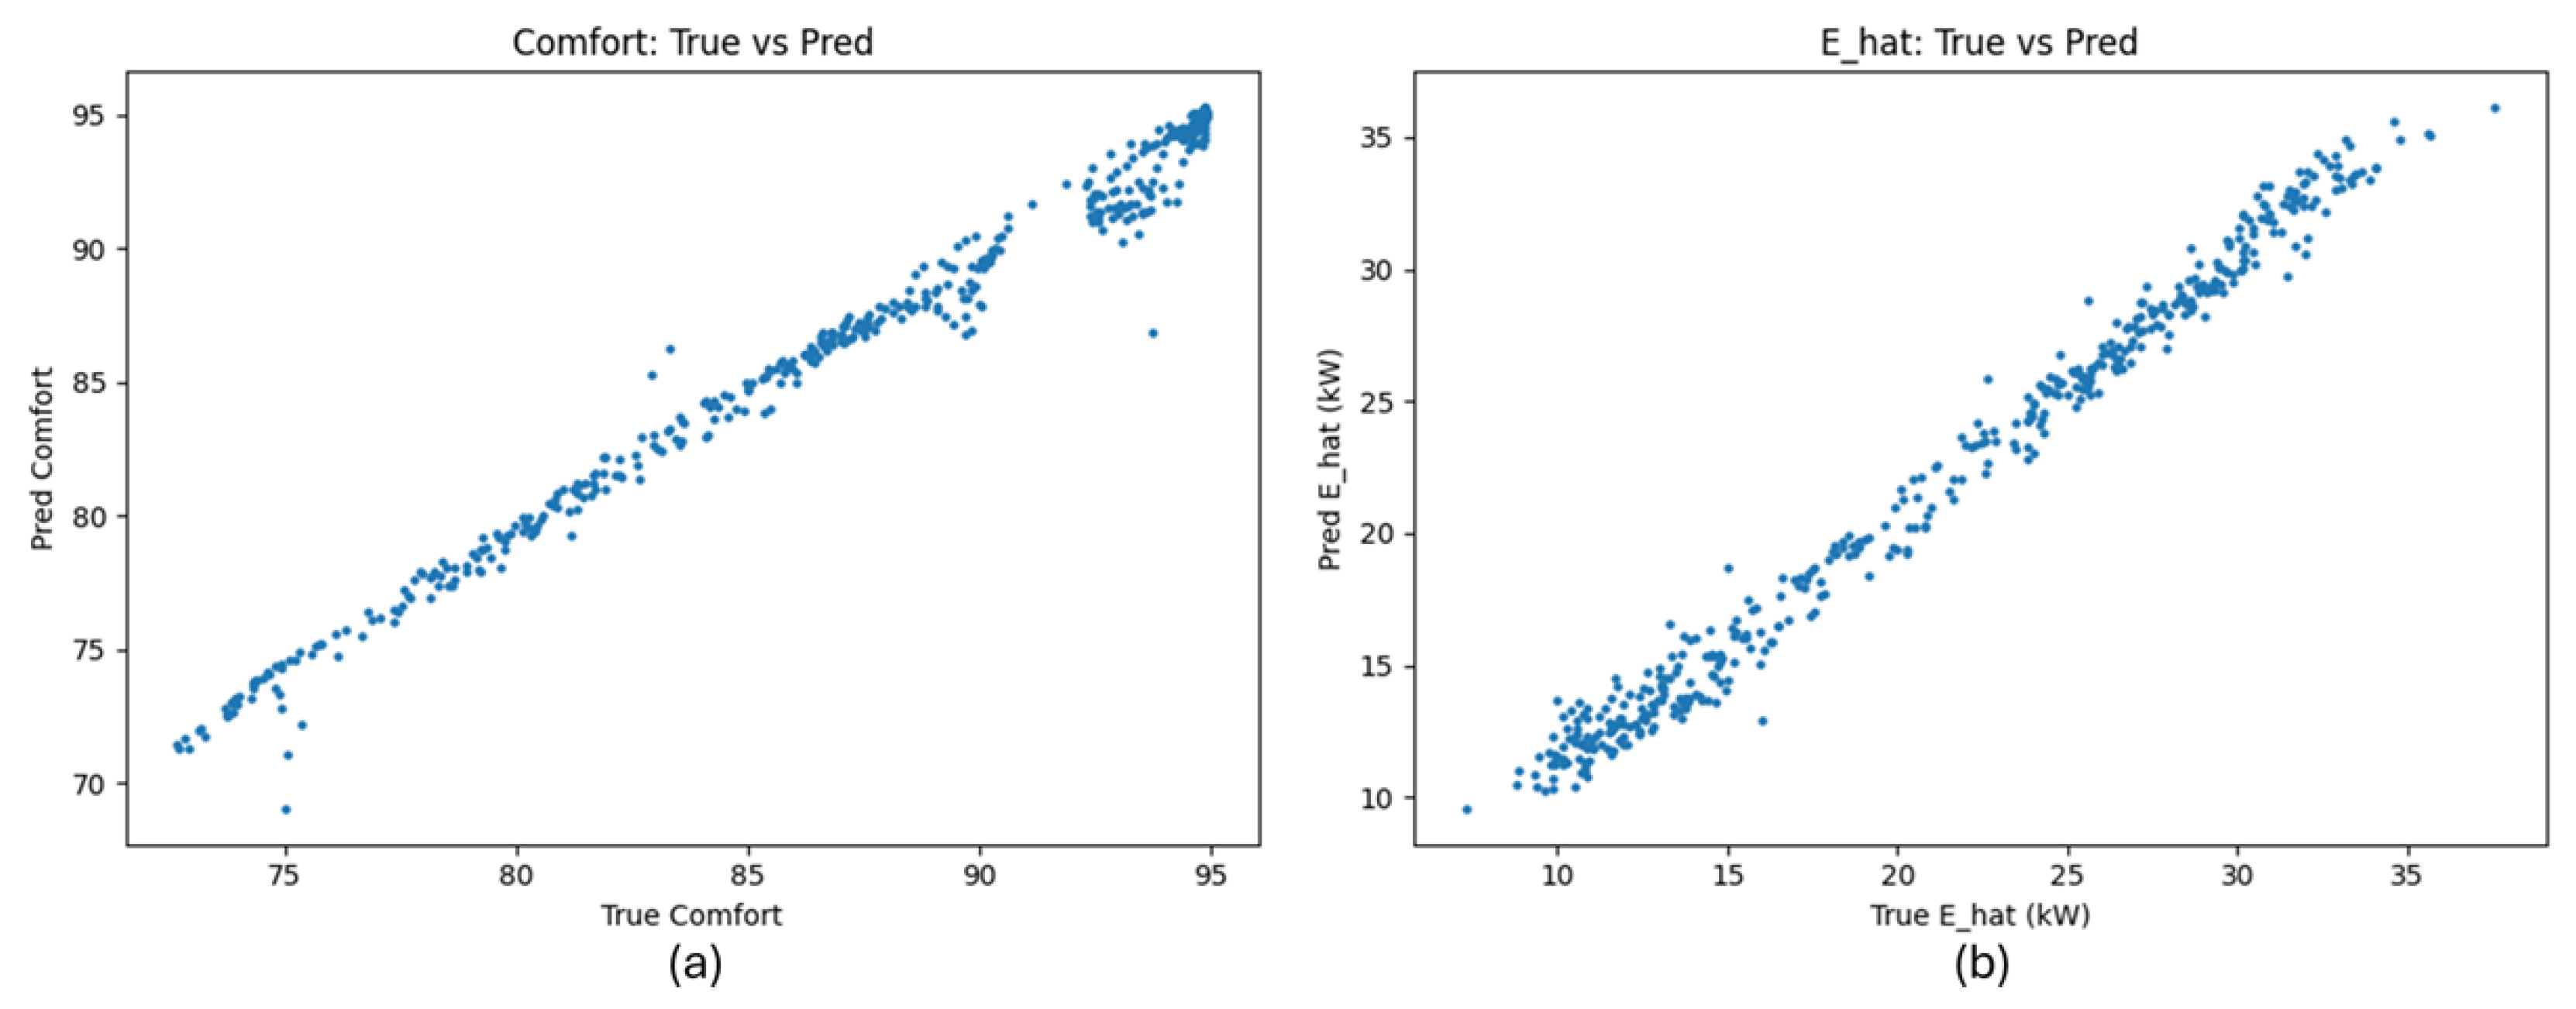
Figure 8a shows the relationship between true and predicted comfort scores. The data points closely align along the diagonal, yielding an of 0.982 and demonstrating strong agreement between predicted and measured comfort levels. Only minor dispersion is observed at the lower comfort range, likely due to transient undercooling events following abrupt thermostat changes.
Figure 8.
Scatter plot of predicted versus true (a) comfort and (b) energy consumption for the Smart Building PRBS and Thermostat dataset [14]. The model maintains a strong linear correlation () and minimal dispersion.
Similarly, Figure 8b presents the predicted versus true energy consumption () relationship. The data points exhibit near-perfect linearity (), confirming the model’s capability to accurately track transient variations in energy demand resulting from thermostat perturbations.
Overall, the transformer-based model successfully captured both the steady-state and transient dynamics of indoor environmental conditions. It generalized effectively across datasets with distinct temporal patterns, exhibiting high accuracy, low bias, and consistent calibration. These results confirm the model’s suitability for predictive control, comfort optimization, and integration into digital twin frameworks for smart building management.
3.3. Comparative Evaluation with Baseline Models
To further evaluate the performance and generalization capability of the proposed transformer-based multimodal regression framework, two sets of comparative experiments were conducted using the two datasets. Both experiments compared the proposed model against three widely used baseline methods: the Multiple Linear Regression (MLR) [19] model representing traditional statistical modeling, the Random Forest (RF) [20] regressor representing nonlinear ensemble learning, and the Long Short-Term Memory (LSTM) [9] network representing deep recurrent sequence learning. All models were trained and evaluated using identical data splits, feature sets, and temporal resolutions to ensure a fair comparison.
Table 2 presents the comparative results on the Bldg59 dataset [15], which represents steady-state building operation under naturally varying conditions. In addition to MAE and , the Root Mean Squared Error (RMSE) is reported to reflect peak deviation behavior. The proposed transformer consistently achieved the lowest mean absolute error (MAE), lowest RMSE, and the highest coefficient of determination () and calibration slope across both comfort and energy consumption prediction tasks. This confirms its superior ability to model long-term temporal dependencies and complex nonlinear couplings among temperature, humidity, occupancy, and HVAC control signals.
Table 2.
Comparison of the proposed transformer-based framework with baseline models on the Bldg59 Energy and Thermal Dynamics Dataset. The best results for each metric are highlighted in bold.
To assess generalization under highly dynamic operating conditions, all models were also evaluated on the Smart Building PRBS and Thermostat Dataset [14], which contains rapid setpoint perturbations and transient thermal responses. As shown in Table 3, the proposed transformer again outperformed the baseline models, achieving values exceeding 0.98 for both comfort and energy consumption prediction tasks, while also attaining the lowest RMSE values across all methods. While the LSTM model also achieved competitive accuracy, it exhibited slightly weaker calibration, particularly during abrupt temperature changes. The transformer’s global attention mechanism enables it to model these fast transitions more effectively, maintaining predictive stability without lag accumulation.
Table 3.
Comparison of the proposed transformer-based framework with baseline models on the Smart Building PRBS and Thermostat Dataset. The best results for each metric are highlighted in bold.
Across both datasets, the transformer-based framework demonstrated consistent superiority over conventional statistical, ensemble, and recurrent models. The lowest RMSE values obtained for both comfort and energy consumption confirm that the proposed model minimizes not only average error (MAE) but also peak deviation behavior. Its ability to capture both steady-state and transient patterns with high calibration fidelity confirms its suitability as a core predictive component in digital twin systems for smart building energy management.
4. Discussion
The results obtained from both the Bldg59 and Smart Building PRBS and Thermostat datasets collectively demonstrate the effectiveness and generalizability of the proposed transformer-based multimodal regression framework in modeling and predicting the coupled dynamics of indoor comfort and energy consumption. The model’s capacity to capture nonlinear and time-dependent relationships across diverse building operating regimes highlights the advantages of self-attention mechanisms in handling complex temporal and environmental dependencies. Unlike recurrent networks that rely on sequential memory propagation, the transformer architecture attends directly to all time steps in parallel, enabling it to model both short- and long-term thermal interactions more effectively [10,11]. This structure allows it to maintain stable convergence and strong generalization, as observed from the smooth loss behavior in Figure 2.
The strong alignment between predicted and actual values across both datasets indicates that the model successfully captured the underlying comfort–energy coupling. Comfort and energy consumption are intrinsically linked through indoor environmental quality, occupancy behavior, and HVAC control dynamics. In contrast to traditional PMV-based formulations that assume fixed metabolic and clothing parameters, the proposed data-driven approach adapts dynamically to real operating conditions. This adaptability enables the model to accommodate variations in occupant behavior, control hysteresis, and external weather disturbances without the need for explicit parameter tuning. The near-perfect calibration and low bias across different outdoor temperatures further confirm that the learned representations generalize well to both steady-state and transitional thermal regimes.
Residual analysis offers further insight into the interpretability and physical consistency of the model. The zero-centered Gaussian residual distributions and limited transient spikes reveal that the model does not introduce systematic over- or underestimation but rather responds proportionally to environmental changes. Notably, most prediction deviations coincide with HVAC state transitions or sudden changes in occupancy load, which are known to generate high-frequency thermal disturbances that challenge even physics-based comfort estimators [21]. The residual–temperature relationships suggest that the model slightly underestimates energy consumption at high outdoor temperatures, a phenomenon consistent with the nonlinear increase in compressor load during extreme conditions. These findings confirm that the learned model remains physically coherent while achieving high predictive accuracy.
The comparative evaluation further substantiates the superiority of the proposed transformer model. On the Bldg59 dataset, the transformer achieved a mean absolute error (MAE) of 0.023 and of 0.987 for comfort prediction, outperforming Multiple Linear Regression (MLR), Random Forest (RF), and Long Short-Term Memory (LSTM) networks by a wide margin. Similar performance gains were observed for energy consumption prediction, where the model achieved an MAE of 0.021 and of 0.991. These results demonstrate that the attention mechanism effectively captures both temporal and cross-modal interactions—across temperature, humidity, occupancy, and HVAC parameters—that conventional regression or recurrent models struggle to represent. The superior calibration slope (0.99) further indicates that the transformer maintains scale-consistent predictions, which is essential for deployment in closed-loop control systems.
When tested on the highly dynamic Smart Building PRBS and Thermostat Dataset, which emulates forced HVAC perturbations, the model continued to outperform all baseline methods. It achieved values above 0.98 for both comfort and energy consumption estimation, confirming its robustness under transient operating conditions. The LSTM model, though competitive, exhibited lag-related errors during abrupt thermostat changes—a limitation inherent to recurrent architectures [22]. In contrast, the transformer’s global self-attention enabled it to simultaneously learn short-term cause–effect relations and long-term thermal inertia effects, preserving prediction accuracy even under rapid environmental shifts. These findings align with recent research emphasizing the superiority of attention mechanisms for dynamic sequence modeling in cyber-physical systems [23].
The practical implications of these outcomes extend beyond predictive performance. By jointly predicting comfort and energy consumption, the proposed framework implicitly learns the trade-off surface between occupant satisfaction and power demand. This dual-task capability positions the model as a surrogate for real-time model predictive control (MPC), enabling proactive HVAC optimization with reduced computational overhead [24,25]. Furthermore, the model’s calibration stability and interpretability of residuals enhance its transparency, an essential feature for integration into digital twin platforms [26,27]. Within such frameworks, the transformer can function as the cognitive layer that bridges sensory data and control actions—continuously adapting predictions to changing building conditions while maintaining reliability and explainability.
Despite its promising performance, several limitations should be acknowledged. The evaluated datasets represent controlled or semi-controlled environments and may not fully capture sensor noise, actuator delays, and stochastic occupancy behavior encountered in large multi-zone commercial buildings. Furthermore, both datasets correspond to specific climatic and operational contexts, and climatic generalizability across heating-dominated and cooling-dominated regions requires further investigation using geographically diverse building portfolios. Cross-building transfer learning and federated training represent promising directions to enhance scalability while preserving data privacy. Finally, the present model performs deterministic point prediction; extending it toward uncertainty-aware prediction would further support risk-sensitive decision-making in real building operation.
In summary, the proposed transformer-based multimodal framework establishes a robust foundation for holistic comfort–energy consumption modeling in smart buildings. Its ability to generalize across steady and dynamic regimes, maintain interpretability, and outperform conventional models underscores its potential as a cornerstone for predictive digital twin systems supporting next-generation energy-efficient and occupant-aware building management.
5. Conclusions
This work presented a multimodal transformer-based framework for jointly predicting indoor comfort and energy efficiency using real-world building datasets. By learning the coupled thermal–energy dynamics from both steady-state and dynamically perturbed environments, the model achieved highly accurate, unbiased, and well-calibrated predictions. Its ability to generalize across different operating regimes highlights the strength of attention-based architectures in capturing complex temporal dependencies. Beyond accurate forecasting, the framework provides a scalable foundation for predictive control and digital twin applications, enabling data-driven optimization of comfort–energy trade-offs in smart, energy-efficient buildings. Future research will focus on extending the proposed framework toward probabilistic transformer architectures for uncertainty-aware comfort and energy prediction, as well as closed-loop integration with reinforcement learning and model predictive control for active HVAC optimization. Scaling the framework across large building portfolios and multiple climate zones, potentially through transfer learning or federated learning, will further establish it as a deployable cognitive layer for next-generation digital twin platforms in smart buildings.
Author Contributions
Conceptualization, M.A.; methodology, M.A.; software, M.A.; validation, M.A.; formal analysis, M.A.; investigation, M.A.; resources, S.A., Y.H., H.A. and W.M.; data curation, M.A.; writing—original draft preparation, M.A.; writing—review and editing, M.A., S.A., Y.H., H.A. and W.M.; visualization, M.A.; supervision, S.A., Y.H., H.A. and W.M.; project administration, S.A.; funding acquisition, S.A. All authors have read and agreed to the published version of the manuscript.
Funding
This work was supported by the Dubai Future Foundation under its Research, Development, and Innovation (RDI) Program, with grant No. 2024UNDUB-ATA-033. The statements made herein are solely the responsibility of the authors.
Data Availability Statement
The original contributions presented in this study are included in the article. Further inquiries can be directed to the corresponding author.
Conflicts of Interest
The authors declare no conflicts of interest.
References
- International Energy Agency (IEA). Buildings: A Source of Enormous Untapped Efficiency Potential. 2020. Available online: https://www.iea.org/topics/buildings (accessed on 5 September 2025).
- Fanger, P.O. Thermal Comfort: Analysis and Applications in Environmental Engineering; McGraw-Hill: New York, NY, USA, 1970. [Google Scholar]
- ANSI/ASHRAE Standard 55; Thermal Environmental Conditions for Human Occupancy. American Society of Heating, Refrigerating and Air-Conditioning Engineers: Atlanta, GA, USA, 2020.
- ISO 7730; Ergonomics of the Thermal Environment—Analytical Determination and Interpretation of Thermal Comfort Using Calculation of the PMV and PPD Indices and Local Thermal Comfort Criteria. ISO: Geneva, Switzerland, 2005.
- Kissock, J.K.; Haberl, J.S.; Claridge, D.E. Inverse modeling toolkit: Numerical algorithms. ASHRAE Trans. 2003, 109, 425. [Google Scholar]
- ASHRAE. ASHRAE Guideline 14: Measurement of Energy, Demand, and Water Savings; American Society of Heating, Refrigerating and Air-Conditioning Engineers: Atlanta, GA, USA, 2014. [Google Scholar]
- Amasyali, K.; El-Gohary, N.M. A Review of Data-Driven Building Energy Consumption Prediction Studies. Renew. Sustain. Energy Rev. 2018, 81, 1192–1205. [Google Scholar] [CrossRef] [Scilit]
- Hippert, H.S.; Pedreira, C.E.; Souza, R.C. Neural Networks for Short-Term Load Forecasting: A Review and Evaluation. IEEE Trans. Power Syst. 2001, 16, 44–55. [Google Scholar] [CrossRef] [Scilit]
- Hochreiter, S.; Schmidhuber, J. Long Short-Term Memory. Neural Comput. 1997, 9, 1735–1780. [Google Scholar] [CrossRef] [Scilit] [PubMed]
- Vaswani, A.; Shazeer, N.; Parmar, N.; Uszkoreit, J.; Jones, L.; Gomez, A.N.; Kaiser, Ł.; Polosukhin, I. Attention Is All You Need. In Proceedings of the 31st Conference on Neural Information Processing Systems (NeurIPS), Long Beach, CA, USA, 4–9 December 2017. [Google Scholar]
- Lim, B.; Arik, S.Ö.; Loeff, N.; Pfister, T. Temporal Fusion Transformers for Interpretable Multi-Horizon Time Series Forecasting. In Proceedings of the 34th Conference on Neural Information Processing Systems (NeurIPS), Vancouver, BC, Canada, 6–12 December 2020. [Google Scholar]
- Wei, T.; Wang, Y.; Zhu, Q. Deep Reinforcement Learning for Building HVAC Control. In Proceedings of the 54th Design Automation Conference, Austin, TX, USA, 18–22 June 2017. [Google Scholar]
- Lu, S.; Gu, W.; Ding, S.; Yao, S.; Lu, H.; Yuan, X. Data-driven aggregate thermal dynamic model for buildings: A regression approach. IEEE Trans. Smart Grid 2021, 13, 227–242. [Google Scholar] [CrossRef] [Scilit]
- Sartori, I.; Walnum, H.T.; Skeie, K.S.; Georges, L.; Knudsen, M.D.; Bacher, P.; Candanedo, J.; Granderson, J.; Prakash, A.K.; Sigounis, A.-M.; et al. Sub-Hourly Measurement Datasets from 6 Real Buildings: Energy Use and Indoor Climate. Data Brief 2022, 48, 109149. [Google Scholar] [CrossRef] [Scilit] [PubMed]
- Tianzhen, H.; Na, L.; Blum, D.; Zhe, W. A Three-Year Building Operational Performance Dataset for Informing Energy Efficiency; Lawrence Berkeley National Laboratory: Berkeley, CA, USA, 2022. [Google Scholar]
- van Hoof, J. Forty years of Fanger’s model of thermal comfort: Comfort for all? Indoor Air 2008, 18, 182–201. [Google Scholar] [CrossRef] [Scilit] [PubMed]
- Ge, J.; Sun, J.; Wu, J.; Zhang, W. Aeromagnetic Compensation Algorithm Robust to Outliers of Magnetic Sensor Based on Huber Loss Method. IEEE Sens. J. 2019, 19, 5499–5505. [Google Scholar] [CrossRef] [Scilit]
- Loshchilov, I.; Hutter, F. Decoupled Weight Decay Regularization. arXiv 2017, arXiv:1711.05101. [Google Scholar]
- Montgomery, D.C.; Peck, E.A.; Vining, G.G. Introduction to Linear Regression Analysis, 6th ed.; John Wiley & Sons: Hoboken, NJ, USA, 2021. [Google Scholar]
- Breiman, L. Random Forests. Mach. Learn. 2001, 45, 5–32. [Google Scholar] [CrossRef] [Scilit]
- Liang, J.; Du, R.; Chen, G. Model-Based Fault Detection and Diagnosis of HVAC Systems Using Support Vector Machine Machine methodSystèmes de chauffage, ventilation et conditionnement d’air: Détection d’anomalies et diagnostic à l’aide d’une méthode assurée par une «Support Vector Machine». Int. J. Refrig. 2007, 30, 1104–1114. [Google Scholar] [CrossRef] [Scilit]
- Lai, G.; Chang, W.-C.; Yang, Y.; Liu, H. Modeling Long- and Short-Term Temporal Patterns with Deep Neural Networks. In Proceedings of the 41st International ACM SIGIR Conference on Research and Development in Information Retrieval (SIGIR), Ann Arbor, MI, USA, 8–12 July 2018; pp. 95–104. [Google Scholar]
- Sajjadi, H.; Abdi, S.; Hadizadeh, M.; Astaraki, M.; Mosavi, A. Fault Detection of Cyber-Physical Systems Using a Transfer Learning Method Based on Pre-Trained Transformers. Sensors 2025, 25, 4164. [Google Scholar] [CrossRef] [Scilit] [PubMed]
- Drgoňa, J.; Arroyo, J.; Cupeiro Figueroa, I.; Blum, D.; Arendt, K.; Kim, D.; Perarnau Ollé, E.; Oravec, J.; Wetter, M.; Vrabie, D.L.; et al. All You Need to Know about Model Predictive Control for Buildings. Annu. Rev. Control 2020, 50, 190–232. [Google Scholar] [CrossRef] [Scilit]
- Mustafaraj, G.; Lowry, G.; Chen, J. Prediction of Room Temperature and Relative Humidity by Autoregressive Linear and Nonlinear Neural Network Models for an Open Office. Energy Build. 2011, 43, 1452–1460. [Google Scholar] [CrossRef] [Scilit]
- Céspedes-Cubides, A.S.; Jradi, M. A Review of Building Digital Twins to Improve Energy Efficiency in the Building Operational Stage. Energy Inform. 2024, 7, 11. [Google Scholar] [CrossRef] [Scilit]
- Rasheed, A.; San, O.; Kvamsdal, T. Digital Twin: Values, Challenges and Enablers from a Modeling Perspective. IEEE Access 2020, 8, 21980–22012. [Google Scholar] [CrossRef] [Scilit]

Disclaimer/Publisher’s Note: The statements, opinions and data contained in all publications are solely those of the individual author(s) and contributor(s) and not of MDPI and/or the editor(s). MDPI and/or the editor(s) disclaim responsibility for any injury to people or property resulting from any ideas, methods, instructions or products referred to in the content. |
© 2026 by the authors. Licensee MDPI, Basel, Switzerland. This article is an open access article distributed under the terms and conditions of the Creative Commons Attribution (CC BY) license.