


Abstract
With the advancement of low-carbon transition and deep load-following operation of coal-fired units, ammonia–coal co-firing is a retrofit-ready option for source decarbonization, but its coupled impacts on combustion and emissions remain to be quantified. A 350 MW corner-tangential pulverized-coal boiler at a 30% rated load was investigated using a three-dimensional ANSYS Fluent CFD model. Thirteen cases were designed by combining five ammonia shares (0–40%) with three injection locations (B, C, D). The temperature and key species fields were analyzed to track the reaction-zone shifts, and the outlet CO2, SO2, NO, and NH3 were evaluated. Increasing ammonia reduced and contracted the high-temperature core, dispersed the flame, extended the ignition distance of the ammonia-laden primary jet, and shifted heat release downstream. CO2 and SO2 decreased with an ammonia substitution; at 40% co-firing, CO2 fell by about 43% and SO2 declined markedly. NO showed a nonlinear, location-dependent response: B and C injection may raise NO at low ratios, but reduce it at higher ratios under lower temperatures and stronger reduction, whereas D injection tends to maintain higher NO in the upper furnace. The findings guide coordinated selection of the co-firing ratio and injection location for low-load retrofits.
1. Introduction
With the intensification of the greenhouse effect, climate change has become one of the major challenges confronting humanity, in which CO2 is a principal greenhouse gas [1]. As a major energy-consuming country, China has set the dual-carbon goals of achieving a carbon peak by 2030 and carbon neutrality by 2060 [2]. Although China is actively expanding renewable energy, challenges remain in terms of grid stability and supply reliability [3]. Owing to its low cost and abundant reserves, coal still plays a dominant role in China’s energy supply and is unlikely to be replaced in the near term. As a carbon-free, hydrogen-rich energy carrier, ammonia co-firing in coal-fired boilers offers a rapid and practical option for decarbonization [4]. Therefore, ammonia–coal co-firing is of considerable significance for reducing carbon emissions from coal-fired power plants and represents a promising route toward achieving dual-carbon targets.
Owing to its carbon-free and hydrogen-rich nature, as well as its relatively low-cost liquefaction and mature storage and transport infrastructure, ammonia has become an important development pathway for reducing carbon emissions in coal-fired power plants [5,6]. However, the use of NH3 as a fuel still faces challenges such as poor combustion characteristics, a low heating value, and a high auto-ignition temperature [7,8]. Ammonia–coal co-firing in coal-fired boilers provides a high-temperature environment that can enhance combustion stability, while ammonia substitution simultaneously reduces CO2 emissions. Consequently, the application of ammonia–coal co-firing in coal-fired boilers has attracted extensive attention [9]. Nevertheless, because NH3 contains fuel-bound nitrogen, ammonia–coal co-firing may lead to elevated NOx emissions. Ammonia–coal co-firing is still at a developmental stage, and further in-depth research is required prior to large-scale deployment in coal-fired power plants. The co-firing mechanism of NH3 involves both gas-phase reactions and heterogeneous interactions with carbonaceous species, which can promote the release of coal volatiles and facilitate char fragmentation, thereby improving the combustion efficiency [10,11]. In recent years, many studies have investigated how various factors influence the combustion characteristics and NOx emissions of ammonia–coal co-firing. The ammonia co-firing ratio is a key parameter. It has been reported that, when the co-firing ratio is below 30%, injecting ammonia into the main combustion zone results in lower NO formation, whereas when the ratio exceeds 30%, injection from the burnout zone leads to a lower outlet NO concentration [12]. Ruan et al. [13] examined the effects of the ammonia blending ratio, gasifier temperature, combustor temperature, and air distribution strategy on fine particulate formation during ammonia–coal co-firing, and found that regulating the ammonia fraction, temperature levels, and air staging can significantly suppress fine particulate generation. Lin et al. [4] retrofitted a 300 MW coal-fired boiler and observed that, compared with pure coal firing, variations in the boiler oxygen level led to pronounced changes in NOx at the furnace outlet. Under fuel-rich operating conditions, an intensified high-temperature reduction in the furnace can occur, resulting in NOx emissions lower than those under pure coal firing. The excess-air ratio directly affects the temperature and oxygen concentration in the reaction zones, thereby shaping the competing oxidation and reduction pathways; however, a higher excess-air ratio is not necessarily beneficial [14]. Meanwhile, air-staging strategies can also effectively reduce NO emissions: as the burnout-air injection location is moved farther downstream from the burner exit, the NO level tends to decrease. However, the separation distance should not be excessively large, as an overly delayed burnout-air addition may adversely affect the combustion efficiency [15]. Staged combustion can mitigate both char-derived NOx and fuel-NOx originating from NH3, thereby playing a critical role in NOx reduction [16].
Numerical simulations enable system design optimization and improvements in combustion efficiency and operational safety, thereby providing reliable guidance for the development and retrofit of coal-fired boilers [17]. Zhang et al. [18] conducted three-dimensional simulations of ammonia–coal co-firing in an 8.5 MW boiler and reported that, as the co-firing ratio increased from 0% to 80%, the furnace temperature, wall heat flux, and CO2 emissions all decreased, while the outlet NO concentration first increased and then decreased. Wang et al. [19] numerically investigated the effects of the ammonia-blending ratio and injection location in a 135 MW coal-fired boiler, and found that increasing the ammonia fraction led to a decrease in the boiler temperature, with NO emissions exhibiting an “increase-then-decrease” trend. In addition, optimizing the ammonia injection scheme and the air distribution can effectively reduce NO emissions. Liu et al. [20] performed numerical simulations of NOx formation under different injection strategies in a 1000 MW utility boiler, showing that a relatively high ammonia co-firing ratio is required to reduce NO when ammonia is injected uniformly through the burners. Moreover, ammonia co-firing may lower the mean gas temperature in the furnace, causing NH3 oxidation to dominate over the reduction of NO by NH3, thereby increasing NO emissions [21]. Wei et al. [22] found that adding ammonia results in higher H2O formation; its evaporation absorbs heat and lowers the flue-gas temperature, which can in turn undermine the combustion stability. Furthermore, Chae et al. [23] investigated the influence of ammonia injection methods on combustion and NOx emissions and concluded that injection through the burners is the most favorable approach. Although progress has been made through laboratory experiments, pilot-scale studies, and numerical simulations, further research is still needed to clarify the combustion characteristics and NOx implications of ammonia–coal co-firing in coal-fired boilers.
In this study, numerical simulations were conducted to investigate ammonia–coal co-firing in a 350 MW coal-fired boiler. The main contribution of this work is a systematic assessment of how the ammonia co-firing ratio and injection location affect the combustion characteristics and NOx emissions in a corner-tangentially fired boiler under low-load operation, with the aim of providing a reliable theoretical basis for boiler retrofit and engineering decision-making.
2. Model Establishment
2.1. Research Subject
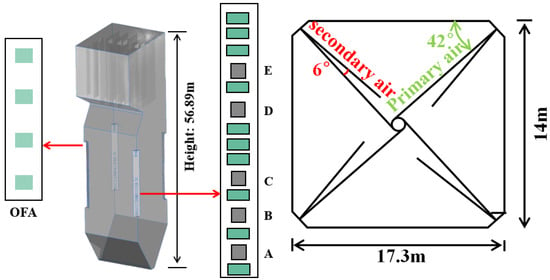
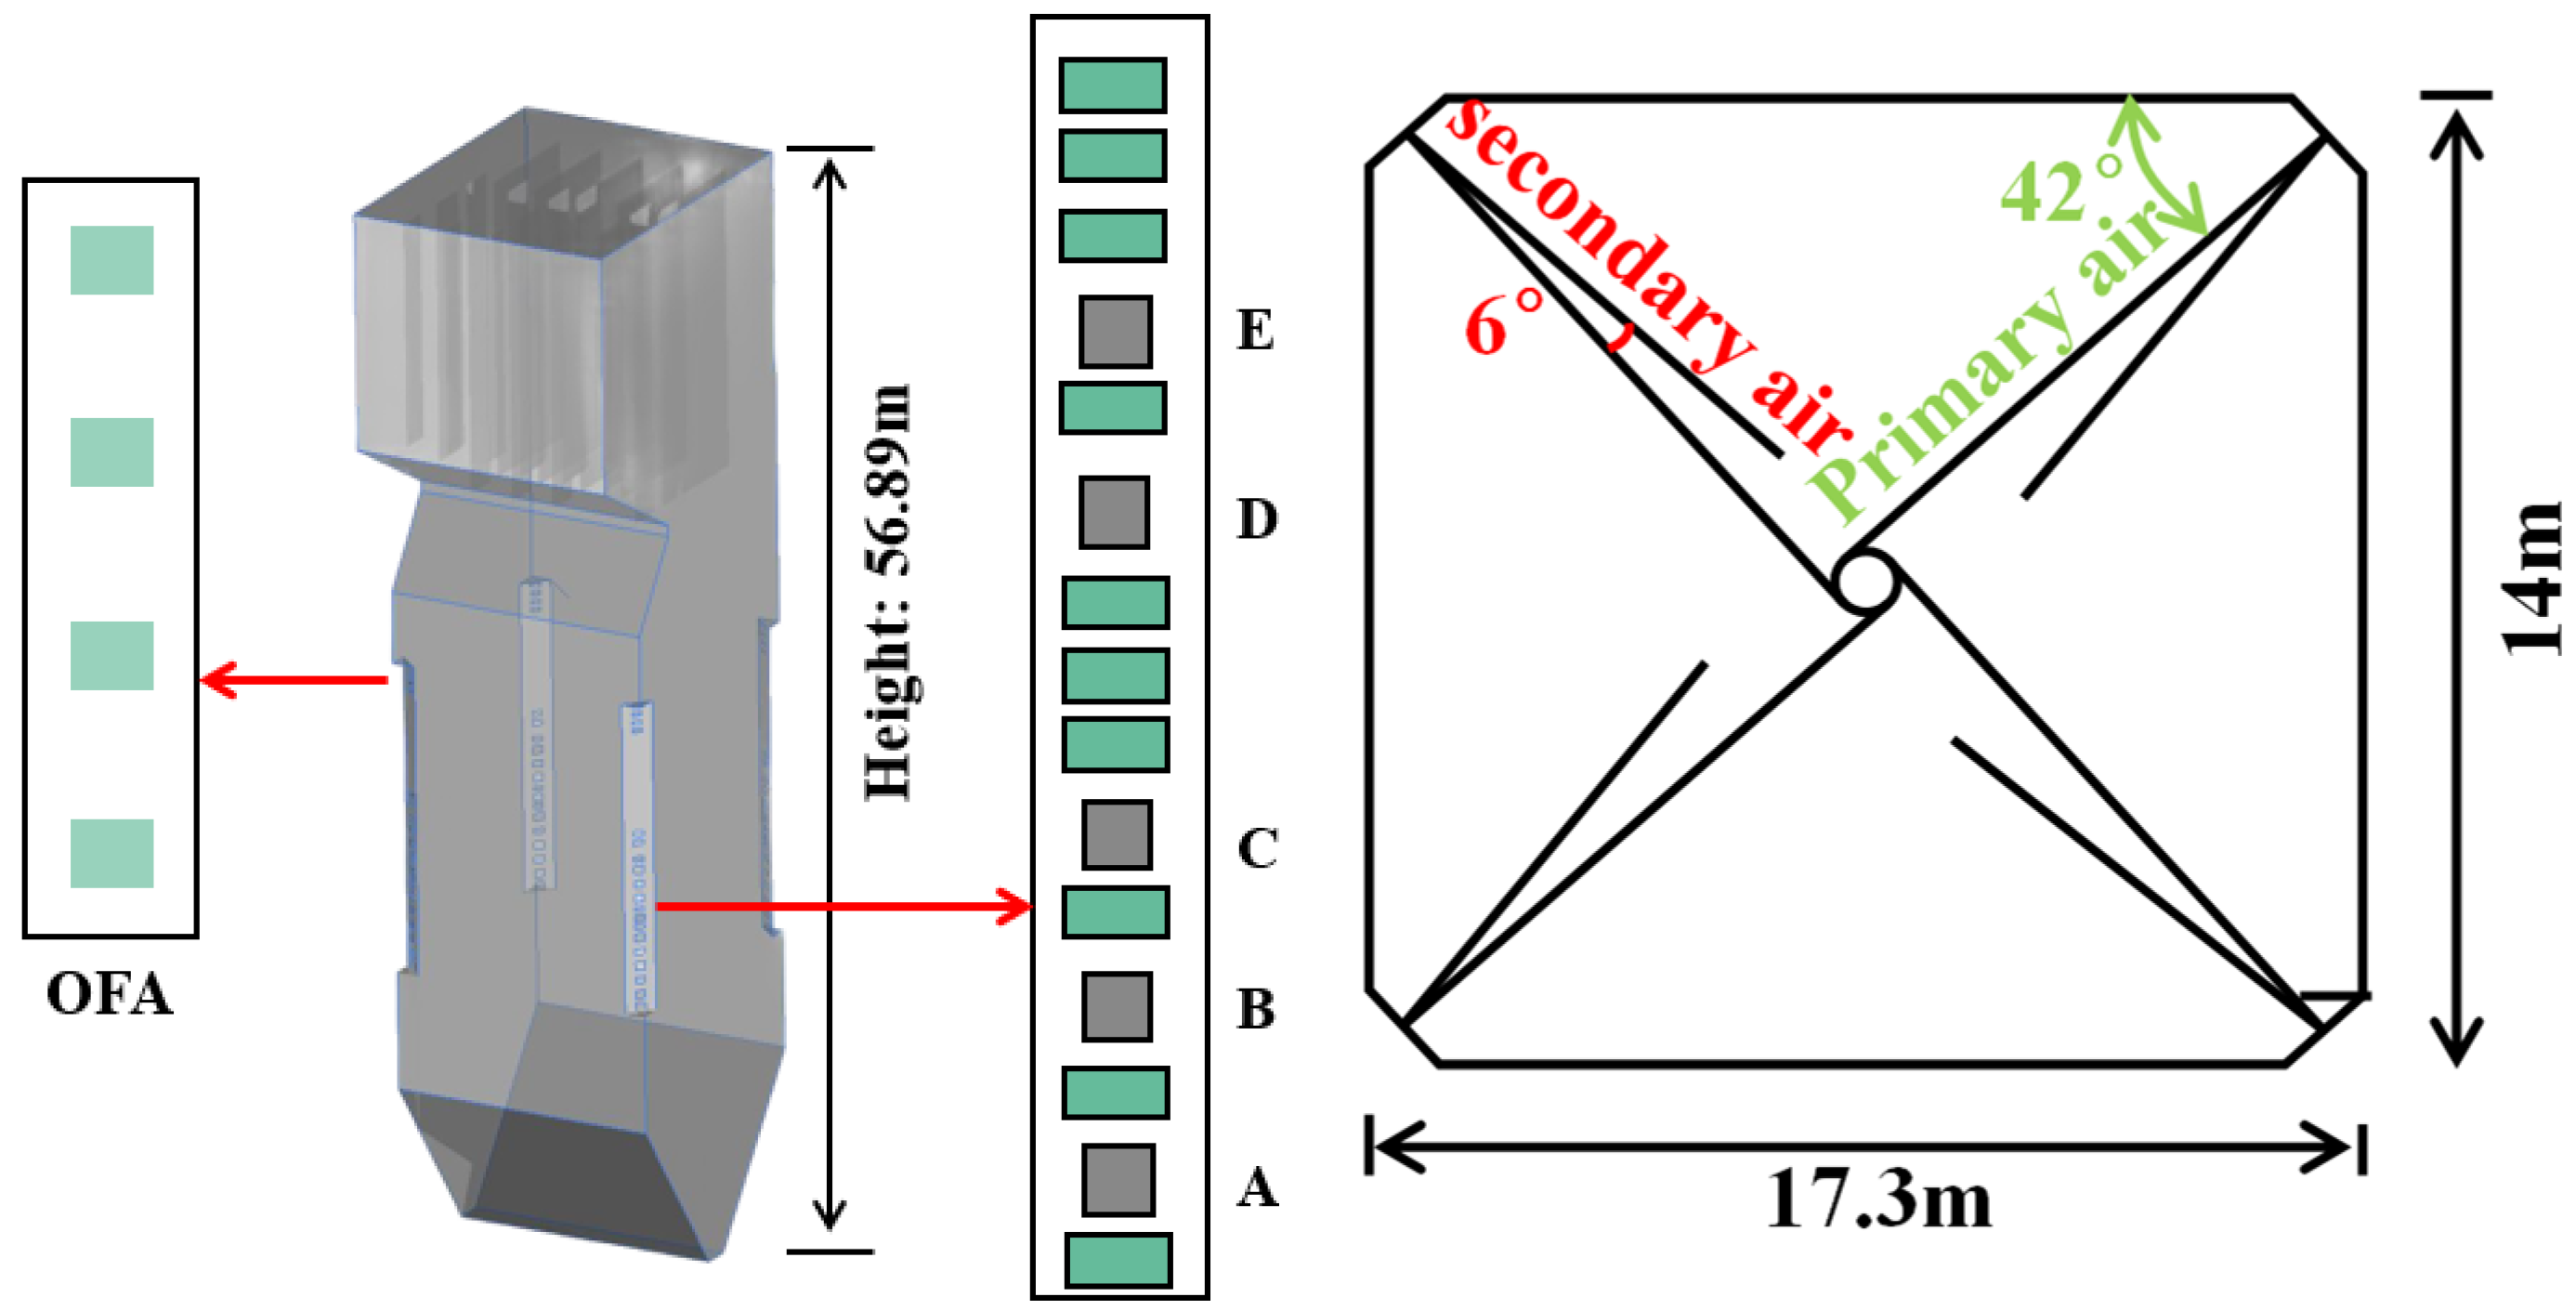
This study focused on a 350 MW coal-fired boiler at a power plant. The boiler was equipped with a corner-tangential firing system. The boiler dimensions were 56.89 m × 17.32 m × 14.05 m. The basic configuration of the boiler is illustrated in Figure 1.
Figure 1.
Physical model of the boiler furnace and the arrangement of primary air, secondary air, and overfire air (OFA).
The boiler was equipped with five burner levels. Under the present 30% load condition, only the B, C, and D burner levels were in operation, whereas the remaining burner levels were shut down. Ammonia was introduced separately at the selected B-, C-, or D-level primary-air stream, corresponding to the active burner elevation in each case. The primary-air (PA) and secondary-air (SA) nozzles were arranged alternately at the furnace corners. In addition, four levels of overfire air (OFA) were installed above the main combustion zone for staged combustion. The green section on the right indicates the secondary air location; the green section on the left indicates the burnout air location; and the gray section indicates the primary air location.
Table 1 summarizes the fuel properties of the as-fired blended coal used in the boiler. The firing fuel was a blended coal prepared by mixing low-grade coal, Chifeng coal, and Zaha coal in different proportions. The coal particle size followed a Rosin–Rammler distribution, with a minimum diameter of 10 μm, a maximum diameter of 200 μm, and a mean diameter of 60 μm. The Rosin–Rammler distribution is expressed as:
where R(d) denotes the mass fraction of particles with a diameter larger than d, d is the particle diameter, is the characteristic diameter, and n is the spread parameter.
Table 1.
Fuel properties.
In this context, the meanings of the respective symbols are as follows: M, moisture; A, ash; V, volatile matter; FC, fixed carbon; C, carbon; H, hydrogen; O, oxygen; N, nitrogen; S, sulfur; ar, as-received basis. The lower heating value (LHV) of NH3 is 18.6 MJ/kg.
2.2. Modeling Methodology
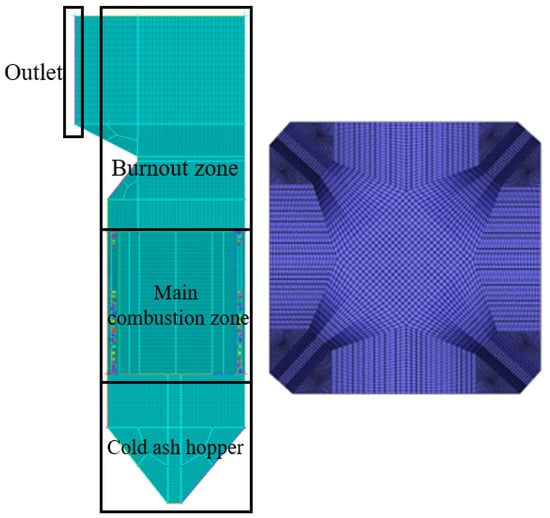
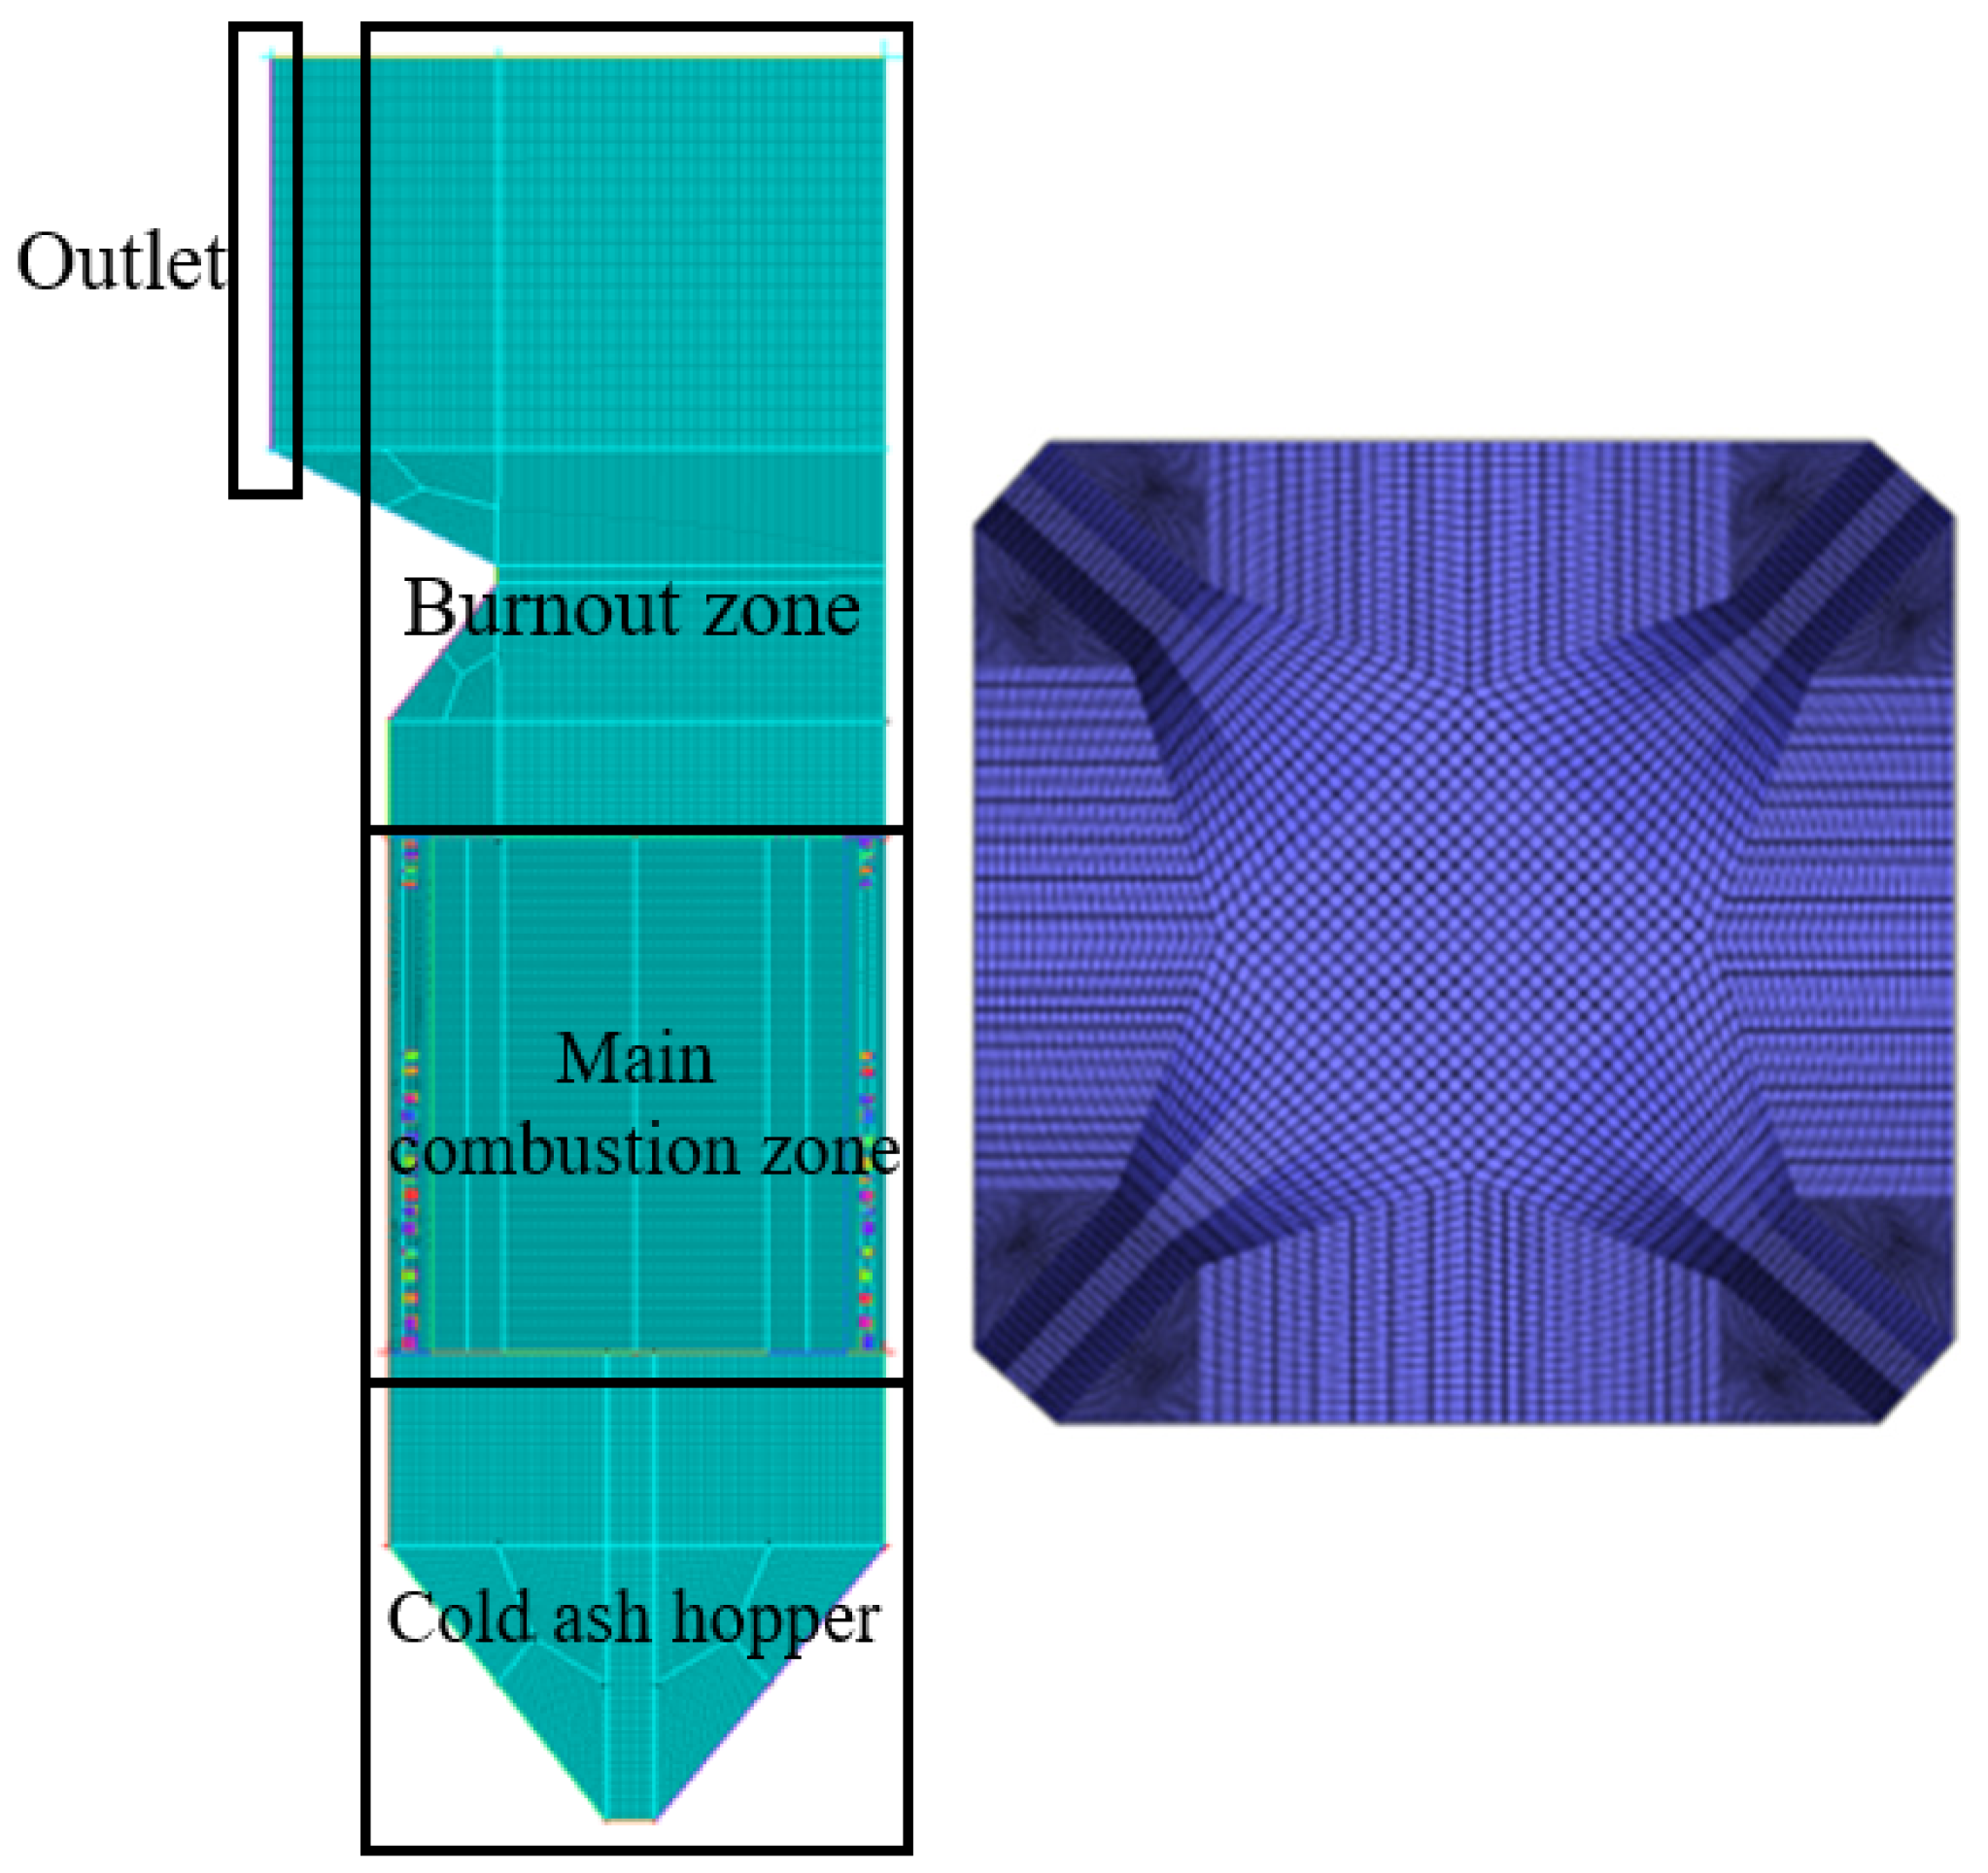
In this work, ANSYS Fluent 2022R1 was employed to perform numerical simulations of the ammonia–coal co-firing process. The boiler mesh was generated using ICEM CFD, as shown in Figure 2.
Figure 2.
Computational mesh of the furnace and cross-sectional mesh views at the burner ports.
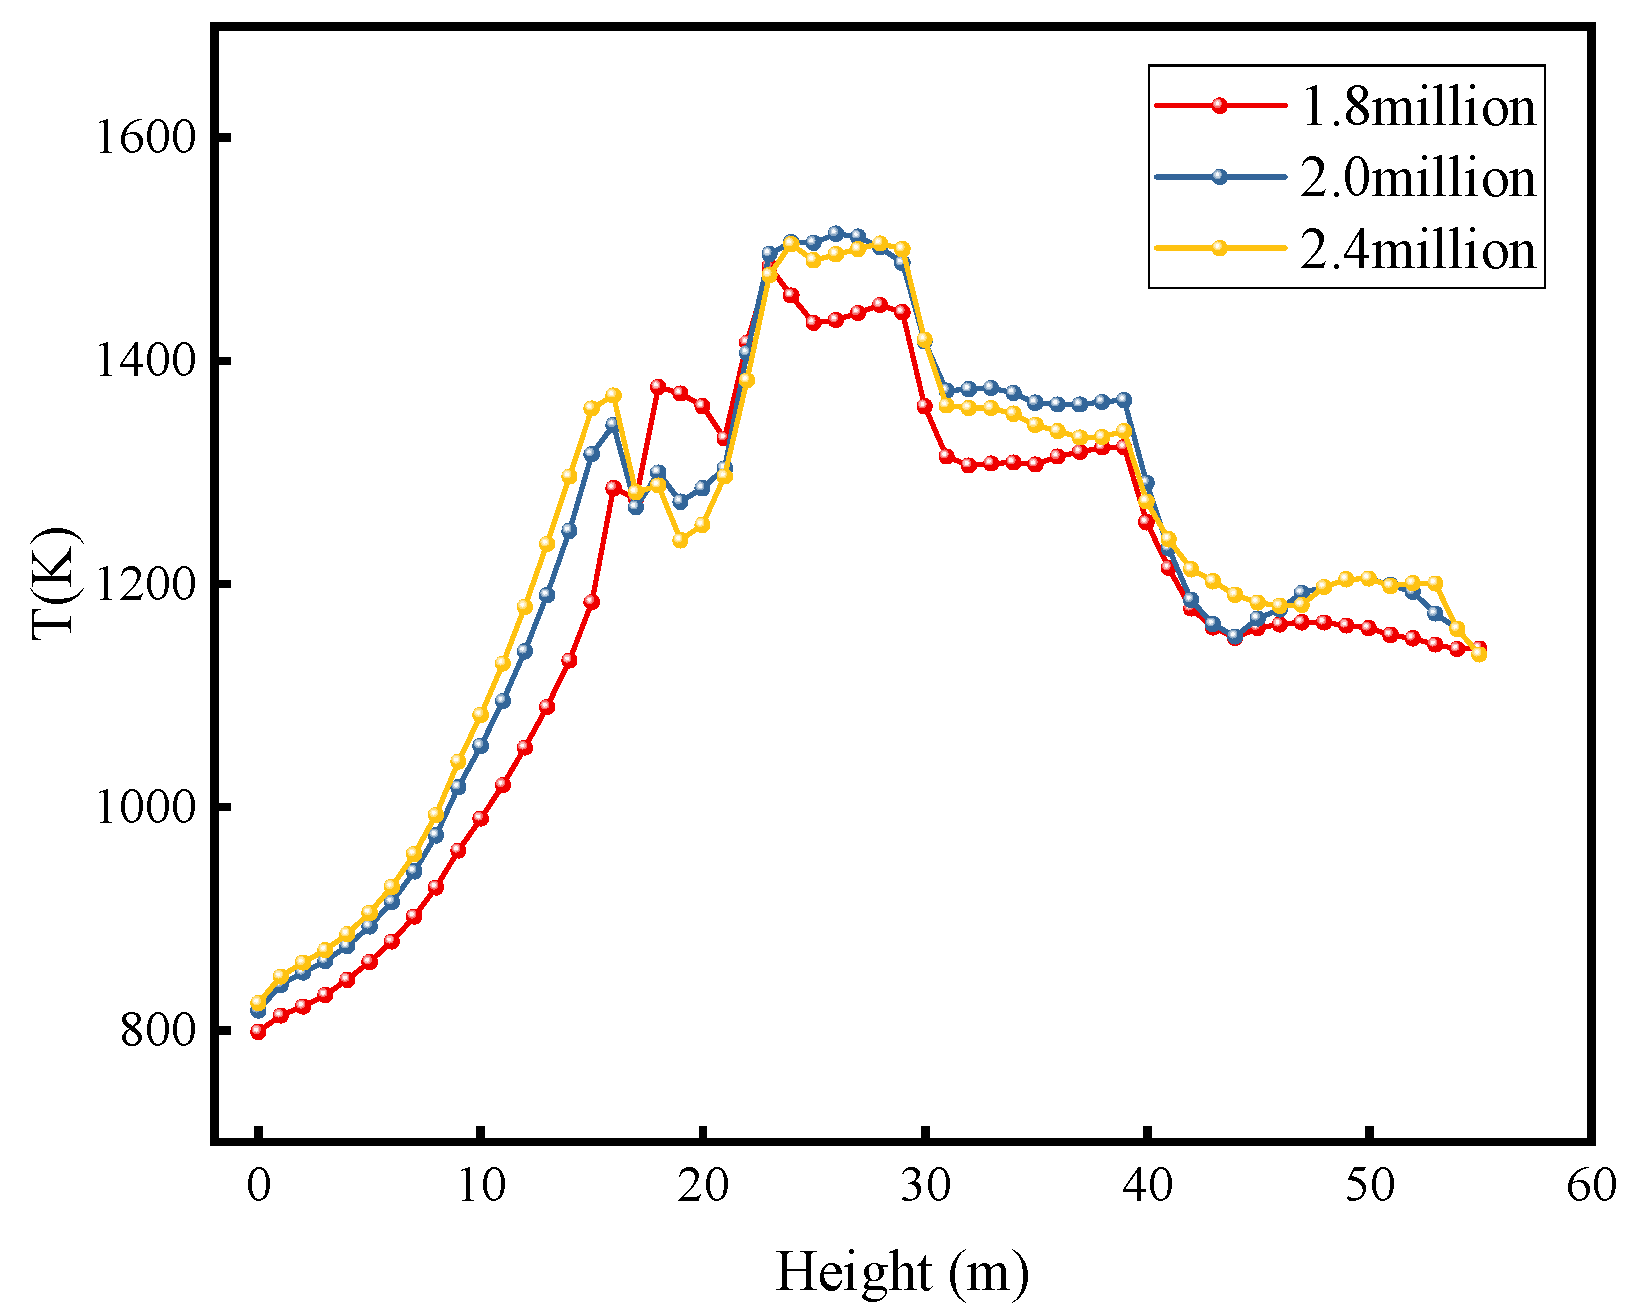
A locally refined mesh was applied in the burner-nozzle region, and the angle between grid lines and the main flow direction was minimized to reduce numerical (false) diffusion. The mesh sensitivity was assessed by comparing the cross-section area-weighted mean gas temperature along the furnace height for several mesh systems, as shown in Figure 3. The differences between the two finer meshes were small, indicating that the main thermal-field prediction was not sensitive to further mesh refinement. Considering both the computational cost and the solution accuracy, the final mesh with 2,027,788 cells was adopted for the subsequent simulations.
Figure 3.
Grid-independence verification.
Model selection: The simulations were performed under a steady-state Reynolds-averaged Navier–Stokes (RANS) framework. The continuous gas phase was solved by the conservation equations of mass, momentum, energy, and chemical species. The standard k–ε turbulence model was adopted together with standard wall functions (SWFs). Radiative heat transfer was modeled using the P1 radiation model. Chemical reactions were described via the species transport approach. Volatile devolatilization was modeled by the two-competing-rates model, with the volatiles assumed to be a mixture of CmHn, CO, CO2, H2, and HCN. Coal particles were tracked using a Lagrangian discrete phase model (DPM). Particle motion was treated with the stochastic tracking (random-walk) model and was coupled with the gas phase. Char combustion was simulated using the multiple surface reaction model, which allows both oxidation and reduction reactions of char to be specified. Gas-phase non-premixed combustion reactions were modeled using the finite-rate/eddy-dissipation (FR/ED) model. Compared with the eddy-dissipation model alone, the FR/ED approach accounted for the interplay between turbulence and chemical kinetics. It evaluated the turbulence-mixing (dissipation) rate, the Arrhenius kinetic rate, and the resulting reaction rate, and then used the minimum of these rates to determine the reaction rate. This treatment is more appropriate for reactions with relatively slow kinetics, such as NO conversion. The term cross-section area-weighted mean refers to the average value of a scalar over each furnace cross-section at a given height. The term mass-weighted mean refers to the outlet average weighted by the local mass flux across the outlet section.
In previous studies, post-processing approaches have often been used to estimate NO formation [22,24]. However, because ammonia acts not only as a fuel, but also as a reducing agent during combustion, such a post-processing treatment is not well suited for ammonia–coal co-firing. NO conversion is inherently complex. In this work, NO formation and conversion during co-firing were modeled using a multi-step reaction scheme rather than relying on post-processing.
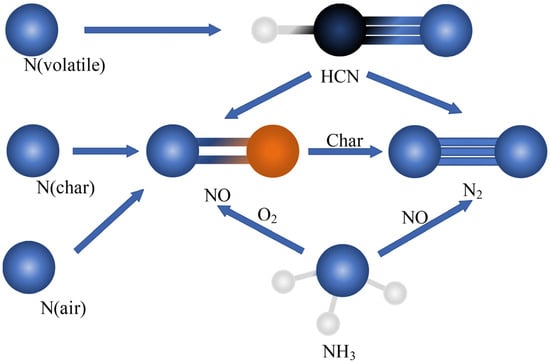
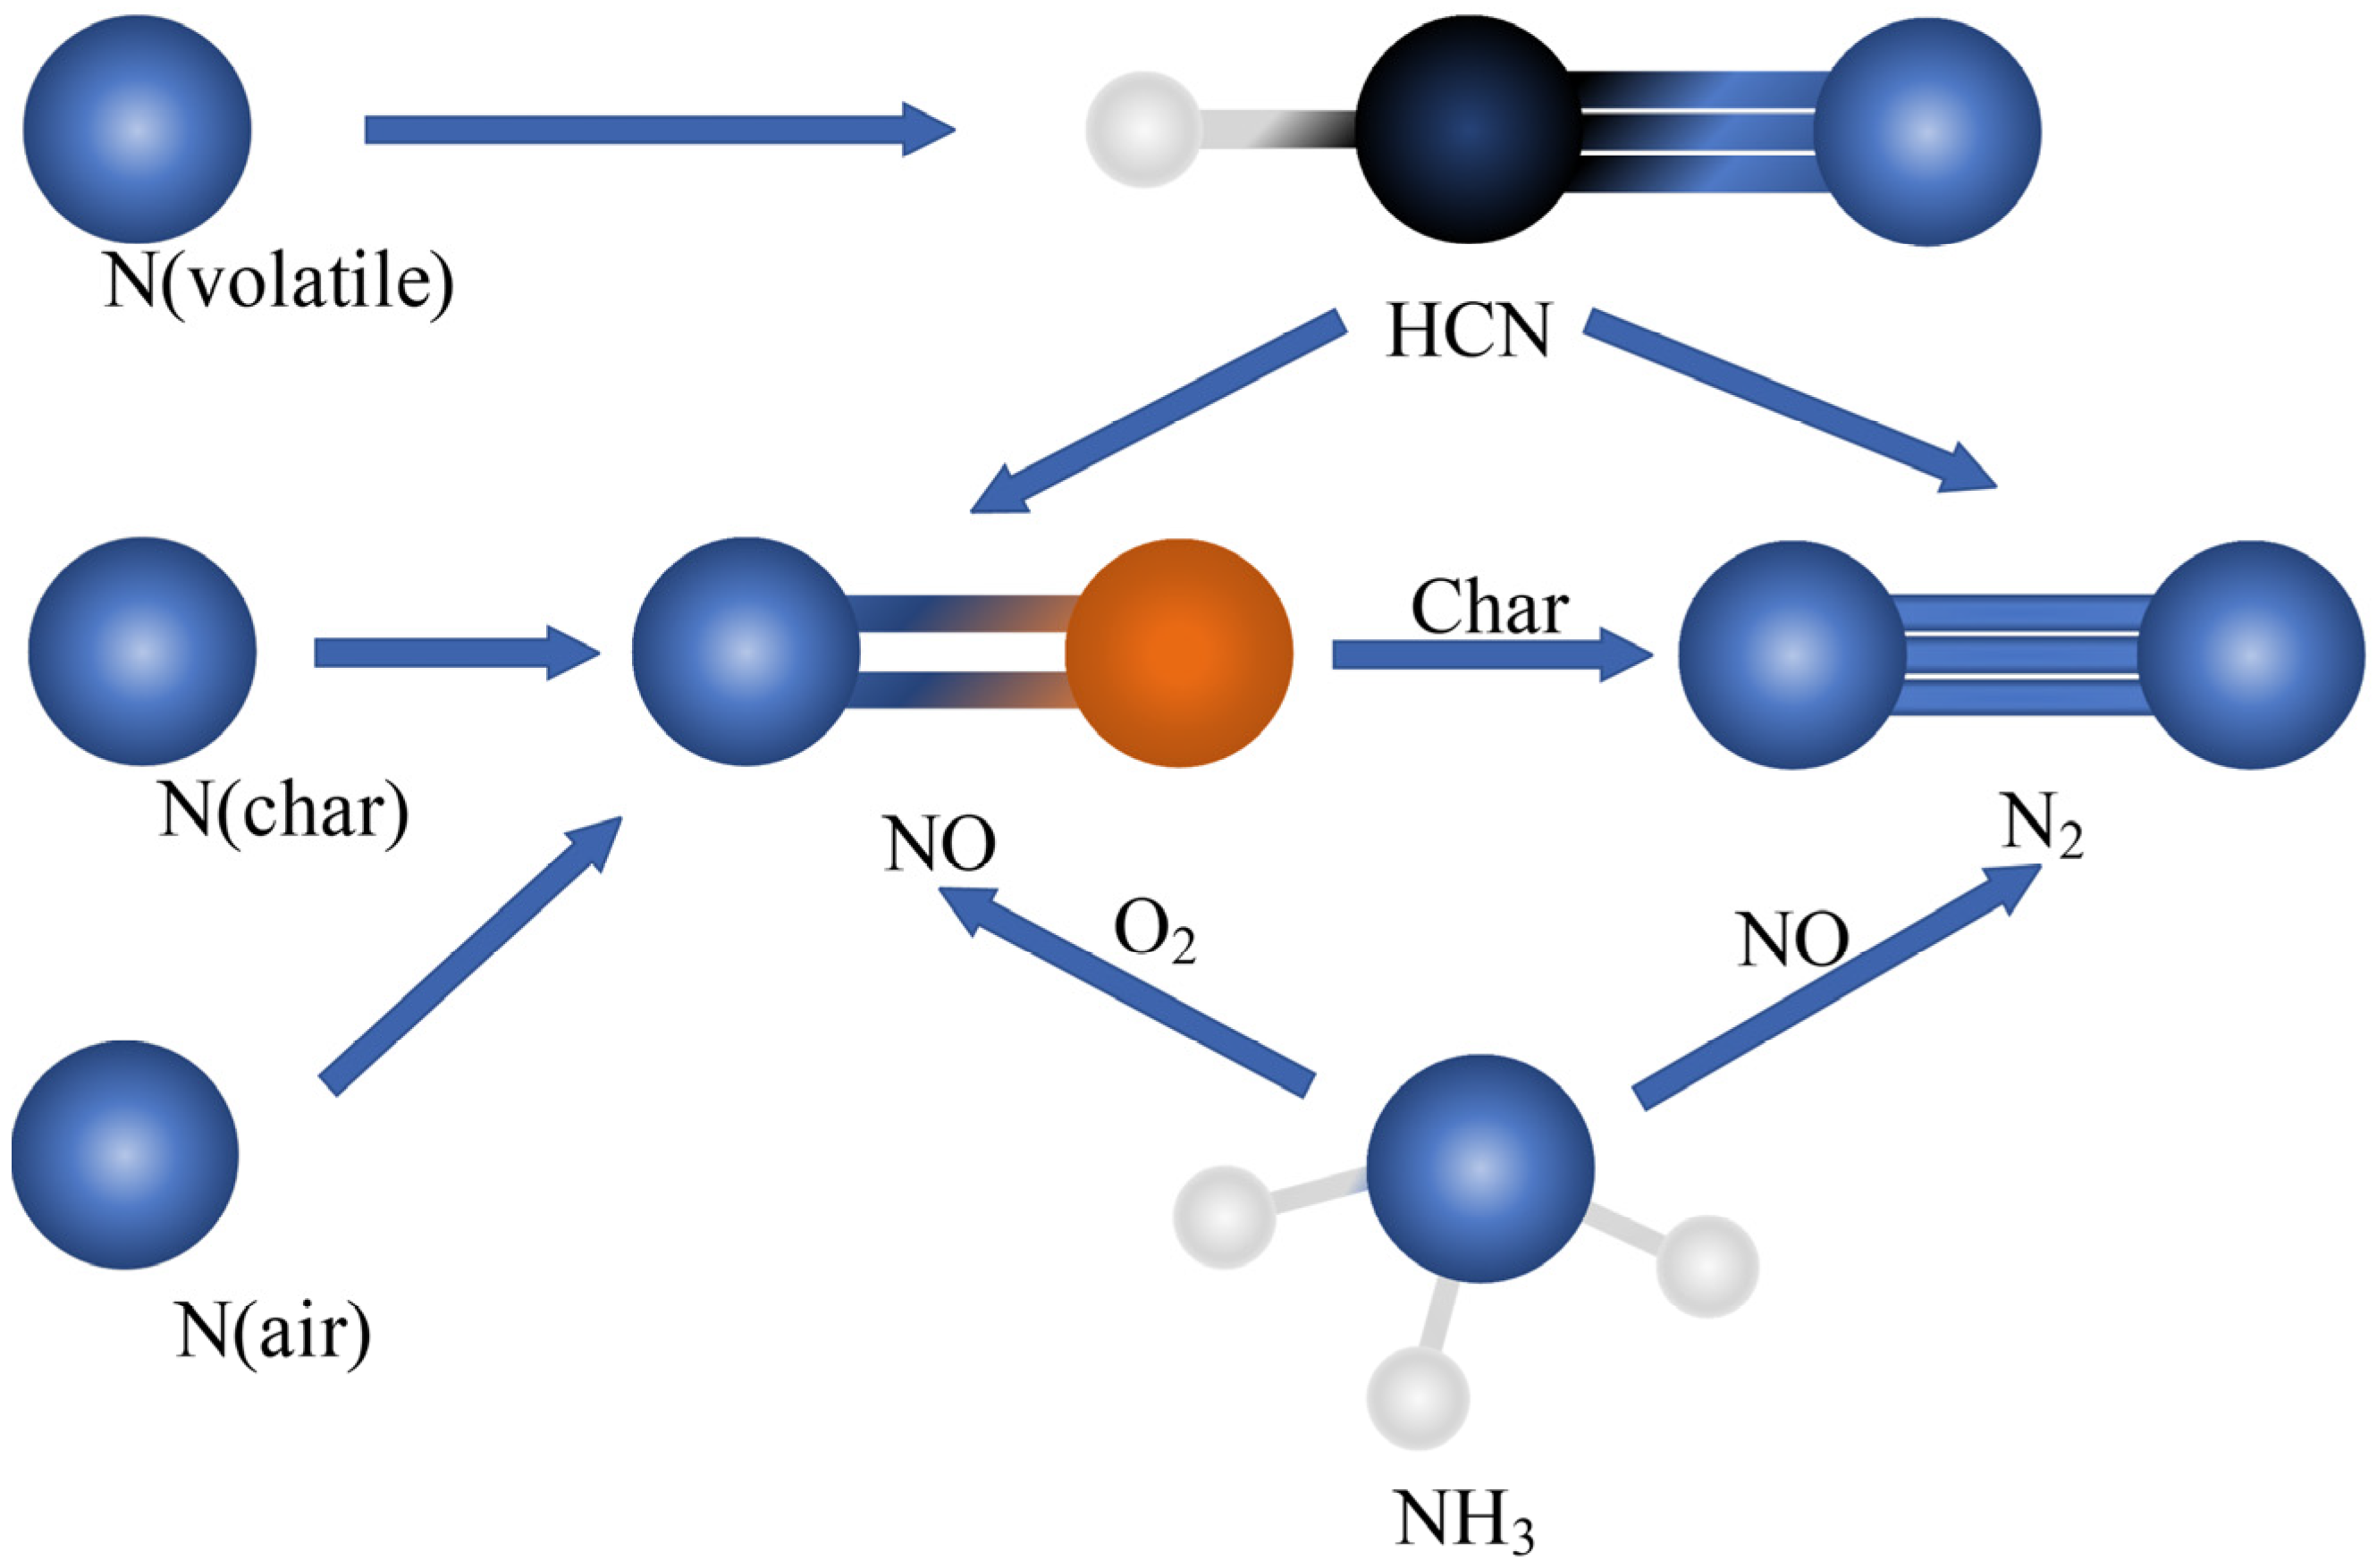
A simplified representation of the mechanism is provided in Figure 4. In the simulations, prompt NO was neglected, and only thermal NO and fuel NO were considered. The reaction set for thermal NO was taken from Ref. [25]. Fuel-bound nitrogen was assumed to originate from two sources: volatile N (N volatile) and char N (N). Nitrogen in the volatiles was assumed to be converted to HCN, and the oxidation reactions of HCN were adopted from Ref. [26]. Char-bound nitrogen was assumed to be oxidized to NO, and the heterogeneous reduction of NO by char was also considered following Ref. [27]. Table 2 and Table 3 list the kinetic parameters for all reactions included in the furnace for ammonia–coal co-firing.
Figure 4.
Schematic of the NOx conversion model [25].
Table 2.
Global mechanism and kinetic parameters.
Table 3.
NOx-related reactions.
2.3. Boundary Conditions
Table 4 lists the air velocities and temperatures in the boiler. Table 5 summarizes the simulation cases, including five ammonia co-firing ratios (0%, 10%, 20%, 30%, and 40%) and three injection locations (B, C, and D). Under low-load operation, coal is supplied only at the B, C, and D levels, and NH3 is also introduced separately at the corresponding B, C, and D levels. The coal feed rate and ammonia flow rate in the table represent the total amounts used for each case. For all cases, the total thermal input of the fuel was kept constant and set equal to that of the pure-coal baseline.
Table 4.
Boiler operating conditions (air velocities and temperatures).
Table 5.
Simulation cases.
2.4. Model Validation
Table 6 compares the simulated and measured gas temperature, O2 volume fraction, NO volume fraction, and CO volume fraction for pure-coal firing. The simulated outlet quantities were extracted at the furnace outlet plane as mass-weighted mean values. The measured data were obtained from on-site tests under stable pure-coal operation at the corresponding outlet flue-gas section. The gas composition data (O2, NO, and CO) were taken from the plant’s online flue-gas monitoring system, and the gas temperature was obtained from the plant instrumentation system/DCS records at the same section.
Table 6.
Comparison between measured and simulated results at the furnace outlet.
3. Results and Discussion
3.1. Combustion Characteristics
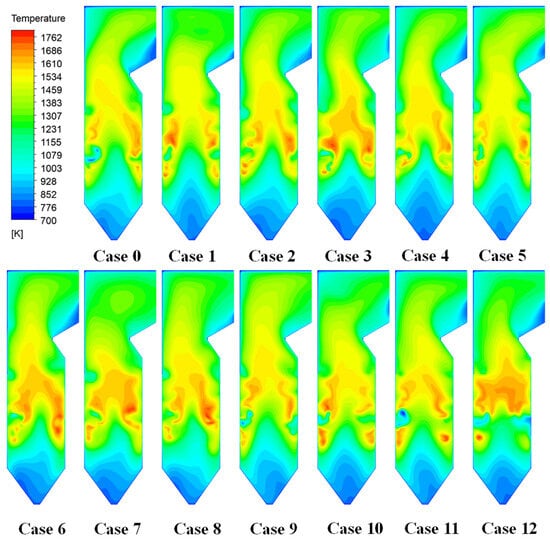
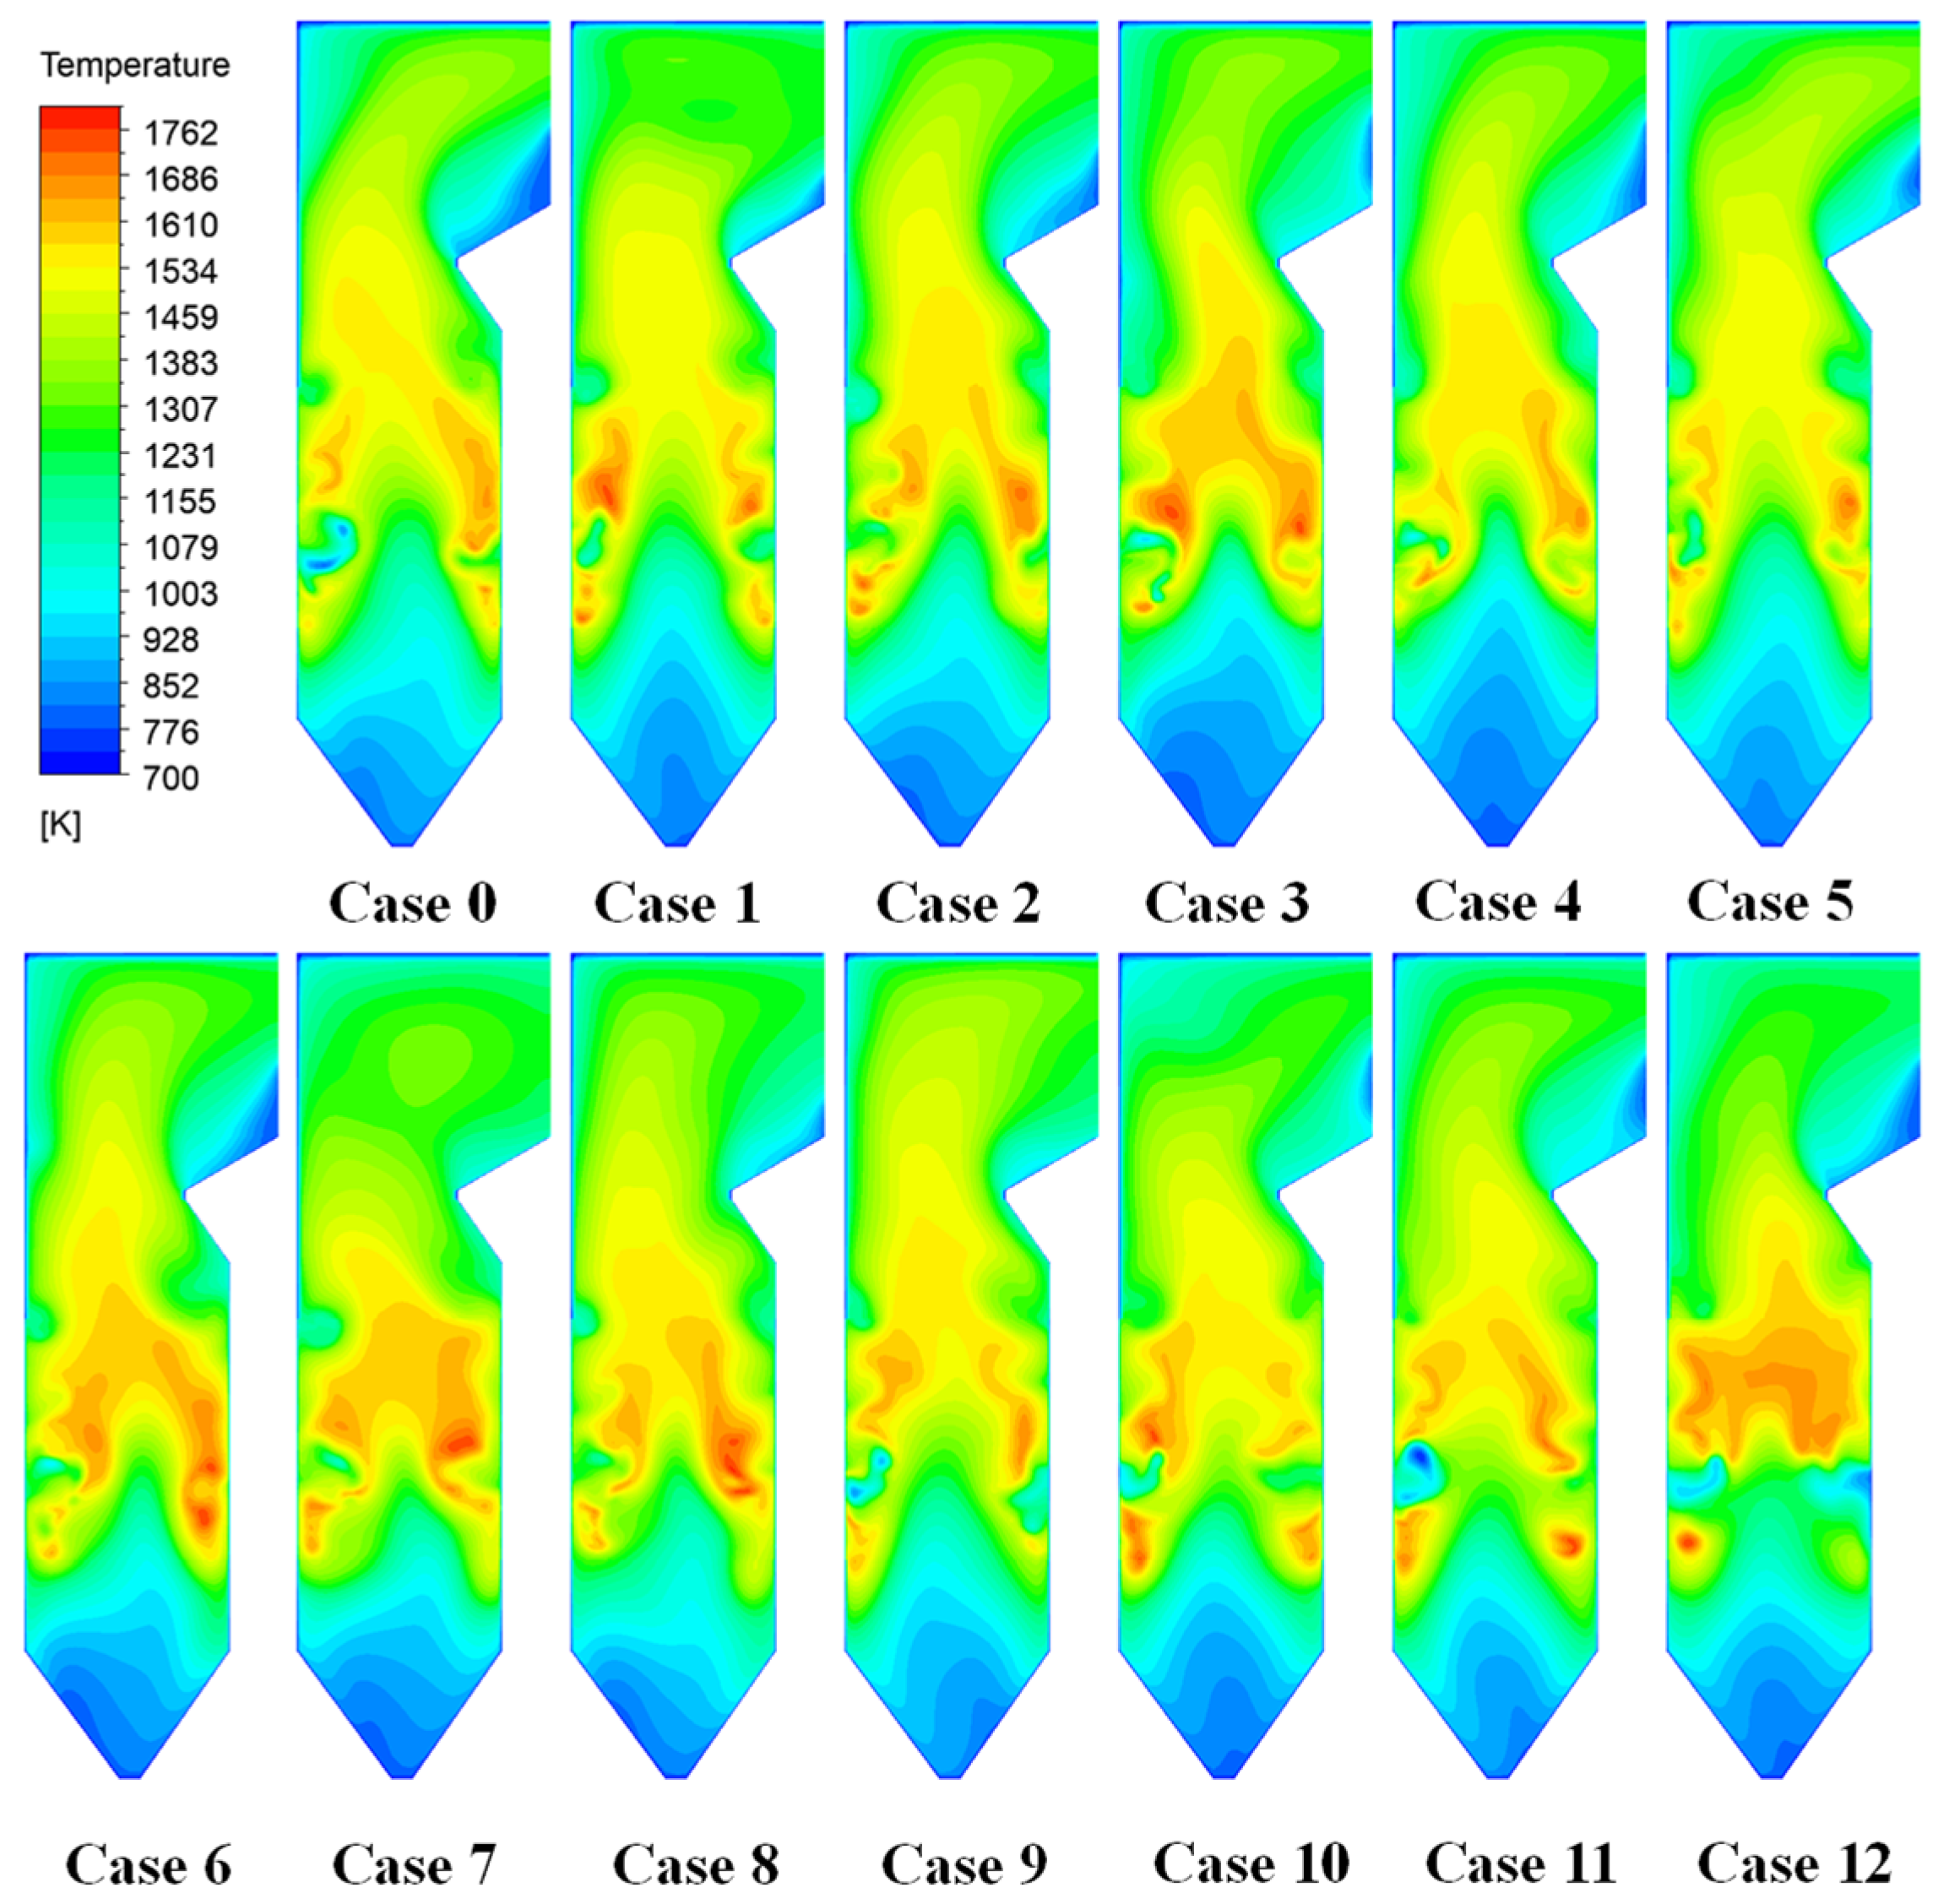
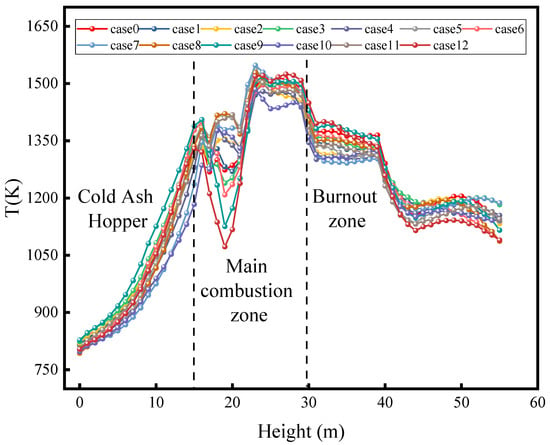
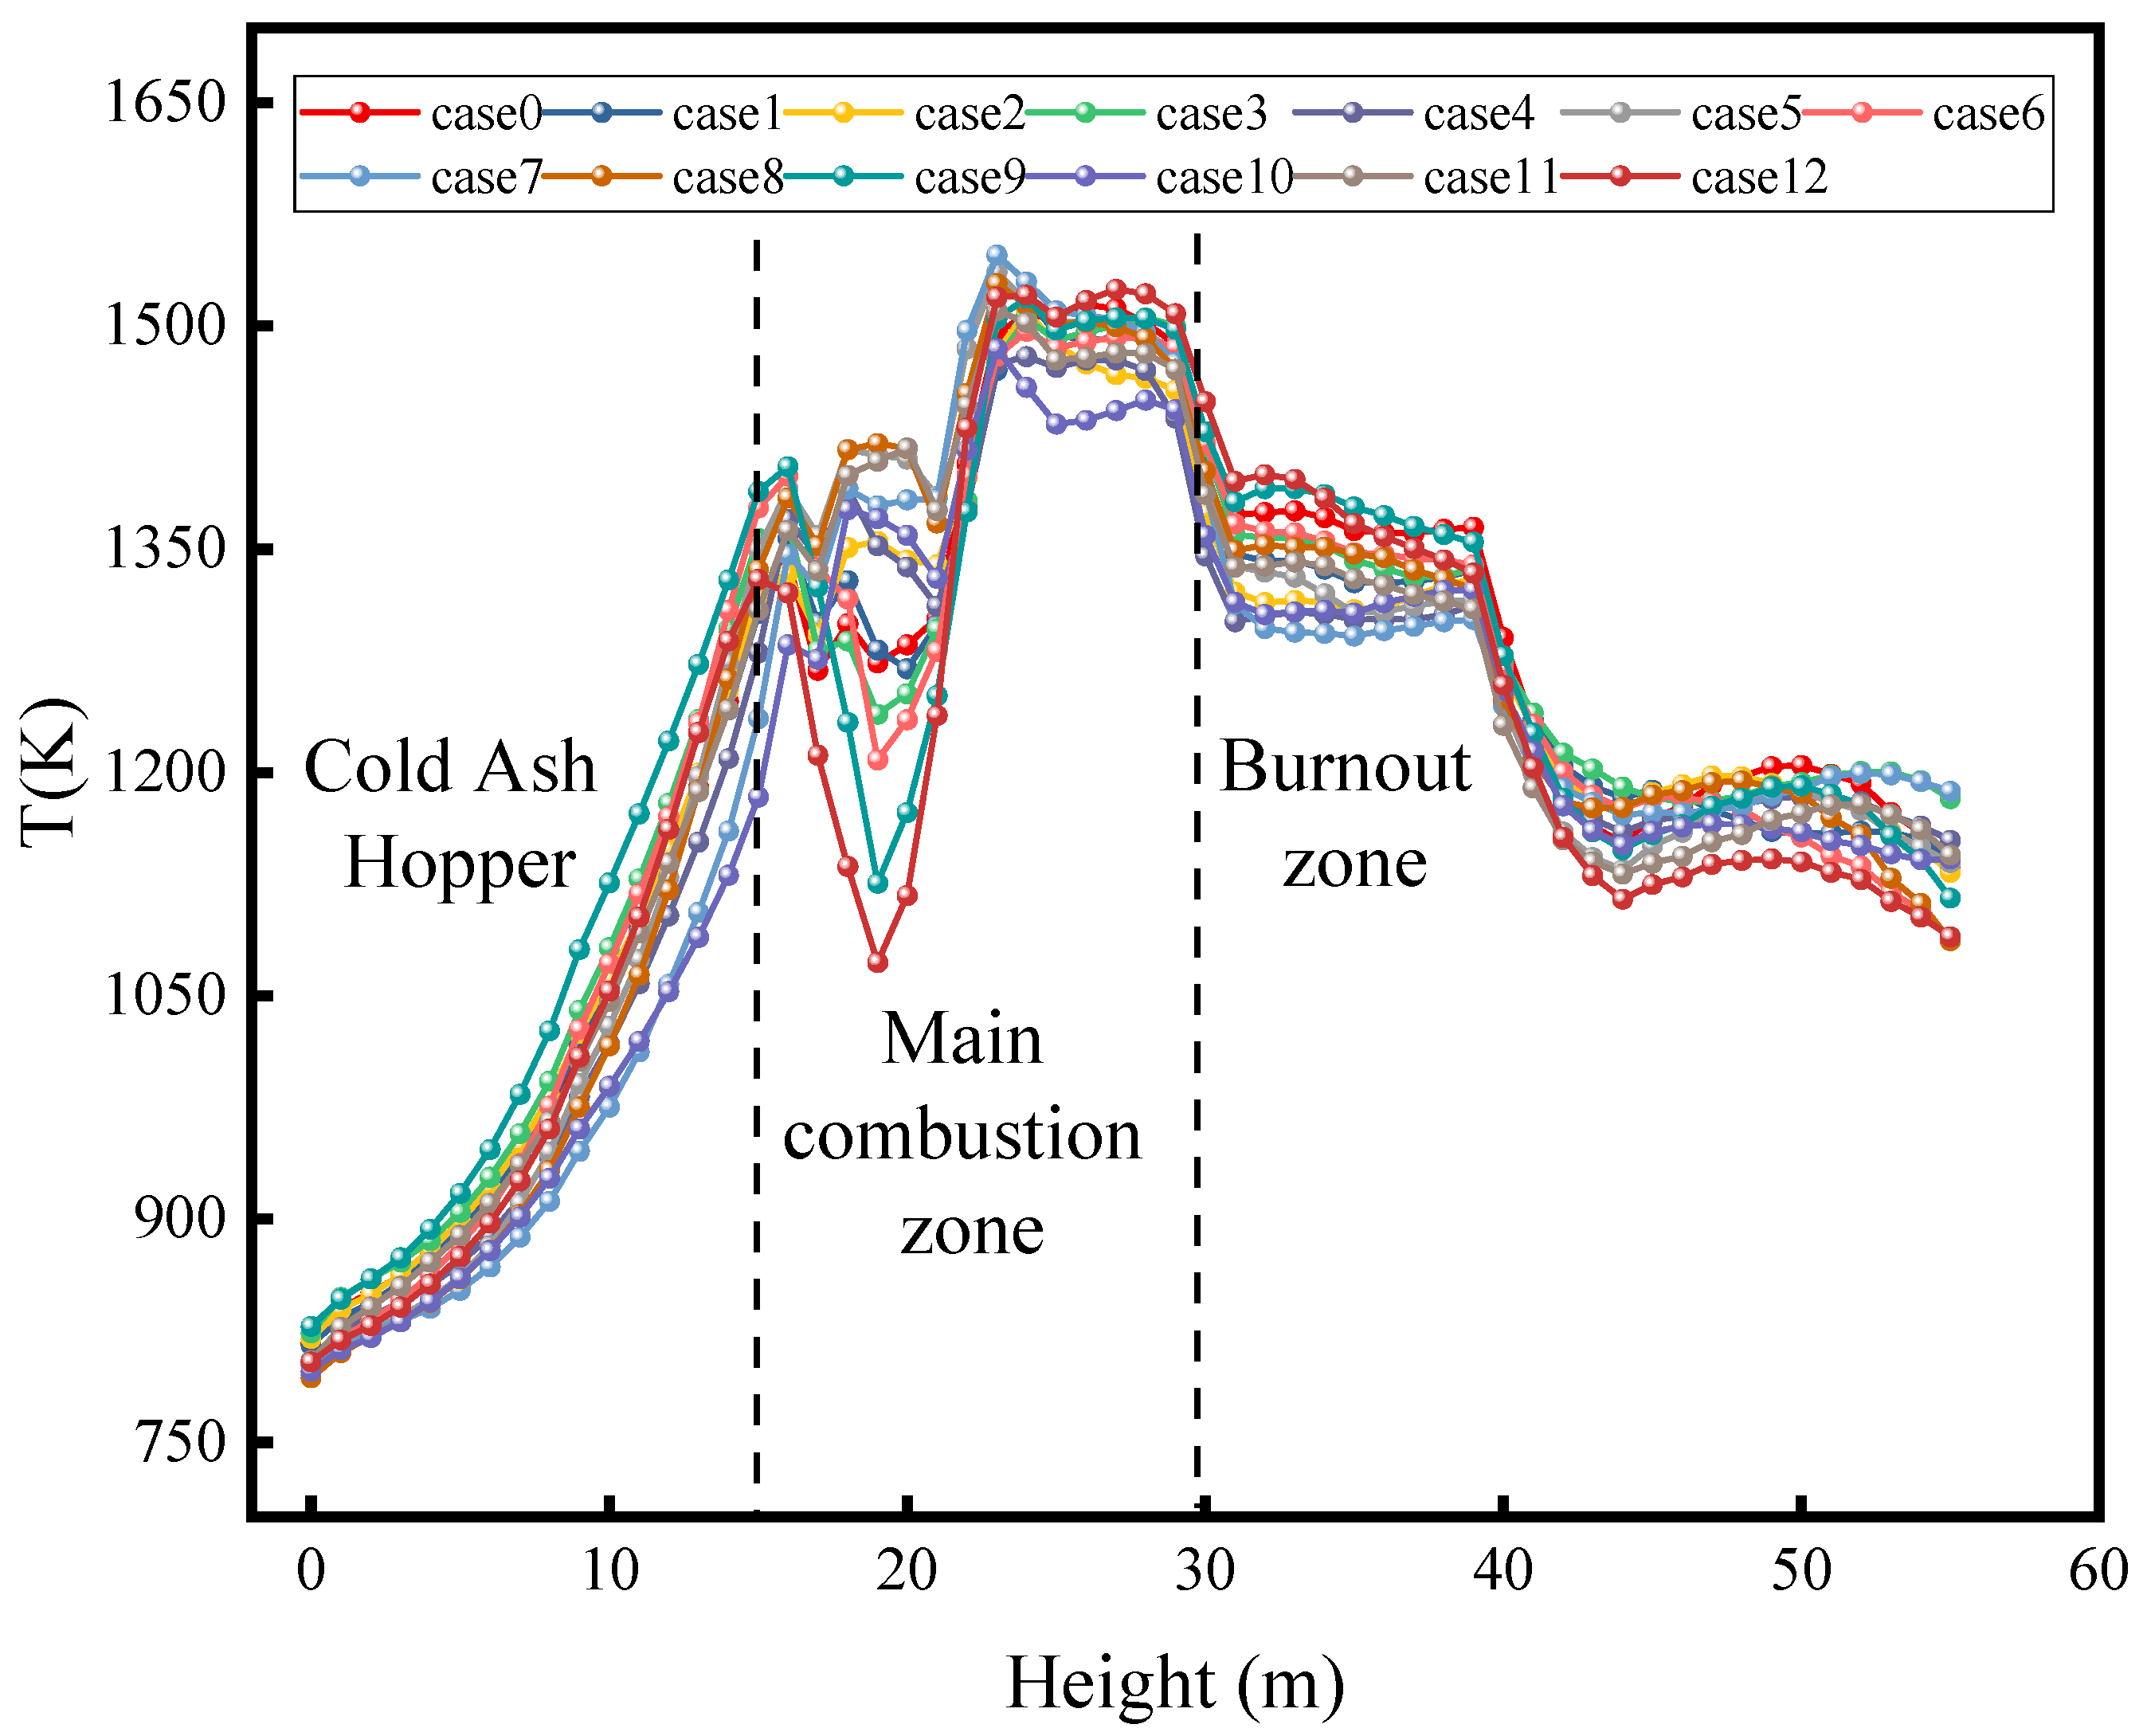
As shown in the cross-sectional contours in Figure 5 and the cross-section area-weighted mean temperature profile along the furnace height in Figure 6, under the pure-coal case (Case 0), the flame temperature was concentrated in the center of the main combustion zone, forming a distinct high-temperature core. In the ammonia co-firing cases, increasing the ammonia fraction markedly reduced the flame temperature in the furnace core and shrunk the extent of the high-temperature region. This behavior was mainly attributed to the lower adiabatic flame temperature of ammonia (about 2100 K) compared with pulverized coal (typically about 2200–2600 K, depending on coal properties and operating conditions), such that an ammonia addition decreases the combustion temperature. High ammonia fractions also alter the flame structure: the high-temperature zone contracts from the furnace center and shifts toward the front and rear water walls, while the flame becomes more dispersed around the burner region. When ammonia is introduced with the primary air, the ammonia-laden jet ignites farther downstream from the burner, and the flue-gas temperature decreases noticeably in the downstream region of the jet. This indicates an intensified ignition delay, which may be detrimental to combustion stability.
Figure 5.
Temperature contours on furnace cross-sections.
Figure 6.
Cross-section area-weighted mean temperature distribution along the furnace height.
Comparing different injection locations, when ammonia is introduced at the lower level (B port), it enters the high-temperature region of the main combustion zone together with pulverized coal and can be ignited rapidly. The flame remains primarily concentrated in the lower furnace, whereas the peak temperature is lower than that in pure-coal firing. With mid-level injection (C port), the high-temperature flame region shifts slightly upward and extends into the middle section of the furnace. Under the upper-level injection case (D port), partial substitution of the lower coal flame by ammonia weakens the initial flame to some extent, while a second combustion hot spot emerges near the furnace tail, corresponding to a secondary ammonia combustion zone. As a result, ammonia injection at the D port produces a dual-flame structure, consisting of a lower coal-dominated flame and an upper ammonia flame. At a 30% load, this two-peak combustion pattern raises the temperature in the furnace tail region, indicating that part of the fuel conversion is delayed to the downstream furnace section.
The differences in temperature fields can be summarized as follows: ammonia co-firing lowers the overall temperature level and drives the flame toward a more dispersed and downstream-shifted pattern. With an increasing ammonia fraction and an upward shift of the injection location, the high-temperature core in the main combustion zone becomes weaker. The temperature contours in Figure 5 further indicate a redistribution of the high-temperature region toward the upper/downstream furnace, particularly for the D-port cases, where a secondary combustion hot spot appears near the furnace tail. In contrast, Figure 6 mainly reflects the overall temperature reduction and the axial variation in the mean temperature.
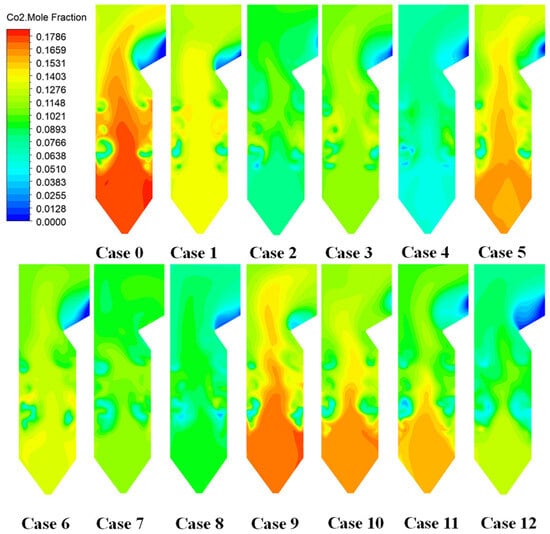
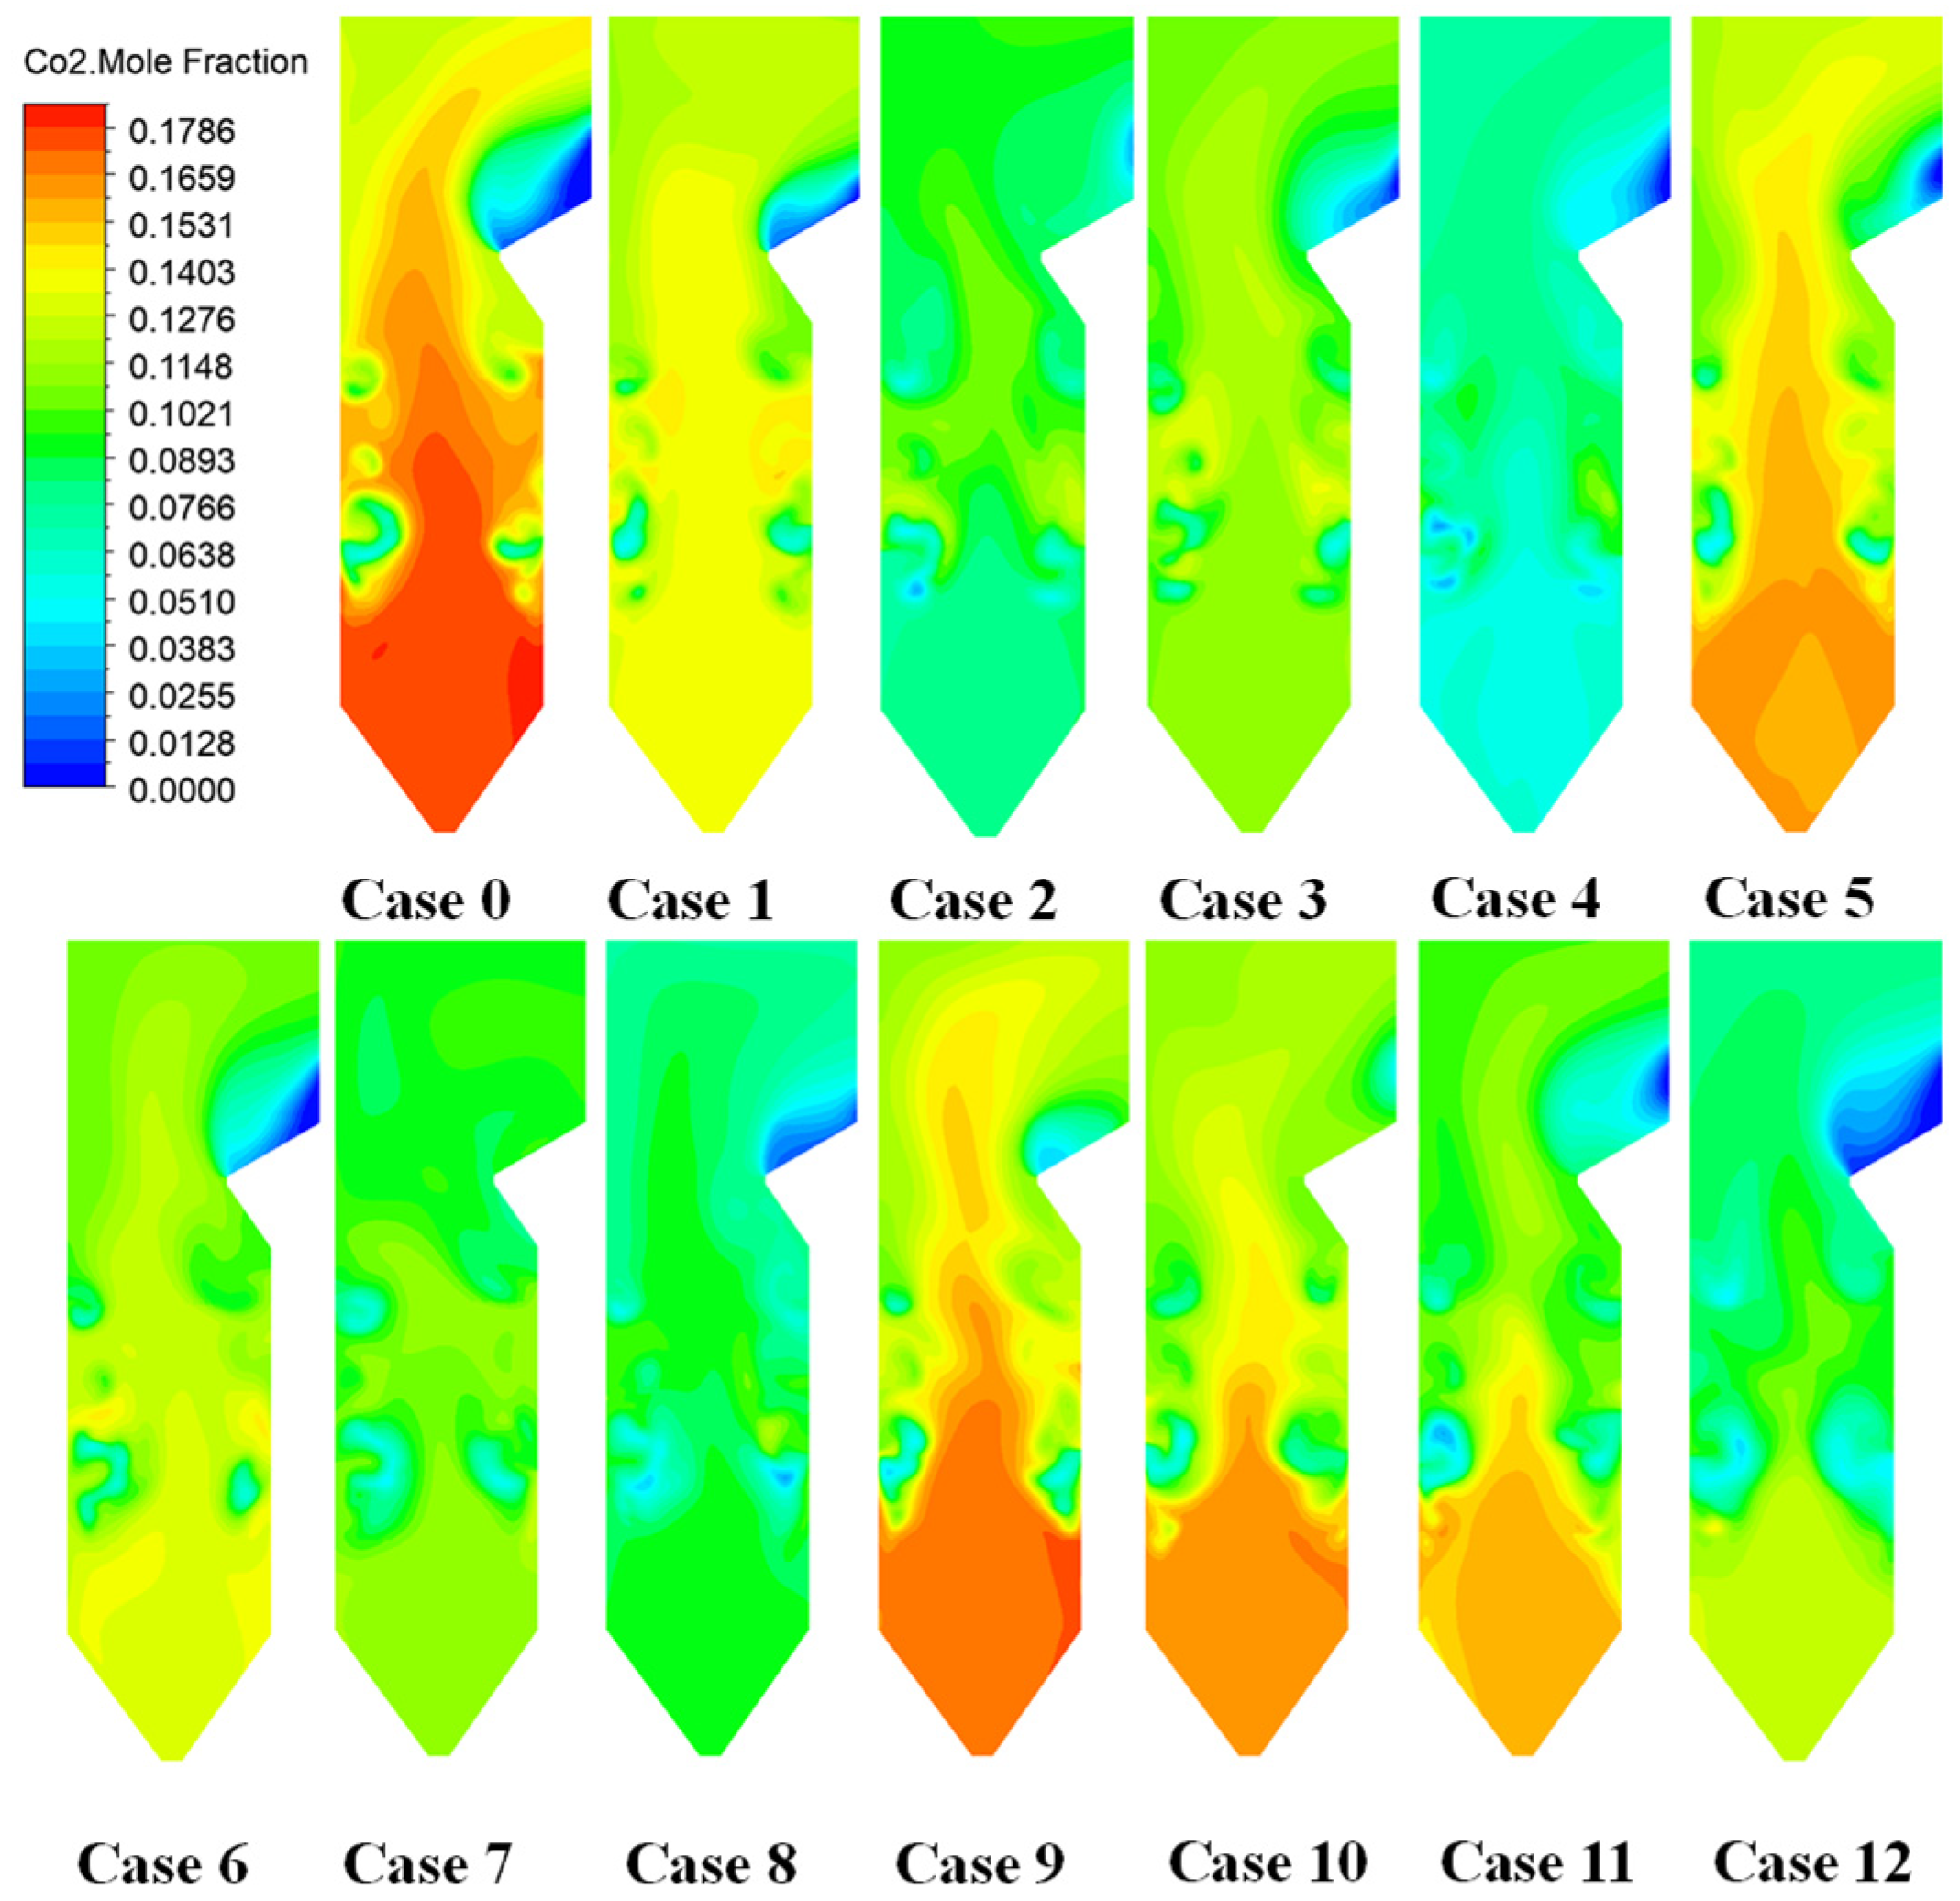
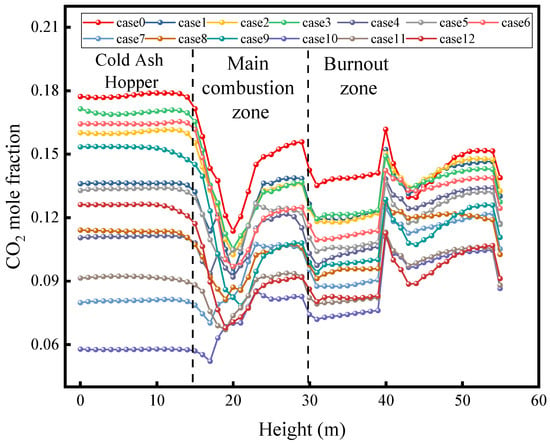
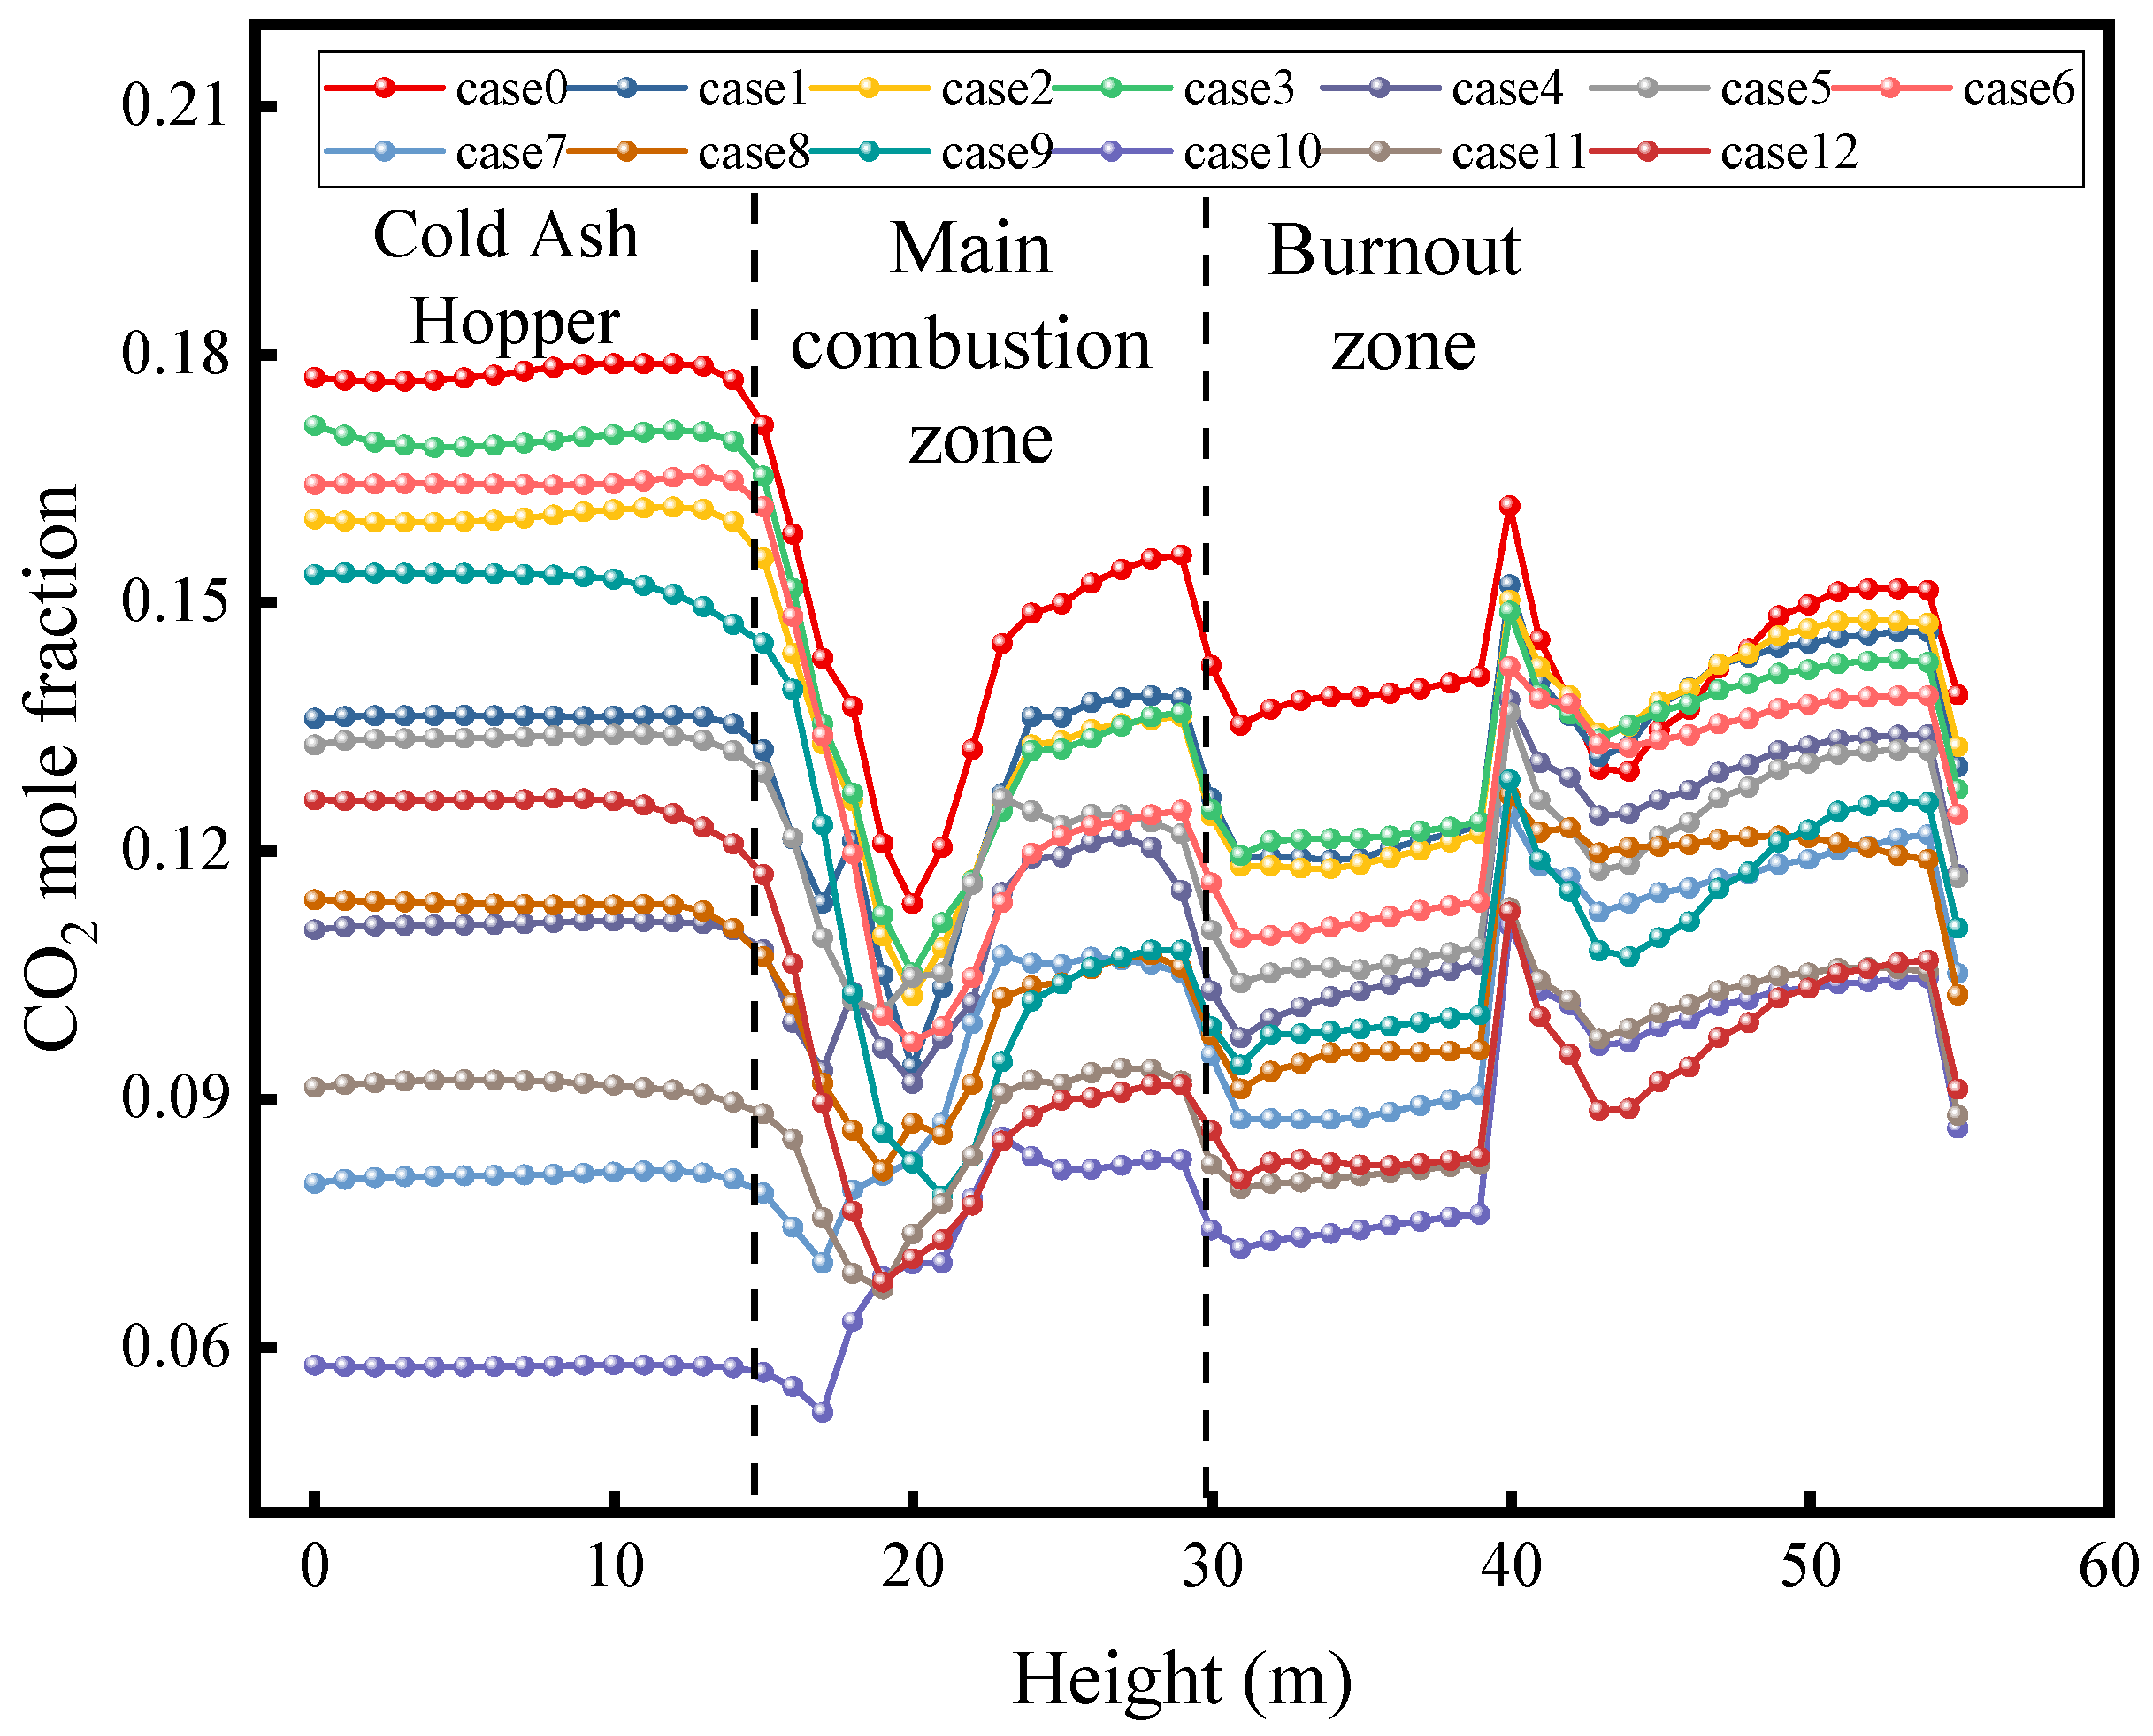
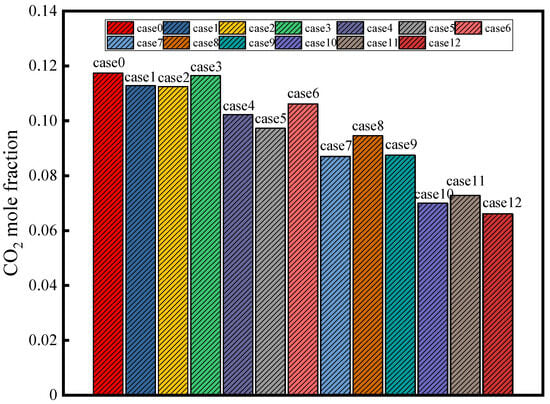
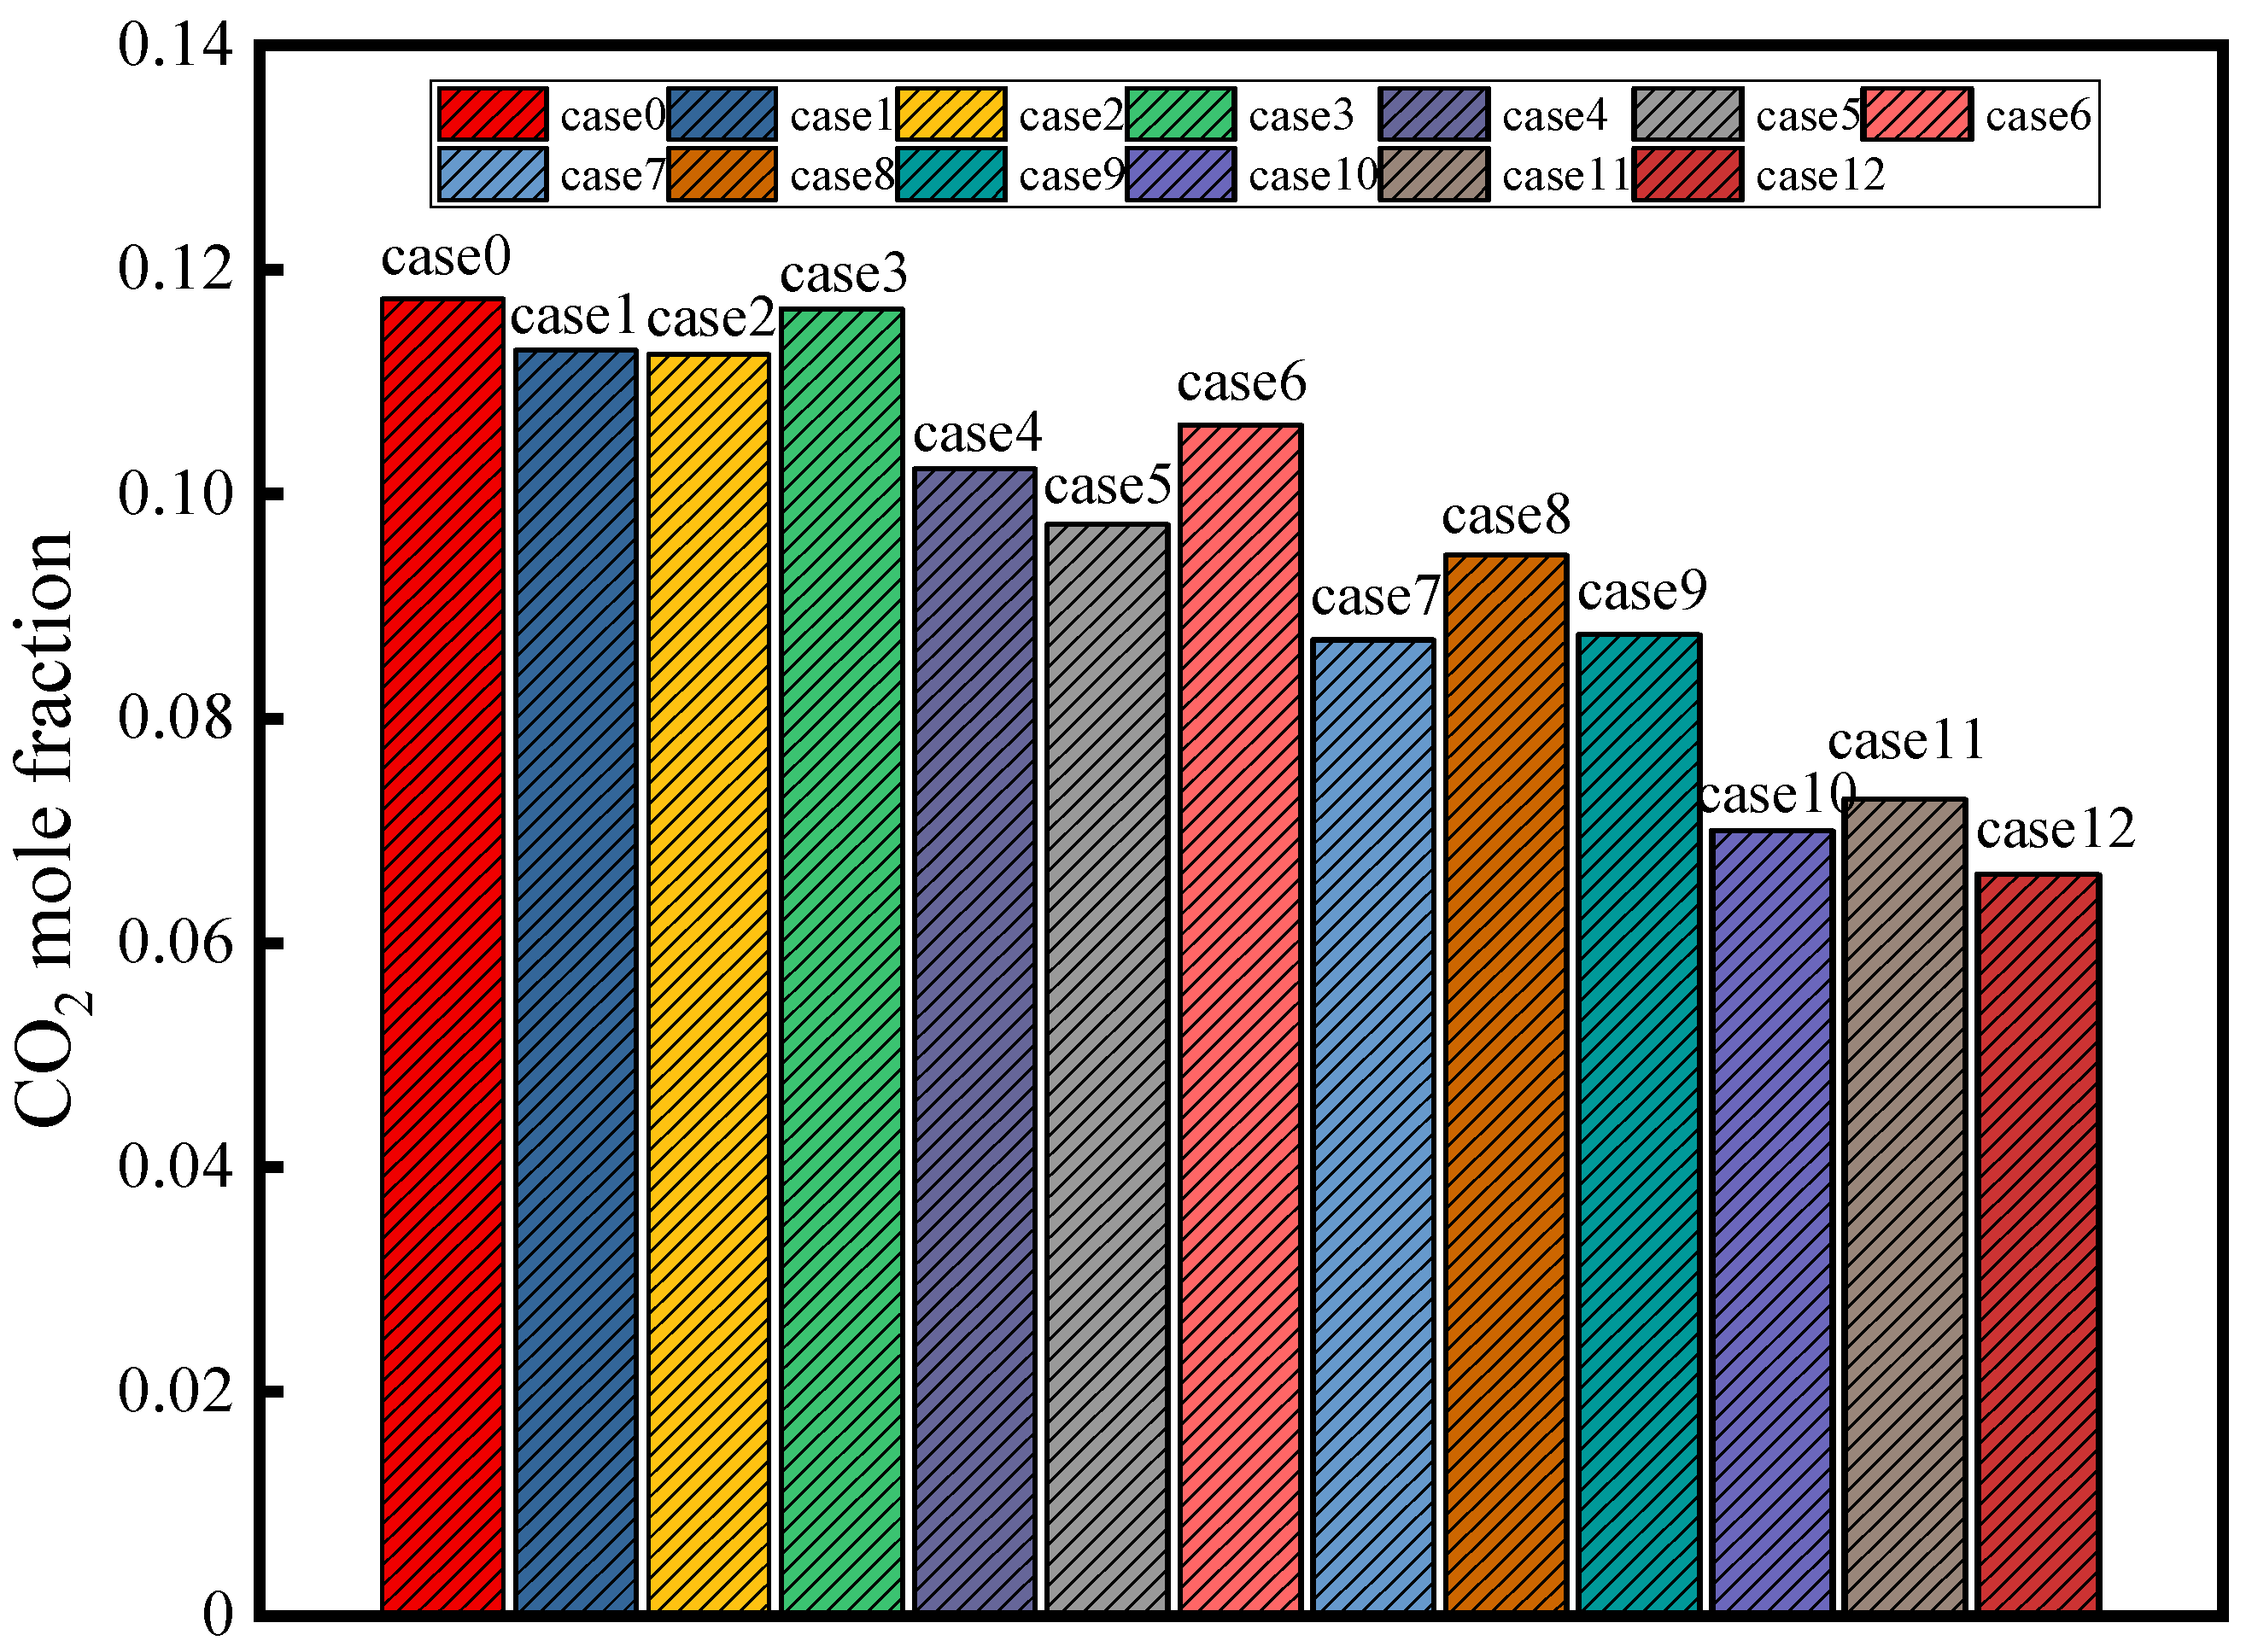
As shown in the CO2 molar fraction contours on the furnace cross-sections (Figure 7), the cross-section area-weighted mean CO2 molar fraction along the furnace height (Figure 8), and the mass-weighted mean CO2 molar fraction at the furnace outlet (Figure 9), because ammonia is a carbon-free fuel, its substitution directly reduces the amount of CO2 produced by combustion. For the pure-coal case, the CO2 molar fraction reached a peak in the main combustion zone and then gradually decreased downstream.
Figure 7.
CO2 molar fraction contours on furnace cross-sections.
Figure 8.
Cross-section area-weighted mean CO2 molar fraction distribution along the furnace height.
Figure 9.
Mass-weighted mean CO2 molar fraction at the furnace outlet.
After the ammonia addition, CO2 formation originated predominantly from the coal fraction: for every 10% increase in the ammonia co-firing ratio, the corresponding coal input decreased, and CO2 emissions declined approximately in proportion. In this study, the 40% co-firing case was estimated to reduce the CO2 concentration by about 43% relative to pure-coal firing. The influence of the injection level on the spatial distribution of CO2 is mainly reflected in the local reduction in CO2 where coal is replaced. For example, 40% ammonia injection at the B port substantially lowers CO2 in the lower combustion zone compared with pure-coal firing, whereas D-port injection reduces CO2 formation in the upper furnace because ammonia combustion produces no CO2. Consequently, in the D-port cases, the CO2 level in the downstream flue gas was notably lower, while the lower furnace also exhibited a slight CO2 reduction due to the decreased coal input.
All ammonia co-firing cases yielded lower CO2 concentrations than pure-coal firing, and the reduction increased with the co-firing ratio, which directly resulted from ammonia substituting a portion of coal combustion.
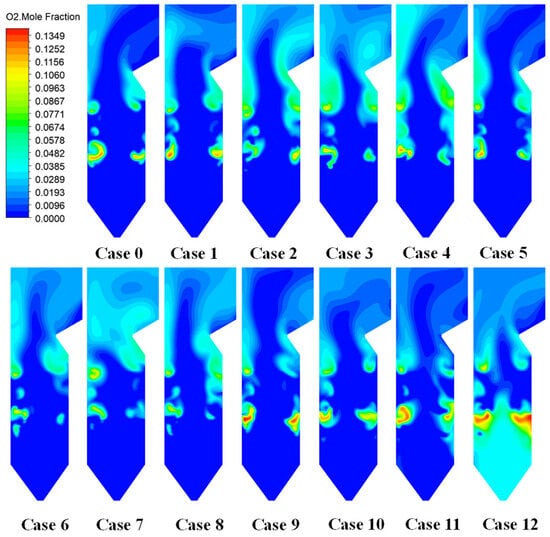
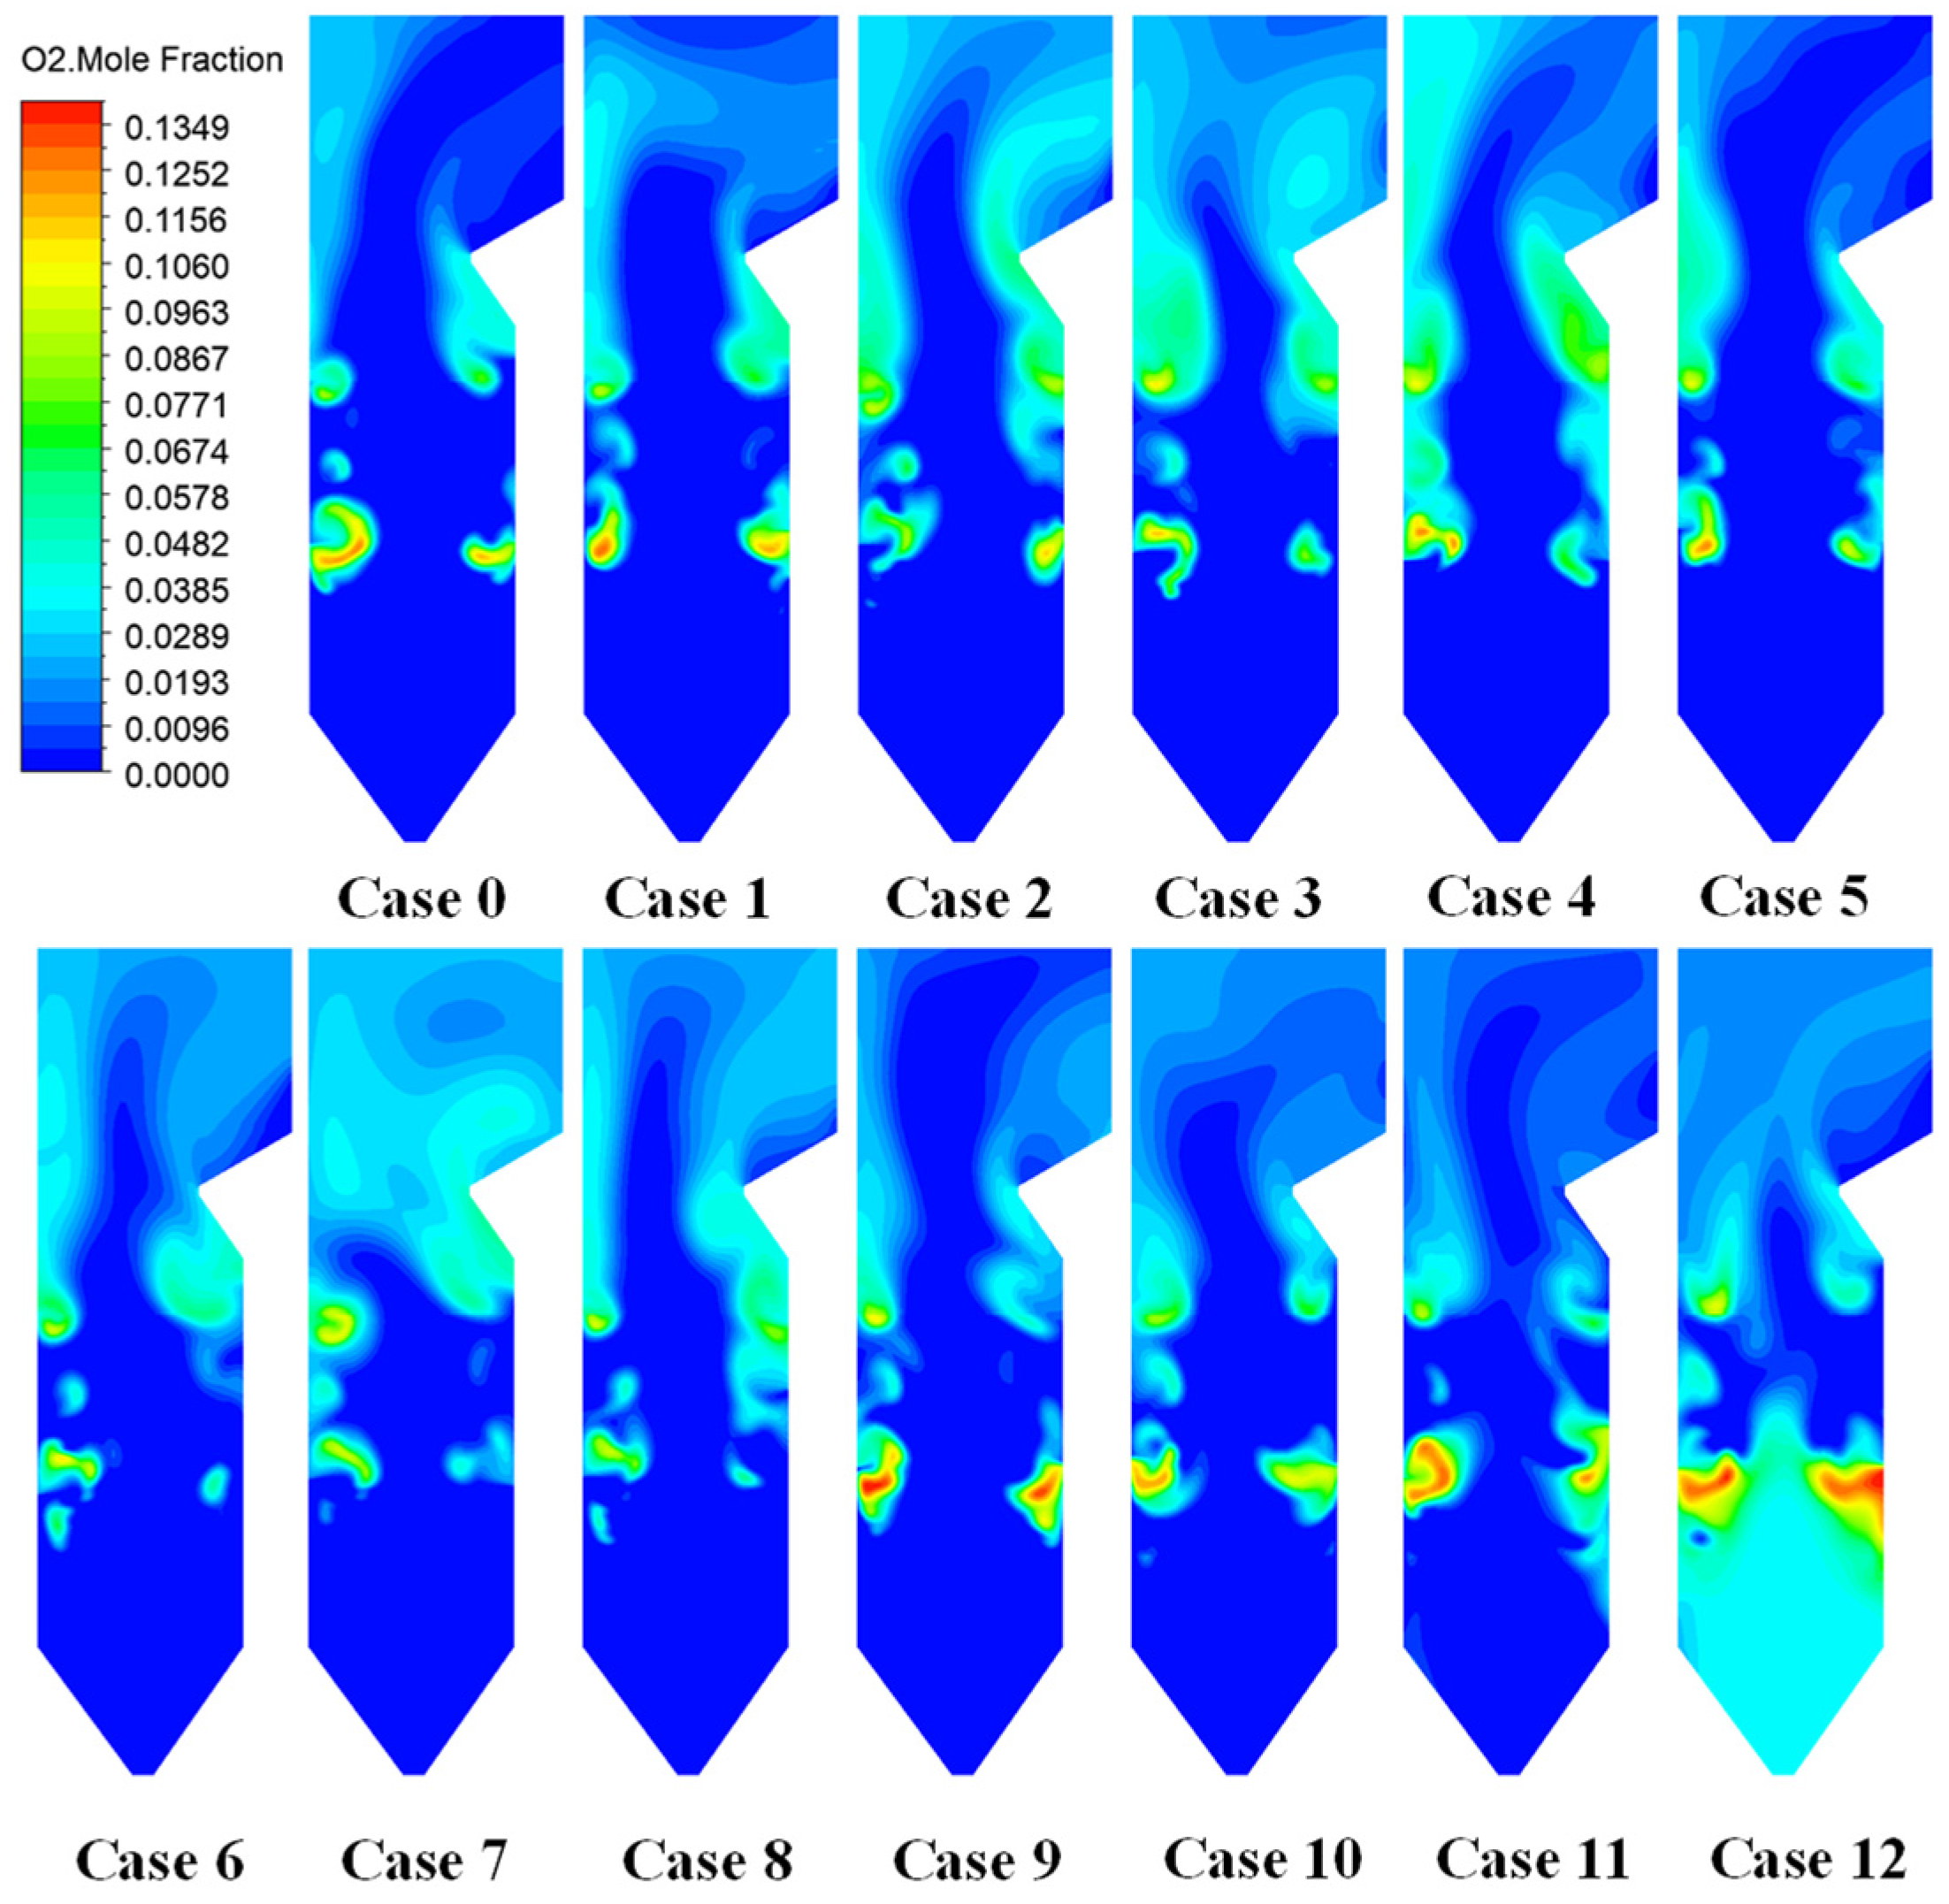
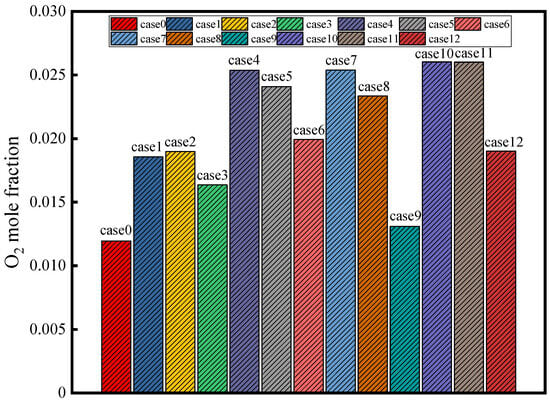
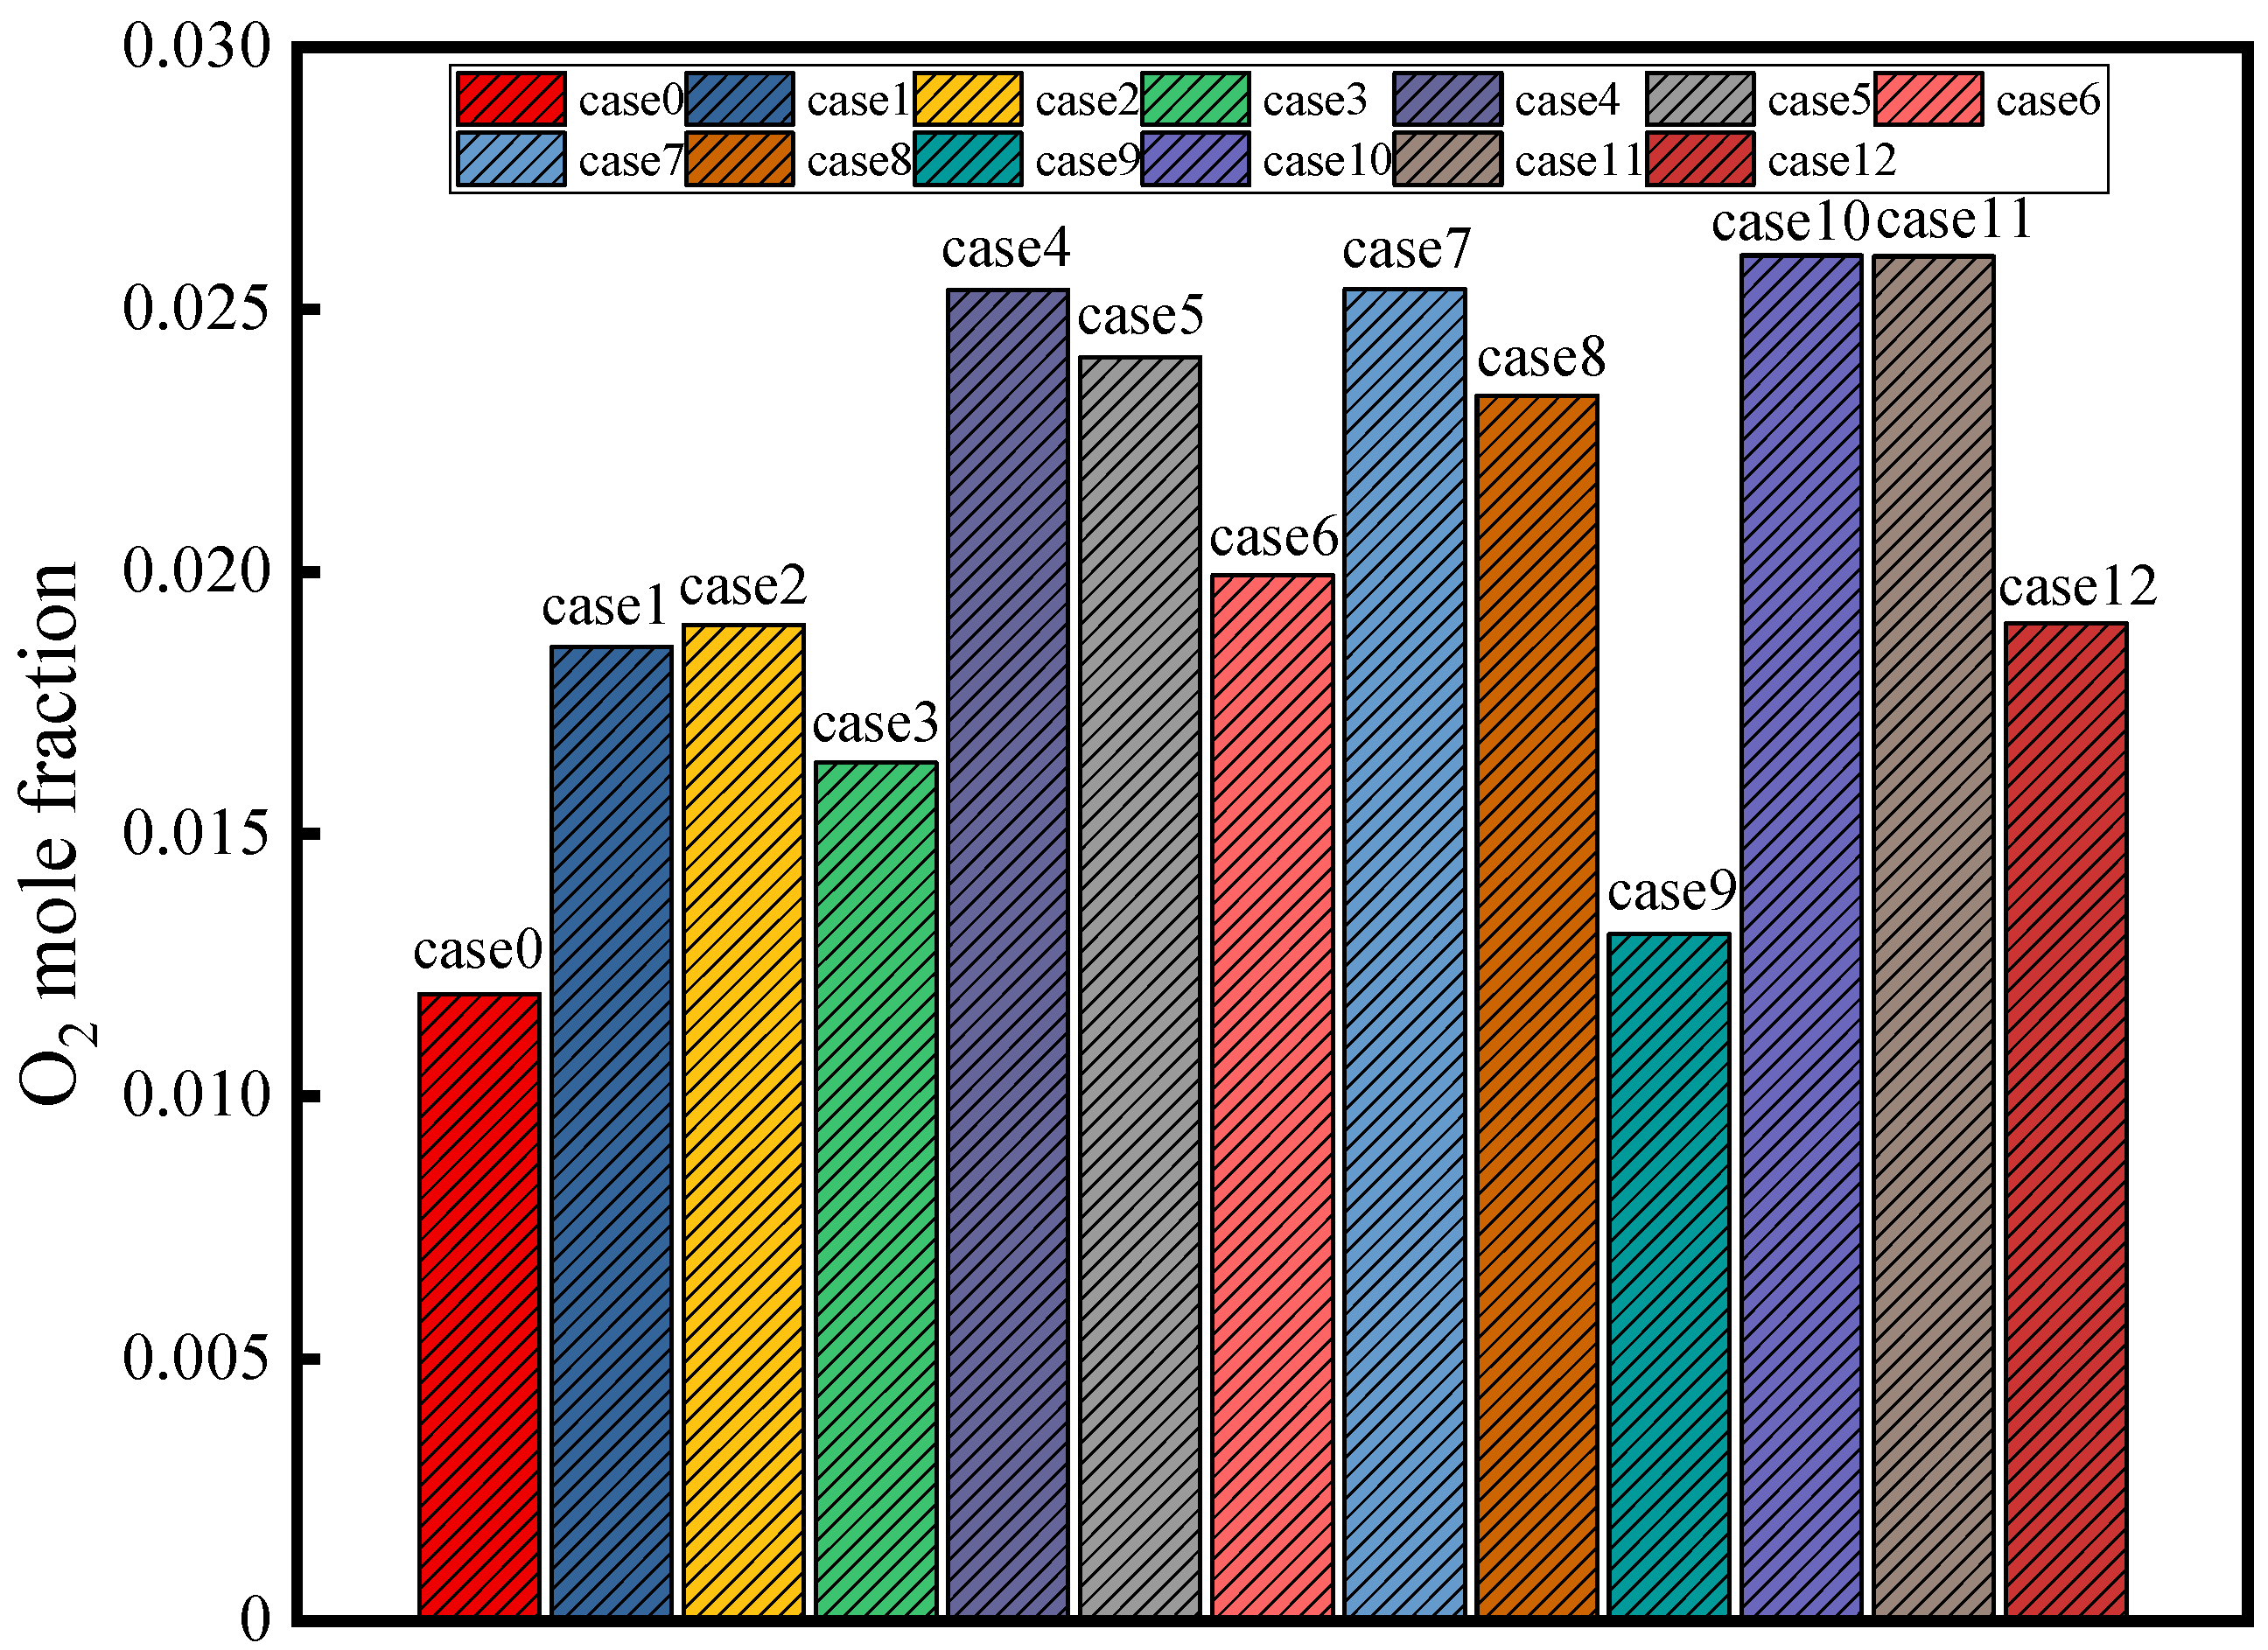
Figure 10 and Figure 11 present the O2 molar fraction contours on furnace cross-sections and the mass-weighted mean O2 molar fraction at the furnace outlet, respectively. As shown, under pure-coal firing, the O2 concentration along the furnace height exhibits a typical “decrease-recovery” pattern: intense reactions in the main combustion zone consume a large amount of O2, resulting in the lowest O2 level, whereas the subsequent introduction of secondary air and overfire air causes the O2 concentration to gradually recover and approach a stable value.
Figure 10.
O2 molar fraction contours on furnace cross-sections.
Figure 11.
Mass-weighted mean O2 molar fraction at the furnace outlet.
Under ammonia co-firing, the O2 distribution is strongly dependent on the injection level. With B-port injection, most of the ammonia burns together with coal in the lower furnace, making reactions in the main combustion zone more intense and locally more fuel-rich, thereby depleting O2 to very low levels. In the upper furnace, because the fuel input is slightly reduced, the O2 recovery is somewhat more pronounced than that under pure-coal firing. In contrast, with D-port injection, the delayed introduction of ammonia reduces the fuel supply in the lower furnace, weakening the combustion intensity and thus decreasing O2 consumption; consequently, the O2 level in the lower half of the furnace is higher than that in the pure-coal case. Ammonia participates in combustion only after it is introduced in the upper furnace (near the D port), where a second drop in O2 is observed because oxygen is consumed by ammonia oxidation.
A higher ammonia fraction tends to increase the residual O2 at the furnace outlet because the total coal input is reduced (i.e., the effective excess air becomes relatively larger). Meanwhile, a more downstream injection level strengthens the staging effect, leading to an oxygen-rich zone in the lower furnace and a fuel-rich zone in the upper furnace. This staged pattern can either lower the O2 concentration in the main combustion zone (if lower-level ammonia addition locally enriches the mixture) or raise it (if fuel is delayed and the lower zone becomes relatively oxygen-lean in terms of the reaction intensity), depending on the injection strategy.
In the present simulations, B- and C-port injection tends to create more oxygen-deficient conditions locally in the main combustion zone (with an expanded low-O2 reaction region), whereas D-port injection renders the main combustion zone relatively oxygen-rich due to a reduced fuel input; complete burnout of ammonia then relies on subsequent mixing with air in the upper furnace.
3.2. Pollutant Emission Characteristics
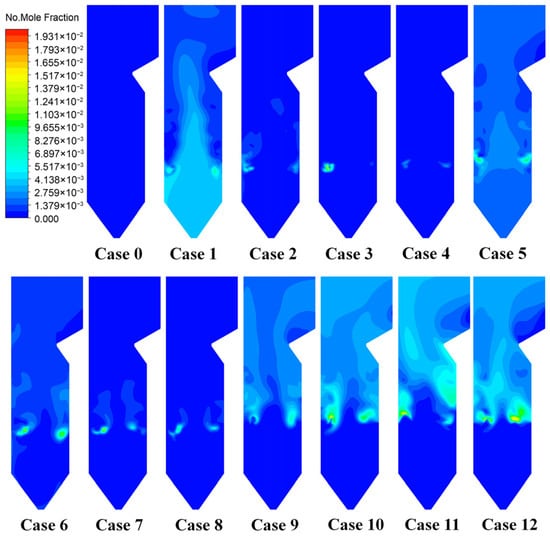
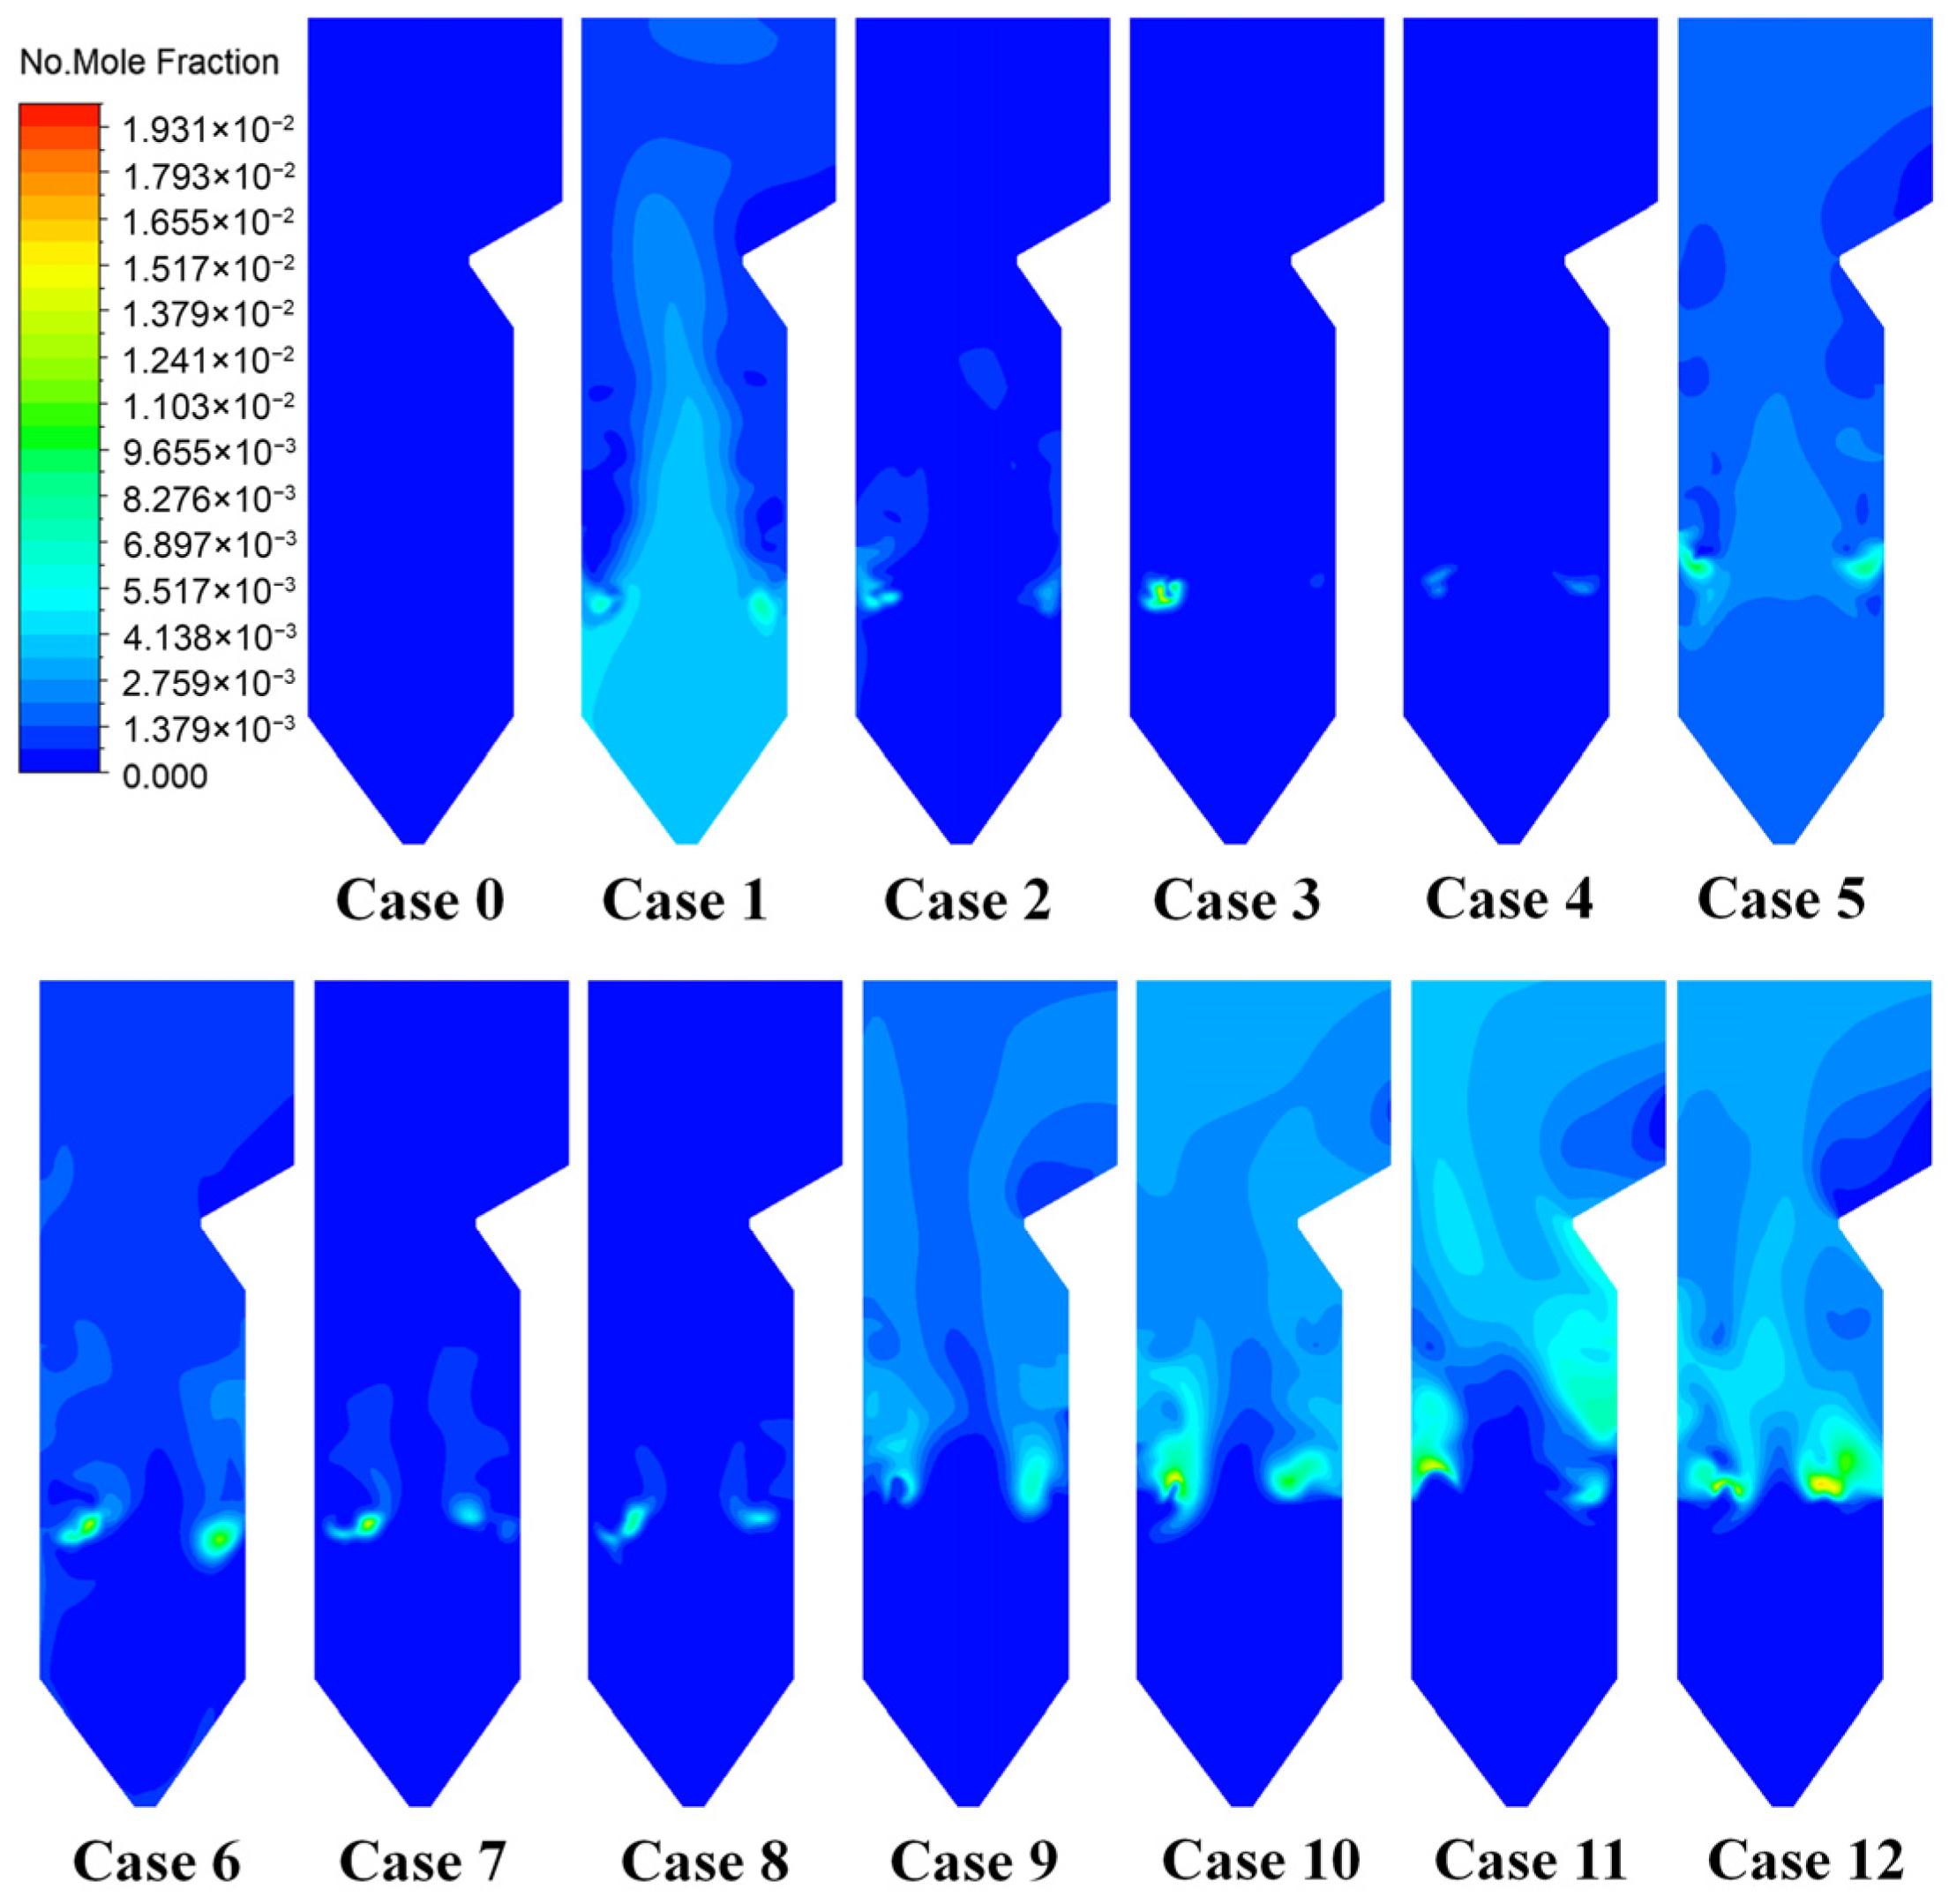
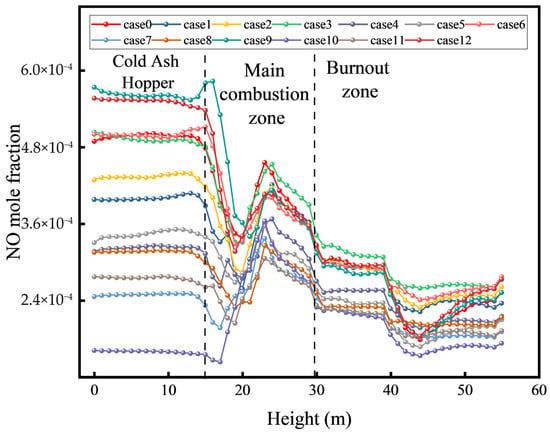
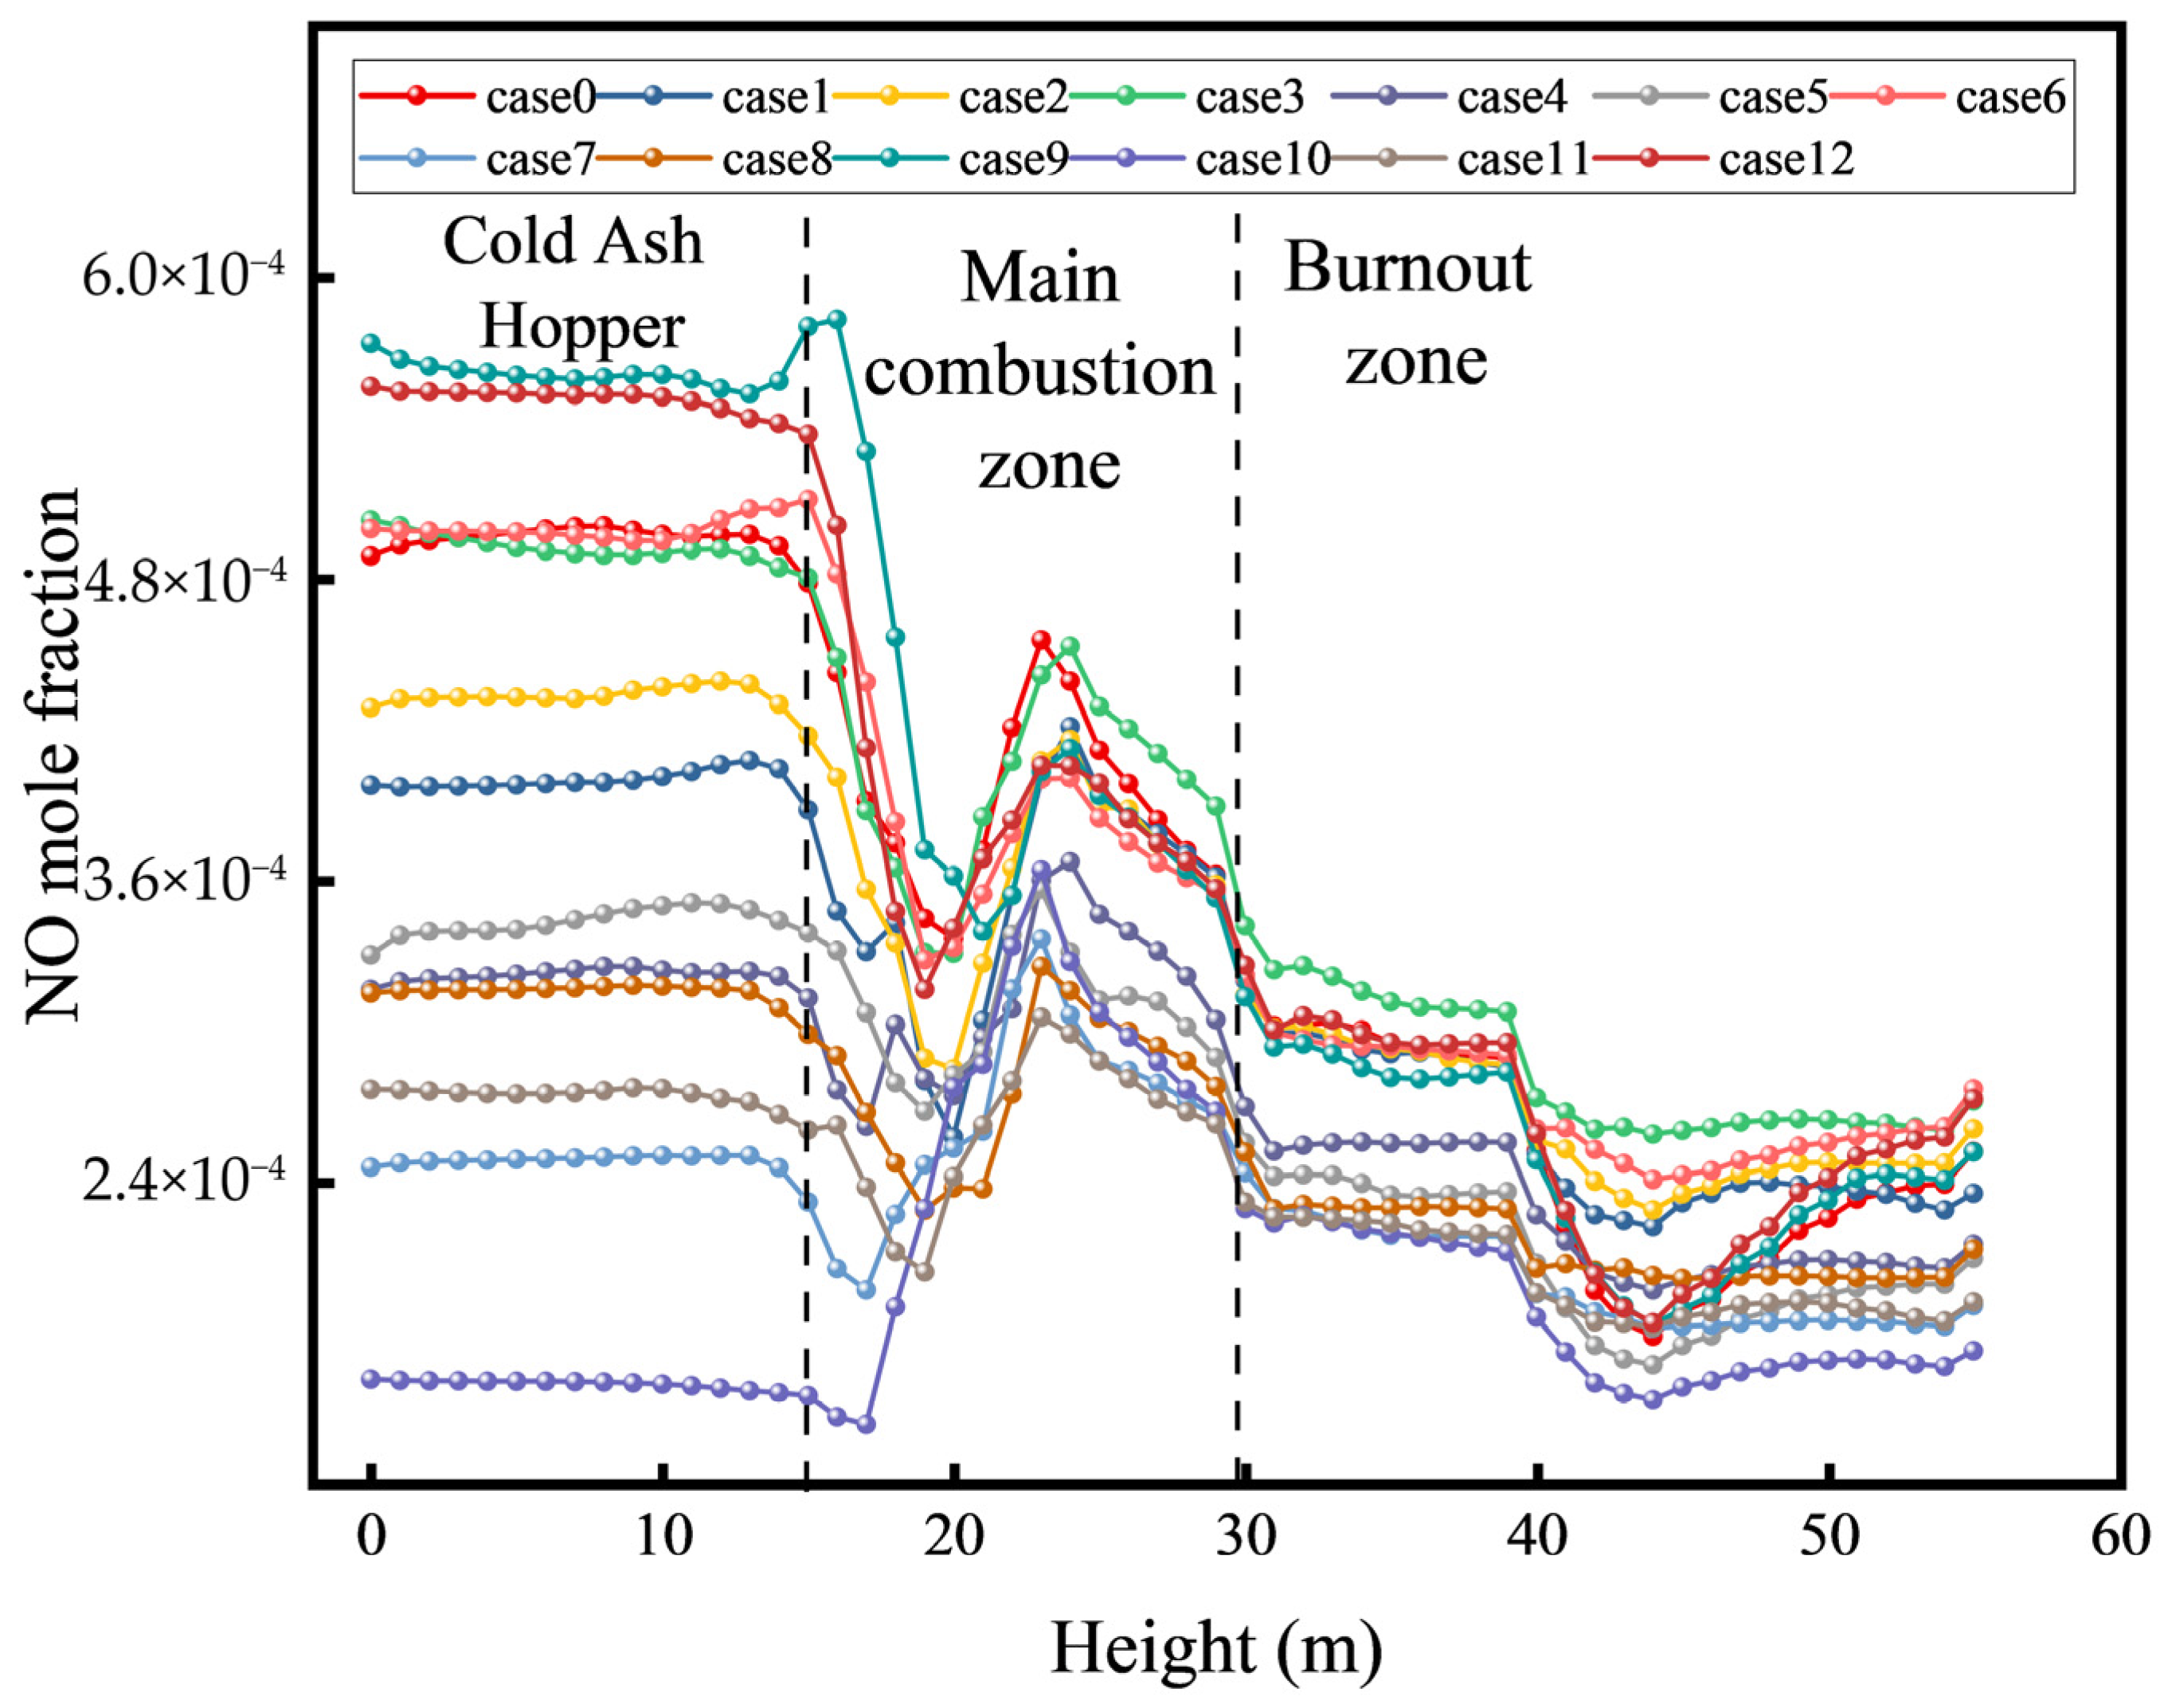
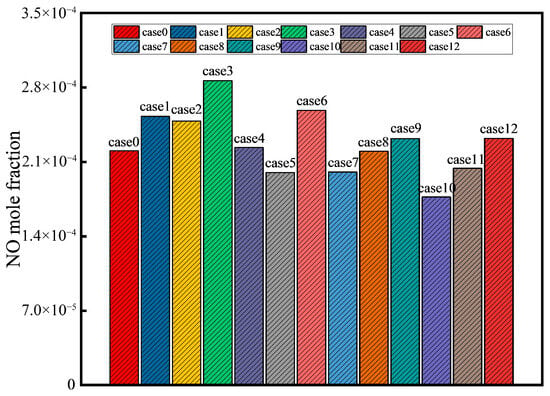
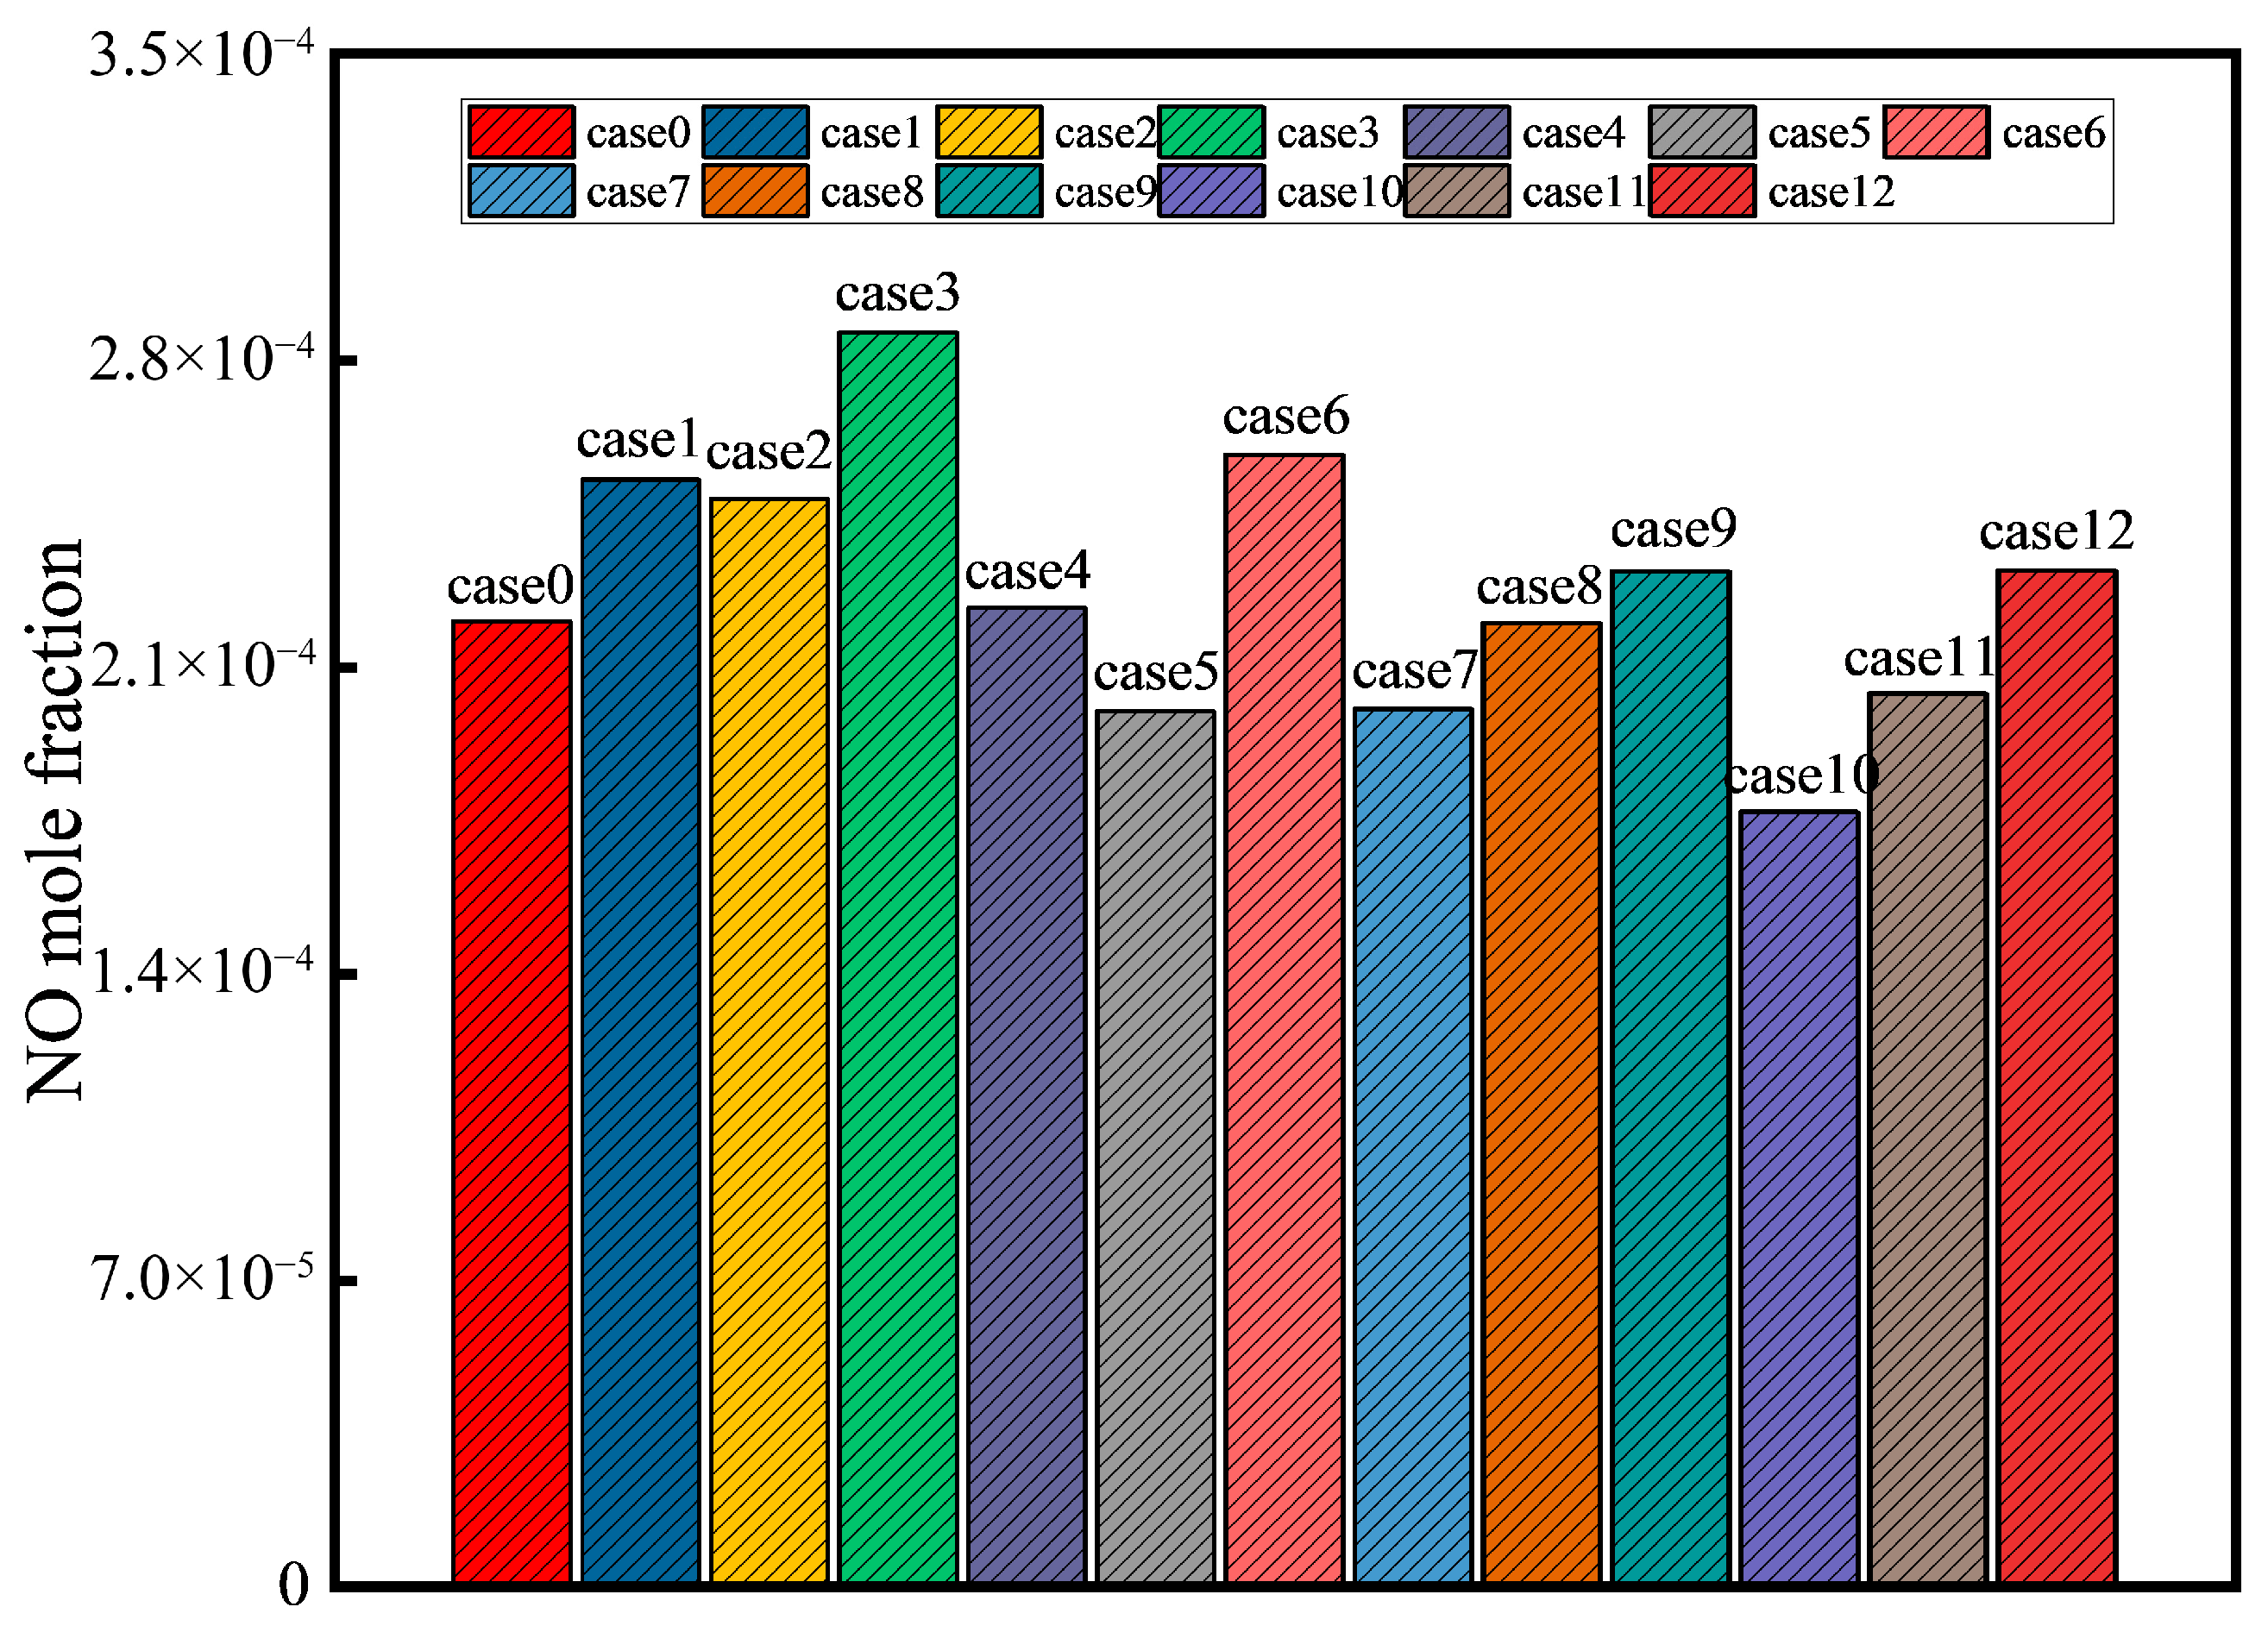
As shown in the NO molar fraction contours on furnace cross-sections (Figure 12), the cross-section area-weighted mean NO molar fraction along the furnace height (Figure 13), and the mass-weighted mean NO molar fraction at the furnace outlet (Figure 14), under pure-coal firing (Case 0), in-furnace NOx (dominated by NO) formation is concentrated in the high-temperature regions of the main combustion zone. Nitrogen-containing precursors released during coal devolatilization are oxidized in the flame zone to form NO, and the peak NO level occurs near the core of the coal flame. Downstream, the NO concentration decreases slightly along the flue-gas flow due to a partial reduction in the reducing zones and dilution effects.
Figure 12.
NO molar fraction contours on furnace cross-sections.
Figure 13.
Cross-section area-weighted mean NO molar fraction distribution along the furnace height.
Figure 14.
Mass-weighted mean NO molar fraction distribution at the furnace outlet.
The NO distribution under ammonia co-firing is closely related to both the injection location and the co-firing ratio. For B- and C-level injection, ammonia burns concurrently with coal in the lower furnace, increasing the fuel-nitrogen input to the main combustion zone while causing a relatively smaller change in the flame temperature. In the high-temperature, oxygen-rich environment, NH3 is preferentially oxidized to NO; therefore, at low co-firing ratios, the NO concentration in the lower furnace increases markedly compared with pure-coal firing. When NH3 is introduced with the primary air, its oxidation with O2 (NH3 + O2 → NO…) often proceeds earlier than the reduction of NO by NH3, resulting in a pronounced increase in NO with increasing ammonia fraction. However, as the ammonia fraction increases further, the local reducing environment becomes stronger (with more NH3 decomposition products such as H2 and CO), and signs of NO reduction emerge in the lower combustion zone, leading to a reduced NO formation rate and even locally decreased NO levels. In the present simulations with high ammonia fractions at the B and C ports, an inflection point or a decreasing region of NO appears already in the downstream part of the main combustion zone.
For ammonia injection at the B and C ports, the in-furnace NO level exhibits an “increase–decrease” trend with respect to the co-firing ratio: at low ratios, NO increases due to additional fuel-nitrogen oxidation, whereas at high ratios, NO formation is suppressed and partially reduced because of the lower temperature and a strengthened reducing atmosphere. For D-level injection, NH3 is introduced in the upper furnace. By this stage, coal in the main combustion zone has largely been consumed, so NO formed in the lower furnace is comparable to or slightly lower than that in pure-coal firing (owing to the reduced coal input). However, NH3 introduced in the upper furnace encounters lower temperatures with residual oxygen, which is unfavorable for complete NH3 burnout and for NO reduction. At temperatures below ~900 °C, part of the NH3 may not combust efficiently, leading to incomplete burnout and ammonia slip; at somewhat higher temperatures, NH3 may instead be directly oxidized to NO. Consequently, in the D-port cases, the NO level may rise again in the upper furnace and remain relatively high toward the outlet. However, the outlet NO molar fraction does not show a strictly monotonic increase with the co-firing ratio. A more appropriate interpretation is that D-port injection tends to maintain a relatively high outlet NO level and does not exhibit the pronounced high-ratio decline observed for the B- and C-port cases. This “persistently high NO at high ratios for D-port injection” supports the conclusion that upper-level ammonia injection offers limited NO suppression because a sufficiently reducing atmosphere is not established. In contrast, ammonia injection at mid- to lower levels promotes a stronger reducing environment and thus shows a higher potential for NO abatement. The lower the injection location, the easier it is to sustain a stable flame and locally oxygen-lean reducing conditions in the main combustion zone, thereby effectively limiting NO formation. The differences among cases can be summarized as follows: with lower-level ammonia injection, NO increases markedly in the lower furnace at low ratios, but can decline at high ratios; with upper-level injection, NO in the lower furnace changes little while additional NO forms in the upper furnace, causing the total NO emission to remain high.
A proper combination of single-level ammonia injection and air staging can establish low-oxygen zones and moderate-temperature regions in the furnace, thereby promoting NO reduction by NH3 and reducing NO emissions. Under unfavorable conditions (e.g., ammonia addition at excessively high temperatures or overly delayed injection), NH3 may fail to reduce NO to N2; instead, it may be almost entirely oxidized to NO or slip unreacted, leading to unchanged or even increased NO emissions. The trends observed across the 13 cases in this study are consistent with those reported in the literature, including the “decrease–increase” behavior of NO with an ammonia addition (Wang et al. [19]) and the “increase–decrease” trend reported by Xue et al. [37], as well as the difficulty of reducing NO under a high-ratio upper-level ammonia injection; these behaviors are reproduced in the simulations and can be explained mechanistically.
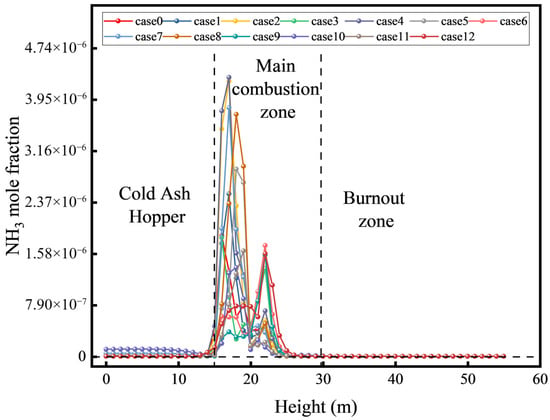
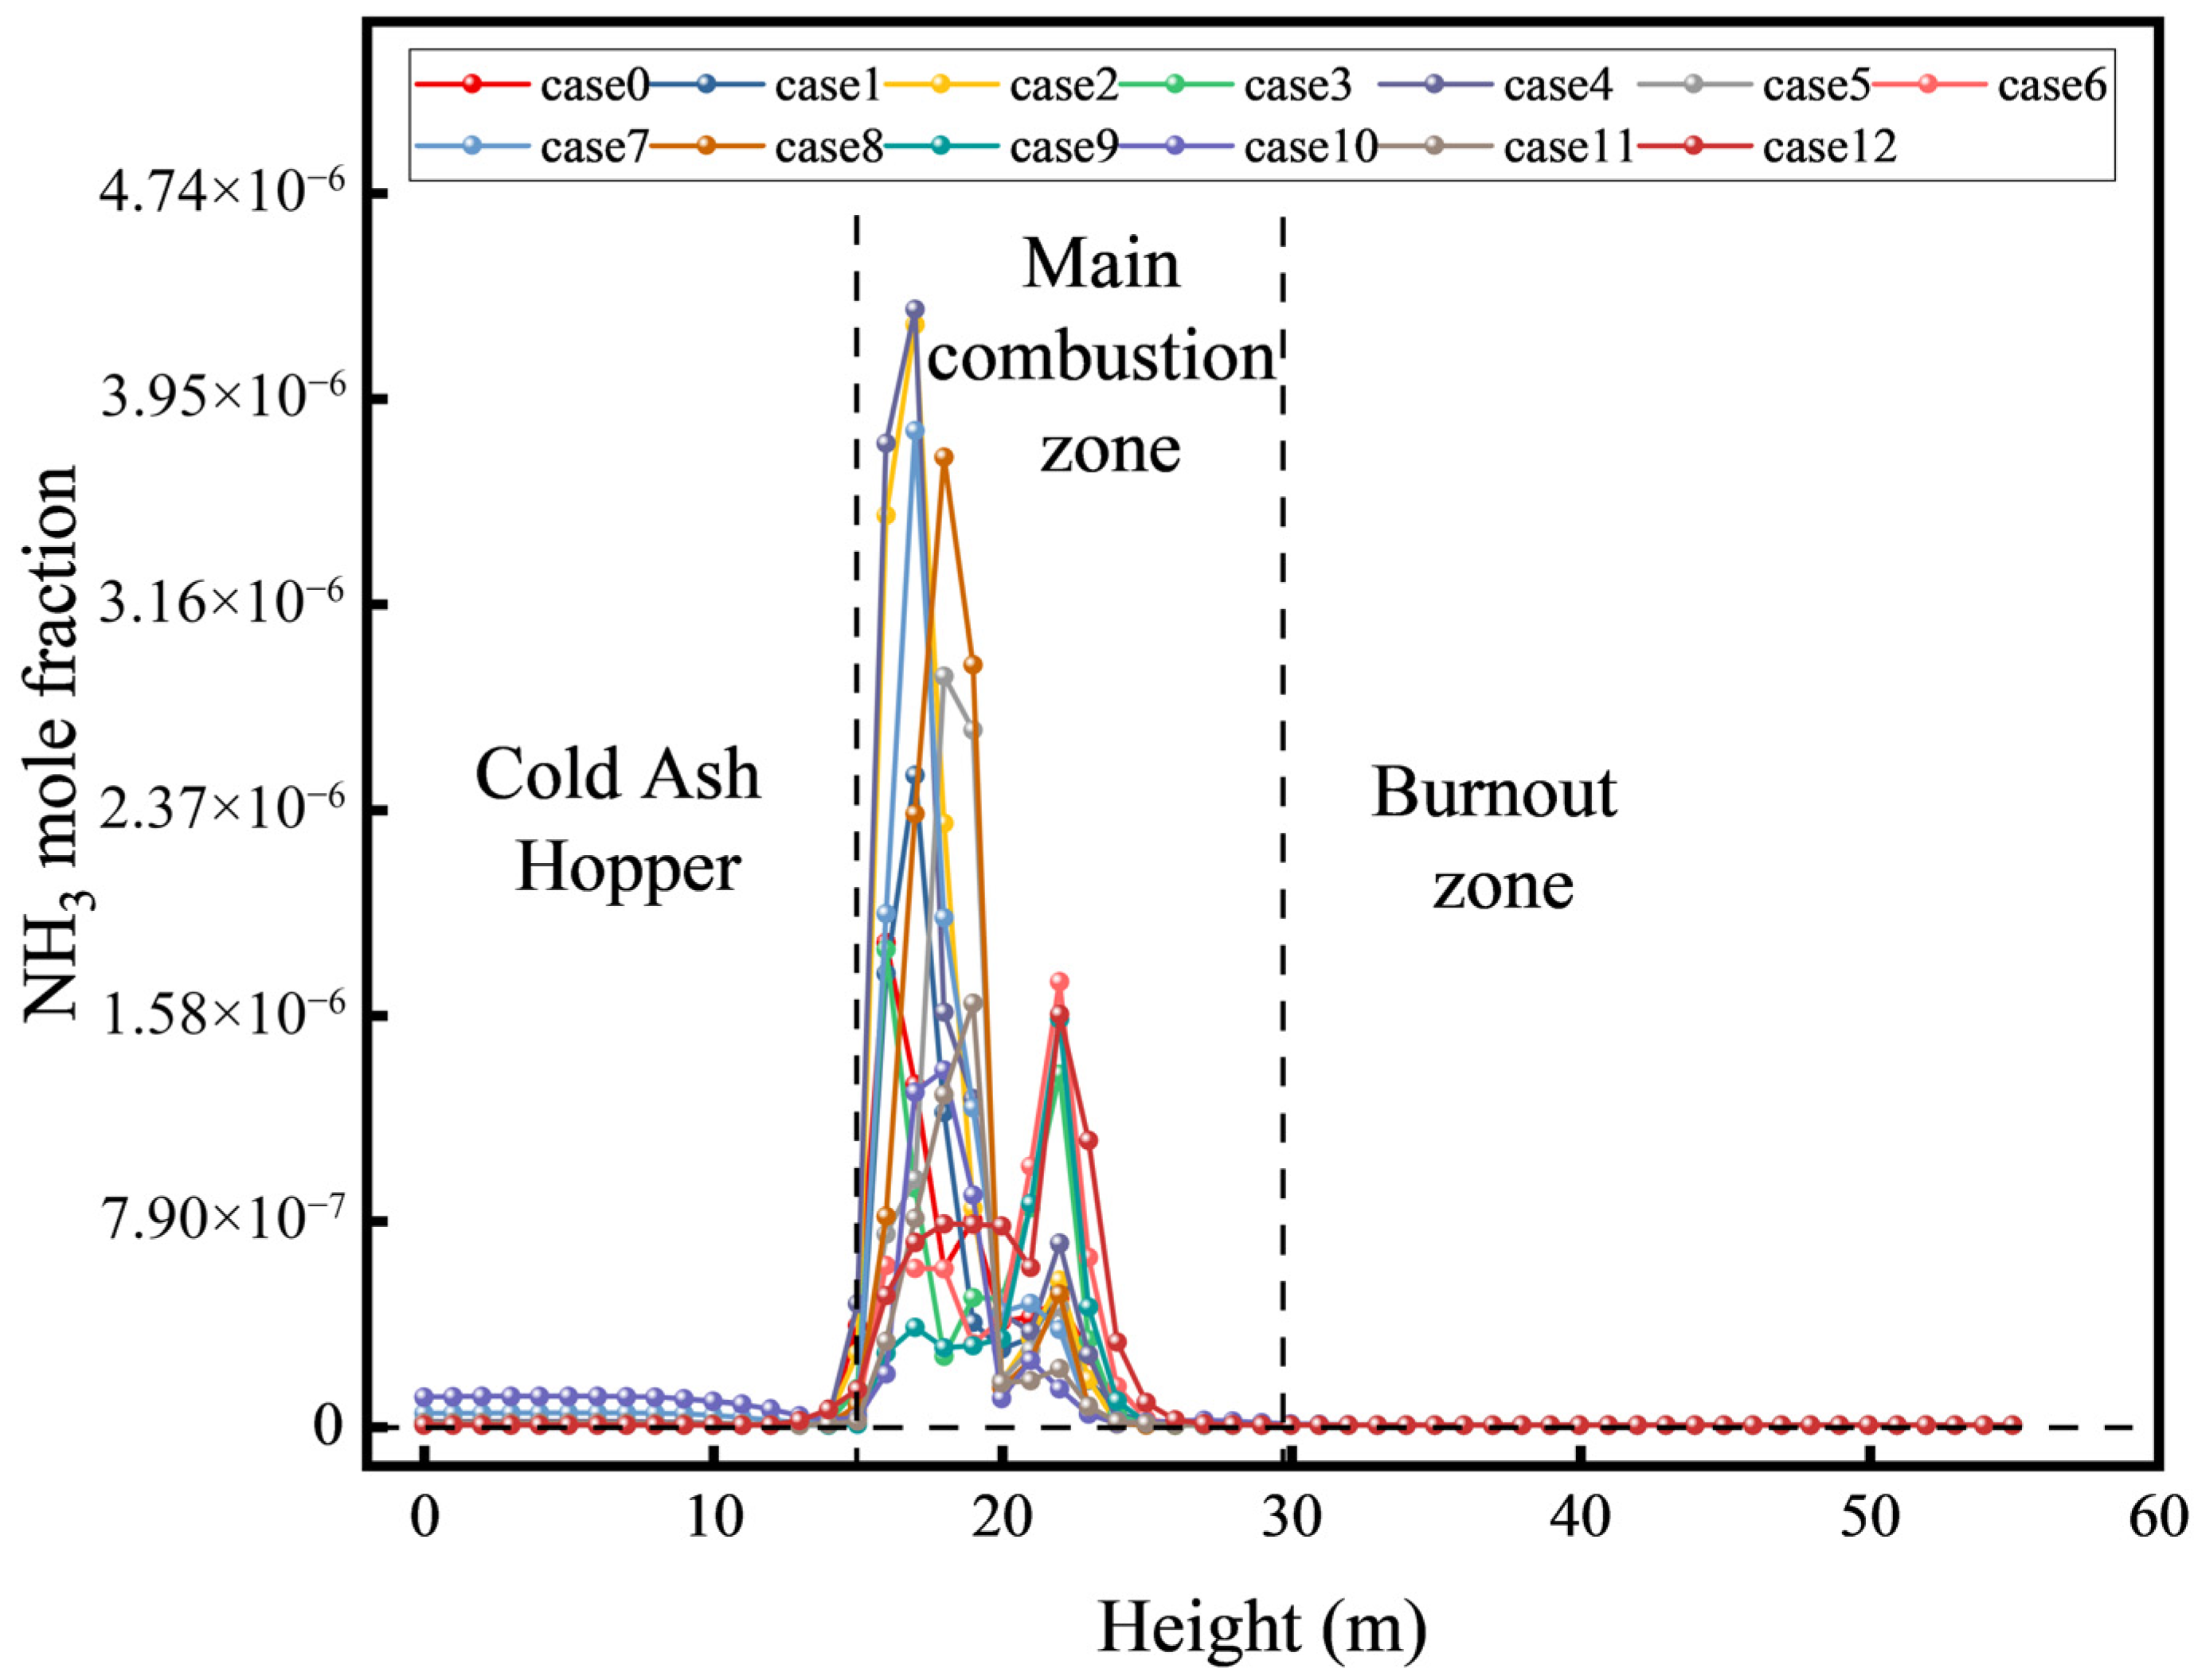
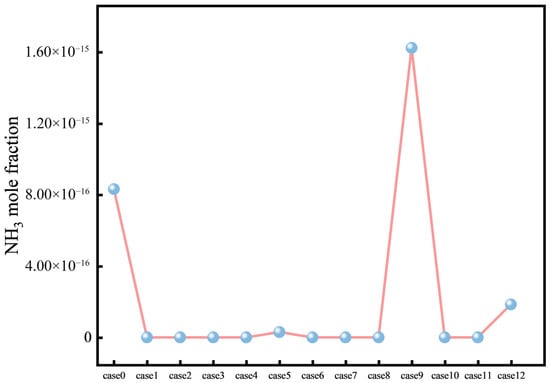
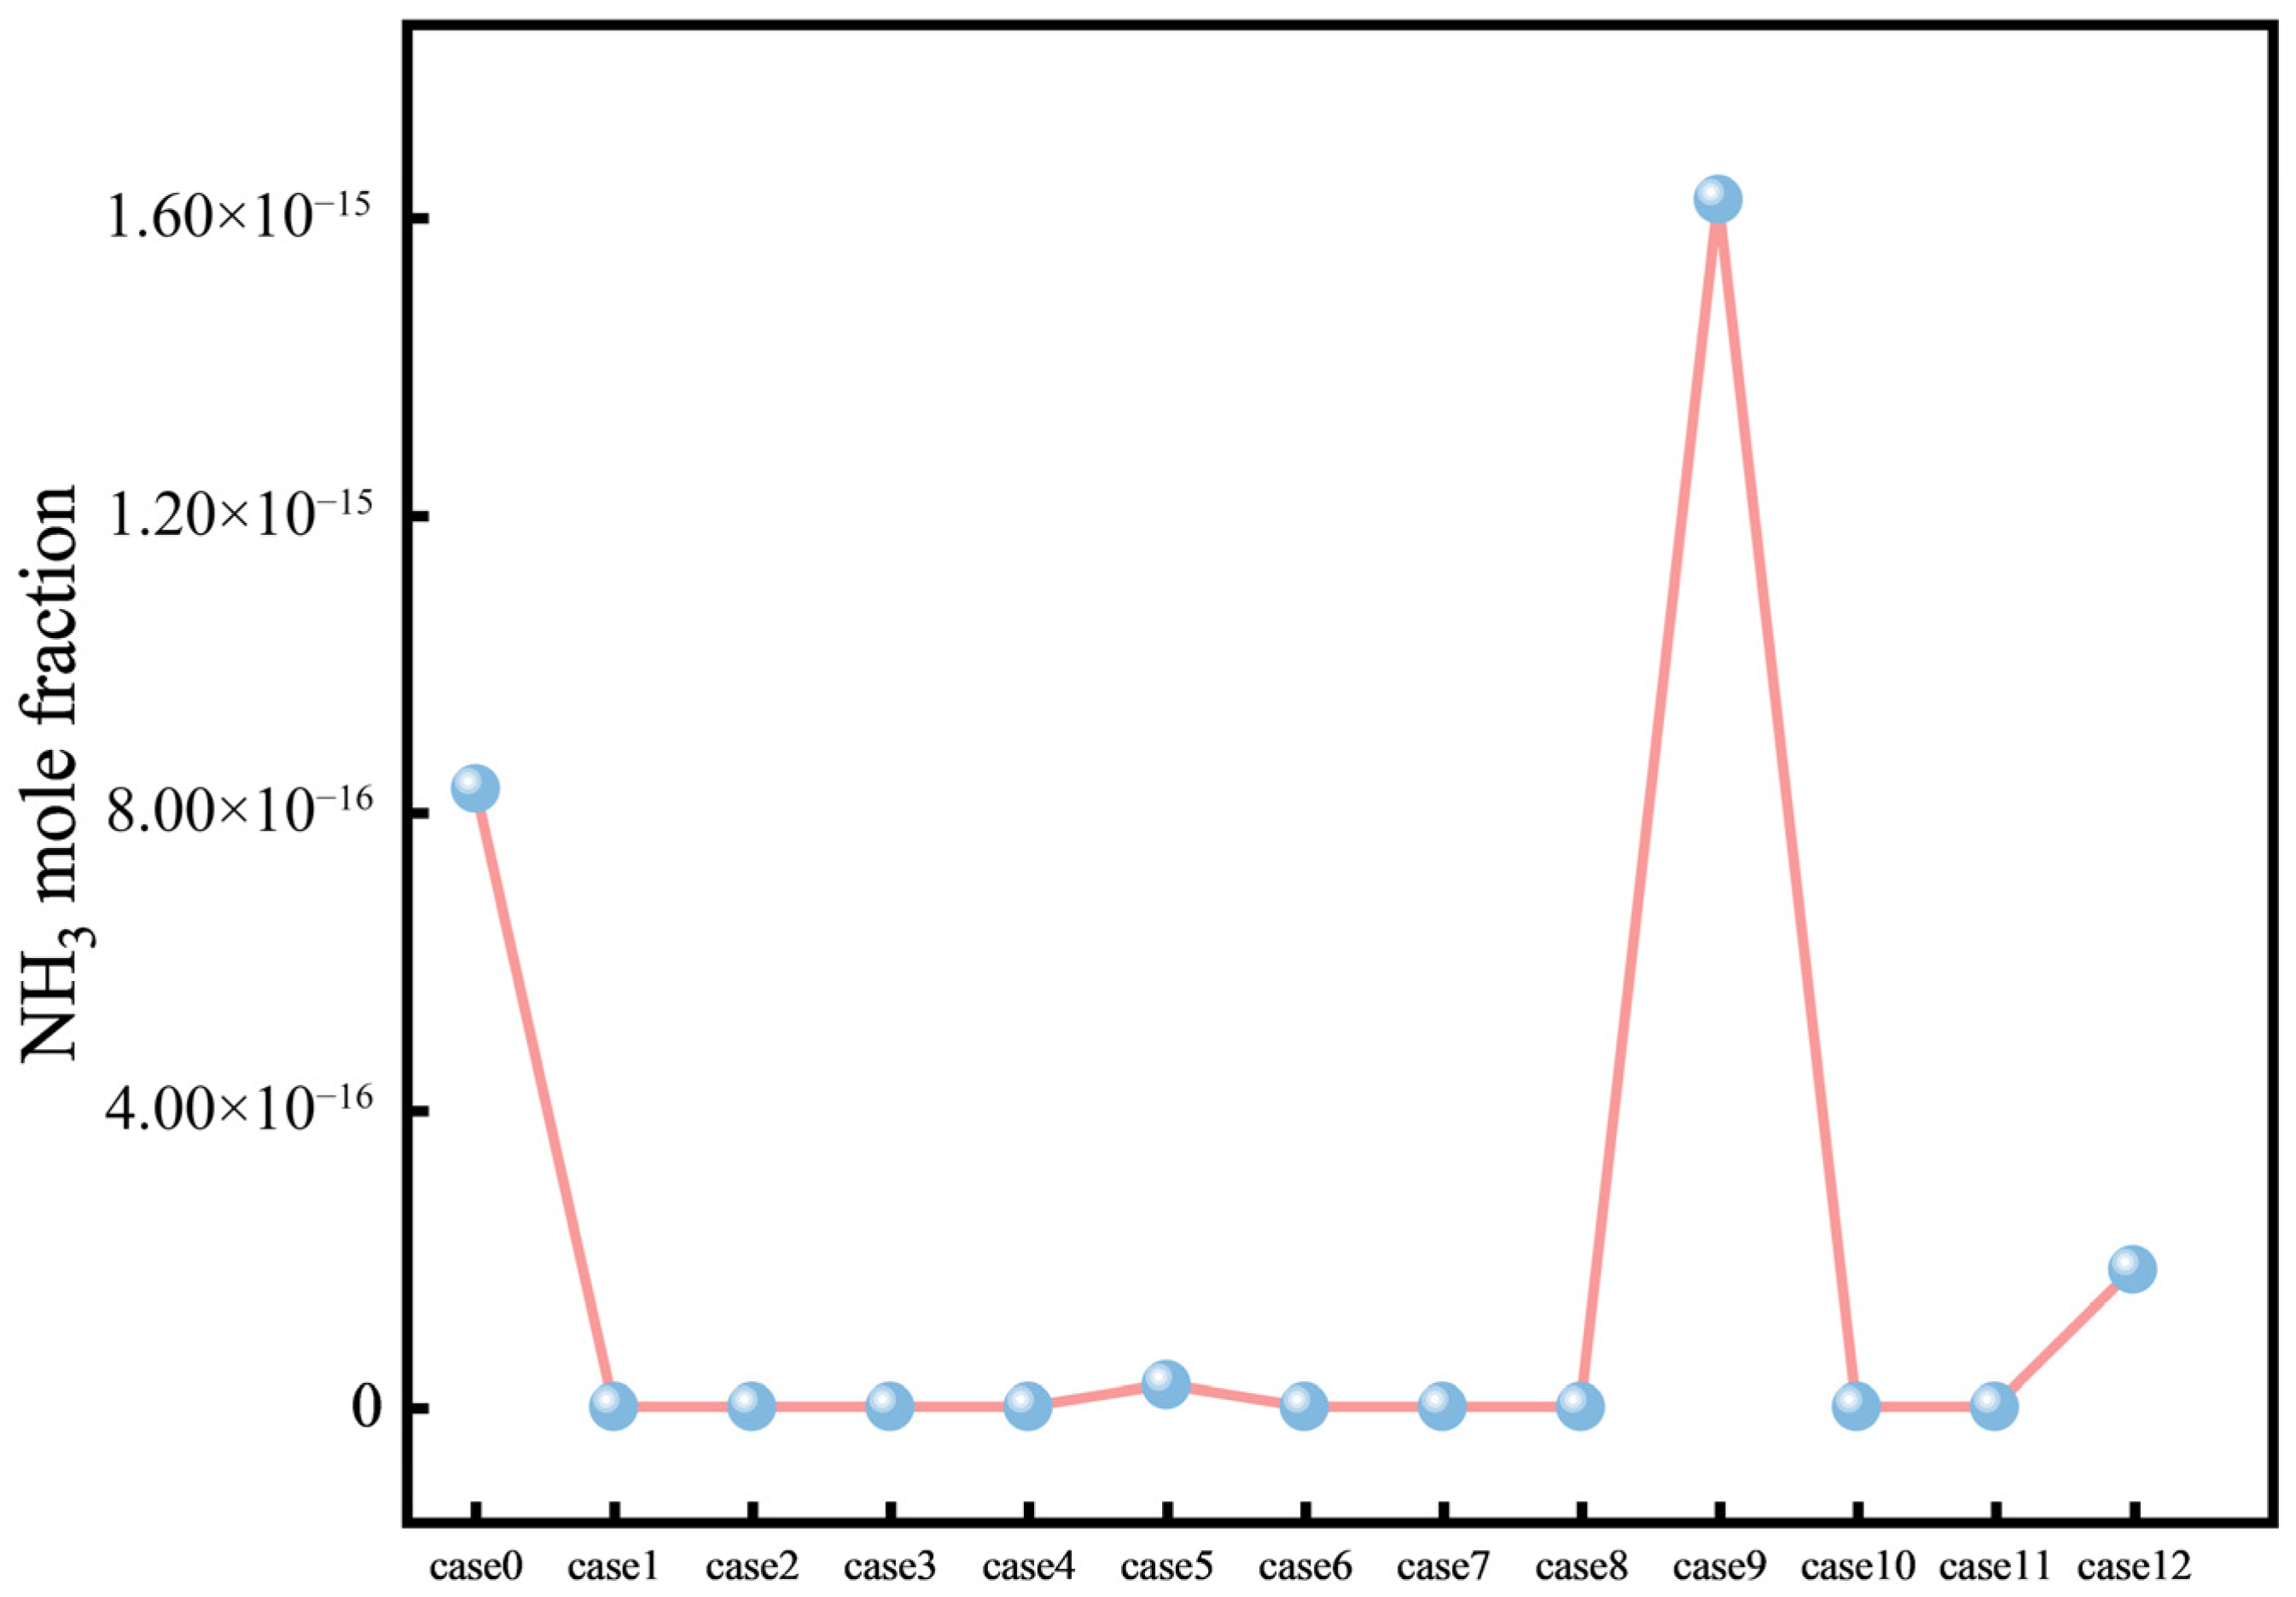
As shown in the cross-section area-weighted mean NH3 molar fraction along the furnace height (Figure 15) and the mass-weighted mean NH3 molar fraction at the furnace outlet (Figure 16), no NH3 species is present in the furnace under pure-coal firing. Under ammonia co-firing, the spatial distribution of unburned ammonia, i.e., ammonia slip, should be carefully examined.
Figure 15.
Cross-section area-weighted mean NH3 molar fraction distribution along the furnace height.
Figure 16.
Mass-weighted mean NH3 molar fraction distribution at the furnace outlet.
The results show that ammonia slip is negligible for B- and C-level injections: ammonia enters the high-temperature zone together with coal and rapidly decomposes and burns, so that most NH3 is consumed in the vicinity of the burners. This is consistent with experimental observations, in which, even at relatively high ammonia fractions, NH3 can be effectively consumed under the high-temperature conditions of a pulverized-coal flame, leaving little to no detectable NH3 at the boiler outlet [4]. For all cases, the NH3 level in the hopper region (≈0–15 m) remained close to zero. After entering the main combustion zone (≈15–30 m), NH3 rose sharply and formed a dominant peak around 16–19 m, with peak magnitudes on the order of 10−6. Among them, Cases 7 and 8 exhibited the most pronounced peaks, reaching nearly 4 × 10⁻⁶, whereas the remaining cases showed substantially lower peak values, mostly within (0.5–3) ×10−6. In addition to the dominant peak, a secondary peak appeared in some cases around 21–23 m (also on the order of 10−6, with a maximum of ~1.6 × 10⁻⁶), although this feature was not present for all cases. Further upward, all profiles decayed rapidly after ~25–30 m and returned to near-zero levels in the burnout zone (>30 m), indicating that non-zero NH3 is mainly confined to the main combustion zone.
At the furnace outlet, the NH3 values were on the order of 10−15, and most cases were essentially indistinguishable from zero at this scale. Three relatively noticeable non-zero values occurred in Case 9 (the largest, ~1.6 × 10⁻¹⁵), Case 0 (~8 × 10⁻¹⁶), and Case 12 (~2 × 10⁻¹⁶), while the remaining cases were difficult to distinguish from zero at this ordinate scale. When combining Figure 15 and Figure 16, the NH3 peak in the main combustion zone is on the order of 10−6, whereas the characteristic outlet value is on the order of 10−15, differing by approximately nine orders of magnitude. This indicates that NH3 decays rapidly above the main combustion zone and becomes nearly zero at the outlet.
The NH3 molar fraction at the furnace outlet is at most on the order of 10−15, indicating that ammonia slip is negligible for the B-, C-, and D-port cases and that NH3 is effectively fully consumed.
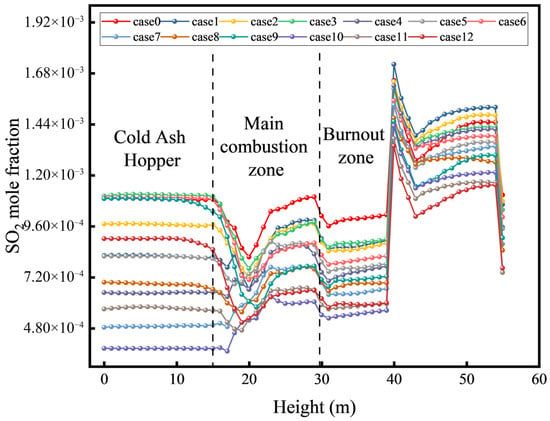
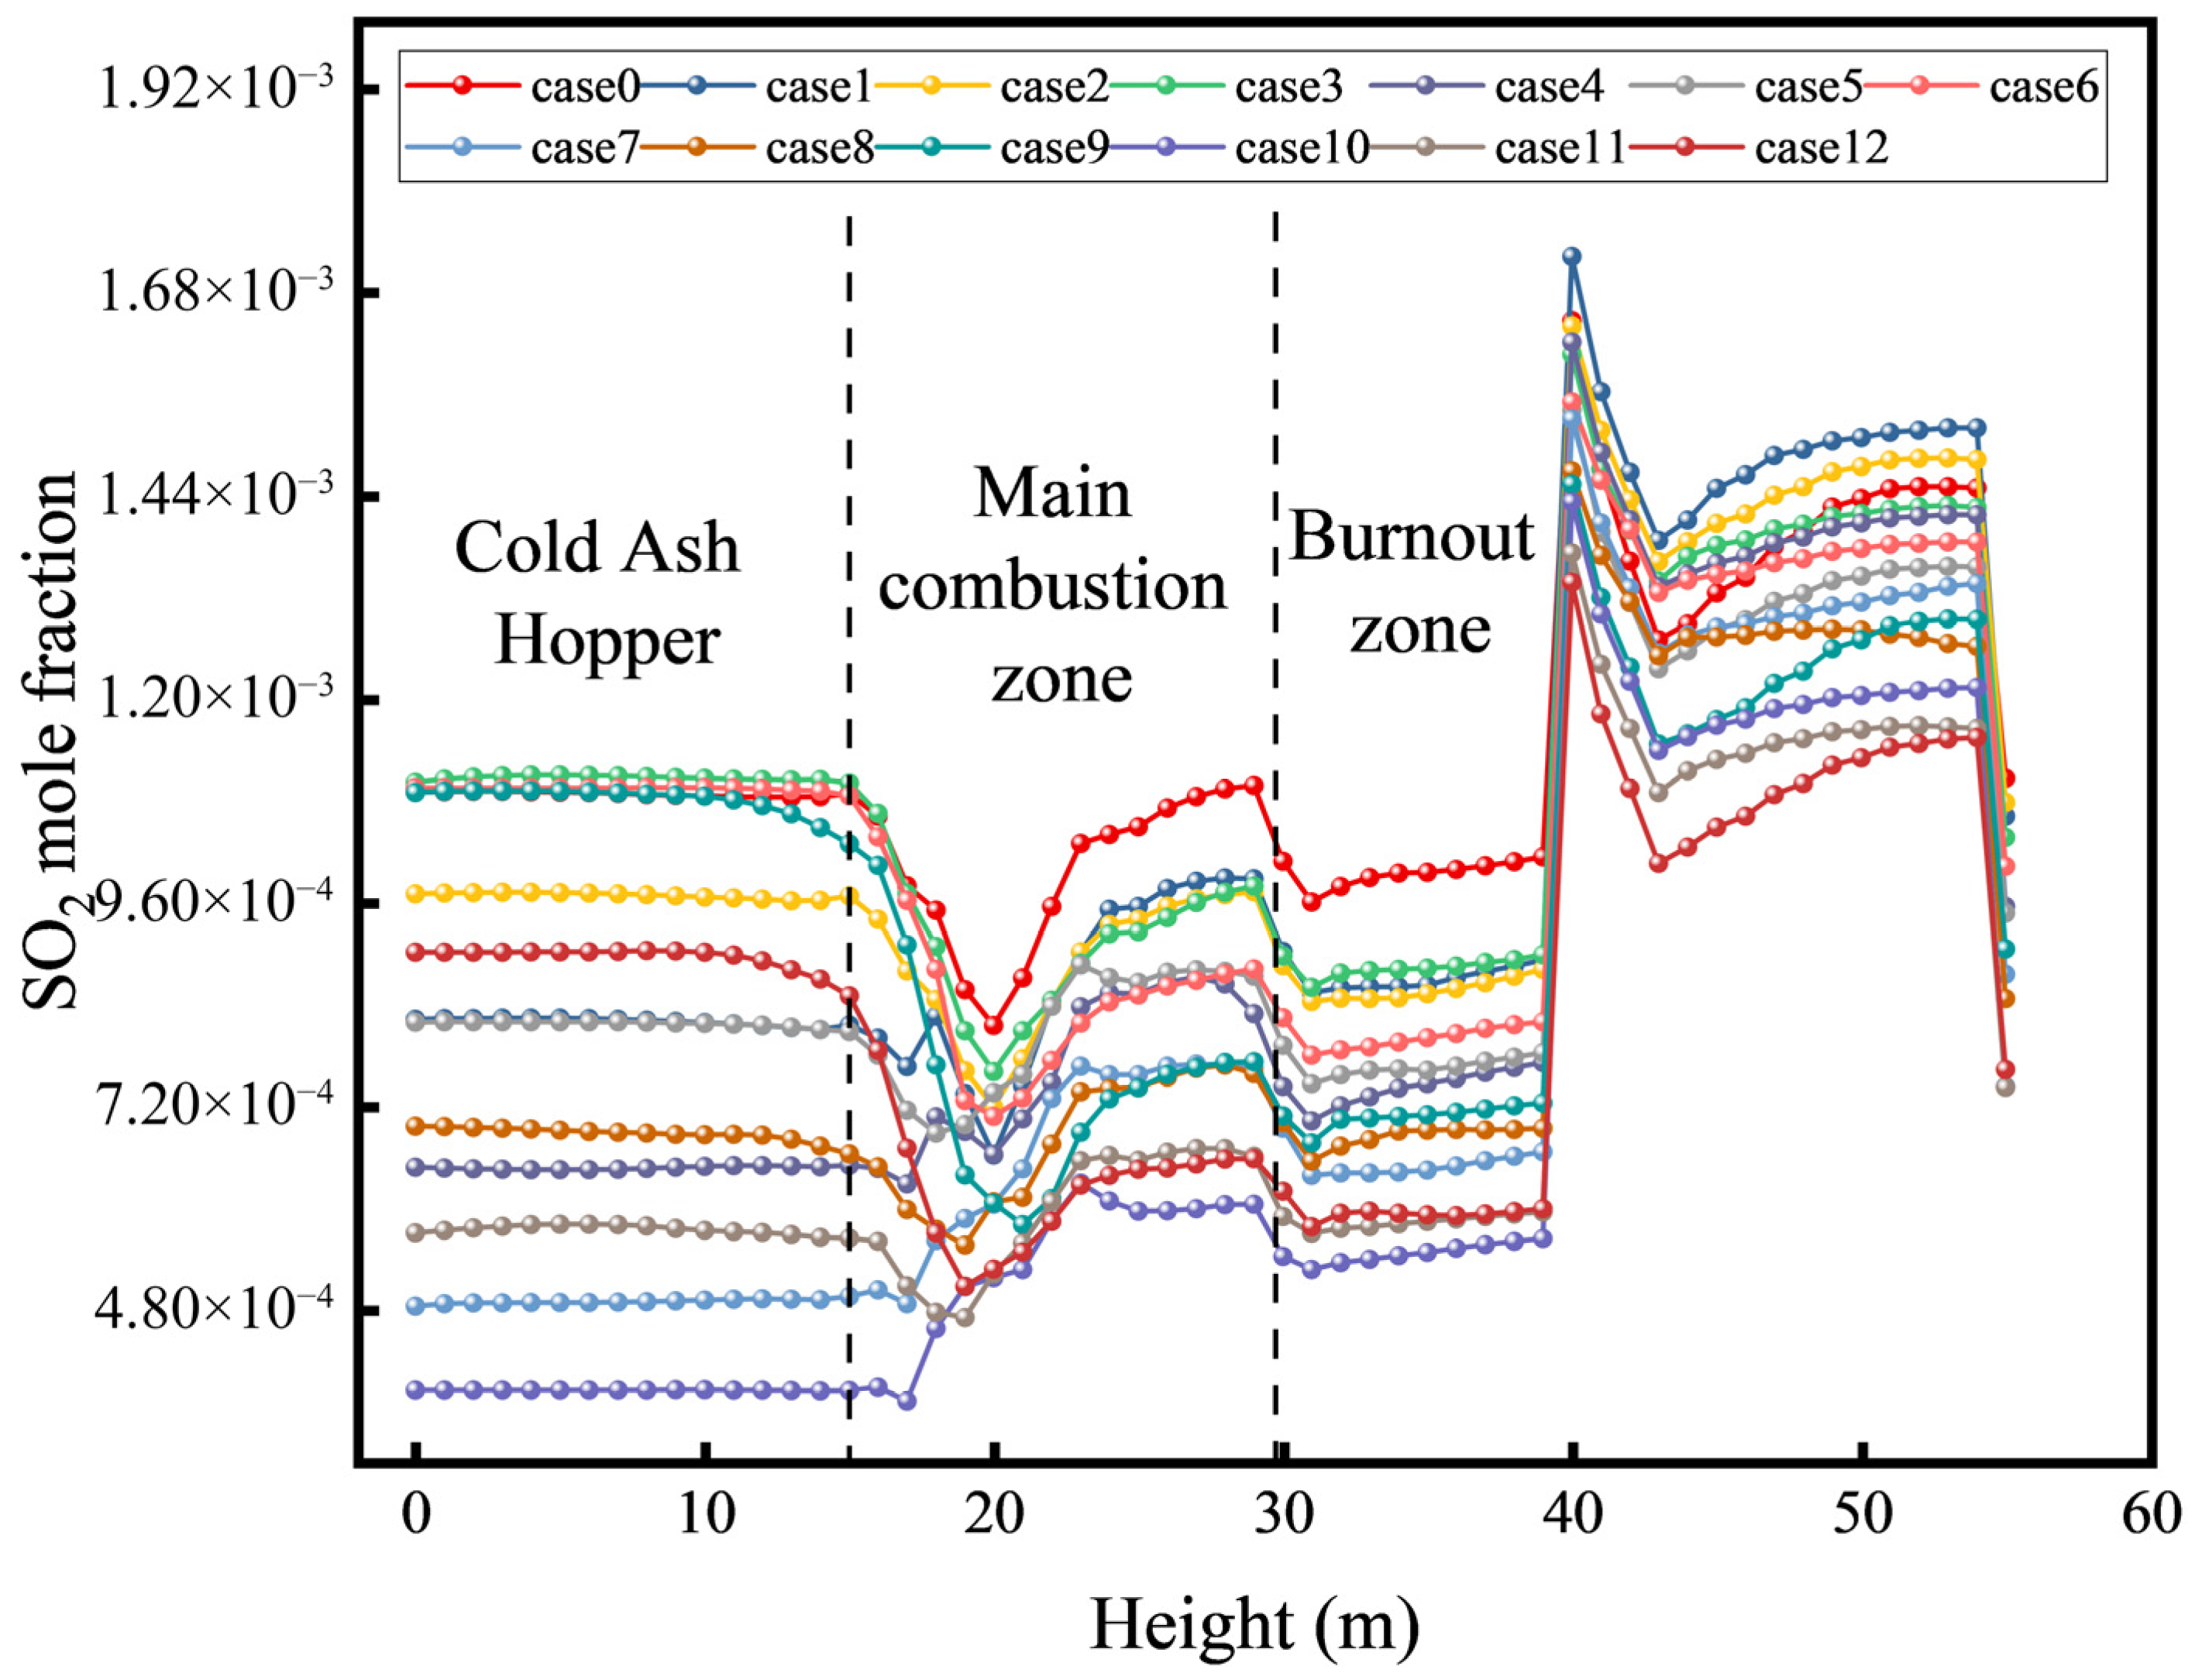
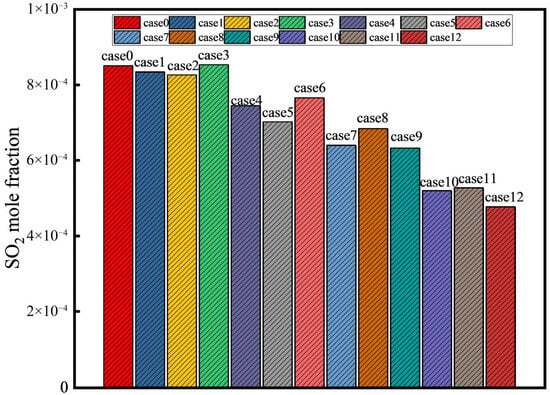
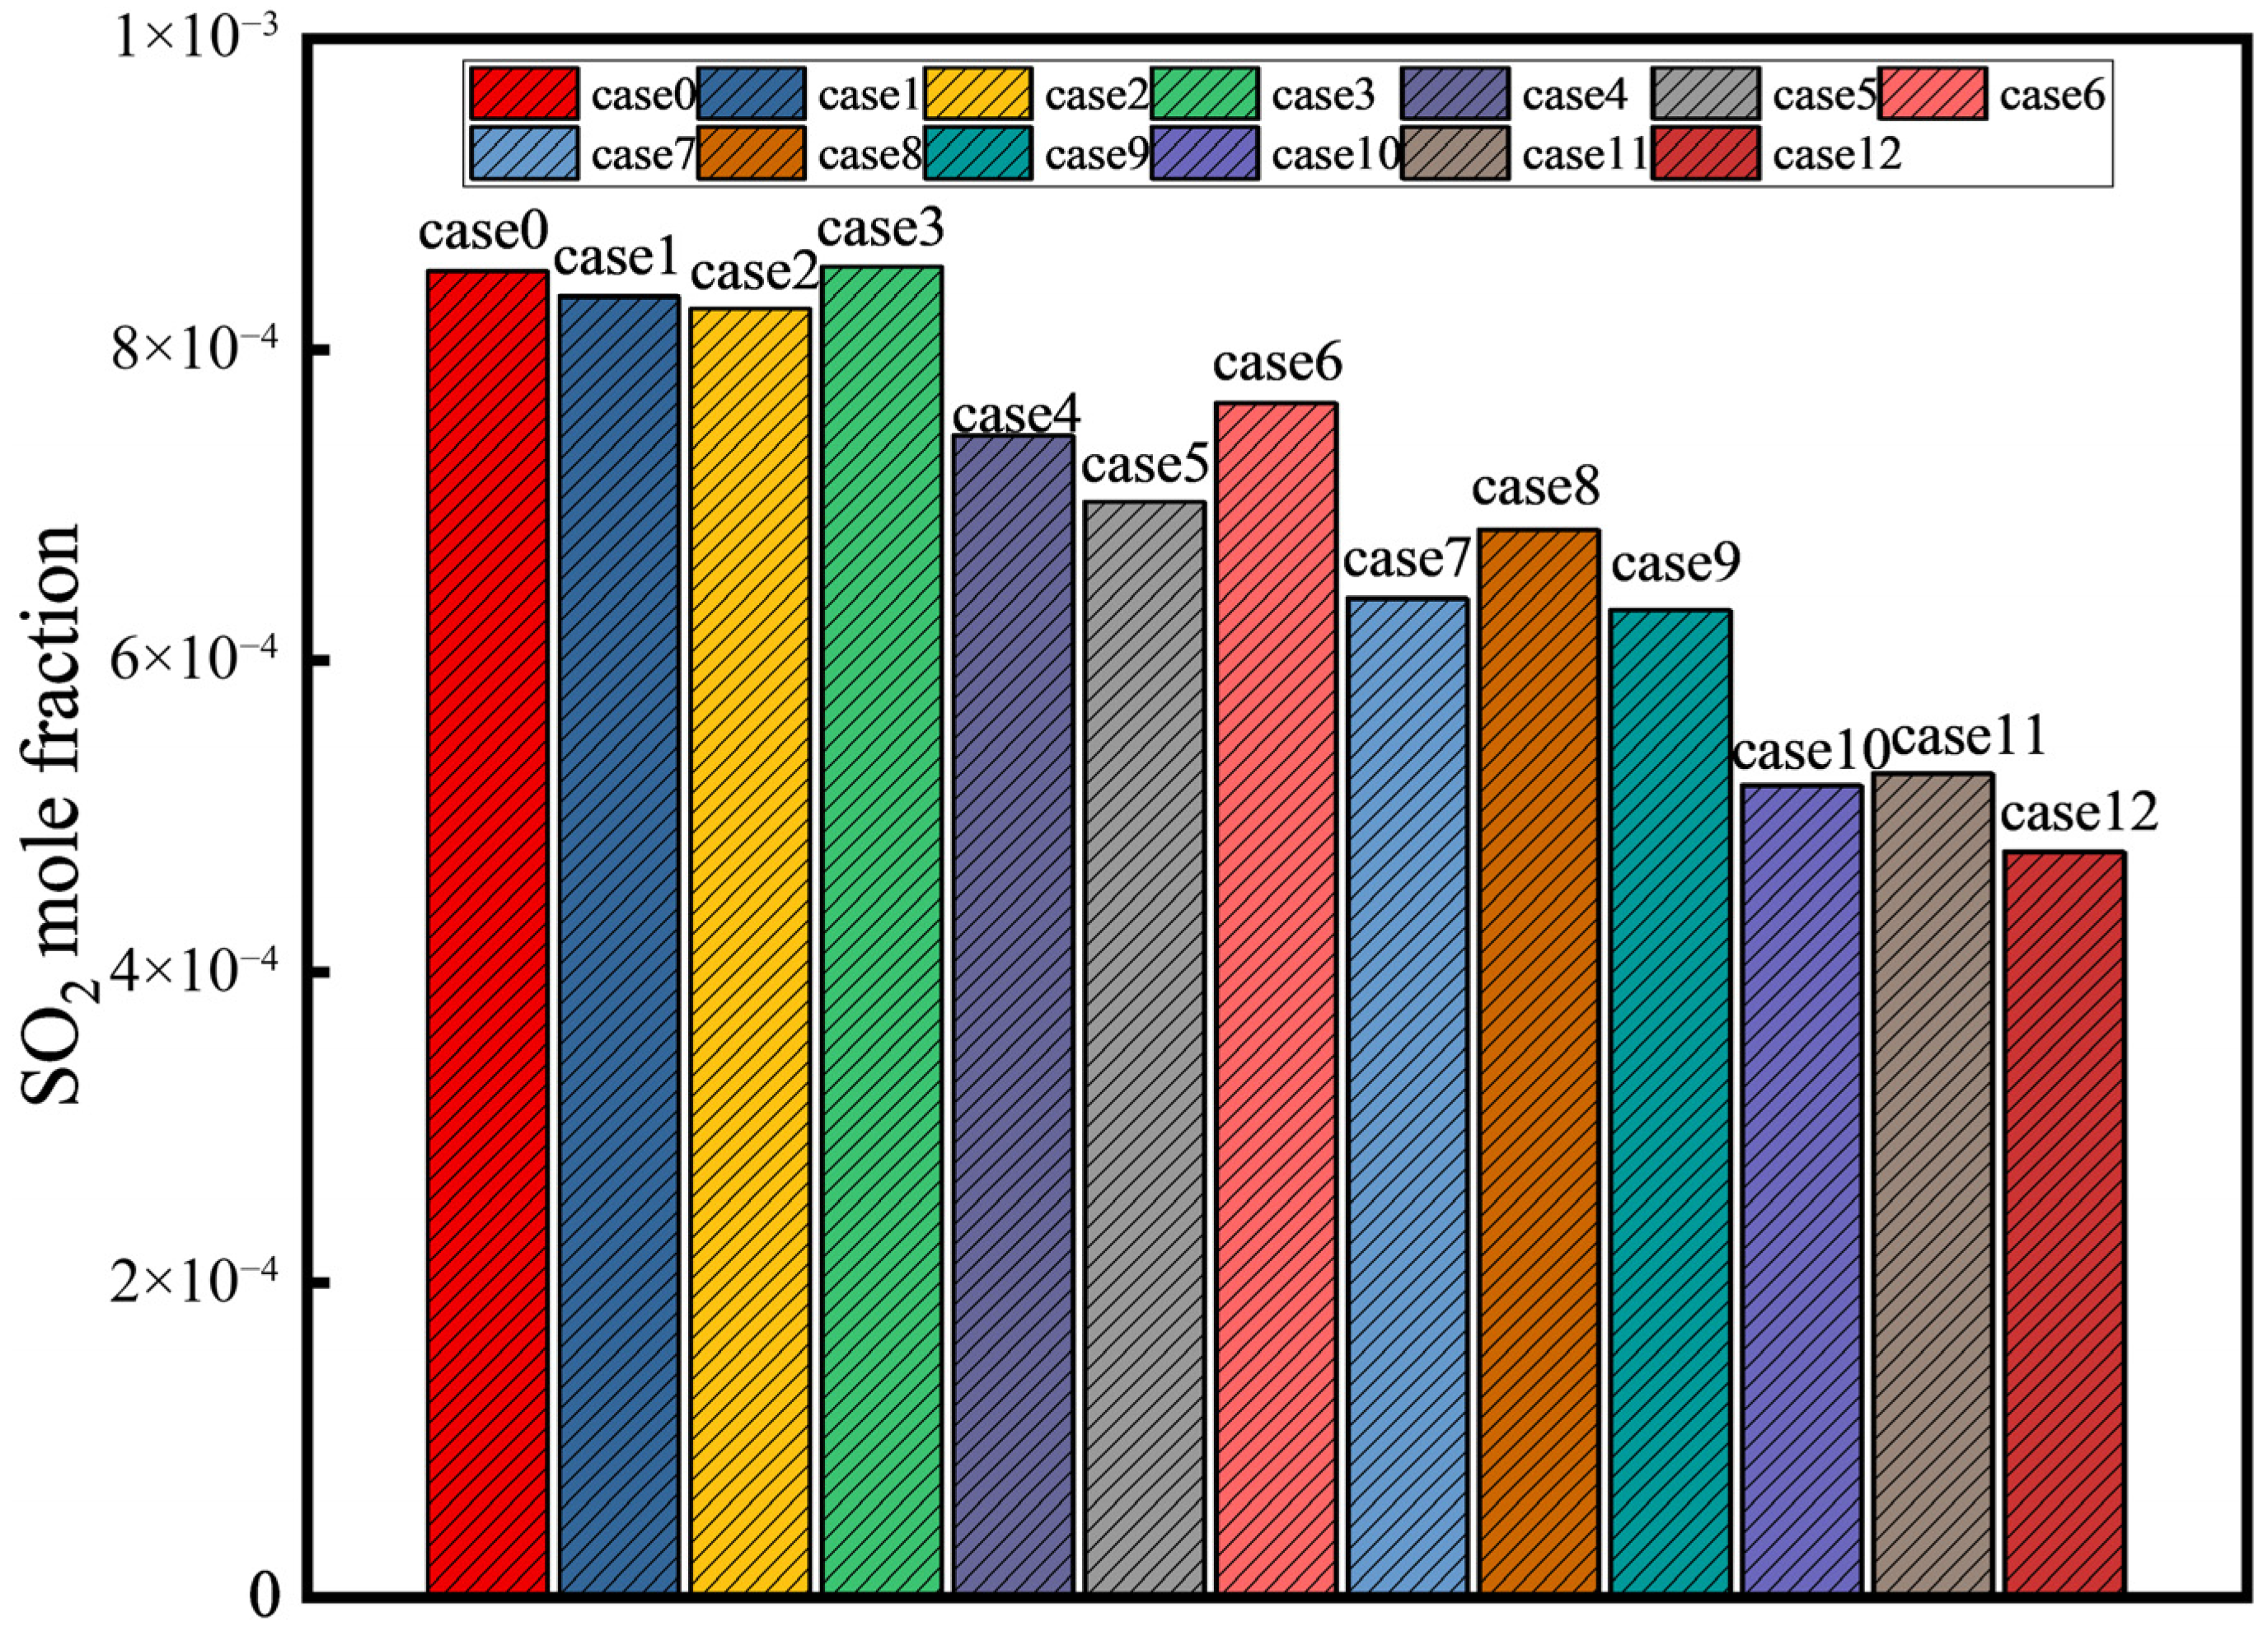
Figure 17 and Figure 18 show the cross-section area-weighted mean SO2 molar fraction along the furnace height and the mass-weighted mean SO2 molar fraction at the furnace outlet, respectively. Sulfur released from coal combustion is oxidized to SO2. In the pure-coal case, SO2 formation mainly occurs in the coal flame zone; thereafter, SO2 undergoes little secondary reaction in the flue gas, and its concentration changes only slightly along the gas path. After ammonia is introduced, because ammonia contains no sulfur, the total sulfur input decreases approximately linearly with the ammonia fraction; consequently, both SO2 formation and the outlet SO2 concentration are markedly lower than those under pure-coal firing.
Figure 17.
Cross-section area-weighted mean SO2 molar fraction distribution along the furnace height.
Figure 18.
Mass-weighted mean SO2 molar fraction distribution at the furnace outlet.
From a spatial perspective, ammonia co-firing mainly influences SO2 formation in the reaction zones: wherever coal at a given burner level is replaced by ammonia, the SO2 concentration at the corresponding height decreases markedly. With B-port injection, SO2 formation in the lower flame region is clearly lower than that under pure-coal firing. With D-port injection, the SO2 produced by the upper-level coal flame is greatly reduced, and the SO2 level throughout the furnace is nearly lower than the pure-coal baseline at almost all heights. This SO2 reduction becomes more pronounced as the ammonia fraction increases. In the 40% co-firing case, the outlet SO2 concentration can be reduced by nearly 40% compared with pure-coal firing. In addition, an ammonia addition may slightly alter sulfur oxidation pathways: because ammonia combustion produces substantial H2O, the increased flue-gas moisture may facilitate partial conversion of SO2 to SO3 and subsequent reactions with NH3 to form ammonium sulfate salts. However, these are secondary processes occurring in the downstream flue-gas path, and they are not directly reflected in the in-furnace SO2 distribution. From the perspective of in-furnace processes, ammonia co-firing can be confirmed to substantially suppress SO2 emissions, which is environmentally beneficial in practical applications.
Under a 30% load, the ammonia–coal co-firing cases demonstrate that a temperature reduction and air staging are beneficial for suppressing thermal NOx, while an appropriately staged ammonia injection can create a reducing atmosphere that mitigates fuel NOx. Meanwhile, SO2 and CO2 decrease substantially with increasing ammonia substitution, indicating that ammonia co-firing offers both opportunities and challenges for emission reduction, and its environmental benefits need to be realized through optimized operational control in practice.
4. Conclusions
This study investigated ammonia–coal co-firing in a corner-tangentially fired pulverized-coal boiler at a 30% rated load and provides a systematic assessment of how the ammonia co-firing ratio and injection location influence in-furnace combustion processes and emission characteristics.
As the ammonia fraction increased from 0% to 40%, the overall temperature level in the main combustion zone decreased; the high-temperature core contracted and its spatial structure was reshaped, and the dominant reactions tended to shift downstream. Moving the ammonia injection location upward increased the ignition distance and intensified the ignition delay. In particular, upper-level ammonia injection more readily induced secondary combustion hot spots in the furnace tail region, making heat release more evidently delayed and dispersed.
With increasing ammonia substitution, CO2 and SO2 emissions decreased accordingly, consistent with the source-term reduction of carbon and sulfur inputs. NO exhibited a pronounced nonlinear response and was highly sensitive to the injection location. Mid- to lower injection levels more readily sustained a continuous flame and locally oxygen-lean reducing conditions in the main combustion zone, allowing NO to decrease at high co-firing ratios. In contrast, upper-level injection relied more strongly on an appropriate temperature window in the downstream furnace, where NO is more prone to rise again in the upper region and may be accompanied by an increased risk of ammonia slip.
Whether high-ratio ammonia co-firing can simultaneously ensure combustion stability and NO control depends less on the co-firing ratio alone than on the coupled effects of the injection location and staged-air supply on the in-furnace oxygen availability and temperature window. Future work should focus on air-staging strategies under low-load transient operation, the coupled constraints between ammonia slip and the downstream DeNOx temperature window, and the thermal maldistribution of heat-transfer surfaces associated with downstream secondary combustion in the furnace tail region.
Author Contributions
Methodology, investigation, and writing—original draft, G.Z.; data curation and visualization, C.Z.; writing—original draft, M.X.; writing—review and editing and software, Z.H.; conceptualization and funding acquisition, Q.W.; conceptualization and funding acquisition, X.W.; writing—review and editing, Y.W.; writing—review and editing, H.L. All authors have read and agreed to the published version of the manuscript.
Funding
The authors appreciate the financial support from the research and demonstration of key technologies for co-firing green ammonia in large utility pulverized-coal boilers (2025-005-KJ-DBGS).
Data Availability Statement
The original contributions presented in the study are included in the article; further inquiries can be directed to the corresponding author.
Acknowledgments
During the preparation of this manuscript, the authors used ChatGPT (OpenAI, GPT-5.2) for language polishing, restructuring of sentences, and assistance in improving the clarity and coherence of the text. The authors have reviewed, verified, and edited all AI-generated content and take full responsibility for the scientific accuracy and originality of this work.
Conflicts of Interest
Authors Guang Zeng, Mobei Xu, Chuang Zhou were employed by the SPIC Northeast Energy Technology Co., Ltd. The remaining authors declare that the research was conducted in the absence of any commercial or financial relationships that could be construed as a potential conflict of interest.
Nomenclature
| Symbol | Full name |
| PA | Primary air |
| SA | Secondary air |
| OFA | Overfire air |
| NH3 | Ammonia |
| NOx | Nitrogen oxides |
| NO | Nitric oxide |
| CmHn | Generic hydrocarbon species |
| LHV | Lower heating value |
| RANS | Reynolds-averaged Navier–Stokes |
| SWF | Standard wall functions |
| DPM | Discrete phase model |
| FR/ED | Finite-rate/eddy-dissipation |
| Mar | Moisture on as-received basis |
| Aar | Ash on as-received basis |
| Var | Volatile matter on as-received basis |
| FCar | Fixed carbon on as-received basis |
| Car | Carbon on as-received basis |
| Har | Hydrogen on as-received basis |
| Oar | Oxygen on as-received basis |
| Nar | Nitrogen on as-received basis |
| Sar | Sulfur on as-received basis |
References
- Pathak, P.K.; Yadav, A.K.; Padmanaban, S. Transition toward emission-free energy systems by 2050: Potential role of hydrogen. Int. J. Hydrogen Energy 2023, 48, 9921–9927. [Google Scholar] [CrossRef] [Scilit]
- Xu, J.; Zhang, Q.; Ye, N.; Zhang, Z.; Wu, X.; Fan, H. A review on flexible peak shaving development of coal-fired boilers in China under the carbon peak and carbon neutrality goals. Therm. Sci. Eng. Prog. 2024, 55, 103004. [Google Scholar] [CrossRef] [Scilit]
- Lu, X.; McElroy, M.B.; Peng, W.; Liu, S.; Nielsen, C.P.; Wang, H. Challenges faced by China compared with the US in developing wind power. Nat. Energy 2016, 1, 16061. [Google Scholar] [CrossRef] [Scilit]
- Lin, Q.; Sun, W.; Li, H.; Liu, Y.; Chen, Y.; Liu, C.; Jiang, Y.; Cheng, Y.; Ma, N.; Ya, H.; et al. Experimental Study on Ammonia Co-Firing with Coal for Carbon Reduction in the Boiler of a 300-MW Coal-Fired Power Station. Engineering 2024, 40, 247–259. [Google Scholar] [CrossRef] [Scilit]
- Zhao, Y.; Setzler, B.P.; Wang, J.; Nash, J.; Wang, T.; Xu, B.; Yan, Y. An Efficient Direct Ammonia Fuel Cell for Affordable Carbon-Neutral Transportation. Joule 2019, 3, 2472–2484. [Google Scholar] [CrossRef] [Scilit]
- Sun, Y.; Li, Z.; Wang, Q.; Zhang, J.; Kong, H. Low carbon pathway and life cycle assessment of ammonia co-firing in coal power plants under the context of carbon neutrality. Energy Convers. Manag. 2023, 296, 117648. [Google Scholar] [CrossRef] [Scilit]
- Guo, L.; Zhu, Y.; Li, D.; Sun, W.; Shi, Y.; Liu, C.; Zhang, H.; Liu, X.; Han, J.; Guo, Y.; et al. Study on the combustion characteristics and reaction mechanism of high-reactive-fuels-blended ammonia. J. Energy Inst. 2025, 123, 102270. [Google Scholar] [CrossRef] [Scilit]
- Li, J.; Lai, S.; Chen, D.; Wu, R.; Kobayashi, N.; Deng, L.; Huang, H. A Review on Combustion Characteristics of Ammonia as a Carbon-Free Fuel. Front. Energy Res. 2021, 9, 760356. [Google Scholar] [CrossRef] [Scilit]
- Tamura, M.; Gotou, T.; Ishii, H.; Riechelmann, D. Experimental investigation of ammonia combustion in a bench scale 1.2 MW-thermal pulverised coal firing furnace. Appl. Energy 2020, 277, 115580. [Google Scholar] [CrossRef] [Scilit]
- Wei, Y.; Xi, Z.; Xia, Y.; Cai, J.; Li, Z.; Lu, Z.; Yao, S. NH3/coal co-firing: Effects on N transfer, char combustion, and ash transformation via TG-FTIR experiments. Sustain. Energy Technol. Assess. 2025, 74, 104168. [Google Scholar] [CrossRef] [Scilit]
- Wang, Y.; Xu, Y.; Quan, Y.; Hong, D.; Wang, H.; Zhang, A.; Liu, X. Effects of char on ammonia–nitrogen conversion and NO formation in ammonia-coal co-firing: Experimental and molecular dynamics simulation study based on ash-free model char. Fuel 2026, 408, 137685. [Google Scholar] [CrossRef] [Scilit]
- Wang, X.; Fan, W.; Chen, J.; Zhang, H. Experimental study and kinetic analysis of NO emission characteristics in ammonia/coal co-firing process with different ammonia injection methods. J. Energy Inst. 2024, 114, 101609. [Google Scholar] [CrossRef] [Scilit]
- Ruan, R.; Hua, W.; Xu, X.; Zhang, K.; Wang, D.; Hu, J.; Cui, B.; Zhang, Y.; Wang, G.; Su, M.; et al. Effects of ammonia co-firing on the formation of fine particles during staged gasification-combustion of coal. Fuel 2025, 399, 135689. [Google Scholar] [CrossRef] [Scilit]
- Liu, H.; Zhang, H.; Wang, C.; Si, T.; Zou, C.; Xu, L. Effect of ammonia blending on the emission behavior of NOx during coal combustion: A global meta-analysis. J. Energy Inst. 2025, 121, 102182. [Google Scholar] [CrossRef] [Scilit]
- Wang, X.; Fan, W.; Chen, J.; Feng, G.; Zhang, X. Experimental study on effects of air-staged strategy and NH3 co-firing ratios on NO formation characteristics in ammonia/coal co-firing process. Fuel 2023, 332, 126217. [Google Scholar] [CrossRef] [Scilit]
- Tan, J.; He, Y.; Zhu, R.; Zhu, Y.; Wang, Z. Experimental study on co-firing characteristics of ammonia with pulverized coal in a staged combustion drop tube furnace. Proc. Combust. Inst. 2023, 39, 3217–3225. [Google Scholar] [CrossRef] [Scilit]
- Wu, X.; Hu, F.; Ding, C.; Yang, Y.; Yang, C.; Liao, H.; Lu, K.; Li, B.; Liu, T.; Liu, C.; et al. Progress in numerical simulations and fundamental characteristics of pulverized coal co-firing with ammonia. Int. J. Hydrogen Energy 2024, 82, 740–758. [Google Scholar] [CrossRef] [Scilit]
- Zhang, J.; Ito, T.; Ishii, H.; Ishihara, S.; Fujimori, T. Numerical investigation on ammonia co-firing in a pulverized coal combustion facility: Effect of ammonia co-firing ratio. Fuel 2020, 267, 117166. [Google Scholar] [CrossRef] [Scilit]
- Wang, Y.; He, Y.; Weng, W.; Wang, Z. Numerical simulation of ammonia combustion with coal in a 135 MW tangentially fired boiler. Fuel 2024, 370, 131831. [Google Scholar] [CrossRef] [Scilit]
- Liu, M.; Chen, S.; Zhu, H.; Xu, J. Numerical study on flame structure and NOx generation under different Coal/NH3 co-firing strategies in a 1000 MW utility boiler. J. Energy Inst. 2025, 119, 101957. [Google Scholar] [CrossRef] [Scilit]
- Jin, W.; Si, F.; Cao, Y.; Yu, C.; Wang, J. Numerical research on ammonia-coal co-firing in a 1050 MW coal-fired utility boiler under ultra-low load: Effects of ammonia ratio and air staging condition. Appl. Therm. Eng. 2023, 233, 121100. [Google Scholar] [CrossRef] [Scilit]
- Wei, D.; Wu, L.; Wang, T.; Sun, B. Numerical simulation of ammonia combustion with sludge and coal in a utility boiler: Influence of ammonia distribution. J. Energy Inst. 2023, 111, 101409. [Google Scholar] [CrossRef] [Scilit]
- Chae, T.; Sim, W.; Lee, J.W.; Yang, W.; Baek, S.; Park, K. An experimental study on optimization of ammonia co-firing in an 80kWth pulverized coal combustion system. Fuel 2025, 380, 132740. [Google Scholar] [CrossRef] [Scilit]
- Ma, L.; Fang, Q.; Zhang, C.; Chen, G.; Wang, X. Combustion and NO formation characteristics of pulverized coal co-firing with ammonia in a deep-air staging condition. Clean Coal Technol. 2022, 28, 201–213. [Google Scholar] [CrossRef]
- Miller, J.A.; Bowman, C.T. Mechanism and modeling of nitrogen chemistry in combustion. Prog. Energy Combust. Sci. 1989, 15, 287–338. [Google Scholar] [CrossRef] [Scilit]
- De Soete, G.G. Overall reaction rates of NO and N2 formation from fuel nitrogen. Symp. (Int.) Combust. 1975, 15, 1093–1102. [Google Scholar] [CrossRef] [Scilit]
- Sun, S.; Zhang, J.; Hu, X.; Wu, S.; Yang, J.; Wang, Y.; Qin, Y. Studies of NO−Char Reaction Kinetics Obtained from Drop-Tube Furnace and Thermogravimetric Experiments. Energy Fuels 2009, 23, 74–80. [Google Scholar] [CrossRef] [Scilit]
- Smoot, D.L.; Smith, J.P. Coal Combustion and Gasification; Springer: Berlin/Heidelberg, Germany, 1985; Volume 41, p. 3235. [Google Scholar]
- Andersen, J.; Rasmussen, C.L.; Giselsson, T.; Glarborg, P. Global Combustion Mechanisms for Use in CFD Modeling under Oxy-Fuel Conditions. Energy Fuels 2009, 23, 1379–1389. [Google Scholar] [CrossRef] [Scilit]
- Jones, W.P.; Lindstedt, R.P. Global reaction schemes for hydrocarbon combustion. Combust. Flame 1988, 73, 233–249. [Google Scholar] [CrossRef] [Scilit]
- Kim, J.P.; Schnell, U.; Scheffknecht, G. Comparison of Different Global Reaction Mechanisms for MILD Combustion of Natural Gas. Combust. Sci. Technol. 2008, 180, 565–592. [Google Scholar] [CrossRef] [Scilit]
- Field, M.A. Rate of combustion of size-graded fractions of char from a low-rank coal between 1200 °K and 2000 °K. Combust. Flame 1969, 13, 237–252. [Google Scholar] [CrossRef] [Scilit]
- Smoot, L.D.; Pratt, D.T. Pulverized-Coal Combustion and Gasification: Theory and Applications for Continuous Flow Processes; Plenum Press: New York, NY, USA, 1979. [Google Scholar]
- Monnery, W.D.; Hawboldt, K.A.; Pollock, A.E.; Svrcek, W.Y. Ammonia pyrolysis and oxidation in the Claus furnace. Ind. Eng. Chem. Res. 2001, 40, 144–151. [Google Scholar] [CrossRef] [Scilit]
- Brouwer, J.; Heap, M.P.; Pershing, D.W.; Smith, P.J. A model for prediction of selective noncatalytic reduction of nitrogen oxides by ammonia, urea, and cyanuric acid with mixing limitations in the presence of co. Symp. (Int.) Combust. 1996, 26, 2117–2124. [Google Scholar] [CrossRef] [Scilit]
- Badzioch, S.; Hawksley, P.G.W. Kinetics of Thermal Decomposition of Pulverized Coal Particles. Ind. Eng. Chem. Process Des. Dev. 1970, 9, 521–530. [Google Scholar] [CrossRef] [Scilit]
- Xiao, Y.; Cui, J.; Pan, H.; Zhu, L.; Xu, B.; Yang, X.; Zhao, H.; Yang, S.; Zhao, Y.; Wirsum, M.; et al. Investigation of Ammonia-Coal Co-Combustion Performance and NOx Formation Mechanisms Under Varied Ammonia Injection Strategies. Energies 2025, 18, 5609. [Google Scholar] [CrossRef] [Scilit]

Disclaimer/Publisher’s Note: The statements, opinions and data contained in all publications are solely those of the individual author(s) and contributor(s) and not of MDPI and/or the editor(s). MDPI and/or the editor(s) disclaim responsibility for any injury to people or property resulting from any ideas, methods, instructions or products referred to in the content. |
© 2026 by the authors. Licensee MDPI, Basel, Switzerland. This article is an open access article distributed under the terms and conditions of the Creative Commons Attribution (CC BY) license.