


Abstract
Gas bubble accumulation and transport play a critical role in the electrochemical performance and reaction uniformity of proton exchange membrane water electrolysis (PEMWE), particularly at high current density. However, the quantitative coupling between bubble coverage and local electrochemical activity remains insufficiently clarified. In this work, a visualization PEMWE combined with a printed circuit board (PCB)-based segmented measurement technique was developed to simultaneously characterize the spatial distributions of bubble coverage and local current density (LCD) under different current densities and operating temperatures. The results showed that both bubble coverage and LCD exhibited pronounced in-plane non-uniformity. The LCD generally displayed lower values in the central region and higher values near the edges, whereas high bubble coverage regions were mainly concentrated in the central and outlet-side areas. As the average current density increased from 0.5 A/cm2 to 2.0 A/cm2, the LCD range expanded from 0.43 to 0.53 A/cm2 to 1.75–2.20 A/cm2, while the local bubble coverage increased from 0.24 to 0.34 to 0.86–0.91. A clear negative spatial correlation between bubble coverage and LCD was identified, and this correlation became stronger with increasing current density. Moreover, the correlation exhibited marked spatial dependence, following the E5 > C3 > E1 > A5 > A1 order. Increasing the operating temperature from 50 to 70 °C alleviated the local heterogeneity, but it did not alter the fundamental coupling trend. These results demonstrate that bubble accumulation is a key factor governing current redistribution and local reaction non-uniformity in PEMWE, and they provide guidance for flow field optimization and high current density operation.
1. Introduction
Driven by the increasing demand for carbon emission reduction and low-carbon development, renewable energy sources such as wind and solar power have expanded rapidly [1]. However, the intermittency, randomness, and volatility of renewable energy pose significant challenges for direct storage and utilization. Therefore, an effective energy carrier is urgently needed to enable stable and flexible energy conversion. Hydrogen, with its zero emissions, high calorific value, and flexible convertibility, is widely regarded as a promising energy carrier for future energy systems [2,3]. Hydrogen production is a core technology within the broader field of hydrogen energy research. Among the existing water electrolysis hydrogen production technologies, PEMWE offers distinct advantages, including high operating current density, high hydrogen purity, compact system design, and high energy efficiency [4,5]. In particular, its rapid dynamic response to power fluctuations makes PEMWE highly suitable for coupling with variable renewable energy sources, drawing increasing global attention [6,7].
Recent investigations have shown that challenges in PEMWE—such as excessive bubble coverage, delayed bubble release, limited nucleation sites, and gas buildup—trigger a cascade of negative consequences, including impaired mass transport, reduced catalyst utilization, and fluctuating cell performance [8,9,10,11]. Therefore, effective bubble management is essential for improving the PEMWE performance. Numerical simulations have been widely used to examine bubble formation, transport, and distribution in PEMWE. These simulations help clarify the underlying mechanisms of internal bubble transport [12,13]. However, due to the inherent complexity of water transport processes, numerical simulation models often suffer from incomplete physical descriptions, which can substantially compromise the reliability of their predictions. Therefore, it is crucial to obtain bubble distribution data through experimental methods that enable more intuitive and accurate observation. At present, the primary techniques used to visualize bubble morphology in PEMWE systems include X-ray imaging [14], neutron imaging [15], and optical imaging [16].
Optical imaging technology is a common experimental method for investigating the visualization of bubbles in electrolysis, characterized by low equipment cost, simple and convenient testing procedures, and broader applicability compared to other visualization techniques. Researchers have conducted a large number of innovative experiments using a structure combining transparent end plates with bipolar plates. The study explores the effects of various factors on two-phase flow, including porous transport layers [17], flow field configurations [18], deionized water flow rates [19,20,21], cell temperature [19,21], current density [19], vibration frequency [20], bolt preload and tightening sequence [22], and ultrasonic treatment [23]. Although significant progress has been made in bubble management research for PEMWE in recent years, most of these studies remain qualitative, and quantifying the formation and transport of bubbles remains challenging. Meanwhile, since the transport of localized bubbles affects the local performance of PEMWE, further exploration of the formation and transport of localized bubbles is still required.
LCD measurement is a crucial component for evaluating the performance and durability characteristics of electrolytic cells. In the research on current density distribution, PCB-based segmented technology has been widely applied in studies on fuel cell water management, durability, and fuel starvation [24,25,26,27]. However, research on LCD measurement in PEMWE remains insufficiently systematic and in-depth. Dedigama et al. [28] first demonstrated the combination of LCD distribution and flow visualization in PEMWE. Researchers [29] observed the local current distribution and local impedance of a single-channel PEMWE, analyzing detailed potential performance losses under water-deficient conditions in segmented PEMWE with low stoichiometric water ratios. Saher et al. [30] confirmed that the heterogeneity of local current distribution in PEMWE has a significant impact on its degradation. Zhang et al. [31] found that electrolytic current density increases with voltage, and changes in two-phase flow patterns lead to enhanced inhomogeneity. Anirban et al. [32] proposed the effective water transport number as a quantitative tool for such current density distribution measurements in PEMWE research. Wang et al. [33] measured the in-plane temperature and current density in the flow field. Their results show that the interdigitated design offers better temperature stability and a more uniform current distribution. Taking specific operating conditions as examples, they conducted a detailed analysis of the dynamic behavior and heterogeneity evolution of current and temperature distributions [34]. Ma et al. [35] developed a PEMWE with visualization functions and a segmented anode flow field whose design enables real-time monitoring of key local physicochemical parameters and two-phase flow patterns. Benjamin et al. [36] developed segmented bipolar plates that allow local measurements of current and temperature, and the clamping pressure caused by uneven torque can be determined using these segmented bipolar plates. Therefore, it is still unclear under which operating conditions bubbles exert the strongest influence on local electrochemical activity and how this effect varies with spatial position.
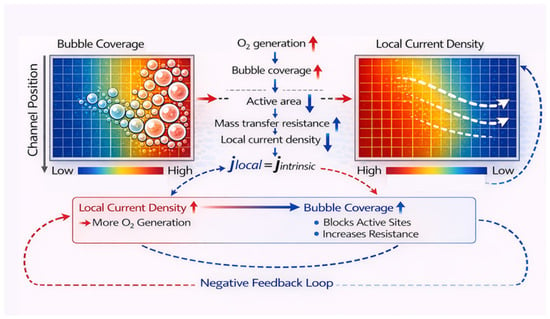
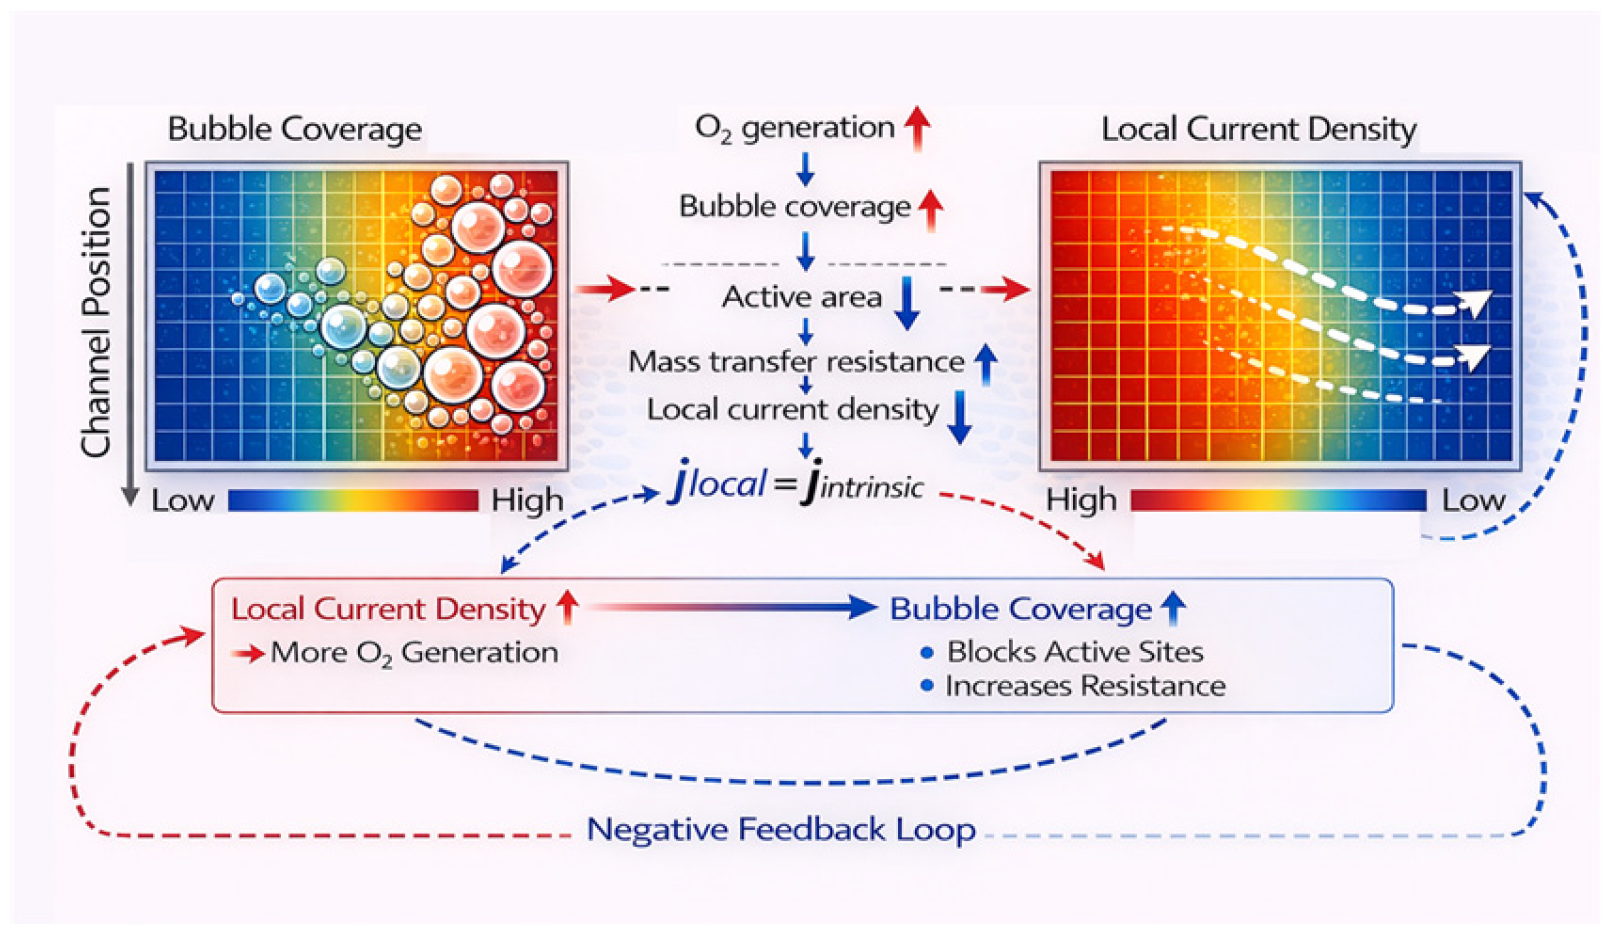
Although visualization and segmented current measurement have both been reported in previous PEMWE studies, a full active area, segmentation-resolved quantitative framework for directly linking local bubble coverage with local electrochemical response is still lacking. To address this gap, the conceptual relationship between bubble coverage and local current density in PEMWE is illustrated in Figure 1. In this work, a spatially co-registered visualization–segmentation PEMWE platform was developed to simultaneously obtain the distributions of bubble coverage and local current density under different temperatures and current densities. By mapping the optical bubble field and the PCB-derived current field onto the same 5 × 5 segmentation grid, one-to-one paired data were established for each local region. Based on this framework, the polarization behavior of the PEMWE was first analyzed under different operating conditions, followed by a comparison of the distribution characteristics and in-plane uniformities of LCD and bubble coverage. The overall correlation between the two distributions and its spatial variation at representative flow field locations were then quantitatively evaluated. This work aims to clarify not only whether bubble accumulation affects local electrochemical activity, but also under which operating conditions and at which spatial locations this coupling becomes most significant, thereby providing guidance for flow field optimization and stable high current density operation of PEMWE.
Figure 1.
Schematic conceptualization of the relationship between the bubble and current density.
2. Experimental Setup
2.1. Design and Segmentation Scheme of PEMWE
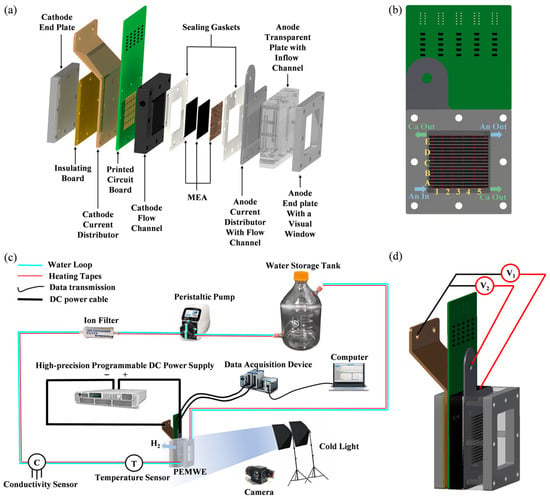
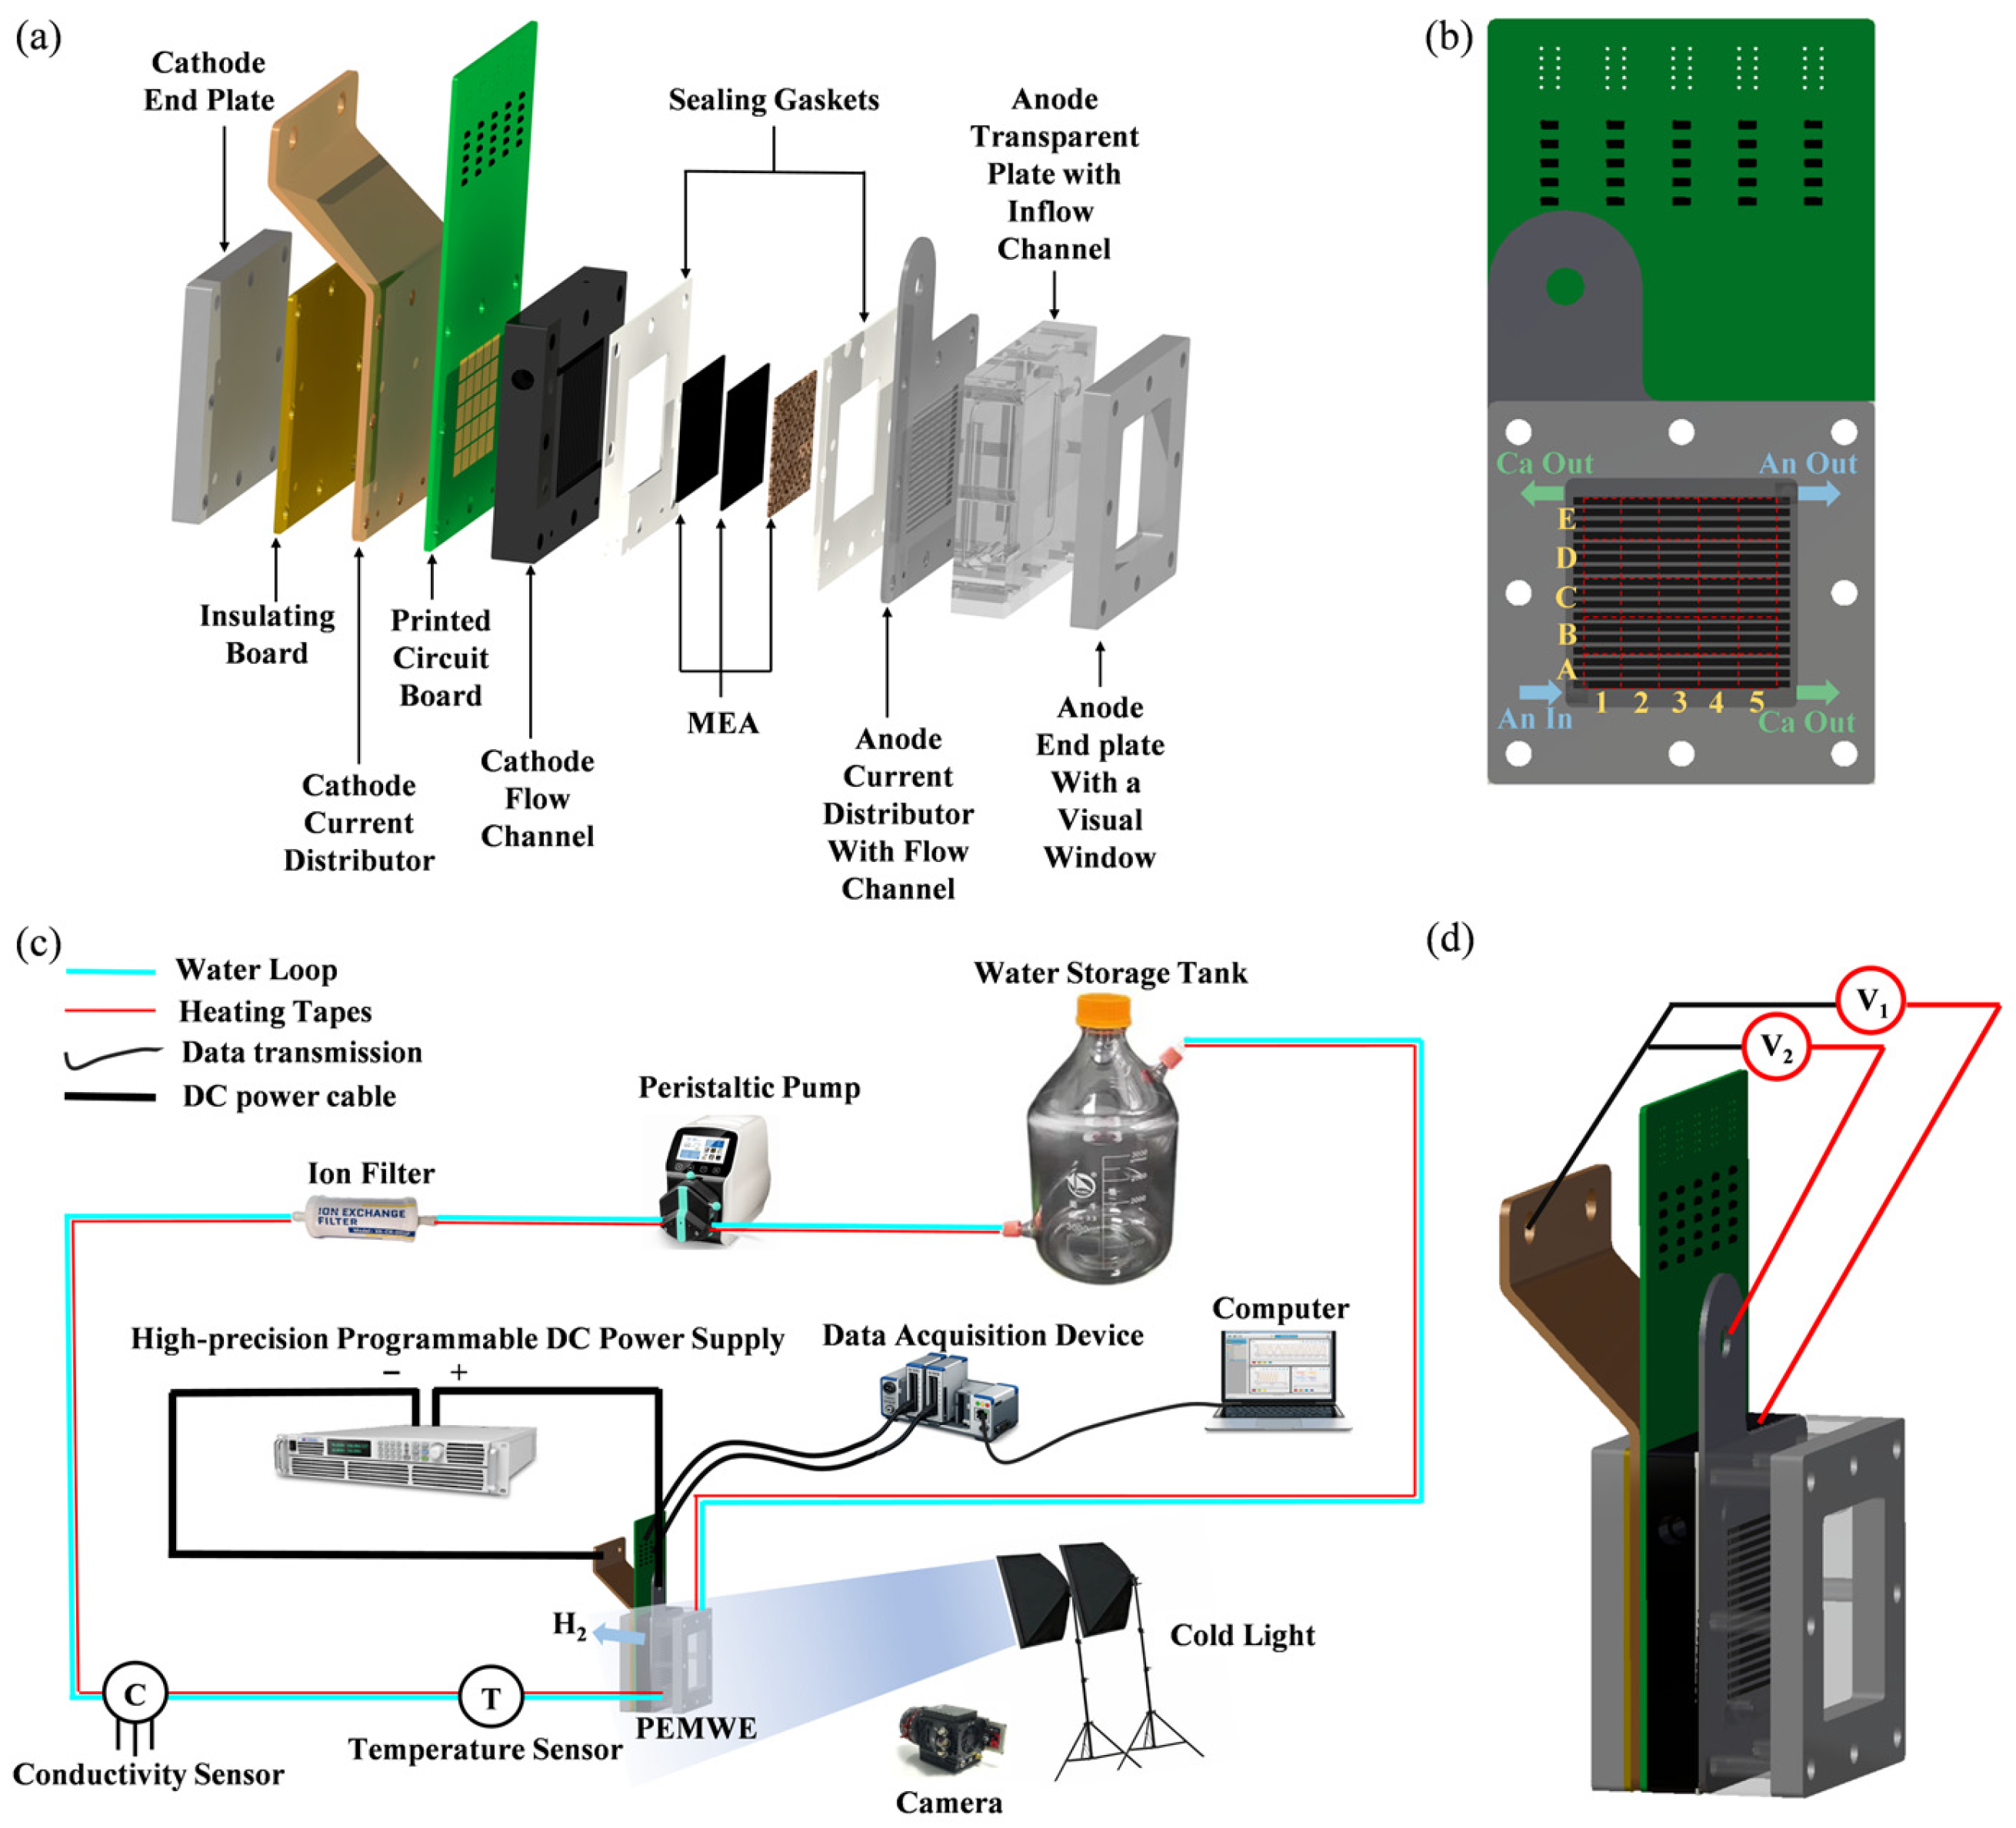
Simultaneously achieving intuitive visualization of bubble distribution and accurate monitoring of LCD during PEMWE operations remains technically challenging. To meet the requirements of observing bubble movement and distribution, as well as monitoring current density distribution characteristics under operating conditions, we designed and fabricated visualized segmented PEMWE by integrating PEMWE visualization technology and PCB-based segmented technology with its structural assembly diagram shown in Figure 2a. The structure of the visualized segmented PEMWE includes end plates, visualized end plates, current distributors, membrane electrode assembly, PCB, and gaskets. Specifically, the end plates are manufactured from stainless steel and equipped with 60 mm × 60 mm observation windows, while the transparent visualization plates are made of polymethyl methacrylate. The anode current distributor is a 2 mm-thick mirror-polished titanium plate incorporating parallel flow channels with a width of 2 mm and a cross-sectional area of 4 mm2. The membrane electrode assembly (MEA) comprises gas diffusion layer (GDL) and a catalyst-coated membrane (CCM). The anode GDL is a titanium fiber felt coated with a 0.5 µm platinum layer, exhibiting a porosity of 56% and a thickness of 0.25 mm, whereas the cathode GDL is Toray carbon paper with 78% porosity and 0.19 mm thickness. Both GDLs have lateral dimensions of 50 mm × 50 mm. The CCM consists of Nafion 115 with IrO2 and Pt/C catalysts loaded at 2.0 mg/cm2 and 1.0 mg/cm2 on the anode and cathode sides, respectively, and its size is 50 mm × 50 mm × 0.13 mm. The segmented cathode flow field is fabricated from 16 mm-thick graphite, featuring parallel channels with a width of 2 mm and a depth of 2 mm. This flow field is divided into 25 segmentations arranged in a 5 × 5 array, with each segmentation measuring 9 mm × 9 mm. A segmented PCB is placed between the cathode flow channel plate and the current distributor, designed with 25 metal contacts (9 mm × 9 mm each) corresponding to the segmented flow field to measure LCD. The sampling resistor, which has an accuracy of 1% and a temperature coefficient of 50 ppm, is integrated into each segmented circuit, and the sampling resistor area is positioned away from the current collection region to minimize the impact of internal temperature on resistor resistance, ensuring negligible resistance variation during operation. Carbon paper is inserted and uniformly compressed on both sides of the PCB to ensure stable electrical contact between the PCB, flow channel plate, and current distributor, thereby reducing interfacial contact resistance.
Figure 2.
(a) The diagram of the PEMWE assembly; (b) the segmentation scheme and flow direction of PEMWE; (c) the schematic diagram of the experimental set-up; (d) the membrane electrode assembly voltage measurement.
The PCB-based segmented flow field plate is divided into 25 segmentations arranged in a 5 × 5 grid for local current density mapping. During optical image post-processing, the same 5 × 5 segmentation framework was geometrically projected onto the visible anode flow field, so that each image segmentation corresponded directly to one electrical measurement segmentation. In this way, the local bubble coverage and the PCB-derived LCD were spatially co-registered on a one-to-one basis over the full active area. This configuration enabled not only high-resolution mapping of local current density but also segmentation-resolved quantitative coupling analysis between oxygen bubble accumulation and local electrochemical behavior, as illustrated in Figure 2b.
2.2. Test System and Membrane Electrode Assembly Voltage Acquisition Scheme
The schematic diagram and physical structure of the experimental system are illustrated in Figure 2c, which consists of a high-precision programmable DC power supply, a water storage tank, a peristaltic pump, an ion filter, a conductivity sensor, a temperature sensor, a temperature controller, four heating tapes, a relay, and the PEMWE under test. Among these components, the heating tapes are attached to the surfaces of the water storage tank, deionizer, and water inlet/outlet pipelines. The temperature controller regulates the on/off state of the heating tapes via the temperature sensor, thereby achieving precise temperature control. The anode water supply mode is adopted in the system. A multi-channel data acquisition device (NI 9184) is utilized to measure and record the current of each segmented region, while a camera system (60 frames per second, 4K resolution) is employed to capture the bubble–liquid flow in the flow channels. Under the control of the upper computer, the PEMWE current and voltage are precisely regulated, while the real-time current and voltage applied to the anode and cathode are continuously displayed and recorded.
Since the integration of a PCB into PEMWE is necessary for measuring the LCD distribution, the measured voltage of the membrane electrode assembly tends to be higher due to the voltage division within the PCB. To eliminate the measurement error caused by PCB voltage division, as shown in Figure 2d, we measure two sets of voltages: (the voltage between the cathode and anode current distributor) and (the voltage between the cathode current distributor and the cathode flow channel). Consequently, the actual MEA voltage () can be calculated using Equation (1):
2.3. Experimental Scheme
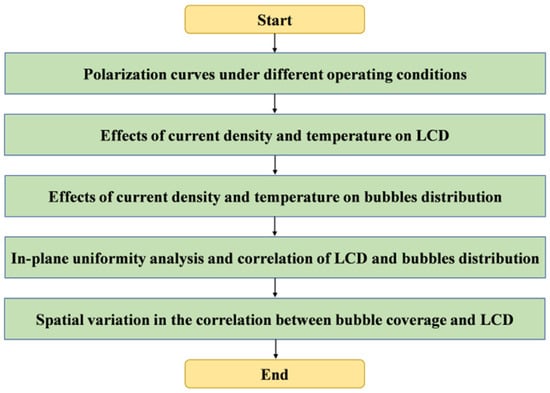
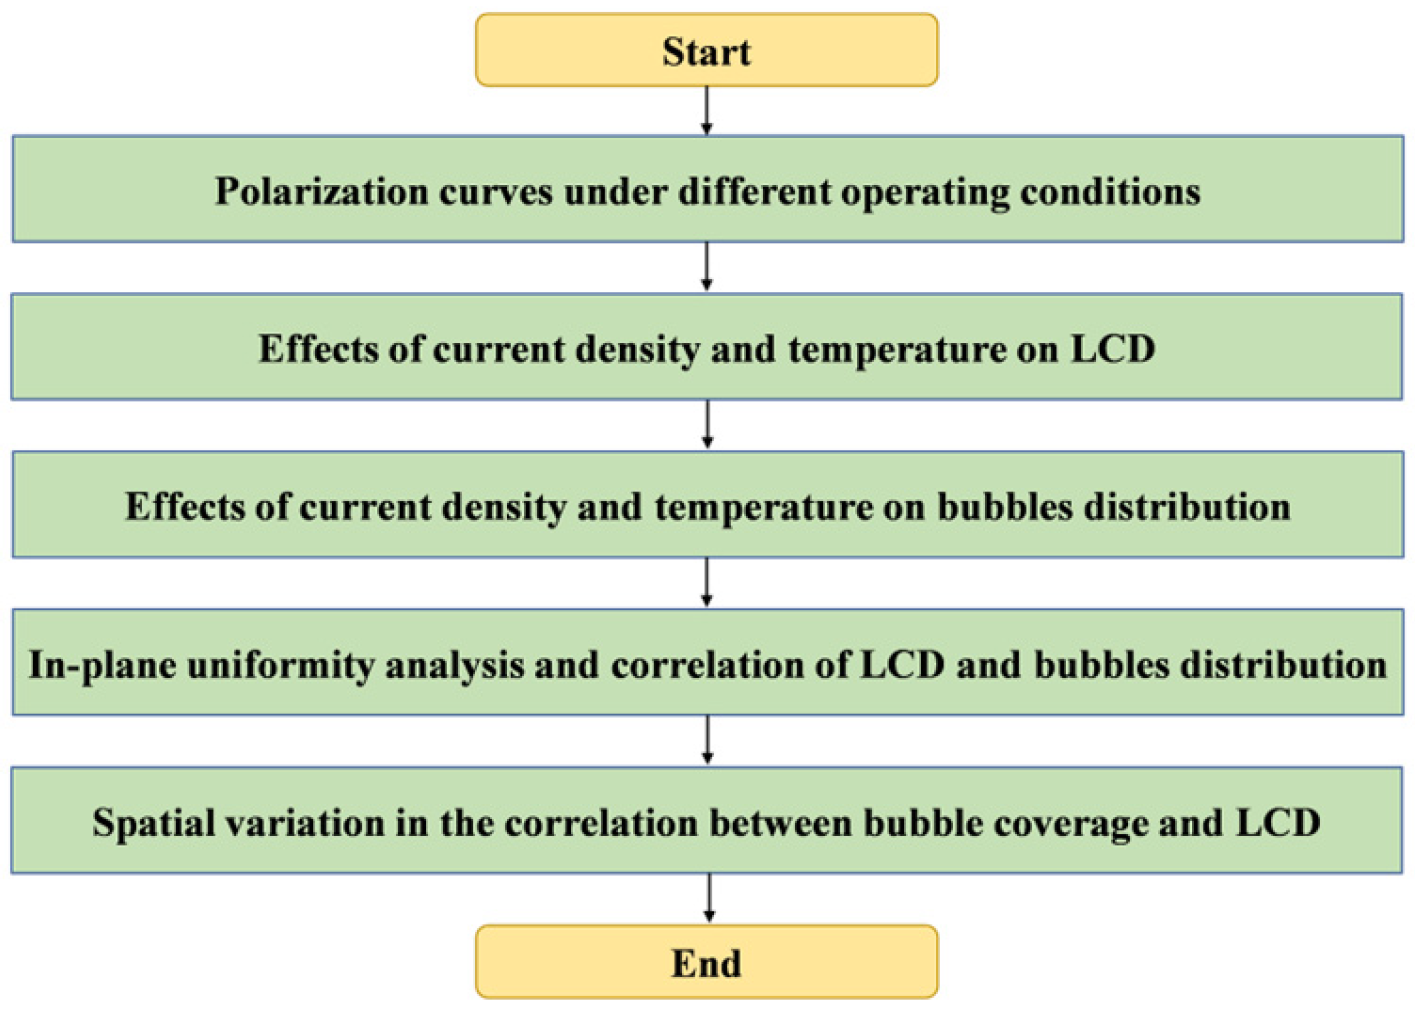
Figure 3 illustrates the research framework for analyzing the relationship between bubble coverage and LCD. Before the main experiment, deionized water was circulated through the PEMWE anode at 60 mL/min and 60 °C for 30 min to stabilize the cell temperature. Subsequently, constant current densities of 0.2 and 1.0 A/cm2 were sequentially applied for 30 min each to activate PEMWE and ensure full hydration of the MEA. After the activation, the polarization curve was recorded. Under the selected operating conditions, the spatial distributions of local current density and anode-side oxygen bubble coverage were then quantified under 12 specific cases. For bubble analysis, the optical image of the visible anode flow field was aligned with the same 5 × 5 segmentation framework used for the PCB measurement. The local bubble coverage in each segmentation was defined as the ratio of bubble-occupied pixels to the visible channel pixels within that segmentation. The rib regions were excluded from the calculation because bubbles beneath the lands could not be directly resolved by optical imaging. Based on these segmentation-resolved data, the effects of current density and temperature on the spatial distributions of LCD and bubble coverage were analyzed, followed by an in-plane uniformity analysis and correlation analysis to reveal the intrinsic relationship between bubble behavior and local electrochemical heterogeneity.
Figure 3.
A schematic conceptualization of the relationship between the bubble and current density.
To quantify the in-plane uniformity of local current density and bubble coverage rate, the degree of inhomogeneity is characterized by the standard deviations, and , which are derived from the root mean square deviation of each element from the corresponding average value, with a denominator of 5 × 5 − 1 to ensure an unbiased estimation of the population variance. This quantitative framework enables a direct and rigorous comparison of distribution uniformity under different current densities and temperatures, providing a solid basis for analyzing the correlation between bubble dynamics and electrochemical reaction heterogeneity.
2.4. Uncertainty Analysis
Inevitable errors exist in the experimental process, including instrumentation errors, measurement errors, and manual errors. According to ISO 19036:2019 [37], the international standard for the estimation and expression of measurement uncertainty, two evaluation methods were used to analyze the uncertainty of the measured parameters. From Equation (4), the uncertainty, , of the parameters, which values measured directly by the operator, were evaluated using the Type A assessment method.
where represents the number of measurements, yi denotes the measured value of the parameter, and y is the mean value. In addition, the experimental uncertainty, , associated with the instrument can be calculated using the Type B assessment method as follows:
In Equation (5), α is the measurement error of the instrument, and k is the coverage factor, which is generally defaulted to . Table 1 summarizes the parameter uncertainties.
Table 1.
Parameter uncertainties.
3. Results and Discussion
3.1. Polarization Curves Under Different Operating Conditions
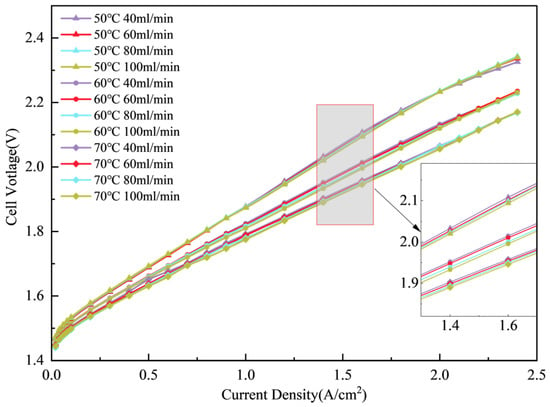
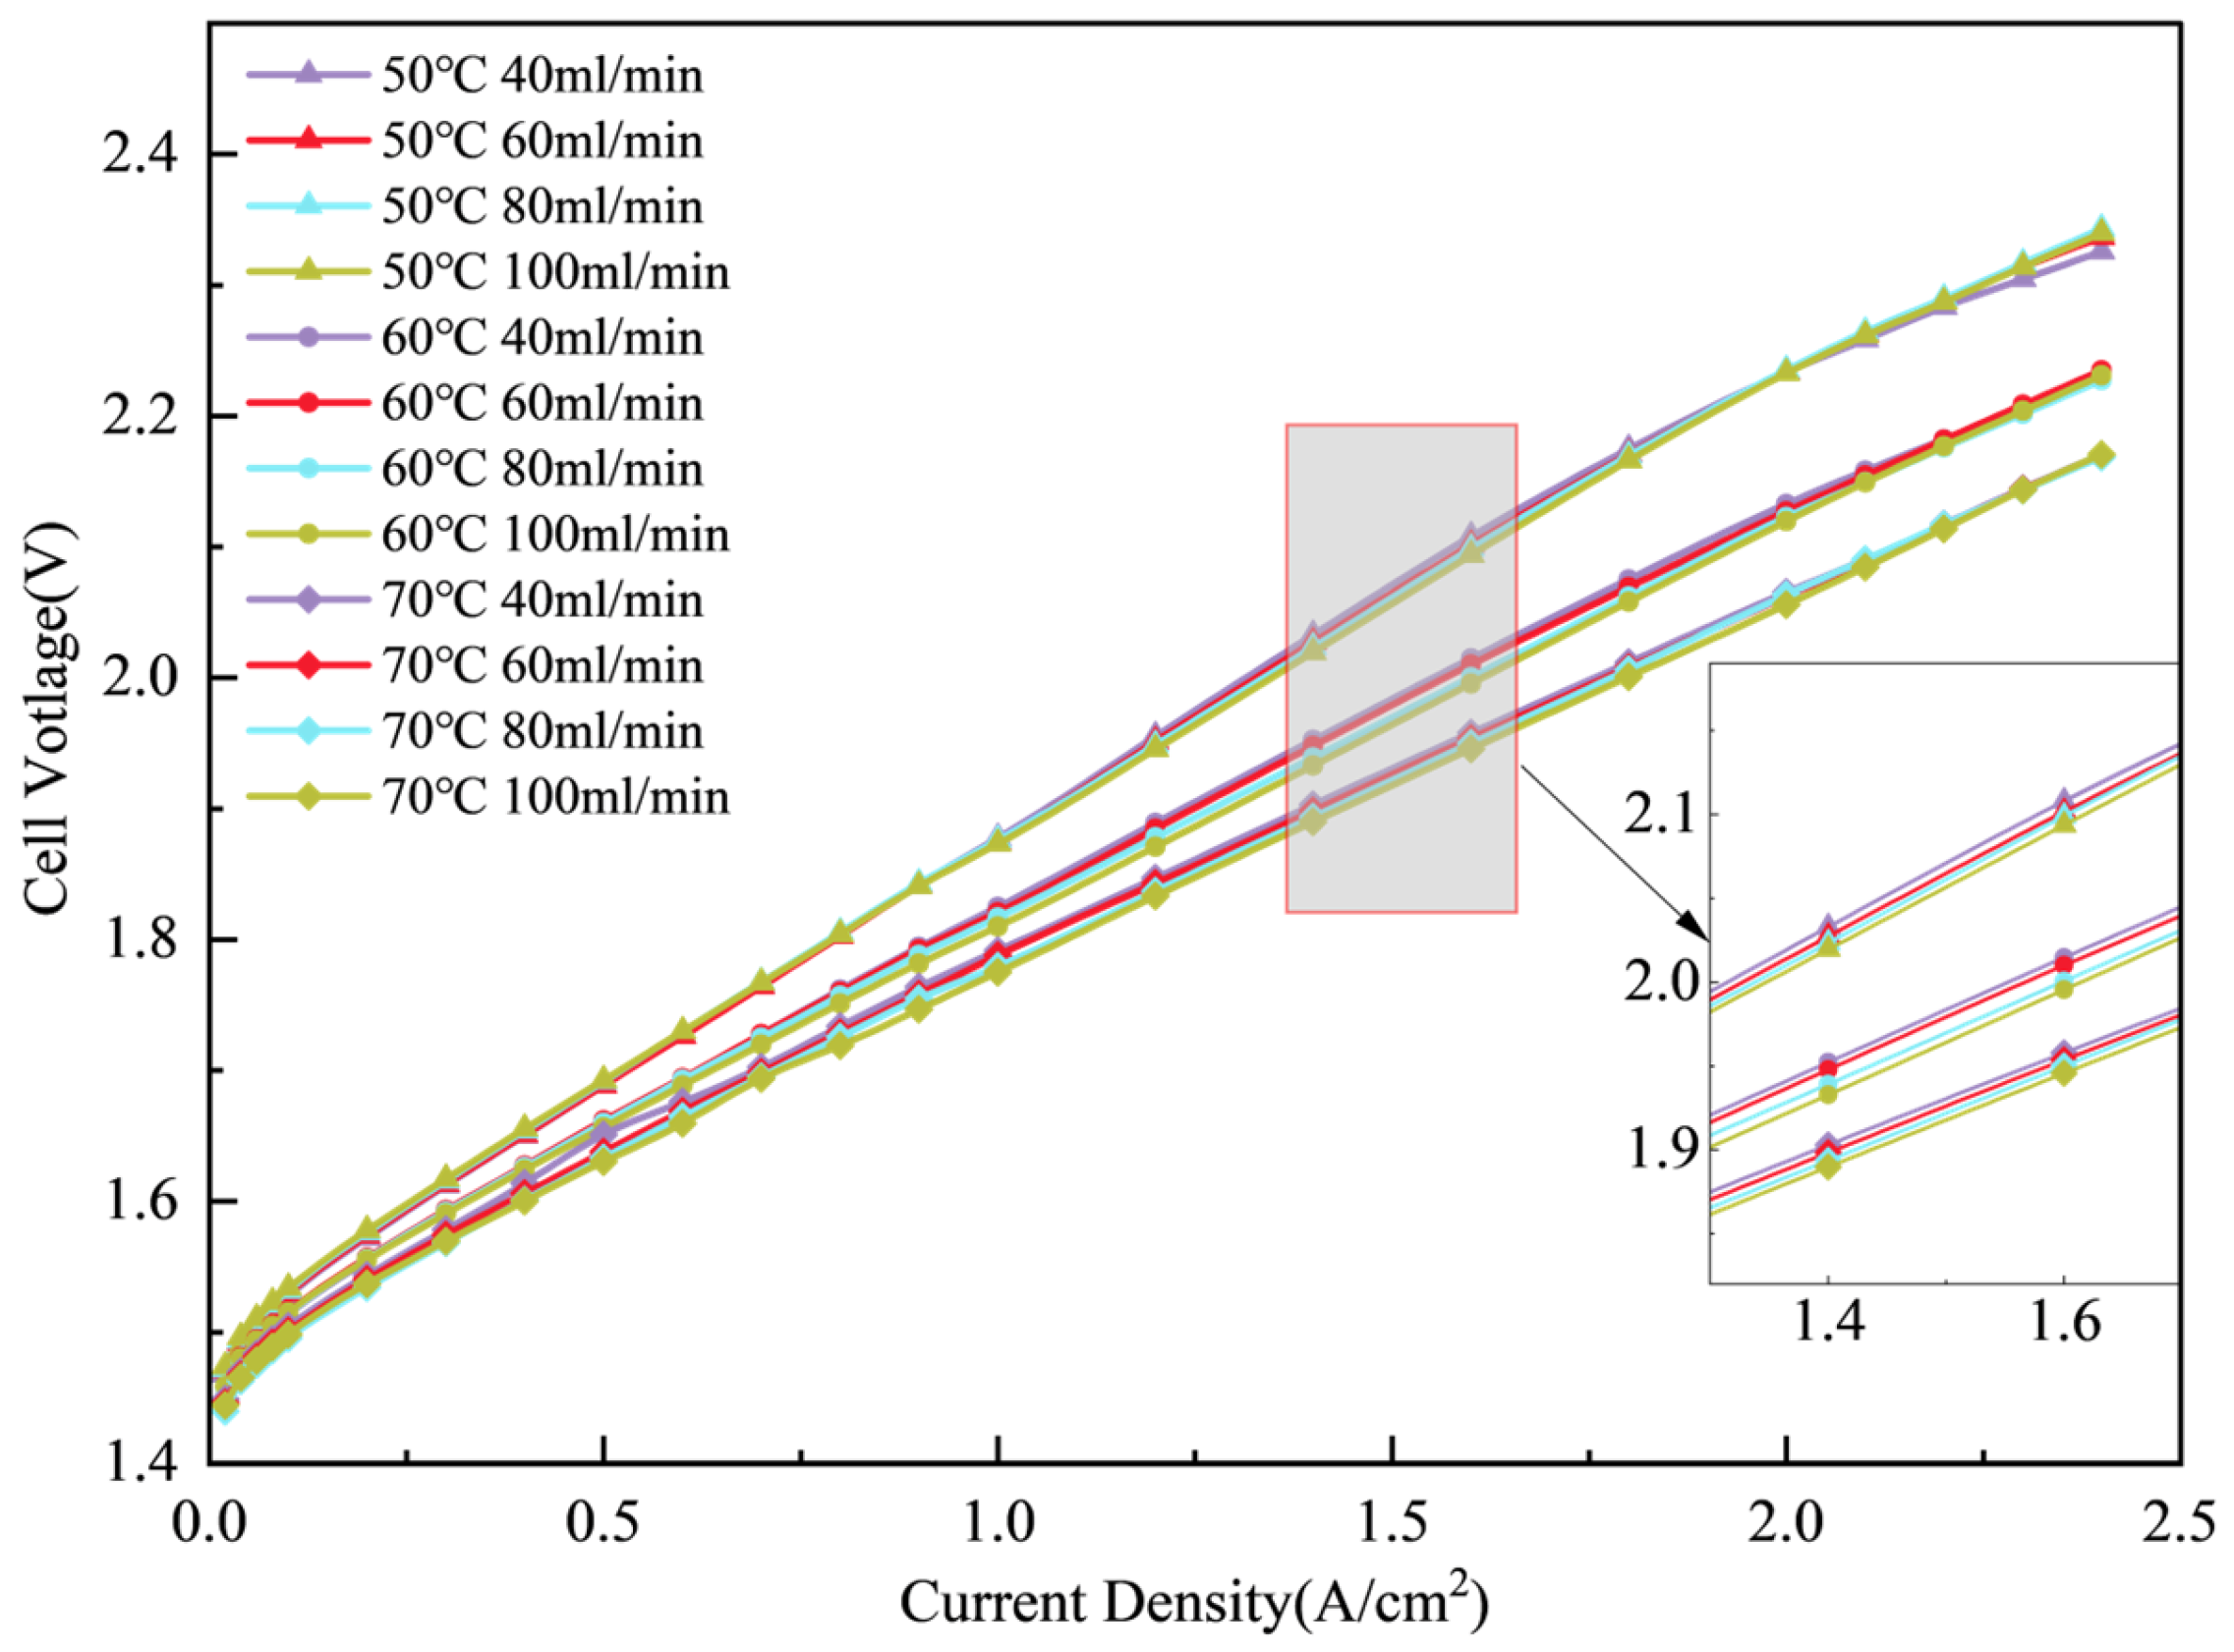
After assembling the PEMWE, deionized water was circulated through the anode at 60 mL/min and 60 °C for 30 min to stabilize the temperature of PEMWE. Subsequently, constant current densities of 0.2 and 1 A/cm2 were sequentially applied for 30 min each to activate PEMWE and ensure full hydration of the MEA. A programmable DC power supply was used to measure the polarization curves, with the measurement procedure detailed in Table 2. Prior to each polarization curve measurement, deionized water was introduced into the PEMWE at a constant flow rate and temperature for 30 min to maintain the stability of the internal temperature and flow rate of the PEMWE. The measured polarization curves are shown in Figure 4.
Table 2.
Polarization curve measurement procedure.
Figure 4.
Polarization curves for PEMWE.
The polarization curves illustrate the cell voltage response of the PEMWE across a wide range of current densities under varying operating temperatures and anode flow rates. Under all operating conditions, the cell voltage increases continuously with current density, indicating that the activation, ohmic, and mass transfer polarizations become progressively more pronounced as the operating load increases. In general, the curves are relatively close to each other in the low current density region, whereas the differences gradually enlarge at higher current densities, suggesting that the influence of the operating conditions becomes more significant under high-load operation.
The effect of temperature on the polarization behavior is particularly evident. As the temperature increases from 50 to 70 °C, the polarization curves shift downward, meaning that the cell voltage decreases at a given current density. This demonstrates that elevated temperature can effectively improve the PEMWE performance. Such improvement can be mainly attributed to accelerated electrode kinetics, enhanced proton conductivity of the membrane, and improved water transport and gas removal, all of which reduce the activation and ohmic losses. The voltage difference among different temperatures becomes especially evident in the medium and high current density regions, indicating that the beneficial effect of temperature is more pronounced under high-load operation.
By comparison, the influence of flow rate is relatively weaker, although a certain trend can still be identified. At a fixed temperature, increasing the flow rate lowers the cell voltage to some extent, and this tendency becomes clearer in the high current density region. This suggests that a higher flow rate can improve the transport process in the flow channels, facilitate reactant supply and bubble removal, and thus alleviate local mass transfer limitations. Overall, within the investigated range, temperature is the dominant factor affecting the overall PEMWE performance, whereas flow rate mainly plays an auxiliary regulating role. The polarization behavior therefore provides the overall electrochemical basis for the subsequent analysis of local current density distribution and bubble coverage behavior.
3.2. The Effects of Current Density and Temperature on LCD Distribution
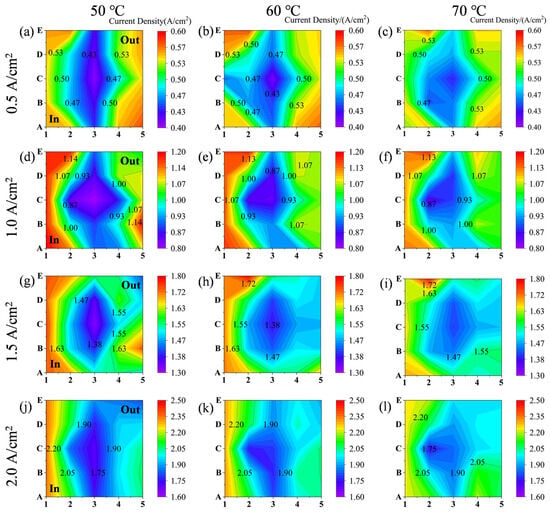
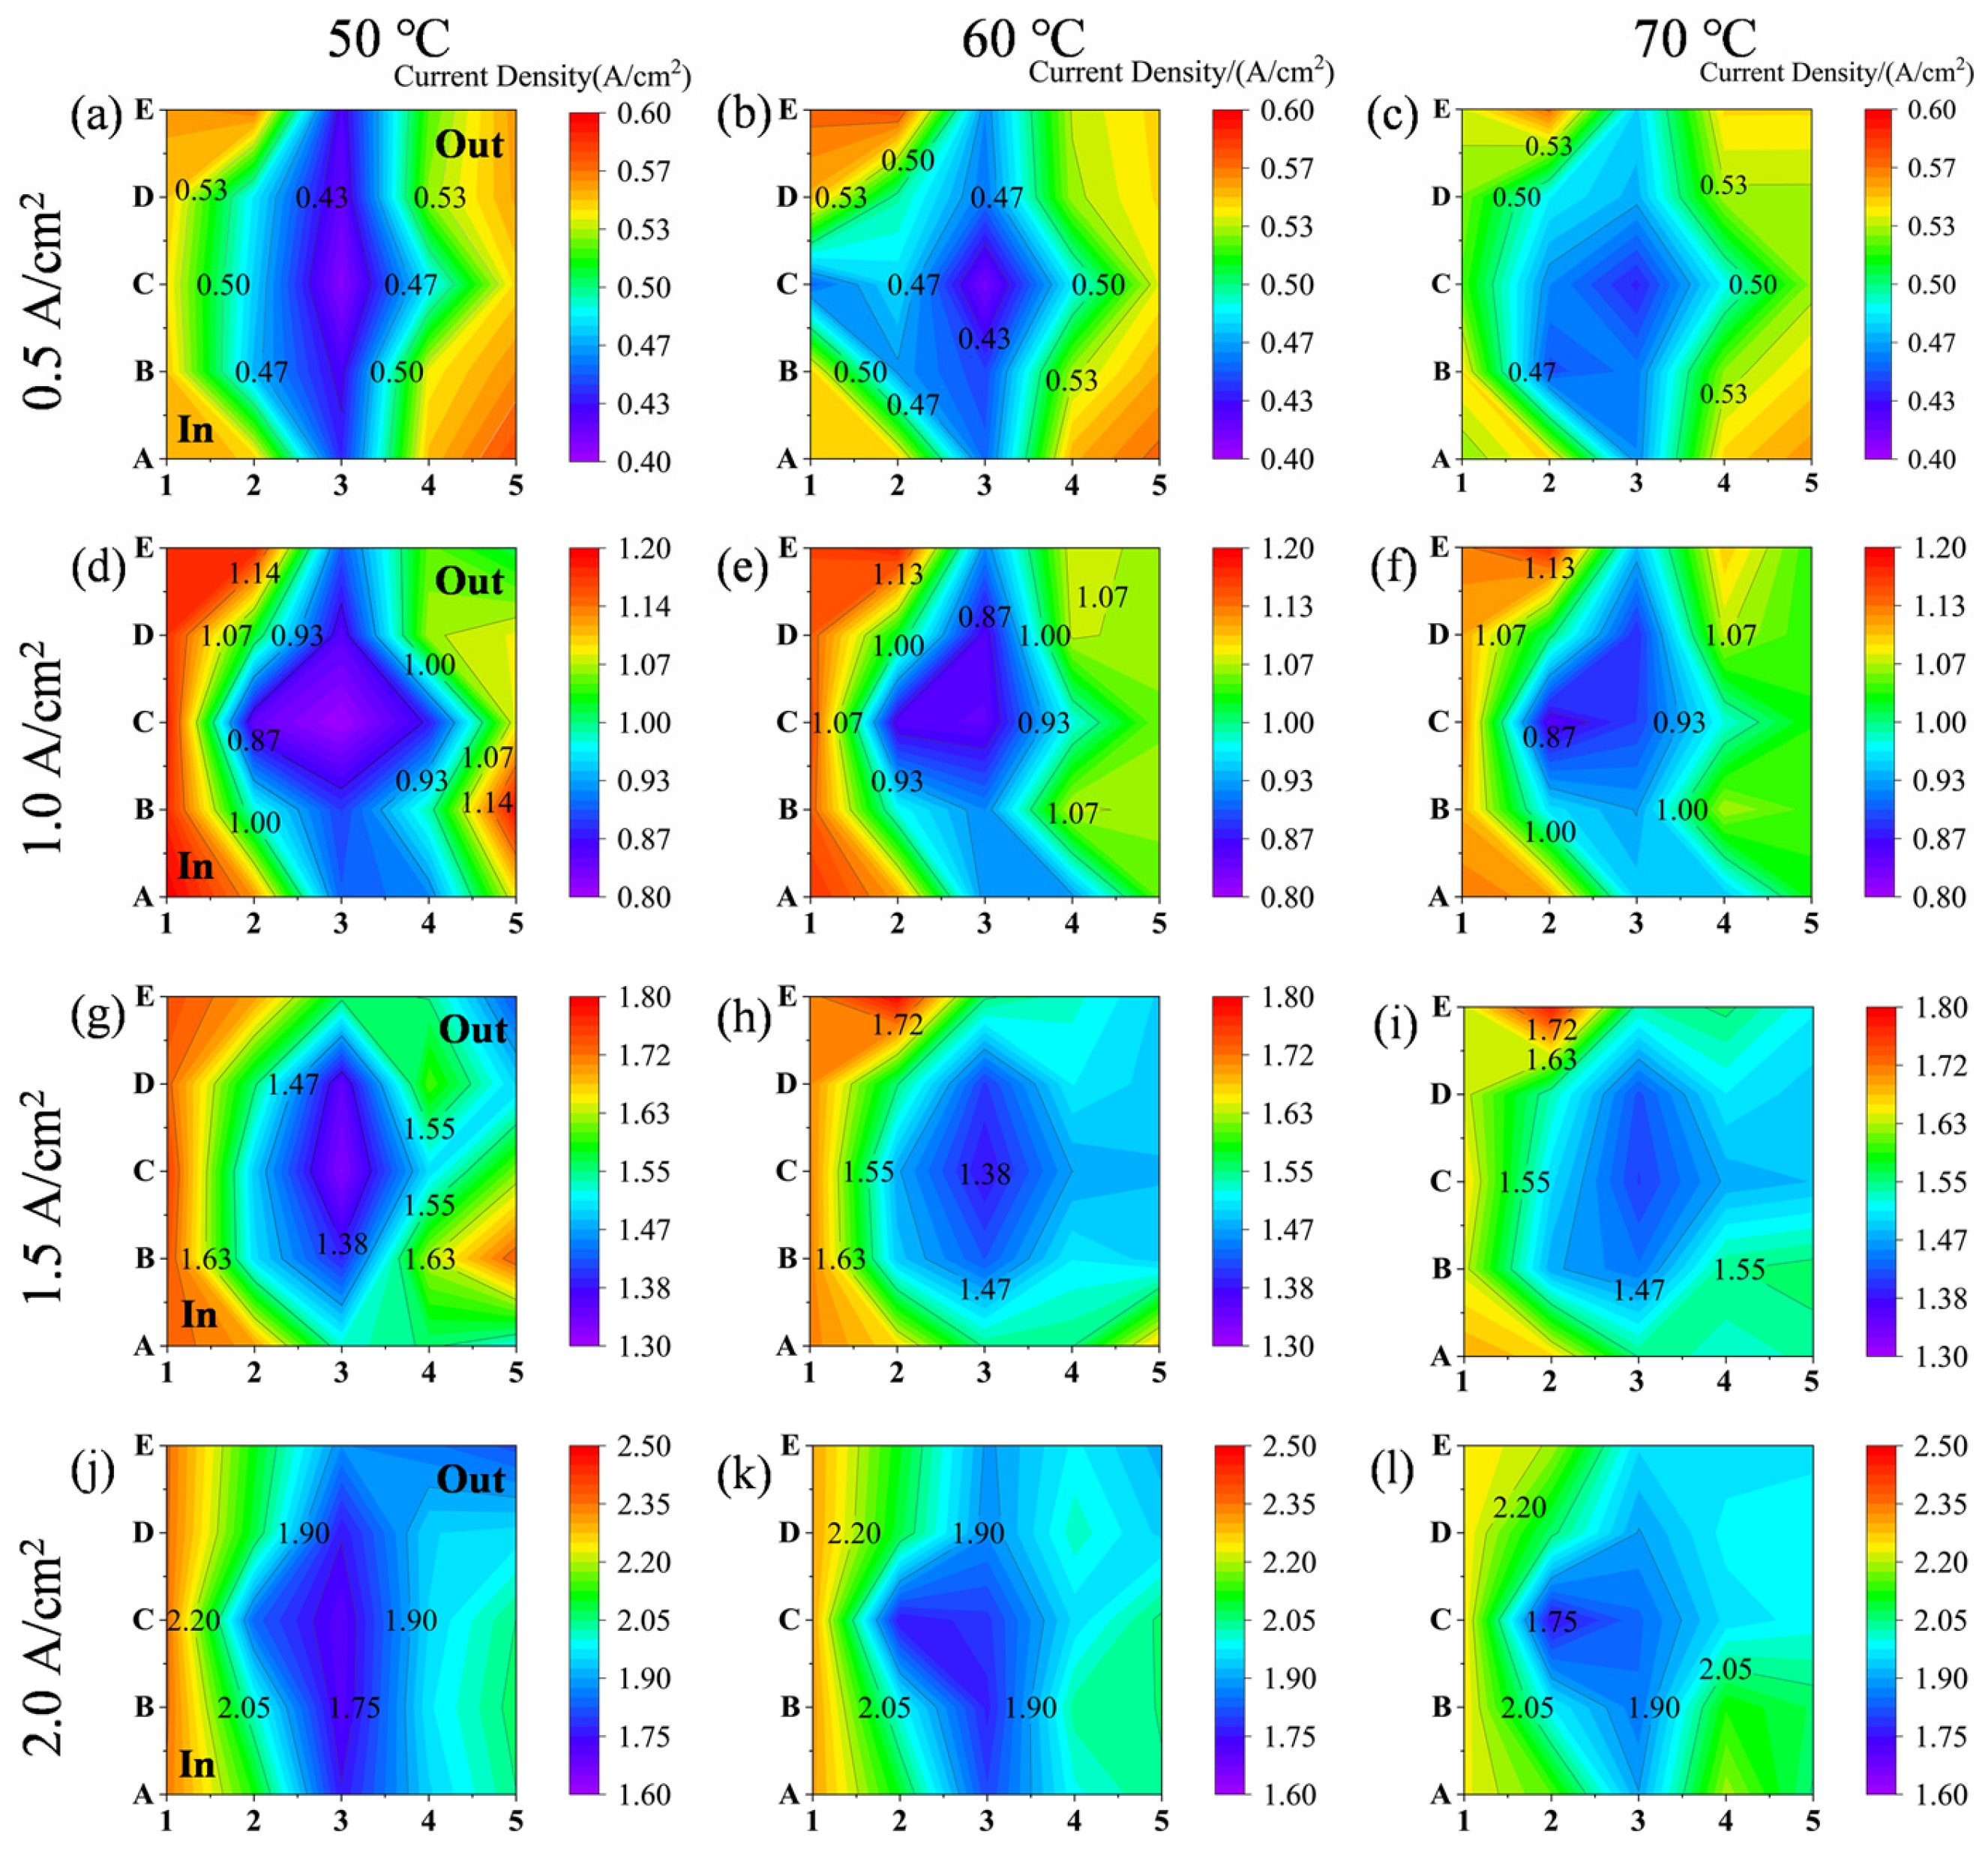
The distribution of LCD affects the performance, lifetime, and efficiency of PEMWE. The LCD distribution in PEMWE is closely related to operating parameters. This section focuses on the in-depth investigation of how these two key parameters influence the LCD distribution. Under electrolysis conditions with a fixed water flow rate of 60 mL/min and temperatures of 50 °C, 60 °C, and 70 °C, the LCD distributions at various applied current densities were examined. Figure 5 presents the LCD distributions at 0.1 A/cm2, 0.5 A/cm2, 1.0 A/cm2, and 2.0 A/cm2, revealing the inhomogeneity of LCD distribution within the flow field. Under all operating conditions, the current density exhibits pronounced in-plane spatial non-uniformity, with stable differences between high- and low-value regions. This indicates that even under the same externally applied average current, the electrochemical reaction inside the PEMWE does not proceed uniformly, but it is jointly affected by local mass transport, flow field structure, and gas–liquid two-phase behavior.
Figure 5.
The influence of current density and temperature on LCD distribution. (a) 50 °C 0.5 A/cm2; (b) 60 °C 0.5 A/cm2; (c) 70 °C 0.5 A/cm2; (d) 50 °C 1.0 A/cm2; (e) 60 °C 1.0 A/cm2; (f) 70 °C 1.0 A/cm2; (g) 50 °C 1.5 A/cm2; (h) 60 °C 1.5 A/cm2; (i) 70 °C 1.5 A/cm2; (j) 50 °C 2.0 A/cm2; (k) 60 °C 2.0 A/cm2; and (l) 70 °C 2.0 A/cm2.
At low current density, the LCD distribution already shows a certain spatial gradient, although the overall variation is still limited. At 0.5 A/cm2, for example, the low-value region is mainly located near the central part of the flow field, whereas the higher values are distributed near the edge regions, especially close to the inlet and outlet sides. This suggests that the local reaction distribution becomes initially non-uniform even under low-load operation, although the magnitude remains moderate. When the current density increases to 1.0 A/cm2, the central low-value region expands further, while the high-value regions near the edges become more evident, indicating that the local reaction environment in different positions becomes increasingly differentiated with increasing load.
As the average current density is further increased to 1.5 and 2.0 A/cm2, this non-uniformity becomes even more pronounced. The central region consistently maintains a relatively low LCD, whereas the regions near the two side edges, especially near the inlet side, exhibit higher values. Under high current density conditions, the difference between the center and edge regions enlarges markedly, indicating a stronger localization of the reaction distribution. This is mainly because the gas evolution rate increases substantially at high load, making it easier for bubbles to be generated, coalesced, and accumulated in local regions. As a consequence, the catalyst surface becomes increasingly covered by bubbles, the effective reaction area is reduced, and the local mass transfer resistance increases, thereby amplifying the difference in current density among different regions.
Regarding the temperature effect, increasing temperature does not alter the basic pattern of LCD distribution at a given average current density. The characteristic feature of “lower values in the center and higher values near the edges” remains generally unchanged at all temperatures, suggesting that the LCD distribution is primarily governed by the flow field structure and local transport conditions and thus exhibits strong structural stability. However, higher temperature can alleviate this non-uniformity to some extent, as reflected by a weakened gradient between high- and low-value regions and a smoother transition among adjacent areas. This can be attributed to improved electrode kinetics, reduced membrane resistance, and enhanced water transport and bubble detachment at elevated temperature, which together mitigate the influence of local transport limitations on current distribution.
Therefore, current density and temperature influence the LCD distribution in different ways. The former mainly intensifies the in-plane non-uniformity of reaction distribution, whereas the latter tends to alleviate local differences and smooth the current distribution. These results indicate that the formation of local reaction heterogeneity in PEMWE is closely related to the operating load and can be significantly regulated by thermal conditions.
3.3. The Effects of Current Density and Temperature on Bubble Characteristic and Coverage
3.3.1. The Effects of Temperature and Current Densities on Bubble Characteristic
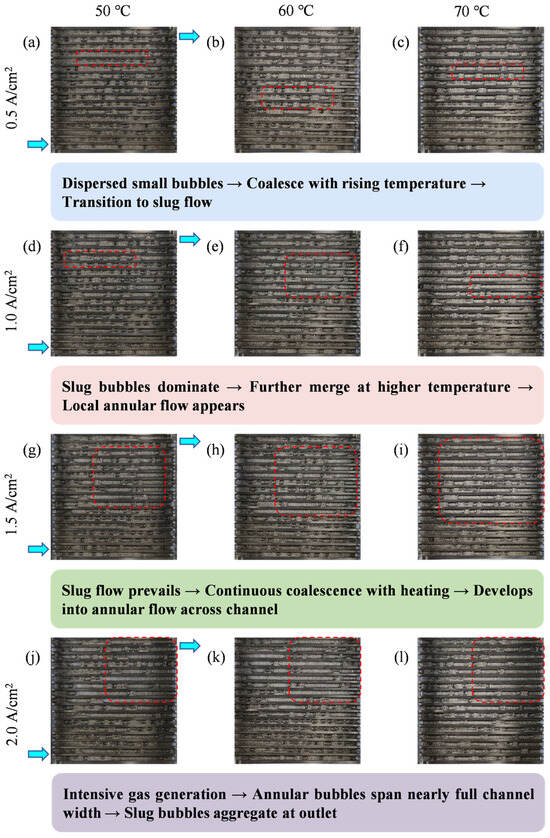
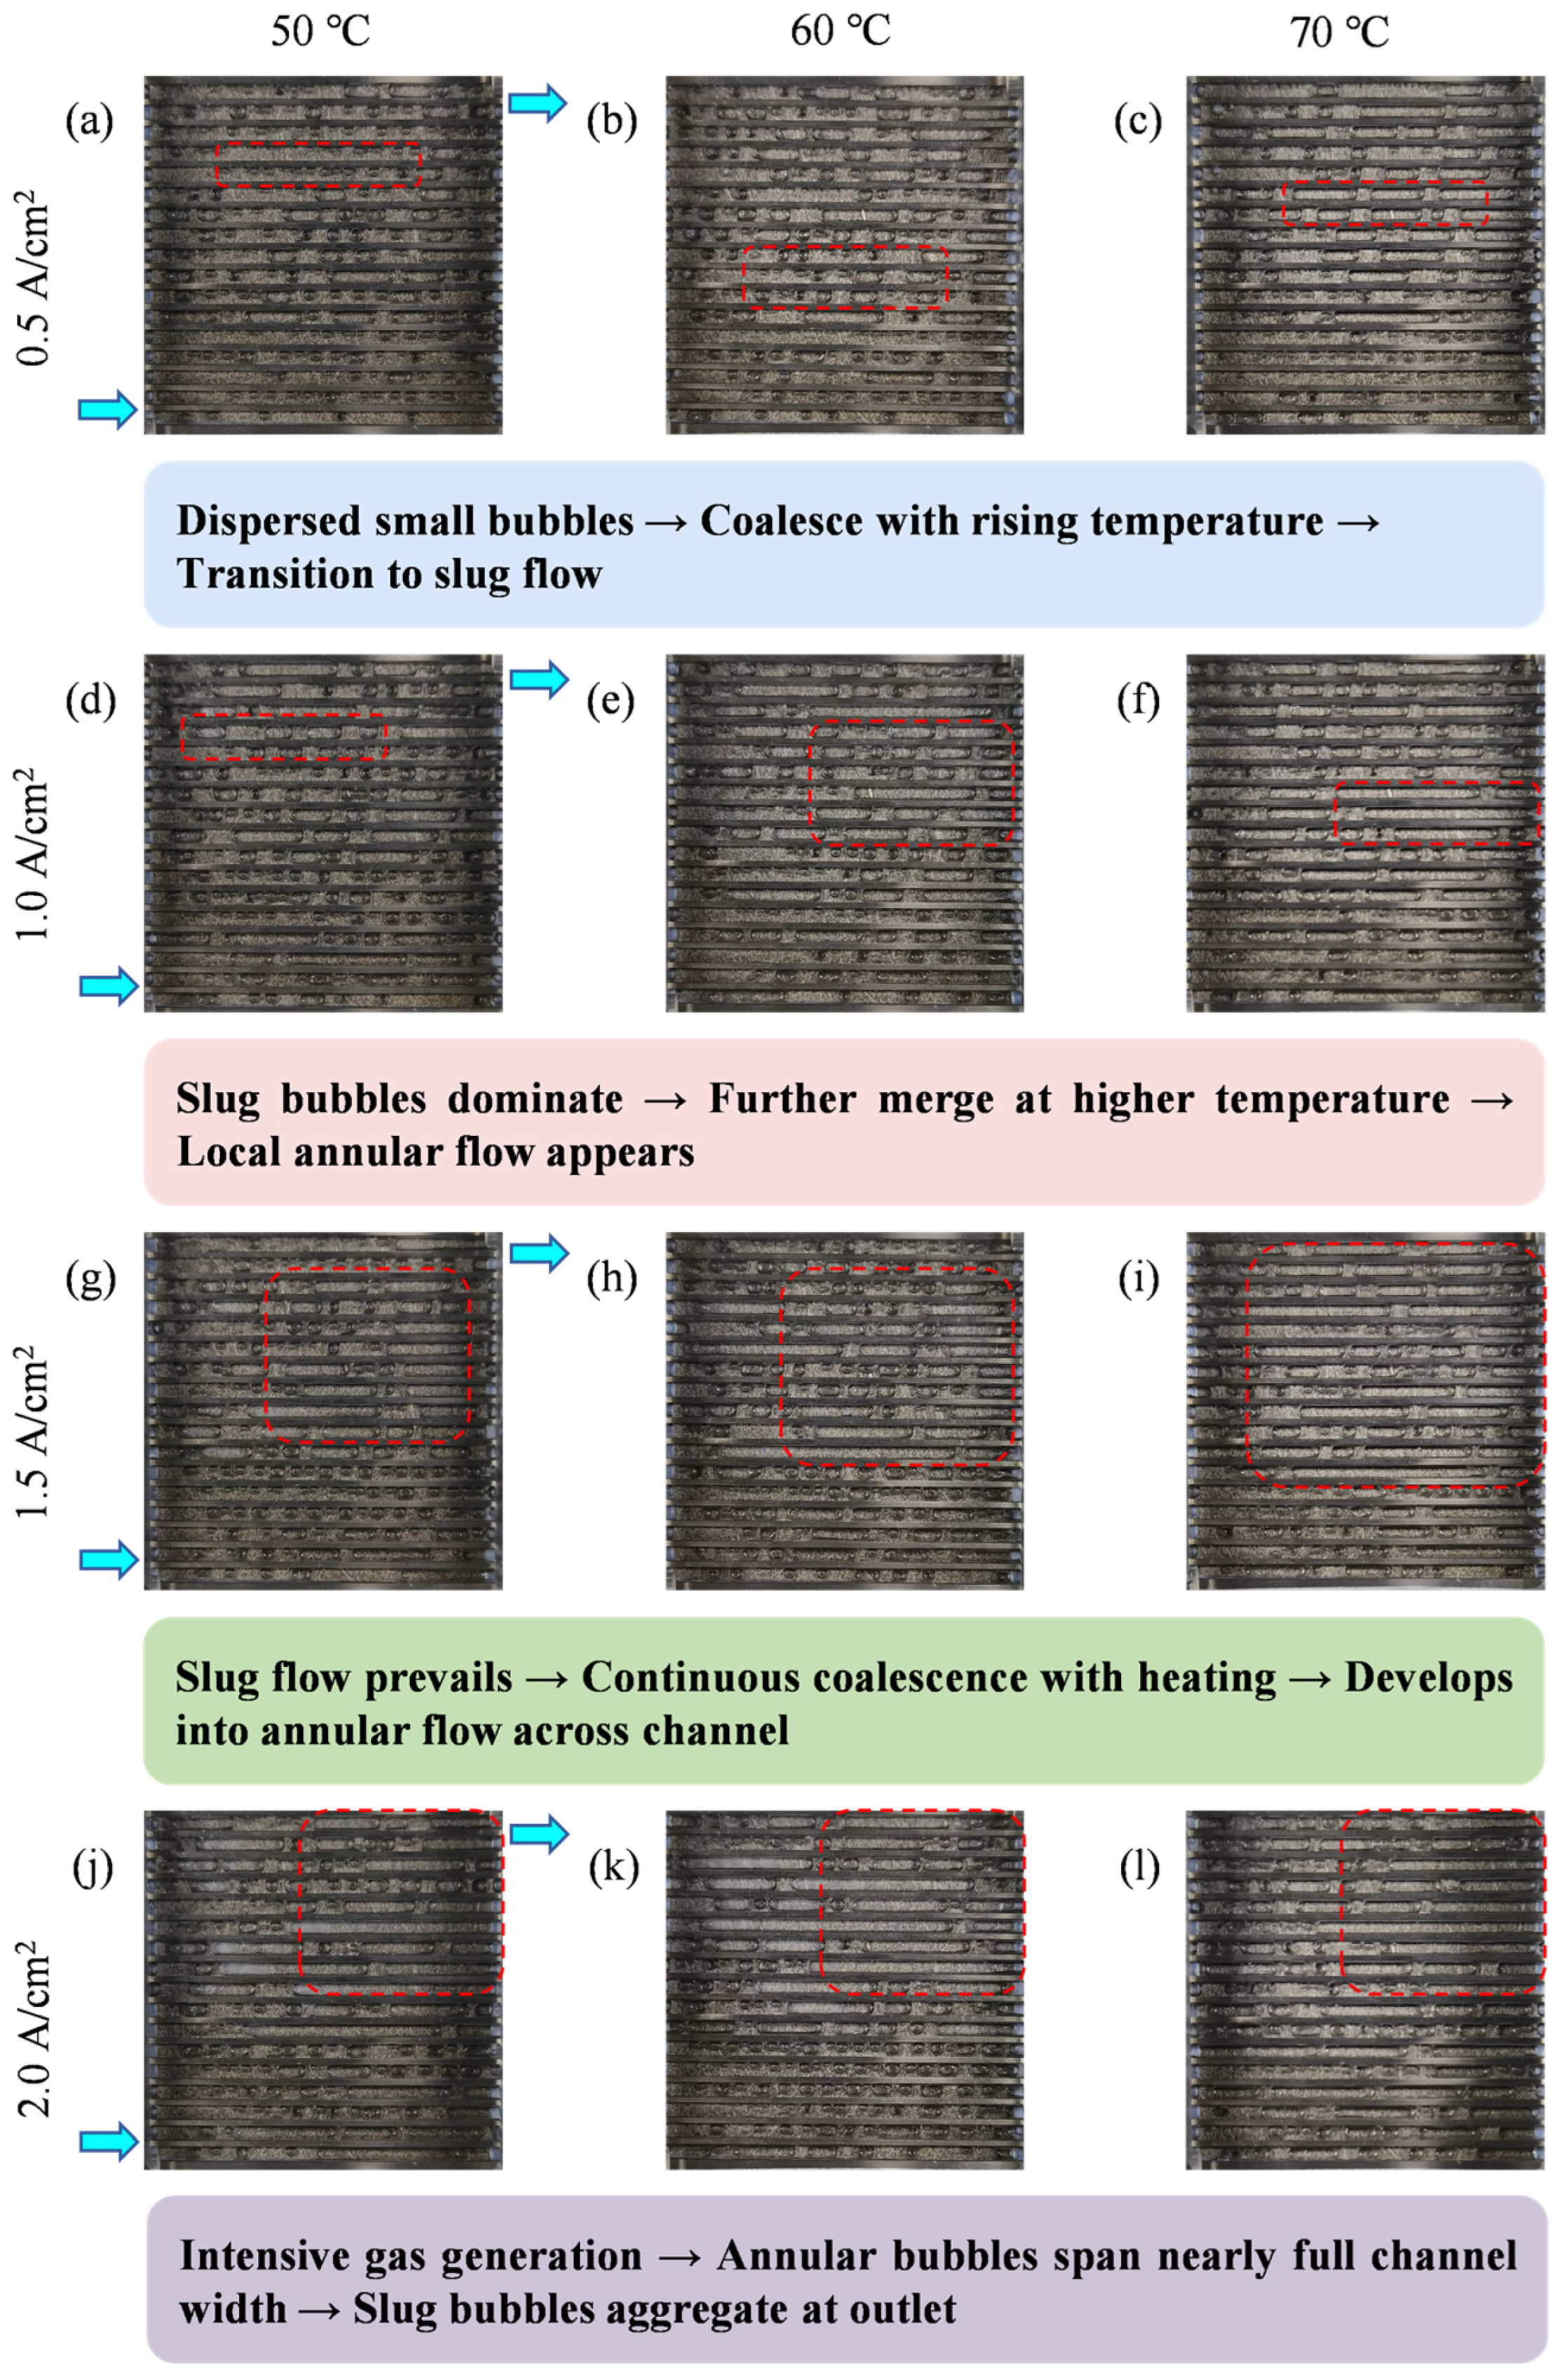
In order to establish the relationship between the two-phase flow and the local PEMWE performance, the two-phase flow is observed with optical visualization of the end plates. Currently, no unified definition exists for bubble flow patterns; despite the inherent subjectivity, three patterns—bubble flow, slug flow, and annular flow—are widely recognized [22,38,39].
Under electrolysis conditions with a fixed water flow rate of 60 mL/min and temperatures of 50 °C, 60 °C, and 70 °C, the LCD distributions at various applied current densities were examined. Figure 6 presents the LCD distributions at 0.1 A/cm2, 0.5 A/cm2, 1.0 A/cm2, and 2.0 A/cm2, revealing the inhomogeneity of LCD distribution within the flow field. At 0.5 A/cm2, the two-phase flow was dominated by bubble flow across all temperatures, characterized by discrete, small-diameter bubbles uniformly dispersed in the flow channels. Temperature had a negligible effect on bubble distribution at this low current density; only a slight reduction in bubble number density was observed at 70 °C, attributed to moderately enhanced bubble coalescence and detachment. As the current density increased to 1.0 A/cm2, localized slug flow began to emerge, particularly at 50 °C, where elongated slug bubbles formed in the middle and outlet regions of the flow channels. Elevating the temperature to 60 °C suppressed slug flow formation, reverting most regions to bubble flow; at 70 °C, discrete bubbles remained dominant, with minimal slugging, indicating that higher temperatures promote bubble fragmentation and prevent large slug formation. At 1.5 A/cm2, the non-uniformity of bubble distribution intensified. At 50 °C, extensive slug flow occupied the majority of the flow channels, and incipient annular flow was observed along the channel walls at the outlet. Increasing the temperature to 60 °C significantly reduced slug and annular flow occurrence, confining slug bubbles to isolated outlet regions. However, at 70 °C, while slug flow was further suppressed, a thin liquid film persisted at the channel edges, likely due to elevated gas production rates offsetting partial bubble detachment benefits. Under the high current density of 2.0 A/cm2, 50 °C operation resulted in severe two-phase flow maldistribution, with large annular bubbles spanning nearly the entire channel cross-section and slug bubbles aggregating at the outlet. Raising the temperature to 60 °C was the optimal condition, effectively inhibiting annular flow and limiting slug flow to small, isolated regions, with bubble flow remaining the dominant regime. At 70 °C, despite enhanced bubble dynamics, the extremely high gas generation rate led to renewed formation of elongated slug bubbles in the downstream channels, though annular flow was still less prevalent than at 50 °C.
Figure 6.
The optical images of two-phase flow visualization at different temperature and current densities. (a) 50 °C 0.5 A/cm2; (b) 60 °C 0.5 A/cm2; (c) 70 °C 0.5 A/cm2; (d) 50 °C 1.0 A/cm2; (e) 60 °C 1.0 A/cm2; (f) 70 °C 1.0 A/cm2; (g) 50 °C 1.5 A/cm2; (h) 60 °C 1.5 A/cm2; (i) 70 °C 1.5 A/cm2; (j) 50 °C 2.0 A/cm2; (k) 60 °C 2.0 A/cm2; and (l) 70 °C 2.0 A/cm2. The red dashed boxes highlight the representative regions of bubble coalescence and flow pattern transition, while the arrows indicate the flow direction and the evolution trend of bubble behavior with increasing temperature. The colored boxes below each row provide schematic descriptions of the corresponding flow regimes.
In conclusion, current density dictates the dominant bubble flow regime, with increasing current promoting the transition from bubble flow to slug flow and ultimately annular flow. Temperature acts as a critical regulator of this transition: moderate heating optimizes bubble detachment and fragmentation, suppressing slug/annular flow formation; while both low and excessively high temperatures fail to maintain stable bubble flow at high current densities, driven by poor bubble dynamics and overwhelming gas production, respectively.
3.3.2. The Effects of Temperature and Current Densities on Bubble Coverage
To quantitatively characterize the gas–liquid distribution and its local influence on electrochemical behavior, the local bubble coverage ratio, denoted as α, was introduced. For each operating condition, the optical image of the visible anode flow field was first processed and aligned with the 5 × 5 segmentation framework used for LCD measurement. In practice, the bubble-covered area was obtained from the processed optical images through grayscale conversion, threshold-based segmentation, and pixel-area counting within the predefined segmental region of interest. The local bubble coverage ratio in each segmentation was then calculated according to Equation (6), as the ratio of bubble-occupied area to the visible channel area within that segmentation. In the present work, only the channel region was included in the calculation, whereas the rib area was excluded, because bubbles beneath the lands could not be directly resolved by optical imaging, and their inclusion would introduce an observational bias. Therefore, the reported α values represent the projected bubble coverage within the observable channel area of each segmentation.
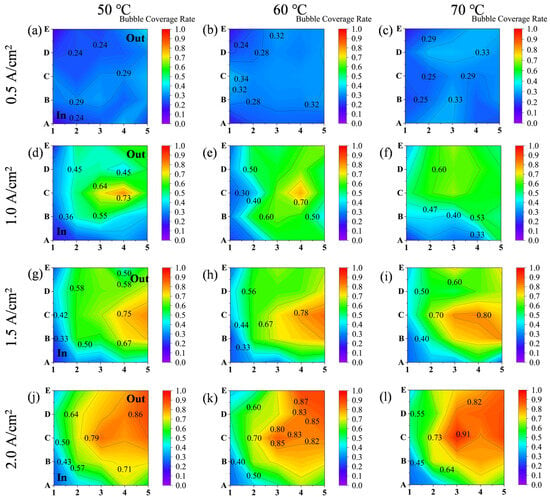
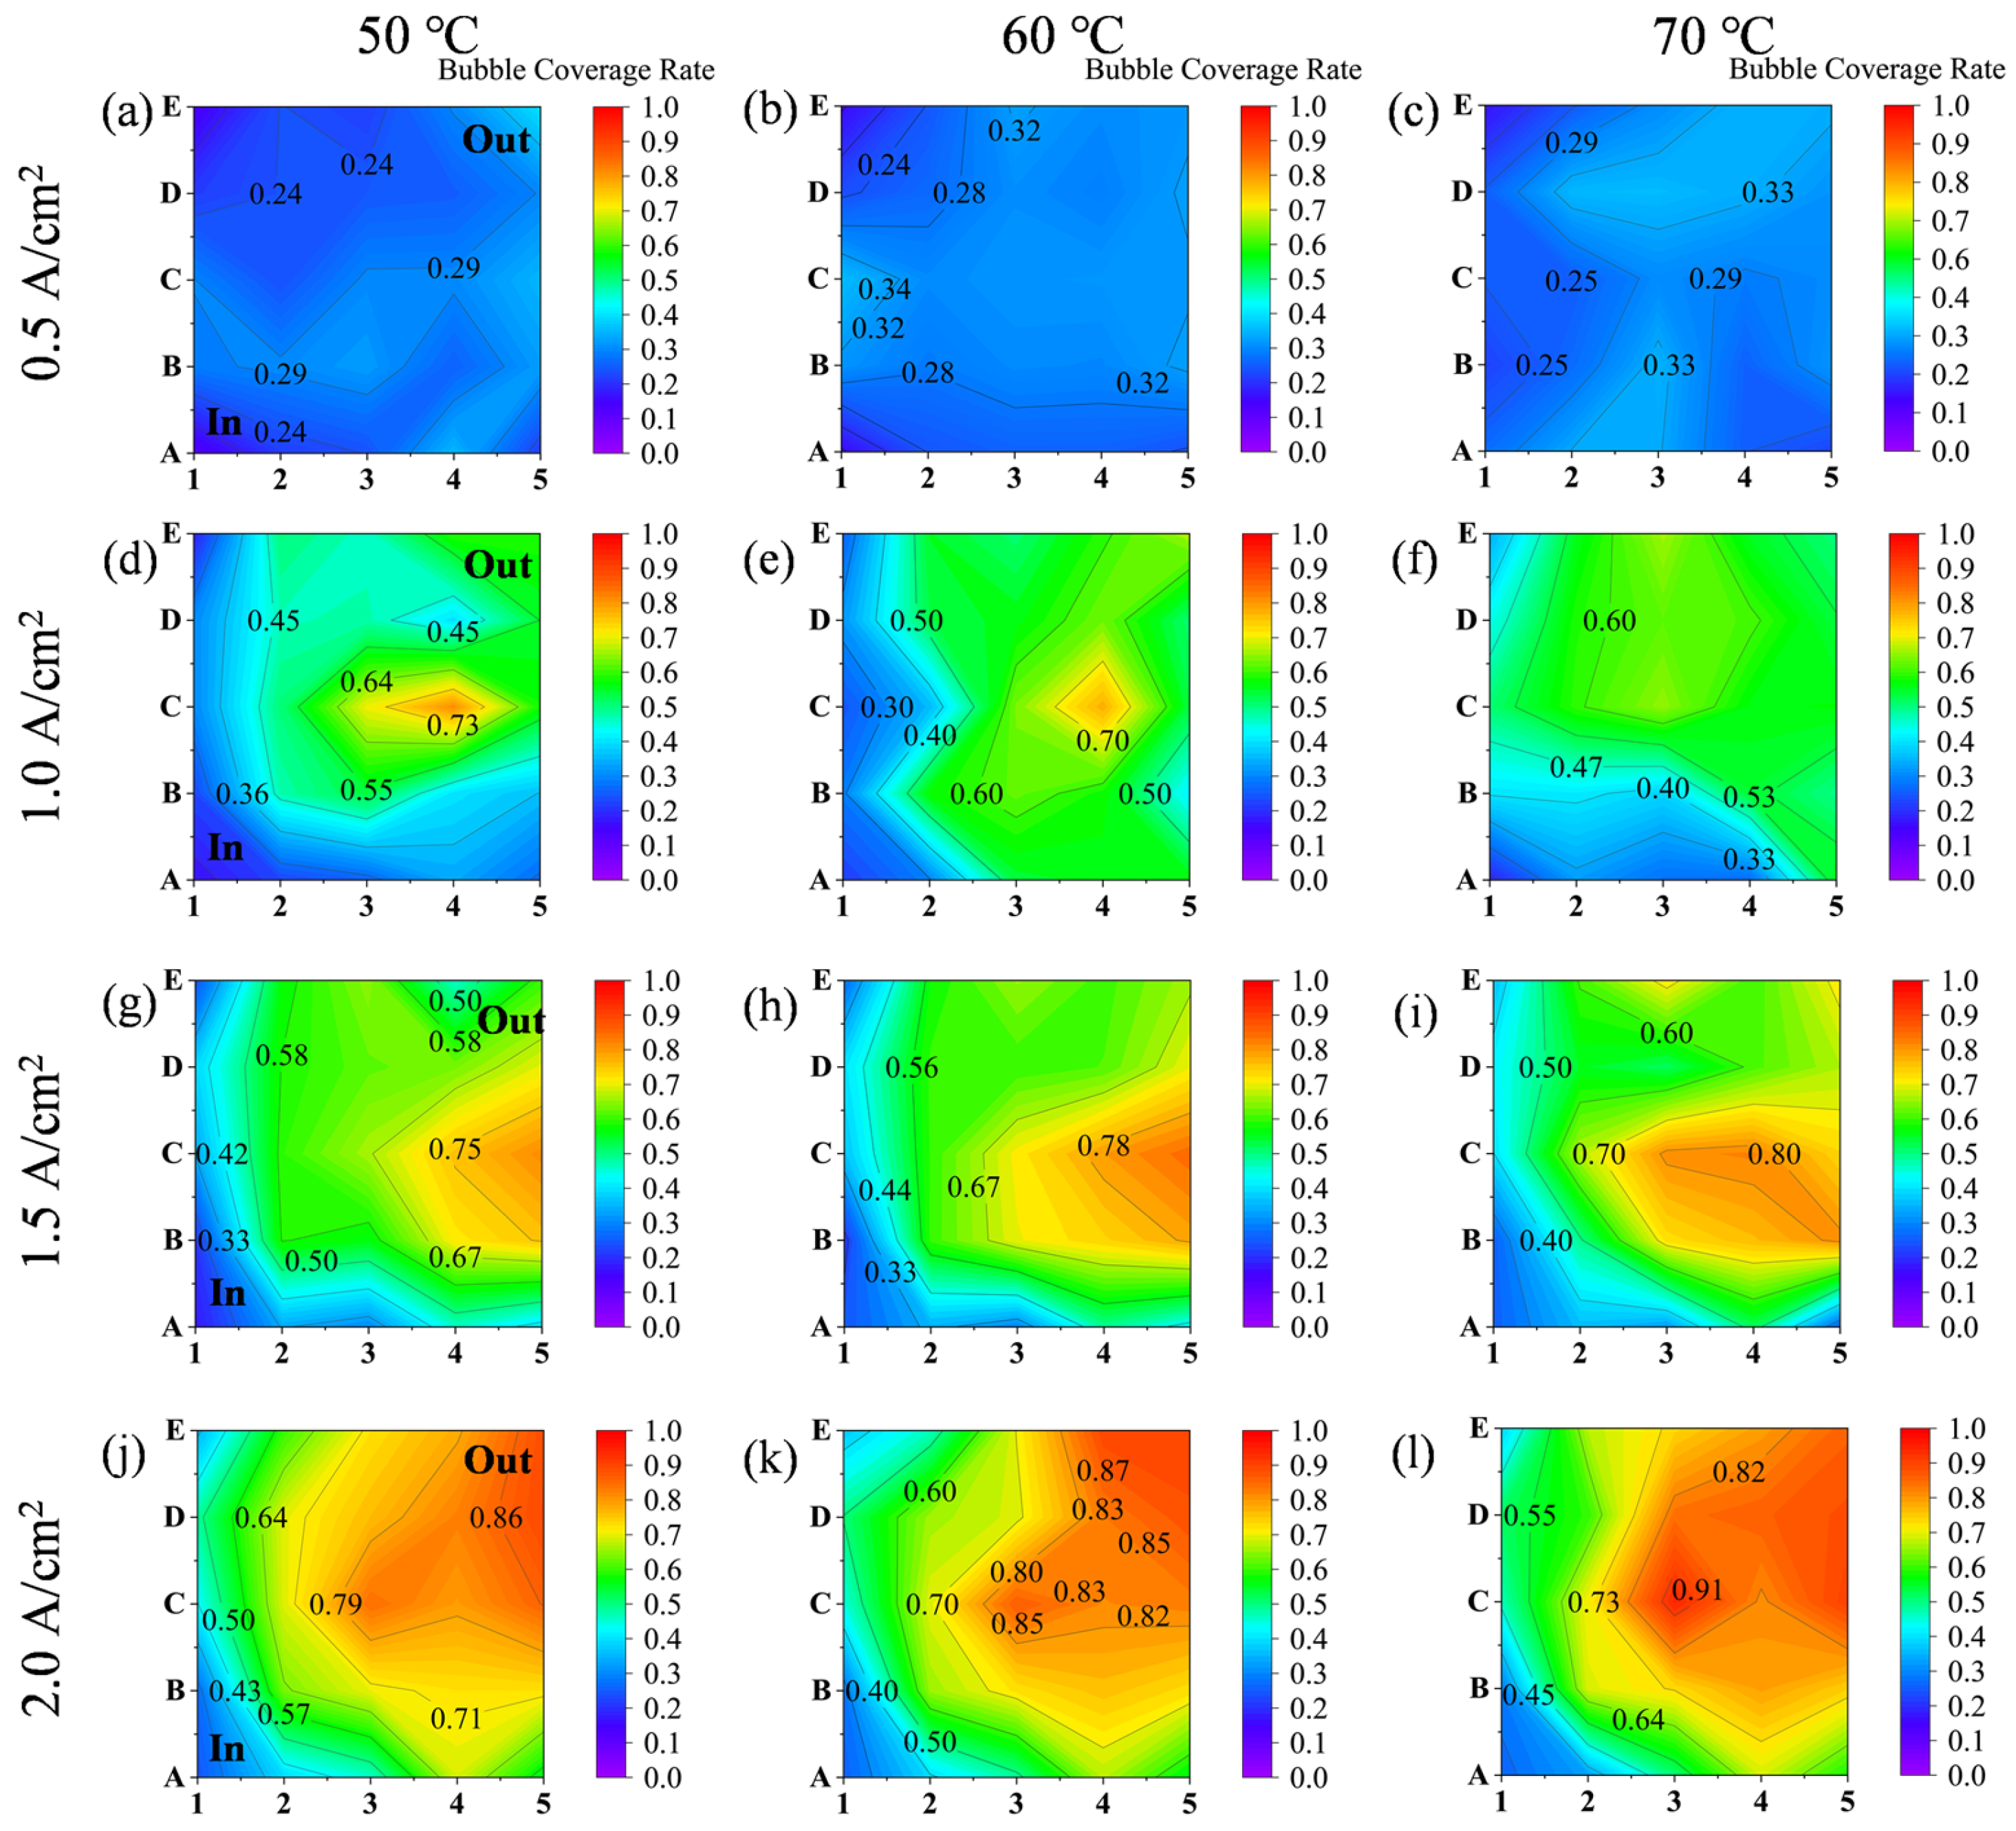
According to Figure 7, the bubble coverage increases significantly with increasing current density and exhibits pronounced spatial non-uniformity. Under different operating conditions, the locations of high- and low-coverage regions are not randomly distributed but instead follow relatively stable spatial evolution patterns, indicating a close relationship between bubble behavior, local reaction intensity, and fluid transport conditions.
Figure 7.
The influence of current density and temperature on bubble coverage rate. (a) 50 °C 0.5 A/cm2; (b) 60 °C 0.5 A/cm2; (c) 70 °C 0.5 A/cm2; (d) 50 °C 1.0 A/cm2; (e) 60 °C 1.0 A/cm2; (f) 70 °C 1.0 A/cm2; (g) 50 °C 1.5 A/cm2; (h) 60 °C 1.5 A/cm2; (i) 70 °C 1.5 A/cm2; (j) 50 °C 2.0 A/cm2; (k) 60 °C 2.0 A/cm2; and (l) 70 °C 2.0 A/cm2.
At 0.5 A/cm2, the overall bubble coverage remains low at all three temperatures, with most regions falling within approximately 0.25–0.35, and the in-plane variation is relatively limited. This indicates that under low current density operation, the gas evolution rate is low, and no obvious bubble accumulation region is formed in the flow channels, so that the local mass transport process remains relatively stable. Although some differences in coverage among locations are already present, their magnitude is still small, suggesting that the disturbance to the local reaction environment caused by bubbles is weak under low-load conditions.
When the current density increases to 1.0 A/cm2, the bubble coverage rises noticeably, and the spatial difference becomes much more evident. High-coverage regions begin to concentrate in the central area and near the outlet side, where local values reach around 0.70, whereas the inlet-adjacent regions remain at relatively low levels. This suggests that, as the reaction rate increases, gas evolution becomes faster and the generation, coalescence, and retention of bubbles in the flow channels become more significant, resulting in obvious local bubble accumulation. Meanwhile, the low-coverage regions are still mainly located near the inlet, reflecting the stronger liquid replenishment and flow-scouring effect in this area, which facilitates bubble removal from the reaction surface.
As the current density is further increased to 1.5 A/cm2, the high-coverage region continues to expand and gradually develops from local concentration into a broader continuous distribution. At this stage, the bubble coverage in the central and outlet-side regions increases further, with several areas reaching approximately 0.75–0.80. Although the inlet-side regions still maintain relatively lower coverage, their values are also clearly higher than those under lower current density conditions. This indicates that under high-load operation, the two-phase flow characteristics become more pronounced throughout the entire flow field. Not only does the bubble generation rate increase, but the local bubble residence time is also prolonged, leading to more persistent bubble coverage behavior.
At 2.0 A/cm2, the bubble coverage reaches its highest level, and the spatial non-uniformity becomes most significant. The high-coverage regions are mainly concentrated in the middle-to-downstream part of the flow field and near the outlet side, where local values approach or exceed 0.85, whereas the inlet region still remains at a relatively lower coverage level. This distribution pattern indicates that bubbles become a key factor affecting local transport conditions under high-current operation. As bubbles are continuously generated and accumulate in the downstream regions, the local liquid pathways are compressed, and the effective mass transfer area is reduced, making it easier for the middle and outlet-side regions to develop into high-coverage zones.
Regarding the temperature effect, increasing the temperature does not fundamentally change the basic spatial pattern of bubble coverage at a given current density. The high-coverage regions are still mainly located in the central and outlet-side areas, while the low-coverage regions remain concentrated near the inlet. This suggests that the spatial pattern of bubble coverage is primarily determined by the flow field structure and the gas–liquid migration pathway, and therefore exhibits certain structural stability. However, temperature does affect the quantitative distribution of coverage among different regions, and it can strengthen the regional difference under high-load conditions to some extent. In particular, at 1.5 and 2.0 A/cm2, the bubble coverage in some central and outlet regions further increases with temperature, indicating that although higher temperature may facilitate bubble detachment, the simultaneously accelerated reaction rate also leads to stronger gas evolution, allowing these regions to maintain a high bubble coverage state.
Overall, current density is the primary factor governing the level of bubble coverage and its spatial non-uniformity. With increasing current density, the bubble distribution evolves from a low-coverage, weak-variation pattern to a high-coverage, strongly heterogeneous spatial structure. In contrast, the effect of temperature is more closely related to the regulation of local coverage magnitude and regional gradients rather than a fundamental change in the distribution pattern itself. These results indicate that in a PEMWE, bubble behavior becomes increasingly intensified with increasing load and forms a distinct location-dependent distribution within the flow field, which provides direct support for the subsequent analysis of the correlation between bubble coverage and local current density.
3.4. In-Plane Uniformity and Correlation Analysis of LCD and Bubble Distribution
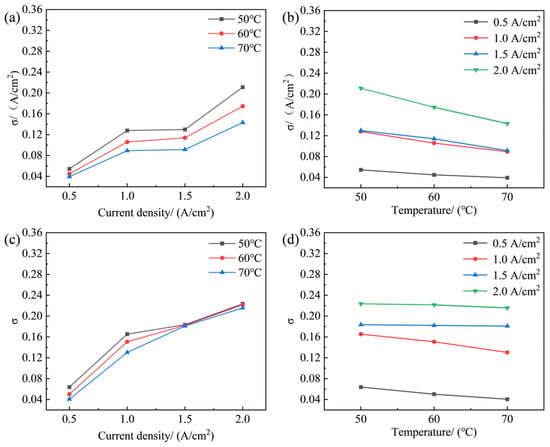
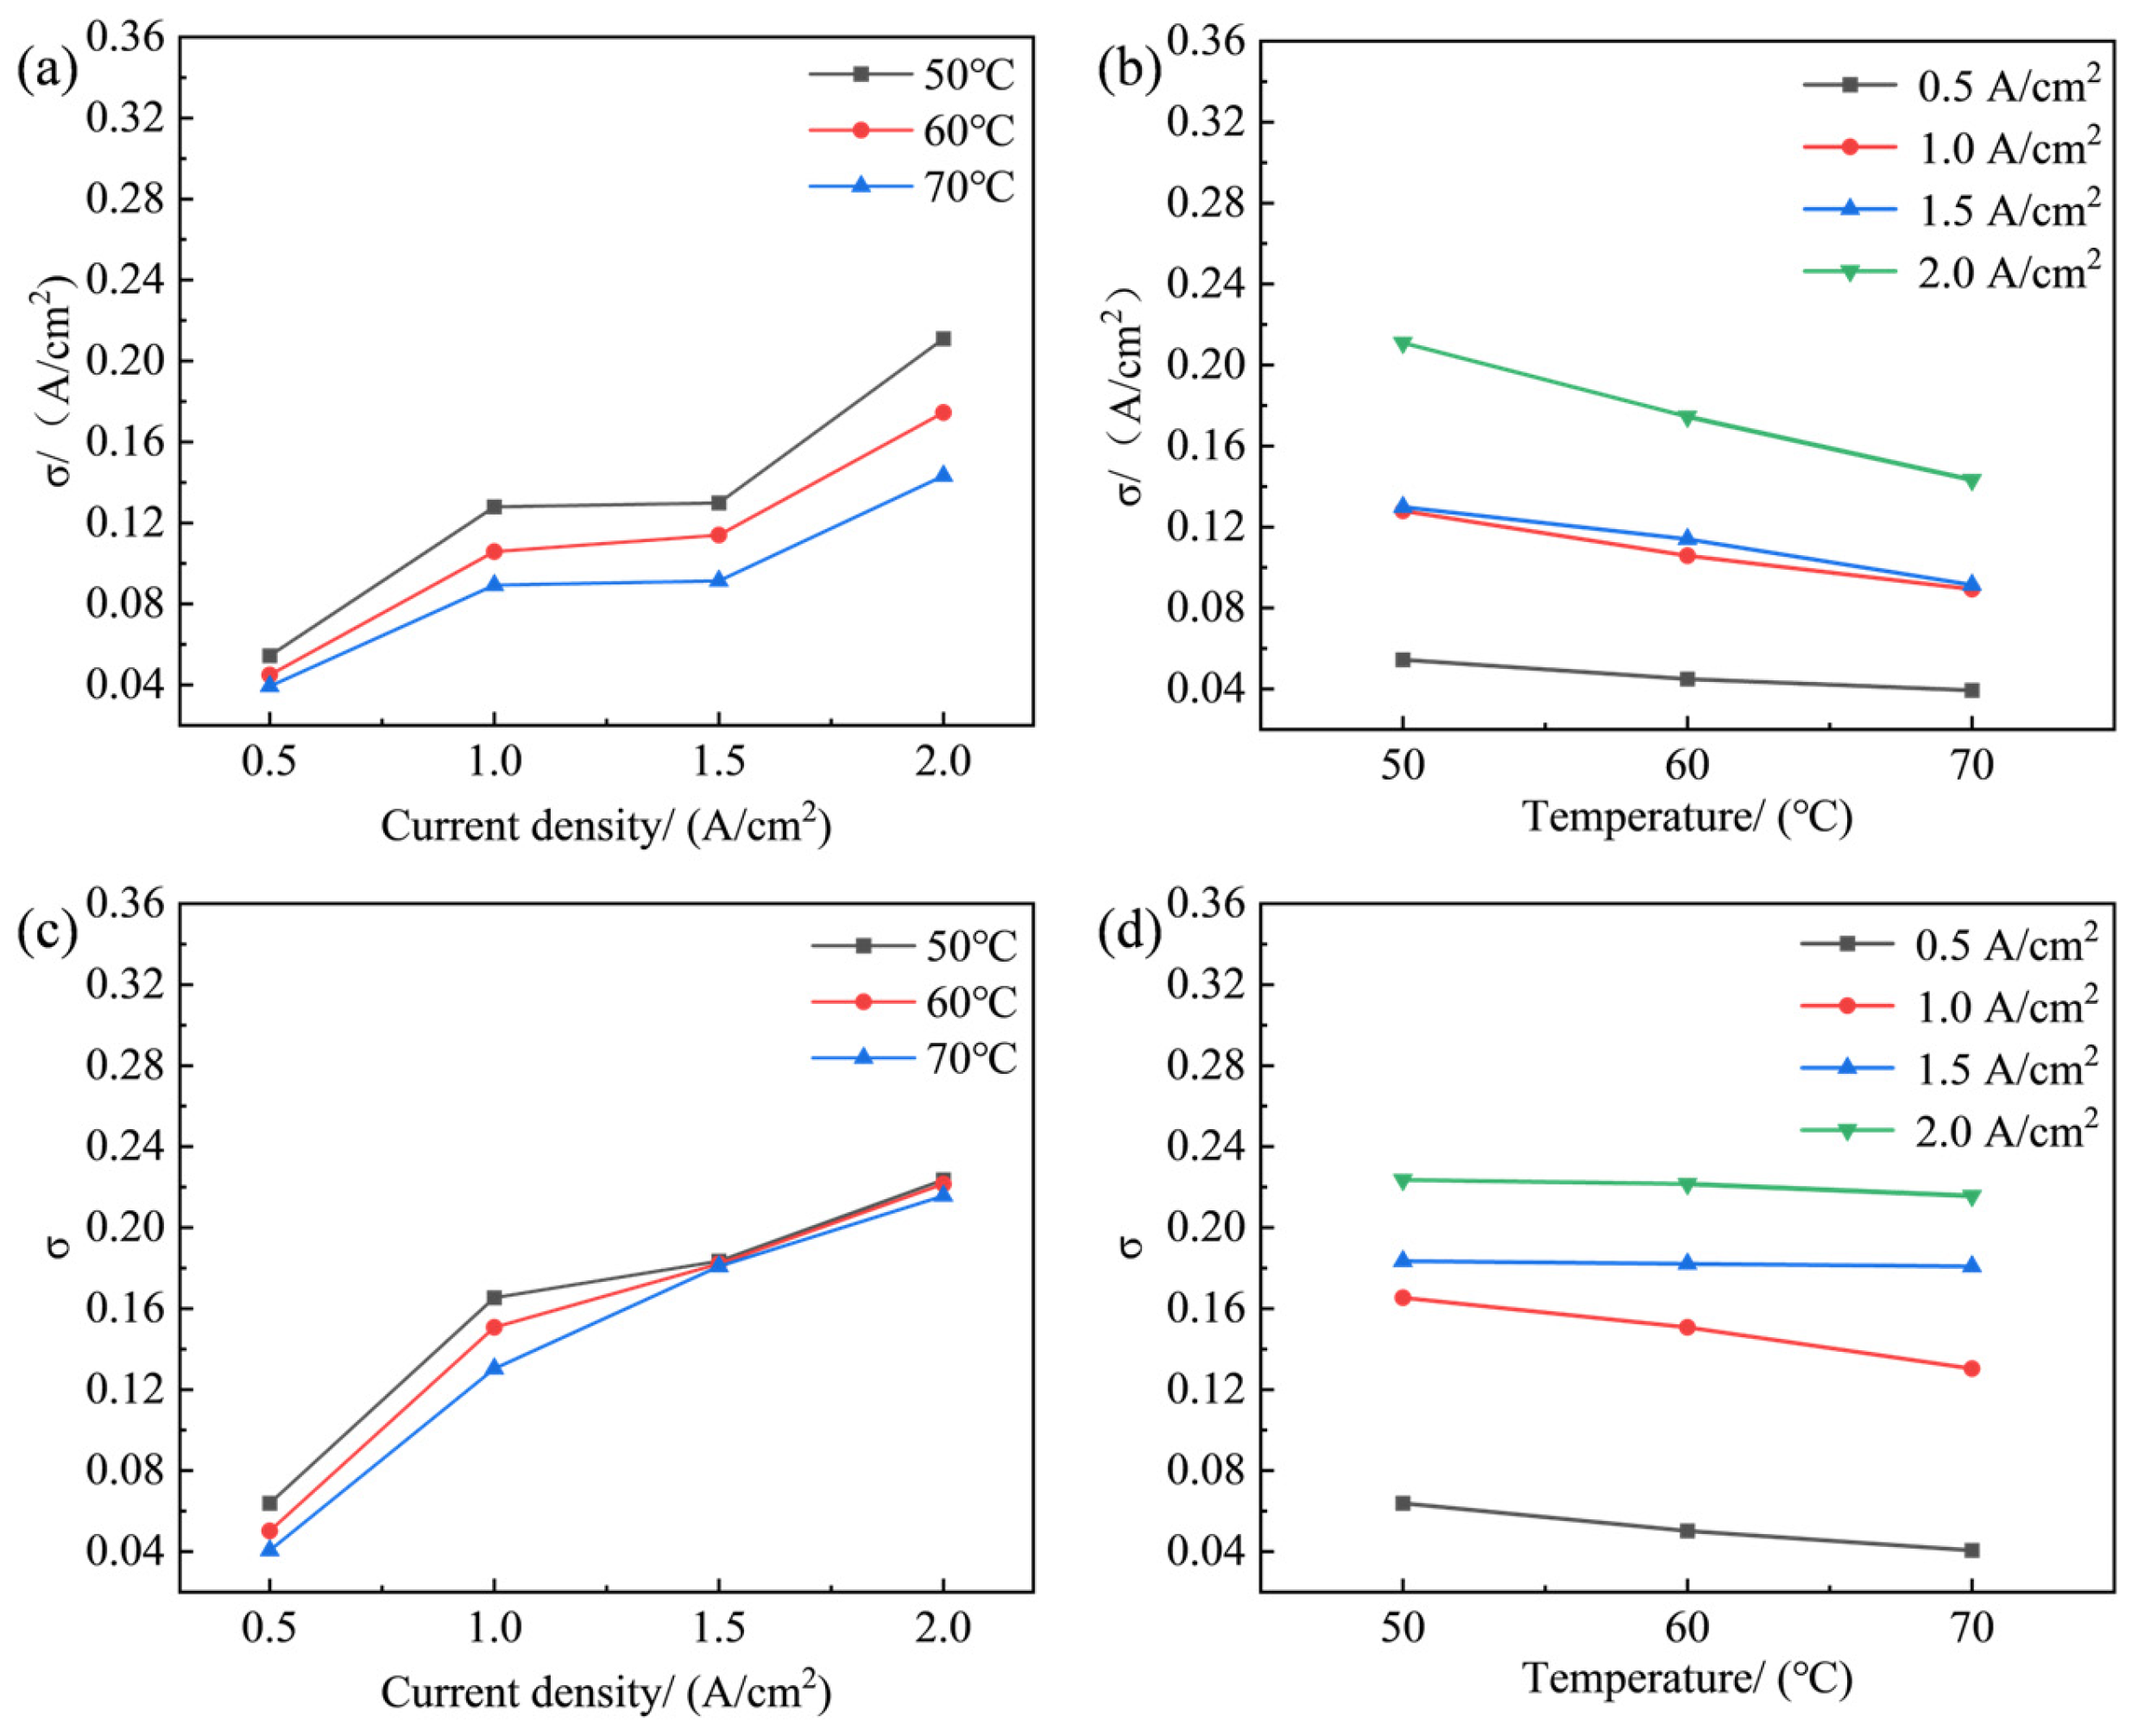
To quantify the coupling relationship between bubble coverage and LCD, the in-plane uniformities of both distributions were compared under different operating conditions. As shown in Figure 8, the non-uniformities of LCD and bubble coverage evolved synchronously. As current density increased, the standard deviations of both distributions increased continuously, whereas increasing temperature led to an overall decrease in both standard deviations. Specifically, increasing temperature reduced the standard deviation of the LCD distribution by about 20–35% and that of the bubble coverage distribution by about 5–20%, depending on the operating condition.
Figure 8.
The influence of current density and temperature on uniformity of LCD distribution and bubble coverage rate. (a) Influence of current density on uniformity of LCD distribution; (b) influence of temperature on uniformity of LCD distribution; (c) influence of current density on uniformity of bubble coverage rate; (d) and influence of temperature on uniformity of bubble coverage rate.
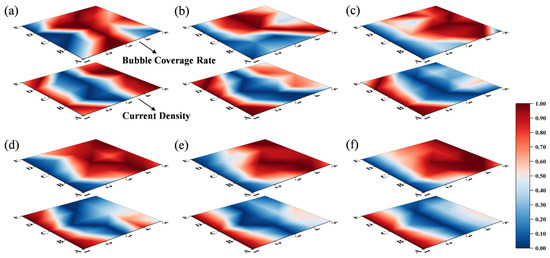
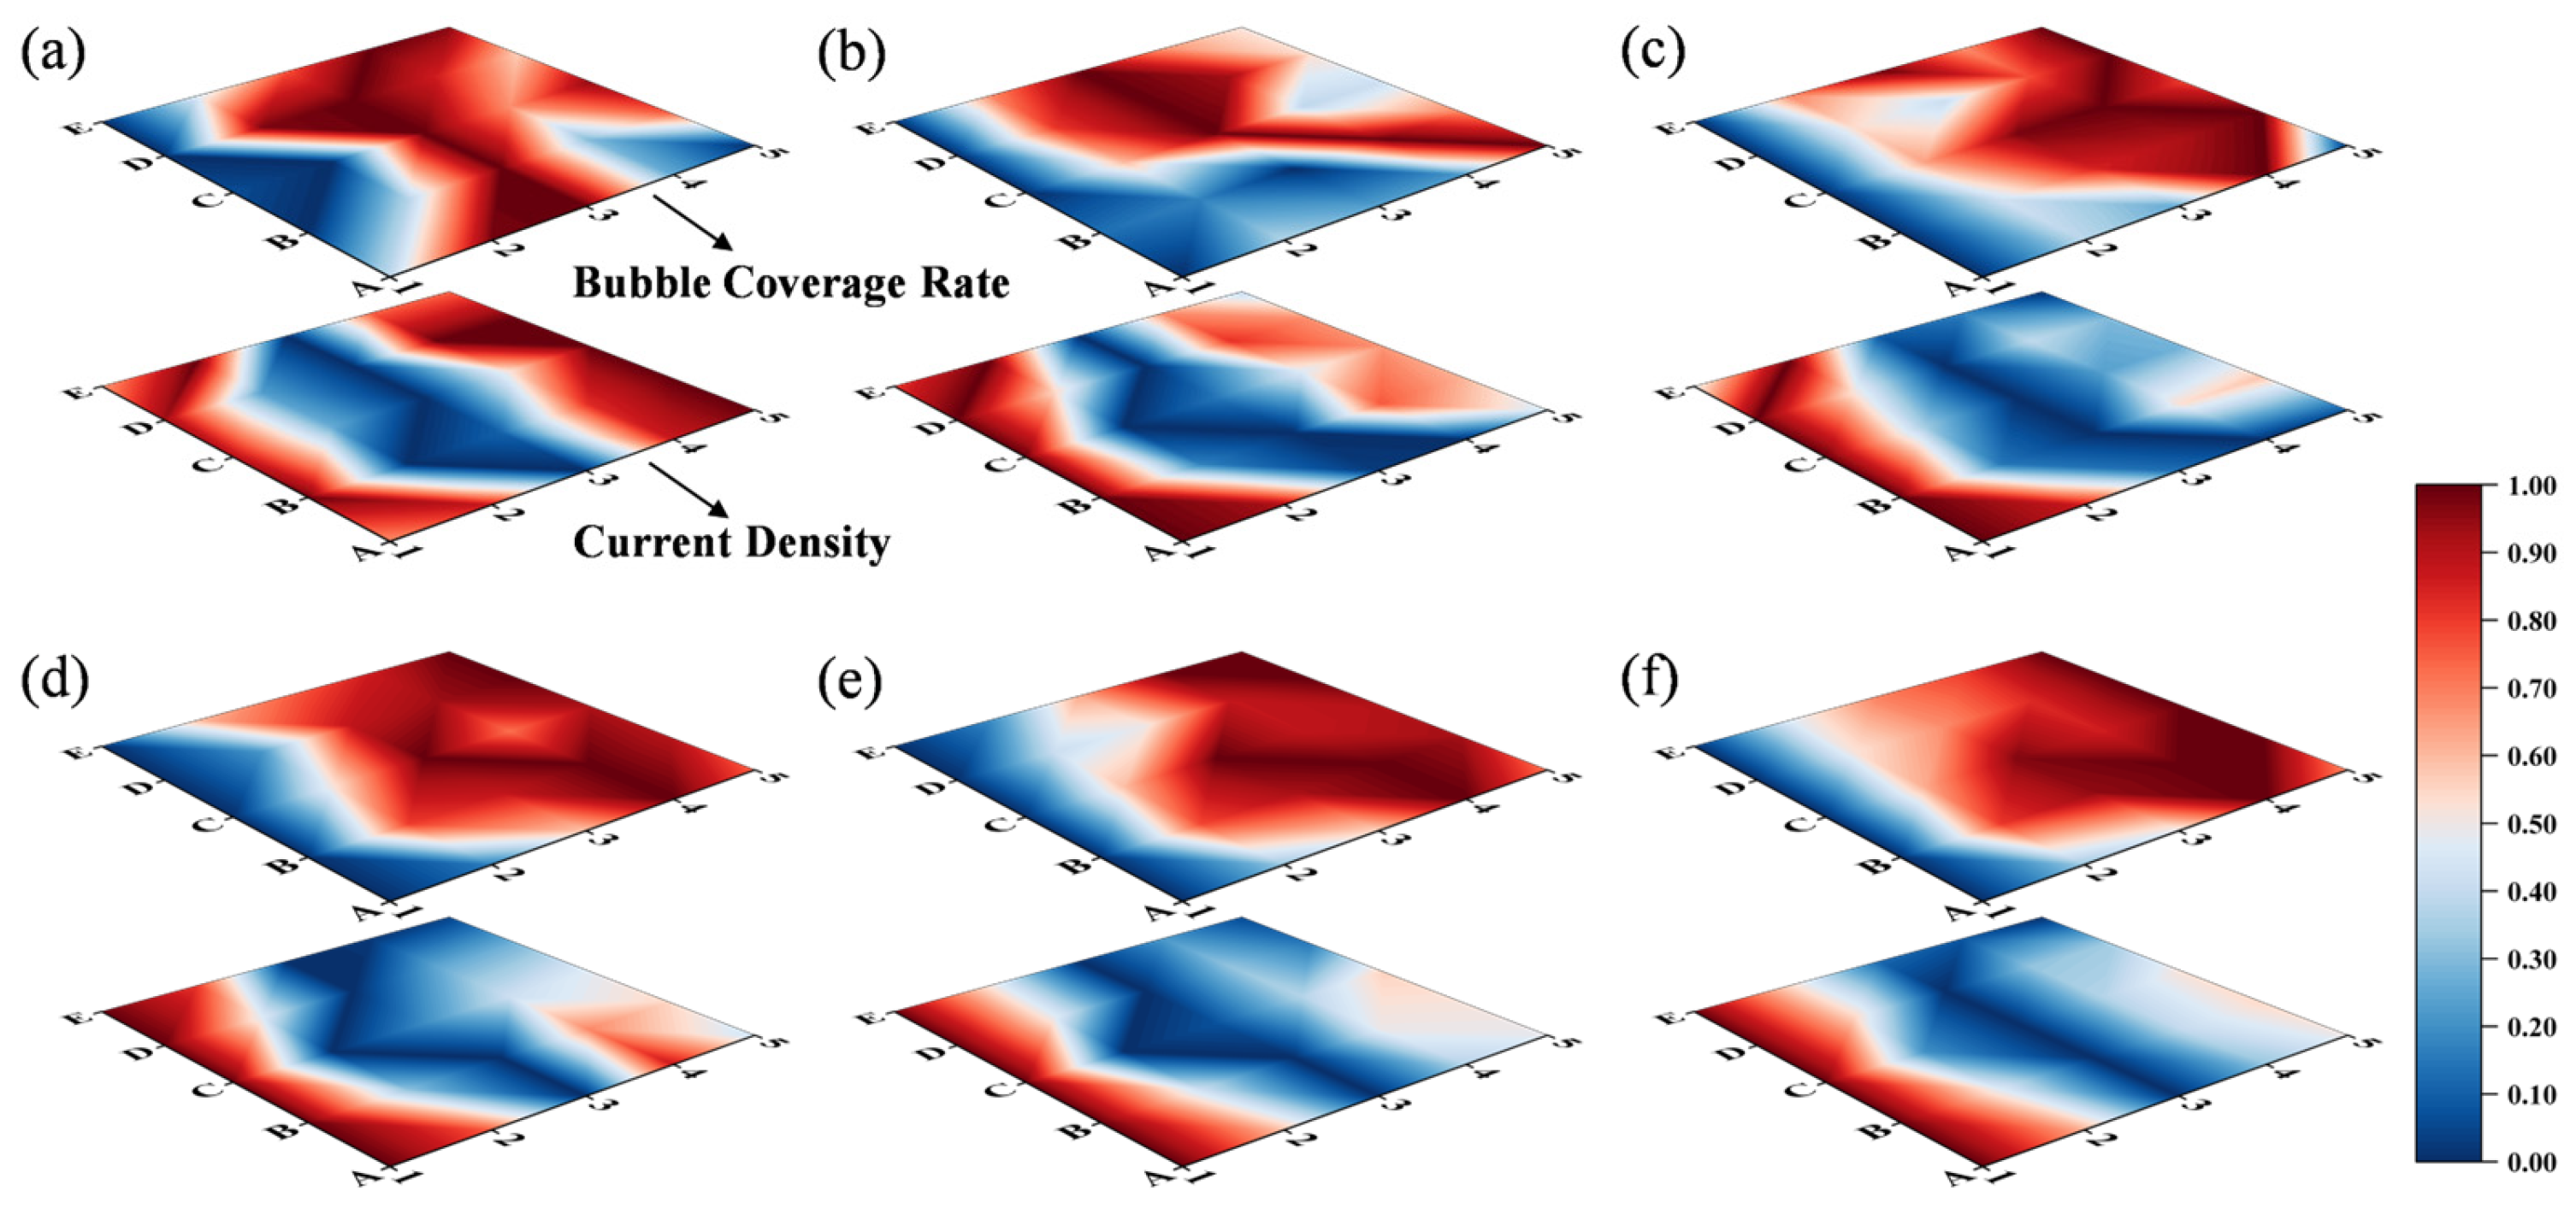
This synchronous evolution indicates that the in-plane heterogeneity of LCD was closely related to that of bubble coverage. Regions with high bubble coverage generally corresponded to regions with low LCD, whereas regions with low bubble coverage tended to maintain relatively high local current density. As further illustrated in Figure 9, this spatial correspondence became increasingly pronounced as current density increased, demonstrating that bubbles gradually became the dominant factor controlling local transport conditions and reaction distribution under high-load operation. Mechanistically, this negative correlation can be explained by the blocking effect of bubbles on the electrochemical interface. Bubble accumulation reduced the effective contact area between liquid water and catalytic sites, increased local mass transfer resistance, and compressed the liquid transport pathways, thereby suppressing local electrochemical activity. As a result, the enhancement of bubble accumulation at high current density directly intensified the in-plane heterogeneity of LCD.
Figure 9.
The normalization of current density distribution (below) and bubble coverage rate (above) at different current densities and temperature. (a) 70 °C 0.5 A/cm2; (b) 70 °C 1.0 A/cm2; (c) 70 °C 1.5 A/cm2; (d) 70 °C 2.0 A/cm2; (e) 60 °C 2.0 A/cm2; and (f) 50 °C 2.0 A/cm2. Numbers 1–5 represent the positions along the flow direction from inlet to outlet, while letters A–E denote the transverse positions across the channel.
However, this relationship should not be interpreted as a simple one-way causality in which bubbles are the sole initial cause of local current redistribution. Instead, the local current distribution in PEMWE is governed by a coupled transport–electrochemical process involving liquid water supply, gas accumulation, local transport resistance, and electrochemical reaction activity. Within this coupled framework, bubble accumulation acts as an increasingly important factor under high current density operation. Specifically, excessive bubble retention can reduce the effective contact area between liquid water and catalytic sites, restrict local transport pathways, and aggravate local mass transfer limitations, thereby suppressing local electrochemical activity and contributing to the observed LCD heterogeneity. At the same time, the local reaction intensity also affects bubble generation and removal behavior. Therefore, the observed negative correlation between bubble coverage and LCD should be understood as the result of coupled local interactions, in which bubble accumulation is a key, but not exclusive factor.
Although increasing temperature partially alleviated the spatial non-uniformity of both distributions, it did not alter the fundamental coupling relationship between bubble coverage and LCD. Therefore, the influence of operating conditions on their correlation can be summarized as follows: high current density strengthened the coupling between the two by intensifying local bubble accumulation, whereas elevated temperature mainly moderated the degree of non-uniformity without changing the basic negative relationship.
3.5. Spatial Variation in the Correlation Between Bubble Coverage and Current Density
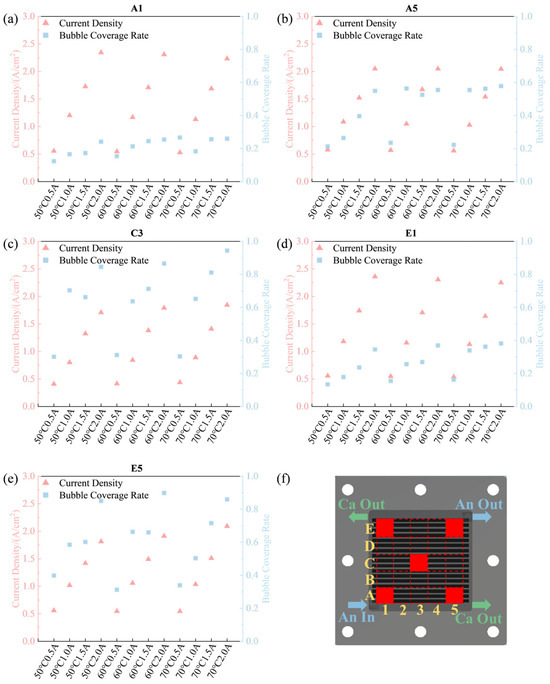
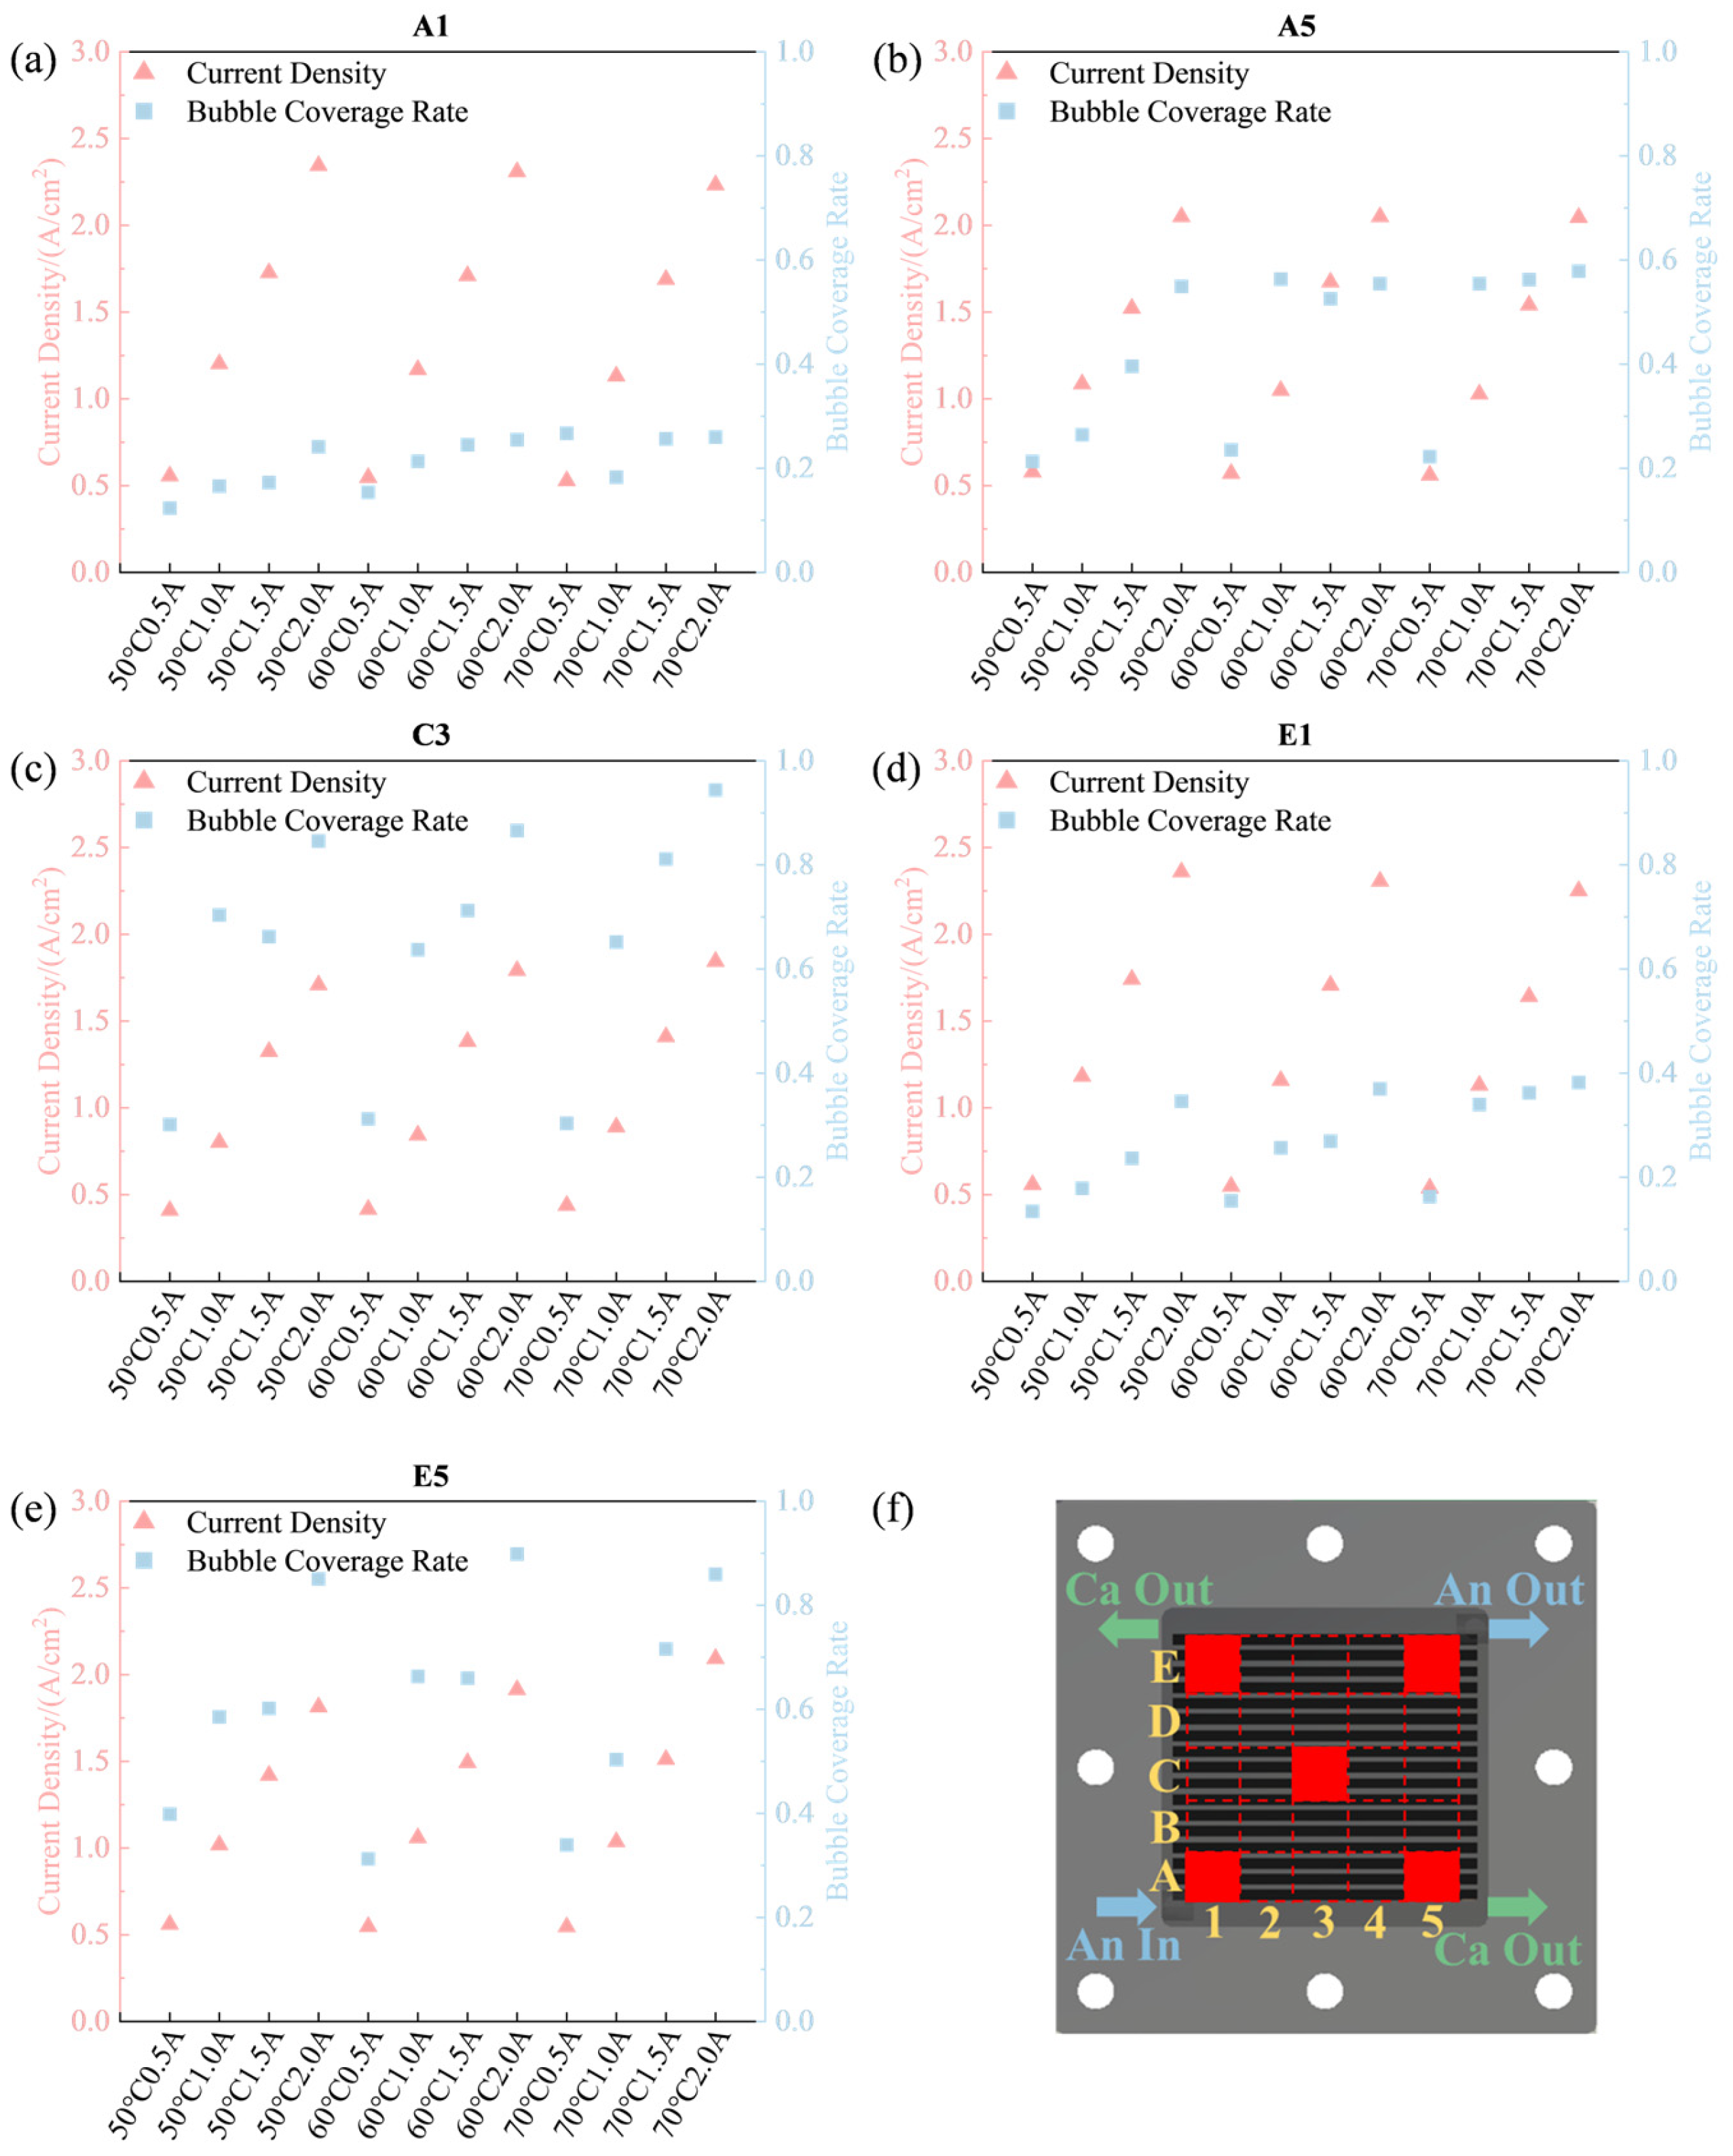
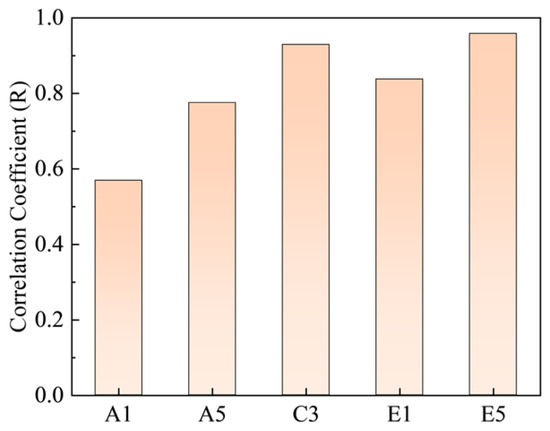
In addition to the overall correlation, the coupling strength between bubble coverage and LCD showed clear spatial dependence. Figure 10 compares the bubble coverage and LCD at five representative positions, namely A1, A5, C3, E1, and E5, while Figure 11 summarizes the corresponding correlation coefficients. The results revealed the following order of correlation strength: E5 > C3 > E1 > A5 > A1.
Figure 10.
Bubble coverage and LCD at five representative positions under different operating conditions. (a) A1; (b) A5; (c) C3; (d) E1; (e) E5; (f) five representative positions. Numbers 1–5 represent the positions along the flow direction from inlet to outlet, while letters A–E denote the transverse positions across the channel.
Figure 11.
The correlation coefficients between bubble coverage and LCD at different positions.
The strongest correlation was observed at E5, followed by C3, E1, A5, and A1, indicating that the coupling between bubble coverage and LCD was much stronger in the central and outlet-side regions than near the inlet. However, it should be noted that correlation strength does not directly represent the absolute magnitude of bubble accumulation. Rather, it reflects the extent to which local current density is controlled by the variation in local bubble coverage.
The weak correlation at A1 was attributed to the dominant influence of reactant supply and convective transport near the inlet. In this region, freshly supplied liquid and stronger flow scouring facilitated bubble removal, so the local current density was governed not only by bubble coverage but also by supply-related factors. Consequently, the direct control of bubbles over LCD remained relatively limited.
By contrast, the much stronger correlations observed in C3, E1, and especially E5 indicate that bubble accumulation became an increasingly important factor controlling local electrochemical activity in the central and downstream regions. As the fluid moved along the flow field, bubbles continuously accumulated and resided longer in the middle-to-downstream part of the channel, leading to stronger blockage of local transport pathways and more direct suppression of LCD.
Notably, the slightly higher correlation at C3 than at E1 does not imply that bubble accumulation was weaker at the outlet-side position E1. Instead, it suggests that the local electrochemical response at E1 was likely influenced by multiple coupled factors in addition to bubble coverage, including edge effects, local flow redistribution, and possible outlet-side manifold influence. In comparison, the central position C3 was less affected by boundary buffering and may therefore represent a region where local bubble retention was translated more directly into mass transfer limitation and LCD suppression. In this sense, the stronger correlation at C3 indicates that the central region was more purely bubble-controlled, whereas the outlet-edge region E1 may have been governed by a more complex superposition of bubble accumulation and boundary-induced transport effects. The particularly high correlation at E5 suggests that this region was most sensitive to bubble accumulation due to the combined effects of downstream transport limitation and edge-related confinement.
Overall, these results indicate that the controlling mechanism of the local reaction environment gradually shifted from reactant supply-dominated near the inlet to bubble accumulation-dominated in the central and outlet regions. This spatial trend was fully consistent with the conclusion that the coupling between bubble coverage and LCD became more pronounced in the central and outlet-side regions. From a design perspective, the present results suggest that flow field optimization should preferentially target the middle-to-downstream region and the outlet-side area. For the central region, structural modifications that enhance local liquid replenishment and bubble detachment, such as locally strengthened convection paths or reduced stagnant zones, are expected to be beneficial. For the outlet-side region, improving the downstream channel transition and outlet-header evacuation capability may help reduce gas residence and local bubble holdup. In addition, gradual or non-uniform channel geometries, such as tapered downstream sections or locally adjusted channel depth, may be promising for mitigating bubble accumulation in the middle-to-downstream part of the flow field. It should be emphasized that these suggestions are mechanism-guided design implications derived from the present measurements rather than experimentally validated optimal geometries within this study.
4. Conclusions
This study integrated visualized transparent PEMWE technology and PCB-based segmented technology to design and fabricate a parallel flow channel single cell, suitable for monitoring the anode oxygen bubble distribution and current density distribution during PEMWE operations. Experimental investigations were conducted to explore the response characteristics of bubble coverage and LCD during the oxygen bubble transport process in PEMWE, and an image post-processing program was utilized for the quantitative analysis of experimental results. This research provides certain reference value for the flow channel design and the formulation of bubble management strategies, with the main conclusions as follows:
- The LCD exhibited persistent in-plane non-uniformity, with lower values in the central region and higher values near the edges. As the average current density increased from 0.5 to 2.0 A/cm2, the LCD range expanded from approximately 0.43–0.53 A/cm2 to 1.75–2.20 A/cm2, while the standard deviation at 50 °C increased from about 0.05 A/cm2 to 0.21 A/cm2. These results confirm that increasing load markedly aggravated the spatial heterogeneity of the reaction distribution. Although increasing temperature did not alter the overall distribution pattern, it mitigated the local differences to some extent.
- Bubble coverage showed a similarly pronounced spatial non-uniformity, with high-coverage regions mainly located in the central and outlet-side areas and low-coverage regions concentrated near the inlet. When the current density increased from 0.5 to 2.0 A/cm2, the local bubble coverage increased from approximately 0.24–0.34 to 0.86–0.91, and its standard deviation rose from about 0.040.06 to 0.22. This indicates that the bubble distribution evolved from a low-coverage, weakly heterogeneous state to a high-coverage, strongly non-uniform state. In contrast, the effect of temperature on the overall bubble distribution pattern was relatively limited and was mainly reflected in the regulation of local coverage level.
- The correlation between bubble coverage and LCD was strongly affected by operating conditions. As the current density increased, the non-uniformities of LCD and bubble coverage were enhanced simultaneously, and their spatial correspondence became increasingly pronounced, indicating that bubbles gradually became the dominant factor controlling local transport conditions and reaction distribution under high-load operation. Although increasing temperature reduced the standard deviation of LCD distribution by approximately 20–35% and that of bubble coverage distribution by about 5–20%, it did not alter the fundamental coupling relationship between bubble coverage and local current density.
- The coupling strength between bubble coverage and LCD exhibited clear spatial dependence, following the E5 > C3 > E1 > A5 > A1 order. The stronger correlation in the central and outlet-side regions than near the inlet indicates that the dominant controlling mechanism of the local reaction environment gradually shifted from reactant supply-dominated to bubble accumulation-dominated along the flow field. It should be emphasized that a stronger correlation does not necessarily correspond to the highest absolute bubble coverage. In particular, the slightly stronger correlation at C3 than at E1 suggests that the central region was more directly governed by bubble-induced transport limitation, whereas the outlet-edge region may additionally have been affected by boundary and manifold-related flow redistribution.
In summary, a clear coupling relationship exists between the local current density distribution and the bubble coverage distribution in PEMWE. This coupling becomes more significant at high current density and in the central and outlet-side regions, suggesting that bubble management in these regions should be prioritized in flow field design and operating strategy optimization. In particular, improving liquid replenishment and bubble detachment in the central region, together with reducing gas residence in the downstream/outlet-side region by optimizing channel transition or outlet-header geometry, may help enhance reaction uniformity and the overall PEMWE performance. These recommendations are mechanism-guided implications derived from the present measurements and still require dedicated structural validation. Meanwhile, the present conclusions are based on a consistent operating condition matrix under a fixed assembly protocol, and the assembly-to-assembly reproducibility of the segment-resolved distributions remains to be further quantified in future work.
Author Contributions
Conceptualization, R.Z.; methodology, W.C. and R.Z.; validation, H.C. and R.Z.; formal analysis, H.C., W.C. and R.Z.; investigation, H.C., W.C. and R.Z.; resources, H.C.; data curation, W.C.; writing—original draft preparation, W.C.; writing—review and editing, H.C., W.C., R.Z., P.P. and P.M.; visualization, H.C. and R.Z.; supervision, H.C., P.P. and P.M.; project administration, H.C.; funding acquisition, H.C. All authors have read and agreed to the published version of the manuscript.
Funding
This research is supported by the National Natural Science Foundation of China (No. 52272373).
Data Availability Statement
The data will be made available on request.
Conflicts of Interest
The authors declare no conflicts of interest.
Abbreviations
The following abbreviations are used in this manuscript:
| PEMWE | proton exchange membrane water electrolysis |
| PCB | printed circuit board |
| LCD | local current density |
| MEA | membrane electrode assembly |
| GDL | gas diffusion layer |
| CCM | catalyst-coated membrane |
References
- Zhuang, Y.; Cui, P.; Long, R.; Liu, W.; Liu, Z. Multi-Objective Optimization of Channel Structure for a Proton Exchange Membrane Water Electrolysis Cell. Int. J. Hydrogen Energy 2024, 49, 337–352. [Google Scholar] [CrossRef] [Scilit]
- Verdin, B.; Fouda-Onana, F.; Germe, S.; Serre, G.; Jacques, P.A.; Millet, P. Operando Current Mapping on PEM Water Electrolysis Cells. Influence of Mechanical Stress. Int. J. Hydrogen Energy 2017, 42, 25848–25859. [Google Scholar] [CrossRef] [Scilit]
- Yuan, S.; Zhao, C.; Cai, X.; An, L.; Shen, S.; Yan, X.; Zhang, J. Bubble Evolution and Transport in PEM Water Electrolysis: Mechanism, Impact, and Management. Prog. Energy Combust. Sci. 2023, 96, 101075. [Google Scholar] [CrossRef] [Scilit]
- Wismer, S.E.; Grabovetska, V.; Al-Douri, A.; Groth, K.M. Fault Tree and Importance Measure Analysis of a PEM Electrolyzer for Hydrogen Production at a Nuclear Power Plant. Int. J. Hydrogen Energy 2025, 180, 151773. [Google Scholar] [CrossRef] [Scilit]
- Zerrougui, I.; Li, Z.; Hissel, D. Toward Optimal Operations of Long-Lifetime PEM Electrolysis: Degradation Mechanisms, Modeling, Diagnostics, and Control. Int. J. Hydrogen Energy 2025, 193, 152297. [Google Scholar] [CrossRef] [Scilit]
- Li, Q.; He, Y.; Pan, L.; Ma, X.; Zhang, L.; Sun, W.; Ma, Z.; Zhu, L.; Lian, Q.; Tang, S. Oxygen Transport under Fluctuating Currents of Porous Transport Layers in Proton Exchange Membrane Water Electrolysis: Insights and Optimization. Int. J. Hydrogen Energy 2025, 127, 252–264. [Google Scholar] [CrossRef] [Scilit]
- Zhang, X.; Wang, J.; Habudula, G.; Liu, J.; Kang, T. A Review of Gas-Liquid Flow Characteristics of Anode Porous Transport Layer in Proton Exchange Membrane Electrolysis Cell. Int. J. Hydrogen Energy 2025, 100, 1010–1029. [Google Scholar] [CrossRef] [Scilit]
- Taie, Z.; Peng, X.; Kulkarni, D.; Zenyuk, I.; Weber, A.Z.; Hagen, C.; Danilovic, N. Pathway to Complete Energy Sector Decarbonization with Available Iridium Resources Using Ultralow Loaded Water Electrolyzers. ACS Appl. Mater. Interfaces 2020, 12, 52701–52712. [Google Scholar] [CrossRef] [Scilit]
- Vogt, H. The Quantities Affecting the Bubble Coverage of Gas-Evolving Electrodes. Electrochim. Acta 2017, 235, 495–499. [Google Scholar] [CrossRef] [Scilit]
- Iwata, R.; Zhang, L.; Wilke, K.L.; Gong, S.; He, M.; Gallant, B.M.; Wang, E.N. Bubble Growth and Departure Modes on Wettable/Non-Wettable Porous Foams in Alkaline Water Splitting. Joule 2021, 5, 887–900. [Google Scholar] [CrossRef] [Scilit]
- Zhou, H.; Chen, B.; Meng, K.; Chen, W.; Li, G.; Tu, Z. Experimental Investigation of Degradation Mechanism in Proton Exchange Membrane Water Electrolyzer under Prolonged and Severe Bubble Accumulation Condition. Chem. Eng. J. 2024, 491, 152202. [Google Scholar] [CrossRef] [Scilit]
- Zhou, H.; Meng, K.; Chen, W.; Chen, B. Two-Phase Flow Evolution and Bubble Transport Characteristics in Flow Field of Proton Exchange Membrane Water Electrolyzer Based on Volume of Fluid-Coupled Electrochemical Method. J. Clean Prod. 2023, 425, 138988. [Google Scholar] [CrossRef] [Scilit]
- Wang, W.; Han, B.; Cao, B.; Mo, J. Three-Dimensional Numerical Simulation of Bubble Dynamics and Design Optimization of Microchannel in Proton Exchange Membrane Water Electrolyzers. Int. J. Hydrogen Energy 2023, 48, 36240–36253. [Google Scholar] [CrossRef] [Scilit]
- Chang, H.-M.J.; Firas, N.M.; Lang, J.T.; Ochoa, J.A.L.; Stansberry, J.M.; Parkinson, D.Y.; Karatay, E.; Danilovic, N.; Zenyuk, I.V. Visualizing Oxygen Distribution in the Along-the-Channel Direction of Polymer Electrolyte Membrane Water Electrolyzers Using X-Ray Imaging. J. Electrochem. Soc. 2025, 172, 014506. [Google Scholar] [CrossRef] [Scilit]
- Lee, C.; Banerjee, R.; Ge, N.; Lee, J.K.; Zhao, B.; Baltic, E.; LaManna, J.M.; Hussey, D.S.; Jacobson, D.L.; Abouatallah, R.; et al. The Effect of Cathode Nitrogen Purging on Cell Performance and in Operando Neutron Imaging of a Polymer Electrolyte Membrane Electrolyzer. Electrochim. Acta 2018, 279, 91–98. [Google Scholar] [CrossRef] [Scilit]
- Yi, Q.; Ai, T.; Han, Y.; Zhu, Z.; Fang, W.; Zhou, H. Research on the Mechanism of Bubble Sizes Evolution in Industrial-Scale Bipolar Plates with Serpentine Flow Field. Chem. Eng. J. 2025, 509, 161292. [Google Scholar] [CrossRef] [Scilit]
- Wang, W.; Yu, S.; Li, K.; Ding, L.; Xie, Z.; Li, Y.; Yang, G.; Cullen, D.A.; Yu, H.; Kang, Z.; et al. Insights into the Rapid Two-Phase Transport Dynamics in Different Structured Porous Transport Layers of Water Electrolyzers through High-Speed Visualization. J. Power Sources 2021, 516, 230641. [Google Scholar] [CrossRef] [Scilit]
- Majasan, J.O.; Cho, J.I.S.; Dedigama, I.; Tsaoulidis, D.; Shearing, P.; Brett, D.J.L. Two-Phase Flow Behaviour and Performance of Polymer Electrolyte Membrane Electrolysers: Electrochemical and Optical Characterisation. Int. J. Hydrogen Energy 2018, 43, 15659–15672. [Google Scholar] [CrossRef] [Scilit]
- Su, X.; Xu, L.; Zhu, D.; Hu, B.; Mi, L. Electrochemical Performance Study of Proton Exchange Membrane Electrolyzer Considering the Effect of Bubble Coverage. Int. J. Hydrogen Energy 2023, 48, 27079–27094. [Google Scholar] [CrossRef] [Scilit]
- Zhu, D.; Xu, L.; Su, X.; Hu, B.; Jia, T.; Mi, L. Experimental Study of the Effect of Mechanical Vibration and Water Velocity on Bubble Management in PEM Electrolysis Cell. Int. J. Hydrogen Energy 2024, 49, 390–403. [Google Scholar] [CrossRef] [Scilit]
- Hu, B.; He, S.; Zhu, D.; Xu, L.; Su, X.; Wang, X. Study of Optimization and Prediction Methods for PEMEC Performance Considering the Effects of Multiple Operating Parameters. Int. J. Hydrogen Energy 2024, 55, 1273–1285. [Google Scholar] [CrossRef] [Scilit]
- Hu, B.; He, S.; Su, X.; Xu, L.; Zhu, D. Experimental Study of the Effect of Fastening Bolts on PEMEC Performance. Int. J. Hydrogen Energy 2023, 48, 35050–35063. [Google Scholar] [CrossRef] [Scilit]
- Cho, K.M.; Deshmukh, P.R.; Shin, W.G. Hydrodynamic Behavior of Bubbles at Gas-Evolving Electrode in Ultrasonic Field during Water Electrolysis. Ultrason. Sonochem. 2021, 80, 105796. [Google Scholar] [CrossRef] [Scilit] [PubMed]
- Xia, Z.; Chen, H.; Li, W.; Zhang, R.; Xu, Y.; Zhang, T.; Pei, P. Characterization and Analysis of Current Distribution for Oxygen Starvation Diagnosis: A Research Based on Segmented PEMFC Technology. Renew. Energy 2024, 237, 121757. [Google Scholar] [CrossRef] [Scilit]
- Chen, H.; Shi, E.; Zhang, R.; Ren, P.; Wang, H.; Zhu, Z.; Fu, X.; Pei, P. Mechanisms and Characterization of Interzone Mass Transfer Inhomogeneity in PEM Fuel Cells. Chem. Eng. J. 2024, 500, 157063. [Google Scholar] [CrossRef] [Scilit]
- Meng, K.; Zhou, H.; Yang, G.; Chen, W.; Chen, B. Local Performance Response Behavior during Liquid Water Transport of a Hydrogen-Oxygen Proton Exchange Membrane Fuel Cell: An Experimental Investigation. Energy Conv. Manag. 2023, 293, 117510. [Google Scholar] [CrossRef] [Scilit]
- Baumann, N.; Blankenship, A.; Dorn, M.; Cremers, C. Evaluating Current Distribution and Influence of Defect Sites for Graphitic Compound Bipolar Plate Materials. Fuel Cells 2020, 20, 40–47. [Google Scholar] [CrossRef] [Scilit]
- Dedigama, I.; Angeli, P.; van Dijk, N.; Millichamp, J.; Tsaoulidis, D.; Shearing, P.R.; Brett, D.J.L. Current Density Mapping and Optical Flow Visualisation of a Polymer Electrolyte Membrane Water Electrolyser. J. Power Sources 2014, 265, 97–103. [Google Scholar] [CrossRef] [Scilit]
- Immerz, C.; Bensmann, B.; Trinke, P.; Suermann, M.; Hanke-Rauschenbach, R. Local Current Density and Electrochemical Impedance Measurements within 50 Cm Single-Channel PEM Electrolysis Cell. J. Electrochem. Soc. 2018, 165, F1292–F1299. [Google Scholar] [CrossRef] [Scilit]
- Al Shakhshir, S.; Zhou, F.; Kaer, S.K. On the Effect of Clamping Pressure and Methods on the Current Distribution of a Proton Exchange Membrane Water Electrolyzer. In Proceedings of the Selected Proceedings from the 233rd Ecs Meeting; Electrochemical Soc Inc.: Pennington, South Africa, 2018; Volume 85, pp. 995–1004. [Google Scholar]
- Zhang, T.; Cao, Y.; Zhang, Y.; Wang, K.; Xu, C.; Ye, F. Relationship of Local Current and Two-Phase Flow in Proton Exchange Membrane Electrolyzer Cells. J. Power Sources 2022, 542, 231742. [Google Scholar] [CrossRef] [Scilit]
- Roy, A.; Roenning, F.H.; Aaron, D.S.; Zhang, F.-Y.; Mench, M.M. EWTN: Quantifying Mass Transport to Enable Water Electrolyzer Architectures with Low Flow-Rate Sensitivity. J. Electrochem. Soc. 2024, 171, 034508. [Google Scholar] [CrossRef] [Scilit]
- Wang, K.; Wang, Y.; Yu, Z.; Xiao, F.; Ta, L.; Ye, F.; Xu, C.; Liu, J. Multi-Technique Experimental Characterization of a PEM Electrolyzer Cell with Interdigitated-Jet Hole Flow Field. Energy Conv. Manag. 2024, 306, 118276. [Google Scholar] [CrossRef] [Scilit]
- Wang, K.; Xu, C.; Xiao, F.; Zhang, T.; Ta, L.; Ma, S.; Liang, J.; Wang, Z.; Ye, F.; Liu, J. Operando Analysis of In-Plane Heterogeneity for the PEM Electrolyzer Cell: Mappings of Temperature and Current Density. J. Clean Prod. 2024, 436, 140586. [Google Scholar] [CrossRef] [Scilit]
- Ma, S.; Wang, K.; Xiao, F.; Zhang, T.; Ye, F.; Xu, C.; Liu, J. In-Plane Performance Analysis of PEM Electrolyzer Cell under Multiple Operating Conditions Based on Anode Segmented Visualization Design. Appl. Energy 2025, 381, 125167. [Google Scholar] [CrossRef] [Scilit]
- Kimmel, B.; Garcia-Sanchez, D.; Morawietz, T.; Schulze, M.; Biswas, I.; Gago, A.S.; Friedrich, K.A. Opportunities of in Situ Diagnostics and Current Distribution in Proton Exchange Membrane Water Electrolyzers with Segmented Bipolar Plates. Appl. Energy 2025, 380, 125106. [Google Scholar] [CrossRef] [Scilit]
- ISO 19036:2019; Microbiology of the Food Chain—Estimation of Measurement Uncertainty for Quantitative Determinations. ISO: Geneva, Switzerland, 2019.
- Tibirica, C.B.; Ribatski, G. Flow Patterns and Bubble Departure Fundamental Characteristics during Flow Boiling in Microscale Channels. Exp. Therm. Fluid Sci. 2014, 59, 152–165. [Google Scholar] [CrossRef] [Scilit]
- Ito, H.; Maeda, T.; Nakano, A.; Hwang, C.M.; Ishida, M.; Kato, A.; Yoshida, T. Experimental Study on Porous Current Collectors of PEM Electrolyzers. Int. J. Hydrogen Energy 2012, 37, 7418–7428. [Google Scholar] [CrossRef] [Scilit]

Disclaimer/Publisher’s Note: The statements, opinions and data contained in all publications are solely those of the individual author(s) and contributor(s) and not of MDPI and/or the editor(s). MDPI and/or the editor(s) disclaim responsibility for any injury to people or property resulting from any ideas, methods, instructions or products referred to in the content. |
© 2026 by the authors. Licensee MDPI, Basel, Switzerland. This article is an open access article distributed under the terms and conditions of the Creative Commons Attribution (CC BY) license.