1. Introduction
At present, in many wind farms, the operating period of wind turbines is approaching their design life. These aging turbines feature small individual capacity and low operational efficiency [
1]. Consequently, it is necessary to repower the wind farms, i.e., adopt the wind turbines with larger unit capacity and advanced technology to replace the aging wind turbines. By 2030, the market scale for such wind farm repowering projects in China alone is projected to reach 200 GW [
2]. Notably, the aging wind turbines have usually accumulated more than a decade of historical operational data, such as nacelle wind speed, power, etc. Making full use of these operational data to assess the spatial distribution characteristics of wind resources can significantly reduce wind measurement costs while improving the accuracy of wind resource assessment. However, nacelle wind speed is affected by airflow disturbance caused by rotor rotation and airflow distortion induced by the nacelle shape, thus resulting in significant deviations from the actual inflow wind speed of the turbines [
3,
4,
5]. Therefore, establishing a high-precision nacelle wind speed correction model and accurately calculating the inflow wind speed have become a research hotspot in such repowering wind farms.
Methods for calculating turbine wind speed based on measured inflow are widely used in engineering. Their basic idea is to install wind measurement equipment at a position 2–4 times the rotor diameter in front of the rotor to obtain the measured inflow wind speed of the turbine [
6], and then establish the mathematical relationship between the measured wind speed and the nacelle wind speed to realize the calculation of the inflow wind speed [
7]. The IEC standard [
8] provides the nacelle transfer function (NTF) method based on measured inflow, which is often used in turbine power curve testing. On this basis, Lou et al. [
9] propose the binned NTF method by fitting wind speed in segments at fixed intervals; Gao et al. [
10] divide the wind speed interval according to the turbine control strategy and use high-order polynomial fitting to adapt to the changes in the nacelle transfer function under different operating states, thereby improving the calculation accuracy. Yu et al. [
11] expand the application scope of the nacelle transfer function and apply the binned NTF method to the test of wind turbine drive chain efficiency. In addition, Zhang et al. [
12] consider the influence of turbulence, introduce a turbulence correction term, and propose the dual NTF method; Vivas et al. [
13] take the rotor speed as an additional variable to improve the accuracy of inflow wind speed calculation for stall-controlled wind turbines in the high wind speed region. Yang [
14] proposed a nacelle wind speed correction model based on convolutional neural networks. The model adopts multi-layer convolution and pooling, which can effectively filter the influences of wind turbine wake and blade disturbance, highly abstract feature variables, and improve the accuracy of corrected wind speed. Gao et al. [
15] constructed a pre-turbine wind speed mapping method based on the LSTM model and verified it through lidar wind measurement experiments at a wind farm. Based on lidar wind measurement data and SCADA system data, the training set, test set, and validation set were divided. This model was established to learn the transfer relationship between nacelle wind speed measurements and effective incoming wind speed. The results show that wind speeds from the proposed mapping method agree well with lidar measurements. Although the above methods are widely used, their modeling relies on measured inflow wind speed, which requires additional deployment of wind measurement equipment for wind measurement, resulting in high time and economic costs, which limit their application in wind resource assessment of repowering projects.
Based on physical modeling, methods for calculating the inflow wind speed without the need for measured inflow wind speed can be established. Liu et al. [
16] use the rotor element momentum model to correct the nacelle wind speed to the inflow wind speed; Ren et al. [
17] simulate the turbine flow field based on the actuator disk model, take the average wind speed at the actuator disk position as the reference, and infer the inflow wind speed through iteration of the inverse function using the thrust coefficient–wind speed curve. Liu et al. [
18] consider wind shear, tower shadow, and turbine operating characteristics and propose an inflow wind speed calculation model based on equivalent power. The above methods all adopt simplified models for physical modeling, resulting in relatively large errors. In recent years, data-driven methods have also been applied to inflow wind speed calculation. Delbos et al. [
19] use transfer learning to calculate inflow wind speed, combine the actual operation data of wind turbines with simulation-generated operation data, and use a neural network model to correct the nacelle wind speed; this method is complex in calculation and has low accuracy at high wind speeds. Carullo et al. [
20] use the mapping relationship between theoretical power and wind speed to calculate the inflow wind speed through statistical methods of empirical distribution functions; however, after the wind turbine power reaches the rated value, the corresponding relationship between power and wind speed is no longer unique, so this method cannot be used in the high wind speed region greater than the rated wind speed. It is worth noting that in the high wind speed region, the pitch control system of the wind turbine adjusts the pitch angle to maintain the power near its rated value. In this stage, the pitch angle shows an obvious monotonic correlation with the inflow wind speed. Therefore, a calculation model for the high wind speed region can be established based on the pitch angle curve, so as to reconstruct the mapping relationship between the nacelle wind speed and the inflow wind speed above the rated wind speed.
This paper proposes a piecewise calculation method for inflow wind speed integrating wind turbine pitch angle and power (Piecewise Model of Combined Parameters, PMCP). According to the theoretical operating characteristics and historical operation data of the turbine, this method models the combination of two operating parameters, power and pitch angle, and establishes the mathematical relationship between the turbine inflow wind speed and the nacelle wind speed using the empirical distribution function. The PMCP method does not require additional deployment of wind measurement equipment and can realize reliable calculation of time-series inflow wind speed over the entire wind speed range, only by using the historical operation data of the turbine. The method is simple and feasible, and can effectively improve the wind energy resource assessment accuracy of repowering projects.
2. Segmented Modeling Method for Inflow Wind Speed Based on Operational Data
2.1. Modeling Approach
According to the theoretical operating characteristics of wind turbines, cut-in, rated and cut-out wind speeds are the three core characteristic wind speeds that define its full operating conditions, which refer to the minimum speed for startup and grid-connected generation, the speed corresponding to rated power, and the maximum speed for safe shutdown, respectively.
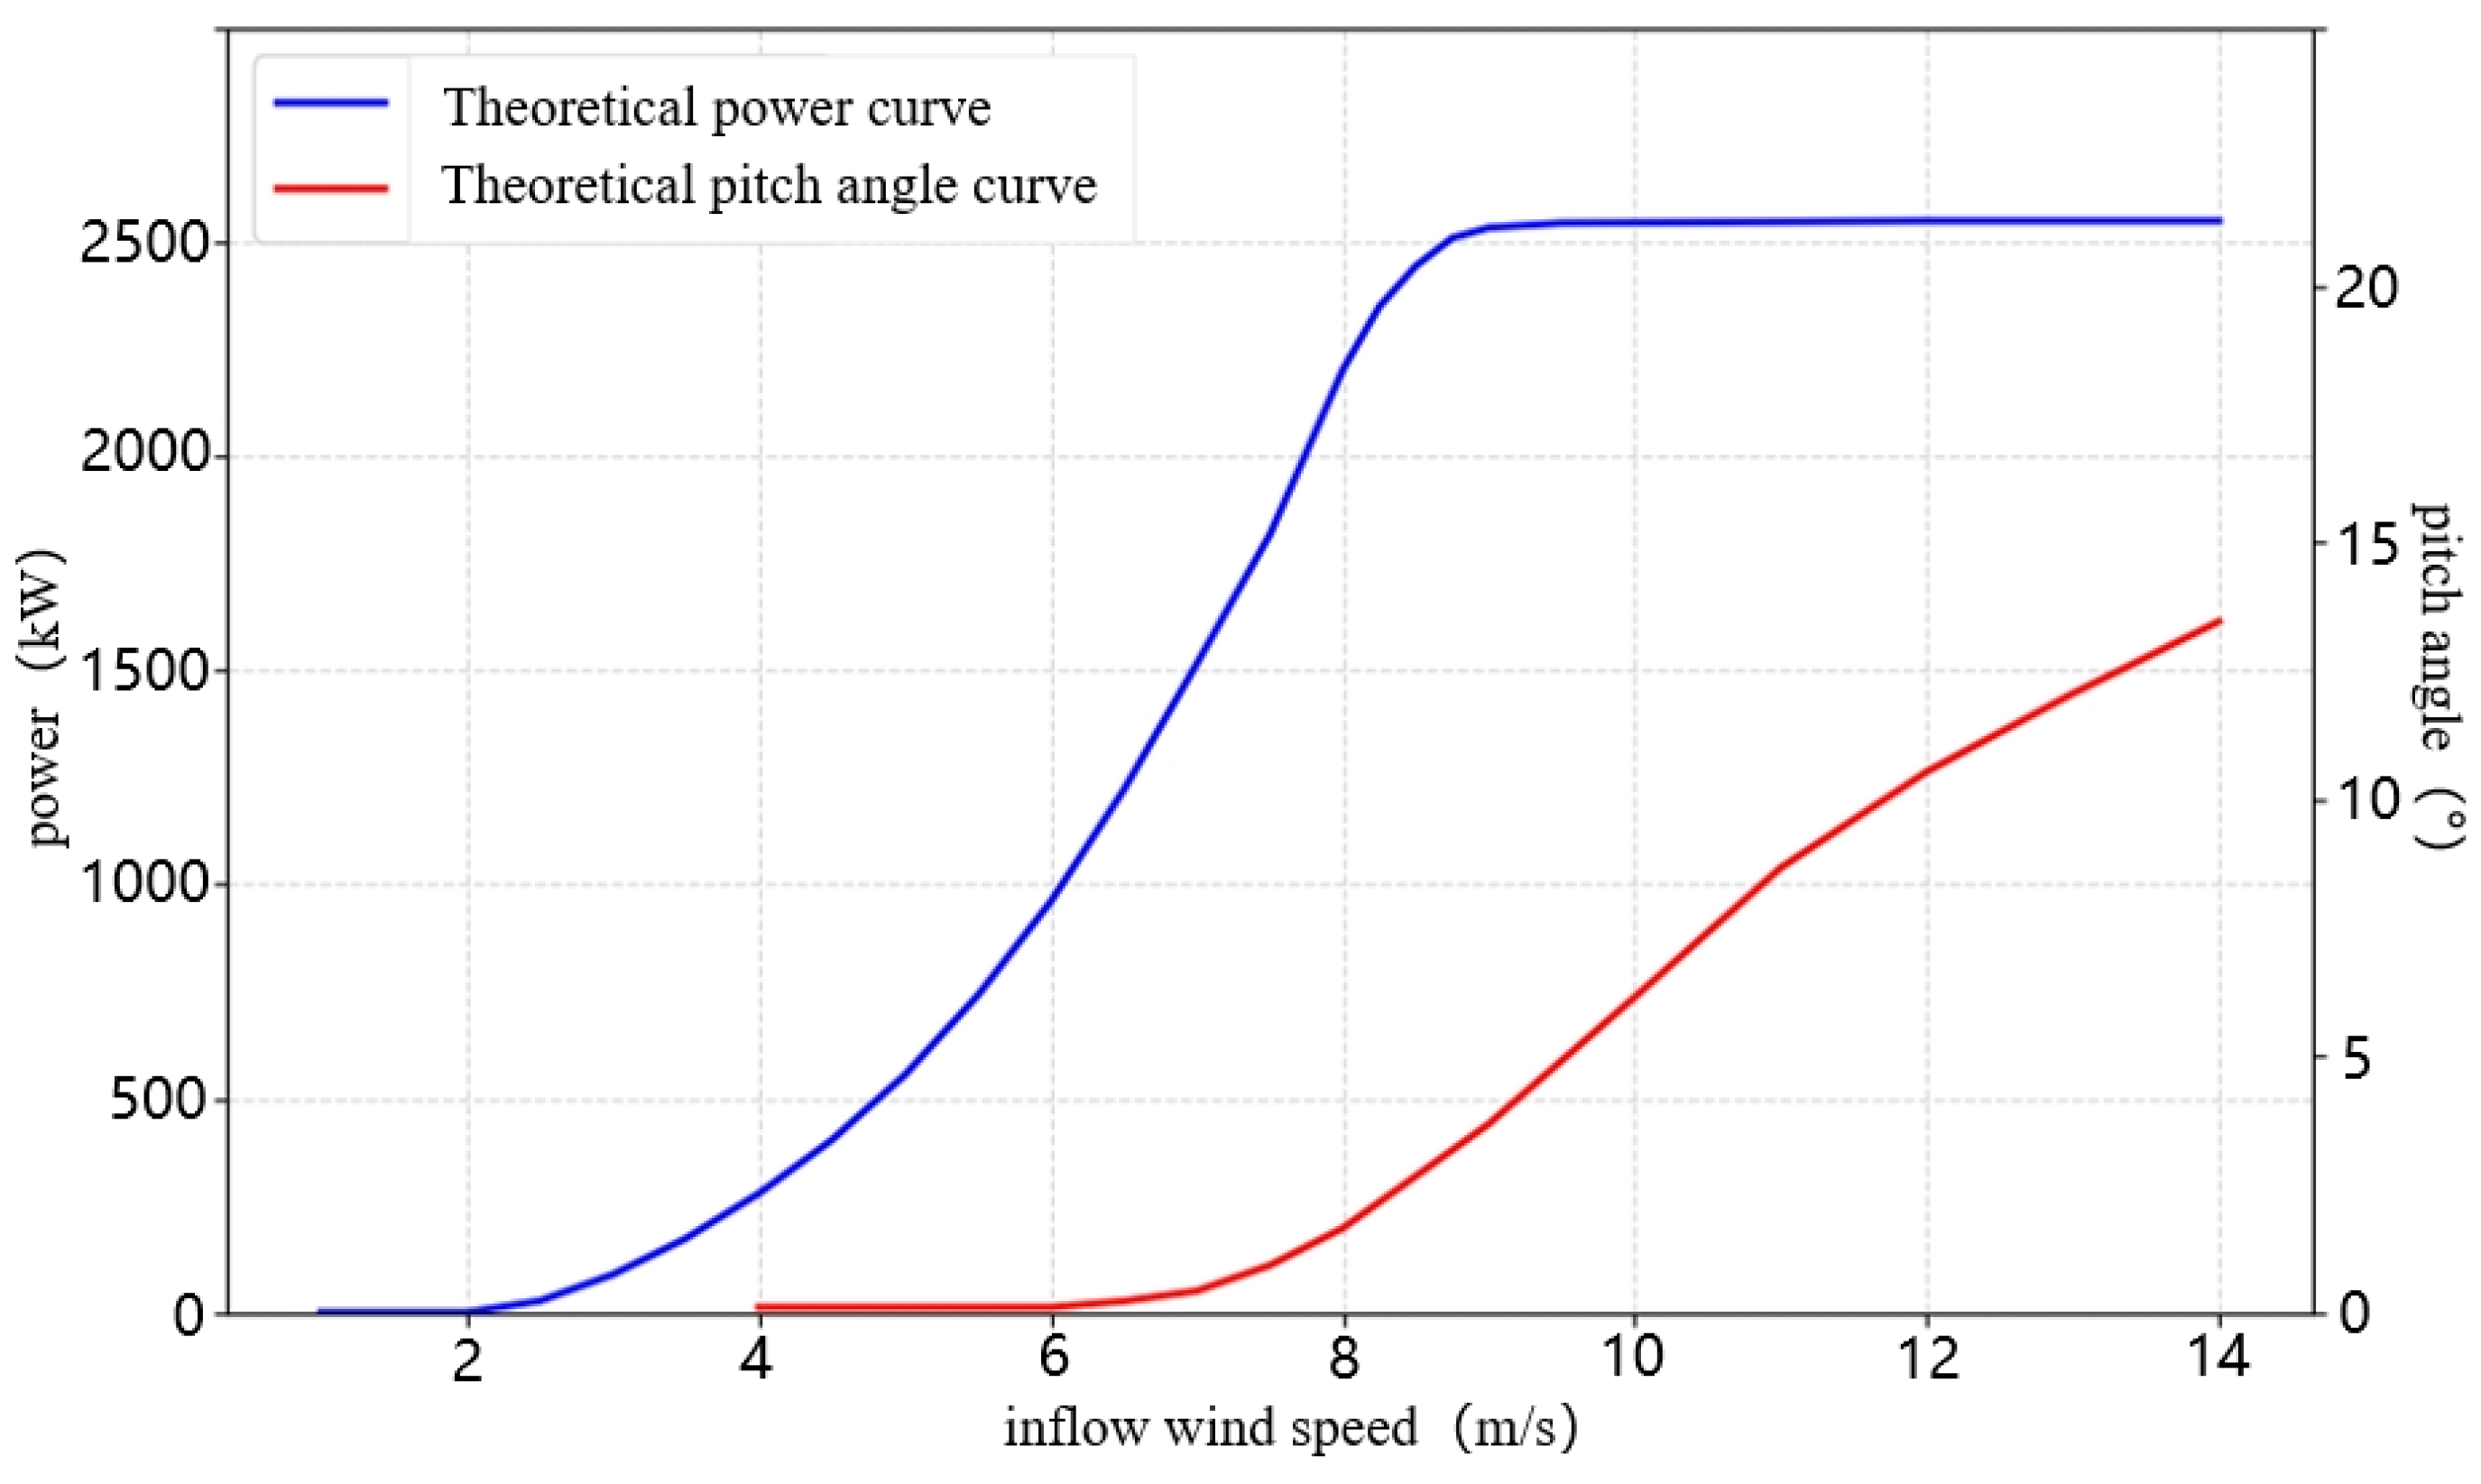
Both output power and blade pitch angle show obvious piecewise variation with inflow wind speed. Between cut-in and rated wind speed, power increases monotonically with wind speed, showing a clear one-to-one mapping relationship. When wind speed exceeds the rated value, the pitch control system adjusts the blade pitch angle to maintain rated power, so power remains stable while pitch angle increases monotonically with wind speed, forming a unique mapping between pitch angle and inflow wind speed.
Figure 1 shows the theoretical power curve and pitch angle curve.Although the theoretical curves show the variation relationships of power and pitch angle with inflow wind speed, the inflow wind speed of each wind turbine is unknown, and the recorded operating parameters only include the power, pitch angle of each turbine, and the nacelle wind speed measured by the anemometer on the top of the nacelle. If the nacelle wind speed value corresponding to each point on the theoretical power or pitch angle curve can be calculated according to the historical operation data of the turbine, the mapping relationship between the inflow wind speed and the nacelle wind speed can be established. However, due to factors such as wind condition changes, rotor inertia, and turbine status, the variation relationship between power and pitch angle in the operation data and the nacelle wind speed presents a scattered distribution; that is, a certain power value or pitch angle value corresponds to multiple nacelle wind speed values. Therefore, how to find the representative nacelle wind speed value corresponding to a certain theoretical power or theoretical pitch angle value has become the key to modeling the inflow wind speed of wind turbines.
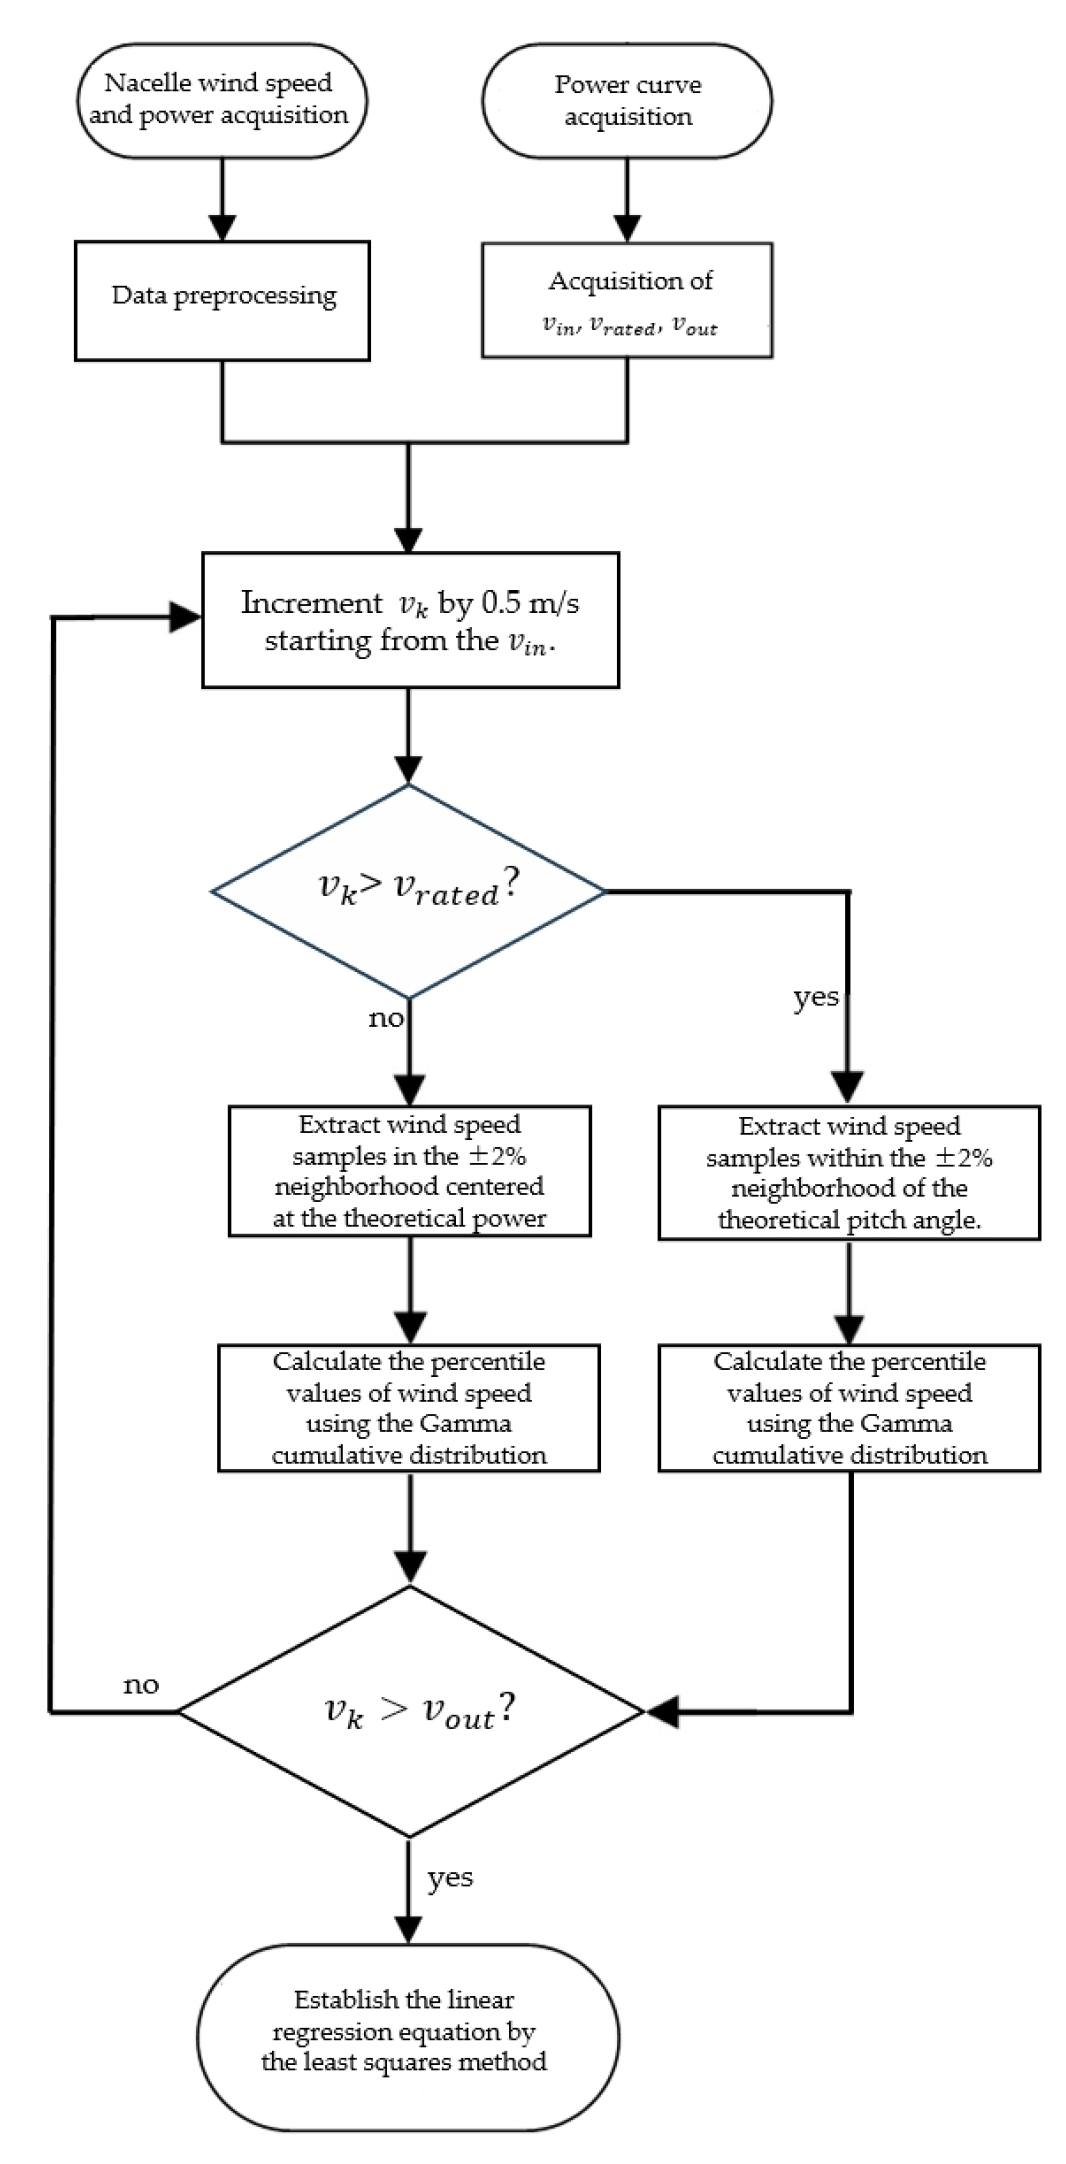
Based on this idea, the piecewise calculation method for the inflow wind speed of wind turbines based on operation data is proposed. Taking the rated wind speed as the boundary, the turbine operation data are divided into the low wind speed region and the high wind speed region. Using statistical methods, the representative nacelle wind speed value is calculated based on the theoretical power curve in the low wind speed region and the theoretical pitch angle curve in the high wind speed region, and the mapping relationship between the turbine inflow wind speed and the nacelle wind speed is established to realize the calculation of time-series inflow wind speed.
2.2. Nacelle Wind Speed Representative Value Calculation Based on Theoretical Power Curve
In the low wind speed region, less than the rated wind speed, the theoretical power of the wind turbine increases monotonically with the increase in inflow wind speed. Therefore, a method for calculating the representative nacelle wind speed value based on the power curve can be established, that is, using the theoretical power as an intermediate parameter to calculate the representative nacelle wind speed value corresponding to any inflow wind speed.
For any point
k on the theoretical power curve, the inflow wind speed is denoted as
vk, and the corresponding theoretical power is denoted as
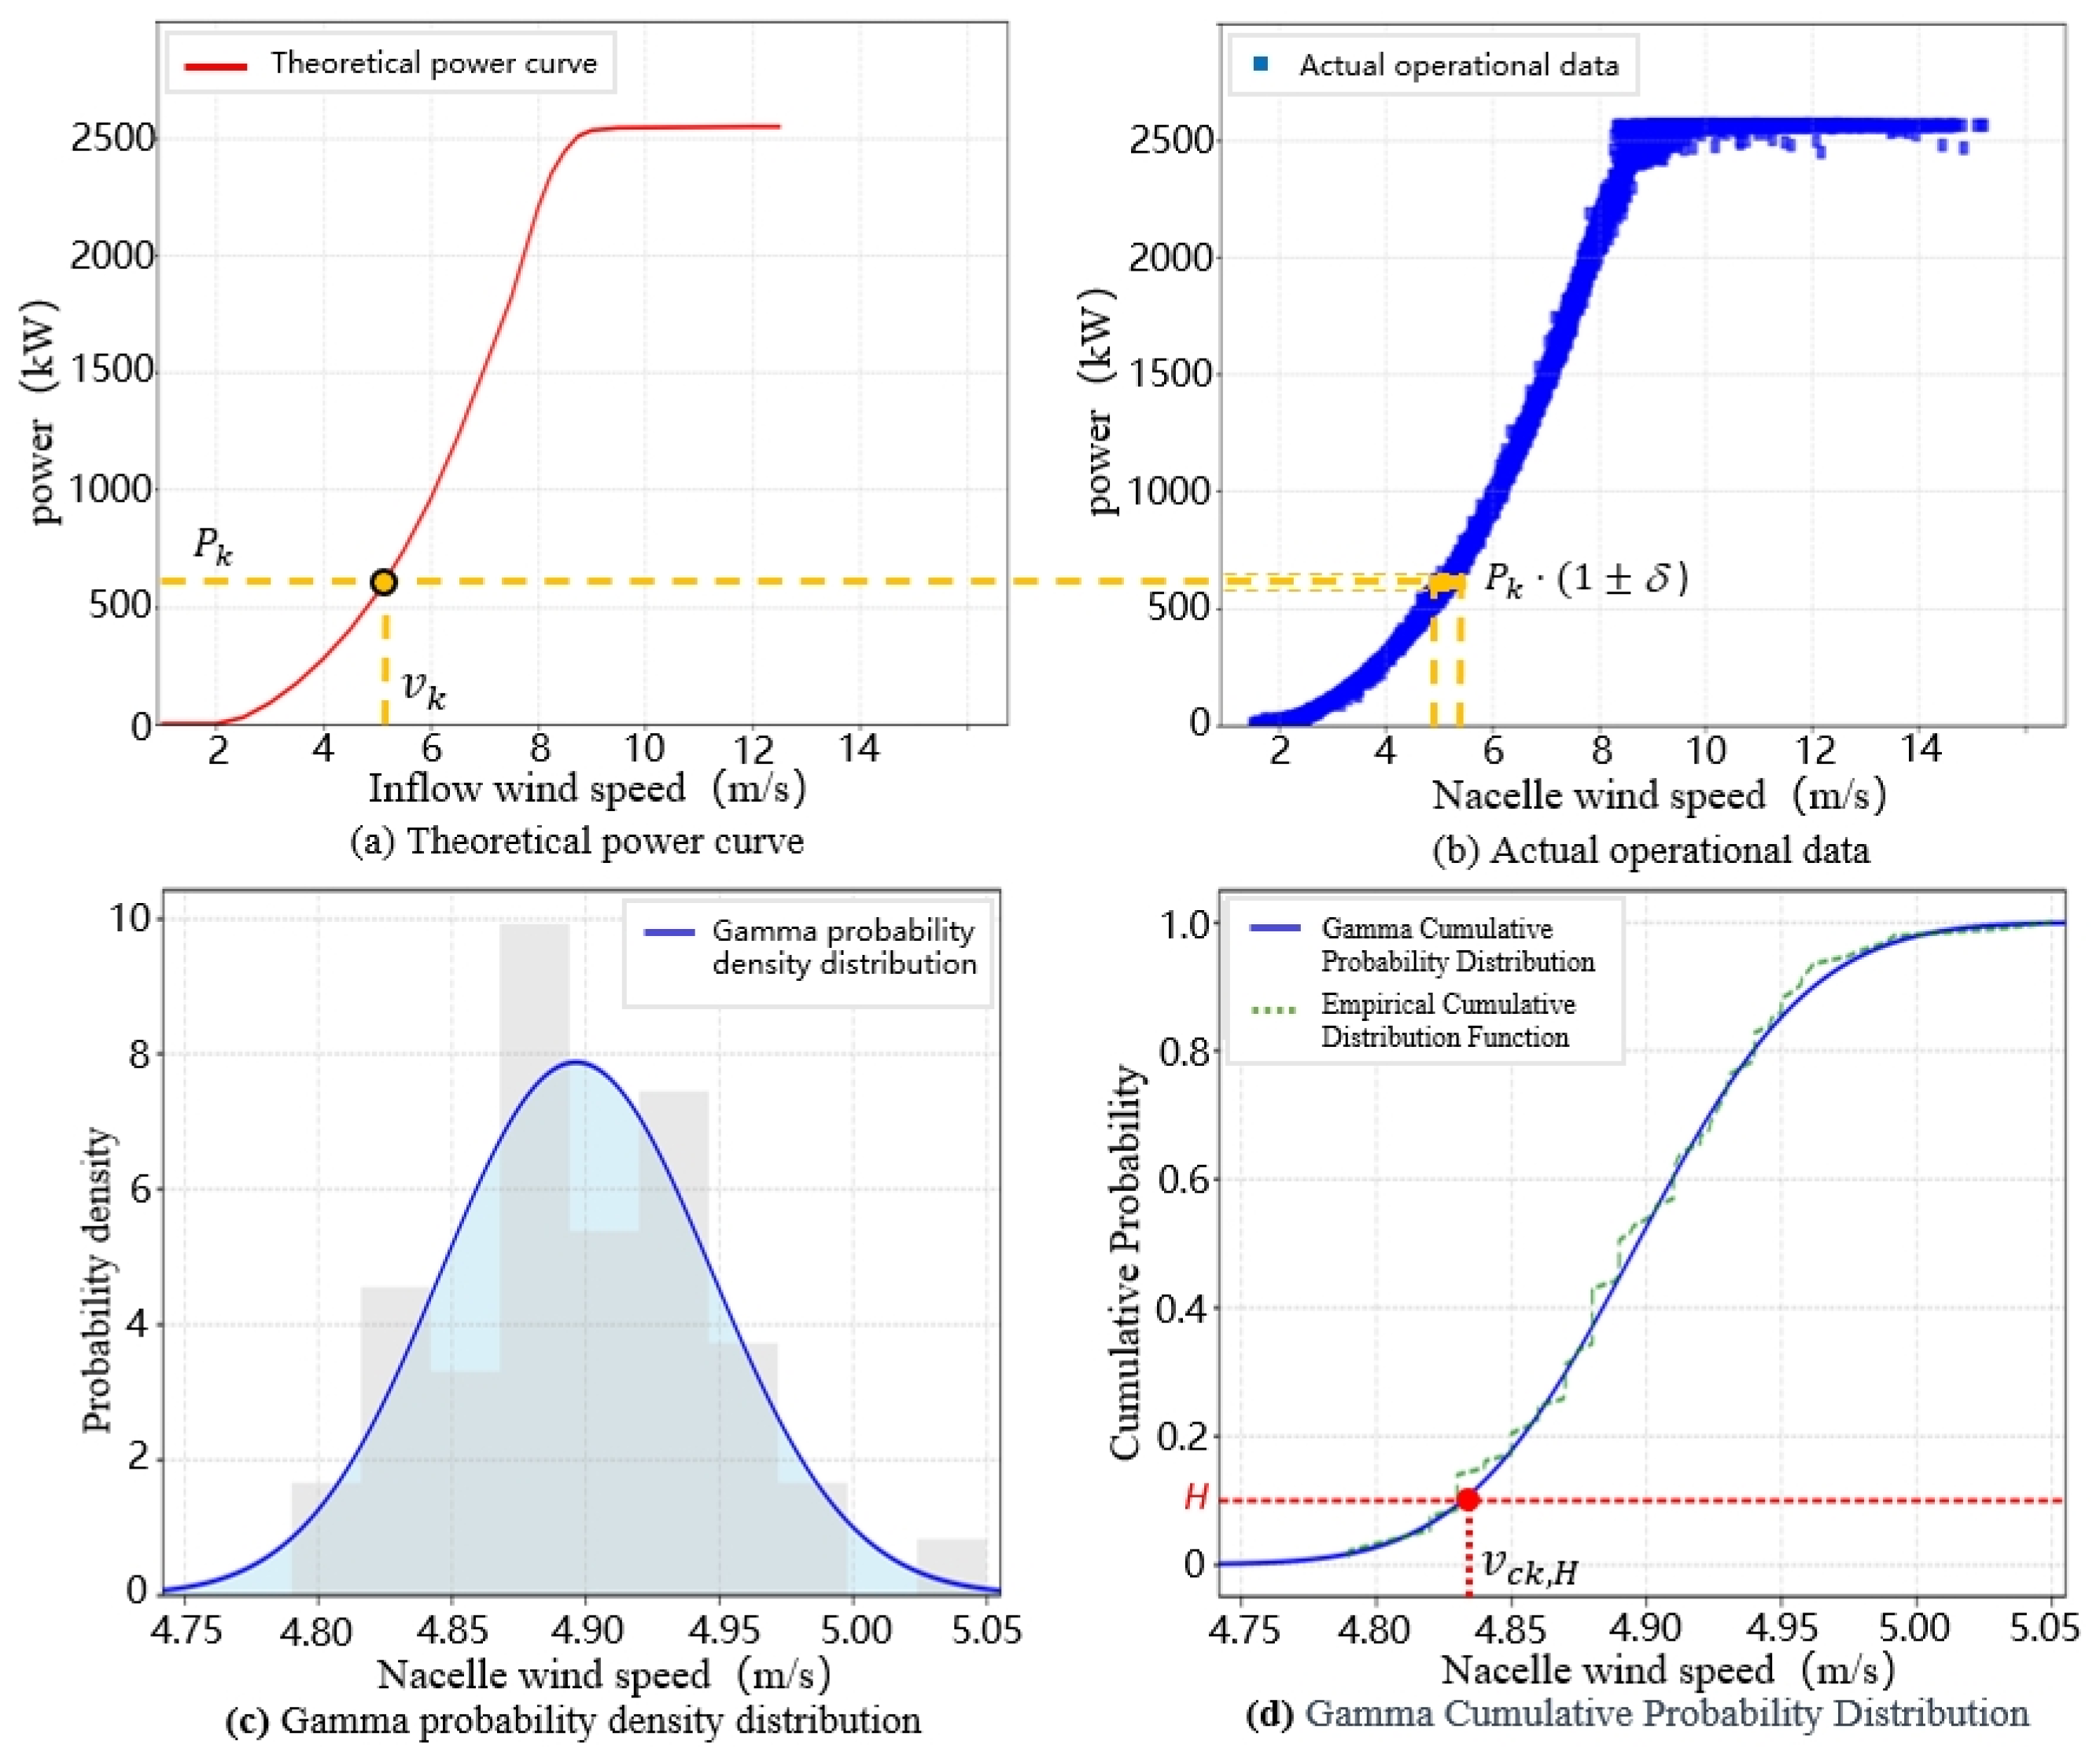
Pk, as illustrated in
Figure 2a. Under identical inflow wind speed conditions, even when the turbine operates under ideal conditions, its actual output power fluctuates around the theoretical power value due to factors such as rotor inertia. Therefore, during statistical analysis of historical operational data, a neighborhood centered at the theoretical power value
Pk should be used to represent
Pk; this neighborhood must not be excessively wide, to avoid degrading the matching accuracy with point (
vk,
Pk) on the theoretical power curve. Specifically, the neighborhood of
Pk is defined as [
Pk(1 −
),
Pk(1 +
)], as shown in
Figure 2b. All historical power values
P(
vc,i) falling within this neighborhood, and their corresponding nacelle wind speeds
vc,i are collected to construct the nacelle wind speed–power dataset
Sk.
Here,
i denotes the
i-th operational data sample within the neighborhood of
Pk;
is a parameter characterizing the neighborhood radius, set to
= 0.02. The nacelle wind speed distribution in dataset
Sk is shown in
Figure 2c, indicating substantial dispersion of nacelle wind speeds corresponding to the theoretical power
Pk. To compute a representative value of nacelle wind speed samples within the neighborhood interval, the cumulative probability statistics method is adopted. Taking the nacelle wind speed samples
vc,i from dataset
Sk as a random variable, the gamma cumulative probability distribution of nacelle wind speed within the neighborhood interval of theoretical power
Pk is calculated. The gamma probability density function is given below:
Here, f is the probability density function of the gamma distribution; Γ(a) is the gamma function used for normalizing the probability density; vc,i is the i-th sample value of nacelle wind speed in the dataset; is the mean nacelle wind speed in dataset Sk; s2 is the variance; and a, b are coefficients.
The cumulative probability of the gamma distribution function is shown in
Figure 2d. Since wind turbines can achieve power
Pk at relatively low wind speeds under ideal operating conditions, a small percentile
H should be selected; the nacelle wind speed value
vck,H corresponding to percentile
H on the cumulative probability curve, is then calculated and adopted as the representative nacelle wind speed
vck for point
k on the theoretical power curve.
2.3. Calculation of Representative Nacelle Wind Speed Based on Theoretical Pitch Angle
In the high wind speed region, greater than the rated wind speed, the pitch angle increases monotonically with the increase in inflow wind speed. Therefore, a method for calculating the representative nacelle wind speed value based on the pitch angle curve can be established, that is, using the pitch angle as an intermediate parameter to calculate the representative nacelle wind speed value corresponding to any inflow wind speed.
For any point
k on the theoretical pitch angle curve corresponding to wind speeds above the rated wind speed, the inflow wind speed is denoted as
vk and the pitch angle as
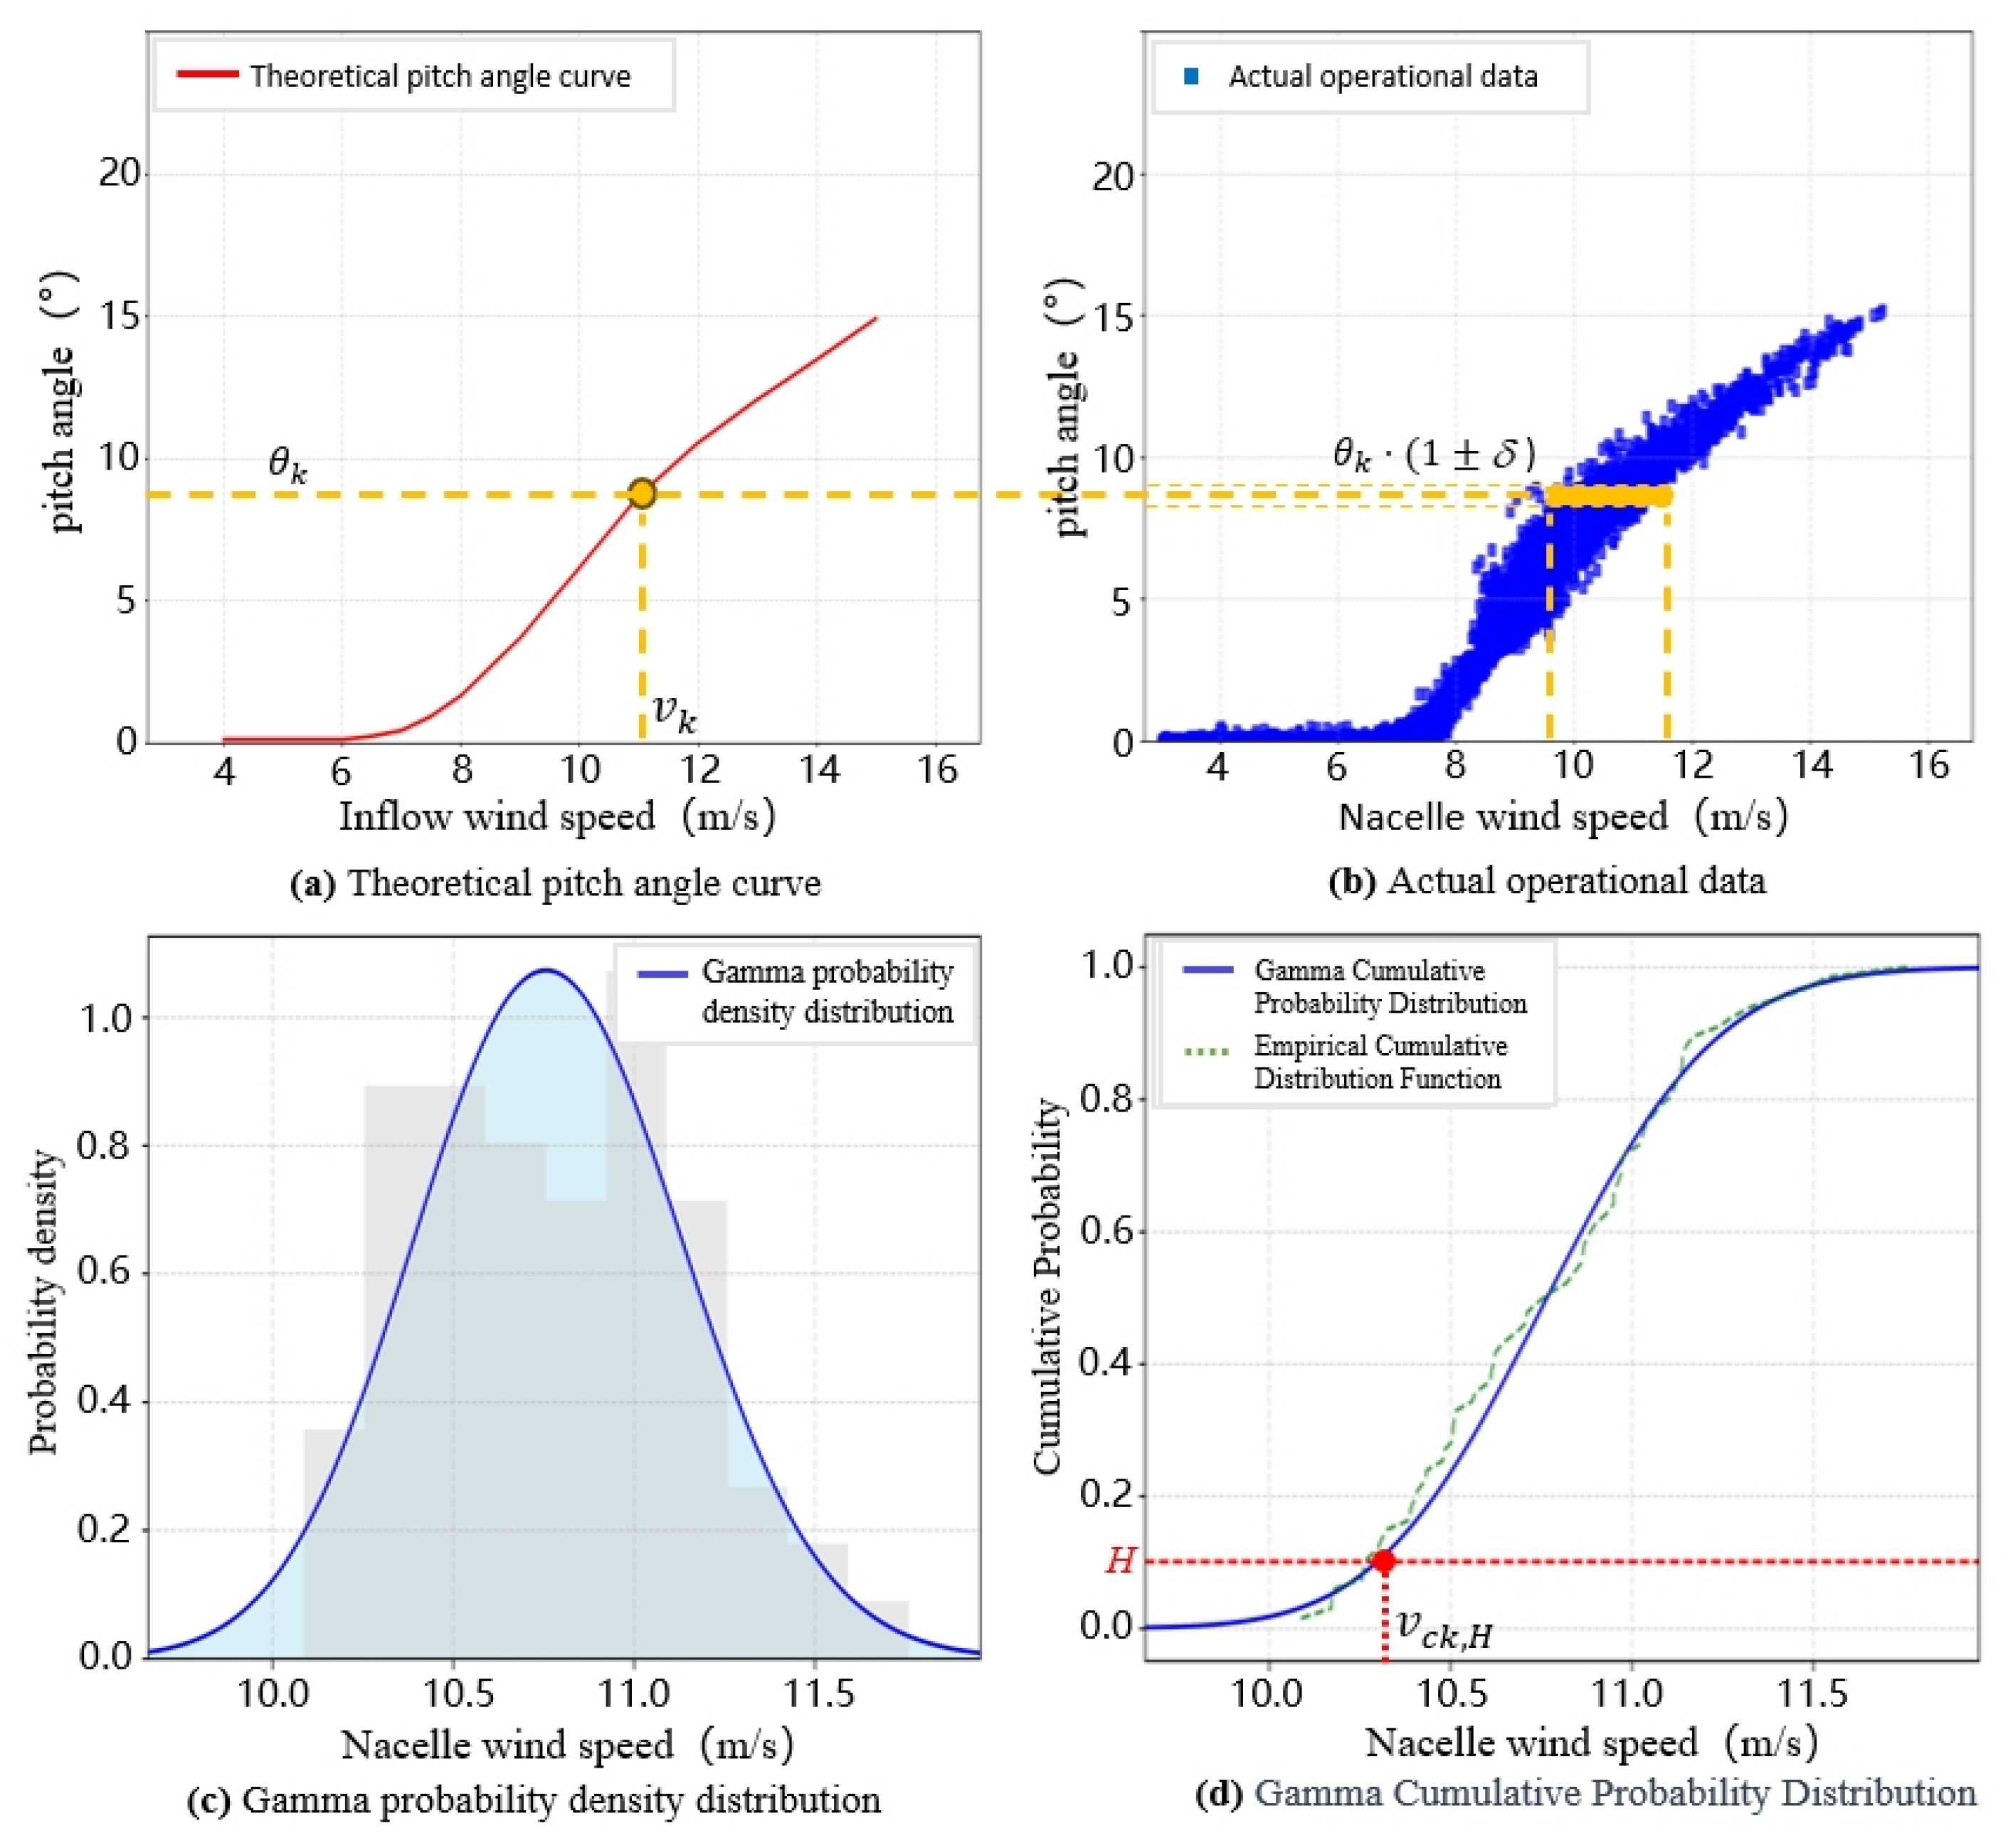
θk, as illustrated in
Figure 3a. Due to inherent lag in pitch control, the actual pitch angle of the turbine fluctuates around the theoretical value even under identical inflow wind speeds. Therefore, when analyzing historical operational data, a neighborhood centered at the theoretical pitch angle
θk should be used to represent
θk; this neighborhood must be sufficiently narrow to maintain high matching accuracy with point
k on the theoretical pitch angle curve. Specifically, the neighborhood is defined as [
θk(1 −
),
θk(1 +
)], as shown in
Figure 3b. All pitch angle operational data
θ(
vc,i) within this neighborhood—and their corresponding nacelle wind speed measurements
vc,i—are collected to form the nacelle wind speed–pitch angle dataset
Rk for wind speeds above the rated value.
i denotes the
i-th operational data sample within the neighborhood, and
= 0.02 is adopted. The nacelle wind speed distribution in dataset
Rk is shown in
Figure 3c, and the dispersion of nacelle wind speeds corresponding to the theoretical pitch angle
θk is also substantial. Therefore, analogous to the nacelle wind speed representative value calculation method based on the power curve, the gamma cumulative probability statistical method—illustrated in
Figure 3d—is employed to compute the nacelle wind speed value
vck,H corresponding to the cumulative probability percentile
H, which serves as the representative nacelle wind speed
vck for point
k on the theoretical pitch angle curve.
4. Case Study Analysis
4.1. Case Study Wind Farm
To verify the effectiveness of the proposed method, an actual flat-terrain wind farm in operation was selected as the research object in this paper. The dominant wind direction of this wind farm is north, with a total installed capacity of 100 MW, equipped with 40 2.5 MW wind turbines. The rated wind speed of the turbine is 9 m/s, the rotor diameter is 140 m, and the hub height is 140 m. Historical operation data of the wind farm from January to June 2025 are selected for the study. The operation parameters include power, pitch angle, nacelle wind speed, turbine power curtailment status, etc., and the time resolution of each parameter is 10 min.
4.2. Inflow Wind Speed Measurement
To obtain objective and accurate inflow wind speed as verification data, a wind turbine with no obvious obstruction in the main wind direction is selected. A ground-based lidar is used to measure the inflow wind speed. Ground-based lidar is a ground-based wind field measurement device based on the principle of laser Doppler anemometry, which can realize non-contact continuous monitoring of wind speed and direction at a specified height and distance.
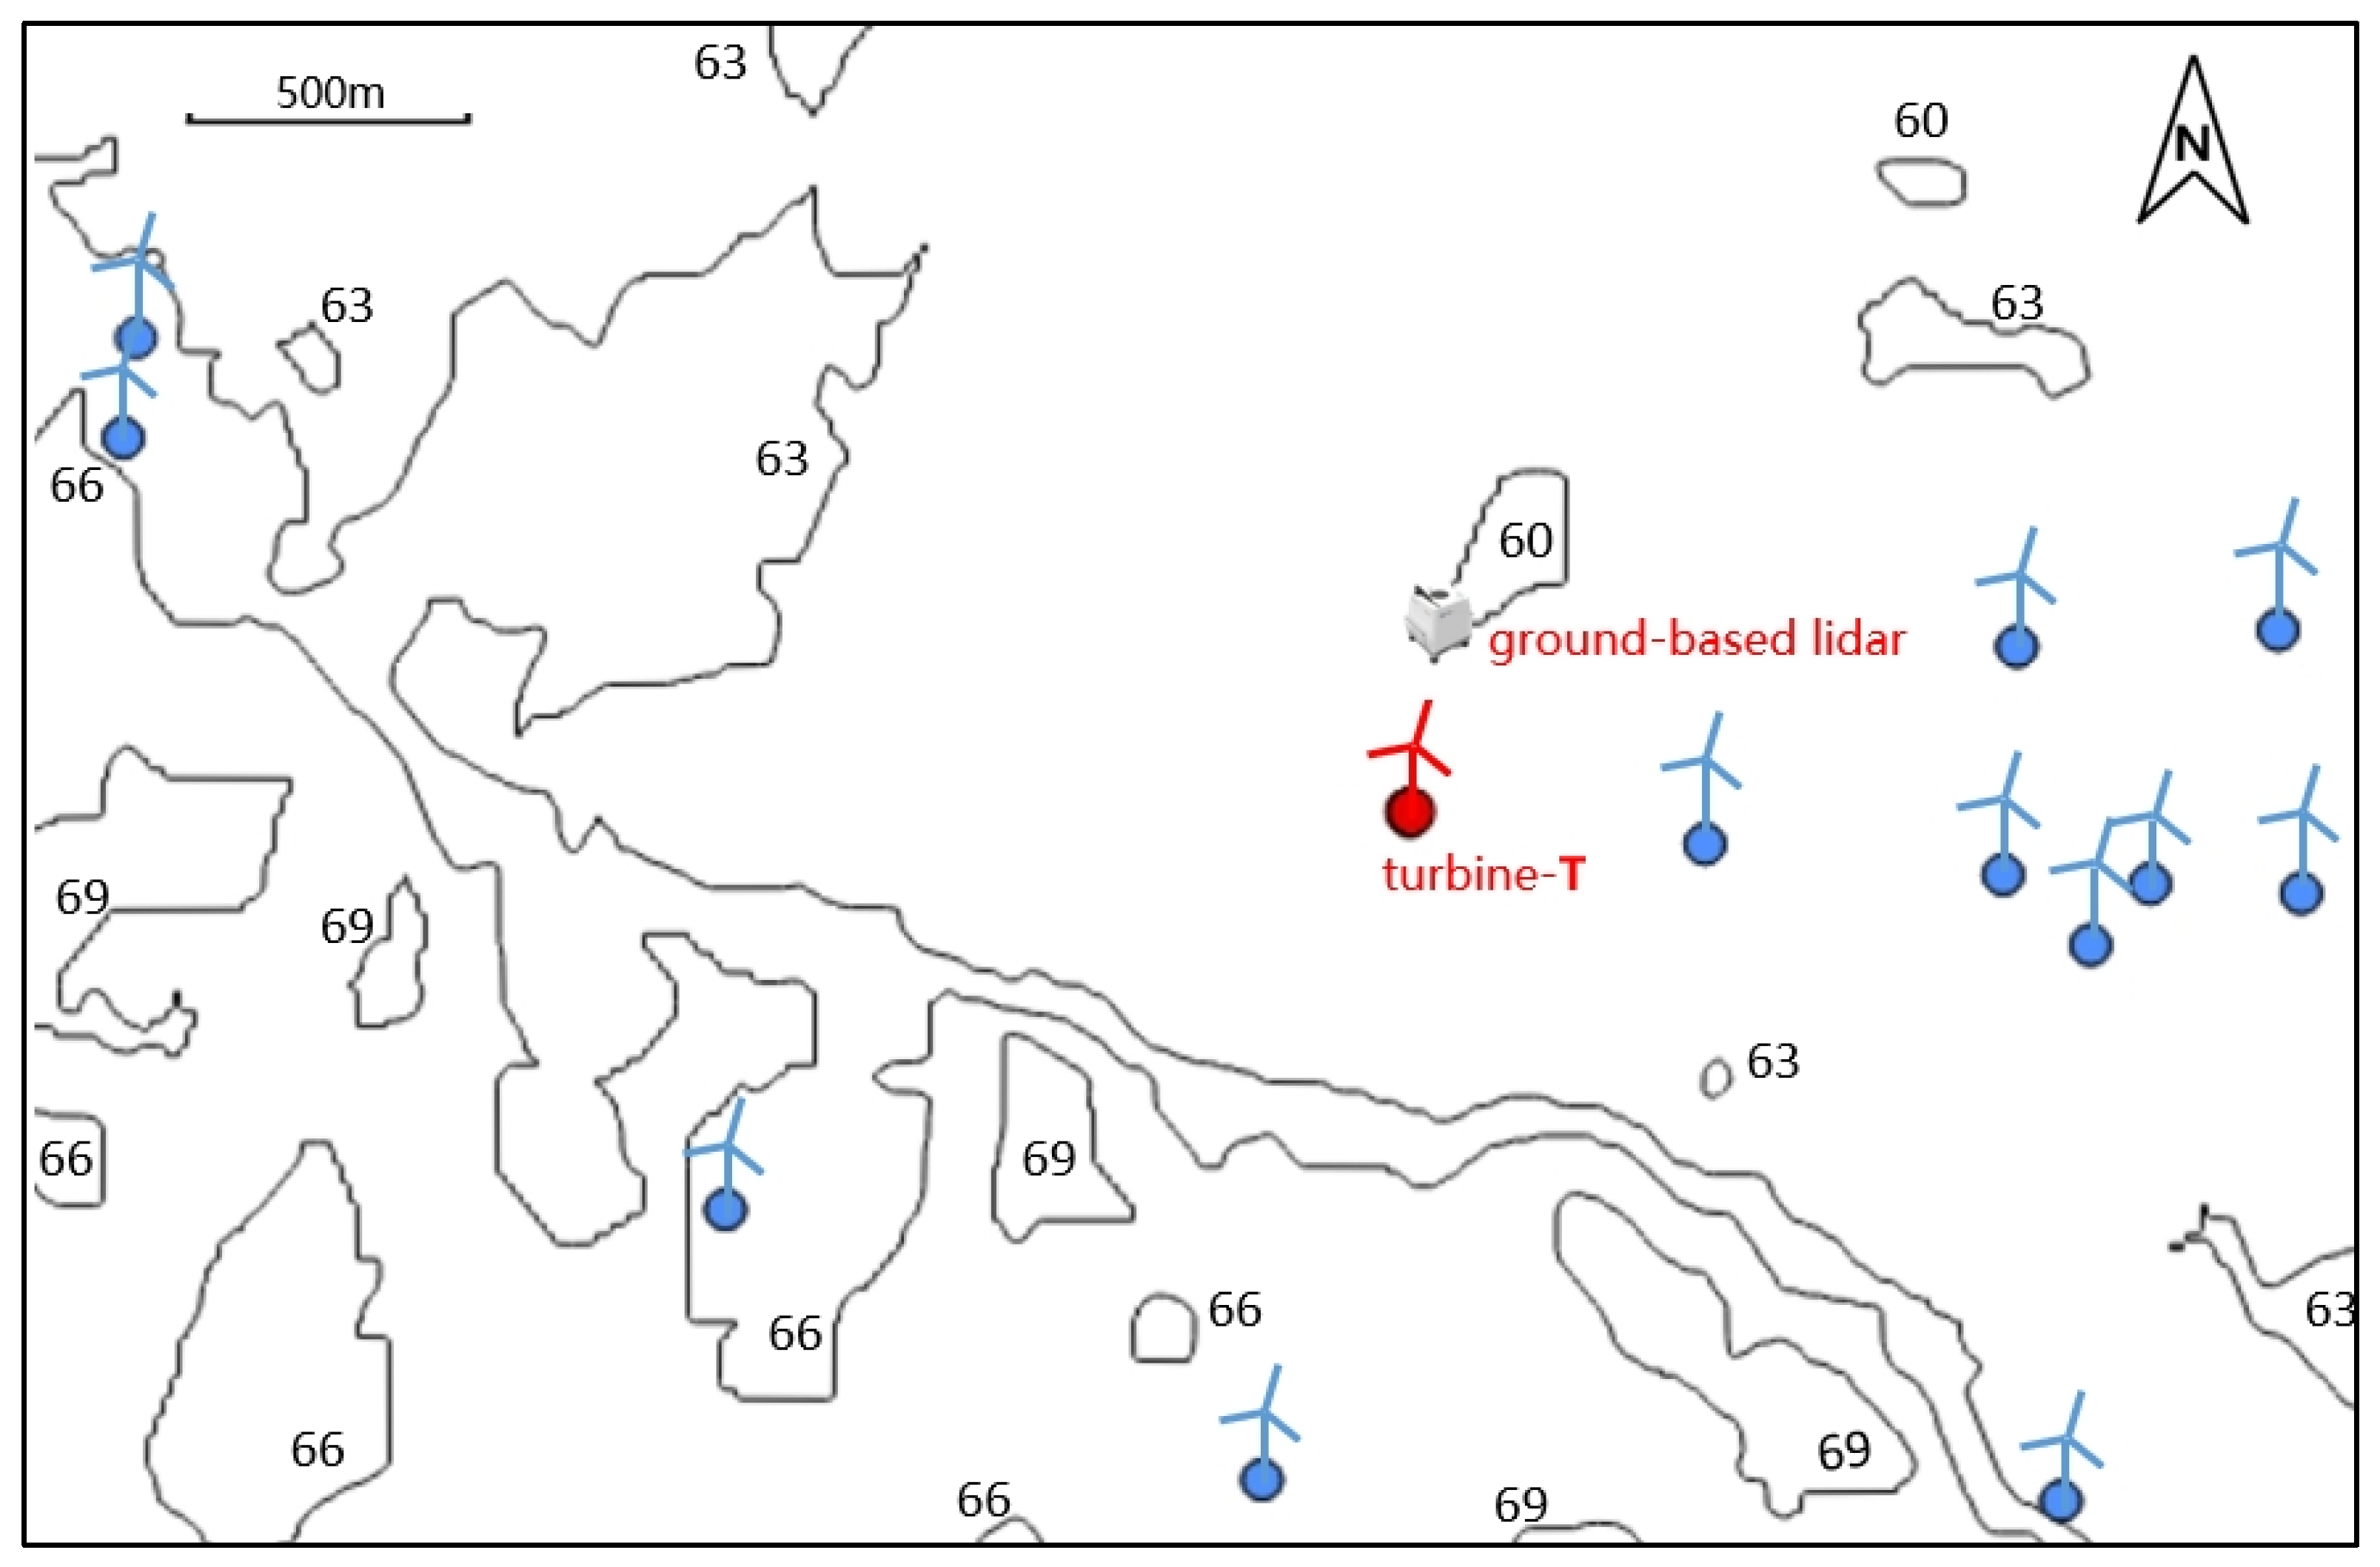
The installation positions of the tested turbine T and the lidar are shown in
Figure 5. The lidar is installed about 400 m north of the T turbine, and the measurement is carried out for 4 months, obtaining the measured time-series data of wind direction and wind speed profile at the lidar location, that is, the horizontal wind speed and wind direction data of 12 height layers in the height range of 40 m to 280 m at the location, with an interval of 20 m, and the time resolution is 10 min.
4.3. Inflow Wind Speed Selected for Validation
The lidar is located at a position of about 2.8 D upstream of the T turbine, and the terrain between them is flat with no tall obstacles. According to the IEC standard [
8], the wind speed data measured by the lidar can be considered as the real inflow wind speed of the turbine. However, due to the random change in wind direction during the measurement process, under certain wind directions, the lidar position is affected by obstacles and the wake of adjacent turbines, and the measured wind speed cannot represent the real inflow of the turbine T. Therefore, it is necessary to eliminate the disturbed wind direction sectors.
According to the IEC standard [
21], for each adjacent turbine that interferes with the wind speed at the lidar position, the formula for calculating the width of the wind direction sector to be eliminated is as follows:
where
Dn is the rotor diameter of the
n-th neighboring wind turbine,
Ln is the horizontal distance between the lidar and the
n-th wind turbine, and
βn is the width of the excluded wind direction sector.
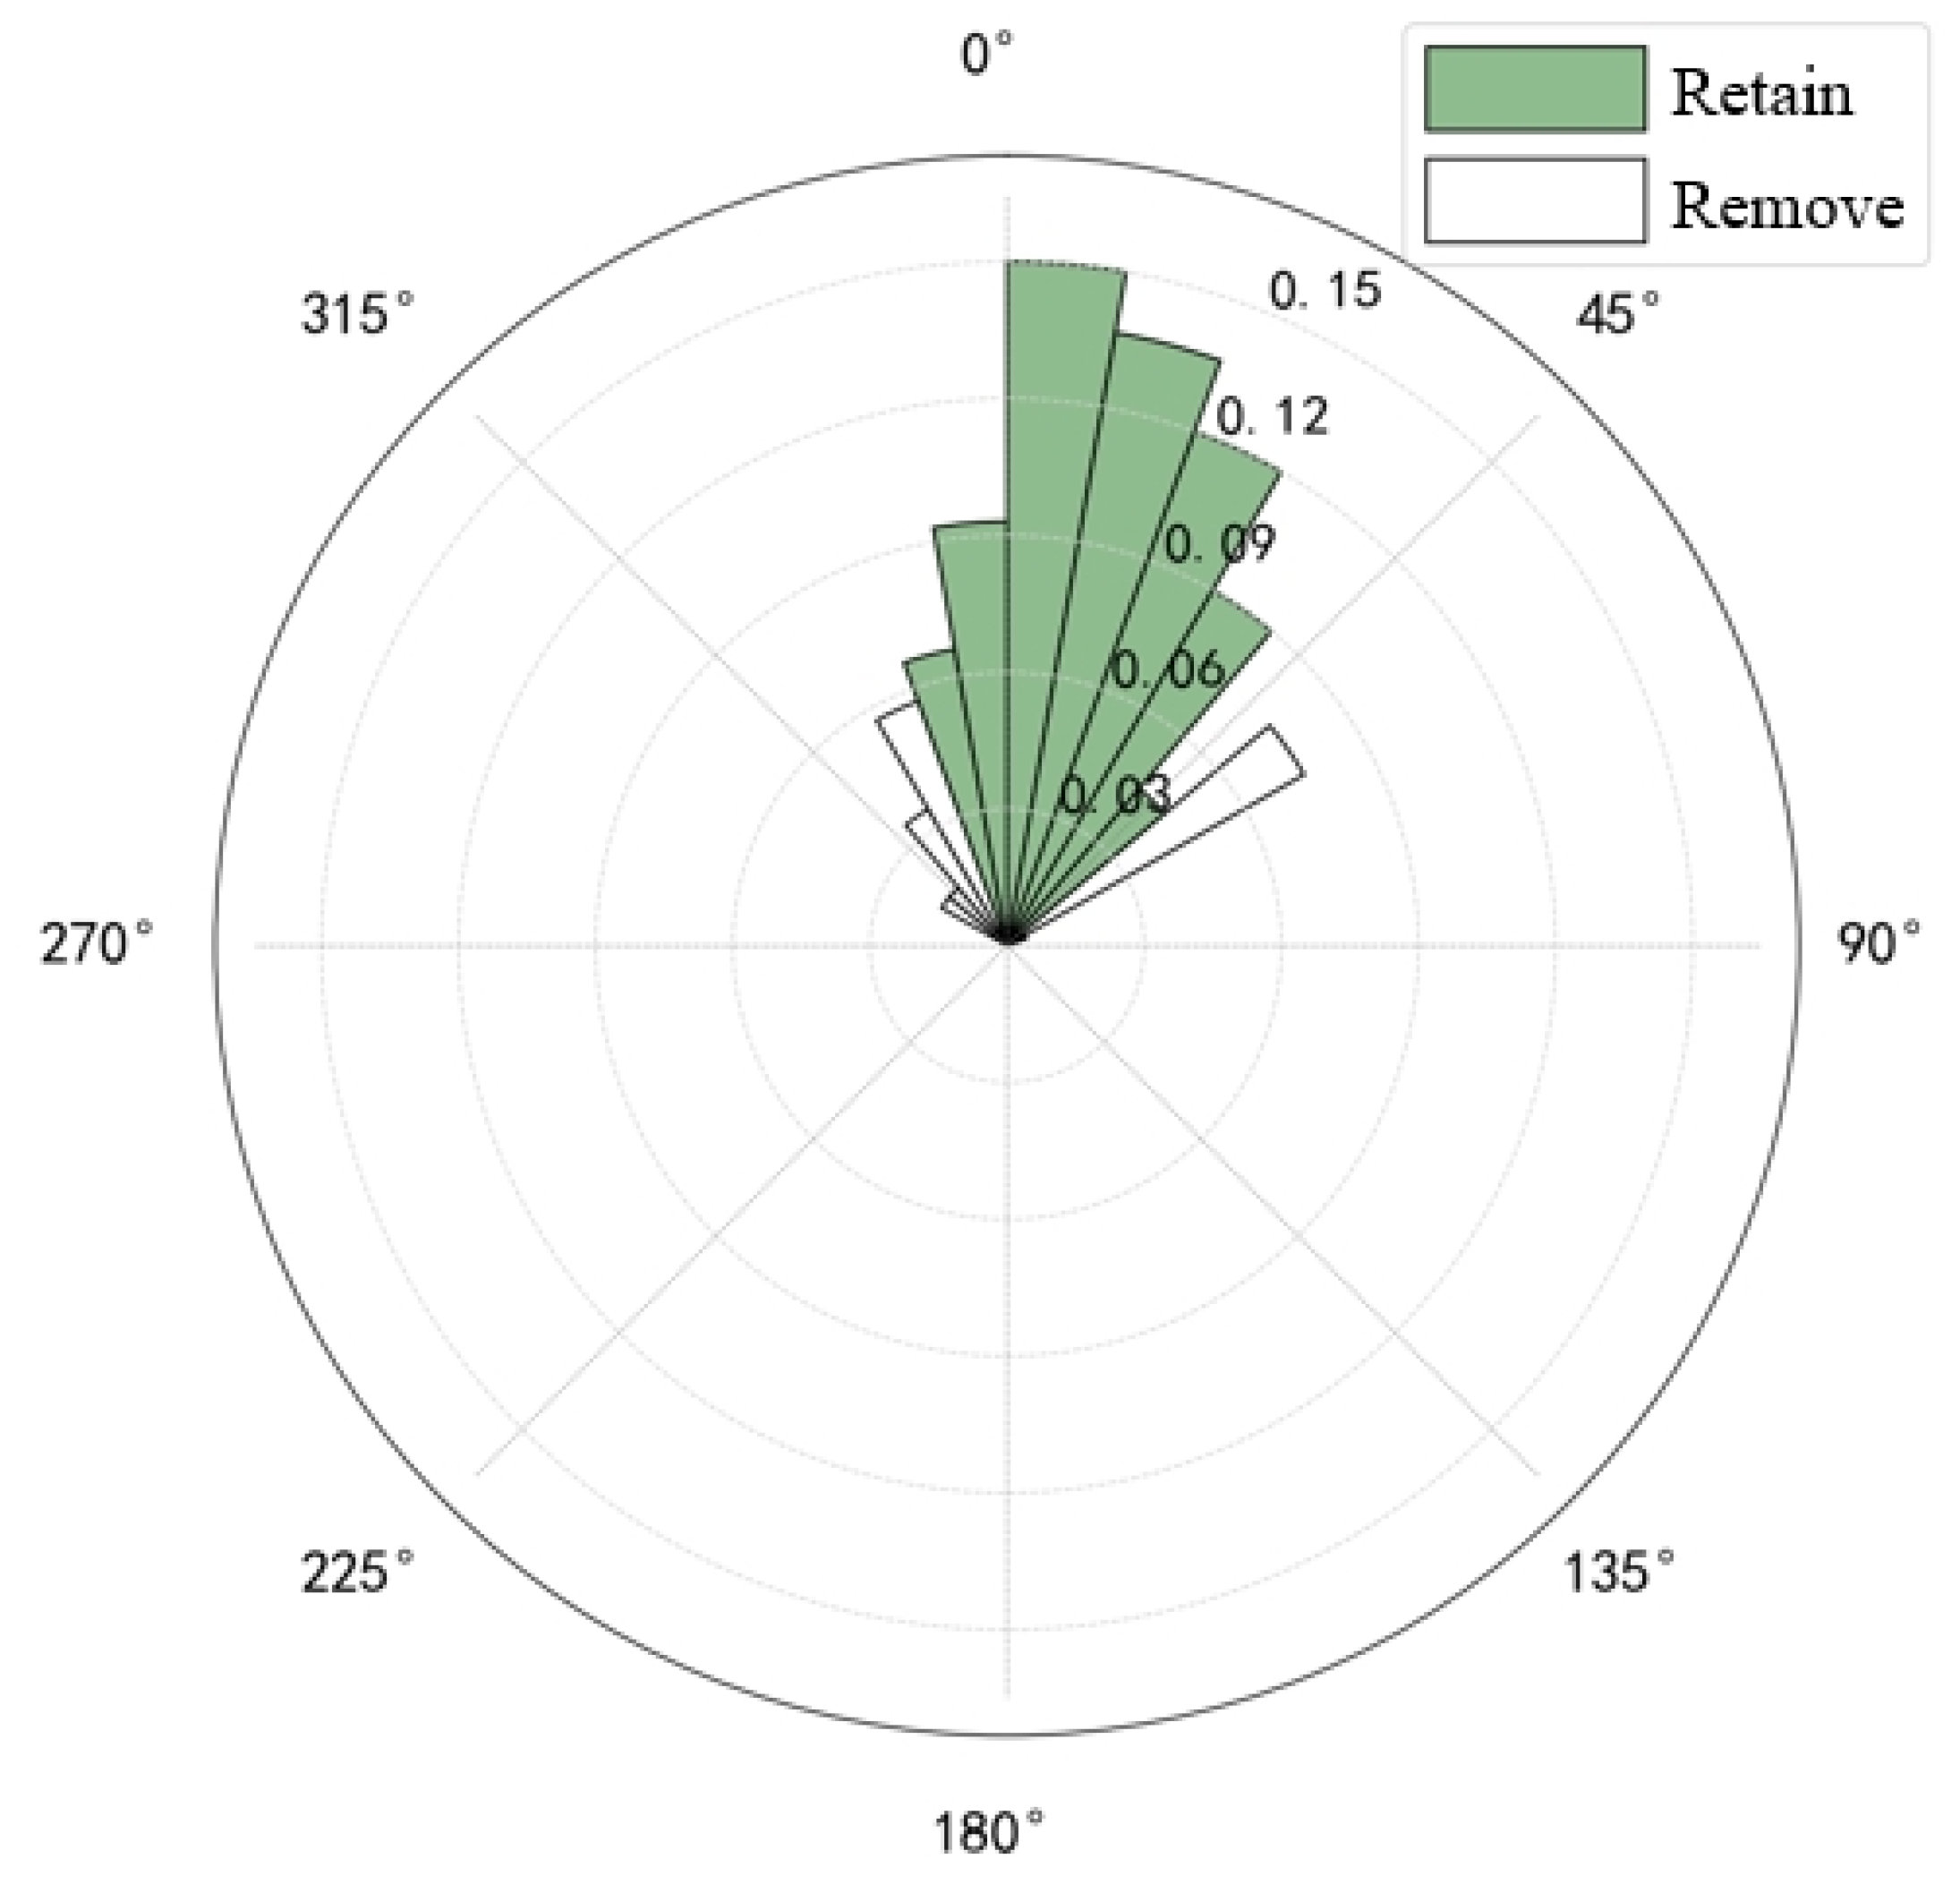
According to the lidar position and the layout of the turbines in the wind farm, the wind direction sectors after eliminating the interference of the T turbine and adjacent turbines are obtained, as shown in
Figure 6. The measured time-series wind speed data of the lidar in the reserved sector in
Figure 6 can be considered as the real inflow wind speed of the wind turbine, which is used as the standard for verifying the calculation accuracy of the proposed method.
4.4. Optimization of Percentile H
Percentile H is a critical parameter for determining the representative nacelle wind speed, directly affecting the accuracy of inflow wind speed calculations for the turbine; therefore, percentile H is optimized.
Taking wind turbine T as an example, using the historical operation data of the turbine from January to June 2025, the proposed piecewise inflow wind speed (PMCP) model is used to calculate the time-series inflow wind speed of turbine T during the same period. In the modeling process, the percentile H is set to 1%, 5%, and then increased from 5% to 40% in steps of 5%, totaling 9 cases.
The calculated inflow wind speed is selected to obtain time-series data according to the reserved sector in
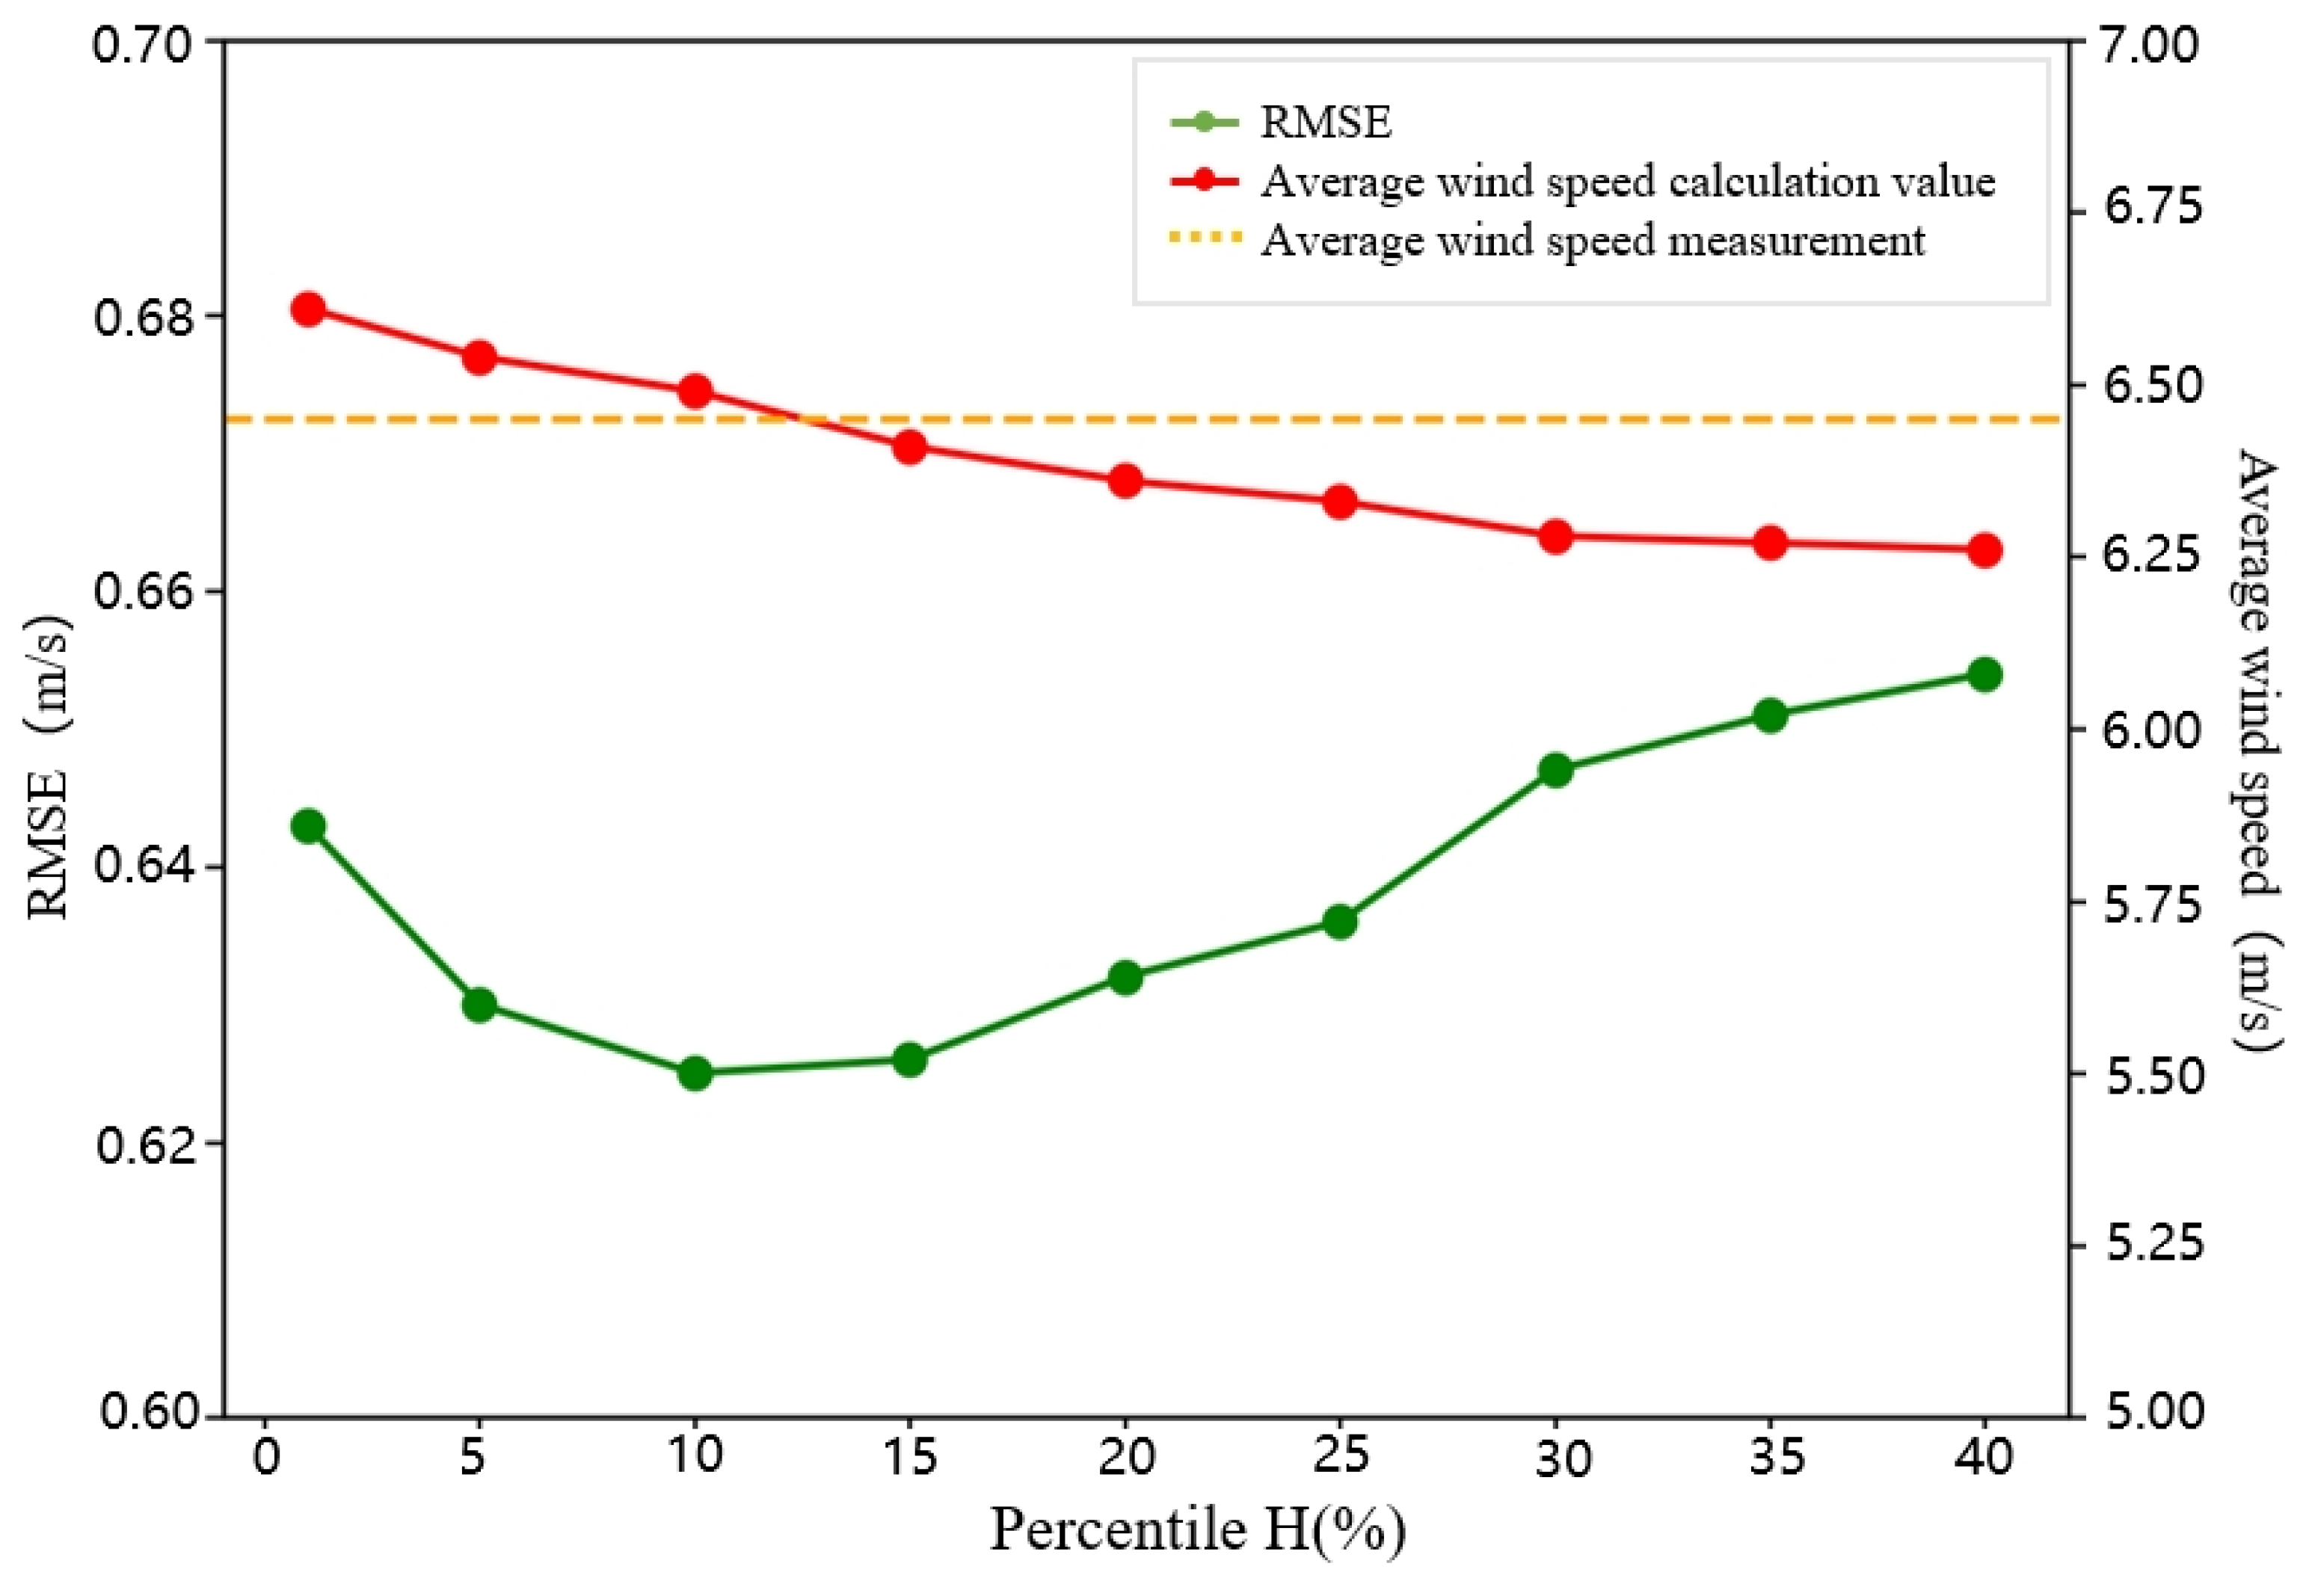
Figure 6, the average wind speed is calculated, and the root-mean-square error is calculated using the measured inflow wind speed of the T turbine as the verification standard. The changes in the average wind speed and root-mean-square error with the percentile are shown in
Figure 7.
As shown in
Figure 7, the computed mean inflow wind speed decreases with increasing percentile
H. When
H ranges from 5% to 20%, the computed mean wind speed is closest to the true mean inflow, yielding minimal error. The root-mean-square error (
RMSE) of the computed inflow wind speed first decreases and then increases with increasing
H, reaching its minimum at
H = 10%. Therefore, the optimal percentile is determined to be
H = 10%.
4.5. Results and Analysis
Taking the 6-month historical operation data of turbine T as the modeling sample, the percentile H = 10% is taken, and the proposed method is used to calculate the time-series inflow wind speed of the turbine, which is compared with the IEC nacelle transfer function (NTF) method.
The nacelle transfer function method [
13] is a widely used method for calculating turbine inflow wind speed in engineering, which is often used in turbine power curve testing. First, wind measurement equipment is installed 2D–4D in front of the rotor to measure the actual inflow of the turbine, and then the mathematical relationship between the inflow wind speed and the nacelle wind speed is established according to Formula (20):
where
and
denote the interval-averaged nacelle wind speeds within wind speed intervals
k and
k + 1, respectively;
and
denote the interval-averaged measured inflow wind speeds within intervals
k and
k + 1, respectively;
denotes the nacelle wind speed at time instant
j; and
denotes the inflow wind speed calculated at time instant
j using the nacelle transfer function method. Although both the PMCP method proposed in this study and the NTF method are applied to inflow wind speed calculation, the two methods differ in the following key aspects: The PMCP method is a statistical modeling approach, whose core lies in deriving the inflow wind speed based on the physical operating laws of wind turbines and fixed mathematical formulas by using a representative dataset, with no reliance on measured inflow wind speed throughout the modeling process. In contrast, the NTF method relies on pre-measured inflow data for modeling; the validity of its model parameters is constrained by the spatiotemporal representativeness of the measured data.
Taking the measured inflow wind speed of turbine T as the verification standard, the calculation accuracy of the PMCP method and the NTF method is evaluated, as shown in
Table 1. It can be seen from
Table 1 that compared with the nacelle wind speed, the root-mean-square error (RMSE) of the wind speed calculated by PMCP is reduced by 15.7%, the mean absolute error (MAE) is reduced by 18.6%, and the coefficient of determination (R
2) is increased by 3.6%. Compared with the NTF method, the various accuracy evaluation indicators of the two methods are highly consistent, and the error of the PMCP method is slightly higher than that of the NTF method overall. The reason is that the nacelle transfer function method must take the measured inflow wind speed as input data, and there is reuse of measured inflow data, while the modeling process of the proposed method only uses historical operation data without the need for measured inflow wind speed.
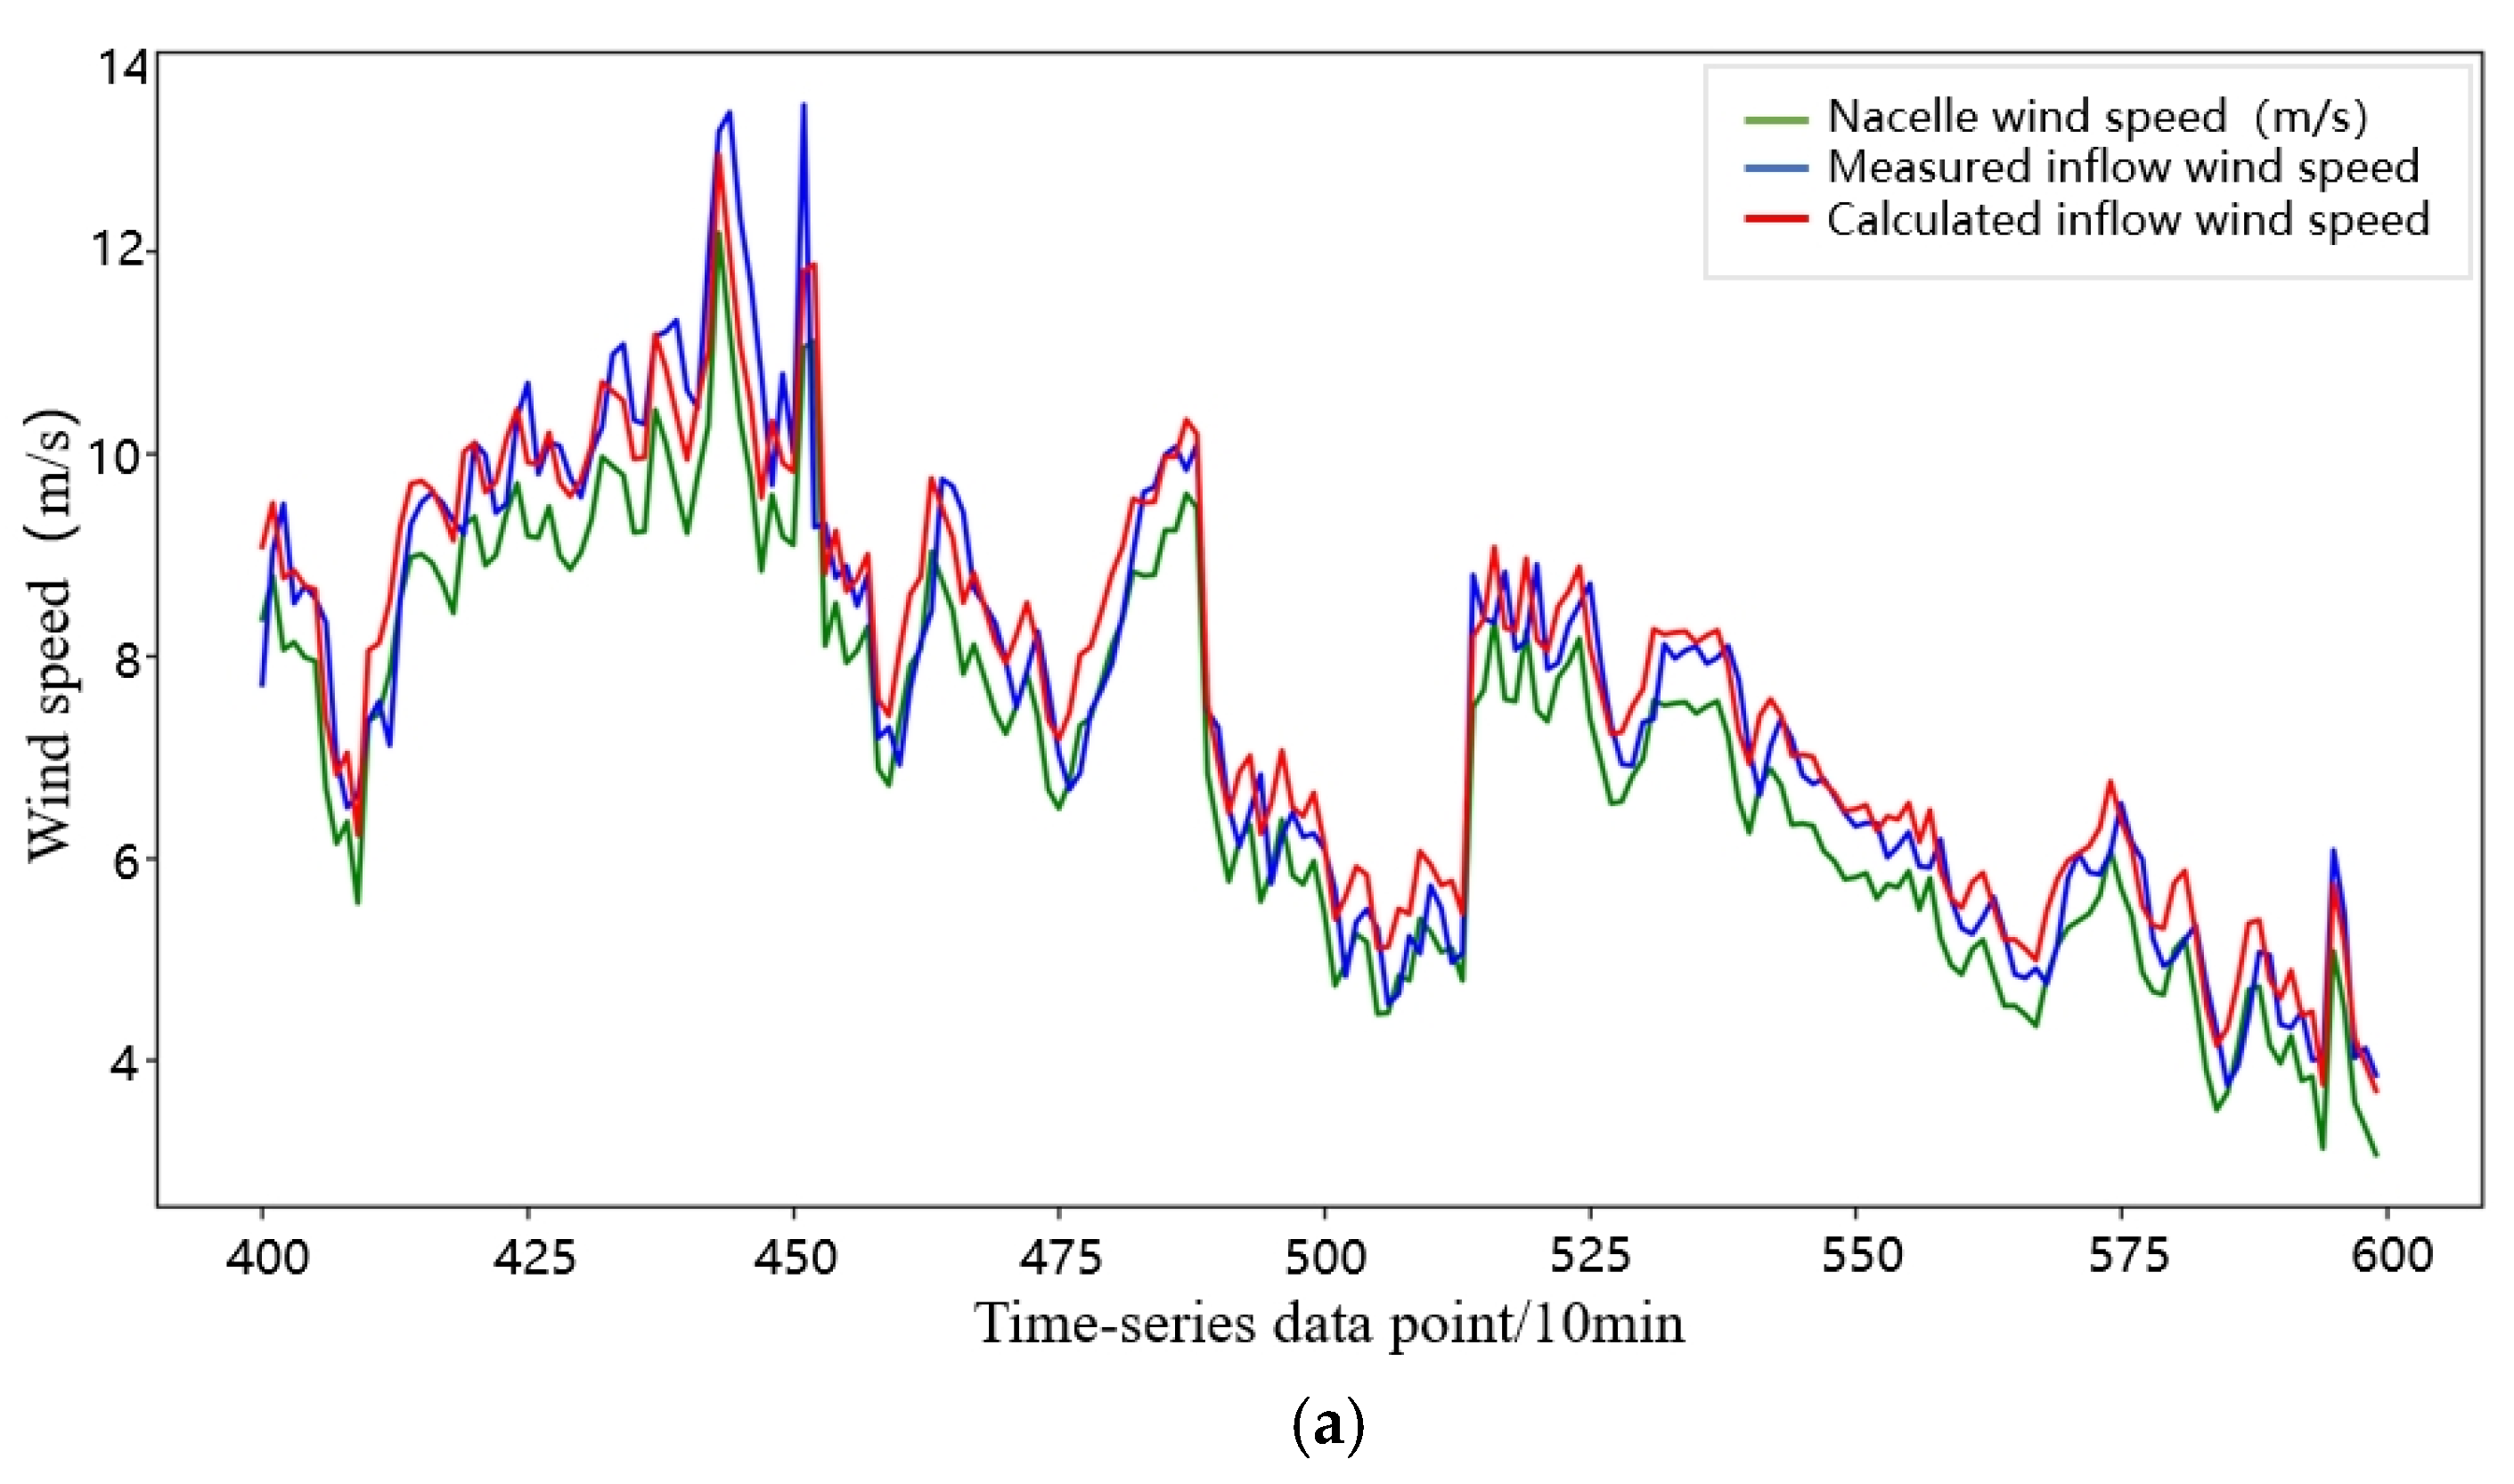
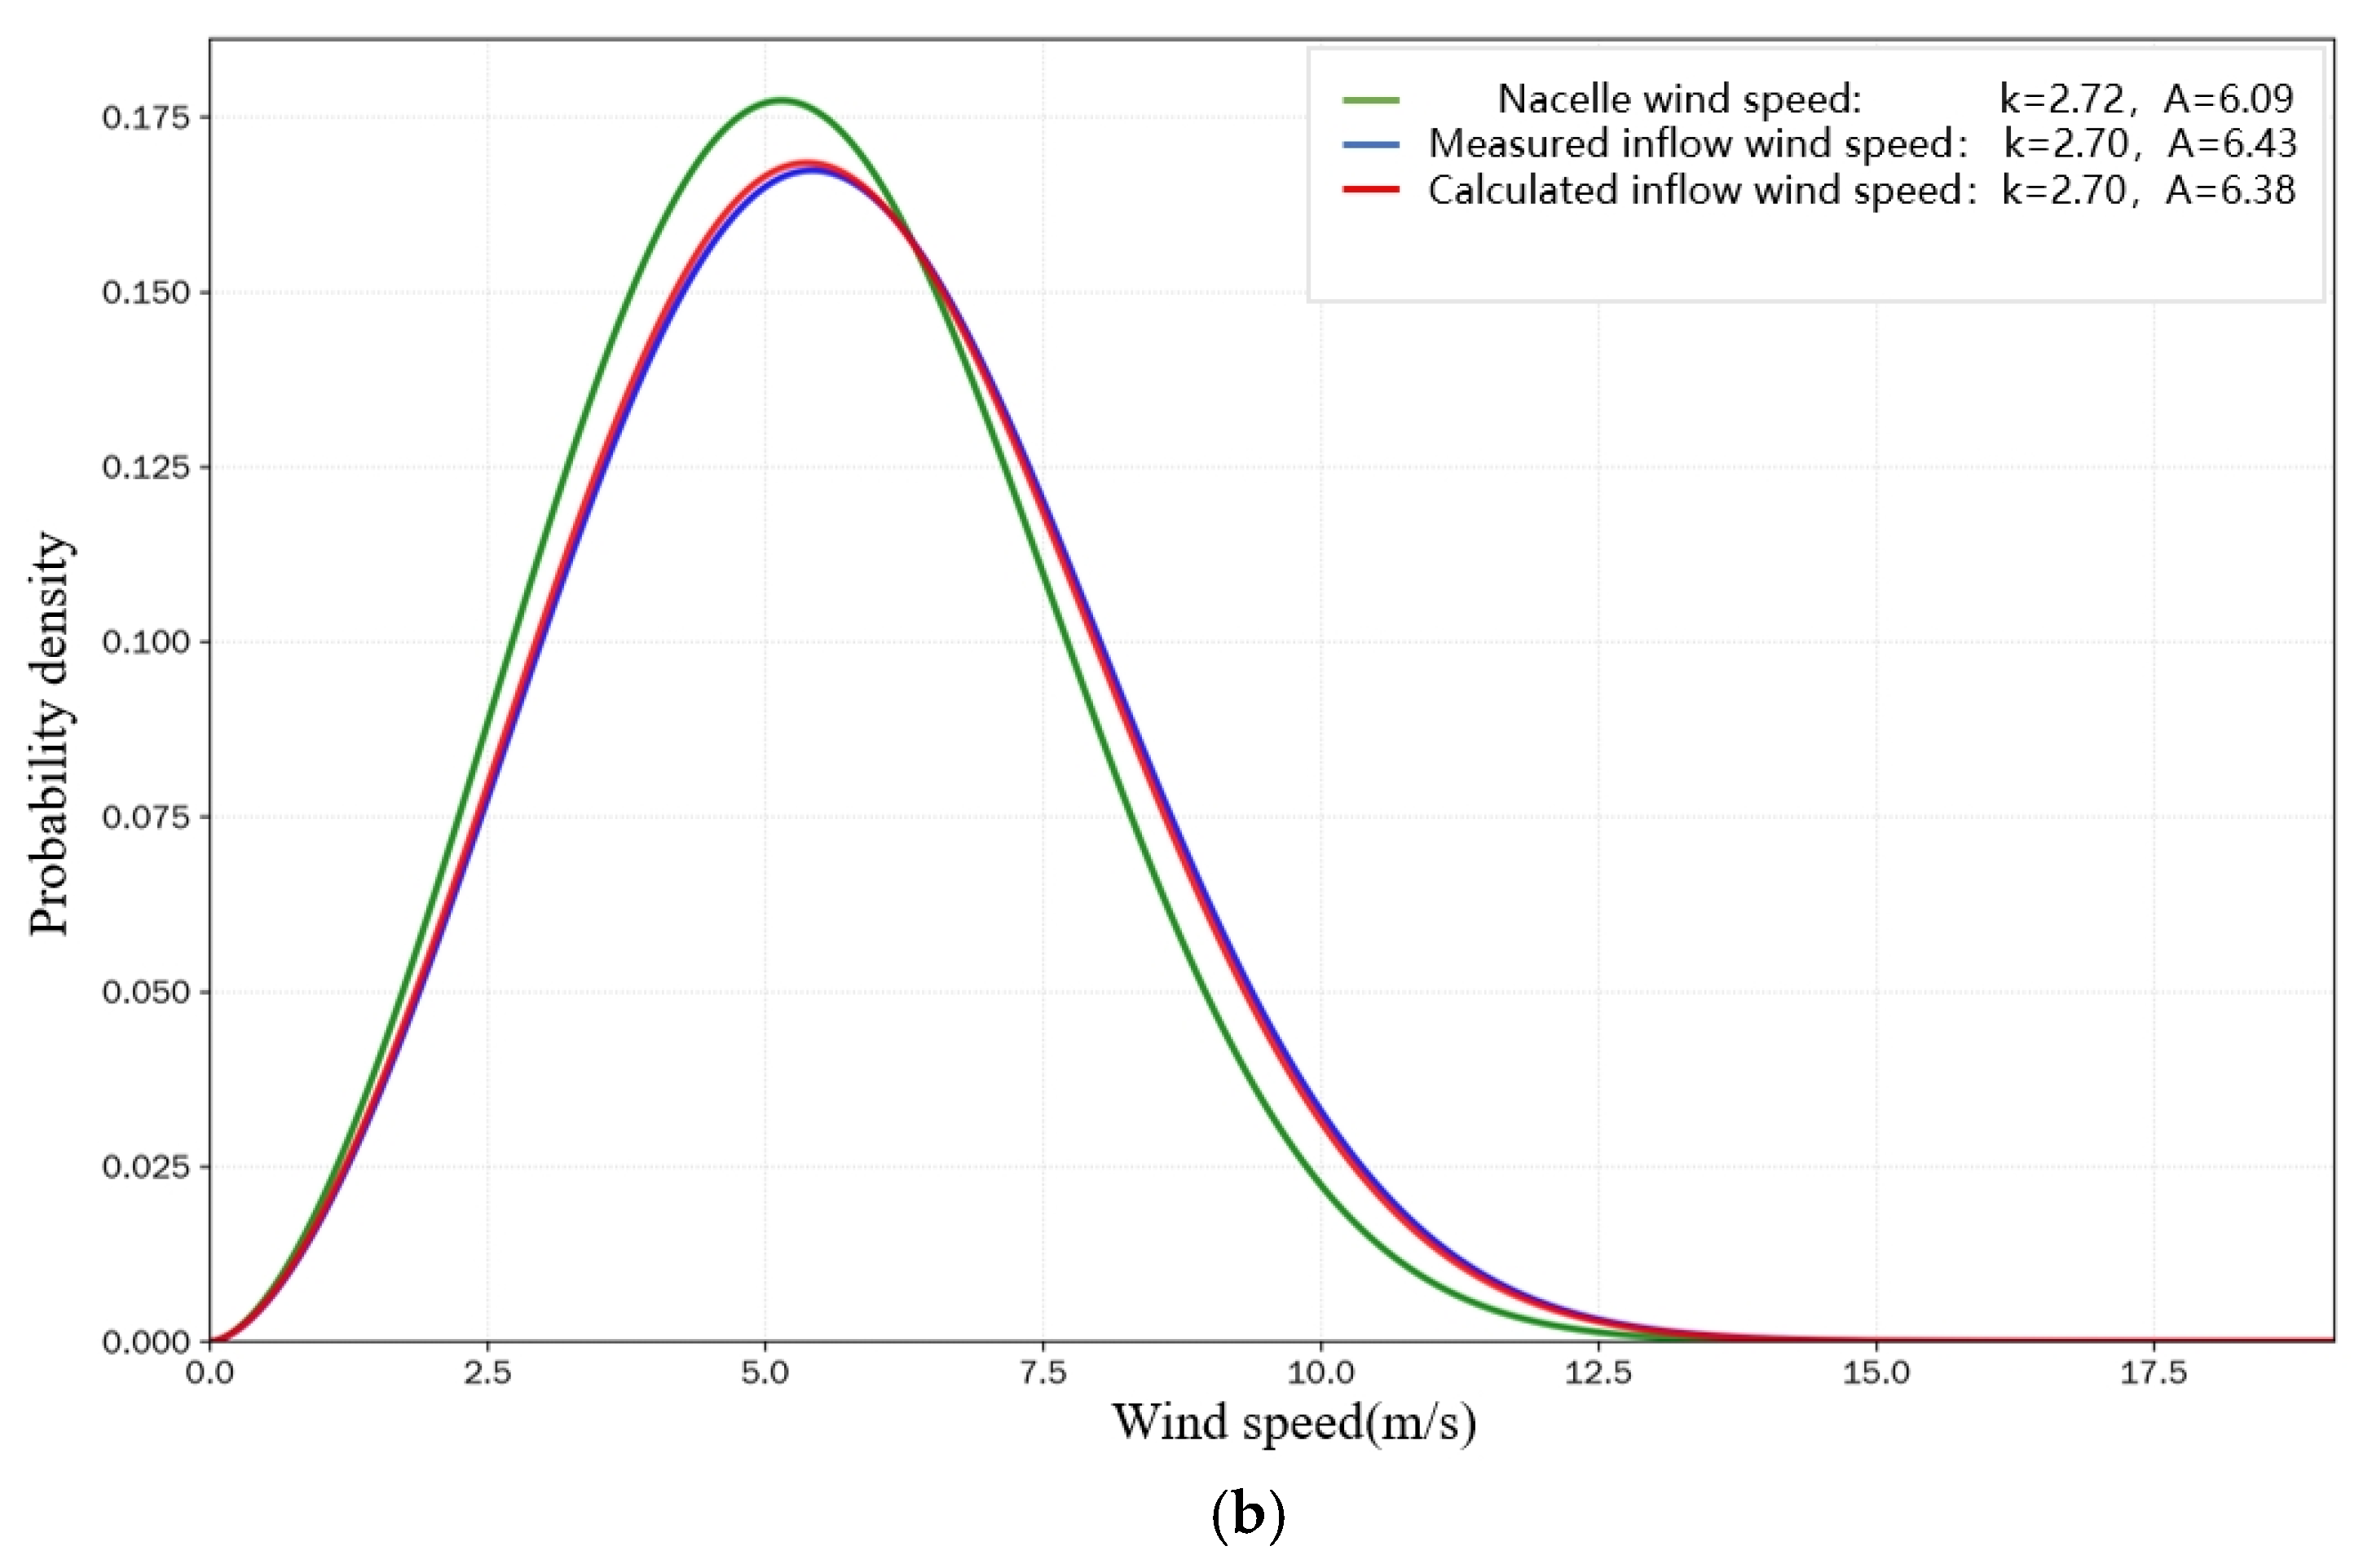
To verify the applicability of the proposed method in wind resource assessment of repowering projects, the time-series values and Weibull distributions of the nacelle wind speed, measured inflow wind speed, and calculated inflow wind speed of turbine T are compared, as shown in
Figure 8. It can be seen from
Figure 8a that due to factors such as rotor rotation and nacelle flow disturbance, there is a large overall difference between the time-series nacelle wind speed and the measured inflow wind speed; while the inflow wind speed calculated by the PMCP method is very close to the measured wind speed curve, indicating that the modeling strategy based on the power curve in the low wind speed region and the pitch angle curve in the high wind speed region can obtain high-precision inflow wind speed. It can be seen from
Figure 8b that compared with the nacelle wind speed, the coincidence degree between the Weibull distribution curve of the calculated inflow wind speed and the measured wind speed curve is greatly improved, indicating that the PMCP method can effectively improve the assessment accuracy when used for wind energy resource assessment.
5. Applicability of the PMCP Model to Wind Farms in Complex Terrain
The PMCP model shows high calculation accuracy in wind farms with flat terrain. This section discusses its applicability in wind farms with complex terrain.
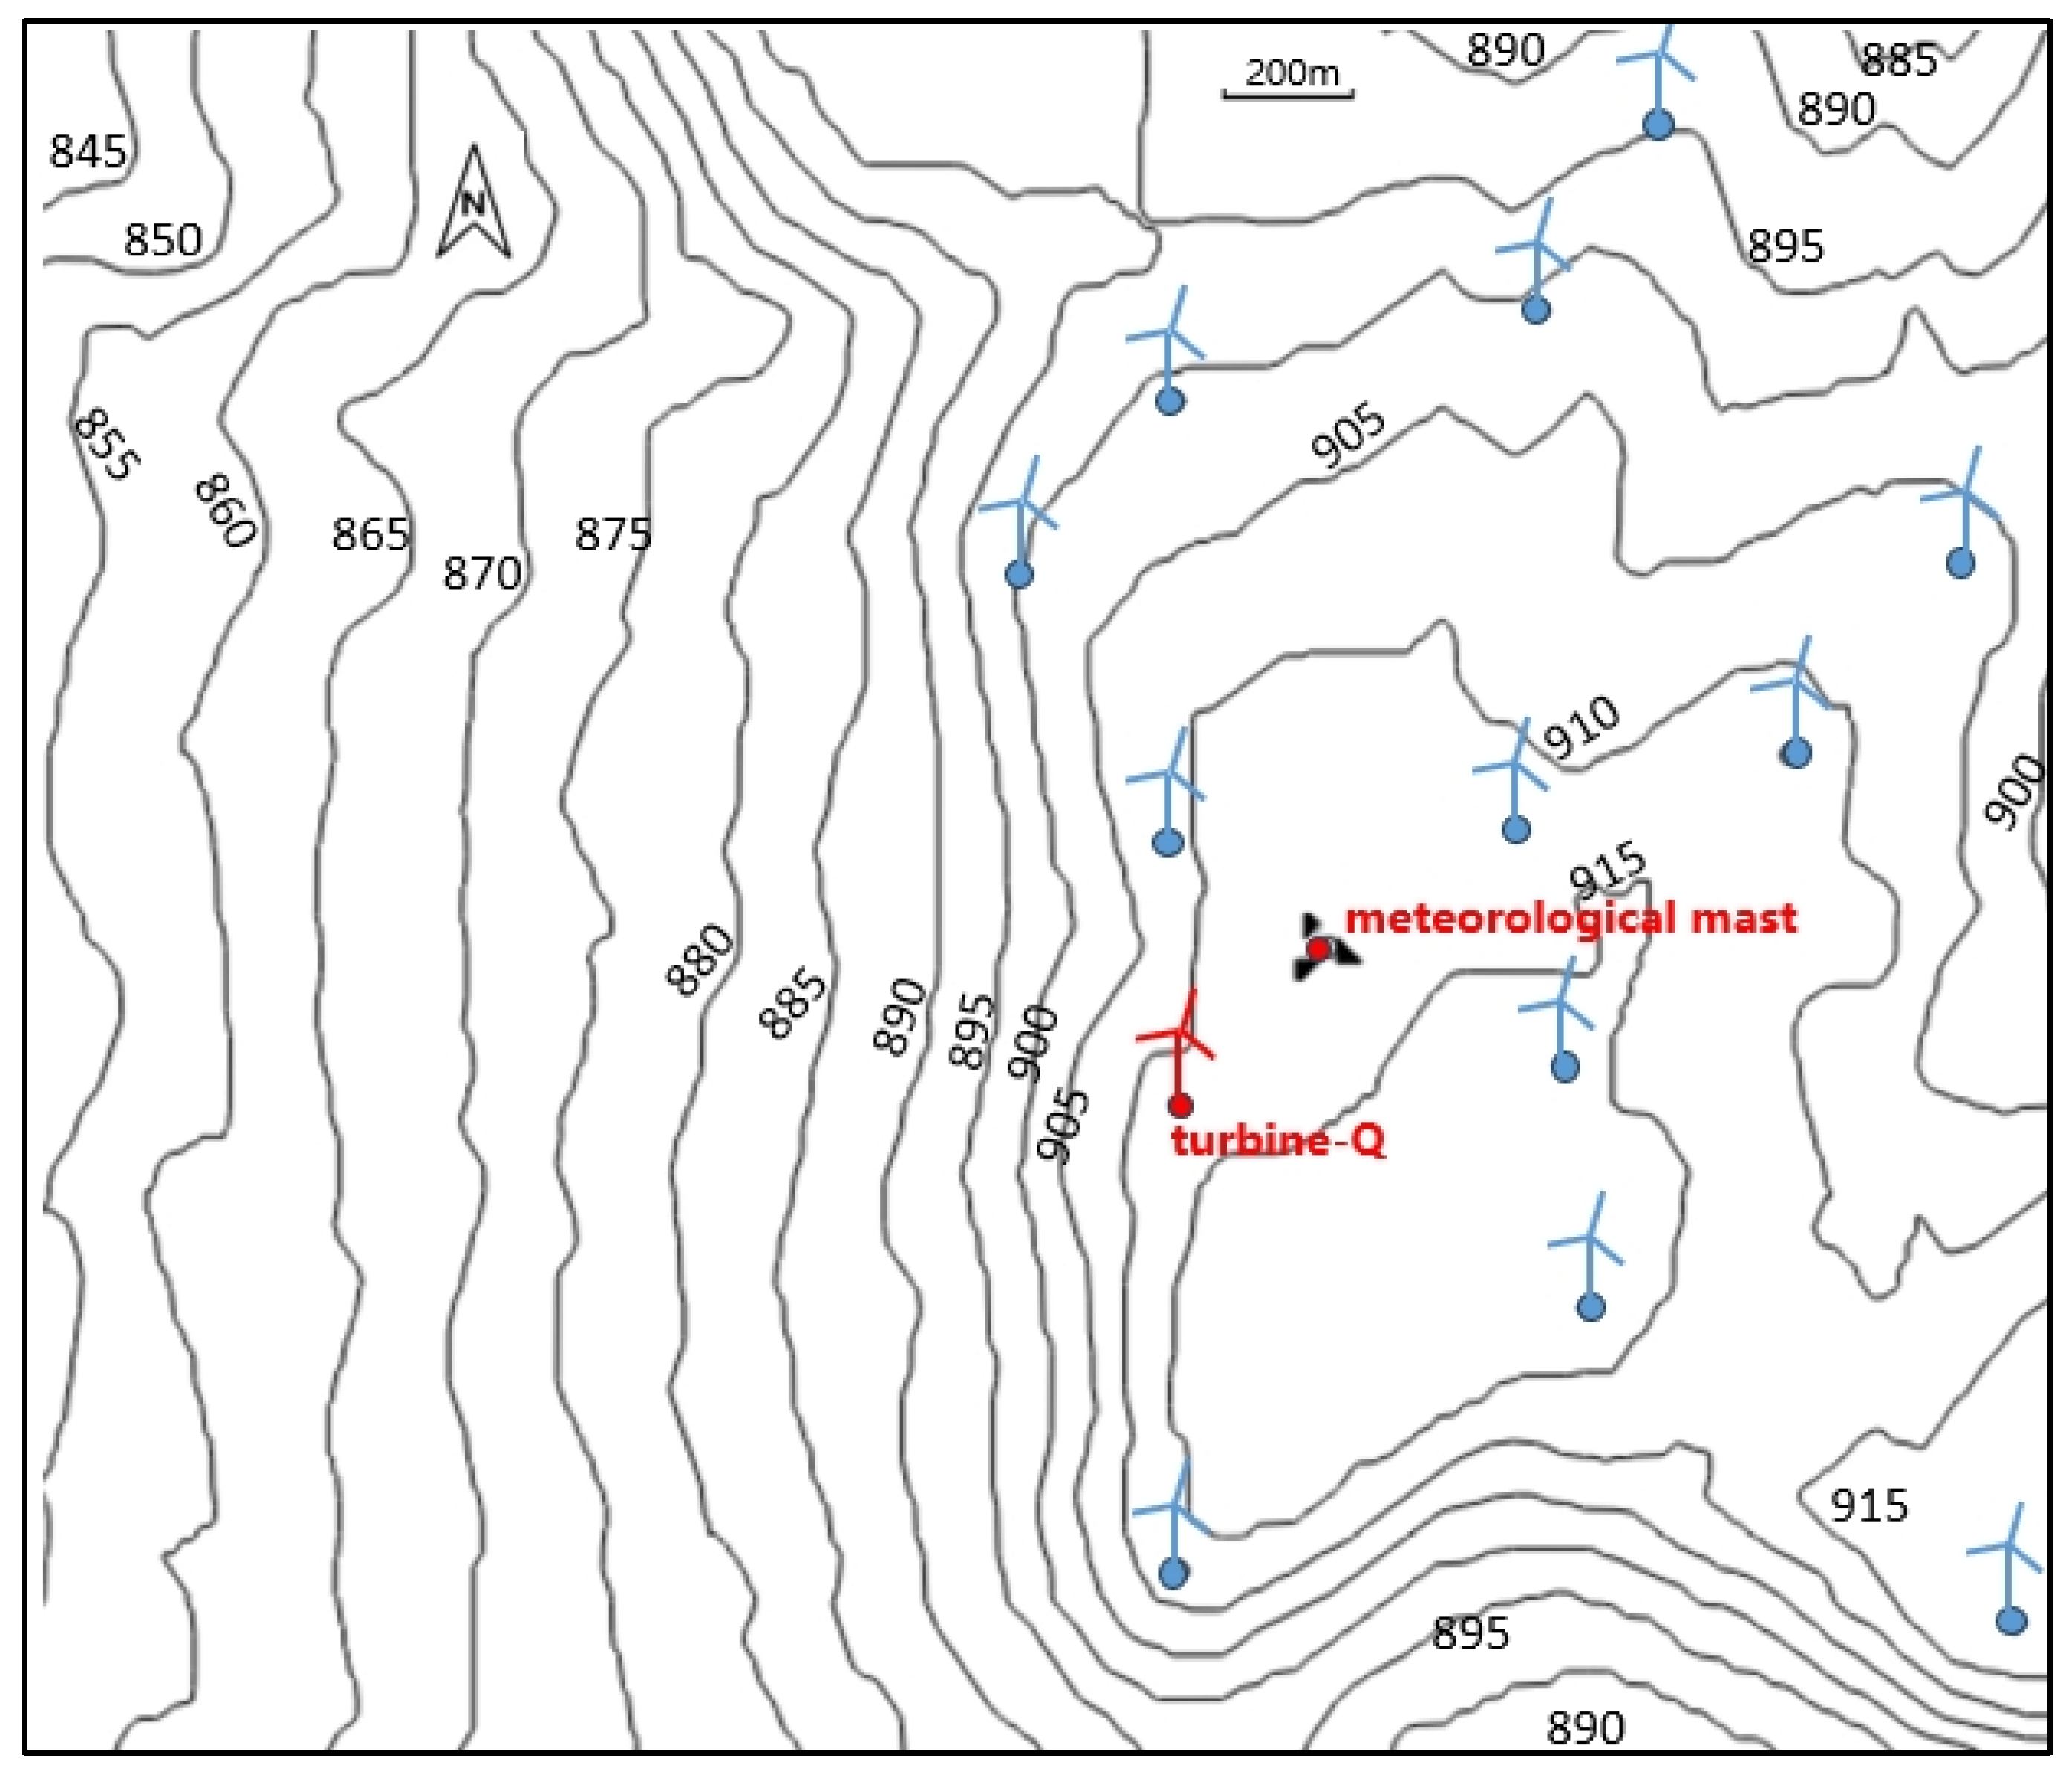
An old mountain wind farm is taken as an example for verification. The altitude range of the wind farm is 820~920 m, the dominant wind directions are southeast wind and west wind, and the installed capacity is 49.5 MW, equipped with 33 1.5 MW wind turbines. The hub height of the turbine is 65 m, the rotor diameter is 70 m, and the rated wind speed is 11 m/s. It should be noted that the theoretical power curve of wind turbines used in the modeling of this wind farm is a customized one provided by the turbine manufacturer for the project. In providing this curve, the manufacturer has fully taken into account environmental factors such as air density at the local altitude and local climate conditions, and has carried out targeted air density correction accordingly. Turbine Q is located on a relatively flat mountain top platform, and a wind measurement tower is built in its southwest direction, with a distance of about 260 m and an altitude difference of 5 m between them. The terrain between them has no large undulations and no tall obstacles. The relative position of turbine Q, the wind measurement tower, and the nearby terrain is shown in
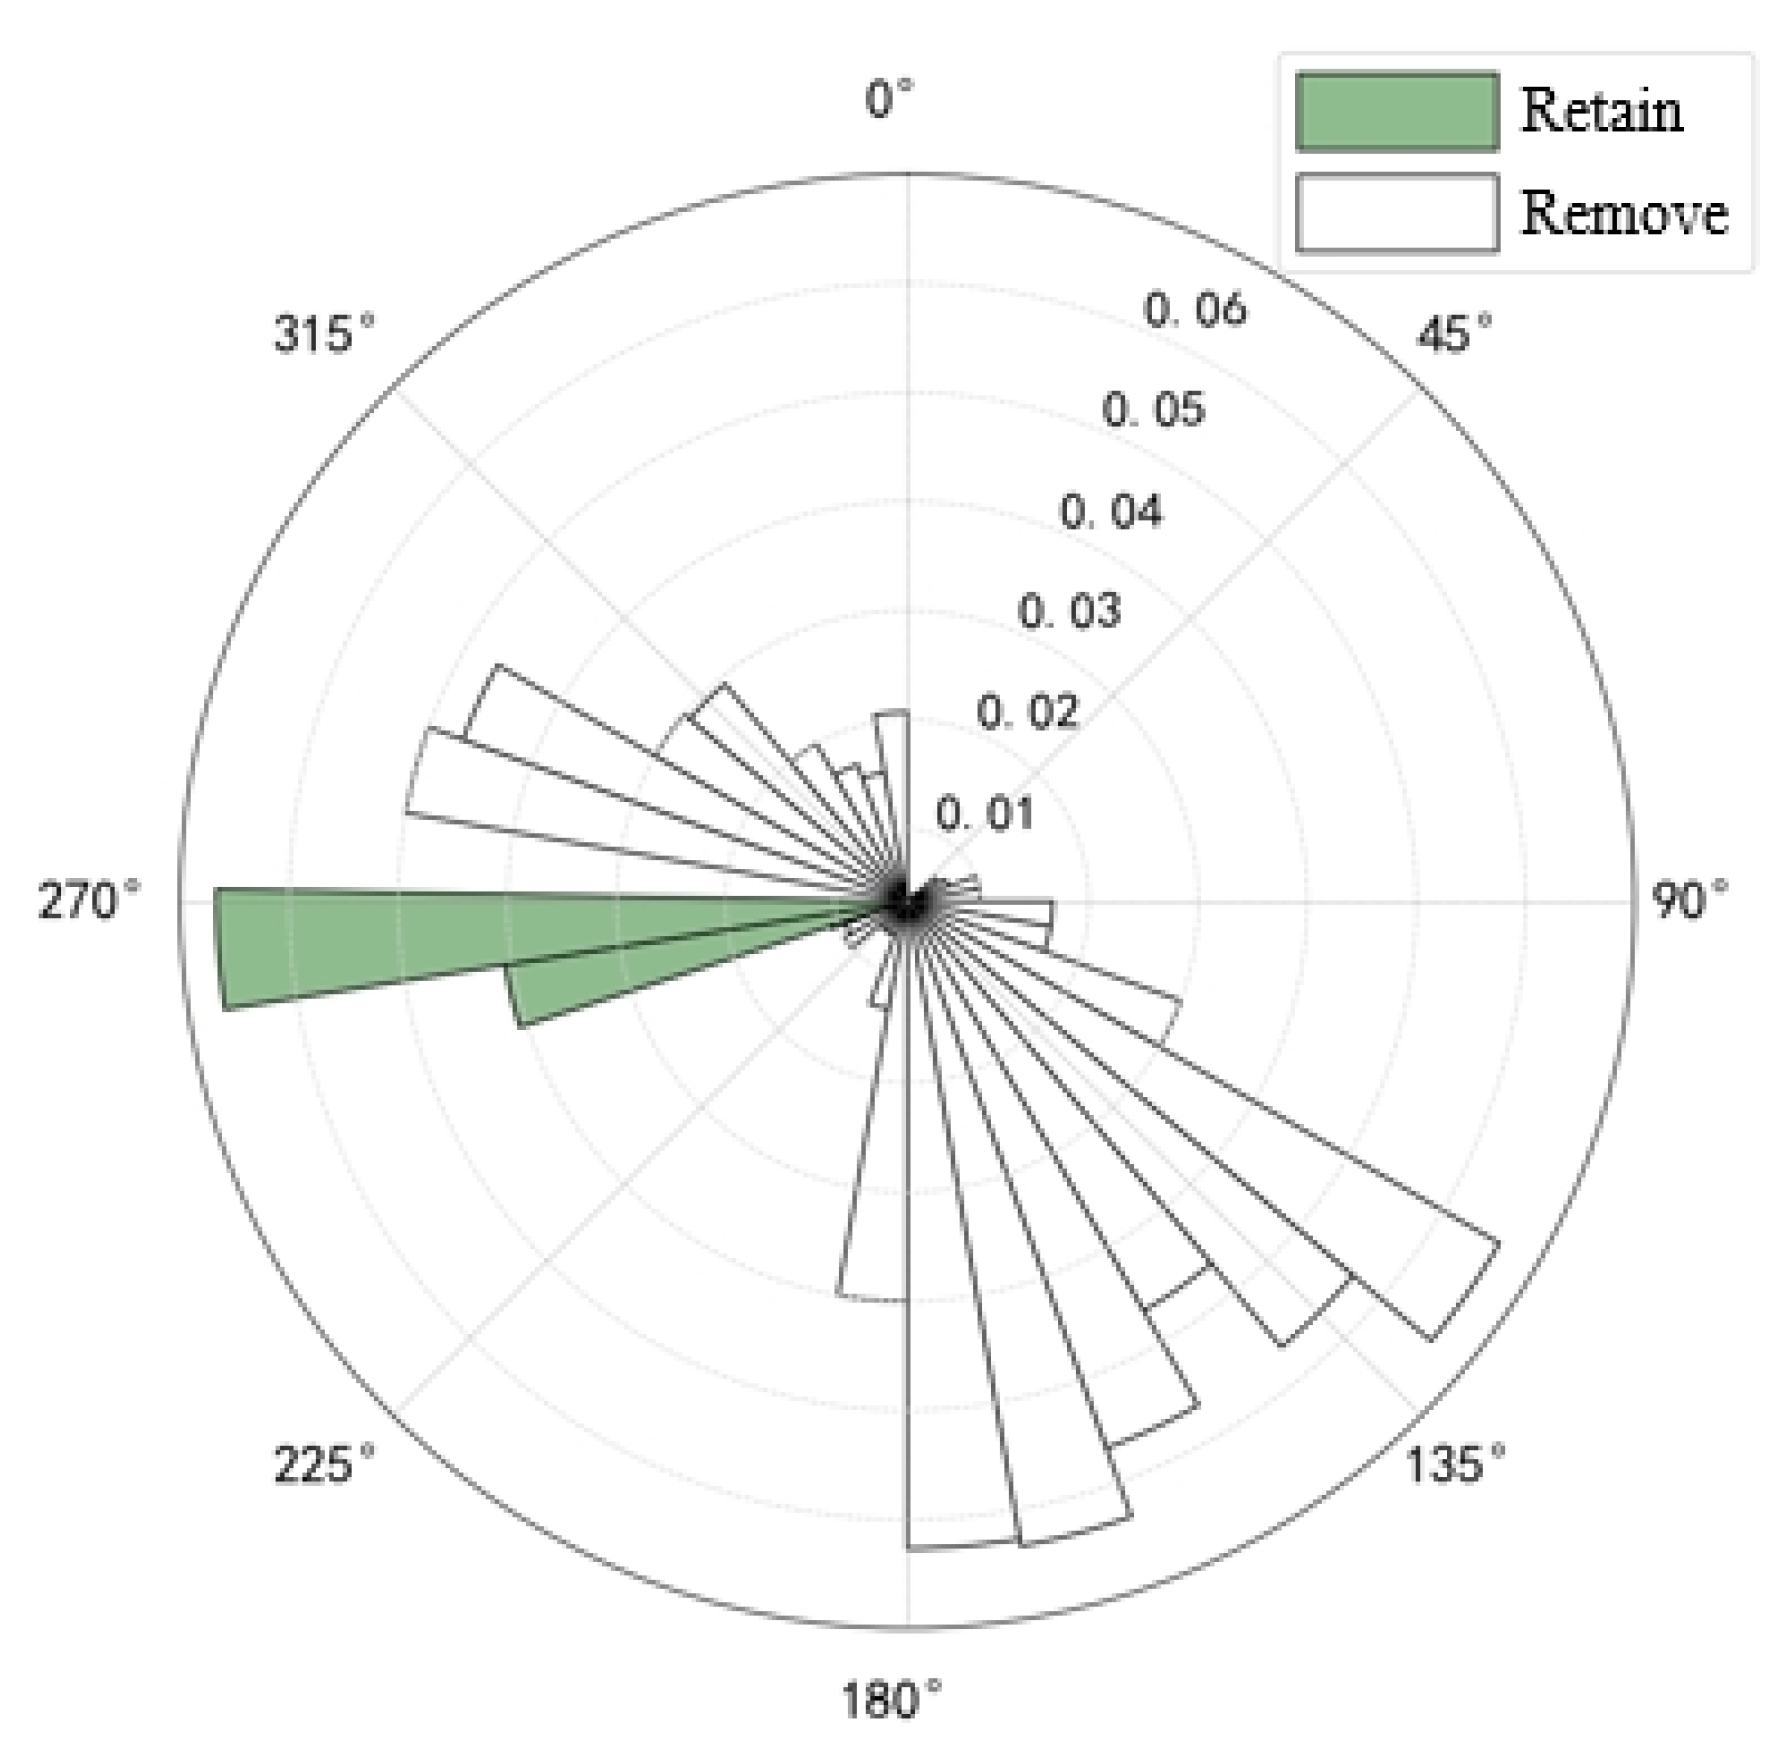
Figure 9. According to the IEC standard, the influence of adjacent turbines is eliminated, and the wind direction sector is screened, with the result shown in
Figure 10. The wind measurement tower data in the reserved wind direction sector in
Figure 10 can be regarded as the real inflow wind speed of turbine Q.
Historical operation data of turbine Q in 2024 are collected for PMCP modeling of inflow wind speed, the neighborhood parameter
= 0.02 is set, the percentile
H = 10% is taken, and the time-series inflow wind speed of turbine Q from January to April 2025 is calculated; the IEC nacelle transfer function of turbine Q is established using the wind measurement tower data in the reserved wind direction sector in 2024 as the measured inflow, and the time-series inflow wind speed from January to April 2025 is calculated. Taking the wind measurement tower data in the reserved wind direction sector from January to April 2025 as the real inflow, the accuracy of the two inflow wind speed calculation methods in the complex-terrain wind farm is verified, as shown in
Table 2.
As shown in
Table 2, for wind farms located in complex terrain, the computational errors of both methods are higher than those for wind farms on flat terrain. Since the nacelle transfer function method requires modeling based on measured wind speeds, its accuracy and temporal fitting goodness are slightly superior to those of the PMCP method. In this case study, the measured average inflow wind speed at the turbine is 6.76 m/s; the nacelle transfer function method yields a highly accurate estimate of the average wind speed, whereas the PMCP method incurs an error of 0.41 m/s.
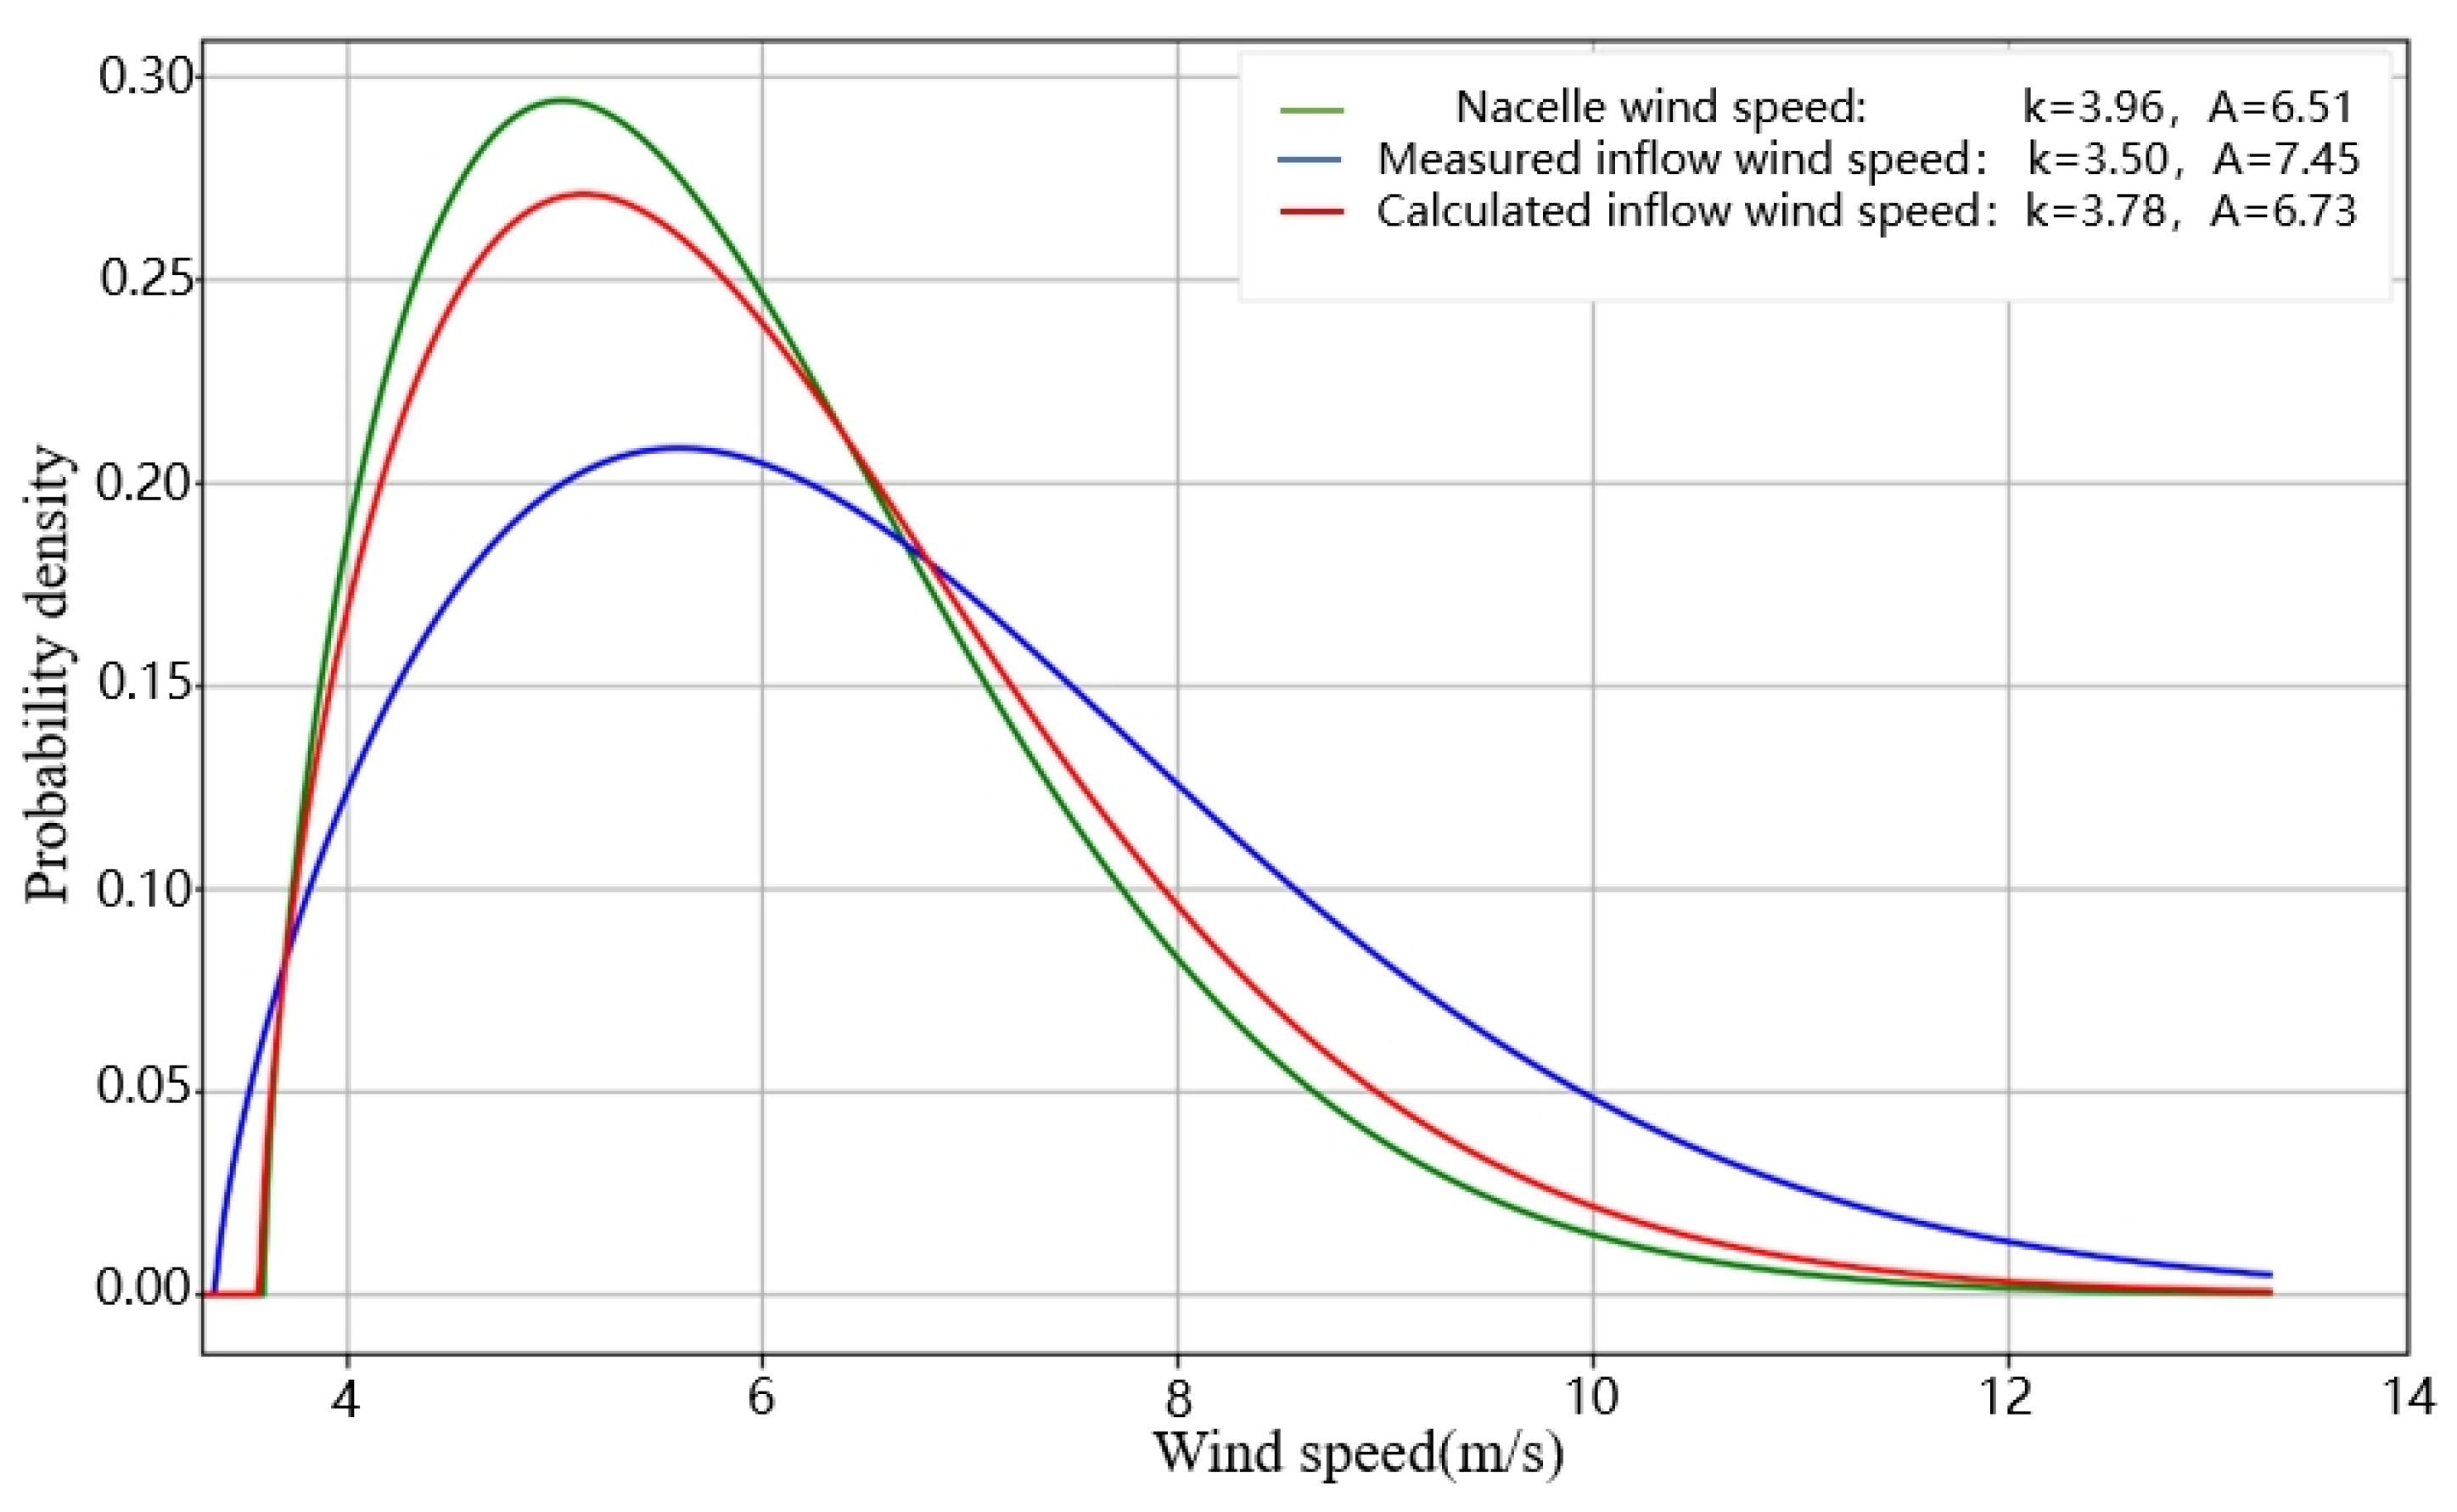
The Weibull distributions of the nacelle wind speed, measured inflow wind speed, and inflow wind speed calculated by the PMCP method of turbine Q are, respectively, calculated, as shown in
Figure 11. It can be seen from the figure that in the complex-terrain wind farm, the accuracy of wind energy resource assessment using the wind speed calculated by the PMCP method is greatly improved compared with directly using the nacelle wind speed, but the error is still large compared with the measured wind speed.
Combined with the analysis of calculation results, the reasons for the reduced calculation accuracy of the PMCP method in complex terrain are mainly reflected in two aspects. First, complex terrain leads to turbulent flow fields in wind farms, which greatly weakens the correlation between nacelle wind speed and actual inflow wind speed, thus reducing the accuracy of wind speed inversion based on the mapping relationship between them. Second, the measured inflow wind speed data obtained from anemometer towers in complex terrain have certain measurement errors. As the reference standard for accuracy verification, the limited accuracy of the measured data also results in relatively high errors in the calculation results of the PMCP method.
6. Conclusions
This paper proposes a Piecewise Method for Calculating Inflow Wind Speed (PMCP) for wind turbines based on operational data. It conducts an optimization study of the key parameter—the percentile H—and validates the accuracy and applicability of the proposed method in both flat-terrain and complex-terrain wind farms through direct measurement of inflow wind speed at turbine sites. The main conclusions are as follows:
(1) The PMCP method establishes the relationship between inflow wind speed and nacelle wind speed by using power and pitch angle as intermediate parameters in different wind speed zones, based on the operational characteristics of the wind turbine.
(2) Percentile H is a critical parameter affecting the accuracy of inflow wind speed calculations, and its value should ideally range between 0.05 and 0.15.
(3) The PMCP method is suitable for wind farms located on flat terrain, achieving computational accuracy comparable to that of the NTF method—which requires measured inflow data for modeling—thereby significantly improving wind resource assessment accuracy. For wind farms in complex terrain, the PMCP method yields a slightly higher computational error than the NTF method, yet still offers a certain improvement in the accuracy of wind resource assessment when compared to the direct use of nacelle wind speed measurements.
(4) The PMCP method is simple and feasible. Its modeling process does not require measured inflow data of the turbine, and the inflow wind speed can be calculated only by using the historical operation data of the turbine, which can effectively reduce the wind measurement cost and improve the wind resource assessment accuracy of wind farm repowering projects.