


Abstract
This study establishes a facies-based framework for characterizing reservoir quality in the Upper Pannonian geothermal reservoirs of the Szentes field (Hungary). To evaluate vertical heterogeneity and optimize the selection of geothermal reinjection zones, an integrated core–log–statistical workflow was applied to data from boreholes SZT-1 and SZSZT-IX. The methodology combined petrophysical measurements, petrographic observations, and multivariate statistical analyses, including Hierarchical Cluster Analysis (HCA) and Linear Discriminant Analysis (LDA). The siliciclastic succession was classified into four distinct facies clusters representing a continuum of depositional energy regimes: Rolling, Graded Suspension with Rolling, fine-grained Suspension, and Uniform Suspension. The results demonstrate a dual control on reservoir quality: the primary pore framework is determined by depositional grain-size architecture and sediment transport processes, while mechanical compaction and diagenetic alteration subsequently modify pore connectivity and flow efficiency. Among the identified facies, deposits formed from Graded Suspension with Rolling represent the most favorable reservoir units, combining high porosity (up to 33%) with exceptionally high permeability (>1500 mD). In contrast, suspension-dominated facies deposited from Graded and Uniform Suspension exhibit significantly reduced permeability due to higher matrix content, cementation, and compaction. The results demonstrate that reservoir performance in the Szentes geothermal system is primarily controlled by facies-scale heterogeneity rather than by depth-based stratigraphic divisions alone. This integrated facies-based approach provides a predictive framework for extrapolating reservoir properties to uncored intervals and offers practical guidance for optimizing reinjection strategies and sustainable geothermal reservoir management.
1. Introduction
Reservoir characterization in siliciclastic systems depends strongly on the interplay between textural attributes and petrophysical properties. Porosity and permeability are primarily controlled by textural parameters such as grain size, sorting, and matrix content [1,2,3] and may subsequently be modified by diagenetic processes including compaction, cementation, and dissolution [4,5]. Understanding these relationships is essential for evaluating effective porosity and fluid-flow capacity in clastic geothermal reservoirs. In complex geological media, reservoir heterogeneity is often governed by multifaceted interactions between sedimentary architecture, mineralogical composition, and pore-scale processes, which together determine the ultimate pore framework and permeability variability. In Hungary, Upper Miocene (Upper Pannonian) sandstones of the Great Hungarian Plain have been exploited for thermal water since the 1960s, particularly in the southeastern part of the basin, where geothermal gradients of 45–50 °C/km are reached [6,7]. These reservoirs, mainly hosted by the Újfalu and Zagyva Formations, constitute the main Upper Pannonian geothermal aquifers of southeastern Hungary, overlying the marl-rich Lower Pannonian aquitards [8,9]. Long-term production without reinjection has resulted in reservoir pressure decline, compaction, and land subsidence [9,10,11,12]. From 2027 onward, reinjection will be required by new regulations, making it crucial to address injectivity decline, which is often linked to fines migration and clogging processes, particularly in intervals enriched in silt- and clay-rich fractions [13,14].
Although average reservoir properties of the Szentes geothermal field have been reported [9,13,15], the role of facies-scale heterogeneity in controlling permeability distribution and injectivity remains insufficiently understood. This study investigates textural and petrophysical variability in Upper Miocene siliciclastic successions from boreholes SZT-1 and SZSZT-IX (Figure 1) by combining sedimentological observations, petrographic examination, and multivariate statistical methods. The analysis aims to quantify the relationship between depositional facies, grain-size architecture, and reservoir properties.
Figure 1.
Stratigraphic cross-section across the study area with wells and their production (screen) interval. The studied wells, SZT-1 and SZSZT-IX, are highlighted (modified after [12,16]).
By integrating sedimentological observations with statistical analyses of grain-size parameters and petrophysical properties (porosity, permeability, and acoustic wave velocity), this work establishes a quantitative link between depositional facies and reservoir quality. Multivariate statistical approaches are employed to identify sedimentary facies and correlate grain-size architecture with petrophysical variability in heterogeneous siliciclastic reservoirs.
This integrated workflow offers a novel facies-based approach for interpreting and predicting heterogeneity in Upper Pannonian systems. By improving the accuracy of permeability and injectivity forecasts, these findings enhance reservoir assessments within the Pannonian Basin and provide a scalable model for analyzing comparable siliciclastic geothermal systems.
2. Geological Setting
The Szentes geothermal field formed within Hungary’s Great Hungarian Plain during the Middle to Late Miocene extensional collapse of the Alpine–Carpathian orogen. This process induced lithospheric thinning and thermal subsidence [6,17] and created significant accommodation space for the accumulation of thick siliciclastic and lacustrine deposits derived from the Pannonian Lake [8,18]. During the Late Miocene (Upper Pannonian), an extensive fluvio-deltaic system prograded into the basin, which resulted in the deposition of the Újfalu and Zagyva Formations in the Szentes area. Together, these successions represent a transi-tion from deltaic to alluvial environments [8,12,19] and are considered the primary, though lithologically heterogeneous, geothermal reservoir units of southeastern Hungary [9,13]. Both formations are overlain by the marl-rich deposits of the Lower Pannonian (Alföld Group), which act as regional aquitards [8,9].
The Újfalu Formation encompasses delta-front to delta-plain facies composed of sandstones, siltstones, and mudstones associated with distributary channels, mouth bars, levees, and interdistributary bays. A wave- and river-influenced deltaic environment characterized by fluctuating energy conditions and frequent channel avulsion is indicated by sedimentary structures [16,19,20,21]. Overlying the Újfalu, a shift to terrestrial alluvial plain conditions is reflected by the Zagyva Formation. It is dominated by fine-grained sandstones, siltstones, and mudstones arranged in fining- and coarsening-upward successions, which reflect cycles of crevasse, play deposition, channel migration, overbank flooding, and floodplain accumulation. Episodic subaerial exposure and pedogenesis are highlighted by the widespread occurrence of paleosols, root traces, desiccation cracks, and mud drapes [12].
The inherent lithological and textural variability of these Upper Pannonian formations, shaped by both depositional controls and diagenetic processes such as compaction, clay mineral authigenesis, and carbonate cementation, exerts a first-order control on porosity, permeability, pore geometry, and overall reservoir quality [22,23,24]. Within the Szentes geothermal field, this heterogeneity has direct implications for sustainable thermal water production and reinjection [9,25].
Accordingly, three distinct reservoir levels have been recognized within the Újfalu and Zagyva successions, which reflect the vertical stratigraphic distribution of productive sandstone horizons [9,13]. The upper aquifer layer group, level A, consists of wells having a completion with production intervals in the Újfalu and Zagyva Fms. between the depths of 1500 and 1800 m, with an average permeability of 1500 mD. The middle aquifer layer group, level B, includes wells with production intervals of 1800–2000 m, mainly in Újfalu and partly in the Zagyva Fm. rock, with an average permeability of 500 mD. The lower aquifer layer group, level C, includes wells below 2000 m depth entirely in the Újfalu Fm., with an average permeability of 1000–2000 mD [12,15,16,26].
3. Materials and Methods
An integrated dataset comprising core descriptions, petrophysical measurements, and well-log data was used to evaluate facies-controlled reservoir heterogeneity in the Szentes geothermal field. In the SZSZT-IX borehole (production well), 49 cylindrical samples were taken from three sections between 1742.5 and 1840.33 m. In the SZT-1 borehole (reinjection well), 75 cylindrical samples were collected from three sections between 1740.5 and 1972.5 m. In addition, 35 and 74 cutting samples from SZSZT-IX and SZT-1, respectively, were analyzed for particle size after soaking in distilled water (disaggregation). Of the cylindrical samples, only 16 from SZSZT-IX and 56 from SZT-1, drilled in the axial direction, were retained after filtering and cleaning to ensure consistency in orientation and quality.
The cylindrical samples underwent comprehensive sedimentological and petrophysical analyses, while cutting material was used explicitly for granulometric measurements. Wireline gamma-ray (GR) logs from both wells were also available and were later integrated with core descriptions for stratigraphic correlation. All core and log data were supplied by GEOCHEM Ltd., which has conducted similar geothermal reservoir characterizations in the Szentes field [13].
3.1. Core Description and Sample Preparation
Macroscopic descriptions were carried out on all core intervals, documenting lithological features (e.g., grain size, sorting, colour), sedimentary structures (e.g., lamination, cross-bedding), and diagenetic modifications (e.g., cementation, compaction textures), following established sedimentological protocols [27,28,29]. These observations facilitated the grouping of samples into preliminary lithotypes. Selected representative samples were prepared for thin-section petrography and Scanning Electron Microscopy (SEM), providing detailed insights into mineralogy, matrix characteristics, and cement distribution [22,30].
Cylindrical plugs (1.5-inch diameter) were extracted from the cores and were dried in a two-step process (air-drying followed by oven-drying at 65 °C for 24 h) to preserve pore structures [31]. These plugs were used for petrophysical measurements (porosity, helium gas permeability, and P- and S-wave acoustic velocity) in accordance with standard protocols [32,33]. Subsamples from identical plug locations were also allocated for SEM investigations, enabling direct correlation between bulk properties and pore-scale features. This integrated workflow ensured that petrophysical variability could be directly linked to microtextural and mineralogical heterogeneity.
3.2. Laboratory Measurements
Grain size distributions were determined by dry sieving for sand fractions and by laser diffraction with a Cilas 1180 LD for silt and clay, following established sedimentological protocols [28,34,35,36,37]. Samples were classified using the Udden–Wentworth scale [36,38,39] and were validated against core descriptions and well logs. CM diagrams [40,41], plotting the coarsest percentile (C) against the median grain size (M) on a log–log scale, were constructed from laser particle size data to assess depositional conditions and sediment transport mechanisms [41,42,43,44,45]. These plots, cross-referenced with core data and GR logs, refined the deltaic depositional model and provided a quantitative framework for linking depositional processes to reservoir heterogeneity.
3.2.1. Petrographic and Scanning Electron Microscopy (SEM)
High-resolution insights into grain boundaries, pore networks, and diagenetic phases were obtained by using thin-section petrography and SEM [23,46]. Particular attention was given to intergranular and intragranular porosity, clay coatings, and authigenic cementation, all of which strongly influence porosity, permeability, and reservoir quality [5,22,30,47]. These microtextural observations were directly integrated with petrophysical measurements, thereby linking pore-scale processes to bulk reservoir properties. This approach allowed mineralogical features, pore textures, and diagenetic modifications to be evaluated in relation to the measured petrophysical variability.
3.2.2. Rock Physical Measurements
Skeletal (matrix) density was measured with a Quantachrome Pentapyc 5200e helium pycnometer, applying Boyle’s law. At the same time, porosity was calculated from combined pycnometric data and plug geometry measured by digital caliper and 3D scanning. Samples (dried at 65 °C for 24 h) were subjected to seven measurement cycles, with the mean of the last five retained when the error was below 0.005.
Gas permeability was determined with a Vinci Technologies Coreval-700 instrument using the pressure-drop method, which is suitable for rocks with permeability between 1 μD and 10 D [32]. Measurements were performed at an estimated reservoir pressure of 210 bar, following values reported by Mészáros and Zilahi-Sebess [48].
Acoustic properties were assessed using the impulse transmission method [49] with a Vinci Technologies AVS-700 system (SZSZT-IX) and a GEOCHEM SRL-A1000 device (SZT-1) (GEOCHEM Ltd., Kővágószőlős, Hungary). P-wave and S-wave transit times were measured on dry plugs under 210 bar confining pressure to simulate in situ stress, which enabled the estimation of dynamic elastic properties [50,51,52].
In addition to porosity and permeability, two derived indices were used to assess reservoir quality. The Reservoir Quality Index (RQI) measures a rock’s ability to store and transmit fluids by combining porosity and permeability into a single, dimensionless value. The Flow Zone Indicator (FZI) provides a pore-geometry-based approach to understanding and classifying reservoir rocks. It moves beyond simple porosity–permeability relationships to define zones of similar flow behavior, leading to more accurate reservoir characterization and permeability prediction [32,53,54,55].
Using these indices enabled evaluation not only of the average quality of the reservoirs but also of the variability introduced by depositional and diagenetic heterogeneities, a critical step for assessing geothermal production and reinjection potential.
3.2.3. Well-Log Analysis
Wireline gamma-ray (GR) logs from wells SZT-1 and SZSZT-IX were depth-matched to core descriptions for precise stratigraphic alignment and used to identify vertical facies changes [56,57,58]. Beyond conventional GR interpretation, INPEFA® (Integrated Prediction Error Filter Analysis) curves were generated from GR data using CycloLog® [59,60]. INPEFA transforms raw log responses into relative percentages of lithological end-members (e.g., sand vs. shale) and provides a quantitative characterization of vertical stacking patterns and lithological heterogeneity. This was particularly important in the present study for detecting high-frequency cyclicity and distinguishing reservoir-prone sandy intervals from non-reservoir mud-rich facies in the Szentes geothermal field.
3.3. Statistical Methods
Data analysis was performed using STATGRAPHICS Centurion 19 and followed a structured workflow (Figure 2). The workflow integrated textural parameters, petrophysical properties, and depositional indicators to identify facies-related heterogeneity within the reservoir system.
Figure 2.
The methodological workflow diagram summarizing the integrated methods applied in this study.
The process began with data preparation, including treatment of extreme and outlier values, followed by descriptive statistical analysis to establish the geological context of the main rock types.
Building on this foundation, samples were grouped using Hierarchical Cluster Analysis (HCA) [61,62], which revealed preliminary associations based on combined textural and petrophysical parameters. These groups were cross-checked against Passega’s CM-diagram for geological plausibility [40,41,43,63] and were further validated through Linear Discriminant Analysis (LDA; [64,65,66]). In addition, Classification Trees were applied to provide explicit decision rules and highlight the key predictors controlling facies assignment [67].
Once statistically robust groups had been established, the study proceeded to correlation and regression analyses [44,68], integrated with well-log observations, to link depositional processes, diagenetic overprints, and reservoir quality indices (RQI and FZI). This integrated statistical approach was essential for bridging textural and petrophysical heterogeneity with stratigraphic architecture, ensuring that facies groups were not only statistically robust but also geologically meaningful.
3.3.1. Hierarchical Cluster Analysis (HCA)
Among the various clustering algorithms, such as partitioning methods, hierarchical clustering, arbitrary origin methods, and mutual similarity procedures, hierarchical methods are increasingly utilized in multivariate data analysis. Hierarchical Cluster Analysis (HCA) is a powerful unsupervised classification technique that groups similar observations into clusters, revealing hidden patterns and natural groupings within complex datasets without requiring prior knowledge of group assignments.
These algorithms effectively reproduce the hierarchical structure of data, classify multivariate populations, and identify statistically coherent groups [69,70,71]. Beyond statistical applications, dendrograms derived from HCA have been shown to capture the hierarchical organization of sedimentary environments and sub-environments, making the method particularly suitable for reservoir-scale facies analysis [72].
In this study, similarities between samples were quantified using Squared Euclidean Distance, and clusters were aggregated using Ward’s Minimum Variance Method [61]. The dataset comprised helium porosity, gas permeability, acoustic velocities, granulometric fractions (clay, silt, sand), and Passega’s C and M values. The resulting dendrogram (Figure 3) revealed a two-level structure: two primary clusters (CLST1 and CLST2), each further subdivided into two subclusters (CLST11, CLST12, CLST21, CLST22).
Figure 3.
Dendrogram of the Hierarchical Cluster Analysis.
This hierarchical organization not only reflects statistical relationships among samples but also mirrors the subdivision of depositional processes and facies associations, providing a geologically meaningful framework for interpretation [71].
Validation of clustering results is often challenging, as internal and external indices can yield ambiguous outcomes [72,73]. To ensure geological plausibility, cluster assignments were cross-checked against Passega’s CM diagram [40,41], which links grain-size distributions to sediment transport processes. This step provided an independent sedimentological criterion for evaluating the robustness of the statistical groupings.
3.3.2. Passega’s CM Diagram
The CM diagram [40,41] provides a graphical tool to relate grain-size distributions to depositional processes. In this method, M represents the median grain size (D50) and C the coarsest percentile, defined as the grain diameter at the first percentile of the cumulative grain-size distribution. Since this value can be difficult to determine directly in laboratory analyses, the D95 percentile is often used as a practical substitute [42,43].
The CM field can be divided into domains that correspond to distinct transport modes, such as uniform suspension, graded suspension, rolling, and turbidity flow. The position of plotted points for a deposit within these domains indicates the dominant hydrodynamic conditions and depositional setting. CM analysis has been widely applied in deltaic and fluvio-lacustrine systems to distinguish transport regimes and infer sedimentary environments [40,41,43,44].
In this study, CM diagrams were used as a complementary tool to statistical clustering, providing an independent sedimentological criterion for evaluating the plausibility of textural groupings and linking them directly to depositional processes.
3.3.3. Linear Discriminant Analysis (LDA)
Linear Discriminant Analysis (LDA) is a supervised technique used to validate the statistical distinctness of HCA-derived clusters, creating linear combinations of variables to maximize group separation [64,74,75]. The aims are to help distinguish between two or more groups of data based on observed quantitative variables. Two objectives of discriminant analysis are used to separate the samples into groups as well as possible and to classify new observations as belonging to one group or another by using the classification functions [65,66].
LDA typically presumes that the data within each class conform to a multivariate normal distribution and that the covariance matrices across all groups are equivalent. However, despite these theoretical prerequisites, LDA has proven to be relatively robust to minor deviations from these assumptions [64]. This characteristic is particularly beneficial in geological studies, where datasets derived from sources such as well logs or grain-size and rock-physical analyses are often inherently complex, may contain noise, and rarely adhere perfectly to ideal statistical distributions due to natural variability, measurement uncertainties, and the intrinsic heterogeneity of geological formations.
One discriminant function is calculated by the analysis for each group. Since these functions are independent by construction, the discrimination between groups does not overlap. The classification table shows the result of assigning observed and new cases to a group using derived classification rules.
3.3.4. Classification Trees (CTs)
A classification tree (CT), also known as a decision tree, is a non-parametric supervised learning method used for both classification and regression. In this study, CTs were applied to predict the cluster label of a target variable by learning simple decision rules inferred from the data features.
The method structures these rules as a tree-like model of hierarchical decisions, where each internal node represents a test on an attribute, each branch represents an outcome of the test, and each leaf node represents a class-label decision. The construction of a classification tree typically involves a recursive partitioning process, often following a top-down, greedy approach. The core idea is to successively split the dataset into smaller, more homogeneous subsets based on the values of the input features [67,76,77,78,79].
Compared to Linear Discriminant Analysis, which relies on interval-scaled predictors and linear combinations of variables, CTs can accommodate both continuous and ordinal data and are unaffected by monotonic transformations of predictor variables [67]. This flexibility makes them particularly suitable for heterogeneous geological datasets. In this study, CTs provided explicit, rule-based criteria for classifying new samples and offered an interpretable framework that directly links statistical groupings to depositional processes and reservoir quality.
3.3.5. Pearson and Partial Correlation Analysis
Pearson’s correlation coefficient was used to assess the strength and direction of linear associations between petrophysical and granulometric parameters. Partial correlation coefficients were also calculated to evaluate the relationship between two continuous variables while controlling for the effect of one or more other continuous variables (often termed “covariates” or “control variables”). In this study, the clay fraction was treated as a control variable because of its strong influence on porosity–permeability trends. This approach enabled the assessment of isolated associations between other parameters, independent of clay content, a key factor in Upper Pannonian sandstones.
Correlation matrices were examined using the ramifying linkage method [68,80,81,82], which organizes variables into clusters of highly intercorrelated parameters. A cutoff of was applied to retain only robust relationships. The procedure started with the strongest observed correlation, followed by successive branching of variables meeting the threshold. Results were summarized as correlation profiles, highlighting the main textural–petrophysical linkages and their implications for depositional processes, diagenetic overprints, and reservoir quality.
3.3.6. Multiple Linear Regression (MLR)
Multiple Linear Regression (MLR) models the relationship between a dependent variable and two or more independent variables, quantifying how predictors collectively influence the response. This technique is widely used in geological studies, where rock properties are often controlled by multiple interacting factors [81,82,83]. By capturing these multivariate dependencies, MLR provides a robust framework for linking depositional and diagenetic attributes with petrophysical behavior.
In this study, Multiple Linear Regression (MLR) quantified the relationship between textural variables and rock-physical properties. The dependent variables were porosity, permeability, Reservoir Quality Index (RQI), and Flow Zone Indicator (FZI), while the independent variables were grain-size fractions and statistical parameters. To account for stratigraphic and facies heterogeneity, models were developed within subsets defined by Hierarchical Cluster Analysis and CM-diagram interpretation.
This approach allowed predictive relationships to be evaluated in a facies-specific context, strengthening the geological interpretability of the regression models.
4. Results
4.1. Lithological Description
Core observations from boreholes SZT-1 and SZSZT-IX revealed a siliciclastic succession dominated by sandstones and siltstones, with minor mudstone beds (Figure 4). These lithologies reflect distinct depositional environments and were modified by post-depositional processes, which led to notable vertical variability in reservoir quality. Sandstones varied systematically from very fine to coarser grained, reflecting depositional energy, diagenetic pathways, and depth-related patterns. Fine- to coarse-grained sandstones were typically light grey to grey, often silty or massive. They were generally well sorted with rounded grains and exhibited horizontal, trough, and planar cross-laminations, sometimes containing coalified plant fragments. Deeper massive sandstones were consistently structureless with detrital carbonate cement.
Figure 4.
Rock columns of Core 1 and Core 2 from Well SZT-1 (A) and Well SZSZT-IX (B), showing sample locations along depth. Numbers in the legend denote sedimentary structures and lithologies as follows: (1) bioturbation; (2) coalified bands; (3) carbonate concretions; (4) horizontal and cross-lamination; (5) coalified plant fragments; (6) cross-lamination; (7) flaser bedding; (8) gravelly band; (9) horizontal lamination; (10) sandy lenses; (11) slumping; (12) synsedimentary fault; (13) trough cross-lamination; (14) trough cross lamination; (15) argillaceous marl; (16) fine-grained sandstone; (17) fine- to medium-grained sandstone; (18) medium-grained sandstone; (19) siltstone; (20) siltstone–argillaceous marl; (21) very fine-grained sandstone; (22) very fine sandstone–siltstone; (23) very fine- to fine-grained sandstone–argillaceous marl; (24) very fine- to fine-grained sandstone; (25) medium- to coarse-grained sandstone.
Fine-grained sandstones were predominantly light grey, well to excellently sorted, with subangular to subrounded grains. Their grain-supported, nearly matrix-free fabric indicated efficient winnowing in moderate-energy settings. Diagenetic overprint was minimal, with patchy fine-grained calcite cement; however, detrital carbonate often showed dissolution features, suggesting secondary porosity. Feldspars were variably altered to clay minerals or sericite, and micas could be bent. Common sedimentary structures included horizontal, cross-, and trough cross-lamination, coalified plant fragments, and synsedimentary faults, indicating active, moderate-energy environments (e.g., distal channel fills, mouth-bar fringes, and upper delta plain).
Very fine- to fine-grained sandstones were typically grey to light grey, well to excellently sorted, but with weakly to poorly worn grains, suggesting short transport distances or rapid deposition. The fabric was primarily grain-supported with low matrix content, which was favorable for primary intergranular porosity. Some deeper intervals showed increased calcite cementation and coal-aleuritic mudstone bands, indicating greater diagenetic alteration.
Siltstones and aleurites were interbedded with other lithologies, including coarse siltstone, very fine sandy siltstone, carbonatic siltstone, and clayey calcareous very fine sandy aleurite. They exhibited alternating light grey and grey layers, were generally well sorted, and commonly showed lamination ranging from tenths of a millimeter to several millimeters thick. Sedimentary structures range from parallel and flaser bedding to convolute lamination and slumping, often characterized by the presence of sandy lenses, coalified bands, and carbonate concretions.
4.2. Microtextural Description
Thin section petrography and SEM imaging showed that quartz was the dominant detrital mineral in sandstones, followed by carbonate occurring both as detrital and minor cement. Feldspar (potassium feldspar and plagioclase) was common and was often altered to clay minerals or sericite. Micas, mainly muscovite and subordinate biotite, were present as detrital flakes, while heavy and opaque minerals occurred in minor amounts.
Thin section observations further indicated that these sandstones typically exhibited grain-supported frameworks with low matrix content, where framework grains commonly contacted along edges or corners (Figure 5). Detrital carbonate fragments occurred among the framework grains and were present in several textural forms, including micritic and fibrous calcite.
Figure 5.
Thin-section photomicrographs of representative fine-grained sandstone samples from the SZSZT-IX borehole. (A) Sample SZSZT-IX-04 (B) Sample SZSZT-IX-16.
SEM observations revealed additional microtextural features of the pore system (Figure 6). The overview image shows moderately packed fine grains with intergranular pore spaces partly occupied by matrix material. Grain surfaces locally display coatings of fine particles and clay minerals within the pore network. In some areas, authigenic clay minerals form fibrous aggregates, while well-developed platy kaolinite crystals occur as booklets precipitated within pore spaces.
Figure 6.
SEM images of Sample SZSZT-IX-28. (A) Overview of the sandstone framework with intergranular pore spaces. (B) Grain surfaces with fine particle coatings. (C) Fibrous aggregates of authigenic clay minerals within the pore network. (D) Platy kaolinite crystals occurring as booklets within pore spaces.
Siltstones and aleurites exhibited mineral compositions similar to those of sandstones but contained higher proportions of fine-grained components and increased clay mineral abundance. Their microtexture was characterized by higher matrix content and more pervasive cementation, particularly in clayey carbonatic aleurites where fine-grained carbonate and clay uniformly impregnated the rock.
4.3. Rock Physical Properties
Grain size analysis indicated that most samples were poorly sorted, asymmetrically distributed, and frequently displayed secondary modes. Despite this variability, siltstone, sandy siltstone, and silty sand/sandstone exhibited clearly distinguishable granulometric curves. A systematic relationship was evident between grain size and petrophysical properties. Very fine sandstones generally exhibited porosities between 27.95% and 30.65%, with one outlier at 12.67%. Permeability was highly variable, ranging from 0.66 mD in the low-porosity sample to 100–500 mD in others. Fine sandstones had porosities between 29.99% and 35.73%, while their permeability spanned 60–1600 mD, reflecting significant heterogeneity. Medium sandstones showed the highest porosities (32.18–36.31%) and consistently high permeability, typically exceeding 1 Darcy (330–2350 mD).
Acoustic velocity measurements revealed marked lithological contrasts. The greatest variability occurred in coarse siltstones, where P-wave (Vp) values ranged from 2527 to 4987 m/s and S-wave (Vs) values from 1625 to 3207 m/s. In sandstones, less consolidated lithotypes generally displayed lower velocities: very fine sandstones showed Vp of 3058–3776 m/s and Vs of 1879–2676 m/s, fine sandstones Vp of 2459–3045 m/s and Vs of 1516–1990 m/s, and medium sandstones Vp of 2539–2929 m/s and Vs of 1560–1905 m/s.
4.4. Well-Log Characteristics (Gamma-Ray)
Gamma-ray (GR) logs from wells SZT-1 and SZSZT-IX provided a continuous framework for comparison with core intervals and for documenting vertical heterogeneity. Both wells showed clear motif variations—funnel-, bell-, and blocky-shaped log responses—that marked shifts in sediment input and lithological composition (Figure 7). These stacking patterns established the broader stratigraphic context in which petrophysical variability was expressed.
Figure 7.
Rock columns and geophysical logs of Core #1 and #2 from Well SZT-1 (A) and Well SZSZT-IX (B), showing sample locations along depth. The displayed logs include gamma-ray (GR), INPEFA, and mirrored INPEFA (MIR) curves derived using CycloLog and interpreted.
In SZT-1, several discrete motifs could be recognized throughout the logged interval. The upper part showed a thick blocky to slightly fining-upward interval, while deeper sections displayed bell-shaped motifs, including a pronounced one between 1964 and 1967 m. Shorter funnel-shaped motifs were also present, alongside irregular, serrated responses that reflected alternation between finer- and coarser-grained material. Together, these trends highlighted a complex stacking pattern of sandy and finer-grained intervals, consistent with a variable fluvio-deltaic setting.
In SZSZT-IX, the GR curve was similarly variable but with more frequent alternations between blocky and serrated motifs. Low GR values in the upper interval (1745–1743 m) may have indicated relatively cleaner, sand-dominated material, while deeper blocky motifs suggested repeated stacking of sandy packages. Higher, more irregular responses corresponded to interbedded finer-grained units, emphasizing vertical heterogeneity.
The use of INPEFA® (calculated with a window size of 4) highlighted subtle cyclicity within these successions and provided tie points that improved recognition of repeated depositional patterns.
4.5. Hierarchical Cluster Analysis (HCA)
To refine rock type classification and directly link multivariate textural and petrophysical properties to depositional environments within the Szentes upper delta system, Hierarchical Cluster Analysis (HCA) was employed. The analysis delineated two primary clusters (Cluster 1 and Cluster 2). Each of them was further subdivided into two distinct subclusters (CLST11, CLST12, CLST21, CLST22), representing specific ranges of depositional energy and transport conditions (Figure 8).
Figure 8.
CM (C vs. M) diagram illustrating the relationship between HCA clusters and depositional modes.
After plotting the four end-level clusters in a CM diagram, it became clear that Cluster 1 represented a high-energy depositional regime. This transport condition resulted in two subpopulations: one transported by rolling (CLST11) and one deposited from graded suspension (CLST12). In contrast, Cluster 2 defined a lower-energy depositional regime, marked by uniform suspension (CLST21) and graded suspension (CLST22).
4.6. Discriminant Analysis and Classification Tree
To quantitatively assess the separability and internal heterogeneity of two primary depositional clusters, CLST1 (Rolling) and CLST2 (Graded and Uniform Suspension), Linear Discriminant Analysis (LDA) was performed. The derived classification functions, which incorporated both grain size and petrophysical parameters, demonstrated high discriminatory power.
CLST1 and CLST2 were effectively distinguished using the percentages of very fine sand, coarse sand, and medium sand. Medium sand content strongly characterized CLST1, which was indicative of high-energy tractional transport. In contrast, very fine sand was more influential for the finer-grained, suspension-dominated CLST2.
All 72 samples were accurately classified, achieving 100% accuracy. Granulometric variables—specifically medium sand, coarse sand, and coarse silt—emerged as the most significant predictors, with petrophysical parameters (porosity, k) playing secondary roles. A classification tree further supported these findings, identifying coarse silt (at a 23.92% threshold) as the primary splitting variable (Figure 9).
Figure 9.
The two macro-level clusters of the studied samples, including the dendrogram, classification functions, classification table, and decision (classification) tree.
Within the CLST1 (Rolling) group, LDA successfully differentiated CLST11 (Rolling) and CLST12 (Graded Suspension with Rolling). Grain size, particularly the very fine sand percentage, was a key discriminator, reflecting the increasing suspension component in CLST12. The influence of permeability (k) was also observed, suggesting variations in compaction or pore structure.
All 25 samples were classified with 100% accuracy. The classification tree identified coarse sand (%) (with a 1.05% threshold) as the primary splitting variable (Figure 10). Within the CLST2 (Suspension) group, LDA classified CLST21 (Uniform Suspension) and CLST22 (Graded Suspension). Given the textural similarities between these subfacies, permeability (k) served as the primary discriminator.
Figure 10.
The two subgroups of the macro-level clusters. (The left panel) shows the CLST1 macro-level cluster, including dendrogram, classification functions, classification table, and decision (classification) tree. (The right panel) shows the CLST2 macro-level cluster, including dendrogram, classification functions, classification table, and decision (classification) tree.
CLST21 (Uniform Suspension) samples exhibited lower permeability due to more compact deposition, whereas CLST22 (Graded Suspension) samples showed slightly higher k, which was attributed to subtle textural variations.
Again, all samples were correctly classified with 100% accuracy, and k (at a 1.14 mD threshold) was the sole variable in the decision tree (Figure 10).
4.7. Pearson and Partial Correlation
To evaluate the linear relationships between textural and petrophysical parameters, Pearson and partial correlation coefficients were calculated for samples below 1932 m depth. This restriction ensured that the dataset reflected a comparable diagenetic regime and addressed the insufficient sample density in the upper intervals. Only strong correlations with an absolute value of 0.70 or greater were considered. Partial correlation profiles were generated by controlling for the clay fraction, thereby allowing identification of associations independent of diagenetically influenced clay content. The Pearson correlation analysis for CLST11 (Rolling) revealed a consistent, tightly linked internal structure among the petrophysical variables.
Permeability, FZI, and RQI were highly correlated with each other, while Vp and Vs showed strong negative correlations with porosity. A positive correlation was observed between the C parameter and porosity, whereas the clay fraction showed negative correlations with FZI and RQI. The partial correlation profiles reaffirmed these relationships, demonstrating that the influence of clay did not fundamentally alter the structure of these main associations (Figure 11, Panel 1).
Figure 11.
Correlation profiles for the four facies clusters. Panel 1: CLST11 (Rolling); Panel 2: CLST12 (Graded Suspension with Rolling); Panel 3: CLST21 (Graded Suspension); Panel 4: CLST22 (Uniform Suspension). Each panel presents Pearson correlations (upper row) and Partial Correlations controlling for clay fraction (lower row), showing relationships between rock physical variables and combined rock physical–textural variables.
In CLST12 (Graded Suspension with Rolling) (Figure 11, Panel 2), the correlations between petrophysical and textural variables were more diffuse. Permeability, FZI, and RQI again formed a coherent group, but their correlation with textural attributes was weaker than in CLST11. The most notable textural correlation was a positive relationship between fine sand content and both FZI and RQI, while Vp showed a negative correlation with these variables. Partial correlation results indicated a further weakening of most relationships after controlling for clay.
The correlation patterns for the finer-grained clusters highlighted a consistent relationship between silt fractions and petrophysical properties. In CLST21 (Graded Suspension) (Figure 11, Panel 3), permeability, FZI, and RQI formed a tightly correlated group but were negatively correlated with coarse silt. These trends remained significant in the partial profiles. In the very fine-grained CLST22 (Uniform Suspension) (Figure 11, Panel 4), the dominant trend was a clear contrast between sand and silt fractions. Coarse and fine silt contents were negatively correlated with permeability, RQI, and FZI, whereas fine sand showed positive correlations with these indicators. These relationships persisted in the partial correlation profiles.
4.8. Multiple Linear Regression (MLR)
Regression models for RQI and FZI were successfully developed for three of the four clusters (CLST11, CLST12, and CLST22), providing a quantitative link between textural parameters and reservoir quality. The model for the Rolling facies (CLST11) achieved high predictive power (), indicating a strong, predictable relationship between its textural composition and reservoir quality. The models identified clay fraction and fine sand as significant negative predictors. This result provided strong statistical support for the microtextural and petrophysical observations: an increase in pore-filling clay and finer grains directly and negatively impacted the overall flow capacity in this facies.
The models for the Graded Suspension with Rolling facies (CLST12) showed moderate predictive power (Table 1). This suggested that while the selected predictor was important, other unmeasured factors also contributed to reservoir quality. In this facies, fine sand was identified as a positive predictor, which indicated that a well-developed framework of fine sand grains was the primary driver of its high flow capacity.
Table 1.
Facies-specific Multiple Linear Regression (MLR) models for Reservoir Quality Index (RQI) and Flow Zone Indicator (FZI).
The strongest model performance was observed in the Graded Suspension facies (CLST22), where values were very high for both RQI and FZI. This high predictability suggested a direct, consistent relationship between rock composition and reservoir quality. In this fine-grained facies, coarse silt was a consistent negative predictor, which confirmed that textural immaturity was the main factor limiting fluid flow. The C parameter, which measured the coarsest grain size, also contributed negatively to FZI, further supporting the interpretation that a heterogeneous mix of grain sizes compromised pore connectivity.
5. Discussion
5.1. Influence of Depositional Environment on Reservoir Quality
The variations in reservoir quality observed throughout the studied interval are a direct reflection of the depositional processes governing sediment transport and accumulation within the Upper Miocene deltaic system. Hydrodynamic energy levels exerted a primary control on the degree of hydraulic sorting and the preservation of fine-grained matrix, which sequentially dictated the geometry and connectivity of the pore network. Such intrinsic relationships between depositional texture and reservoir properties are well-established in siliciclastic successions, where initial grain-size distribution and sorting remain fundamental to the evolution of permeability and porosity during subsequent burial and diagenesis [4,5,22].
The petrophysical signatures derived from the studied cores align seamlessly with these sedimentological frameworks (Figure 12). Sandstone intervals deposited under high-energy flow regimes—interpreted primarily as channel or crevasse-splay deposits—display markedly elevated permeability and higher reservoir quality indices than the finer-grained, siltstone-dominated overbank and floodplain deposits.
Figure 12.
Integrated core-log panel of Well SZT-1 (A) and SZSZT-IX (B), and sample transportation modes.
These disparities highlight the critical role of hydraulic sorting in traction-dominated settings, where the efficient removal of fine matrix material yields grain-supported frameworks capable of preserving interconnected pore networks.
This dependency of reservoir quality on transport mechanics is further validated by hierarchical cluster analysis. Statistical clusters corresponding to tractional transport—specifically Rolling (CLST11) and Graded Suspension with Rolling (CLST12)—are characterized by sand-rich lithologies and superior permeability. In stark contrast, suspension-dominated clusters—Graded Suspension (CLST21) and Uniform Suspension (CLST22)—are heavily skewed toward finer-grained sediments where elevated matrix volumes degrade pore-throat connectivity. Consequently, these statistical aggregations correspond tightly to the classical sediment transport regimes delineated in CM diagrams, affirming the distinct textural segregation of tractional and suspension processes [40,41].
Furthermore, the internal variability recorded within the very fine to fine sandstone intervals captures the highly transitional nature of distributary channel margins and crevasse-splay settings. In these environments, localized fluctuations in flow velocity induce rapid spatio-temporal variations in grain size and matrix retention, engendering significant permeability heterogeneity even across broadly similar lithofacies. Such architectures are highly analogous to other Upper Miocene deltaic successions across the Lake Pannon basin, where distributary channels and mouth bars act as the dominant sand conduits within an otherwise heterolithic, fine-grained delta plain [8,18].
Synthesizing these observations, it is evident that the hydraulic architecture of the Szentes geothermal reservoir is a direct artifact of its original depositional facies distribution. The sandstone bodies of distributary channels and crevasse splays constitute the principal flow units, whereas the finer-grained overbank facies act as internal baffles or barriers, effectively compartmentalizing fluid migration. These stratigraphically controlled permeability contrasts are consistent with broader regional trends in Upper Pannonian reservoirs near Szentes, where the architecture and interconnectivity of channel-derived sands ultimately govern reservoir performance and injectivity [12,16].
5.2. Robust Facies Classification
The integration of Hierarchical Cluster Analysis (HCA) alongside CM-diagram validation provides a more rigorous classification of reservoir facies than conventional bivariate porosity–permeability relationships. Although simple petrophysical correlations can delineate general trends, they frequently obscure the profound textural heterogeneity that characterizes deltaic depositional environments. The four-fold classification derived herein via HCA—CLST11, CLST12, CLST21, and CLST22—successfully isolates the reservoir into discrete hydraulic units that are intrinsically linked to sediment transport processes and prevailing energy levels [43,63].
The significance of these distinct clusters lies in the direct relationship between transport dynamics and the resulting grain-framework architecture:
CLST11 (Rolling): Represents traction-dominated transport typical of elevated-energy distributary channels. Active bedload transport facilitates rigorous hydraulic sorting, yielding peak Reservoir Quality Index (RQI) and Flow Zone Indicator (FZI) values indicative of excellent pore-network interconnectivity.
CLST12 (Graded Suspension with Rolling): Signifies a progressive increase in suspended sediment fallout. Although these deposits retain favorable reservoir properties, the incorporation of finer material causes a measurable reduction in overall pore-throat continuity.
CLST21 (Graded Suspension) & CLST22 (Uniform Suspension): Encompasses suspension-dominated depositional settings where reduced hydrodynamic energy permitted the widespread retention of fine particulates. This yielded matrix-supported fabrics that inherently obstruct pore connectivity, defining the lowest reservoir quality threshold of the dataset (Figure 13).
Figure 13.
Average rock physical properties by depositional process.
The statistical validity of these macro-clusters is further substantiated by Classification Tree (CT) analysis, which empirically identifies a permeability threshold of approximately 1.14 mD. This critical value marks the division between matrix-poor, traction-dominated facies and fluid-restricting, suspension-dominated facies. Decision-tree methodologies like CART provide clear, algorithmic rules for parsing lithofacies based on critical predictive variables, making them highly suitable for robust reservoir characterization [77,79]. Furthermore, the tight correspondence between the defined HCA clusters and the classical sediment transport fields of CM diagrams [40,41] reinforces that these groupings represent physically meaningful depositional regimes, rather than mere statistical coincidence.
By deliberately bridging statistical clustering with sedimentological theory, this workflow serves as a powerful predictive framework capable of being extrapolated to uncored intervals through the careful integration of well-log signatures and established depositional models.
5.3. Effect of Cyclic Facies Architecture on Reservoir Performance and Reinjection Efficiency (Zones of High and Low Permeability)
The vertical succession of the identified facies clusters reveals a distinct cyclic pattern that mirrors the progradational nature of the Upper Miocene deltaic system. In the studied wells, these cycles are characteristically defined by funnel-shaped gamma-ray log motifs that delineate upward-coarsening sequences. Internally, these cycles transition from low-energy, matrix-rich overbank or floodplain deposits at the base (CLST21 and CLST22) to higher-energy, sand-dominated distributary channel or crevasse-splay facies at the top (CLST11 and CLST12). Such architectural stacking patterns are quintessential to prograding deltaic environments [8,18,19].
Historical stratigraphic frameworks for the Szentes geothermal field have generally subdivided the reservoir into two principal depth domains: Level A (1500–1800 m) and Level B (>1800 m), with Level A traditionally regarded as the superior aquifer. However, the current study reveals that fluid transmissivity is governed far more by facies-scale depositional cycles than by broad depth classifications. Although the upper successions of Level A contain substantial sandstone accumulations, their overall hydraulic efficiency is often diminished by the repeated vertical stacking of thin, fine-grained layers that act as internal flow baffles [19,27,28].
By contrast, the stratigraphic transition zone between Level A and Level B frequently contains exceptionally well-developed CLST12 sandstone bodies that retain Darcy-scale permeability, irrespective of their greater burial depth. These sand bodies represent high-energy depositional interludes, allowing them to preserve well-sorted grain assemblages with minimal matrix content.
The microstructural basis for these permeability contrasts is clearly illustrated by SEM observations (Figure 6). Within the sand-rich phases, grain-supported fabrics maintain open, well-connected intergranular pore networks ideal for fluid flow. Conversely, the finer-grained overbank intervals feature pore spaces extensively occluded by detrital matrix and fine mineral aggregates.
The spatial distribution of these high- and low-permeability cycles carries profound implications for geothermal reinjection strategies. Because reinjection protocols necessitate sustained, high-capacity flow rates, targeting well placements based exclusively on the traditional “Level A” depth boundary is likely to yield suboptimal performance. Instead, successful reinjection is critically dependent on accessing the permeable CLST11 and CLST12 sand bodies. Injecting fluids into the matrix-choked CLST21 and CLST22 facies severely restricts fluid intake and actively promotes localized pressure buildup and fines migration—factors that drive rapid injectivity decline [10,11,12,16]. Ultimately, the optimization of geothermal doublets requires a targeted, facies-based approach to dramatically improve connectivity with the most transmissive architectural elements of the delta.
5.4. Effect of Diagenesis
Although the initial architectural framework of the reservoir was dictated by its depositional environment, subsequent diagenetic processes have significantly altered the pore networks. The present-day pore structure of the Szentes reservoir represents the combined legacy of mechanical compaction and authigenic mineral precipitation. Crucially, the intensity of these processes was heavily predetermined by the primary detrital composition and textural fabric of the individual facies [4,5,22].
The retention of highly favorable porosity in the CLST11 and CLST12 facies is largely attributable to the mechanical resilience of their constituent grains. Predominantly composed of rigid detrital quartz and feldspar, their grain frameworks strongly resisted mechanical deformation during burial, preserving a significant fraction of primary intergranular pore space even at depths surpassing 1700 m. In stark contrast, the subordinate reservoir quality of the CLST21 and CLST22 facies is intimately tied to their elevated proportions of ductile materials, including detrital matrix and micaceous flakes. During progressive burial, these weaker components proved highly susceptible to compaction and ductile deformation, resulting in a premature collapse of pore volume and a loss of pore-throat connectivity.
The permeability structure of the reservoir is further complicated by the precipitation of authigenic minerals. High-resolution SEM imaging (Figure 6) reveals the pervasive presence of pore-lining clay minerals alongside well-crystallized kaolinite booklets. Such authigenic clay habits are well-documented suppressors of permeability, acting to bridge crucial pore throats and drastically increase the tortuosity of interconnecting fluid pathways [22,30]. In the analyzed samples, the genesis of this kaolinite is closely linked to the diagenetic alteration of detrital feldspar grains.
Reservoir heterogeneity is additionally compounded by localized phases of carbonate cementation. The scattered presence of calcite and Fe-dolomite cements reflects early-stage diagenetic events that partially occlude the available pore space, further disrupting the continuity of the pore network and weakening the predictive correlation between porosity and permeability.
From an applied perspective, this diagenetic state carries substantial implications for the design of geothermal reinjection protocols. The proliferation of authigenic clays and the presence of structurally weakened, altered feldspars generate a ready supply of mobilizable fine particulates. During high-pressure fluid injection, these fines are highly susceptible to dislodgement and migration, actively choking pore throats and driving progressive injectivity decline [10,11,12,16]. Therefore, the explicit identification and targeting of matrix-poor, mechanically stable facies (CLST11 and CLST12) remains a prerequisite for ensuring the longevity and sustainability of geothermal doublet operations.
5.5. Advantages and Drawbacks of the Integrated Analysis
The integrated analytical workflow applied in this study—combining Hierarchical Cluster Analysis (HCA), CM-diagram validation, and Classification Tree (CT) analysis—provides a highly structured framework for interpreting reservoir heterogeneity within the Szentes geothermal field. By advancing beyond conventional, bivariate porosity–permeability relationships, this methodology successfully bridges grain-size architecture, sediment transport processes, and petrophysical properties within a cohesive sedimentological context. A primary advantage of this approach is its rigorous reproducibility: the CT analysis empirically identified a permeability threshold of approximately 1.14 mD, effectively partitioning high-quality and low-quality reservoir clusters. When integrated with standard well-log signatures and depositional models, these rule-based thresholds offer transparent, actionable criteria for identifying transmissive facies within uncored intervals.
Despite these methodological strengths, several inherent limitations must be acknowledged when extrapolating these results to the reservoir scale. Petrophysical parameters derived from laboratory core analysis represent plug-scale properties; while they accurately capture localized pore architectures, they do not comprehensively reflect field-scale hydraulic dynamics. In complex, fluvio-deltaic environments, overall reservoir performance is fundamentally dictated by the lateral continuity of sand bodies, vertical facies stacking, and broader structural compartmentalization—architectural factors that cannot be directly captured by core plug measurements. Similar scale-dependent discrepancies between laboratory-derived permeability and actual well productivity are widely documented in sandstone reservoirs, confirming that facies connectivity remains the ultimate control on fluid flow [12,16].
Real-world production data from the Szentes geothermal system clearly corroborate this scale dependency. Specific intervals exhibiting highly favorable plug permeabilities (e.g., 300–500 mD) frequently yield limited actual productivity when the permeable sand bodies are laterally pinched out or vertically isolated by low-permeability heterolithic baffles. This behavior perfectly encapsulates the intrinsic heterogeneity of deltaic successions and emphasizes the limitations of relying exclusively on plug-scale datasets for comprehensive reservoir evaluation.
In this context, the integration of petrophysical measurements with HCA facies classification and Reservoir Quality Index (RQI) analysis serves as a vital bridge across the scale gap separating core observations from macro-reservoir behavior. By explicitly linking statistical facies clusters to defined sedimentological transport regimes, this workflow allows localized permeability trends to be interpreted through the lens of large-scale depositional architecture. Comparable relationships between depositional frameworks and reservoir quality are well-documented throughout Upper Pannonian sandstone reservoirs, reflecting the complex facies variability generated during the Late Miocene infill of Lake Pannon [8,18].
A synthesized overview of the methodological strengths, inherent limitations, and broader operational utility of this integrated facies-based workflow is provided in Table 2. This summary highlights how the transition from plug-scale measurements to a geologically contextualized framework helps mitigate the “blind spots” typically associated with isolated petrophysical analyses.
Table 2.
Summary of methodological strengths, limitations, and operational applicability of the integrated facies-based workflow.
The systematic trends recorded across the four distinct facies clusters—representing a progressive hydrodynamic shift from Uniform Suspension to Rolling transport regimes—illustrate exactly how variations in depositional processes translate into predictable, quantifiable differences in pore structure and hydraulic capacity. Consequently, the integrated sedimentological–statistical workflow developed herein is highly transferable to other Upper Pannonian geothermal reservoirs and comparable Neogene deltaic–lacustrine systems, provided appropriate local calibration is applied. In these complex settings, this approach offers a highly practical methodology for reducing geological uncertainty and refining the targeted selection of intervals for geothermal production and reinjection.
6. Conclusions
This study demonstrates that the evolution of reservoir quality within the Szentes geothermal field is governed by a coupled influence: depositional processes establish the initial sedimentological framework, whereas subsequent mechanical compaction and diagenetic alteration dictate the final hydraulic efficiency of the system. By integrating Hierarchical Cluster Analysis (HCA) with CM-diagram validation, this research successfully partitioned the reservoir into four distinct facies clusters. The traction-dominated Rolling (CLST11) facies proved to be the optimal reservoir target, closely followed by the Graded Suspension with Rolling (CLST12) facies. In stark contrast, the suspension-dominated intervals (CLST21 and CLST22) form matrix-rich hydraulic baffles characterized by severely restricted pore connectivity.
A key outcome of this integrated approach is the empirical identification of a 1.14 mD permeability threshold. This critical value acts as a fundamental hydraulic boundary, effectively separating highly transmissive, grain-supported frameworks from flow-impeding, matrix-supported fabrics. Furthermore, petrographic analyses confirm that the diagenetic alteration of detrital feldspar into pore-lining kaolinite drastically increases the tortuosity of the pore network. Operationally, the presence of these authigenic clays represents a primary hazard for geothermal reinjection, as they serve as a readily mobilizable source of fines capable of driving rapid injectivity decline.
Ultimately, these findings dictate that sustainable geothermal management must transition away from generalized, depth-based stratigraphic subdivisions (such as “Level A” versus “Level B”) in favor of a targeted, facies-directed strategy. Focusing well placements on high-energy depositional motifs within the cyclic fluvio-deltaic successions provides the most reliable methodology for optimizing long-term reinjection performance. Subsequent research will leverage 3D micro-CT imaging to quantitatively assess pore-throat connectivity, thereby refining predictive models for permeability evolution and fluid flow across the Pannonian Basin.
Author Contributions
Conceptualization, J.K.; methodology, C.C.C., F.F. and J.G.; software, C.C.C.; validation, C.C.C., F.F. and J.G.; formal analysis, C.C.C., F.F. and J.G.; investigation, C.C.C., F.F. and J.G.; resources, J.K.; data curation, C.C.C., F.F. and J.G.; writing—original draft preparation, C.C.C., F.F. and J.G.; writing—review and editing, C.C.C., F.F., J.G., J.K. and M.H.-V.; visualization, C.C.C., F.F. and J.G.; supervision, J.K.; project administration, J.K.; funding acquisition, J.K. and M.H.-V. All authors have read and agreed to the published version of the manuscript.
Funding
This research was funded by the Interreg project CE0100071 through the University of Pécs. Additional in-kind support was provided by the University Research Scholarship Program EKÖP-24-3-II-PTE-109. The APC was funded by the authors’ institutions. This paper is a deliverable of Project No. K142550, implemented with support by the Ministry of Energy of Hungary from the National Research, Development and Innovation Fund under the K_22 scheme.
Data Availability Statement
The datasets generated and/or analyzed during the current study are not publicly available but are available from the corresponding author on reasonable request.
Acknowledgments
The authors acknowledge the use of ChatGPT (OpenAI, GPT-4/5, 2026) as a supplementary tool to improve the clarity and academic tone of the manuscript. The model was used exclusively for language editing and minor stylistic refinement. All research design, data analysis, interpretations, and conclusions are entirely the authors’ own. The authors also thank the two anonymous reviewers for their constructive feedback, which greatly improved the quality of the article.
Conflicts of Interest
The authors declare no conflicts of interest.
Abbreviations
The following abbreviations are used in this manuscript:
| API | American Petroleum Institute |
| ASTM | American Society for Testing and Materials |
| Bt | Biotite |
| Cal | Calcite |
| CLST | Cluster facies groupings |
| CM | Coarsest percentile vs. median grain-size (Passega diagram) |
| CT | Classification Tree |
| Fm. | Geological Formation |
| FZI | Flow Zone Indicator |
| GR | Gamma-Ray Log |
| HCA | Hierarchical Cluster Analysis |
| INPEFA | Integrated Prediction Error Filter Analysis |
| k | Permeability |
| Kaol | Kaolinite |
| Kfs | Potassium feldspar |
| LD | Laser Diffraction |
| LDA | Linear Discriminant Analysis |
| MLR | Multiple Linear Regression |
| Ms | Muscovite |
| PHI | Porosity |
| Pl | Plagioclase |
| Qz | Quartz |
| RHOG | Skeletal density (matrix density) |
| RQI | Reservoir Quality Index |
| SEM | Scanning Electron Microscopy |
| Vp | P-wave velocity |
| Vs | S-wave velocity |
| XRD | X-ray diffraction |
| m | meter |
| m/s | meters per second |
| mD | millidarcy |
References
- Folk, R.L.; Ward, W.C. Brazos River bar [Texas]: A study in the significance of grain size parameters. J. Sediment. Res. 1957, 27, 3–26. [Google Scholar] [CrossRef] [Scilit]
- Bear, J. Dynamics of Fluids in Porous Media; Dover: New York, NY, USA, 1988. [Google Scholar]
- Bjørlykke, K. Fluid-flow processes and diagenesis in sedimentary basins. Geol. Soc. Lond. Spec. Publ. 1994, 78, 127–140. [Google Scholar] [CrossRef] [Scilit]
- Houseknecht, D.W. Assessing the relative importance of compaction processes and cementation to reduction in porosity in sandstones. AAPG Bull. 1987, 71, 633–642. [Google Scholar] [CrossRef] [Scilit]
- Worden, R.H.; Burley, S.D. Sandstone diagenesis: The evolution of sand to stone. In Sandstone Diagenesis: Recent and Ancient; Burley, S.D., Worden, R.H., Eds.; Blackwell: Oxford, UK, 2003; pp. 1–44. [Google Scholar]
- Horváth, F. Towards a mechanical model for the formation of the Pannonian Basin. Tectonophysics 1993, 226, 333–357. [Google Scholar] [CrossRef] [Scilit]
- Lenkey, L.; Mihályka, J.; Paróczi, P. Review of geothermal conditions of Hungary. Földtani Közlöny 2021, 151, 65–78. [Google Scholar] [CrossRef] [Scilit]
- Sztanó, O.; Szafián, P.; Magyar, I.; Horányi, A.; Bada, G.; Hughes, D.W.; Hoyer, D.L.; Wallis, R.J. Aggradation and progradation controlled clinothems and deep-water sand delivery model in the Neogene Lake Pannon, Makó Trough, Pannonian Basin, SE Hungary. Glob. Planet. Chang. 2013, 103, 149–167. [Google Scholar] [CrossRef] [Scilit]
- Békési, E.; Fokker, P.A.; Candela, T.; Szanyi, J.; van Wees, J.D. Ground motions induced by pore pressure changes at the Szentes geothermal area, SE Hungary. Geotherm. Energy 2022, 10, 3. [Google Scholar] [CrossRef] [Scilit]
- Seibt, P.; Kellner, T. Practical experience in the reinjection of cooled thermal waters back into sandstone reservoirs. Geothermics 2003, 32, 733–741. [Google Scholar] [CrossRef] [Scilit]
- Ungemach, P. Reinjection of cooled geothermal brines into sandstone reservoirs. Geothermics 2003, 32, 743–761. [Google Scholar] [CrossRef] [Scilit]
- Bálint, A.; Szanyi, J. A half century of reservoir property changes in the Szentes geothermal field, Hungary. Cent. Eur. Geol. 2015, 58, 28–49. [Google Scholar] [CrossRef] [Scilit]
- Njeru, R.M.; Sofyan, A.; Halisch, M.; Kóbor, B.; Szanyi, J. Optimizing micro-CT resolution for geothermal reservoir characterization in the Pannonian Basin. Energies 2024, 17, 3081. [Google Scholar] [CrossRef] [Scilit]
- Sendula, E.; Albrecht, R.; Conceição de Castro, C.; Keresztény-Borbás, E.; Szabó-Krausz, Z.; Kovács, J. Characteristics of heat-depleted thermal water re-injection-induced water–rock interactions in a sandstone reservoir. Minerals 2025, 15, 513. [Google Scholar] [CrossRef] [Scilit]
- Farkas, M.P.; Magyar, G.; Hofmann, H.; Zimmermann, G.; Fedor, F. Comparison of stimulation techniques in a geothermal injection well. Geotherm. Energy 2025, 13, 44. [Google Scholar] [CrossRef] [Scilit]
- Koroncz, P.; Vizhányó, Z.; Farkas, M.P.; Kuncz, M.; Ács, P.; Kocsis, G.; Mucsi, P.; Fedorné Szász, A.; Fedor, F.; Kovács, J. Experimental rock characterisation of Upper Pannonian sandstones. Energies 2022, 15, 9136. [Google Scholar] [CrossRef] [Scilit]
- Royden, L.H. Late Cenozoic tectonics of the Pannonian Basin system. In The Pannonian Basin: A Study in Basin Evolution; AAPG Memoir 45; AAPG: Tulsa, OK, USA, 1988; pp. 27–48. [Google Scholar]
- Magyar, I.; Radivojević, D.; Sztanó, O.; Synak, R.; Ujszászi, K.; Pócsik, M. Progradation of the paleo-Danube shelf margin across the Pannonian Basin. Glob. Planet. Chang. 2013, 103, 168–173. [Google Scholar] [CrossRef] [Scilit]
- Miall, A.D. Fluvial Depositional Systems; Springer: Cham, Switzerland, 2014. [Google Scholar] [CrossRef] [Scilit]
- Nádor, A.; Thamó-Bozsó, E.; Magyari, Á.; Babinszki, E. Fluvial responses to tectonics and climate change. Sediment. Geol. 2007, 202, 174–192. [Google Scholar] [CrossRef] [Scilit]
- Kiss, T.; Hernesz, P.; Sümeghy, B.; Györgyövics, K.; Sipos, G. The evolution of the Great Hungarian Plain fluvial system. Quat. Int. 2015, 388, 142–155. [Google Scholar] [CrossRef] [Scilit]
- Morad, S.; Ketzer, J.M.; De Ros, L.F. Spatial and temporal distribution of diagenetic alterations in siliciclastic rocks. Sedimentology 2000, 47, 95–120. [Google Scholar] [CrossRef] [Scilit]
- Milliken, K.L.; Curtis, M.E. Imaging pores in sedimentary rocks: Foundation of porosity prediction. Mar. Pet. Geol. 2016, 73, 590–608. [Google Scholar] [CrossRef] [Scilit]
- Feng, C.; Melnyk, S.; Ross, C.; Shanley, K.; Zonneveld, J.-P.; Gingras, M.K. Lithofacies-dependent pore-throat radii. Mar. Pet. Geol. 2021, 131, 105157. [Google Scholar] [CrossRef] [Scilit]
- Szanyi, J.; Kovács, B. Utilization of geothermal systems in south-east Hungary. Geothermics 2010, 39, 357–364. [Google Scholar] [CrossRef] [Scilit]
- Korim, K. Geological aspects of thermal water occurrences in Hungary. Geothermics 1972, 1, 96–102. [Google Scholar] [CrossRef] [Scilit]
- Stow, D.A.V. Sedimentary Rocks in the Field: A Color Guide; Gulf Professional Publishing: Burlington, MA, USA, 2005. [Google Scholar]
- Tucker, M.E. Sedimentary Rocks in the Field; Wiley: Chichester, UK, 2003. [Google Scholar]
- Tucker, M.E. Sedimentary Rocks in the Field: A Practical Guide; Wiley-Blackwell: Chichester, UK, 2011. [Google Scholar]
- Wilson, M.D.; Pittman, E.D. Authigenic clays in sandstones. J. Sediment. Petrol. 1977, 47, 3–31. [Google Scholar] [CrossRef] [Scilit]
- Anovitz, L.M.; Cole, D.R. Characterization and analysis of porosity and pore structures. Rev. Mineral. Geochem. 2015, 80, 61–164. [Google Scholar] [CrossRef] [Scilit]
- Tiab, D.; Donaldson, E.C. Petrophysics: Theory and Practice; Elsevier: Amsterdam, The Netherlands, 2012. [Google Scholar]
- API. Recommended Practices for Core Analysis; API RP 40; American Petroleum Institute: Washington, DC, USA, 1998. [Google Scholar]
- Konert, M.; Vandenberghe, J. Comparison of laser grain size analysis with pipette and sieve analysis. Sedimentology 1997, 44, 523–535. [Google Scholar] [CrossRef] [Scilit]
- Blott, S.J.; Pye, K. GRADISTAT: A grain size distribution and statistics package for the analysis of unconsolidated sediments. Earth Surf. Process. Landf. 2001, 26, 1237–1248. [Google Scholar] [CrossRef] [Scilit]
- Blott, S.J.; Pye, K. Particle size scales and classification of sediment types based on particle size distributions. Sedimentology 2012, 59, 2071–2096. [Google Scholar] [CrossRef] [Scilit]
- Gale, S.; Hoare, P.G. Quaternary Sediments: Petrographic Methods; Blackburn Press: Caldwell, NJ, USA, 2012. [Google Scholar]
- Udden, J.A. Mechanical composition of clastic sediments. GSA Bull. 1914, 25, 655–744. [Google Scholar] [CrossRef] [Scilit]
- Wentworth, C.K. A scale of grade and class terms for clastic sediments. J. Geol. 1922, 30, 377–392. [Google Scholar] [CrossRef] [Scilit]
- Passega, R. Texture as characteristic of clastic deposition. AAPG Bull. 1957, 41, 1952–1984. [Google Scholar] [CrossRef] [Scilit]
- Passega, R. Significance of CM diagrams of sediments deposited by suspension. Sedimentology 1977, 24, 723–733. [Google Scholar] [CrossRef] [Scilit]
- Friedman, G.M.; Sanders, J.E. Principles of Sedimentology; Wiley: New York, NY, USA, 1978. [Google Scholar]
- Puskarczyk, E. Application of multivariate statistical methods for reservoir characterization. Energies 2020, 13, 1548. [Google Scholar] [CrossRef] [Scilit]
- Zheng, D.Y.; Wu, S.X. Principal component analysis of textural characteristics in sedimentary rocks. Geol. Mag. 2021, 158, 1847–1861. [Google Scholar] [CrossRef] [Scilit]
- Zeng, F.; Tian, S.; Dong, H.; Dong, Z.; Liu, B.; Liu, H. A novel method to determine the grain size distribution of sediments. Fractal Fract. 2025, 9, 642. [Google Scholar] [CrossRef] [Scilit]
- Boggs, S. Petrology of Sedimentary Rocks; Cambridge University Press: Cambridge, UK, 2009. [Google Scholar]
- Gao, Z.; Liang, Z.; Qinhong, H.; Jiang, Z.; Xuan, Q. Contributions of organic matter and inorganic minerals to pore systems. Mar. Pet. Geol. 2021, 127, 104962. [Google Scholar] [CrossRef] [Scilit]
- Mészáros, F.; Zilahi-Sebess, L. Compaction of sediments. Geophys. Trans. 2001, 44, 21–48. [Google Scholar]
- ASTM D2845-08; Standard Test Method for Laboratory Determination of Pulse Velocities and Ultrasonic Elastic Constants of Rock. ASTM International: West Conshohocken, PA, USA, 2005. [CrossRef] [Scilit]
- Birch, F. The velocity of compressional waves in rocks to 10 kilobars. J. Geophys. Res. 1960, 65, 1083–1102. [Google Scholar] [CrossRef] [Scilit]
- Castagna, J.P.; Batzle, M.L.; Eastwood, R.L. Relationships between compressional-wave and shear-wave velocities in clastic silicate rocks. Geophysics 1985, 50, 571–581. [Google Scholar] [CrossRef] [Scilit]
- Koroncz, P.; Fedor, F. Automatic Waveform Processing Software; GEOCHEM Ltd.: Kővágószőlős, Hungary, 2016. [Google Scholar]
- Amaefule, J.O.; Altunbay, M.; Tiab, D.; Kersey, D.G.; Keelan, D.K. Enhanced Reservoir Description: Using Core and Log Data to Identify Hydraulic (Flow) Units and Predict Permeability in Uncored Intervals/Wells. In Proceedings of the SPE Annual Technical Conference and Exhibition; SPE-26436; SPE: London, UK, 1993. [Google Scholar] [CrossRef]
- Bhatti, A.A.; Ismail, A.; Raza, A.; Gholami, R.; Rezaee, R.; Nagarajan, R. Permeability prediction using hydraulic flow units. Energy Geosci. 2020, 1, 81–91. [Google Scholar] [CrossRef] [Scilit]
- Ughulu, E.O. Petrophysical characterization through pressure clustering. In Proceedings of the SPE Nigeria Annual International Conference and Exhibition; SPE-228653-MS; SPE: London, UK, 2025. [Google Scholar] [CrossRef] [Scilit]
- Rider, M. The Geological Interpretation of Well Logs; Rider-French Consulting Ltd.: Sutherland, UK, 1996. [Google Scholar]
- Miskimins, J.; Graves, R.; Hurley, N. Extrapolation of rock mechanical properties from logs. In Proceedings of the SPE/ISRM Rock Mechanics Conference, Irving, TX, USA, 2002; SPE-78250-MS; SPE: London, UK, 2002. [Google Scholar] [CrossRef]
- Asquith, G.; Krygowski, D. Basic Well Log Analysis; AAPG: Tulsa, OK, USA, 2004. [Google Scholar]
- PanTerra Geoconsultants B.V. CycloLog®, version 2024; PanTerra Geoconsultants B.V.: Leiderdorp, The Netherlands, 2024.
- Van Geuns, L.C.; Prins, C. Stratigraphic Methods and Workflow Approaches; ENRES International: Delft, The Netherlands, 2011. [Google Scholar]
- Ward, J.H. Hierarchical grouping to optimize an objective function. J. Am. Stat. Assoc. 1963, 58, 236–244. [Google Scholar] [CrossRef]
- Puskarczyk, E.; Jarzyna, J.A. Improved recognition of rock formation using multivariate statistics. Acta Geophys. 2019, 67, 1809–1822. [Google Scholar] [CrossRef] [Scilit]
- Sneath, P.H.A.; Sokal, R.R. Numerical Taxonomy; W.H. Freeman: San Francisco, CA, USA, 1973. [Google Scholar]
- McLachlan, G.J. Discriminant Analysis and Statistical Pattern Recognition; Wiley: Hoboken, NJ, USA, 2005. [Google Scholar] [CrossRef] [Scilit]
- Mishra, S.; Datta-Gupta, A. Applied Statistical Modeling and Data Analytics; Elsevier: Amsterdam, The Netherlands, 2017. [Google Scholar]
- Gross, D.S.; Atlas, R. Environmental chemistry through intelligent data analysis. Environ. Model. Softw. 2010, 25, 760–769. [Google Scholar] [CrossRef] [Scilit]
- Breiman, L.; Friedman, J.; Olshen, R.A.; Stone, C.J. Classification and Regression Trees; CRC Press: Boca Raton, FL, USA, 2017. [Google Scholar]
- Hastie, T.; Tibshirani, R.; Friedman, J. The Elements of Statistical Learning; Springer: New York, NY, USA, 2009. [Google Scholar]
- Mojena, R. Hierarchical grouping methods and stopping rules: An evaluation. Comput. J. 1977, 20, 359–363. [Google Scholar] [CrossRef] [Scilit]
- Jain, A.K.; Dubes, R.C. Algorithms for Clustering Data; Prentice-Hall: Englewood Cliffs, NJ, USA, 1988. [Google Scholar]
- Lubo-Robles, D.; Bedle, H. Evaluation of principal component analysis in reservoir studies. Mar. Pet. Geol. 2023, 150, 106097. [Google Scholar] [CrossRef] [Scilit]
- Feldman, R.; Sanger, J. The Text Mining Handbook; Cambridge University Press: Cambridge, UK, 2007. [Google Scholar]
- Pfitzner, D.; Leibbrandt, R. Similarity measures for pairs of clusterings. Knowl. Inf. Syst. 2009, 19, 361–394. [Google Scholar] [CrossRef] [Scilit]
- Fisher, R.A. The use of multiple measurements in taxonomic problems. Ann. Eugenics 1936, 7, 179–188. [Google Scholar] [CrossRef] [Scilit]
- Duda, R.O.; Hart, P.E.; Stork, D.G. Pattern Classification; Wiley: New York, NY, USA, 2000. [Google Scholar]
- Quinlan, J.R. Induction of decision trees. Mach. Learn. 1986, 1, 81–106. [Google Scholar] [CrossRef] [Scilit]
- Dubois, M.K.; Bohling, G.C. Rock facies classification problem. Comput. Geosci. 2007, 33, 599–617. [Google Scholar] [CrossRef] [Scilit]
- Hall, B. Facies classification using machine learning. Leading Edge 2016, 35, 906–909. [Google Scholar] [CrossRef] [Scilit]
- Duan, Y.; Xie, J. Decision tree method applied to lithology identification. Sci. Rep. 2020, 10, 19209. [Google Scholar] [CrossRef] [Scilit]
- Davis, J.C.; Sampson, R.J. Statistics and Data Analysis in Geology; Wiley: New York, NY, USA, 1986. [Google Scholar]
- Agterberg, F.P. Geomathematics; Elsevier: Amsterdam, The Netherlands, 1974. [Google Scholar]
- Howarth, R.J. Multivariate analysis. In Handbook of Exploration Geochemistry; Elsevier: Amsterdam, The Netherlands, 1983; pp. 207–289. [Google Scholar]
- Iwamori, H.; Yoshida, K. Geochemical data interpretation based on multivariate statistical analyses. Geochem. Geophys. Geosyst. 2017, 18, 994–1012. [Google Scholar] [CrossRef] [Scilit]
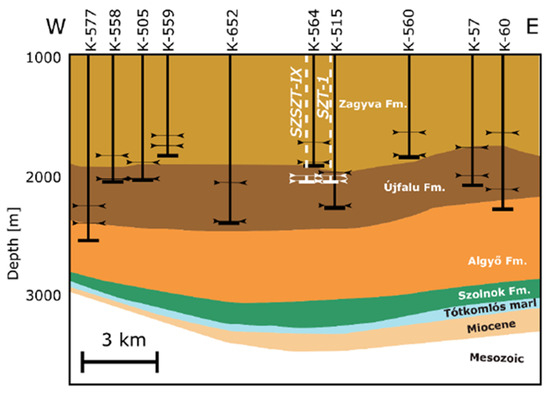
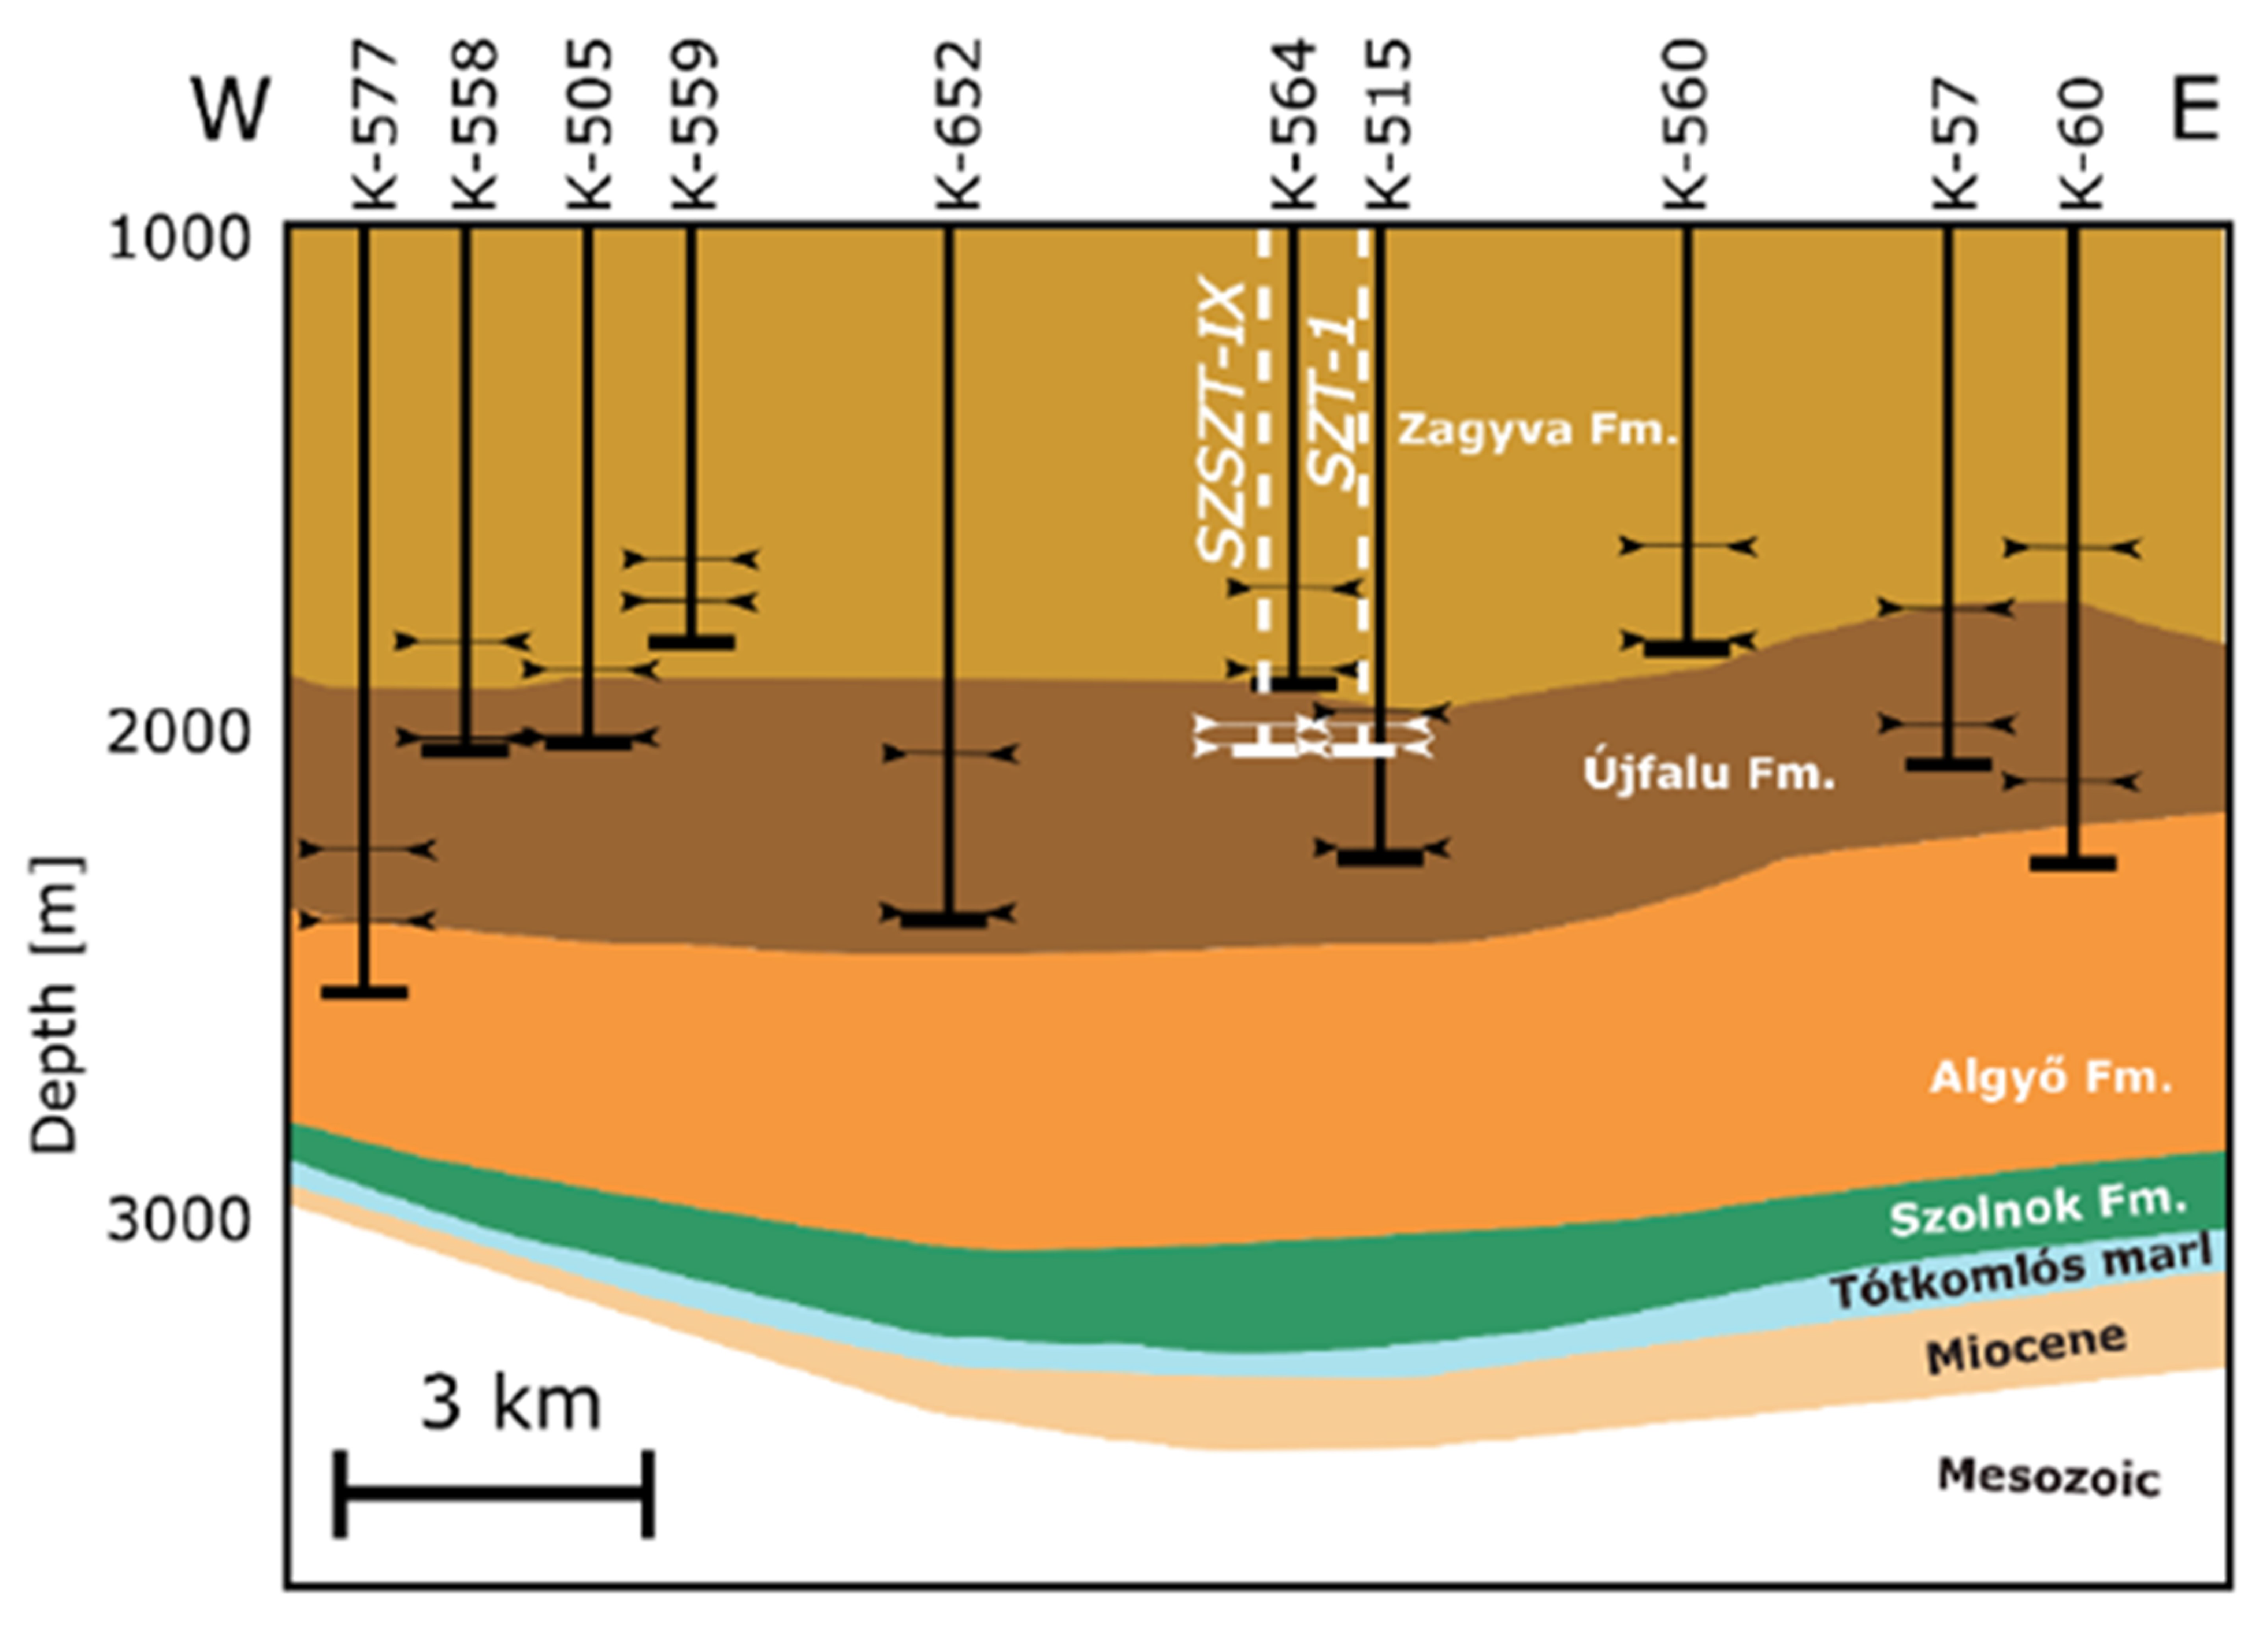
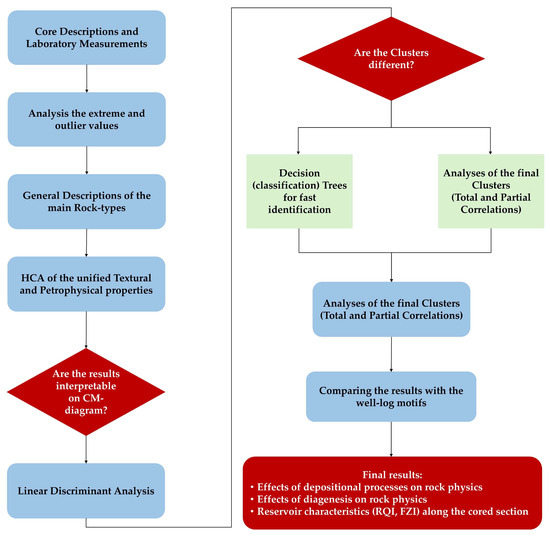
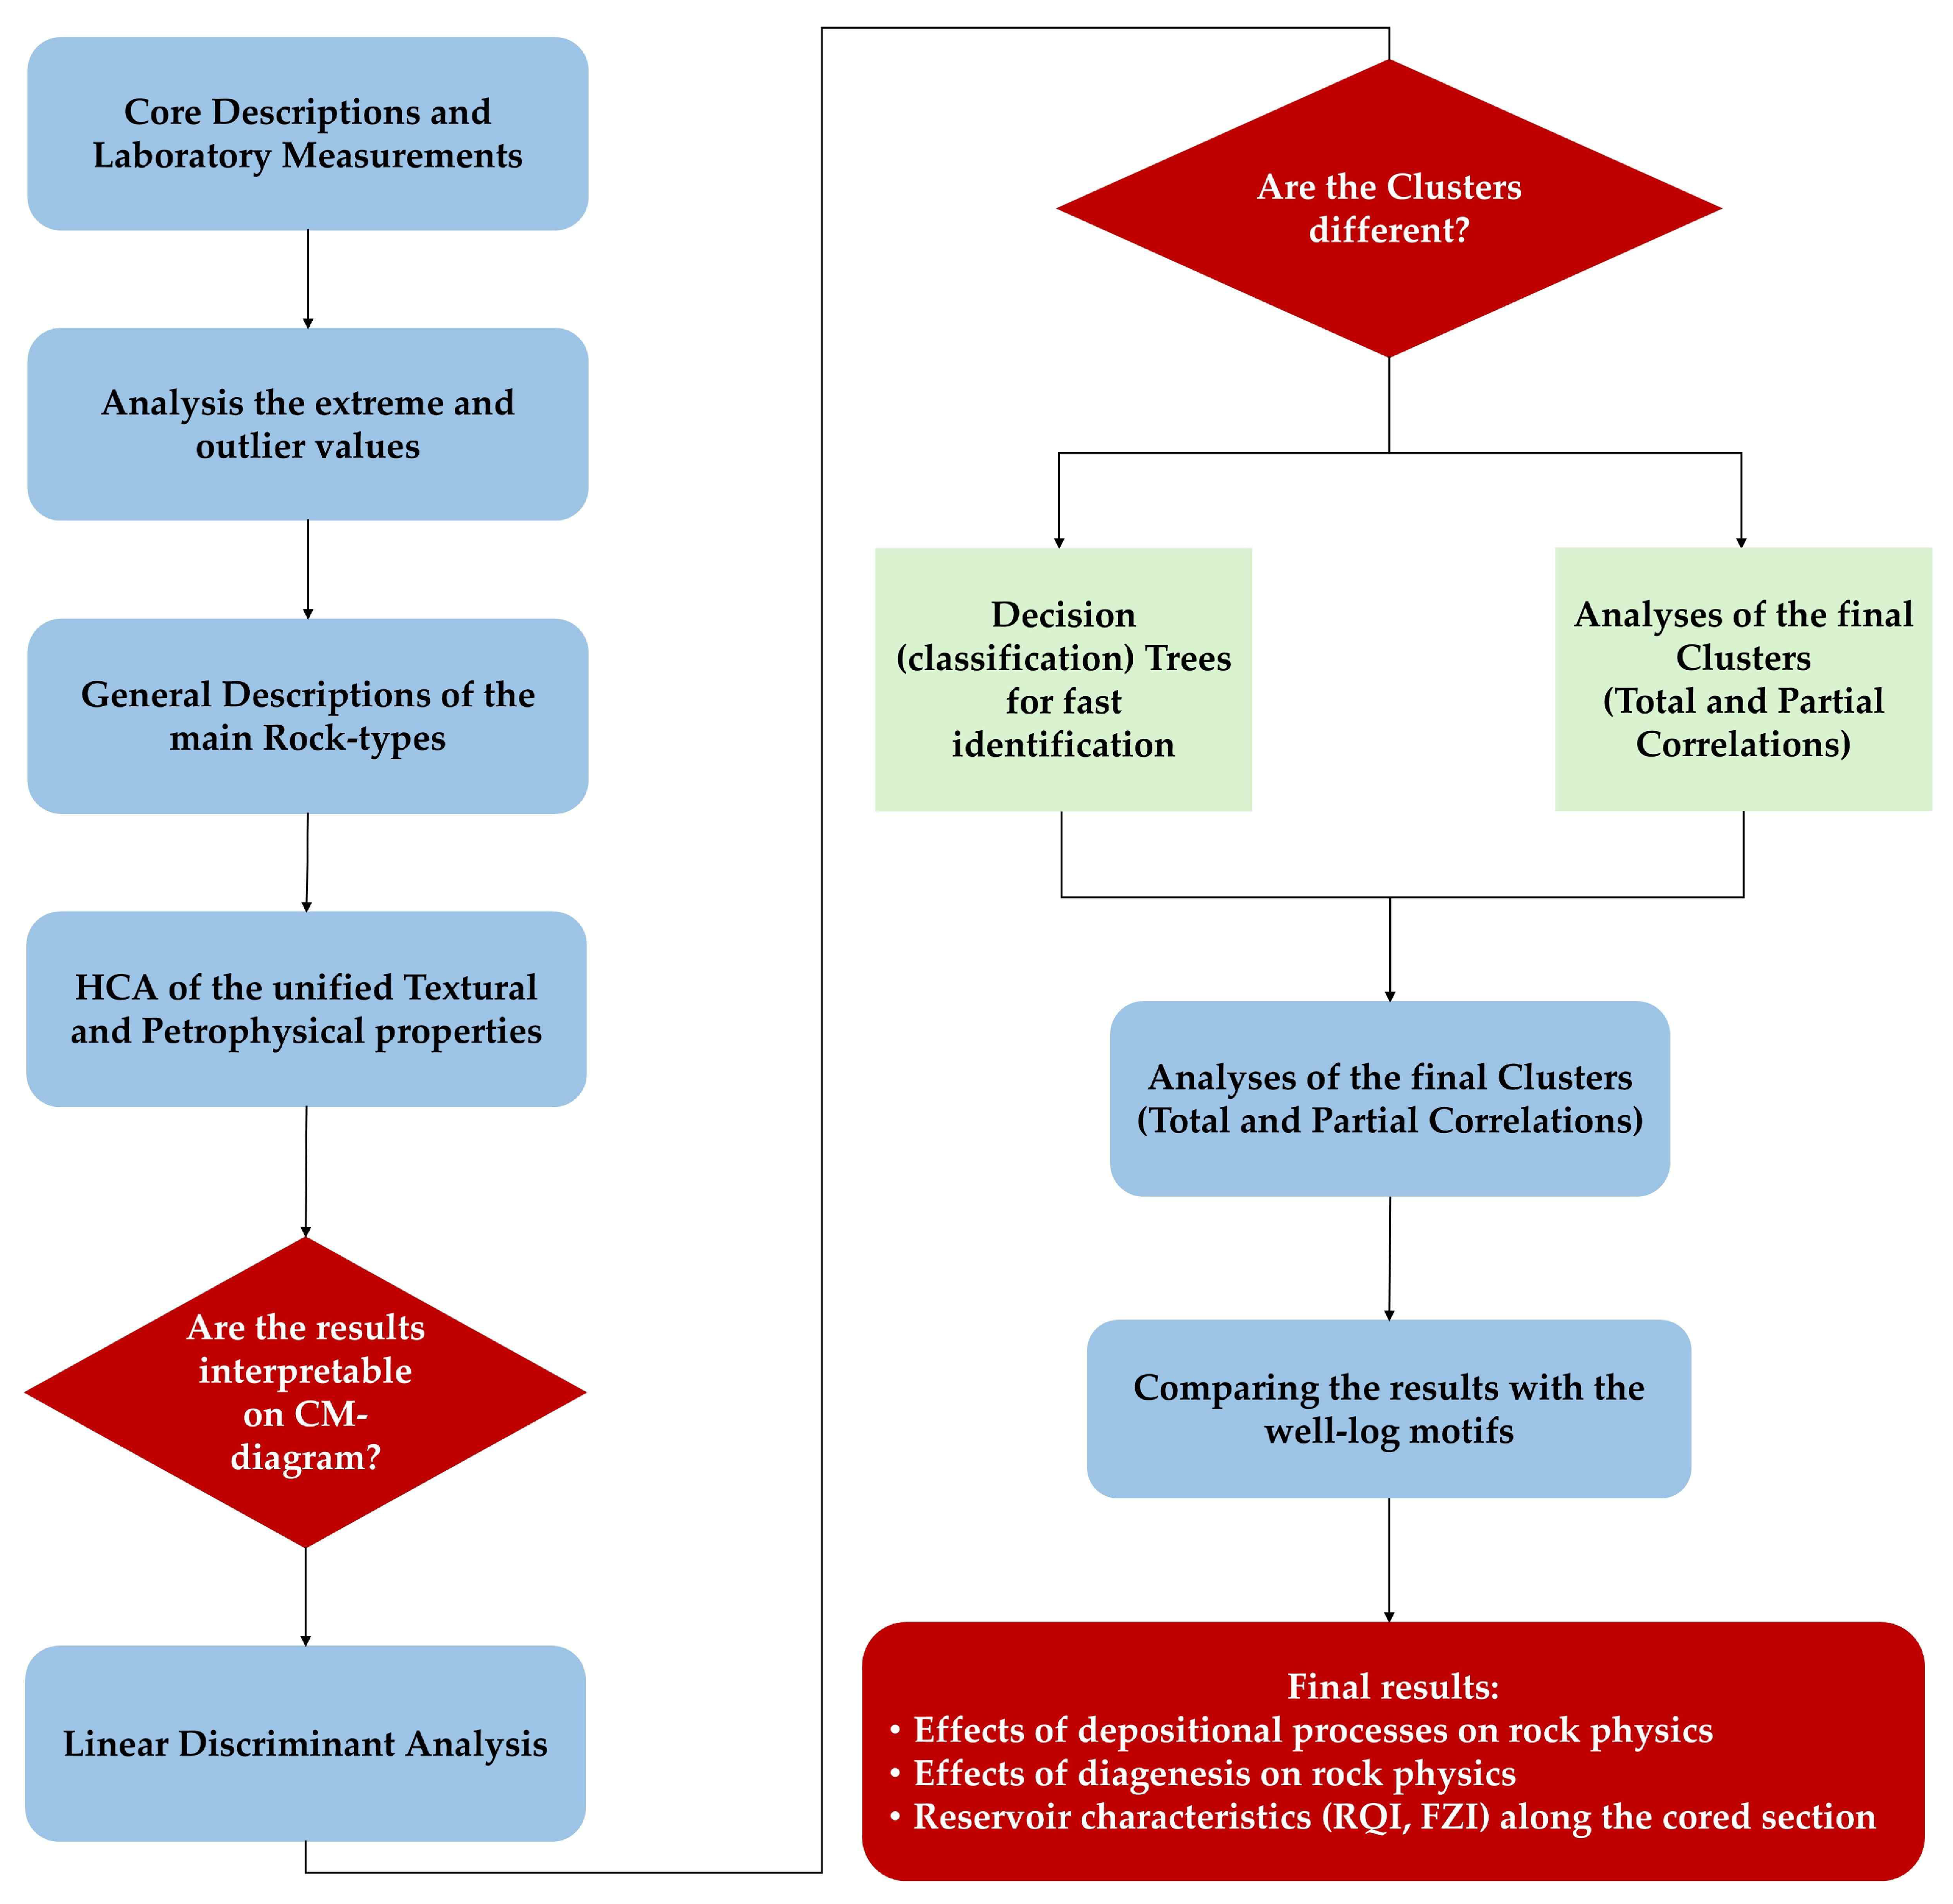
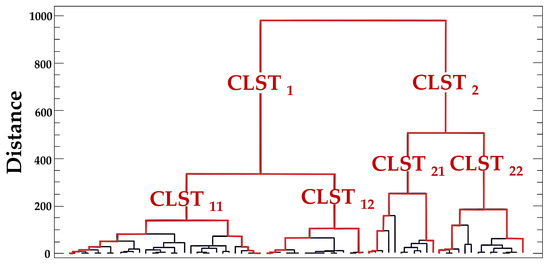
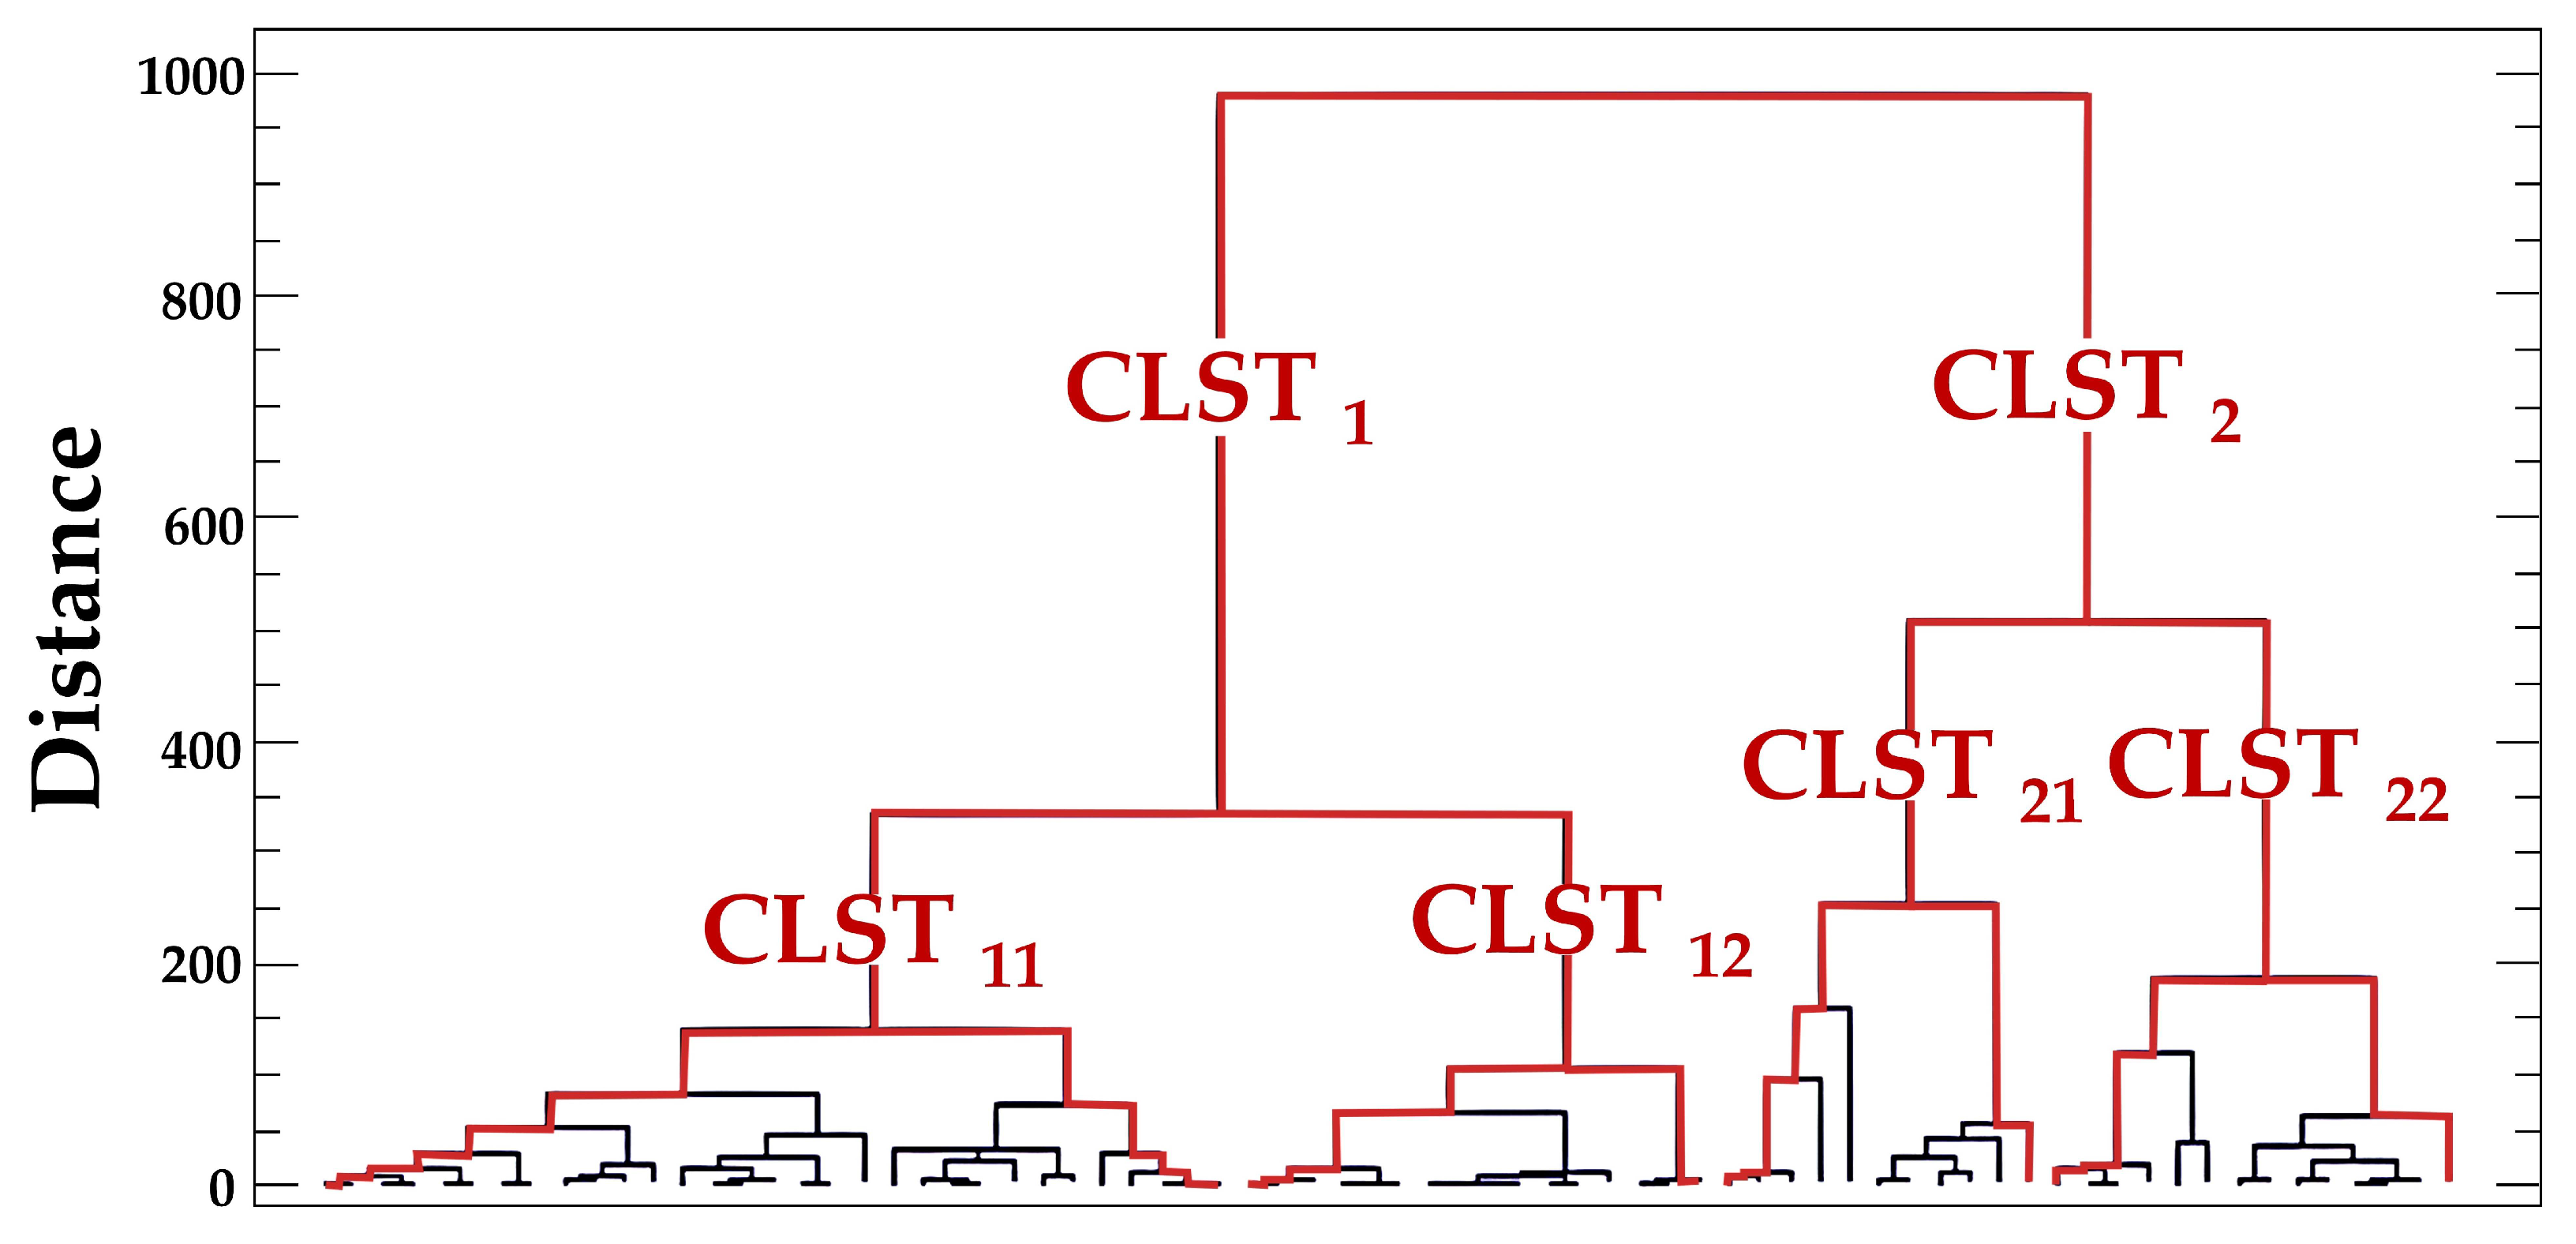
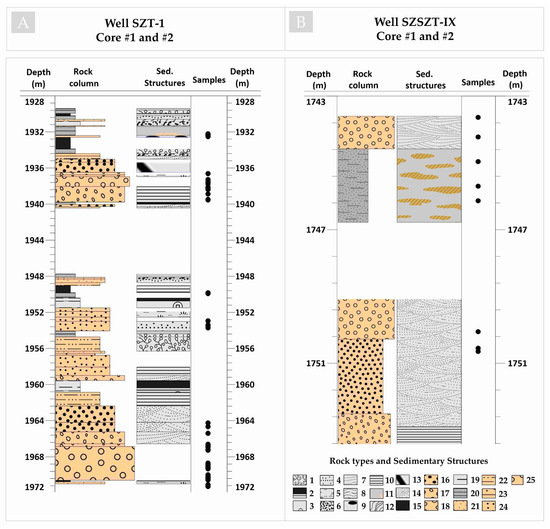
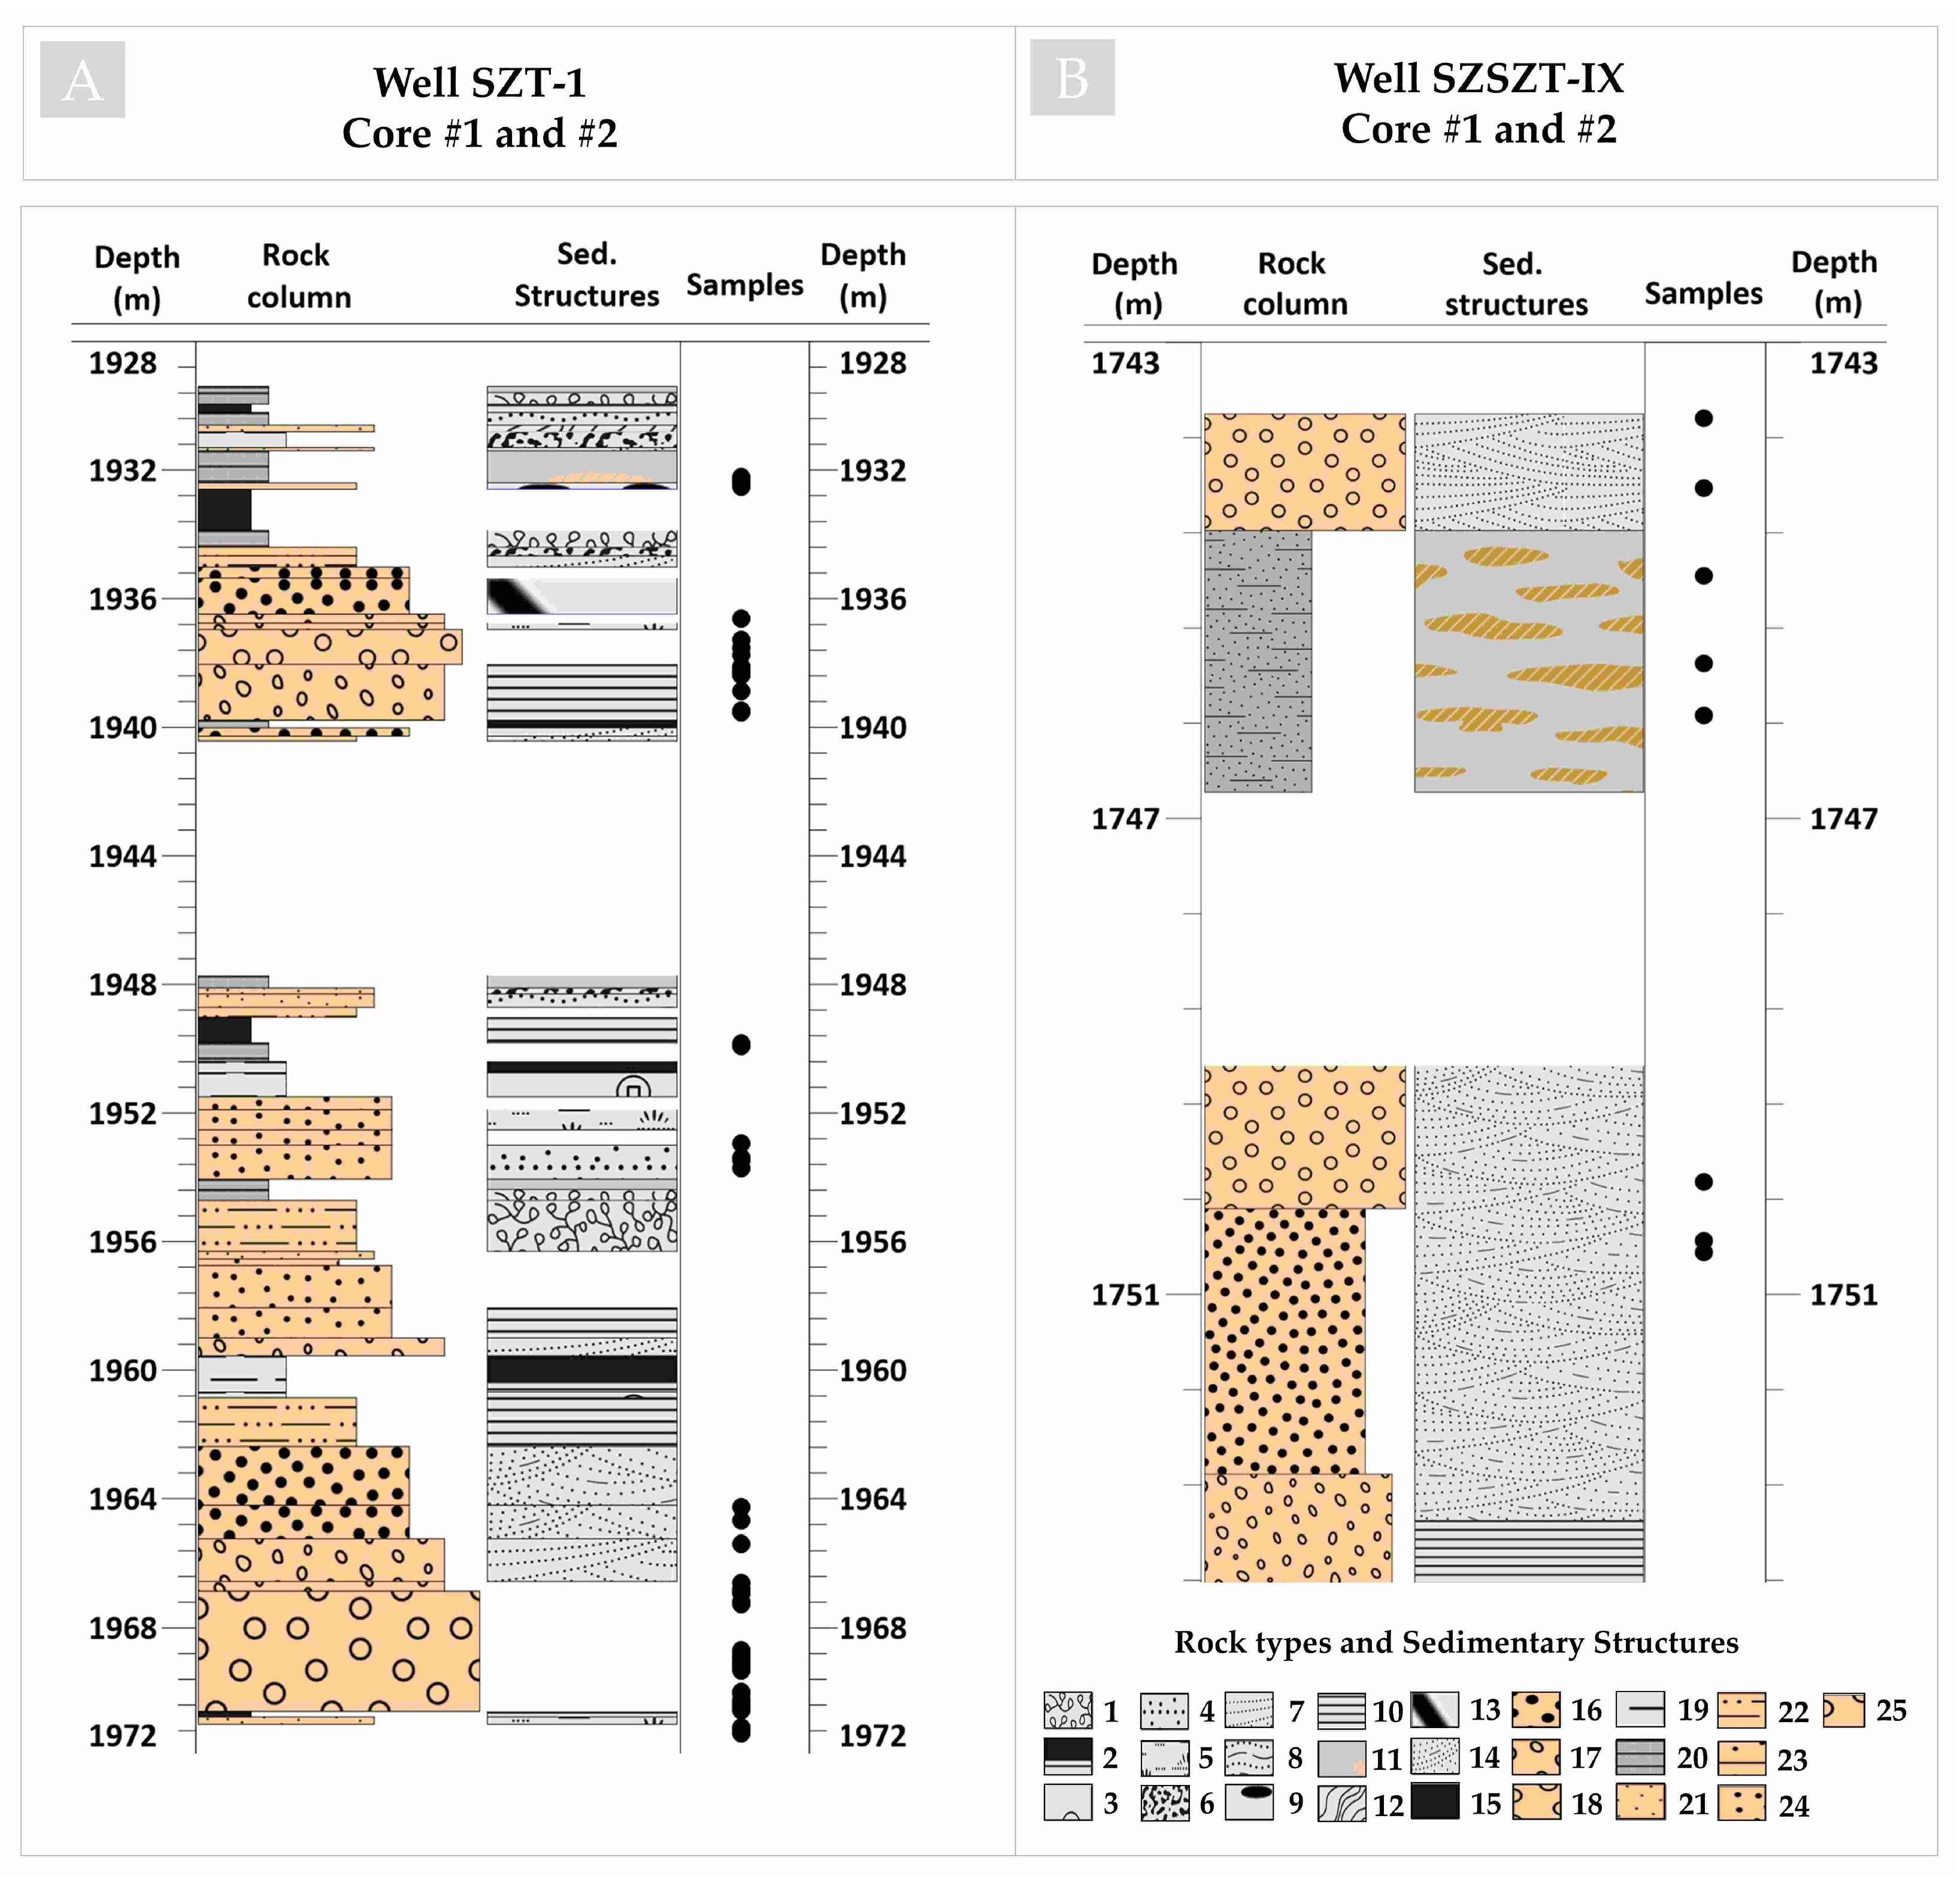
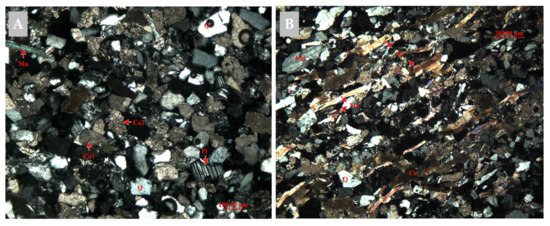
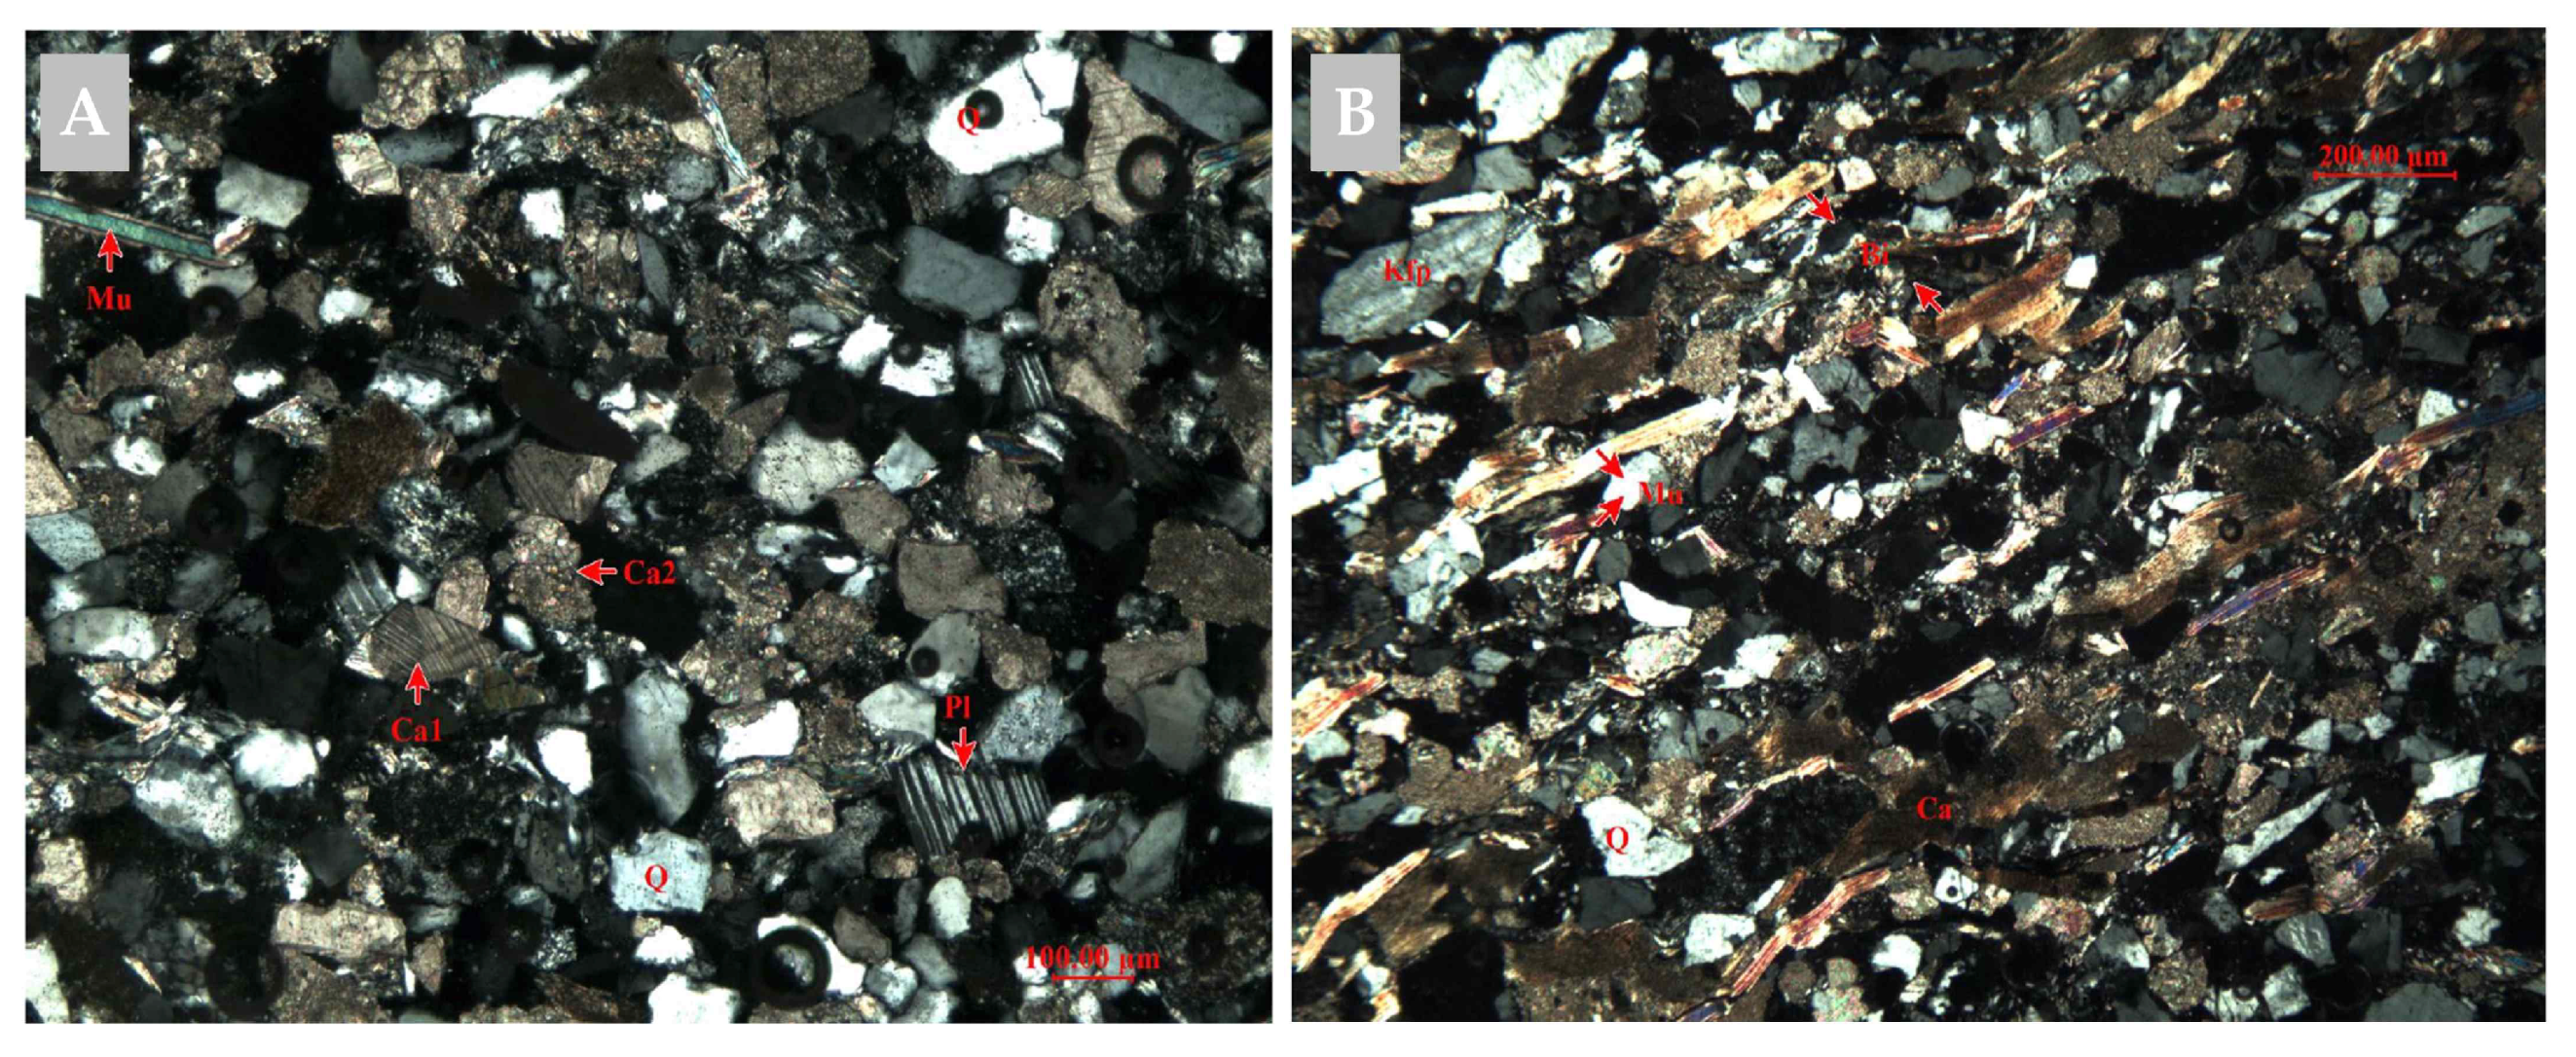
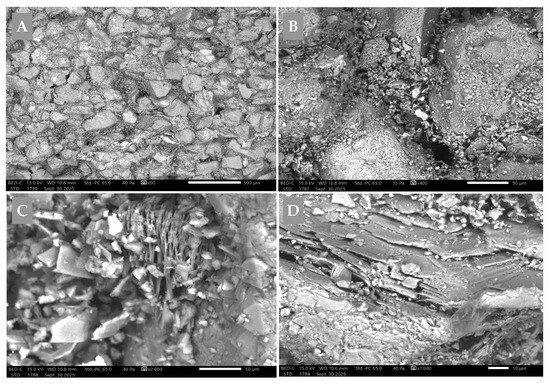
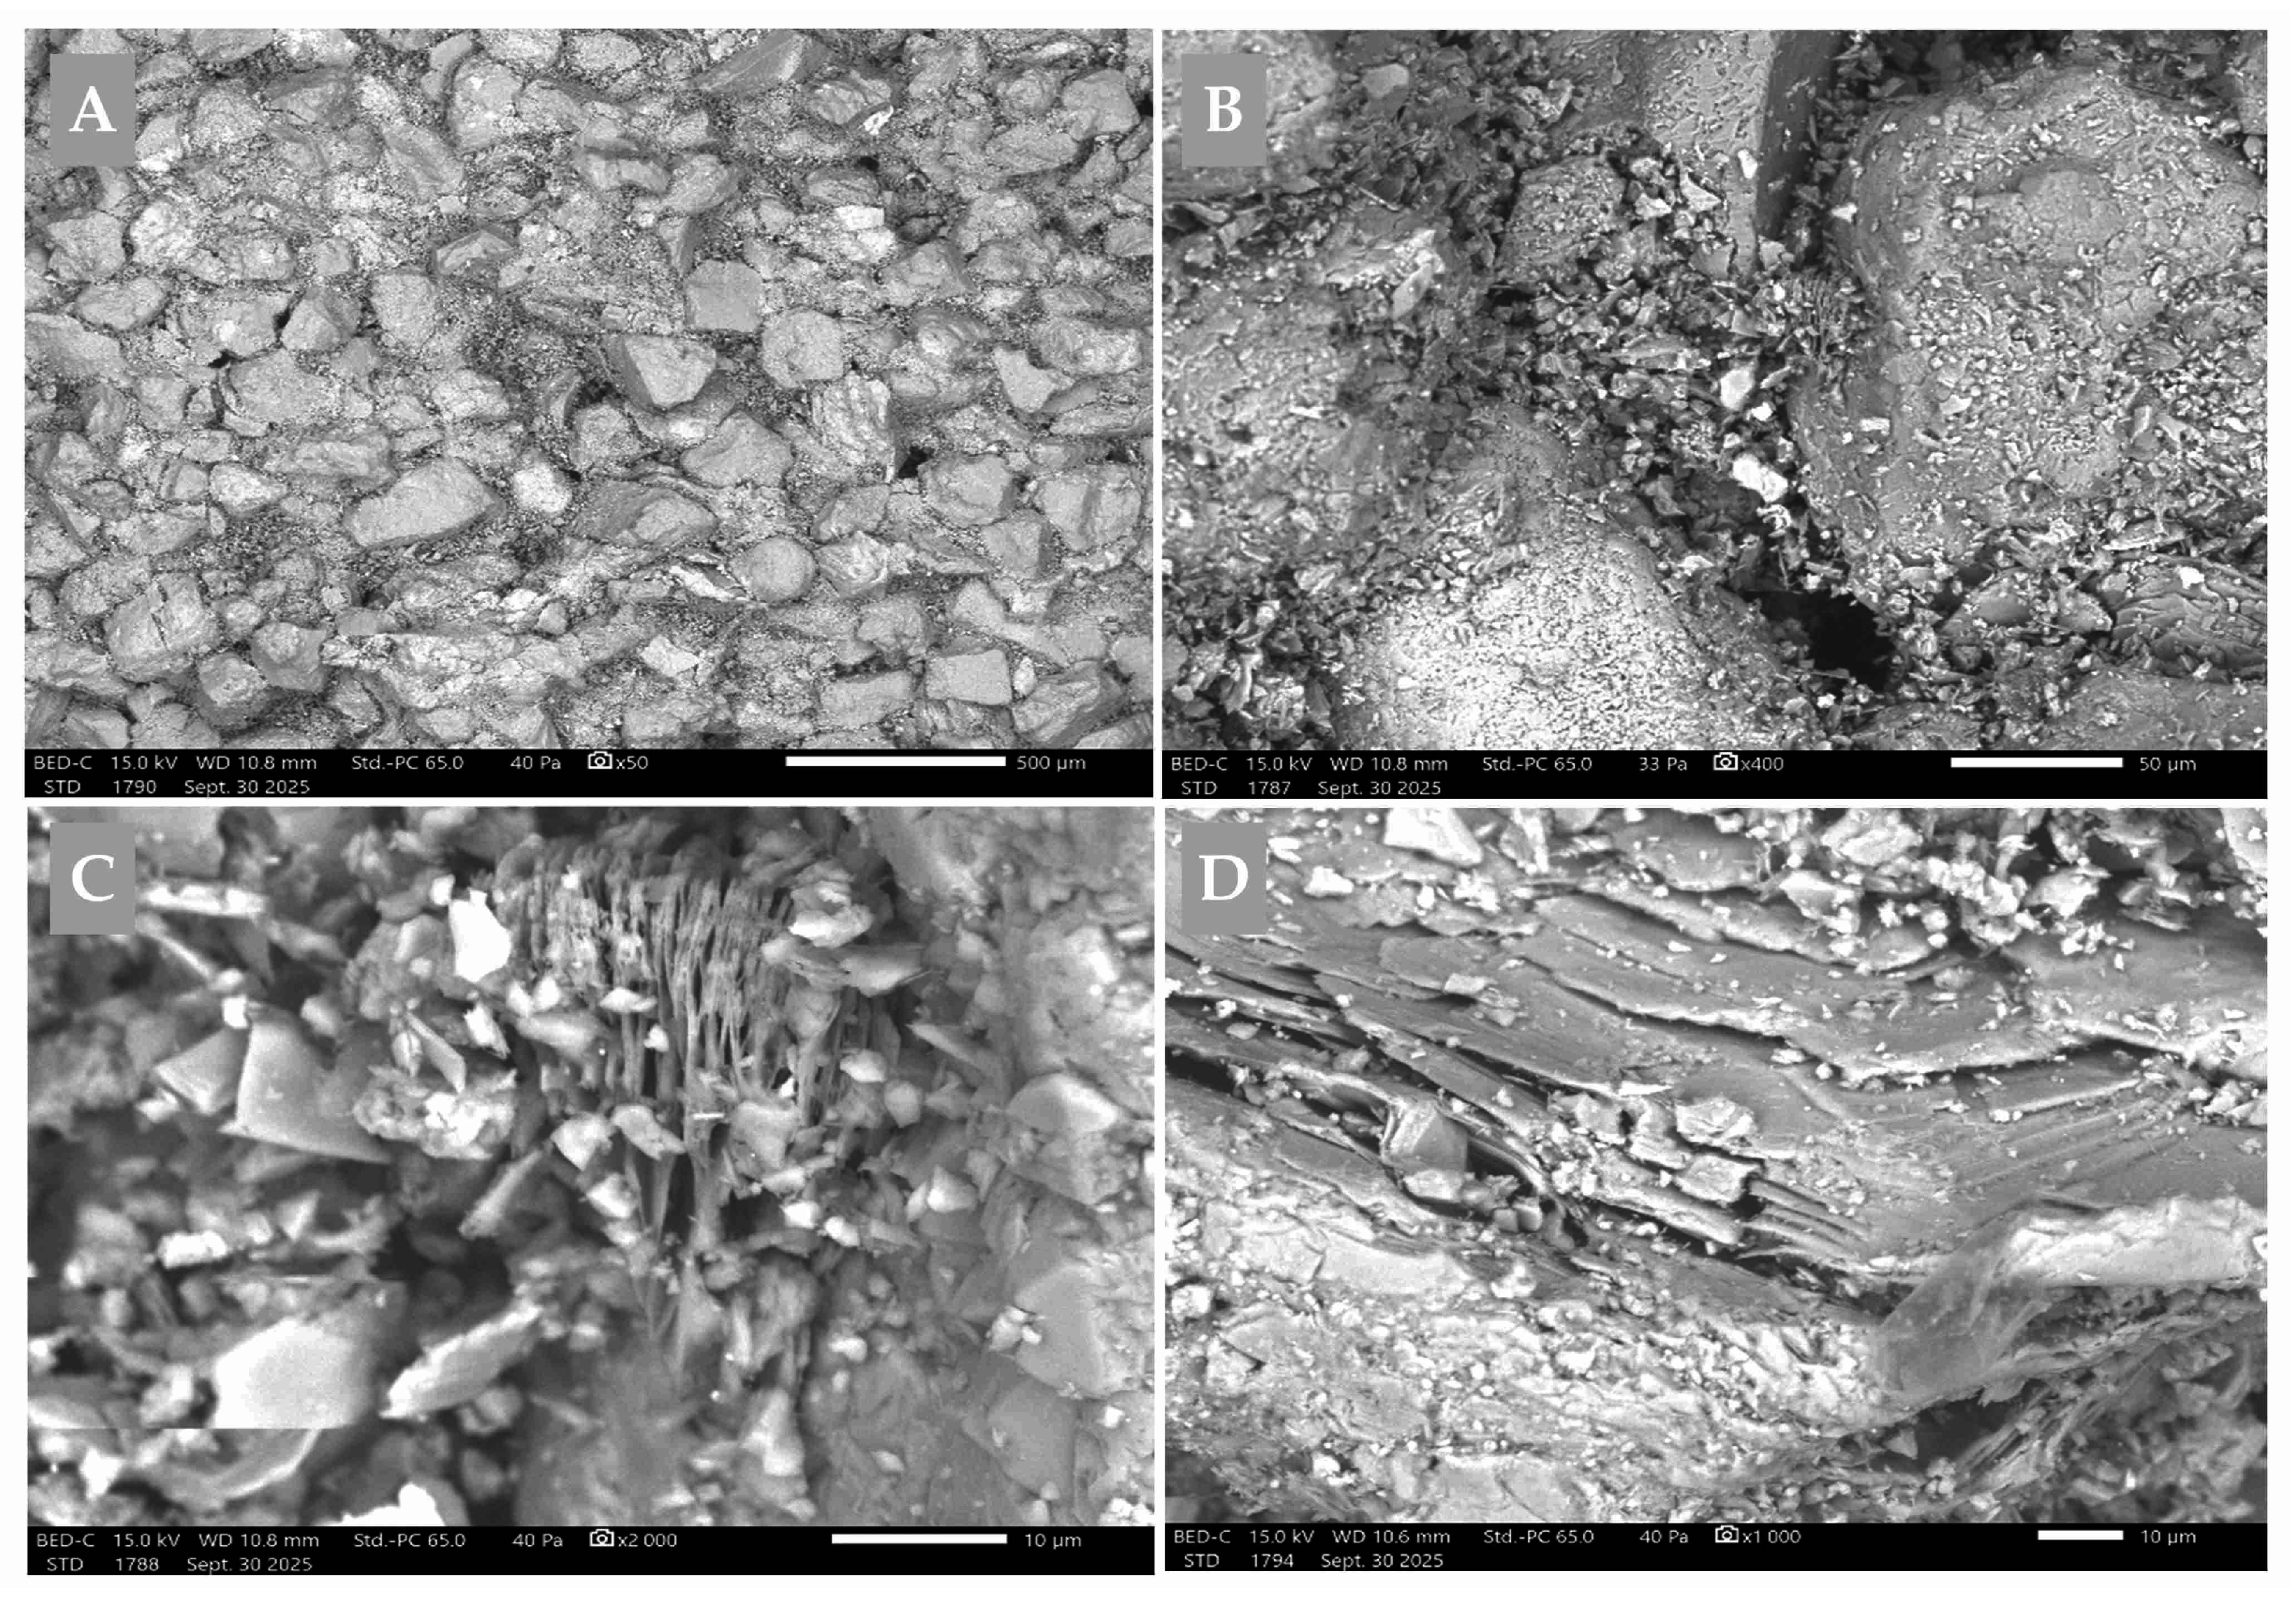
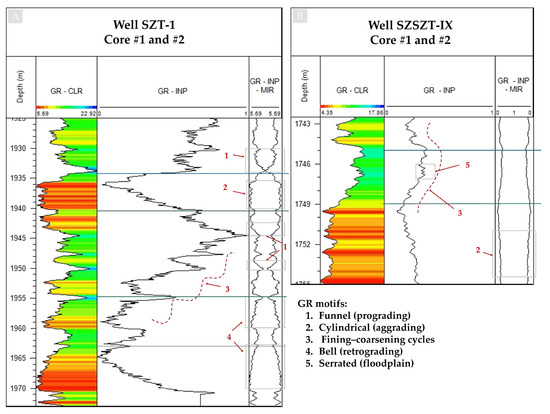
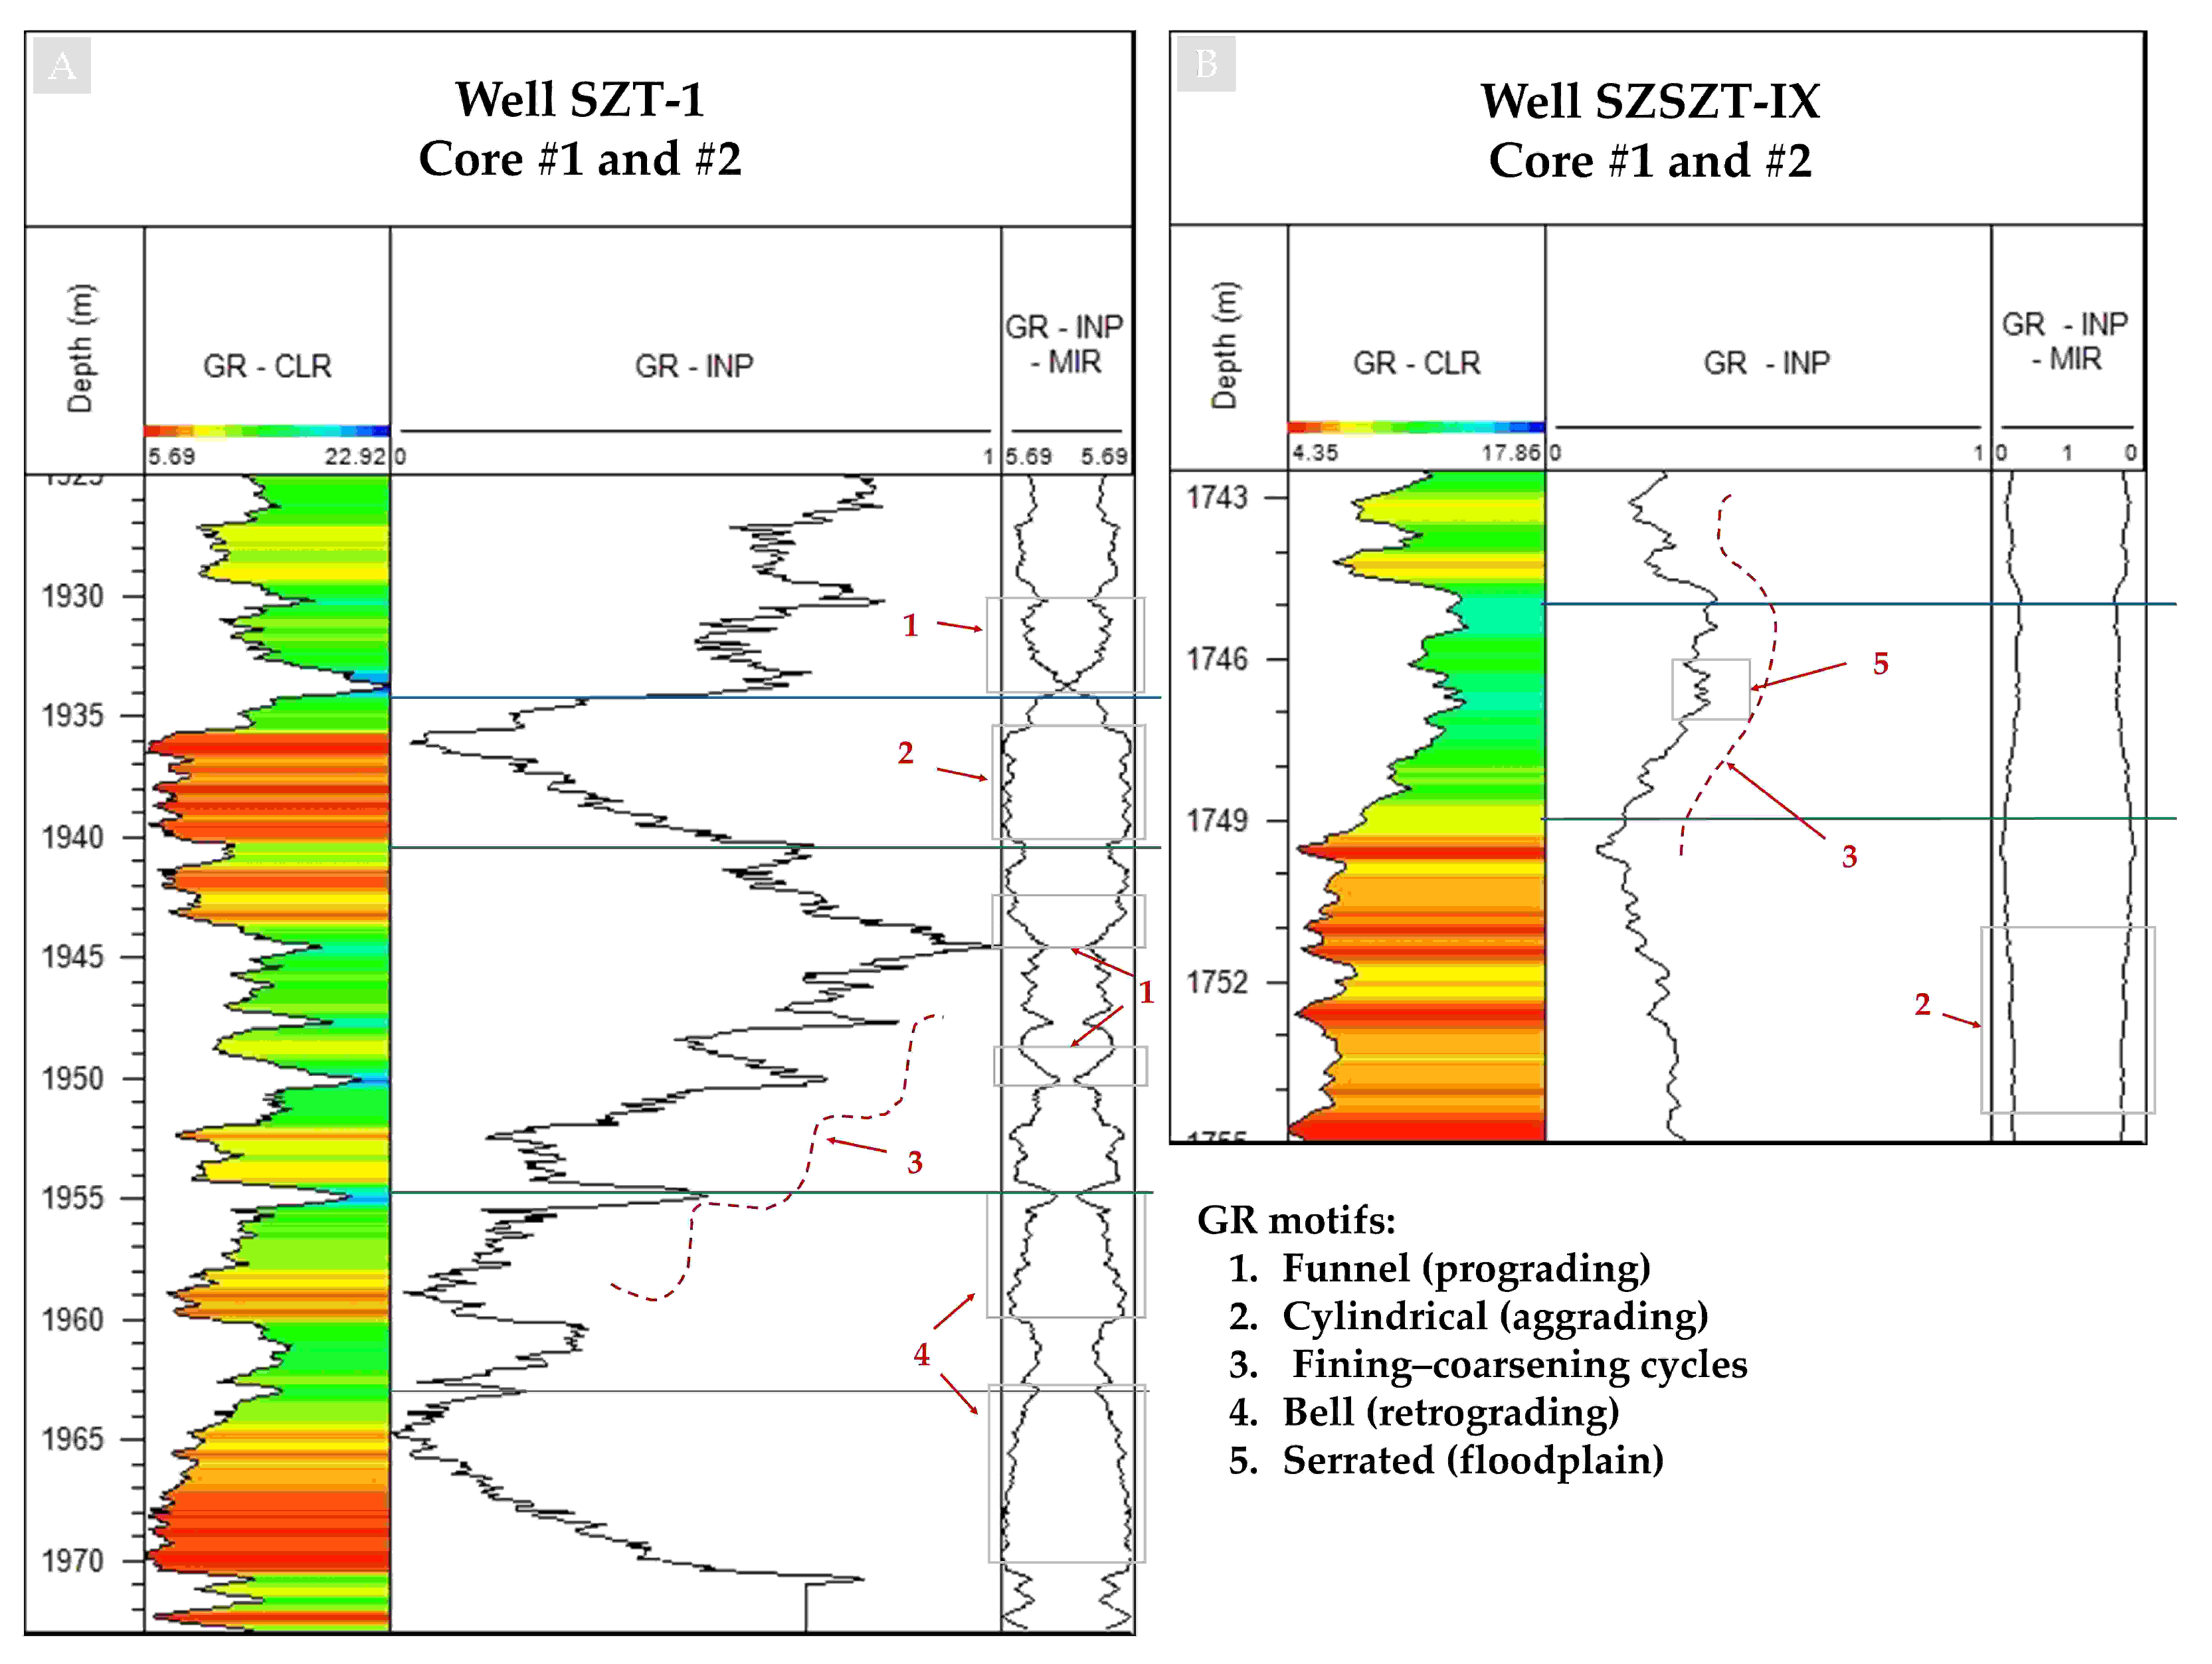
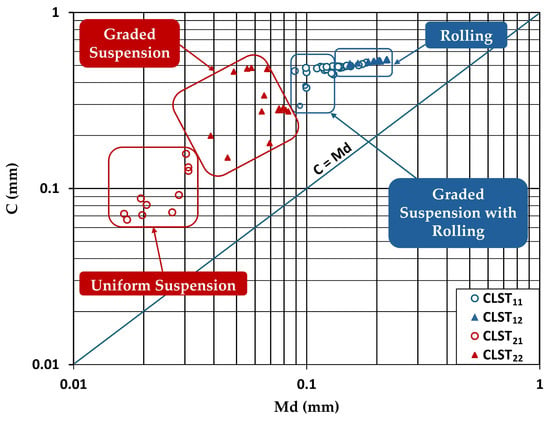
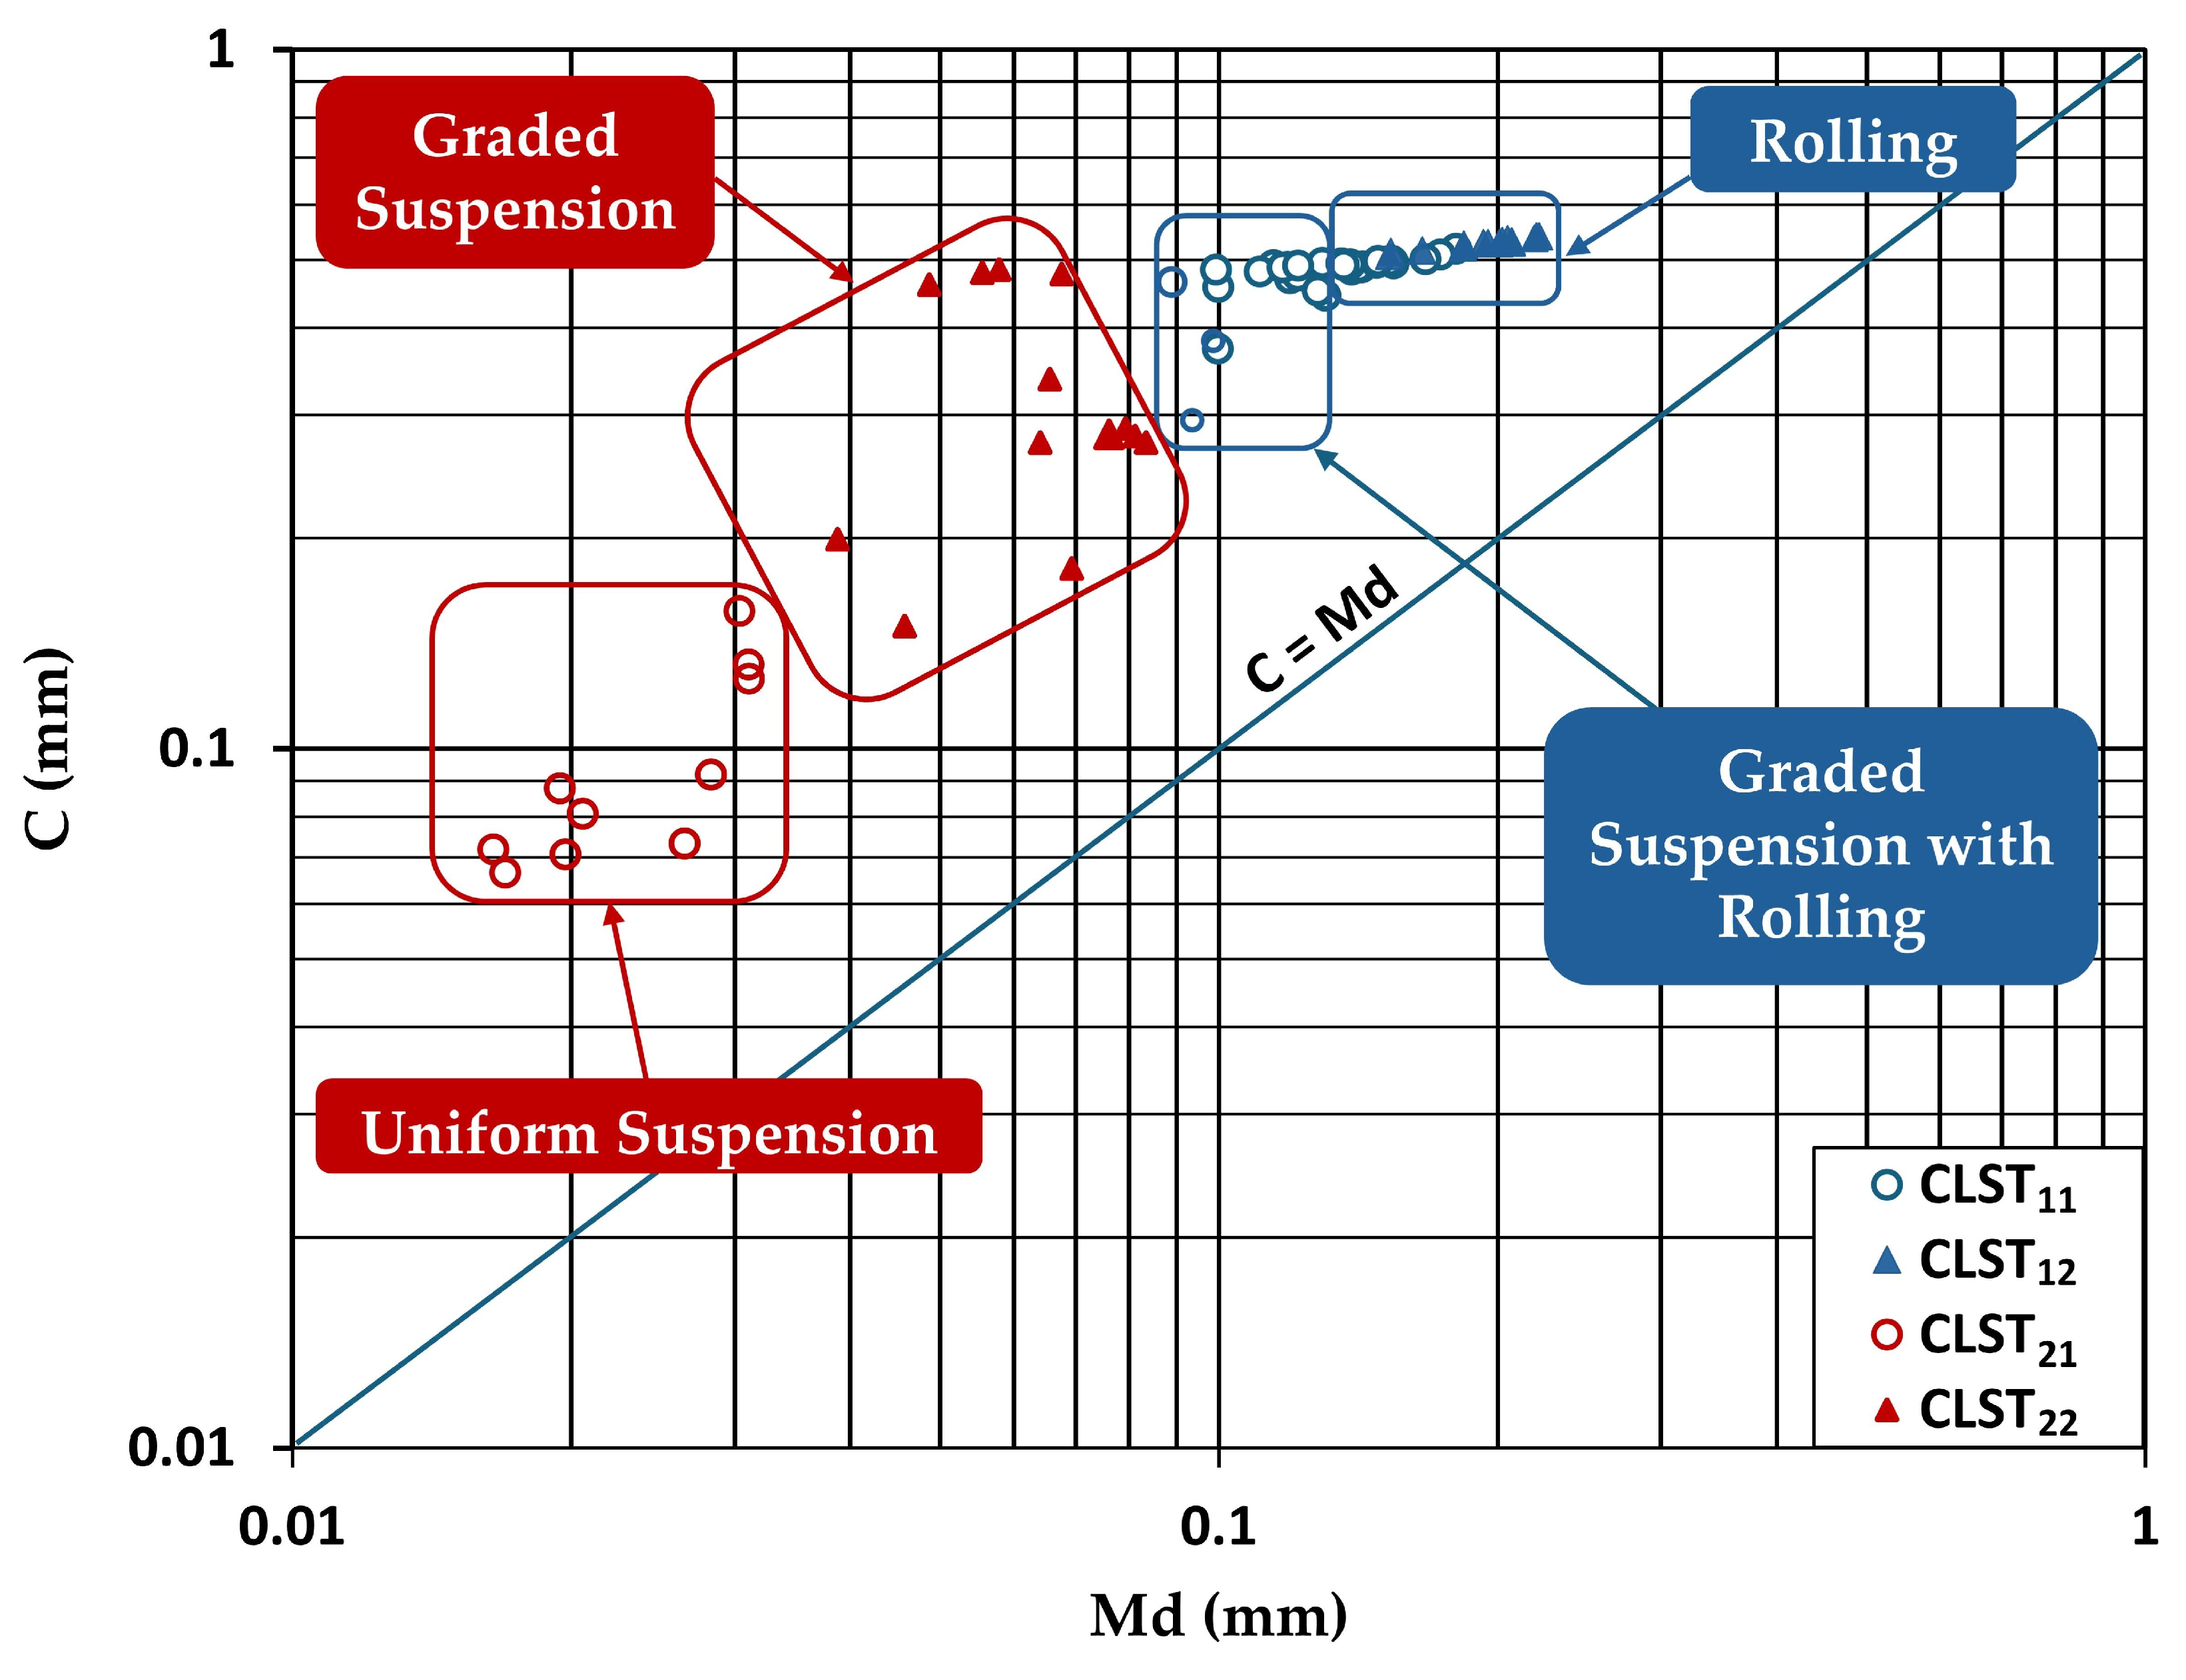
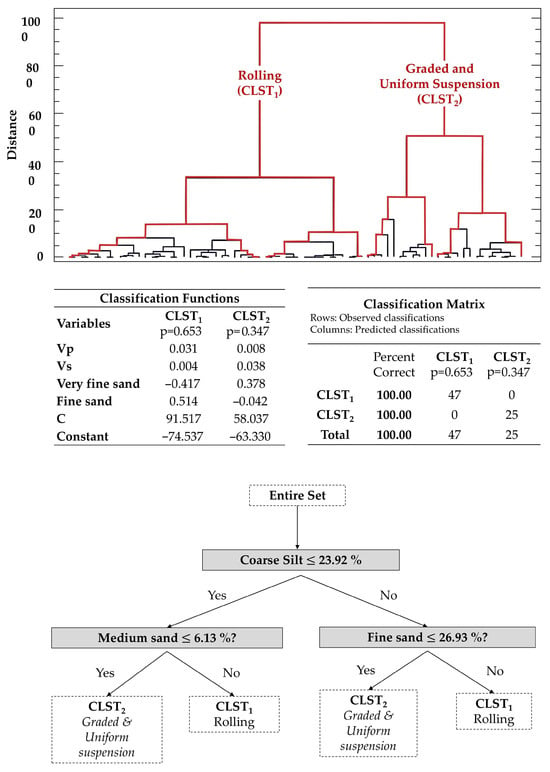
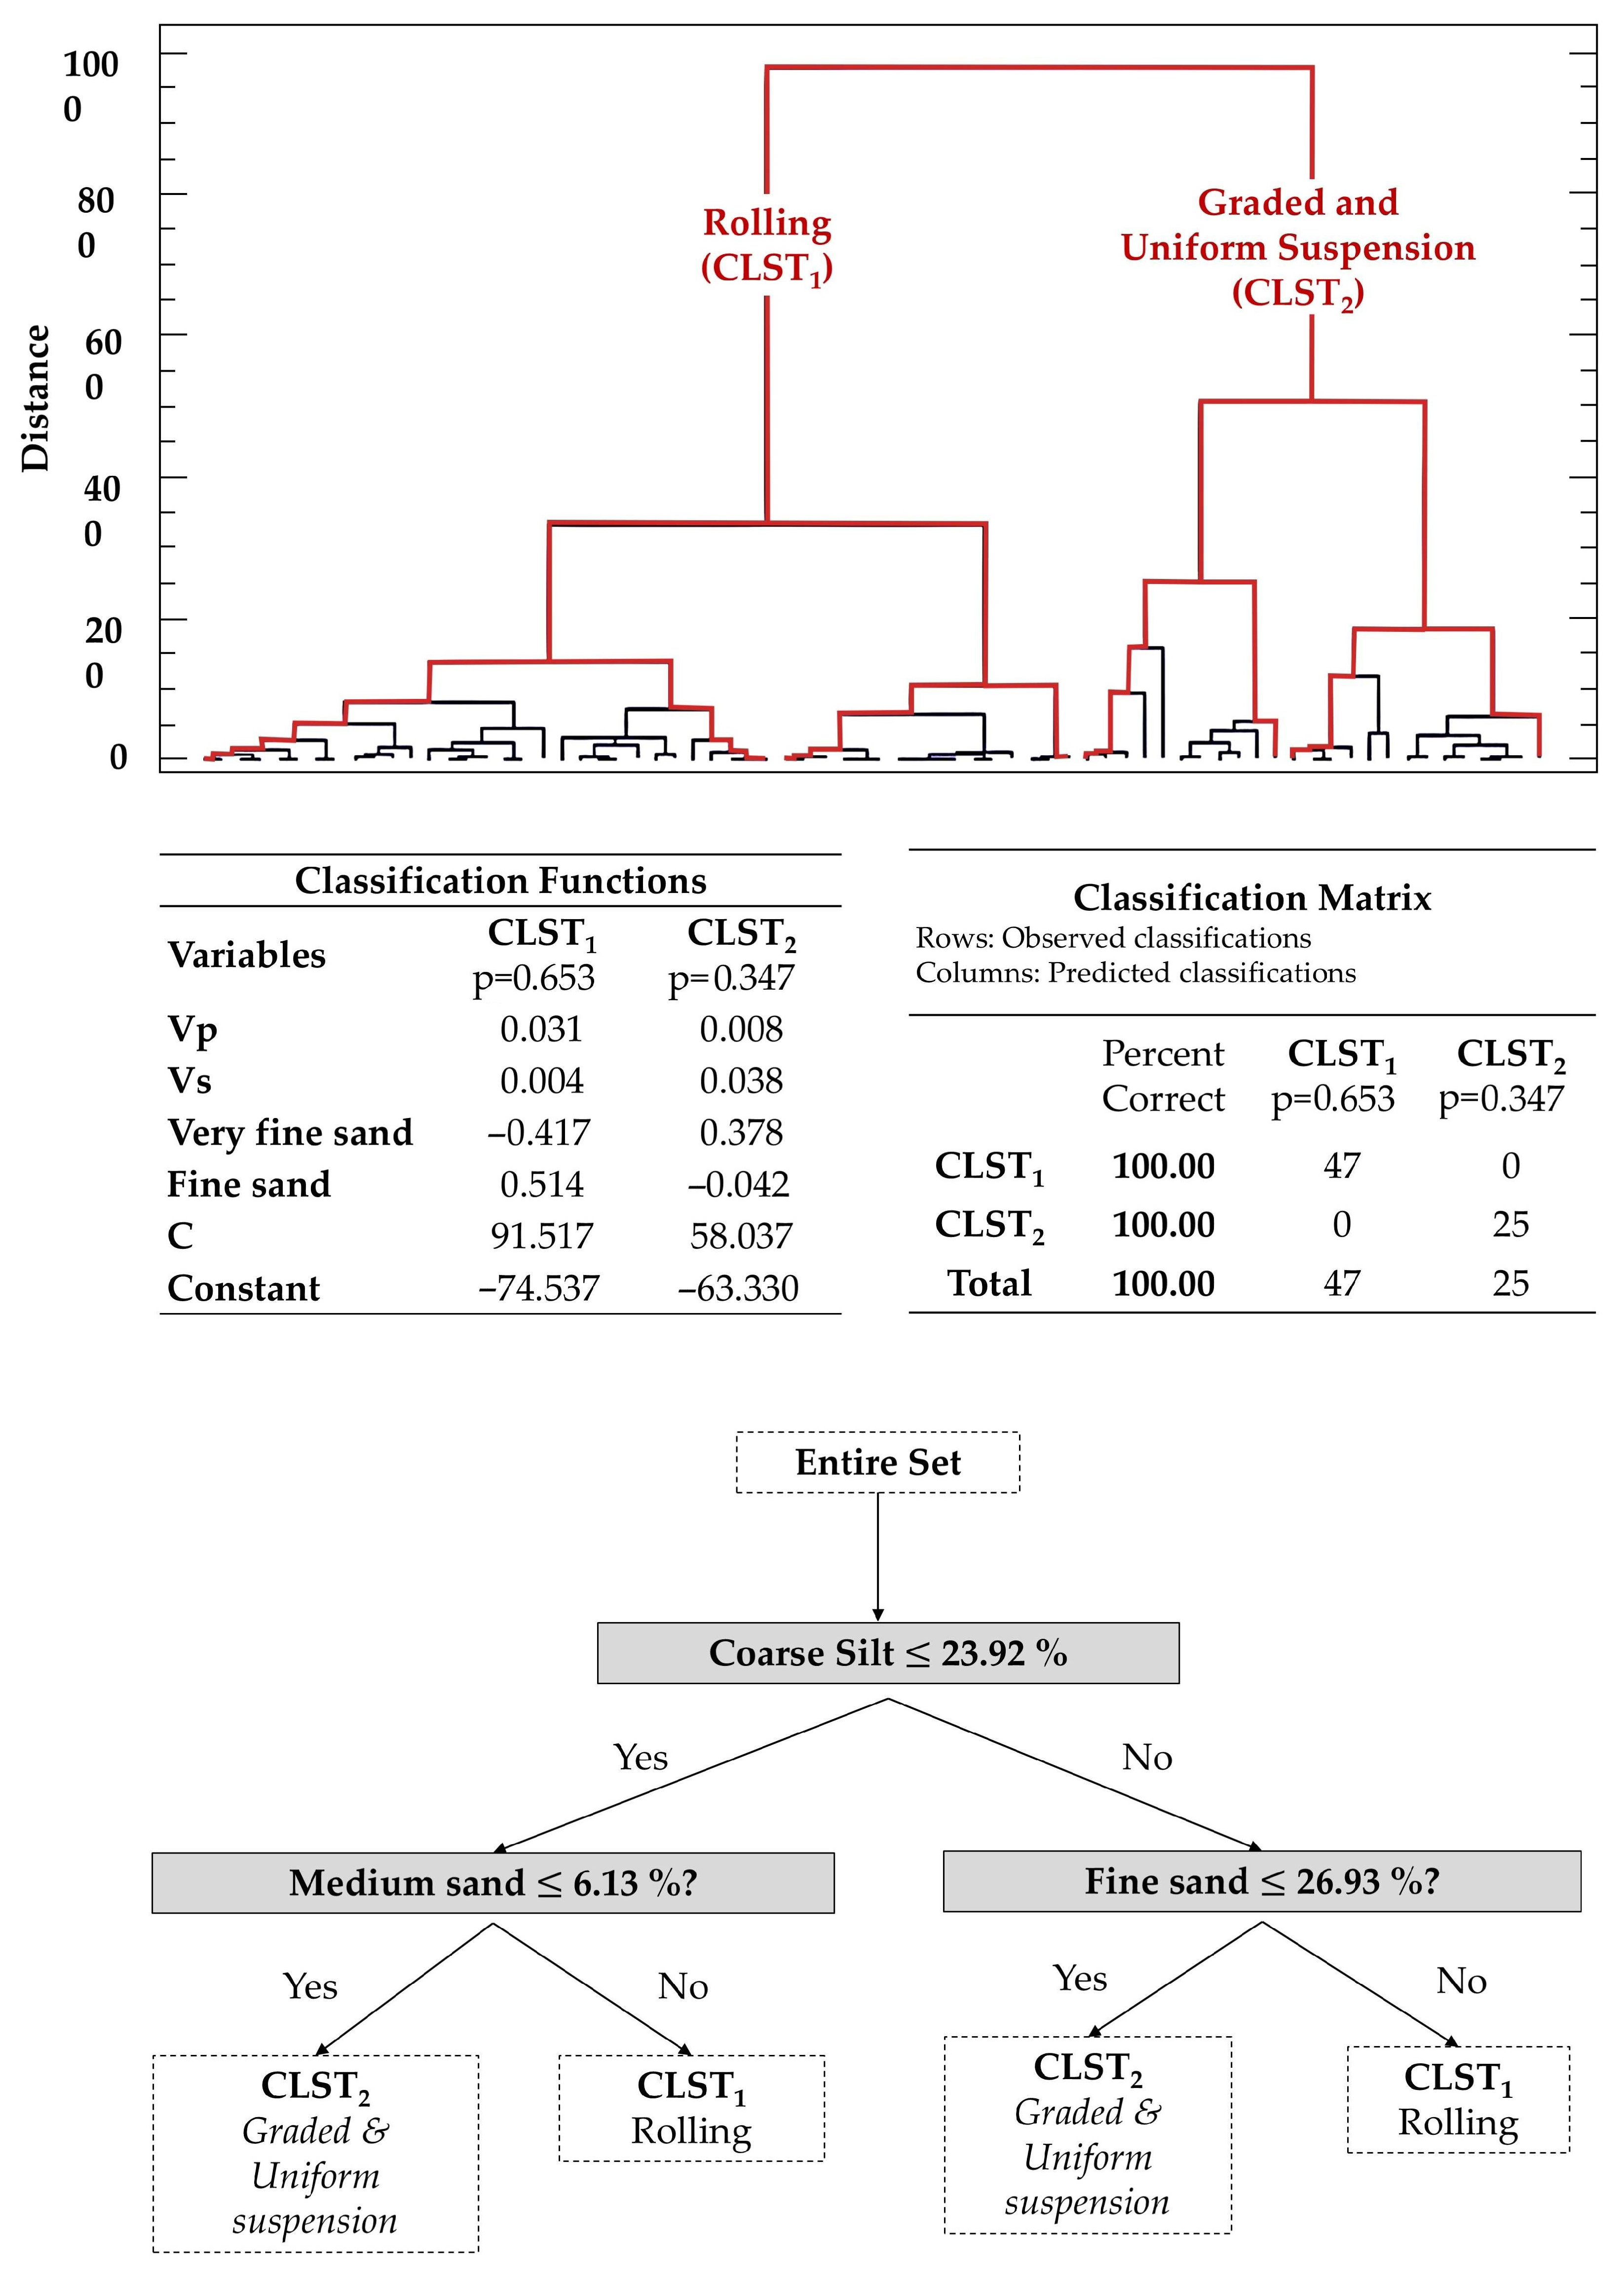
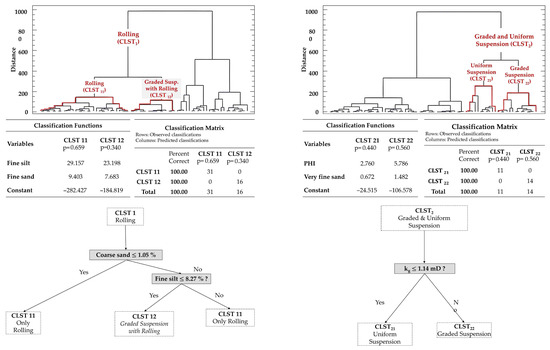
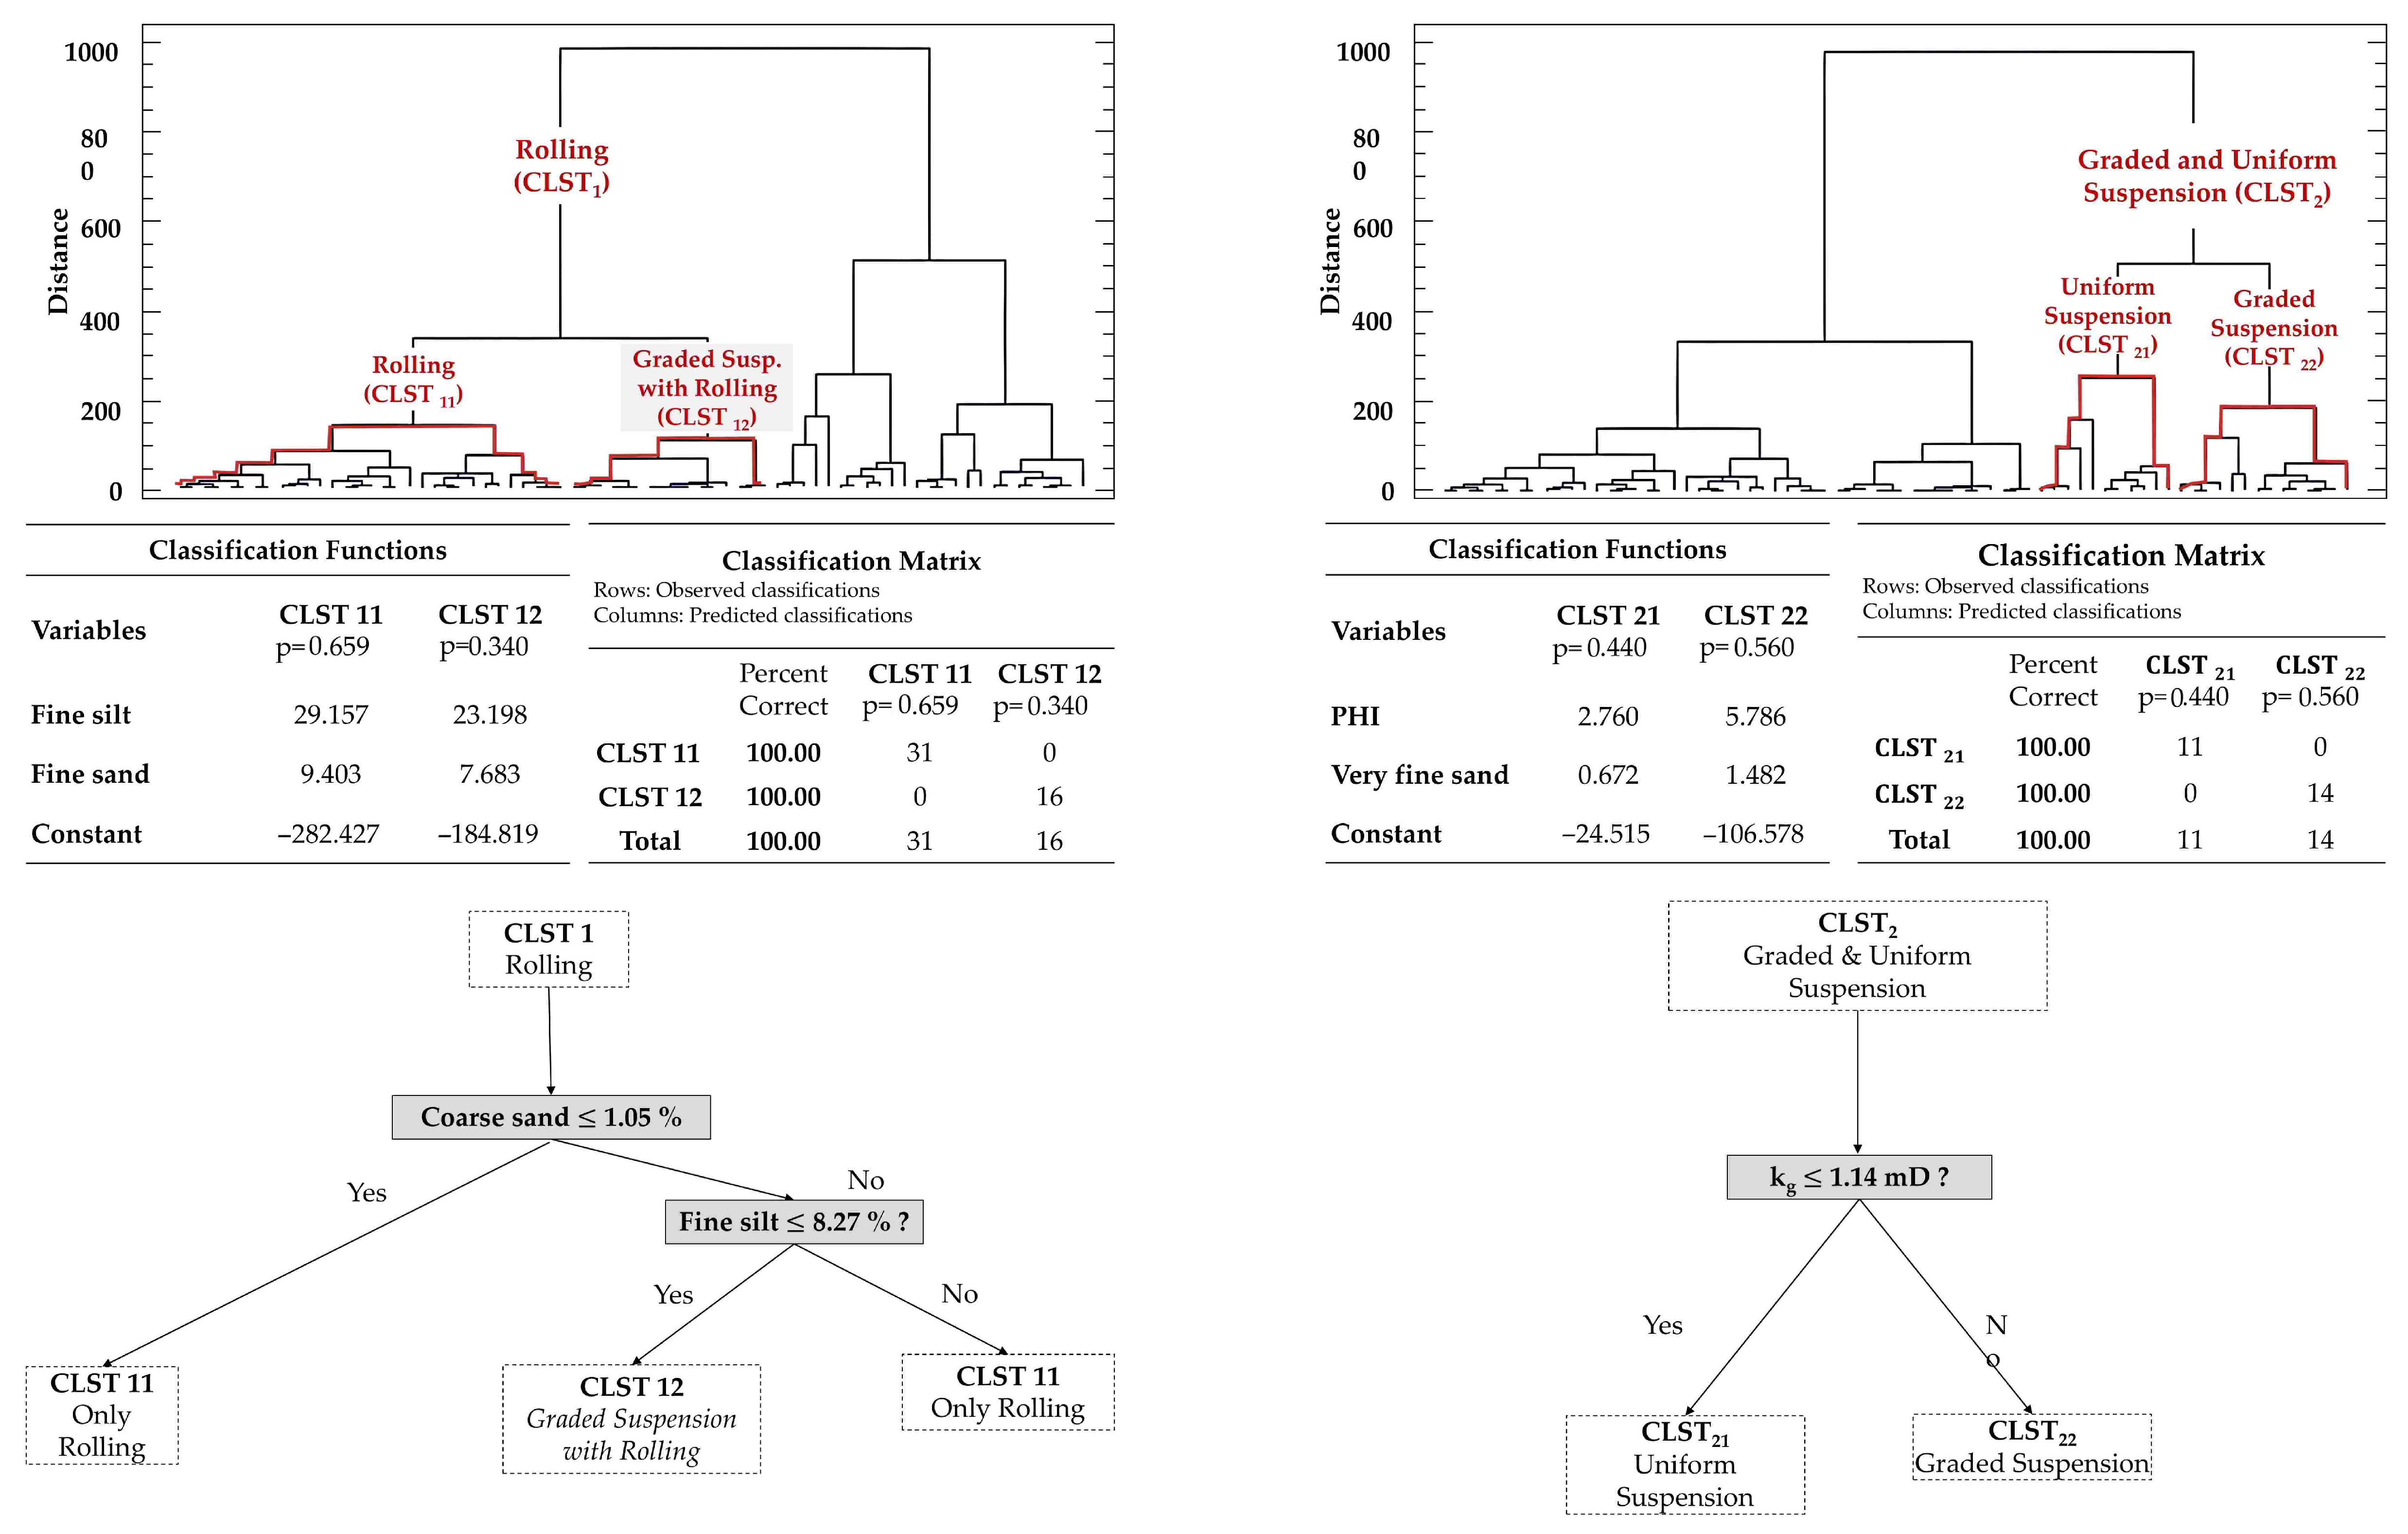
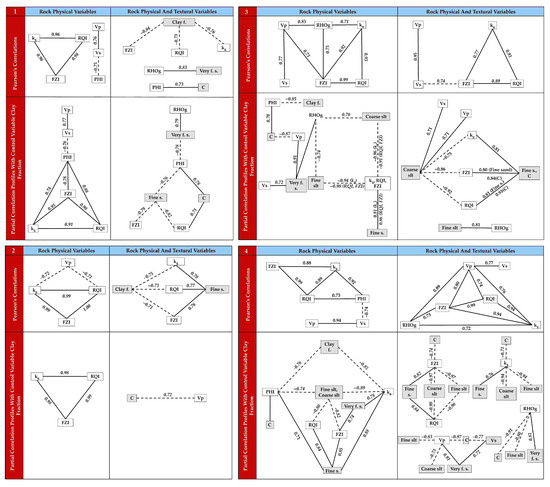
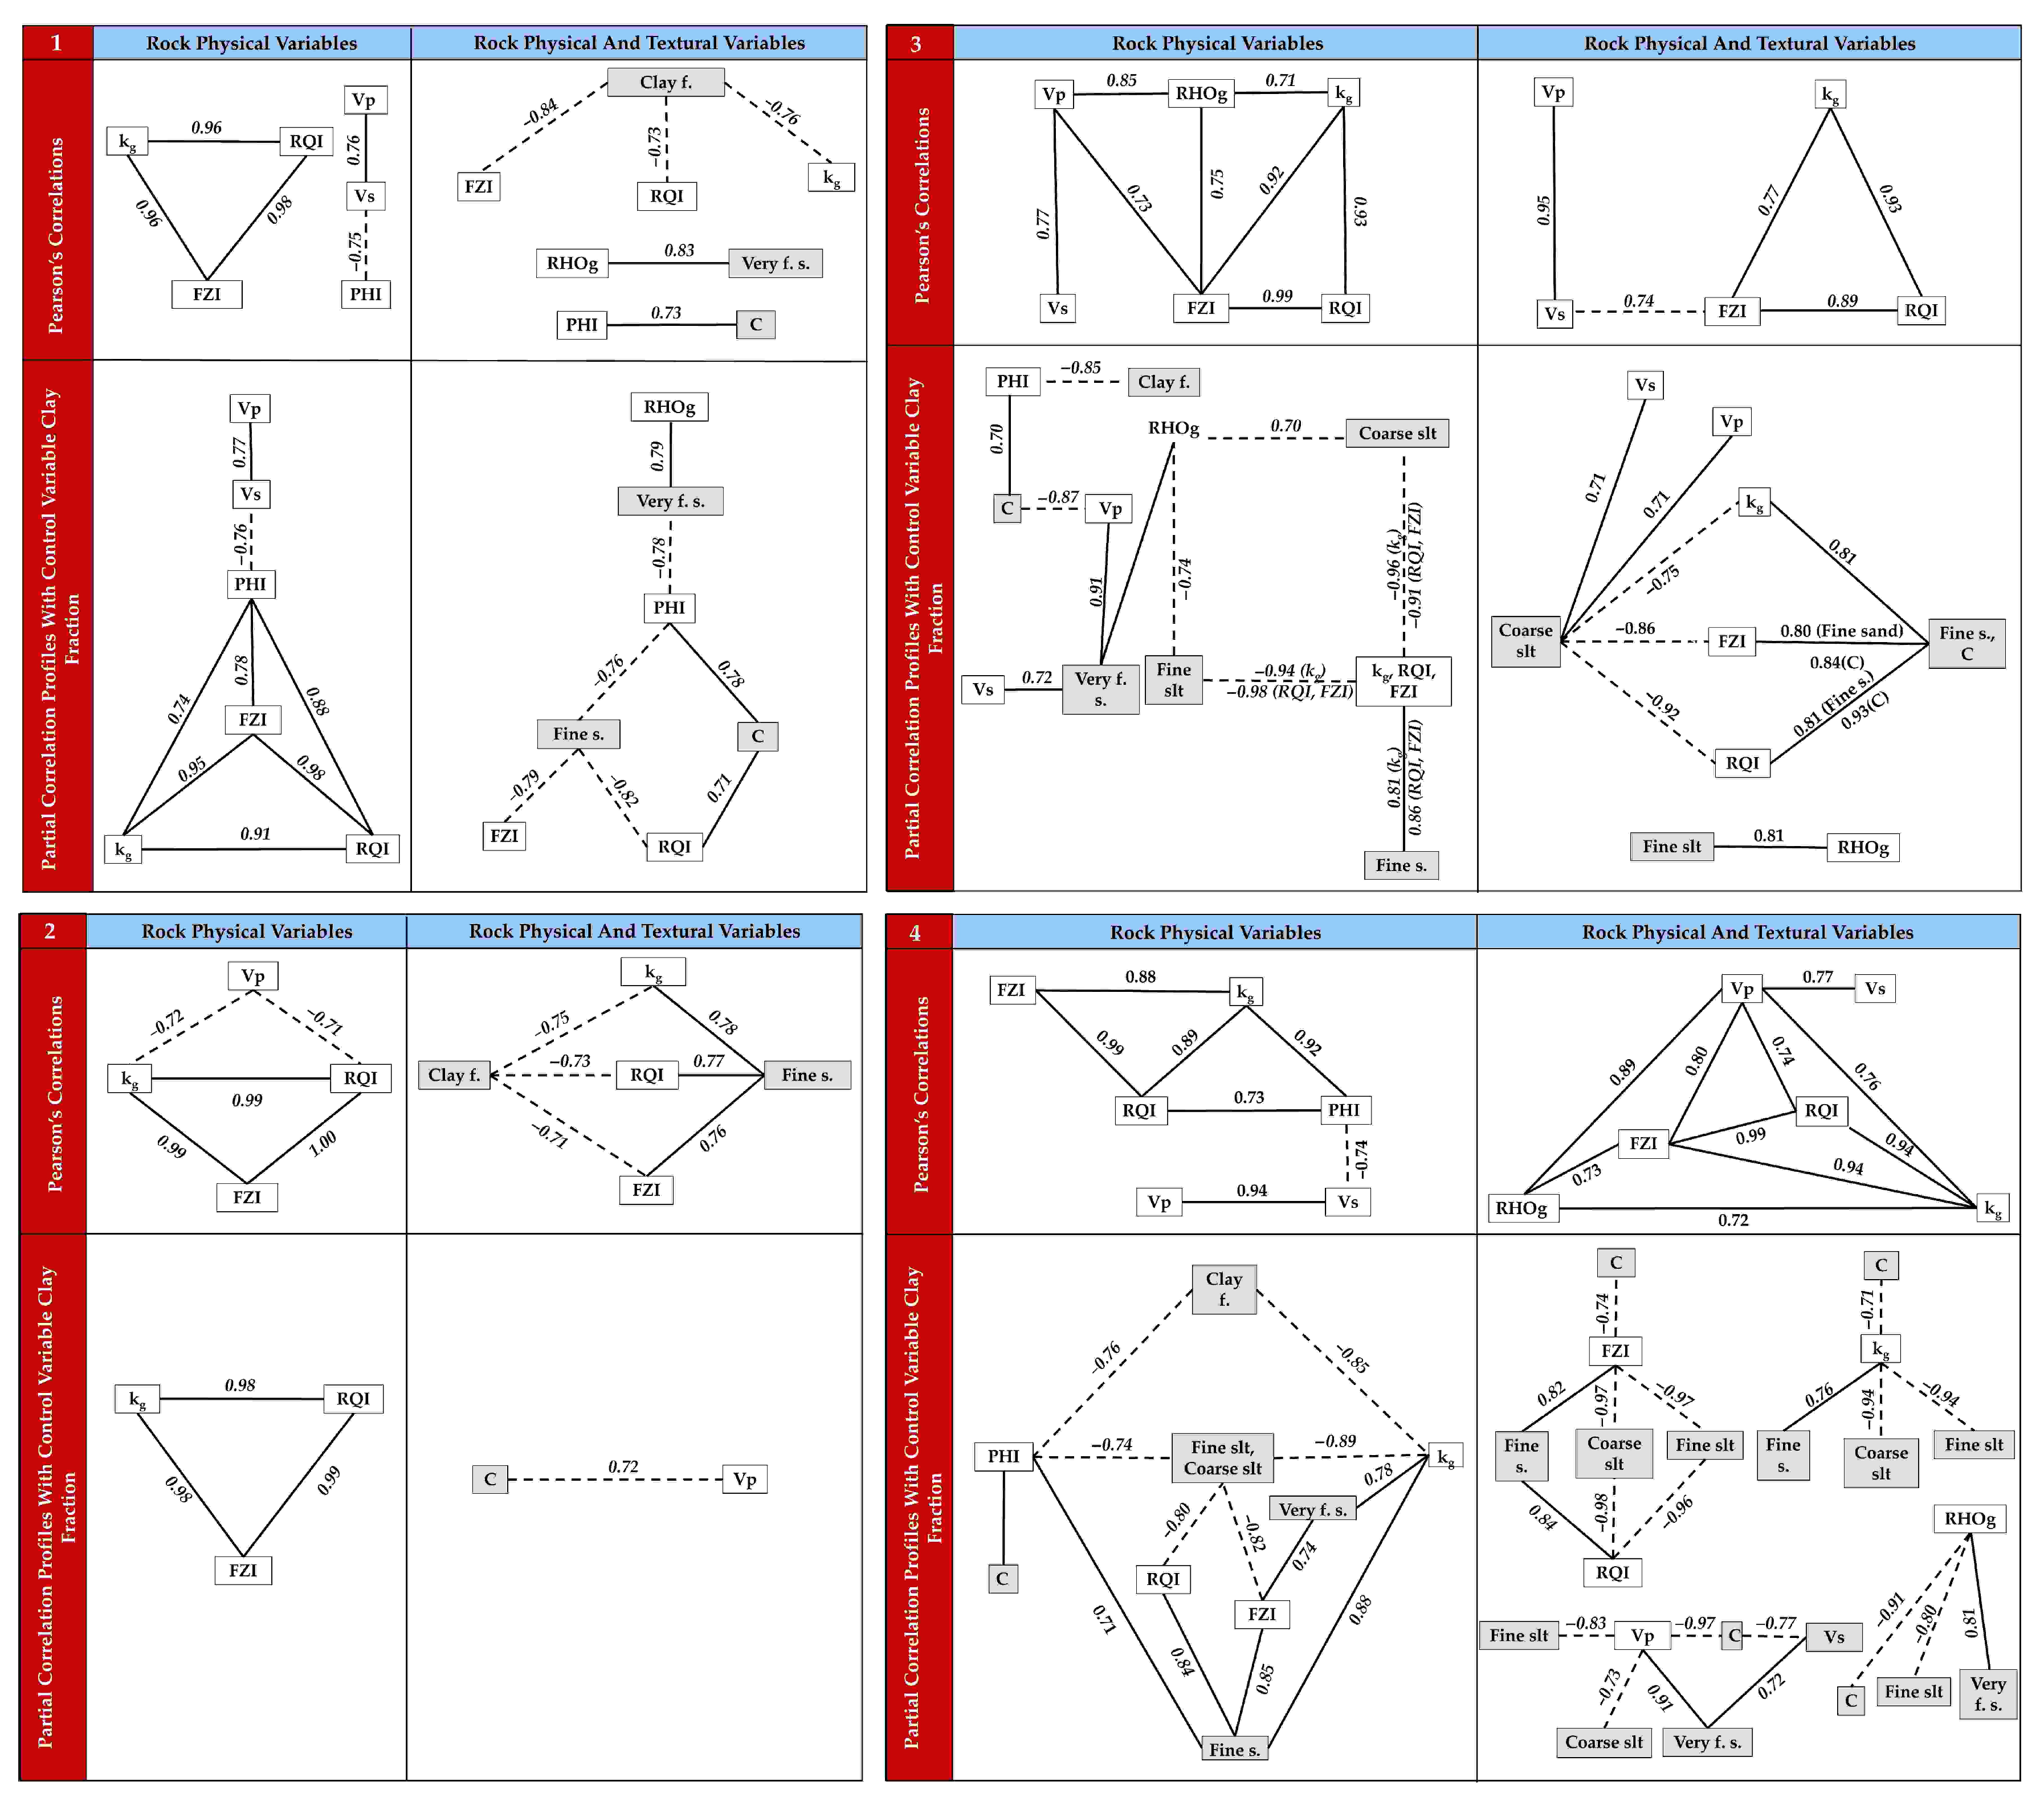
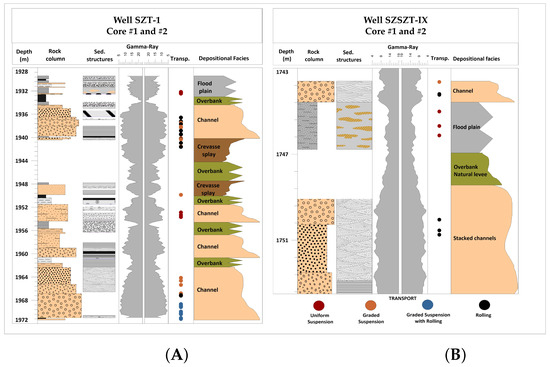
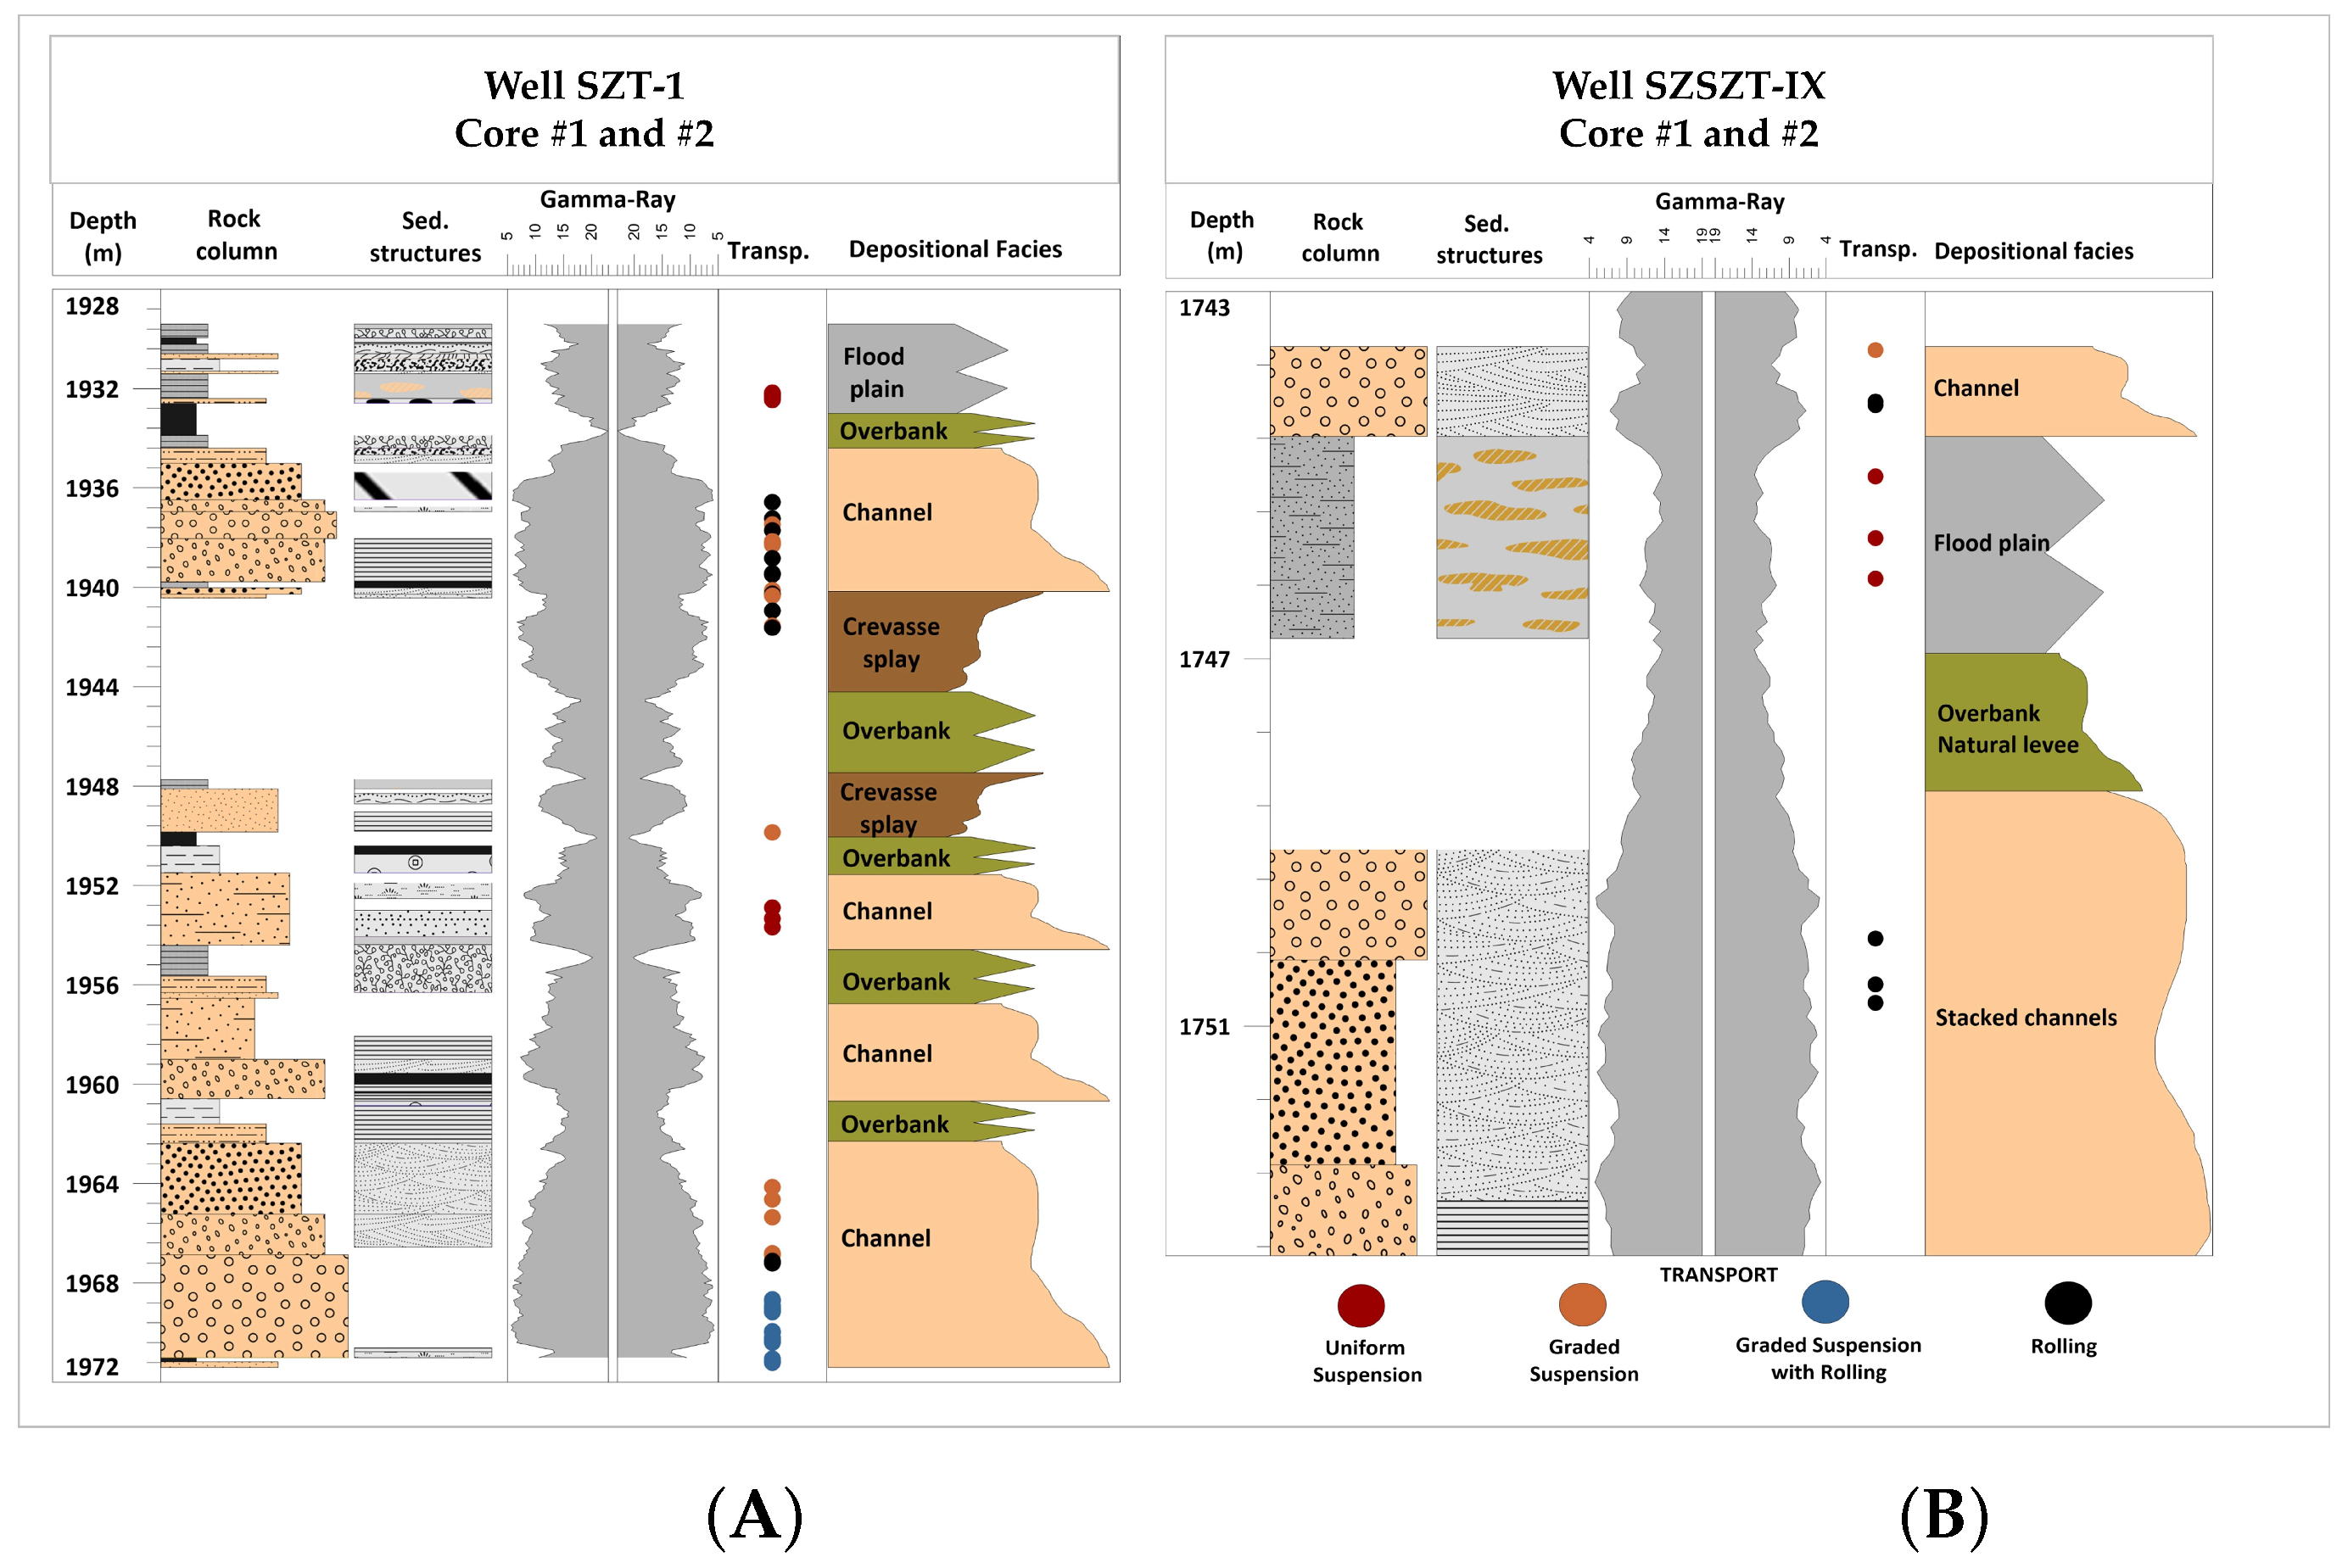
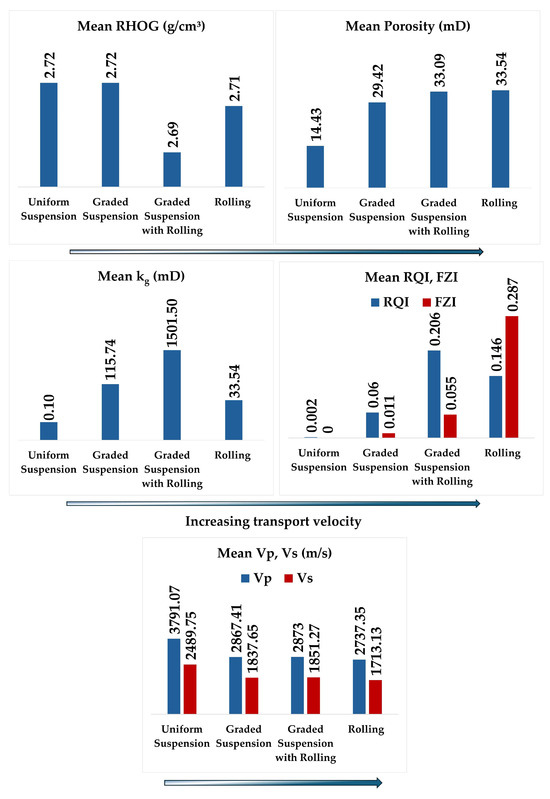
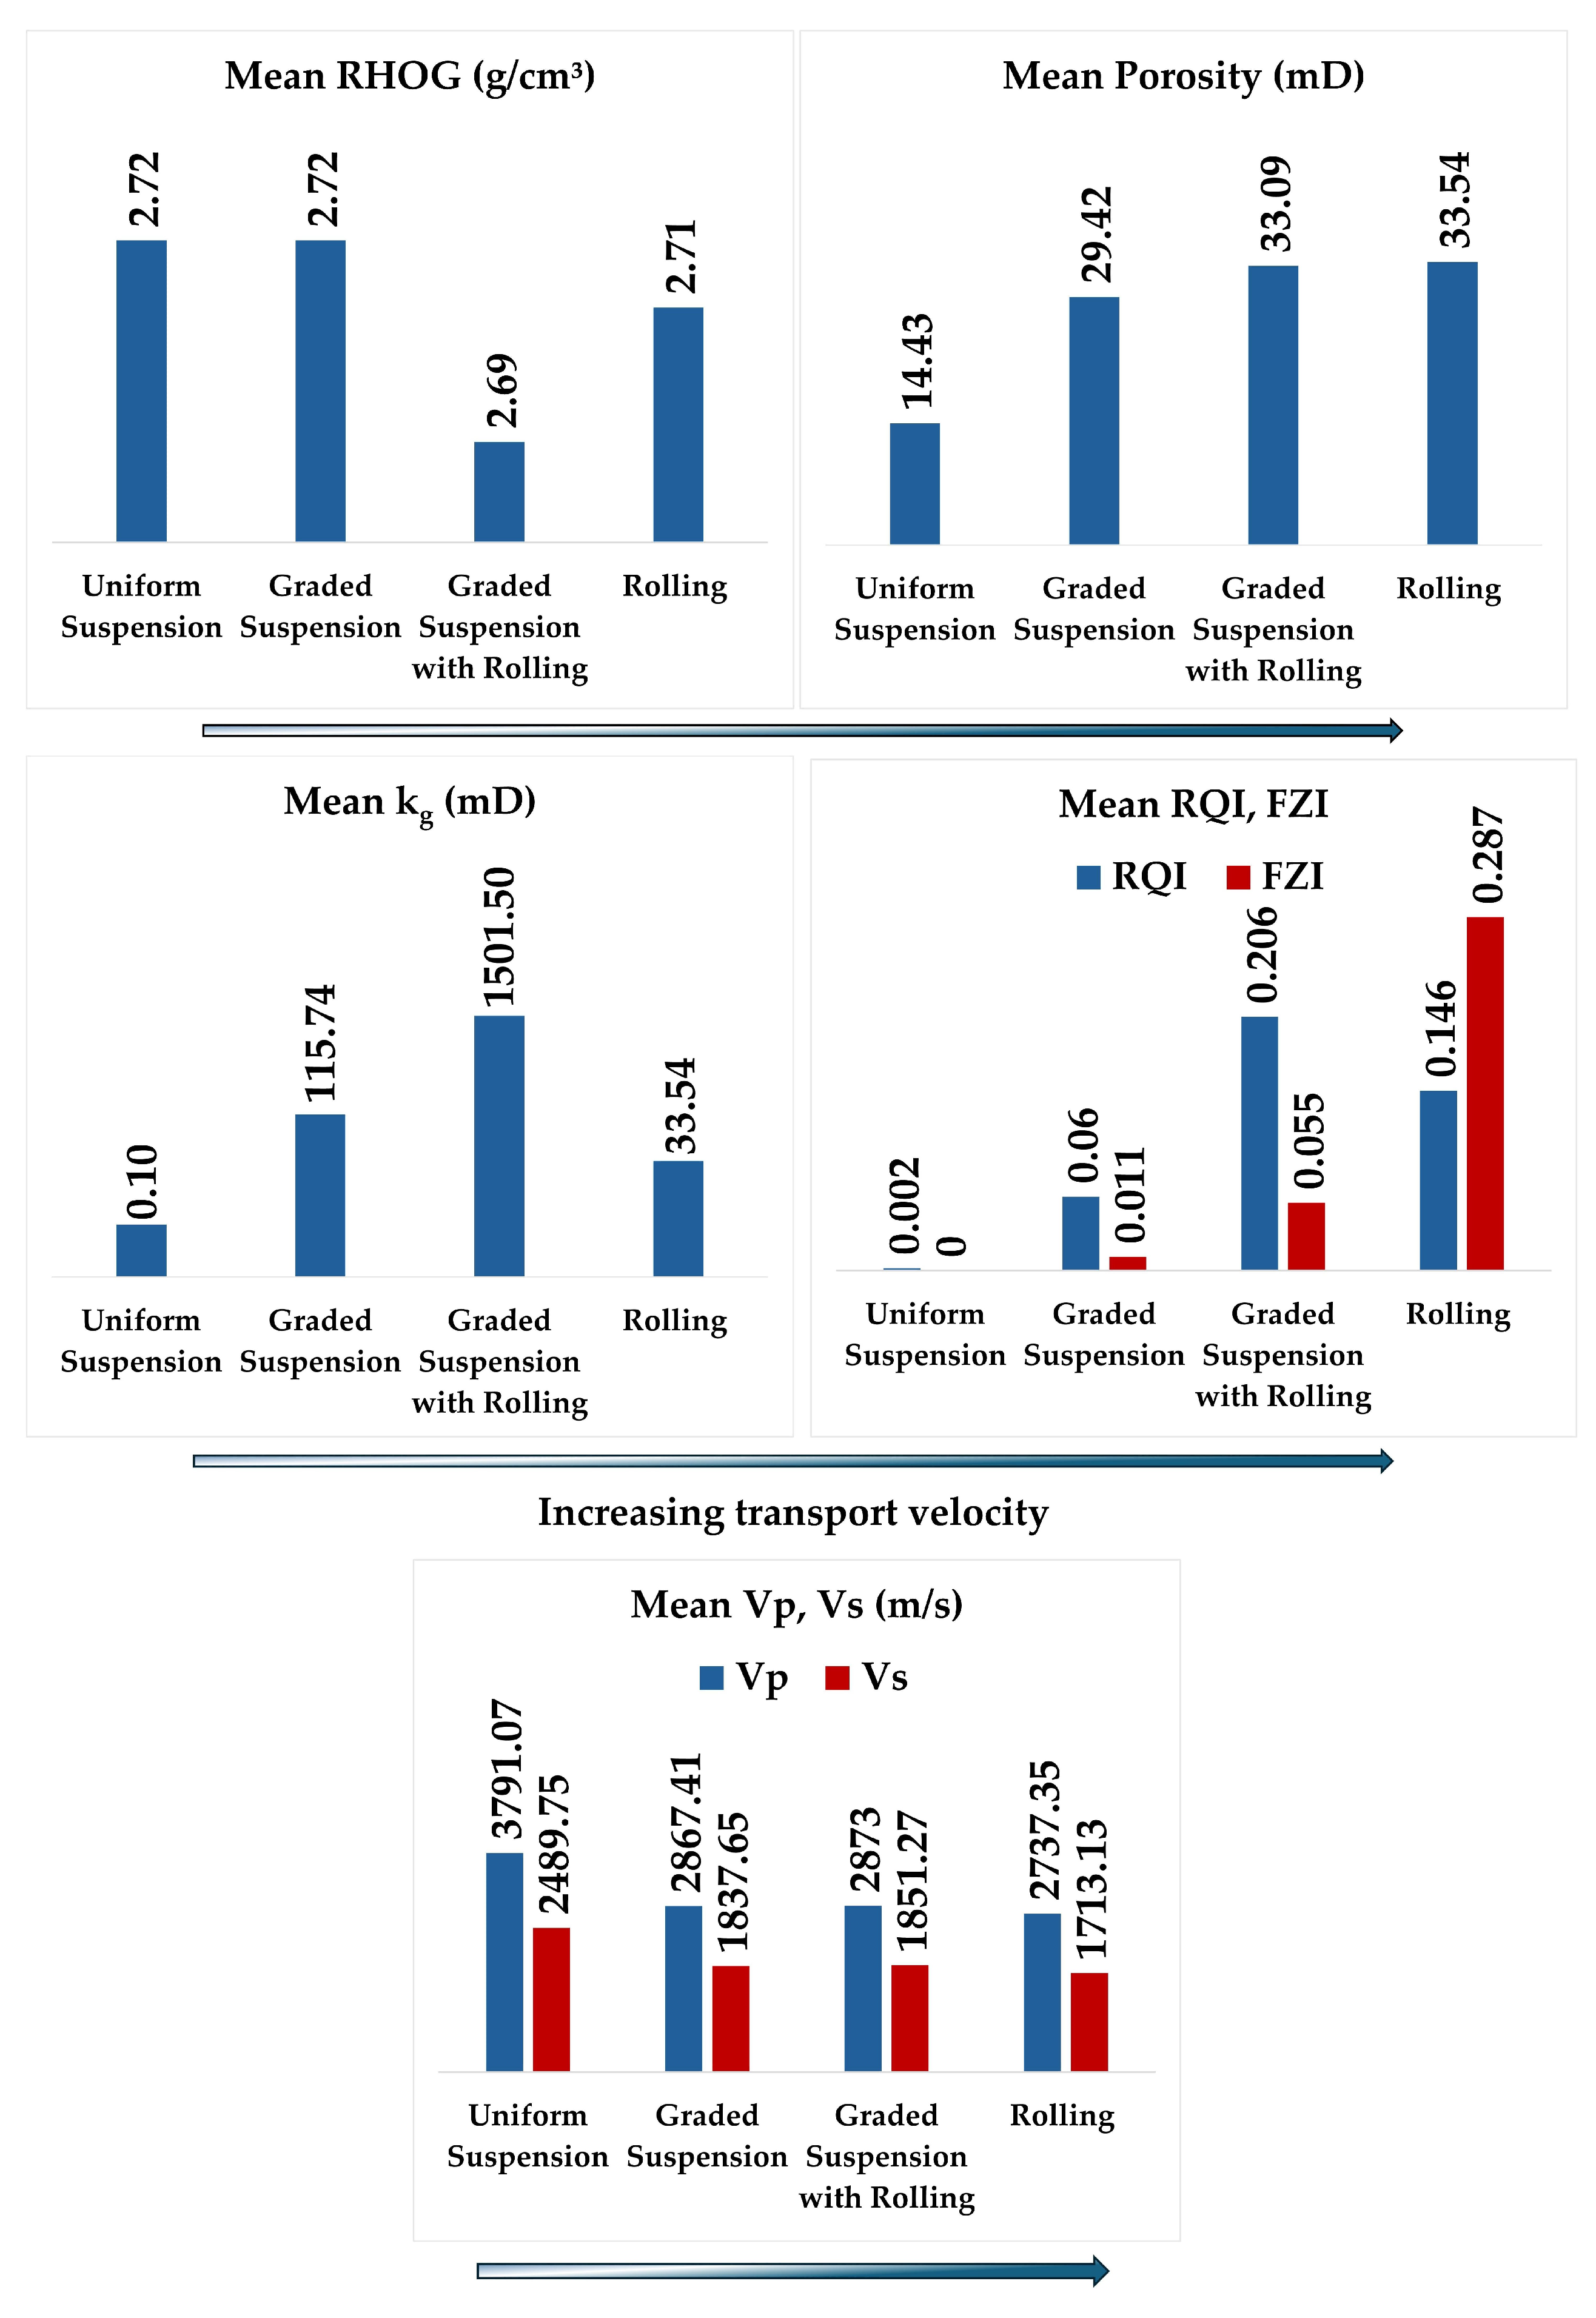

Disclaimer/Publisher’s Note: The statements, opinions and data contained in all publications are solely those of the individual author(s) and contributor(s) and not of MDPI and/or the editor(s). MDPI and/or the editor(s) disclaim responsibility for any injury to people or property resulting from any ideas, methods, instructions or products referred to in the content. |
© 2026 by the authors. Licensee MDPI, Basel, Switzerland. This article is an open access article distributed under the terms and conditions of the Creative Commons Attribution (CC BY) license.