


Abstract
Phase-change materials (PCMs), such as paraffin wax, are widely used in latent heat storage (LHS) because they store substantial thermal energy at nearly constant temperature; however, their low thermal conductivity limits heat transfer and slows melting/solidification. In this work, two flat-plate solar collectors are coupled with a paraffin-based LHS unit for low-temperature solar heating, and the design is optimized by introducing improved fin-geometry combinations on both the heat transfer fluid (HTF) tube and shell side. The M-shaped fins combined with rectangular fins significantly enhanced convective heat transfer by generating localized vortices, while the extended surface area improved conduction within the solid PCM, facilitating efficient heat dissipation and accelerating the phase transition. The LHS unit without fins showed complete melting in 67 min. However, fin introduction remarkably mitigated charging duration to 44 min, 52.3% faster than bare tubes having no fins. The experimental melting process exhibited a 7 min delay by comparing experimental and numerical results, achieving complete melting in 51 and 44 min, respectively. Discharging was completed in 48 min. During PCM charging, sensible heating produces a rapid temperature rise with only a small energy increase, but once the PCM entered into the melting range (320–324 K), the energy changed more steeply. Adding fins boosts stored energy from 2.10 MJ to 3.25 MJ (54.8%) and exergy from 0.15 MJ to 0.27 MJ (80.0%), yet exergy remains far smaller than energy (92.9% lower without fins and 91.7% lower with fins), indicating fins enhance total heat storage more than recoverable work potential.
1. Introduction
The energy crisis is one of the major issues of the modern day that needs to be dealt with sooner rather than later. With the constant rise in demand and shortage of fossil fuel, switching to clean renewable energy is the viable option to be researched upon [1,2]. Air pollution, primarily from fossil fuel combustion in vehicles and power plants, leads to severe health issues, high greenhouse gas emissions contributing to climate change, and significant environmental degradation [3,4]. A study conducted in 2022 reported a marked global decline in reliance on fossil fuels, including in developing and less-developed nations, as energy systems increasingly shifted toward renewables such as solar and wind [5,6]. Solar energy is an effective solution to tackle higher energy demands; however, the intermittent nature of solar resources needs a sustainable energy storage unit. Thermal energy storage (TES) is one of the solutions. These systems store and release energy quickly, typically within seconds or minutes [7,8].
1.1. Phase-Change Materials and Effectiveness of TES
They feature fast response times, high power density, and excel in short discharge durations, making them ideal for rapid energy delivery during demand or supply fluctuations, though they are not suited for prolonged power supply [9,10,11]. Latent Heat Storage (LHS), a type of TES, utilizes Phase-Change Materials (PCMs) to store energy during phase transitions, such as melting or freezing. Unlike Sensible Heat Storage, it leverages latent heat from solid-to-liquid changes, providing higher energy density and improved temperature regulation. This makes it an efficient and effective method for thermal energy storage and management [12,13]. Even though phase-change materials (PCMs) face drawbacks, such as a relatively narrow operating temperature window, higher upfront cost, and some energy losses, their benefits (better energy efficiency, potential lifecycle cost reduction, improved system reliability, and environmental advantages) generally outweigh these limitations [14,15,16]. A key challenge is that most PCMs have inherently low thermal conductivity; therefore, many researchers focus on improving heat transfer using nano-enhanced PCMs for thermal energy storage applications. Both organic and inorganic PCMs are employed, each with practical temperature constraints. Inorganic PCMs, in particular, are well-suited to higher-temperature duties and can often withstand thousands of melt–freeze cycles with minimal degradation [17,18]. PCMs have been investigated in a wide range of uses, including thermal management of electronic devices [19,20], building and envelope systems [21,22,23], waste-heat recovery [24,25,26], and solar thermal energy storage [27,28,29]. Numerous studies have also examined different TES configurations and optimization strategies involving PCMs [30,31]. For waste-heat recovery and solar thermal systems, researchers have explored combinations of conductive inserts/metals (e.g., aluminum and copper), carbon-based materials (e.g., carbon brushes), and PCMs such as paraffins and stearic acid. Recent results highlight that natural convection can strongly govern the melting process: increasing the fin number and fin length typically yields major performance gains, whereas fin thickness and fin orientation tend to produce comparatively smaller effects. The focus on heat-exchanger-dominated TES architectures, including submerged finned-tube assemblies within RT50, with both PCM selection and operating parameters, are experimentally examined for their influence on overall thermal response [32]. For enhancement strategies, researchers are exploring non-traditional fin shapes and multi-configuration layouts often coupled with additional techniques such as nanoparticle additives or radiative effects to shorten freezing/melting times and improve transient behavior [33,34]. Likewise, computational studies along with experimental results were conducted for assessing combined multiple fin arrangements in RT50 PCM and identifying designs that better exploit buoyancy-induced circulation during melting. In some models, researchers further integrate flow control features (such as baffles) and multi-temperature PCM staging to increase utilization and stabilize outlet conditions [35]. A few studies based on several investigations which compared finned RT50 tanks with conventional sensible media (e.g., water or gravel) showed that PCM-based tanks can maintain a usable temperature level for longer periods and achieve higher stored-energy density under similar constraints [36].
1.2. Improvements in Thermal Performance of TES Unit
Mahad et al. conducted research regarding the impact of the number of heat transfer fluid (HTF) tubes on the discharging and charging duration of a triple pipe heat exchanger. HTF tubes incrementally reduced the charging times, remarkably showing the positive influence of numerous tubes on the thermal performance of the LHS unit [37]. Storage of thermal energy for space heating and cooking applications was investigated to propose a suitable solution to eliminate the use of methane for cooking [38]. Experiments were conducted on a heat storage device equipped with multiple pipes to investigate the influence of natural convection on phase transitions. The findings indicated that the presence of multiple convection zones notably enhanced the phase-change process [39]. Additionally, a numerical analysis on a shell-and-tube PCM-based storage system demonstrated that the geometric arrangement plays a crucial role in regulating charging and discharging rates, ultimately improving heat distribution efficiency [40]. Thermal performance enhancement of LHS units is key for large-scale application, with various experimental and theoretical strategies explored. Jegadhees et al. reviewed these enhancement techniques in different LHTS configurations, focusing on their impact on phase transition rates and heat storage efficiency [41]. Gasia et al. [42] studied a commercial paraffin with a 58 °C melting point as a phase-change material for industrial waste-heat recovery and domestic hot water. Laboratory tests, including DSC, TGA, and thermocycling, confirmed its thermal stability up to 80 °C for 1200 cycles. Pilot plant experiments in a shell-and-tube heat exchanger analyzed its thermal behavior under varying flow rates, revealing insights into heat transfer mechanisms, energy rates, and the impact of tank geometry on charging/discharging efficiency and time.
Hosseini et al. [43] conducted a computational analysis to explore the influence of extended surfaces on the charging process in a double-tube heat exchanger (HX). Their findings revealed that extending the length of the fins reduces the melting time (MT) and enhances heat density. The study emphasized that the heat extraction capability of the HX is closely tied to the fin length, especially during the initial stages of the charging process. Rathod et al. [44] found that a LHS unit using PCMs can enhance thermal energy storage for solar applications, but its effectiveness is limited by the low thermal conductivity of PCMs. This study investigates the impact of three longitudinal fins on a shell-and-tube LHSU, focusing on heat transfer augmentation through experimental analysis. Results indicate that increasing the heat transfer fluid inlet temperature significantly improves heat transfer rates, with the solidification time reduced by up to 43.6% due to fin installation. Similarly, Khan et al. [45] studied the impact of fin orientation on the performance of a horizontal LHS using stearic acid as the phase-change material. Numerical simulations reveal that Y-fin arrangements (θ = 30°) significantly enhance melting rates and energy accumulation compared to λ-fins (θ = 90°). High fin length-to-thickness ratios and increased HTF temperatures further improve melting performance, leading to proposed correlations for predicting melting and heat transfer. A few recent studies that evaluated the leakage behavior of molten PCMs (e.g., leakage quantification, containment/shape-stabilization and encapsulation approaches), and also the degree of solidification/solid fraction evolution during discharge, highlighted how incomplete solidification, supercoiling, and cycling effects can reduce recoverable latent heat and impact repeatability [46,47,48,49]. Although LHS units using organic PCMs are widely analyzed numerically, the PCM–TES design decision (fin architecture, HTF temperature/flow, etc.) is still often guided by simulations that are not sufficiently validated against full charging–discharging experiments under realistic boundary conditions. In particular, many studies evaluated single fin concepts or reported melting (charging) enhancement only, whereas the same geometry can behave differently during solidification because conduction paths, buoyancy-driven flow, and the spatial progression of the phase front change with time. Consequently, there remains a technical gap in experimentally verifying whether combined fin geometries can simultaneously shorten charging and discharging durations while maintaining spatially uniform heat transfer from the HTF to the PCM, which is critical for predictable TES performance, reduced local thermal resistance, and repeatable outlet-temperature profiles. To address this gap, the present work provides experimental-numerical cross-validation for an organic PCM-based double-pipe LHS unit and introduces a hybrid fin arrangement consisting of an M-shaped fin combined with rectangular fins. The proposed configuration is designed to improve uniform heat dissipation from the HTF wall into the PCM volume by (i) distributing heat more evenly along the axial and circumferential directions, (ii) increasing effective conduction pathways into regions that typically remain thermally “inactive,” and (iii) promoting a more homogeneous melting/solidification.
2. Materials and Methods
This methodology section comprising two subsections; one belongs to the numerical analysis of LHS system and second is development of experimental testing setup. Validation study can be easily performed by comparing analysis results and experimental results. Evaluation of thermal performance of LHS system can be conducted by using RT50 (Rubitherm Technologies GmbH., Berlin, Germany) because experimental testing will reveal difference in heat transfer. Flat-plate collectors (FPCs) connected in series (2×) can deliver outlet temperatures up to 85 °C ideally, providing sufficient driving temperature difference to overcome thermal resistances and achieve effective latent heat charging. A higher-melting PCM would reduce/inhibit melting under typical conditions, while a lower-melting PCM would not maintain the desired storage temperature level for the intended application. Results of numerical analysis and experiments will be compared to figure out variations in heat transformation. Data acquisition will be performed by utilizing thermal sensors at different locations of the storage tank. Environmental influence will be checked by monitoring data from thermal sensors. To simulate PCM solid–liquid melting in CFD, the enthalpy–porosity approach was utilized in which thermophysical properties of PCM are provided. The energy equation, the phase-fraction definition, the buoyancy treatment, and the momentum-damping term were used to evaluate the numerical heat transfer phenomenon for predicting more accurate real-life melting behavior of PCM.
2.1. Geometry of Experimental Setup
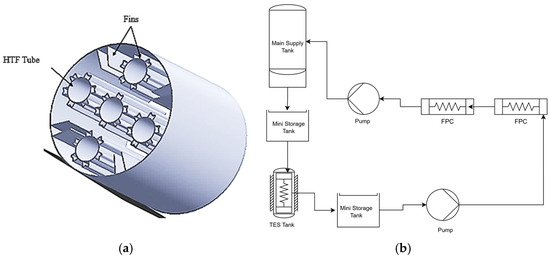
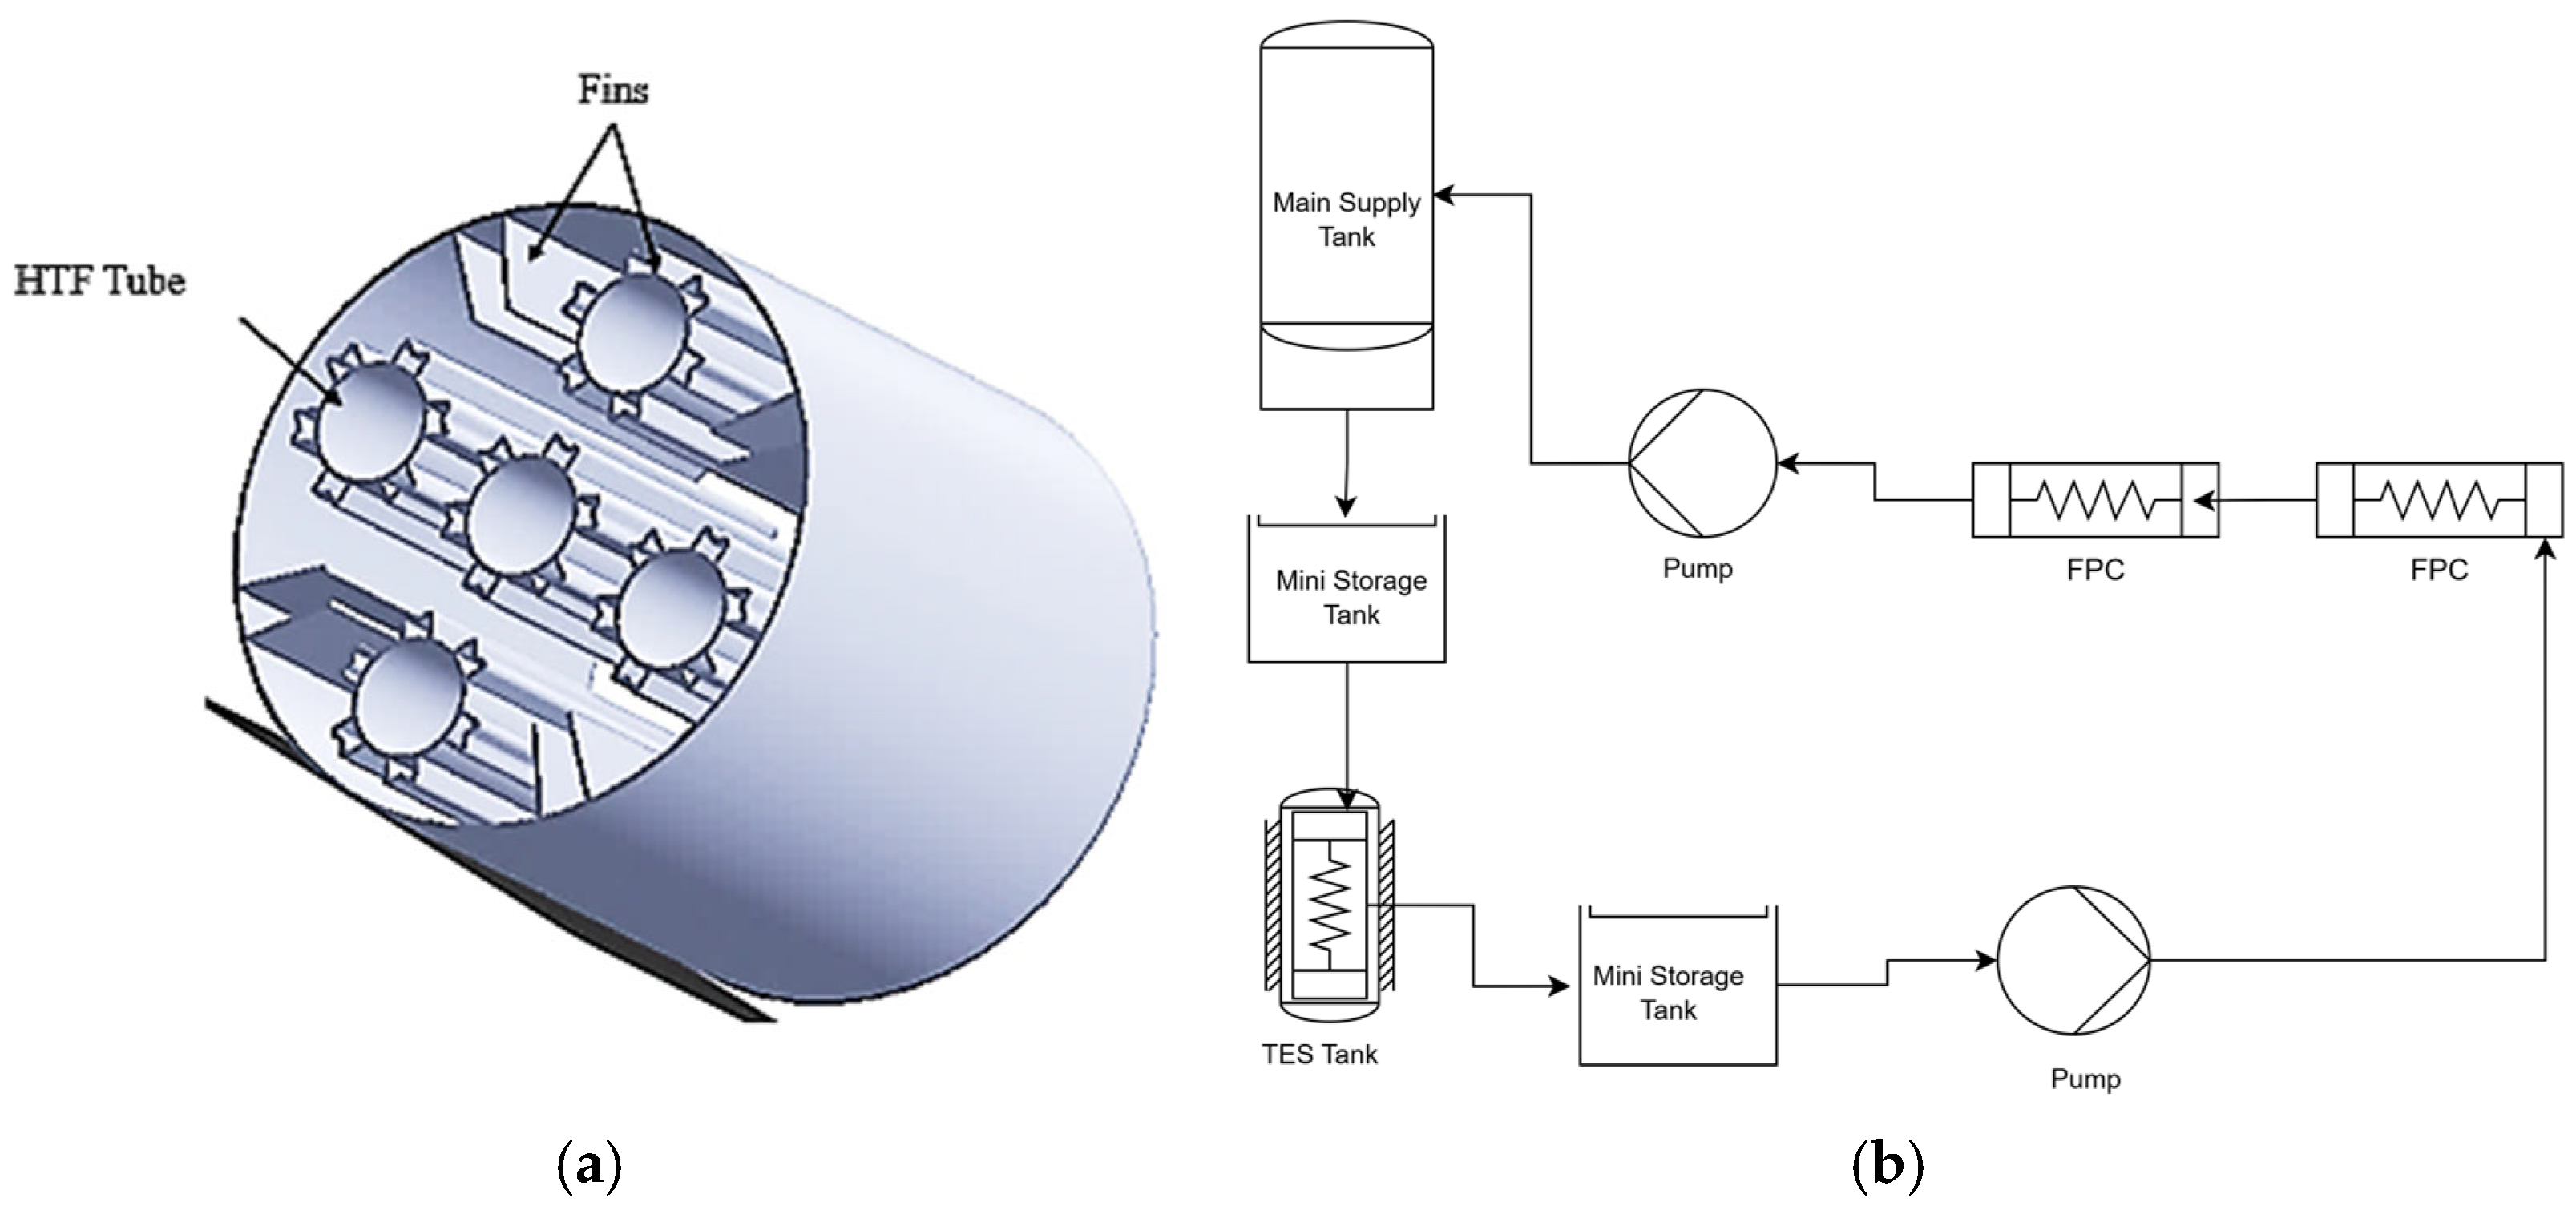
For the geometric configurations of LHS and the schematic of the complete system, shown in Figure 1a and Figure 1b respectively, 5× HTF tubes were utilized for maintaining uniform flow of HTF because the flow rate of HTF is significantly important for good heat transfer. Rectangular fins and M-shaped fins were used as extended surfaces for enhancement of the heat transfer from HTF to PCM and from PCM to the boundaries of the tank. All the rectangular fins were dimensionally equal; M-shaped fins were also the same in dimension with each other. A Proline Promag H 300 electromagnetic flowmeter (Endress+Hauser., Lorrach, Germany) was selected to measure the HTF flow rate because accurate, repeatable flow measurement is essential for a reliable CFD experimental validation. The meter provides stable readings for hot-water operation and minimizes additional pressure losses, enabling the flow setpoint to be maintained with low uncertainty during each test. The measured flow rate was continuously monitored and averaged over the steady period, and only data with negligible flow fluctuation were used for comparison. In the CFD model, the same inlet flow rate was imposed directly as an inlet boundary condition ensuring that both numerical and experimental cases were evaluated under identical hydraulic operating conditions.
Figure 1.
(a) Geometry of storage tank with integrated M- and rectangular fins (b) Schematic diagram showing complete process.
The complete unit was fabricated by using Stainless Steel, SS 304 (Jiangsu Mittel Steel Industrial Limited., Wuxi City, China) due to better corrosion-resistance properties. Further details regarding the size of the HTF tubes and the length of storage tank are mentioned in Table 1. Thermophysical properties of RT50 is taken from ref. [50] and HTF (water) are represented in Table 2 and Table 3, respectively. These properties are utilized for heat transfer analysis by using Ansys 2025 R2 Workbench (CFD). A comparison between different grades of paraffin wax, represented in Table 4, shows the difference in the melting point and latent heat values.
Table 1.
Dimensions of TES tank.
Table 2.
Thermophysical properties of paraffin wax [50].
Table 3.
Thermophysical properties of HTF (water).
Table 4.
Thermophysical properties comparison between different low-temperature grades of paraffin wax.
2.2. Assumptions and Limitations
In a mathematical formulation, the following assumptions are important to consider:
- (a)
- Flow of PCM and HTF would be laminar
- (b)
- For demonstrating incompressible viscous flow and heat transfer in a circular domain, it is appropriate to use the Navier–Stokes equations together with the thermal energy equation, since the viscous dissipation term is negligible due to its very small magnitude.
- (c)
- Equation (1) expressed the Boussinesq approximation for predicting behavior of PCM in natural convection mode
- (d)
- Y+ values near the wall were not fully suitable for this regime because the flow in the TES tank is highly viscous and predominantly laminar, whereas standard wall functions are primarily formulated for turbulent near-wall treatment; therefore, to ensure a smooth and physically consistent near-wall resolution, fine inflation layers were employed to better capture the boundary-layer temperature gradients and accurately resolve the near-wall heat transfer.
2.3. Governing Equations
The continuity constraint and the momentum balance are formulated in Equations (2) and (3a), respectively.
Continuity Equation:
Momentum Equation:
Equation (3b) includes a damping-related term derived from Darcy’s law, which is coupled with the momentum equation to ensure a smooth phase transition within the convection regime. The mushy-zone constant, Zmush, is typically taken in the range 10−4–10−7 in the present study, 10−6 is adopted. Equation (4) represented the energy equation for the complete system.
Here, H denotes the material enthalpy and is evaluated using Equation (5a), whereas the sensible enthalpy h is obtained from Equation (5b).
The latent heat contribution to the total energy can be expressed in terms of the latent heat L, as given in Equation (6).
The enthalpy increment ΔH varies from 0 to its minimum value being zero in the solid phase and reaching its maximum in the liquid phase. The liquid fraction (LF) is computed using Equation (7).
Exergy calculations were performed by using Equations (8) and (9) in which sensible and latent exergy are determined, similarly.
2.4. Boundary Conditions
The boundary conditions for the heat storage tank were designed to minimize fluctuations in heat transfer from the high-temperature fluid flowing through the tubes to the low-temperature PCM within the tank. To achieve this, the geometric configurations of the fins were meticulously selected to enhance heat transfer efficiency and ensure rapid melting (charging) of the PCM. Specifically, M-shaped fins were strategically attached to the HTF tubes to maximize heat dispersion, while rectangular fins were affixed to the tank body to facilitate uniform and rapid heat distribution. This arrangement effectively mitigates thermal gradients within the storage tank by strategically placing fins at various locations, addressing the inherent low thermal conductivity of the PCM. The addition of multiple extended surfaces plays a crucial role in enhancing heat transfer throughout the system, thereby reducing temperature inconsistencies and ensuring efficient thermal energy storage and retrieval. The storage tank was filled with paraffin wax, a PCM known for its reliable thermal properties. The HTF tubes were arranged in a strategic pattern: one tube positioned at the center and four additional tubes arranged in a circular configuration with a diameter of 120 mm. This arrangement ensures optimal heat transfer within the tank. Water was selected as the heat transfer fluid due to its widespread availability, cost-effectiveness, and well-established thermal characteristics, making it an ideal choice for the application. The flow rate of the HTF and the initial conditions remained constant in all numerical simulations. The inlet temperature of the HTF was set at a fixed value across all HTF tubes to assess the influence of various fin geometries. To minimize heat loss, the outer wall of the tank was treated as an adiabatic boundary. The boundary conditions are outlined below:
The inlet temperature of the HTF was maintained at a constant 373 K in all cases to evaluate the impact of different fin geometries. The tank’s external surface was designated as an adiabatic boundary to prevent heat loss. The boundary conditions are appended in Equations (10)–(14) below:
HTF heating inside tube:
Outer tank adiabatic wall:
Initial temperature:
2.5. Meshing
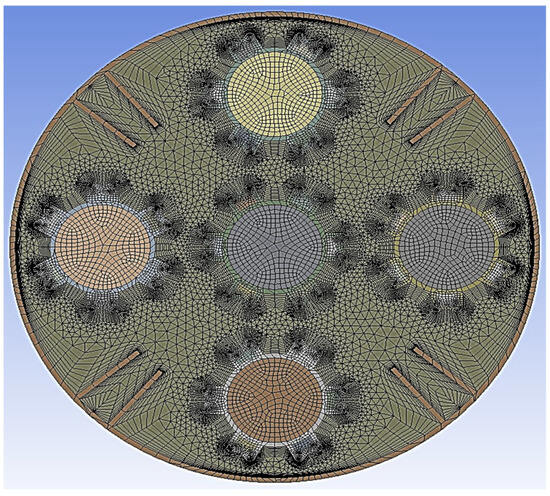
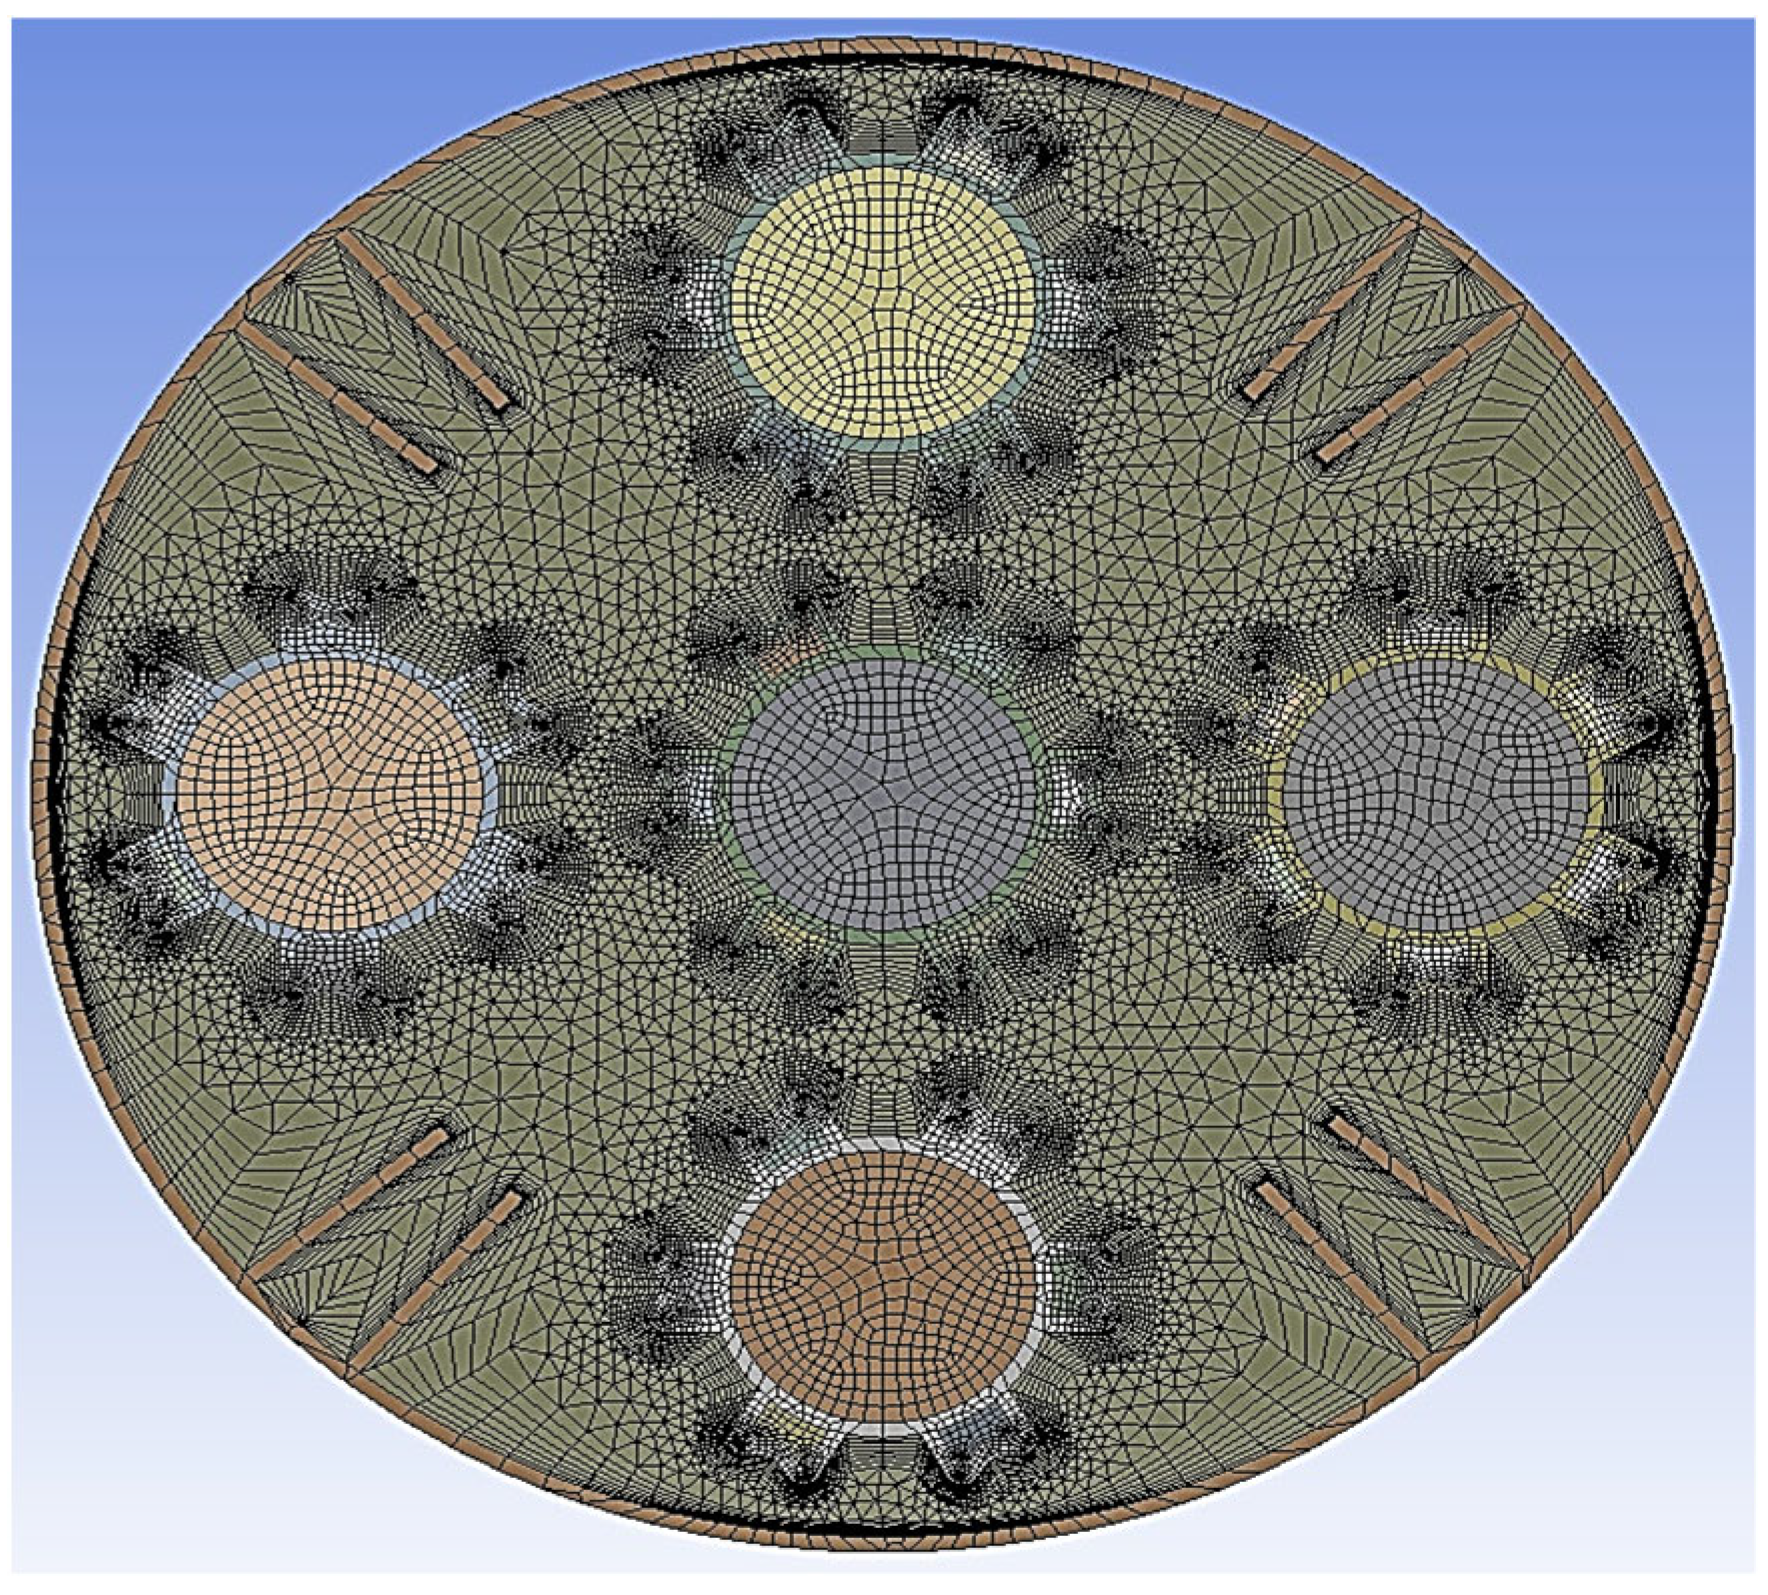
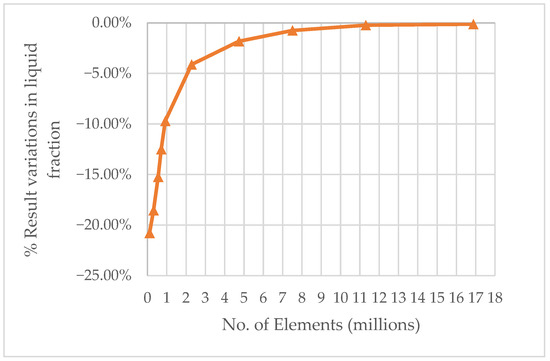
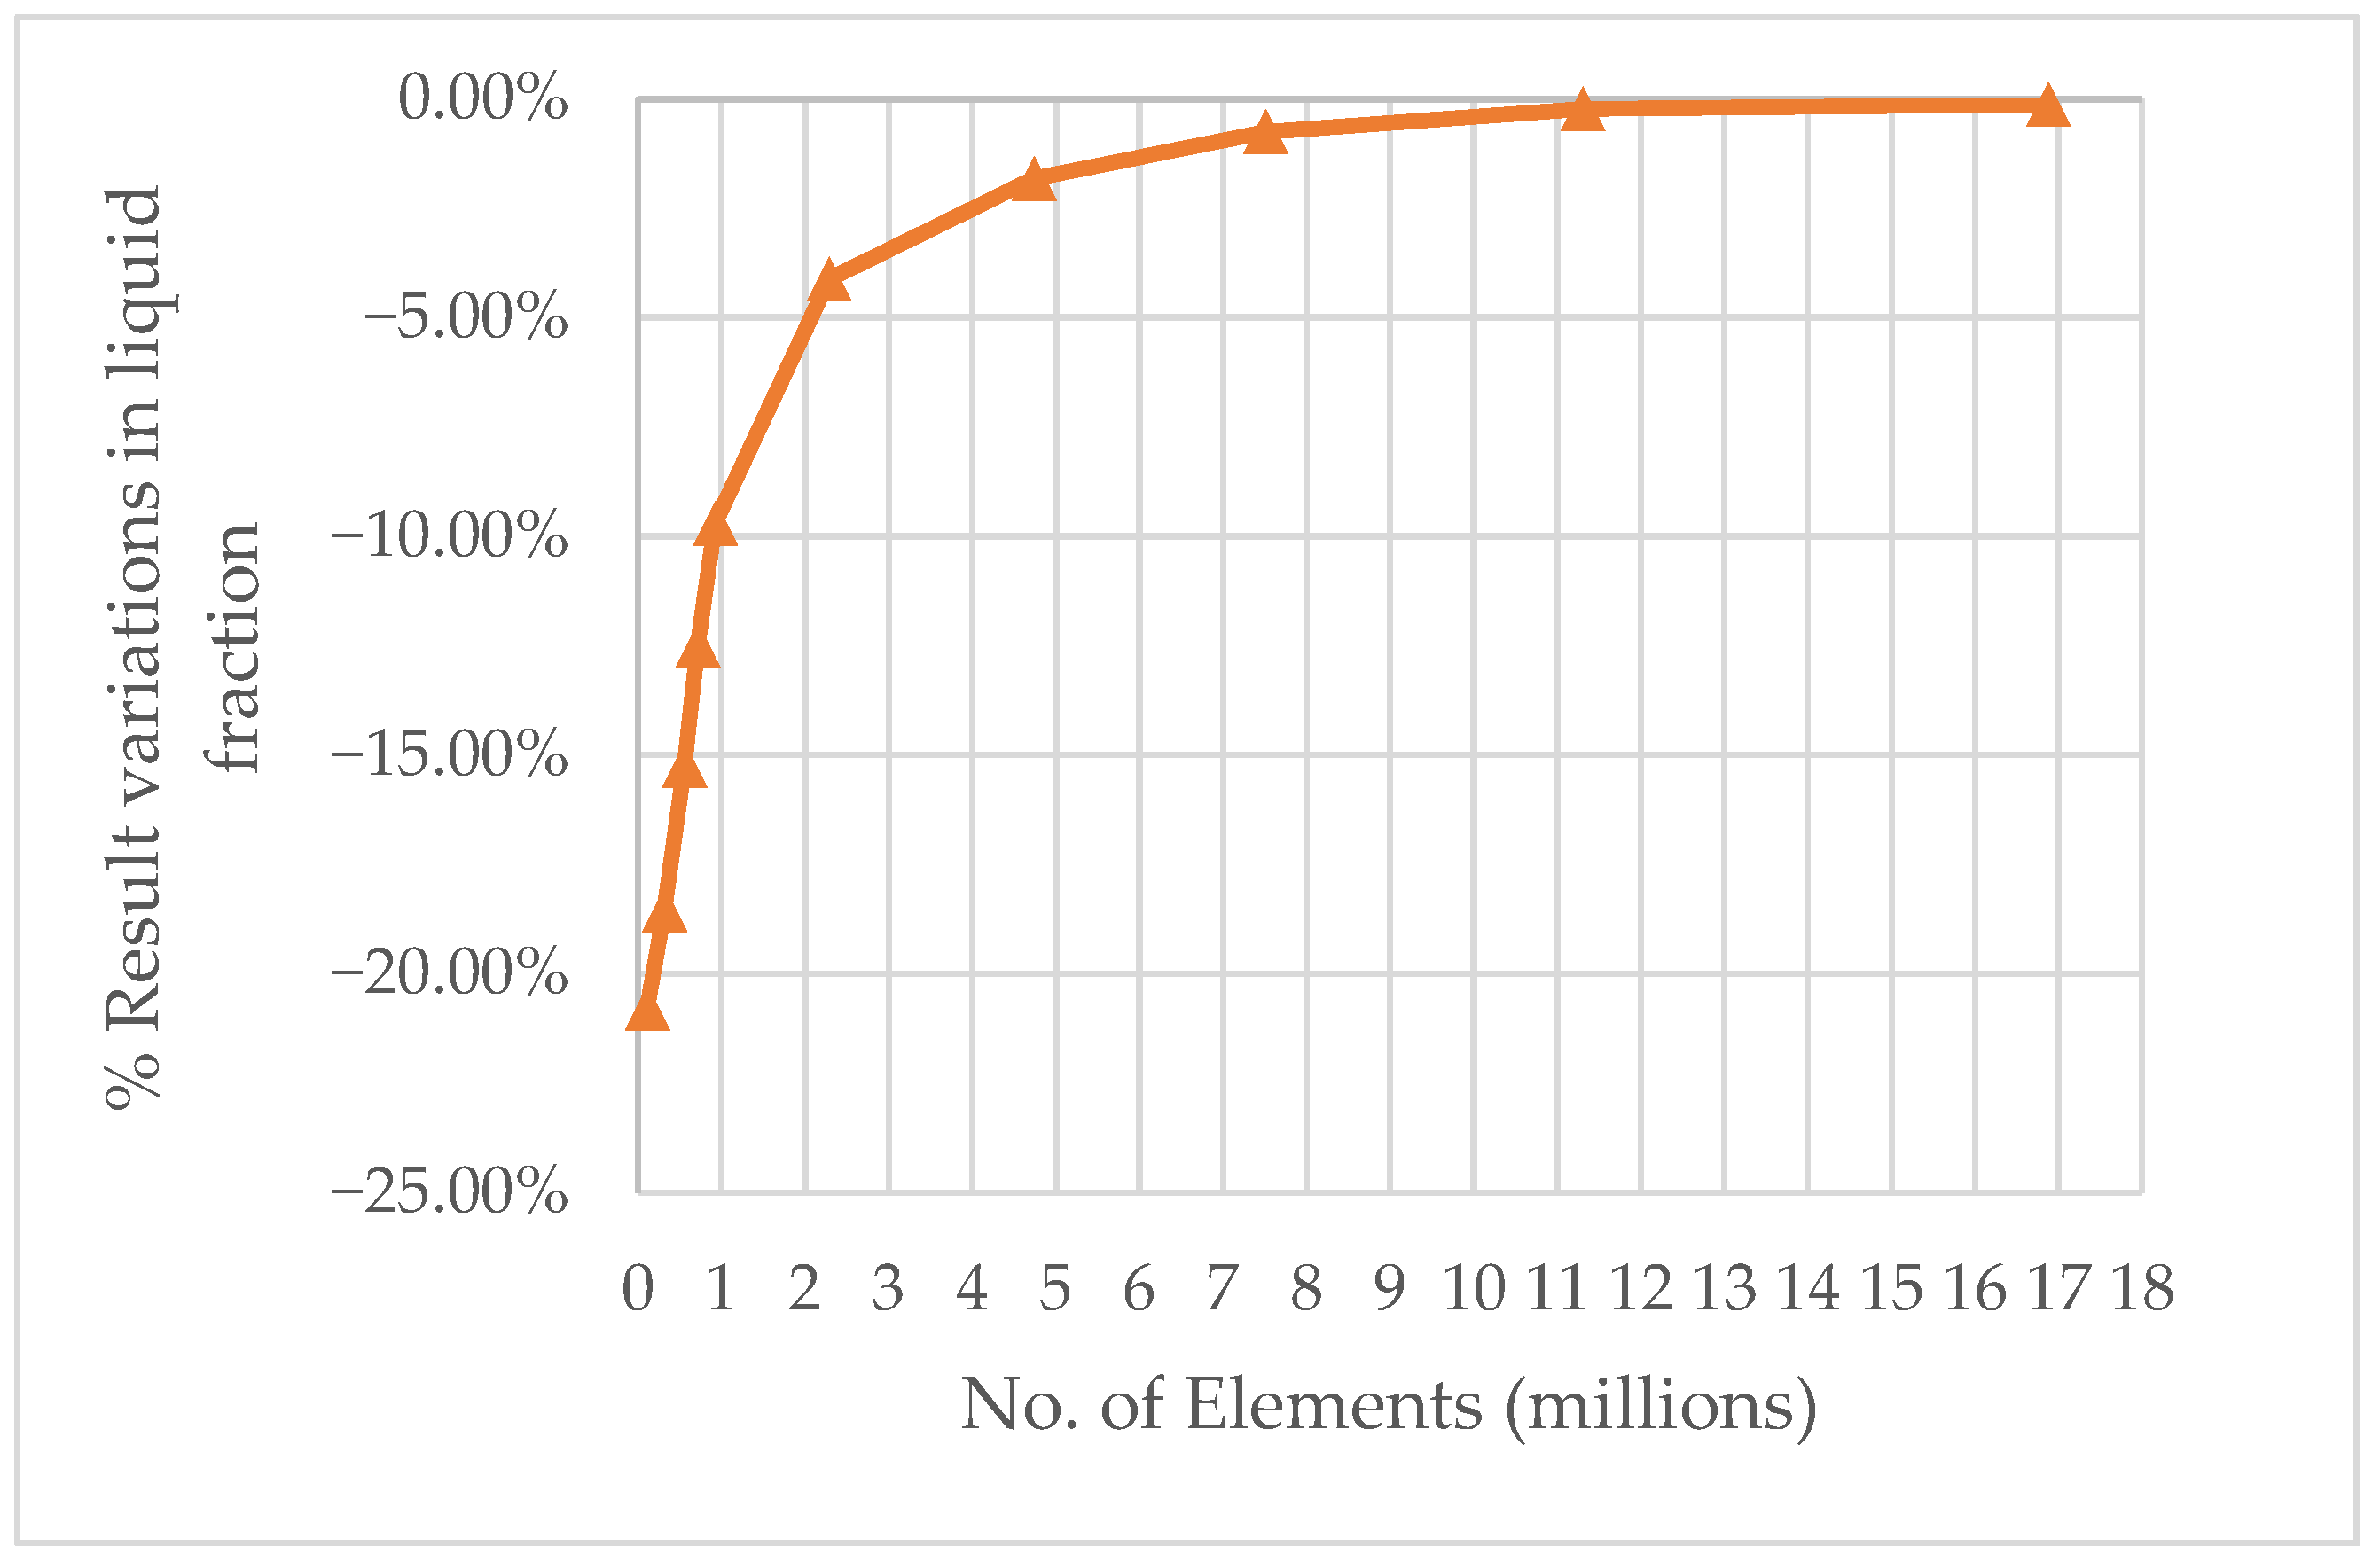
A mesh independence study was conducted to determine the minimum number of elements required for accurate results. It was found that 11.5 million elements were effective, as shown in Figure 2, since there was virtually no difference in results beyond this number. Further increasing the element count did not significantly improve the results but led to a substantial increase in computational requirements. Figure 3 displays the fine mesh, which is a hybrid of structured and unstructured grids. Triangular (unstructured) elements are used in regions where flexibility is essential, as they can easily conform to irregular shapes. These unstructured elements are placed near the HTF tubes and fins. A structured mesh is applied near the outer pipe to enhance accuracy, particularly near the walls. Additionally, an inflation layer is included near the outer wall to accurately predict heat transfer from the HTF tubes to the outer wall of the tank. The structured quadrilateral mesh inside the HTF tube ensures precise capture of flow parameters, such as temperature and flow rate. The unstructured mesh helps reduce computational cost, while the structured mesh provides higher accuracy. Therefore, unstructured elements are used in areas prone to grid distortions, such as the transition region where the mesh transitions from being unstructured to structured.
Figure 2.
Fine mesh with inflation layers.
Figure 3.
Mesh independence curve.
Numerical simulations were carried out using Workbench Fluent CFD to investigate the melting and solidification behavior of phase-change materials. The enthalpy–porosity method was employed to model the phase-change process.
The phase transition of PCM’s from solid to liquid encountered very low movement of PCM because it possesses a viscous state; hence, the laminar approach was selected for analysis. The governing equations were solved using the SIMPLE algorithm, and the momentum and energy equations were discretized using the QUICK scheme for differentiation. For pressure correction, the PRESTO scheme was applied. In the convergence criteria, tolerance values of 0.4 for pressure, 0.6 for velocity, and 0.99 for energy were set for the analysis.
3. Heat Transfer Analysis Results
Heat transformation from HTF tubes to PCM was investigated using CFD tool, rapid thermal transformation was possible by enhancing the internal structure of the storage tank. There is a strong requirement to improve the thermal conduction mode by using conductive materials for fins inside the tank.
3.1. Liquid Fraction Without Fins
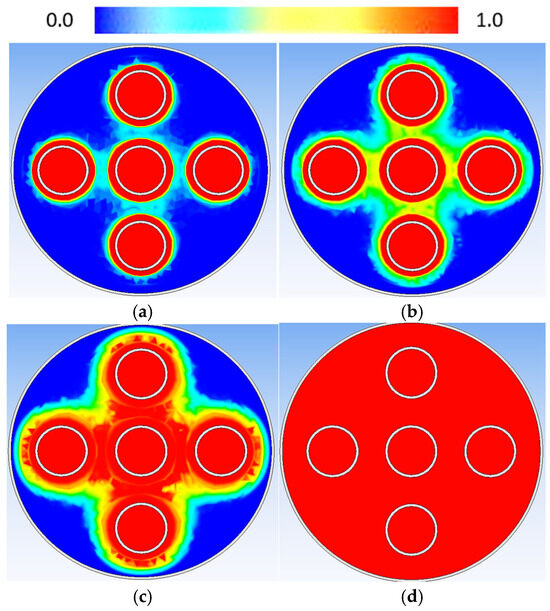
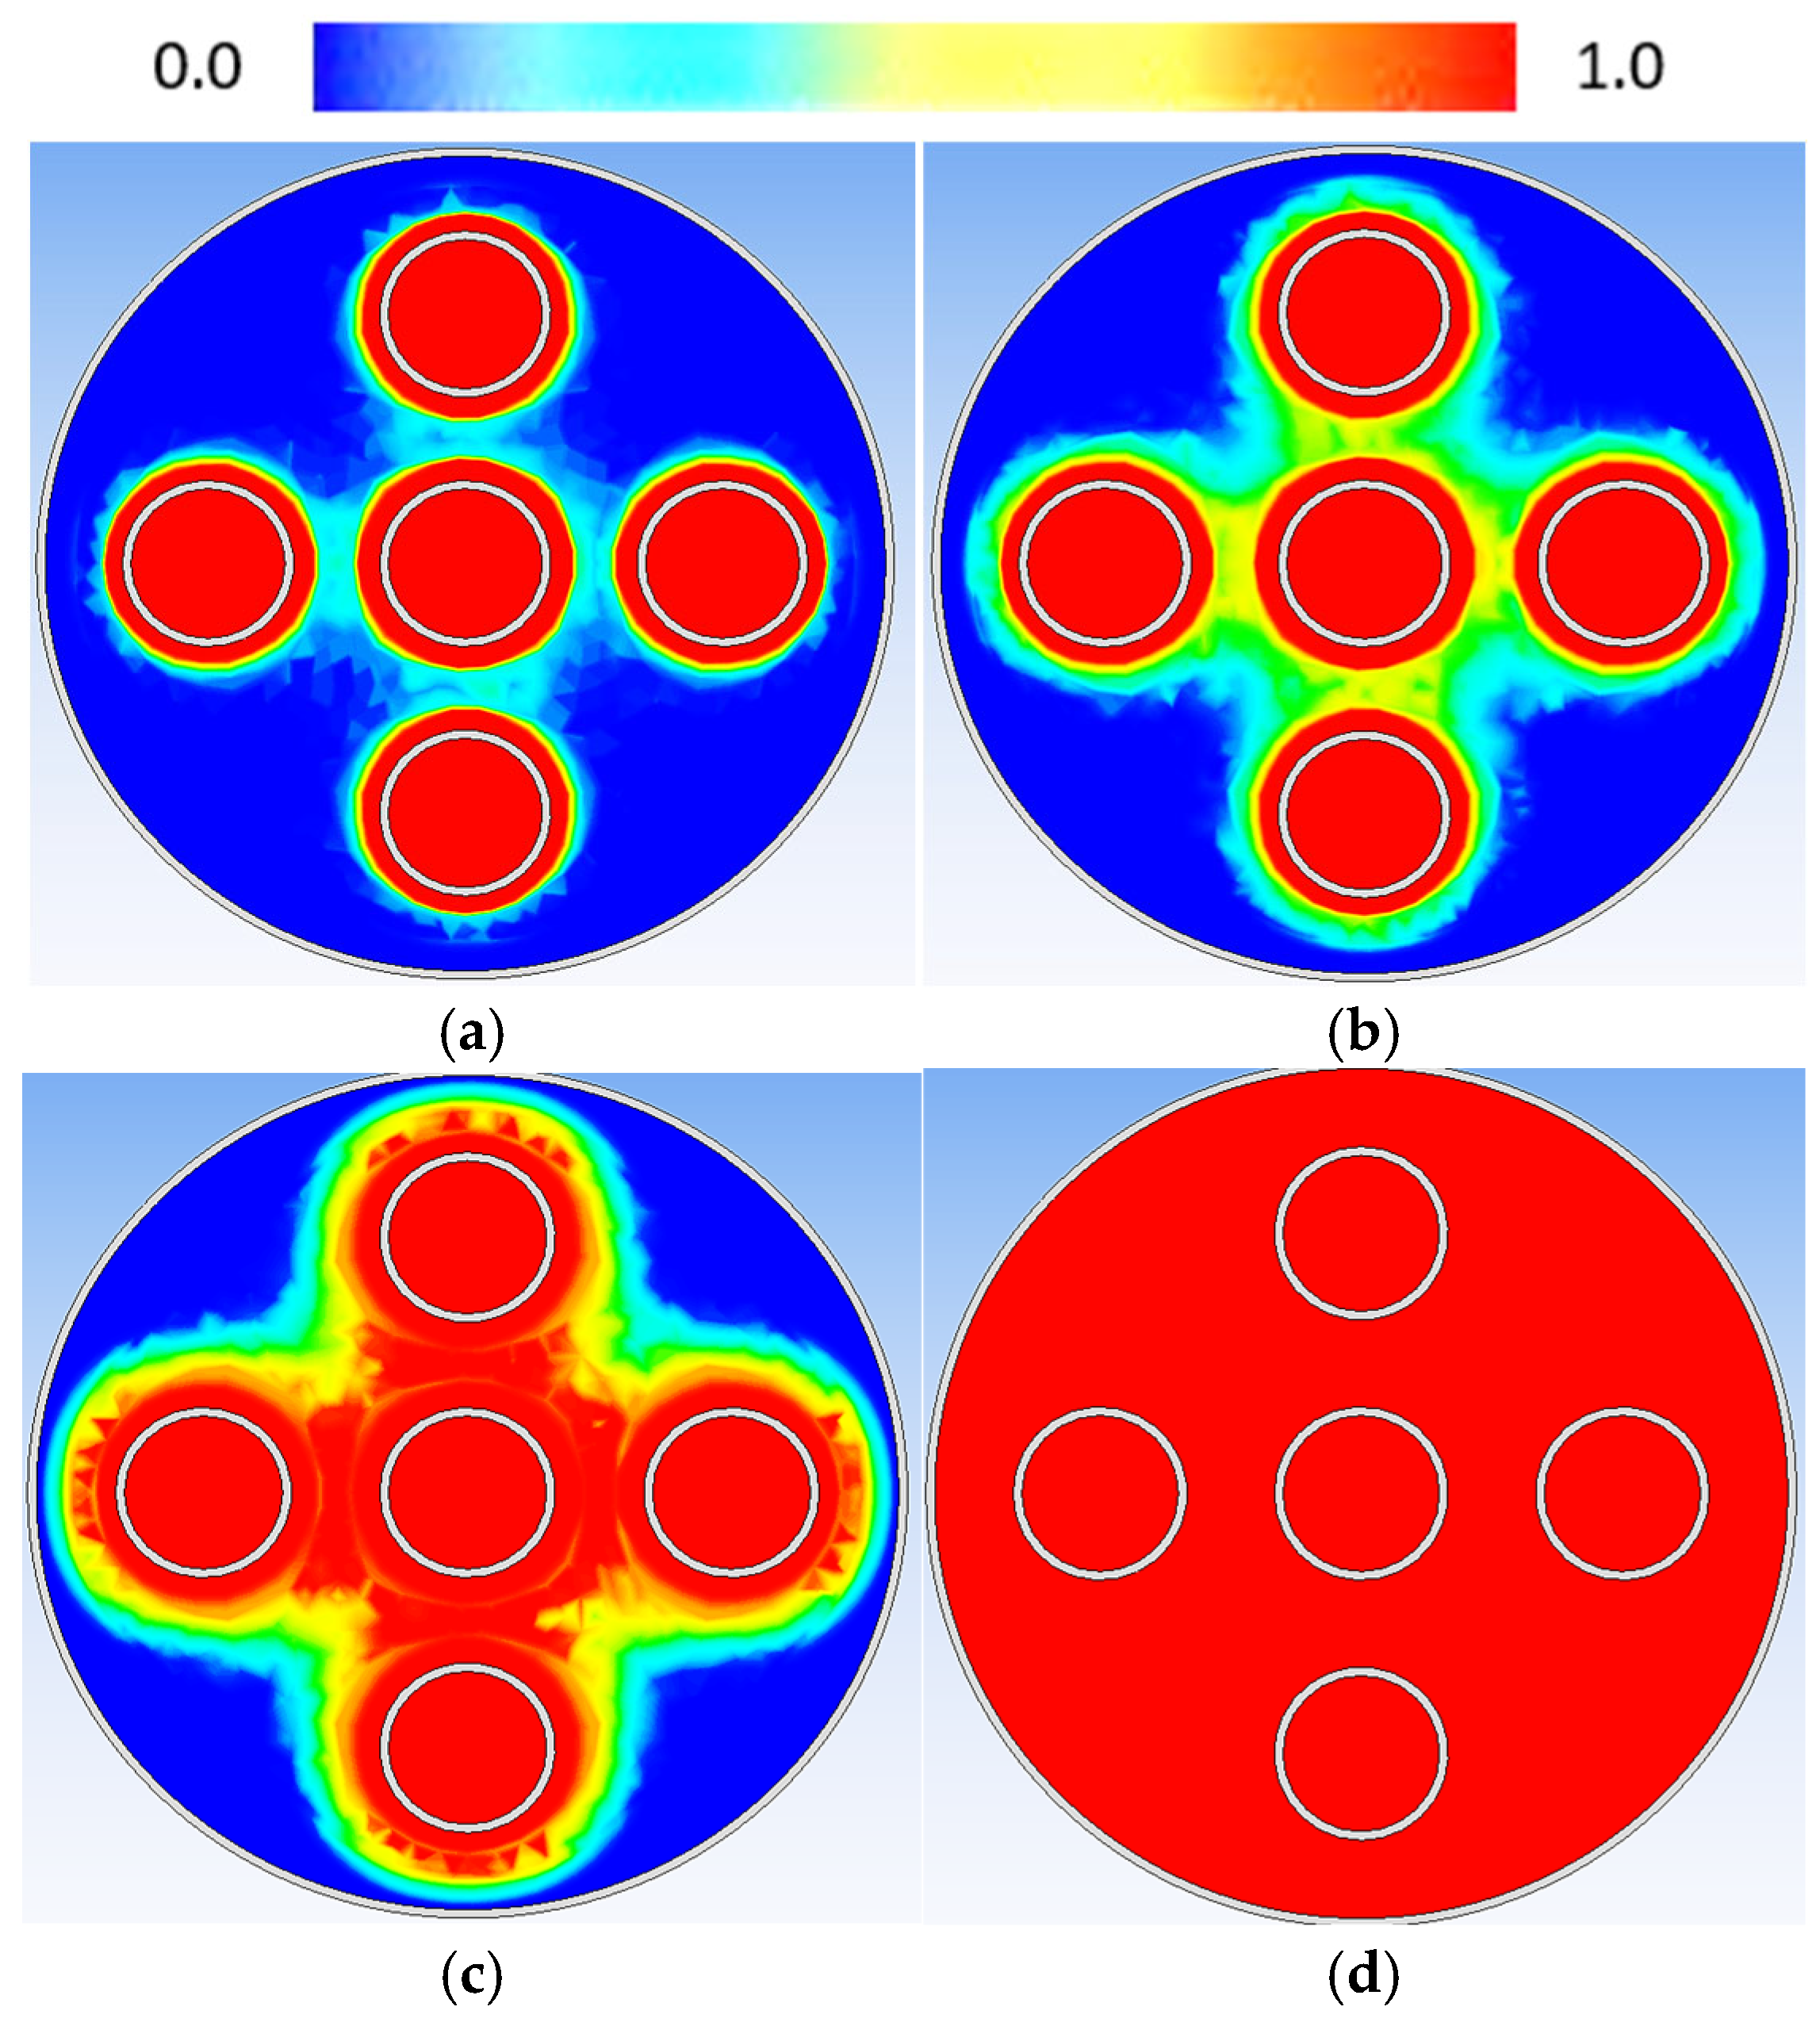
The initial investigation of the LHS unit focused on the charging behavior of PCM without fins. As shown in Figure 4, the melting process progressed slowly due to the low heat dissipation rate. Notable melting was observed around 35 min into the charging process, with approximately 40–45% of the solid PCM transitioning to a liquid. The slow heating was attributed to the poor thermal conductivity of the PCM. However, after 35 min, as shown in Figure 4c, the melting rate increased as the dominant heat transfer mechanism shifted from conduction to convection, accelerating the phase transition. This transition occurred smoothly as the heat transfer mode matured. A rapid phase shift was observed in areas near the HTF tubes, whereas regions farther from the tubes required more time to complete the phase transition. Complete melting was achieved after 67 min of charging.
Figure 4.
Liquid fraction after (a) 5 min (b) 20 min (c) 35 min (d) 67 min of charging.
3.2. Liquid Fraction After 5 min (300-Time Steps)
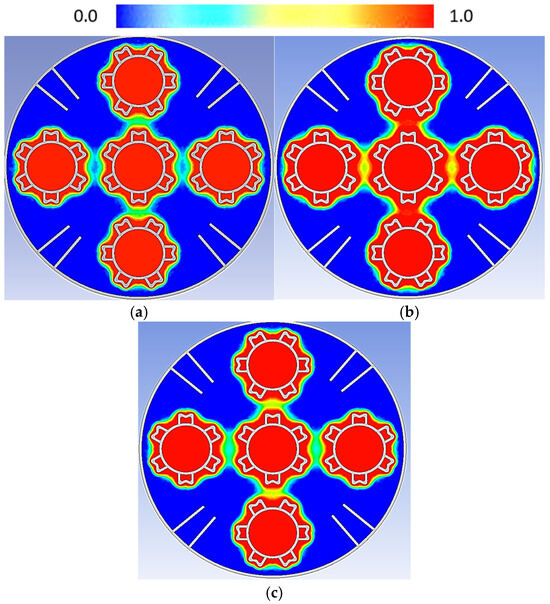
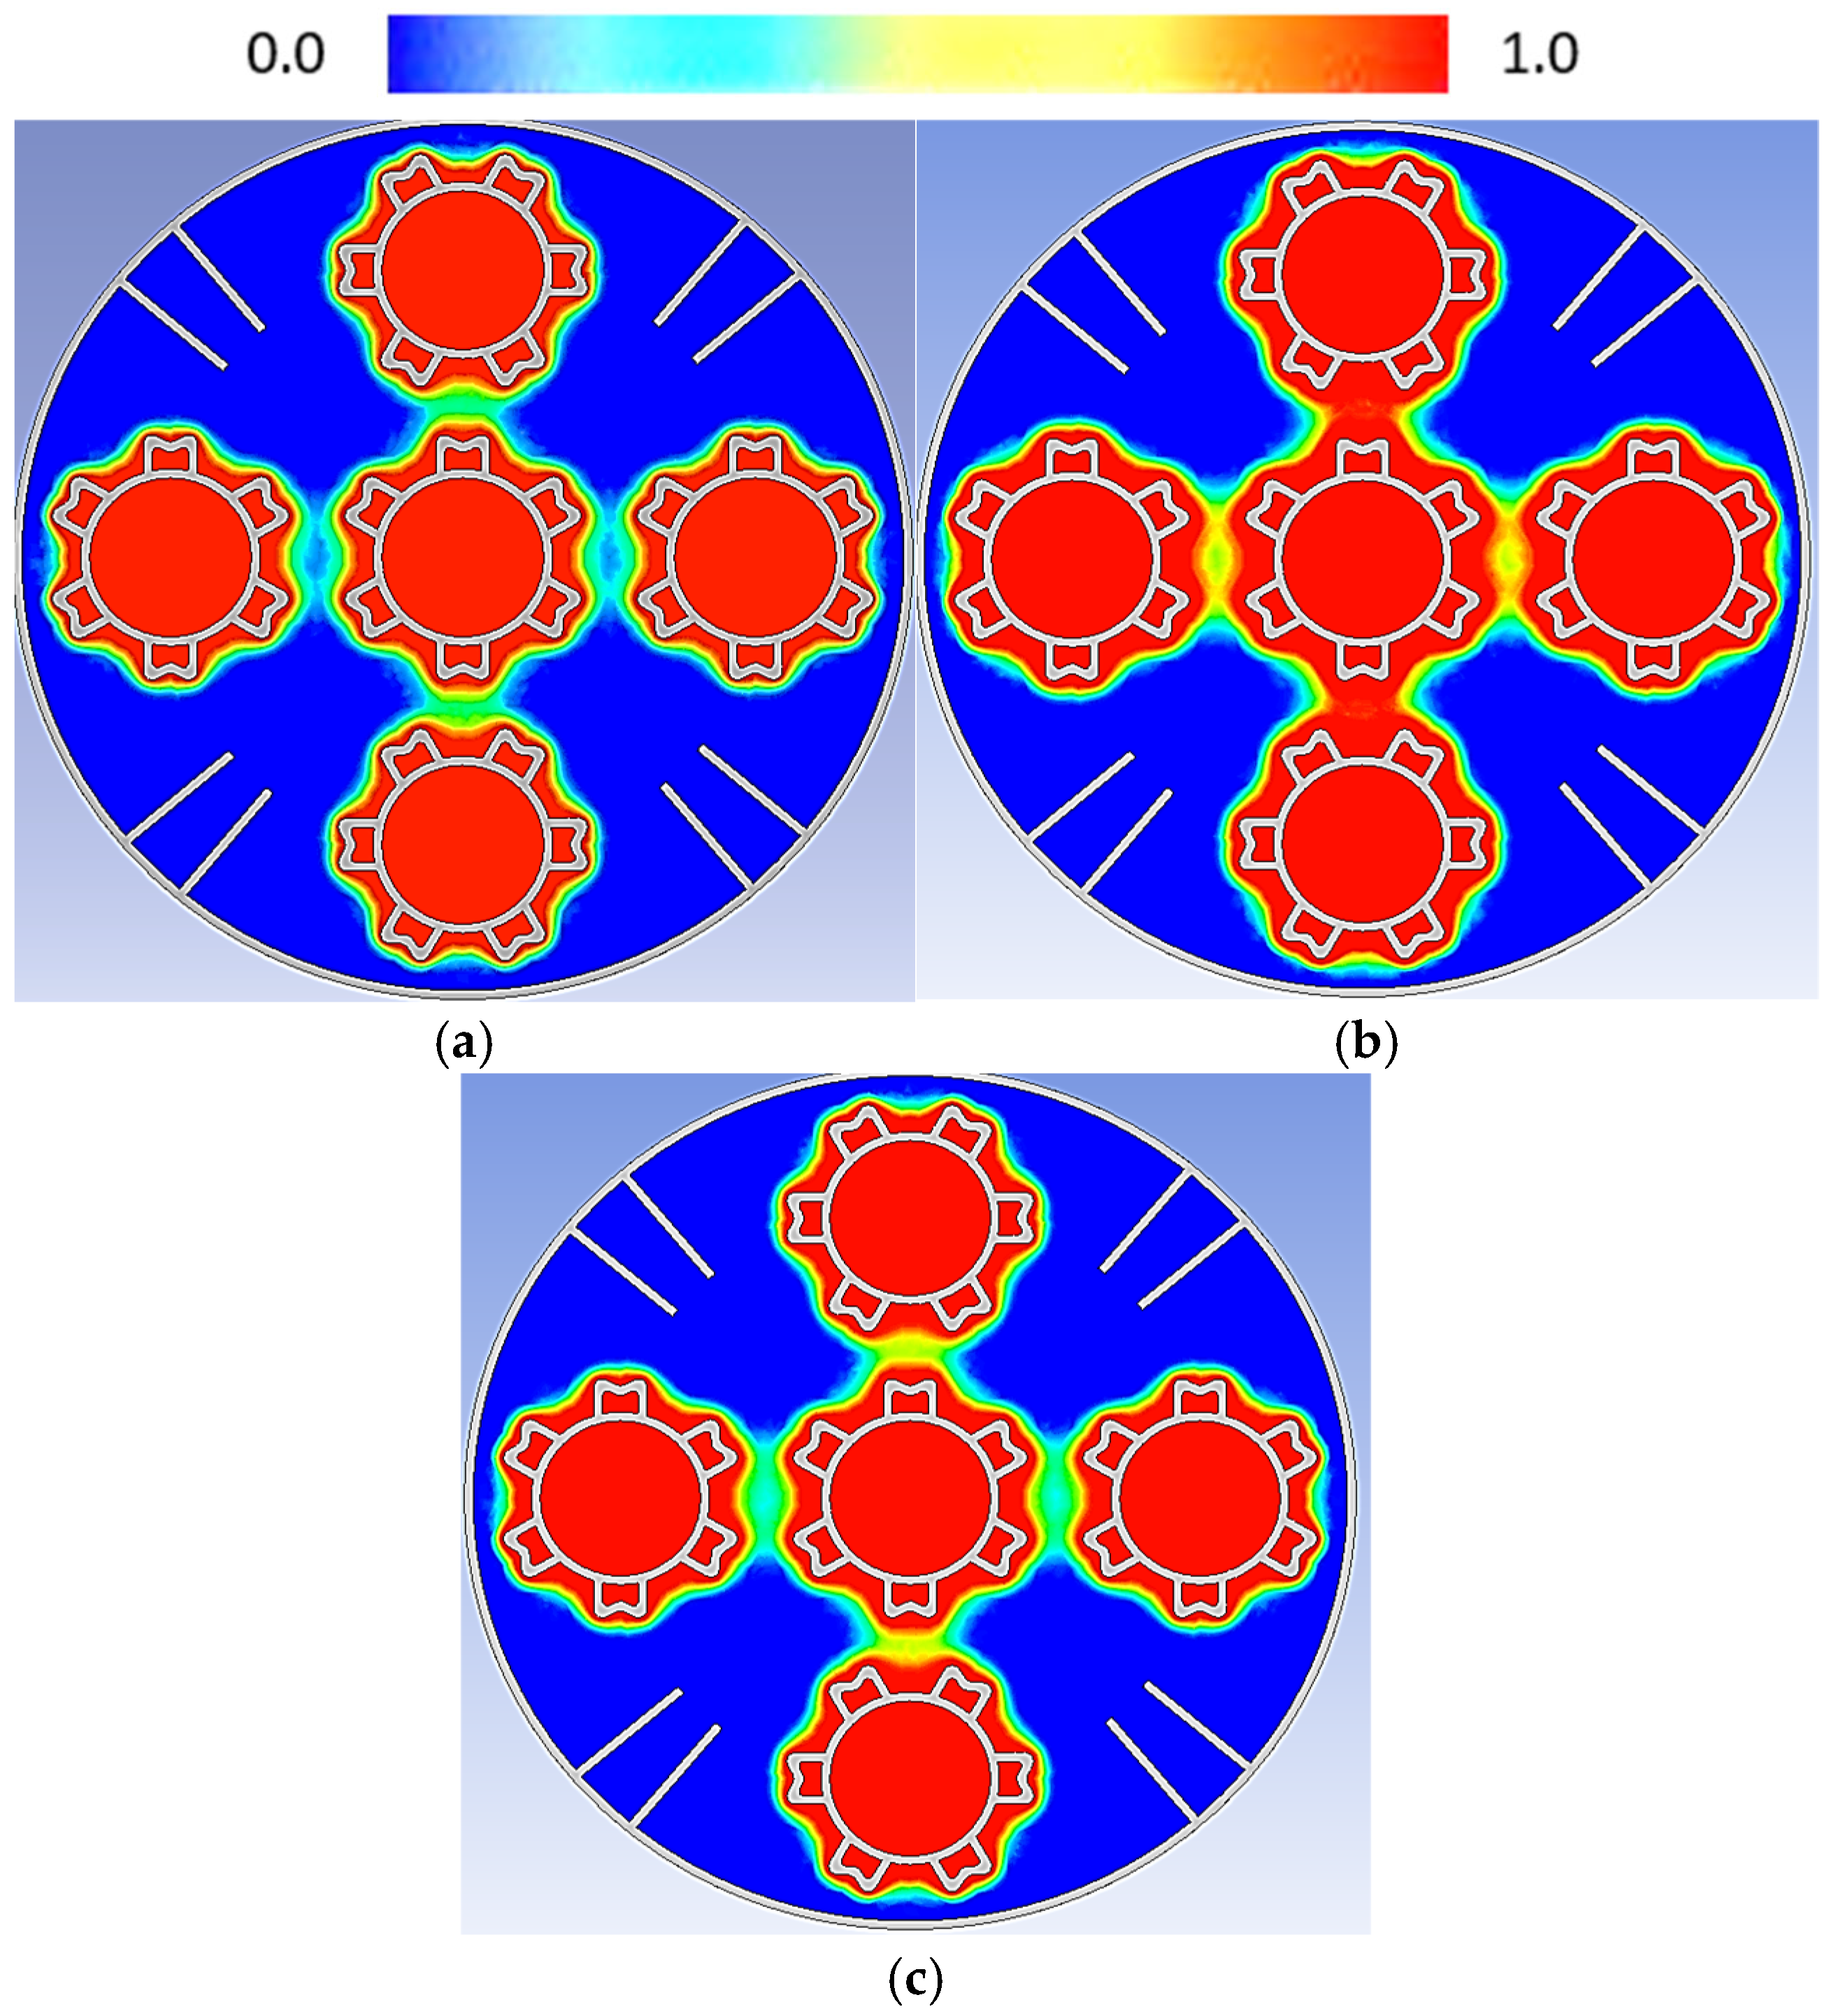
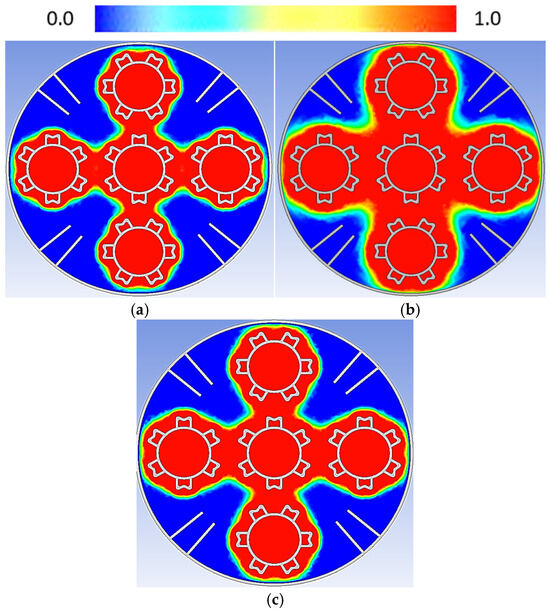
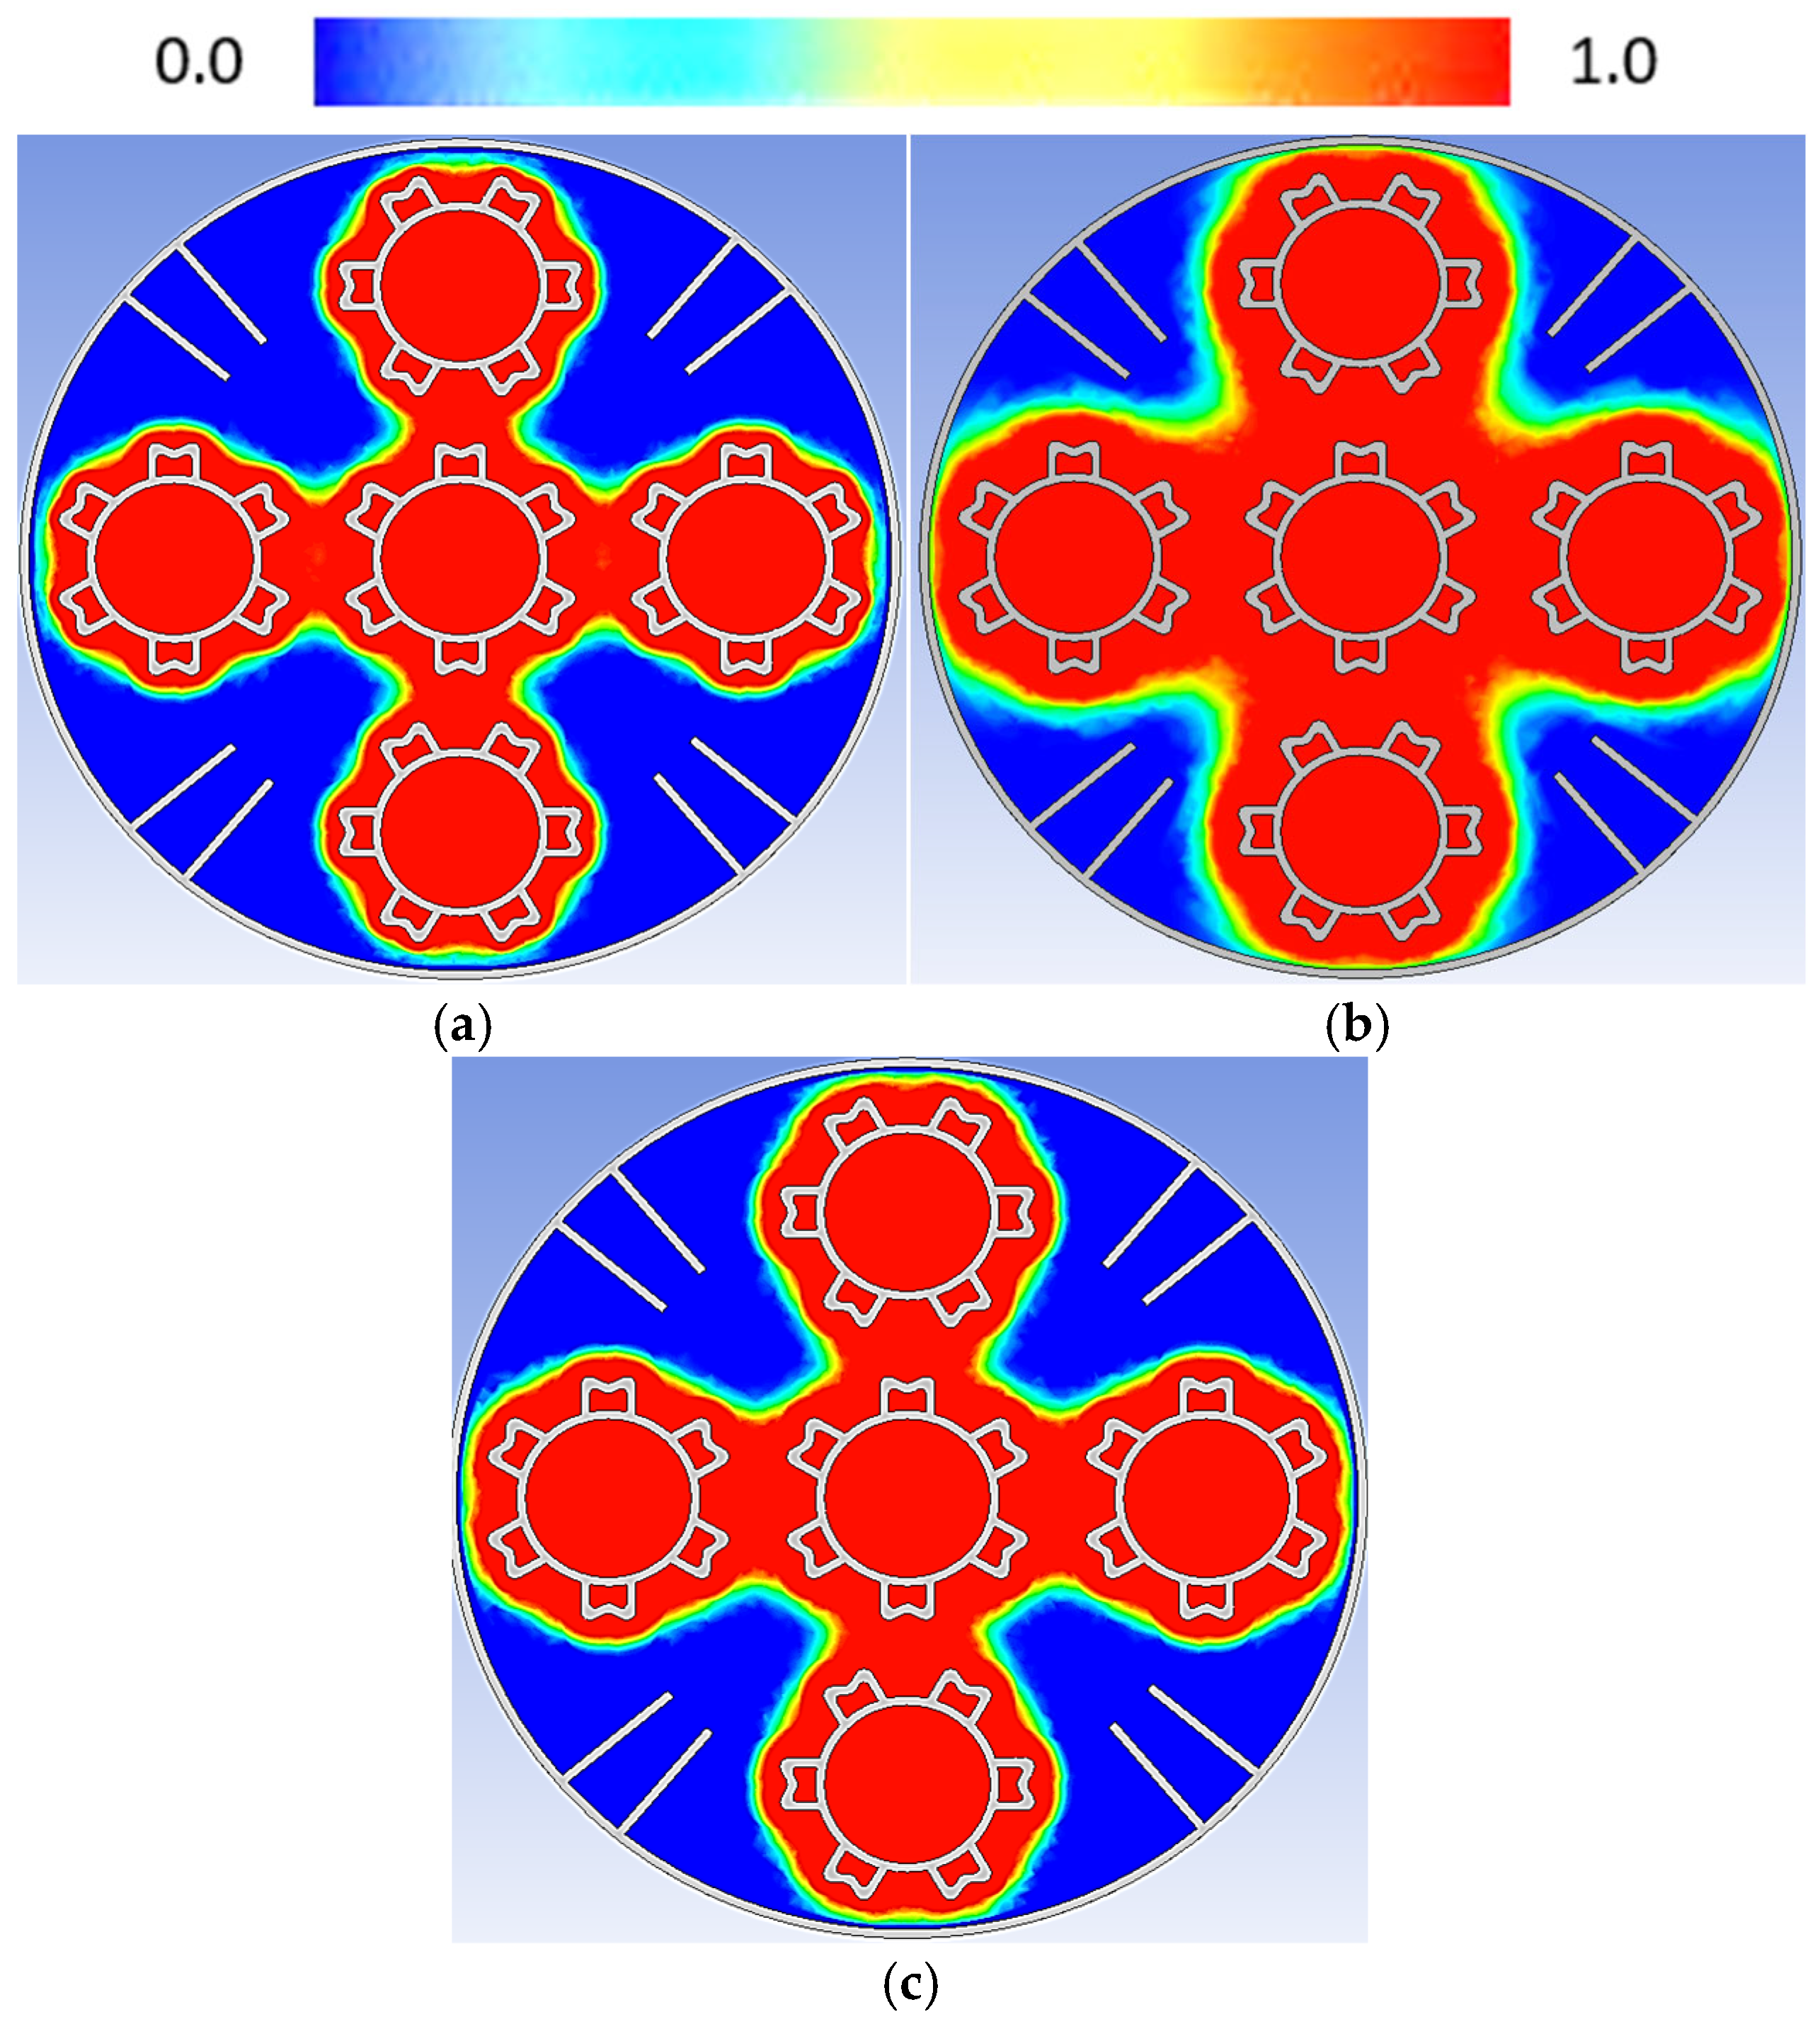
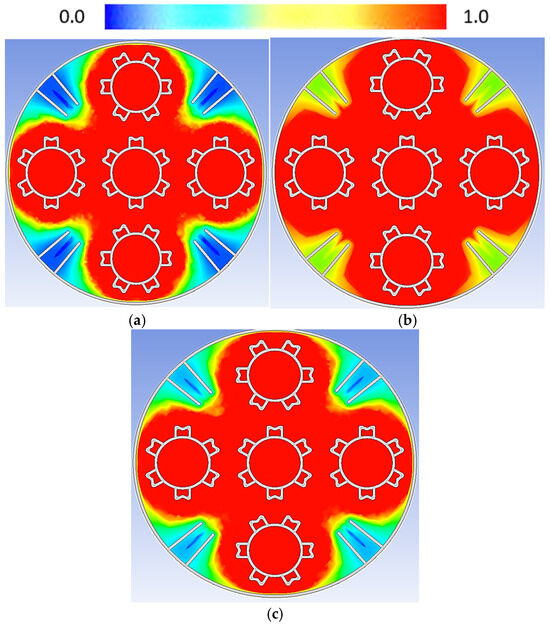
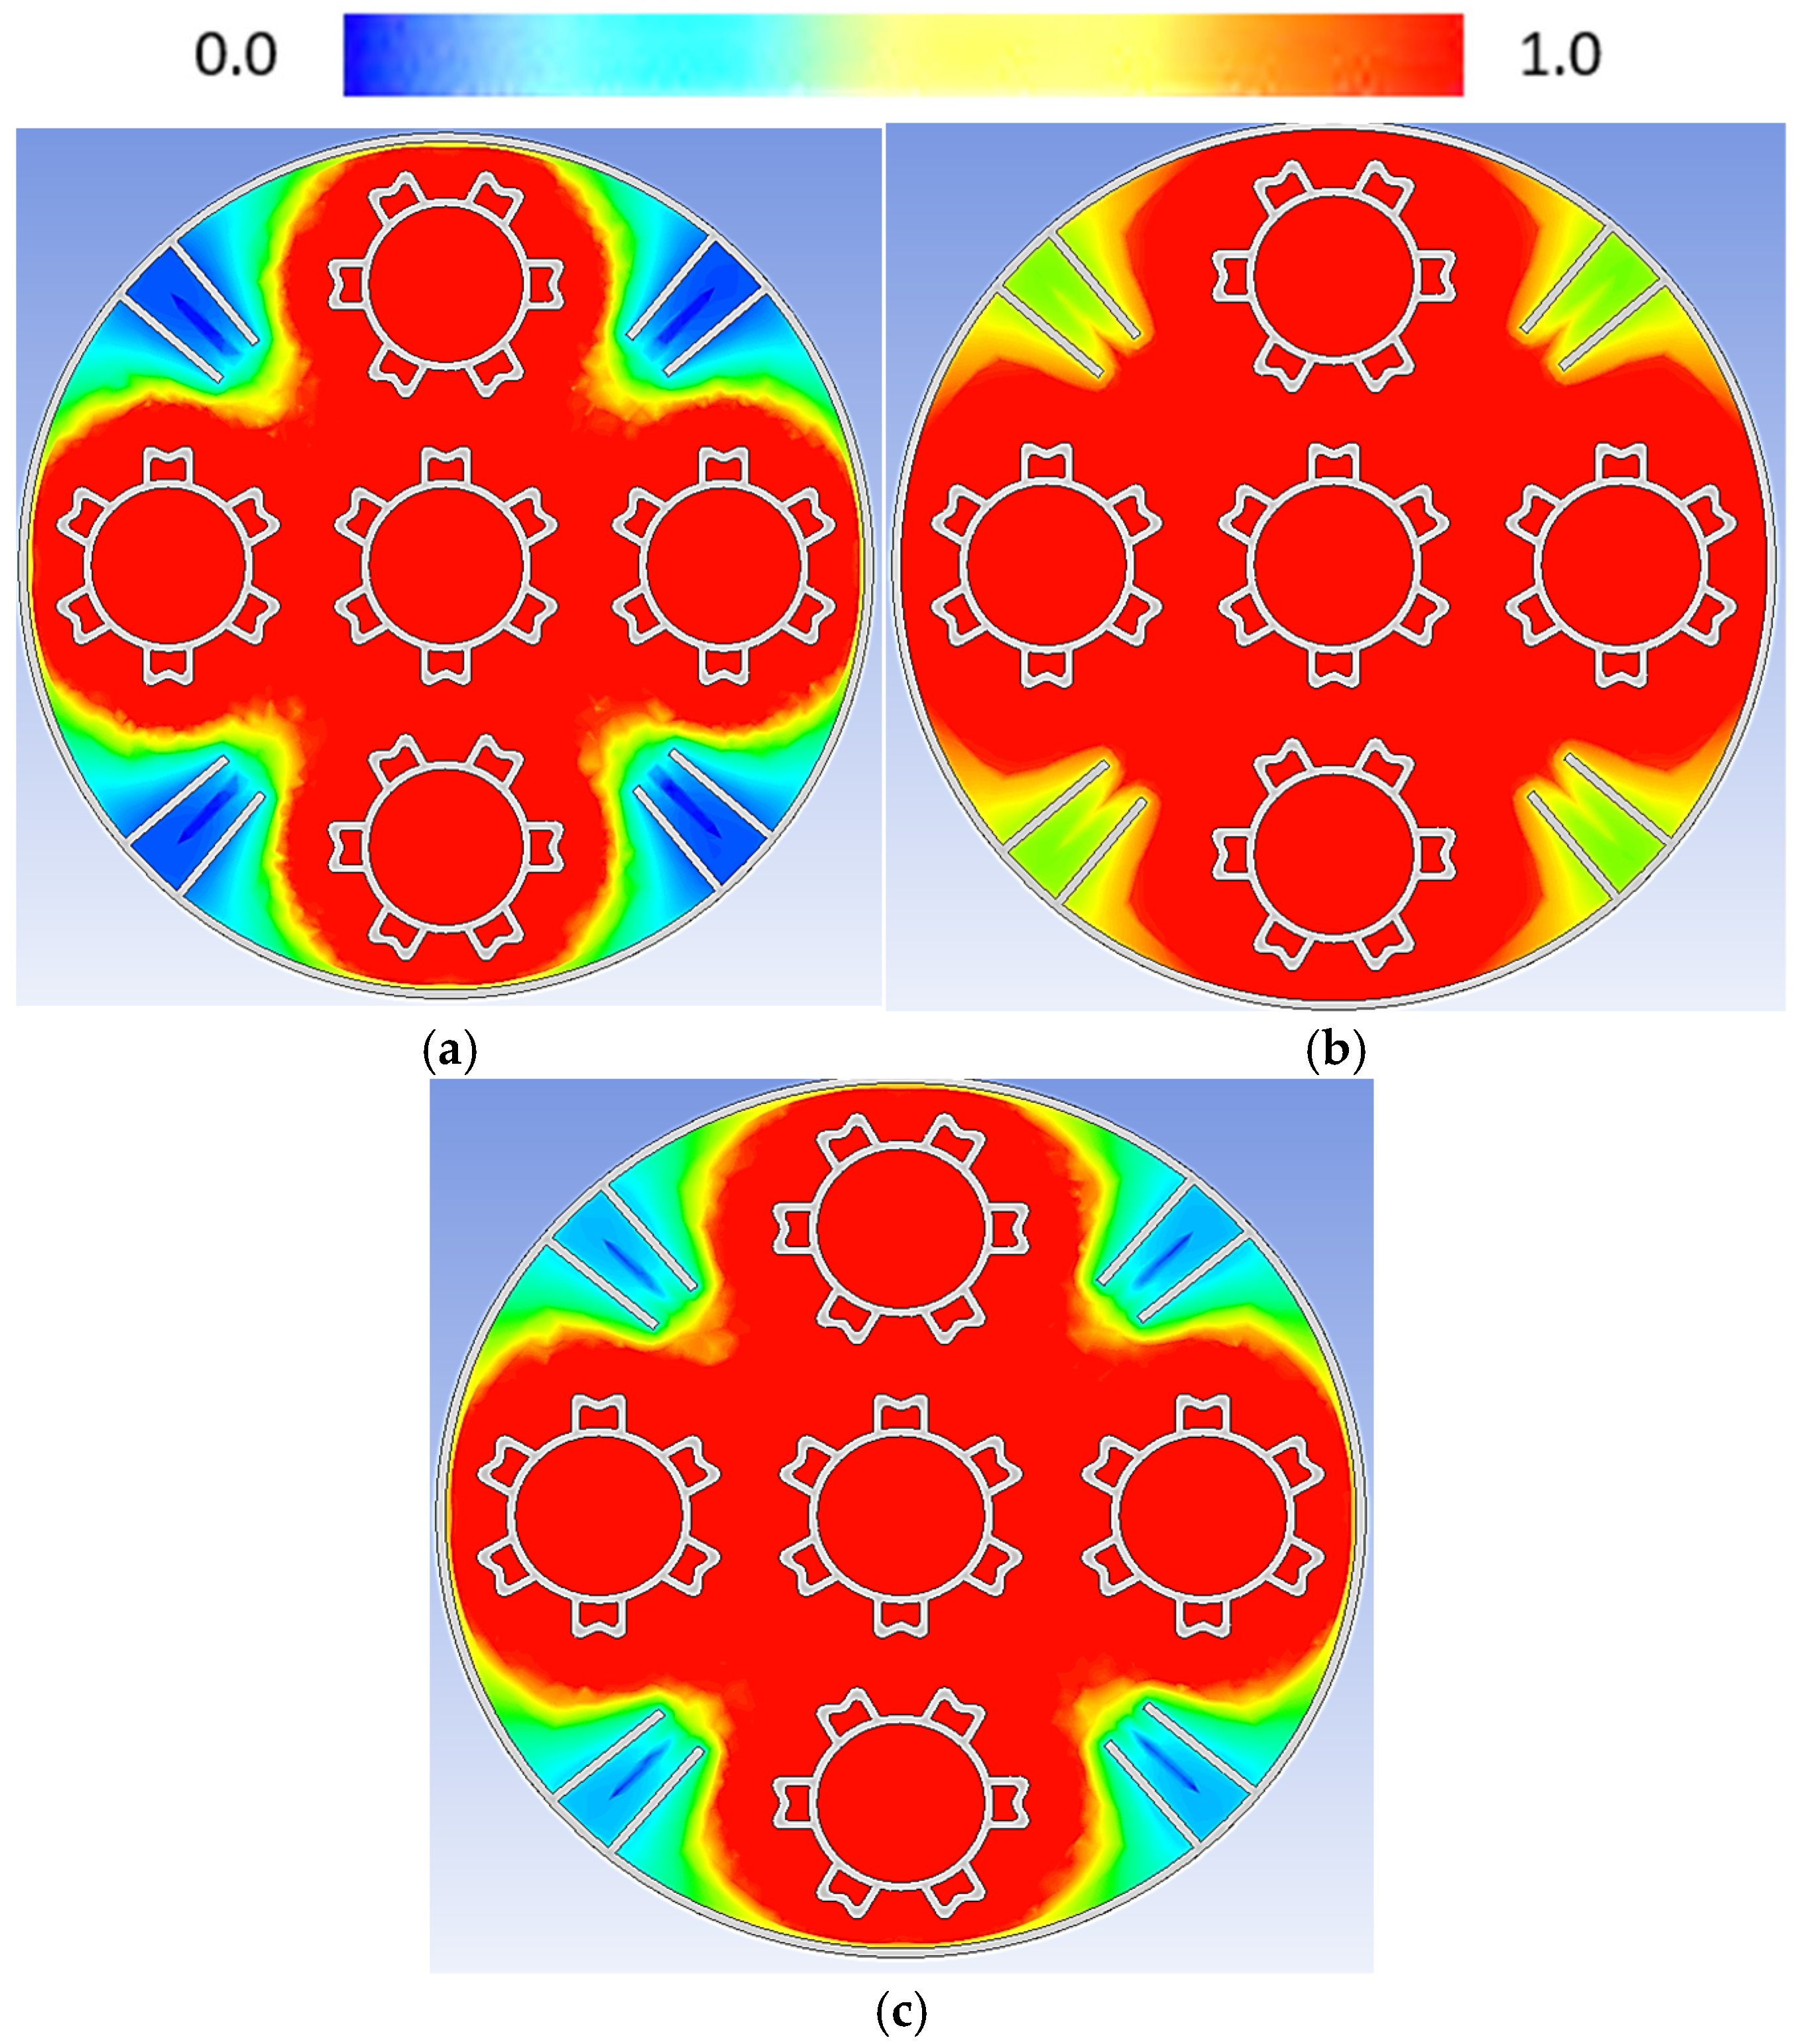
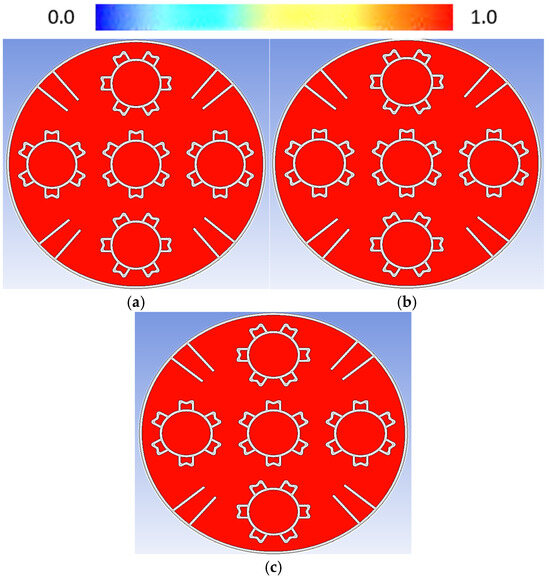
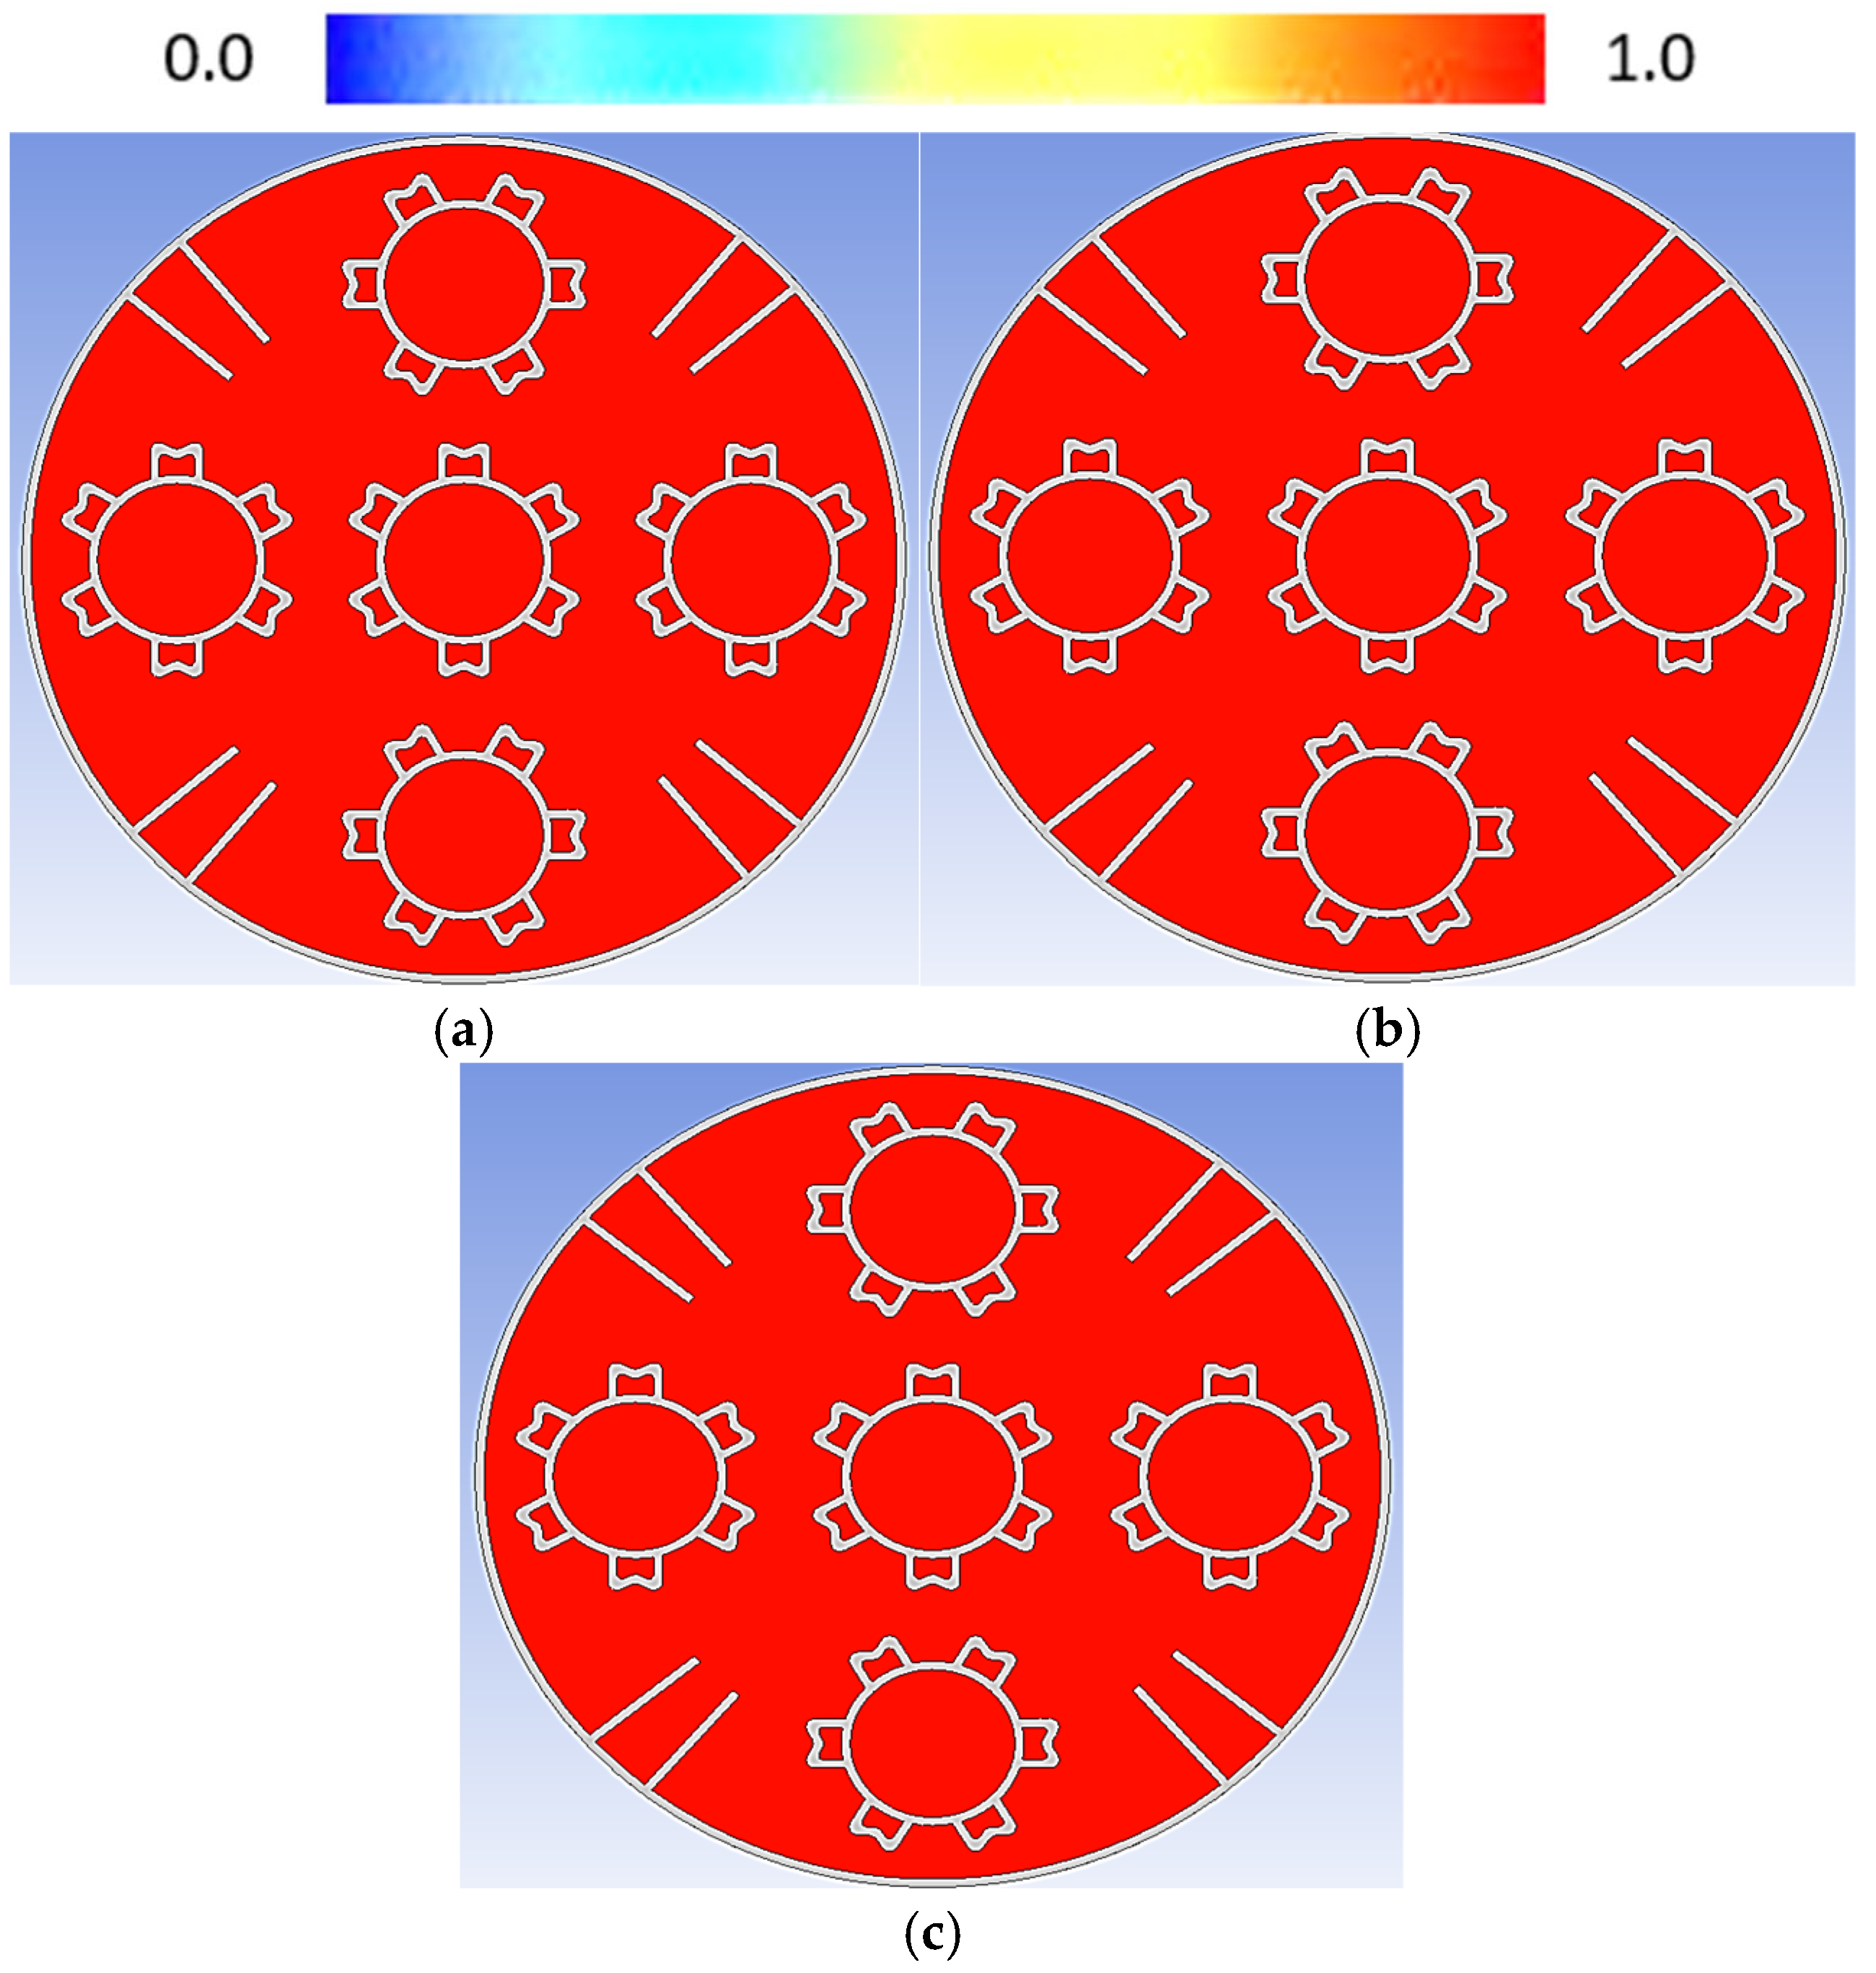
Heat transfer analysis was performed to examine the variation in liquid fractions after different charging times. Figure 5 shows the liquid fraction after 300-time steps (5 min), with the liquid fraction plotted along the length of the tank. Blue contours represent the solid fraction of the phase-change material, while red contours indicate the liquid fraction. Heat transfer from the heat transfer fluid tubes caused the transition from a solid to a liquid. The region close to the HTF tubes exhibits a higher liquid fraction after 5 min, whereas the PCM near the tank’s outer wall remains solid due to the low thermal conductivity of the PCM.
Figure 5.
Liquid fraction at (a) inlet, (b) center, and (c) outlet of storage tank after 5 min of charging.
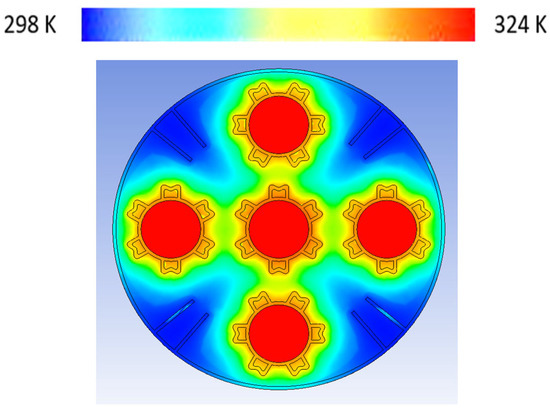
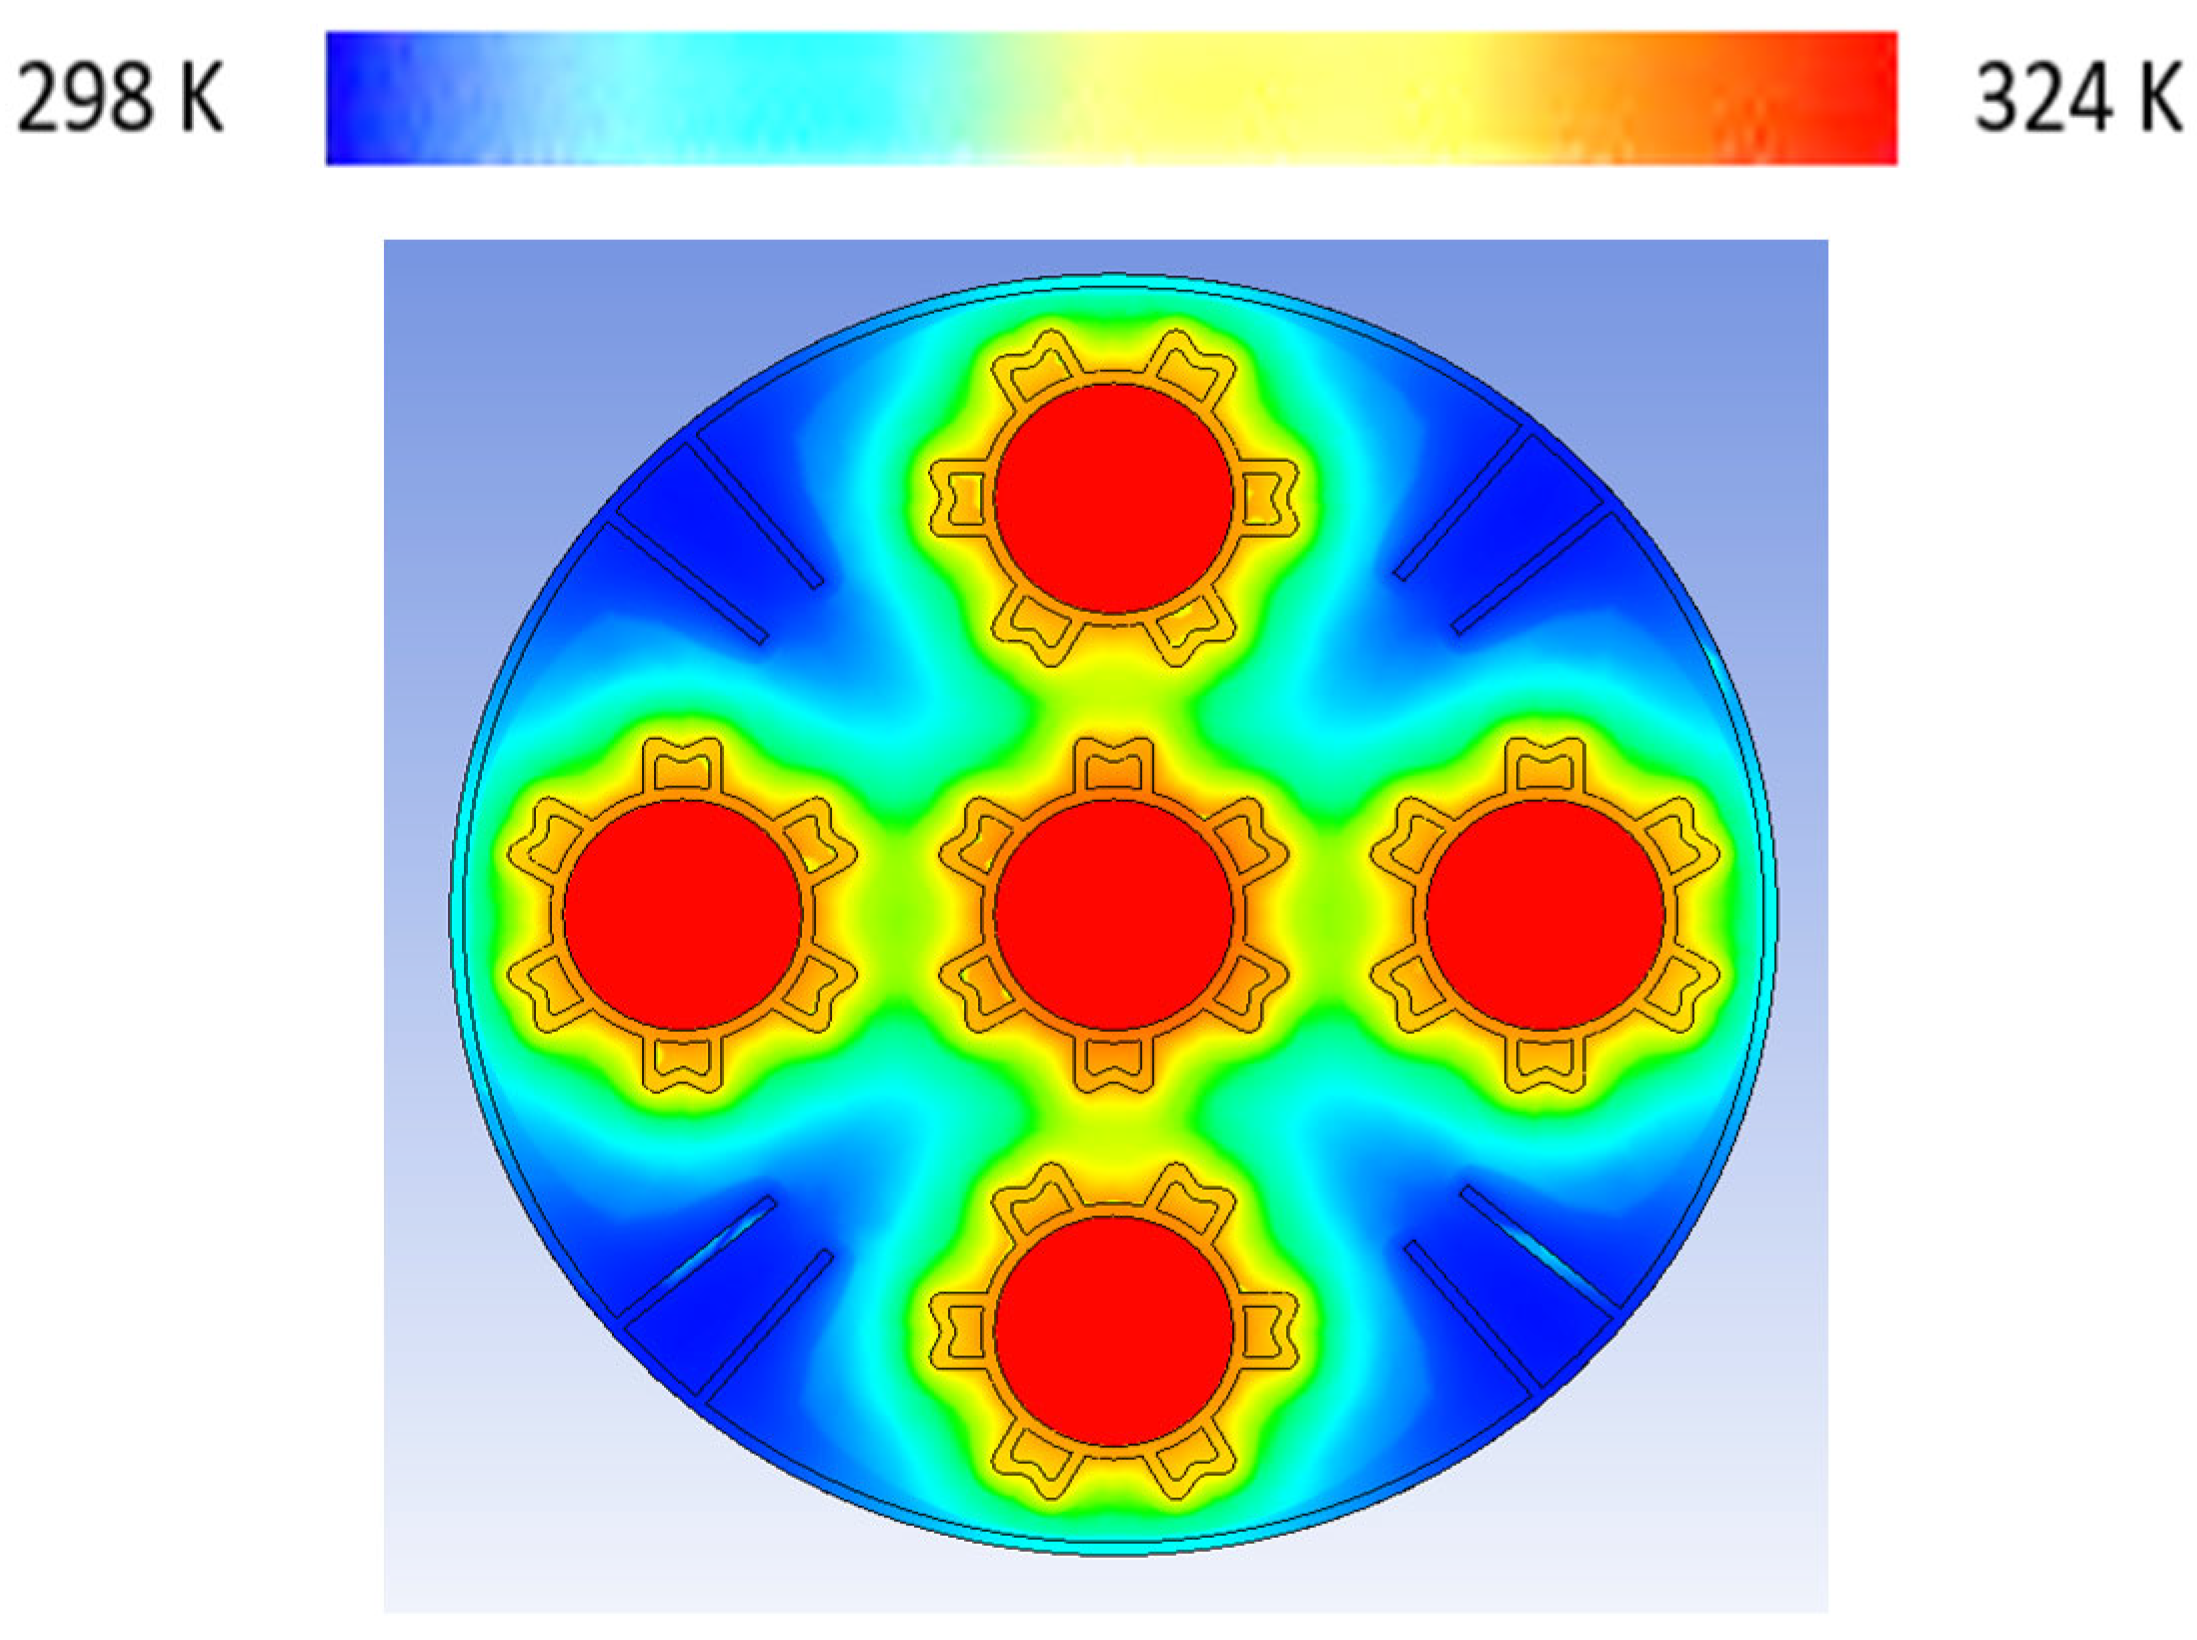
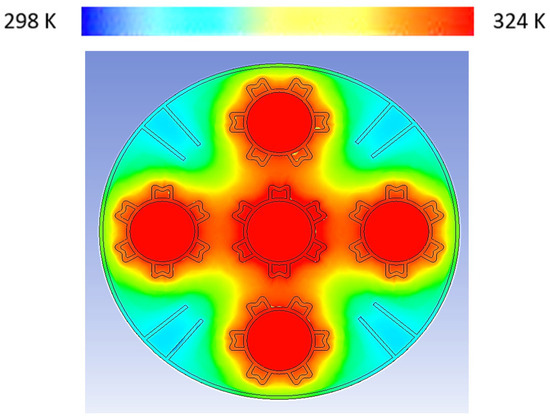
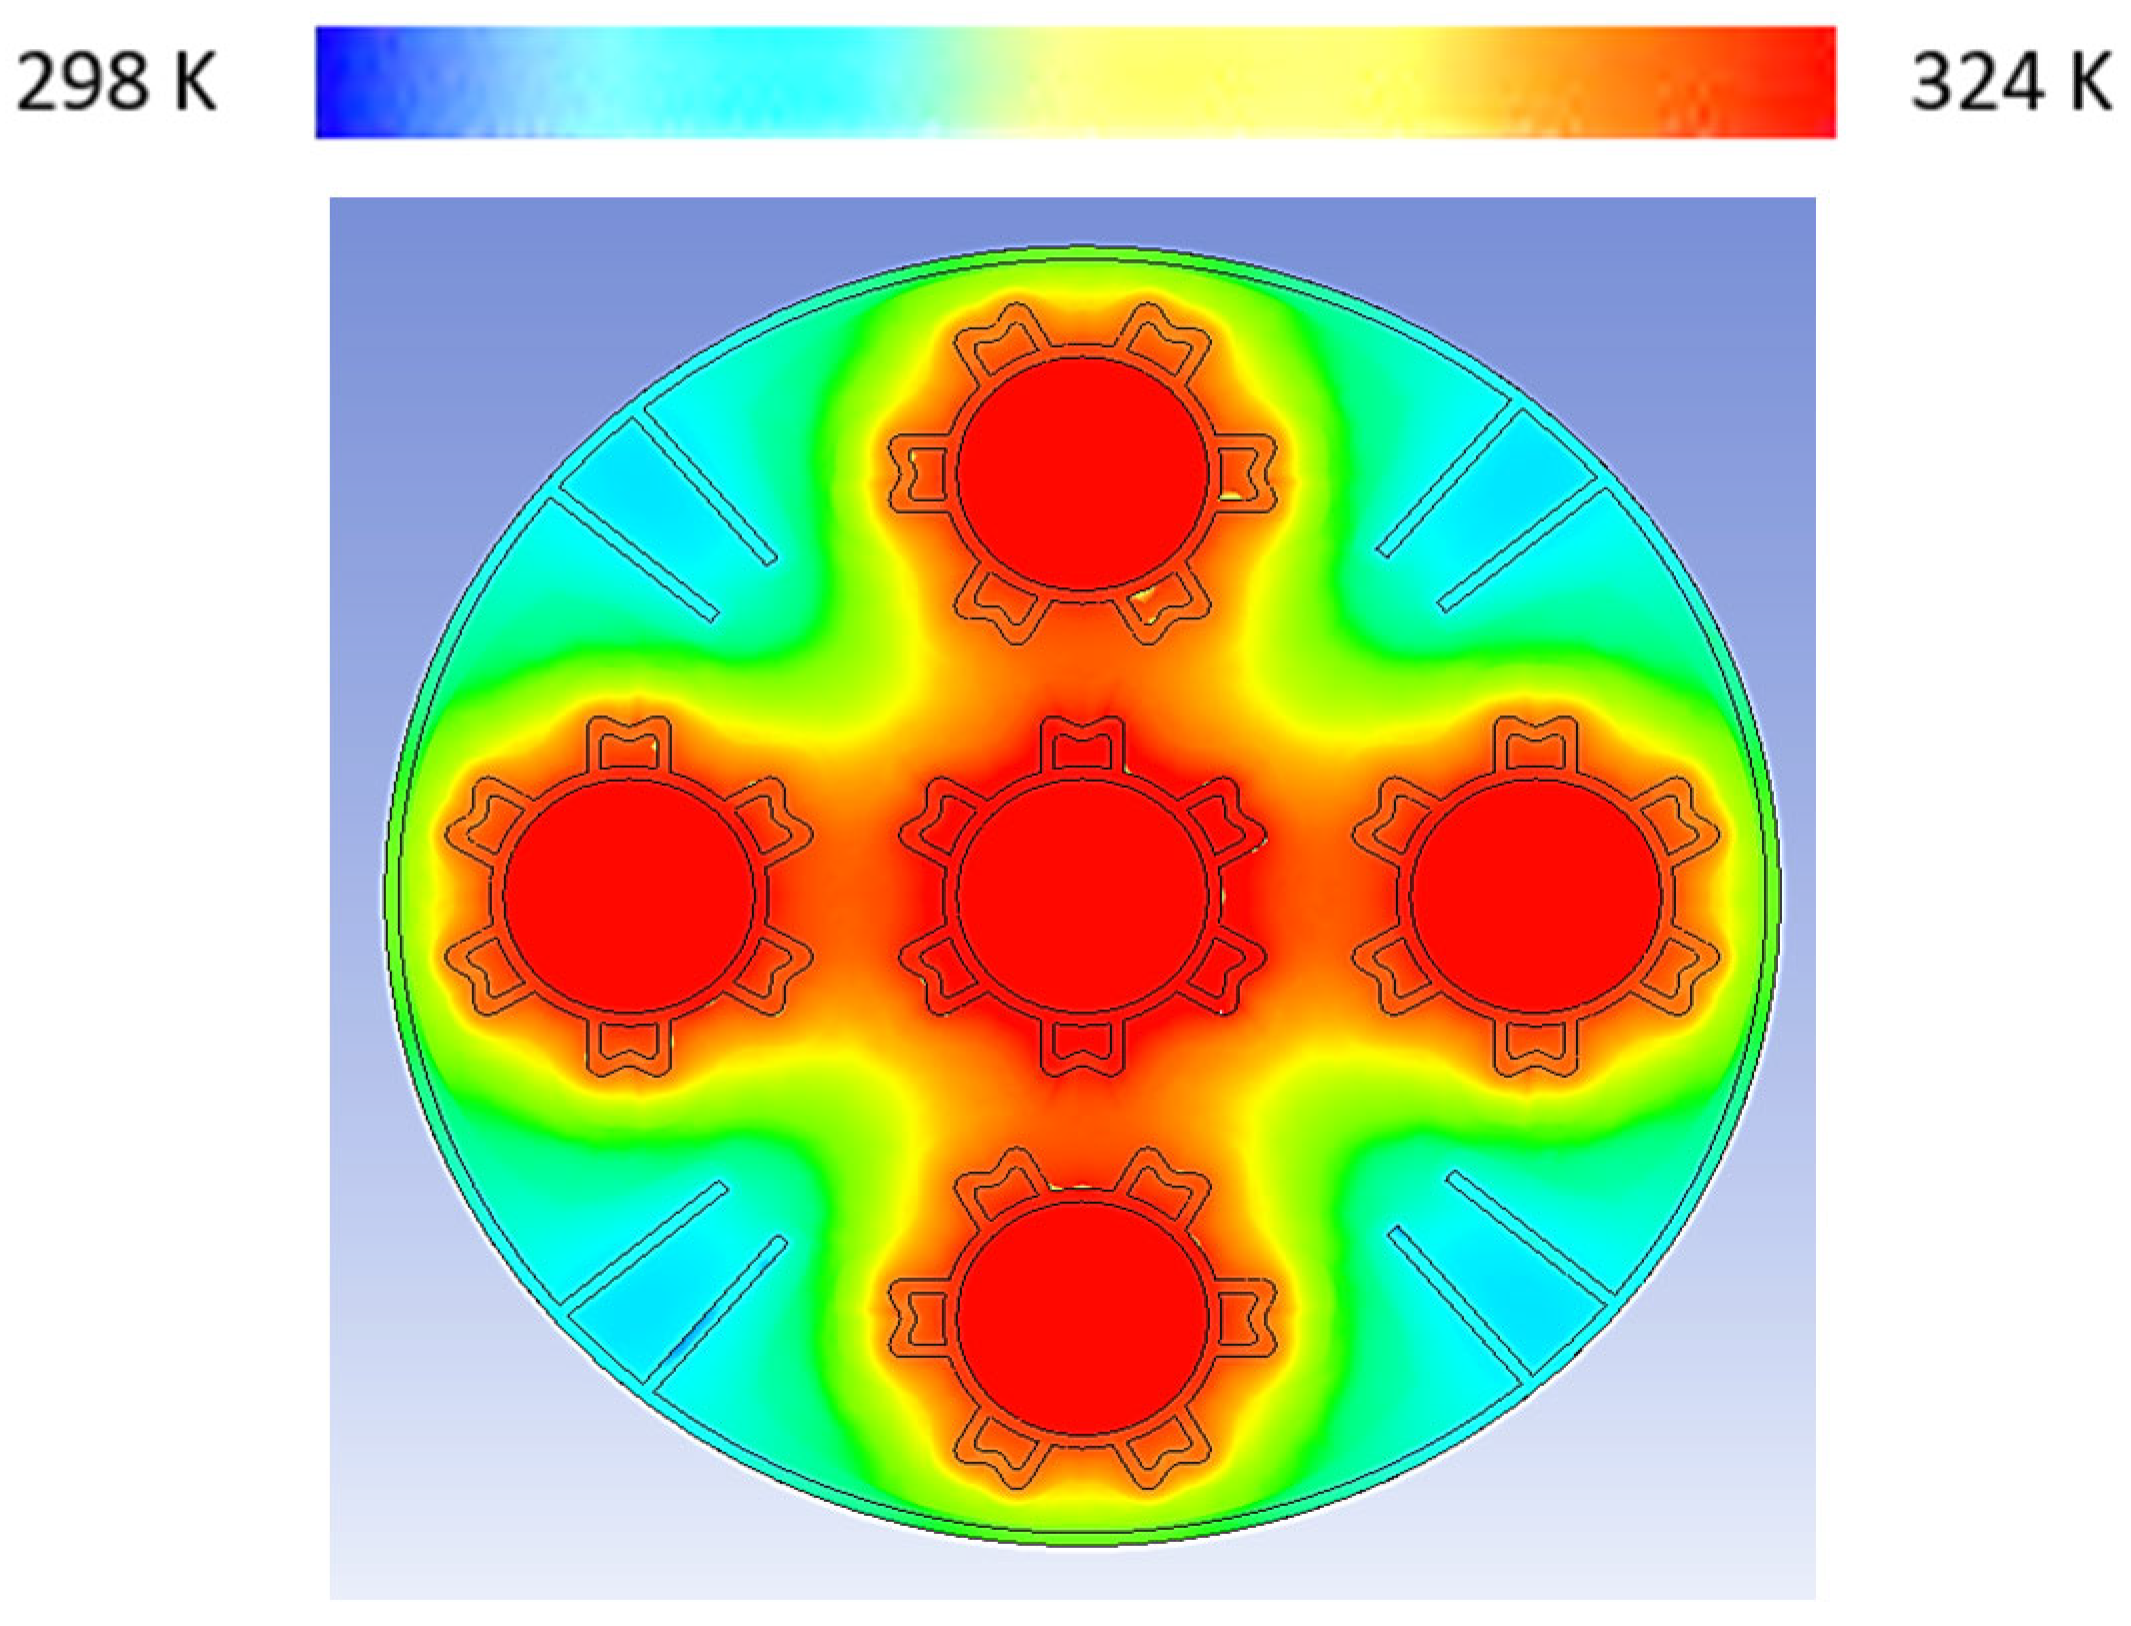
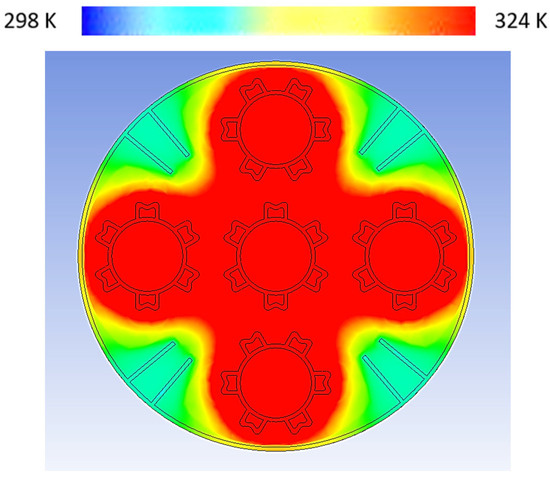
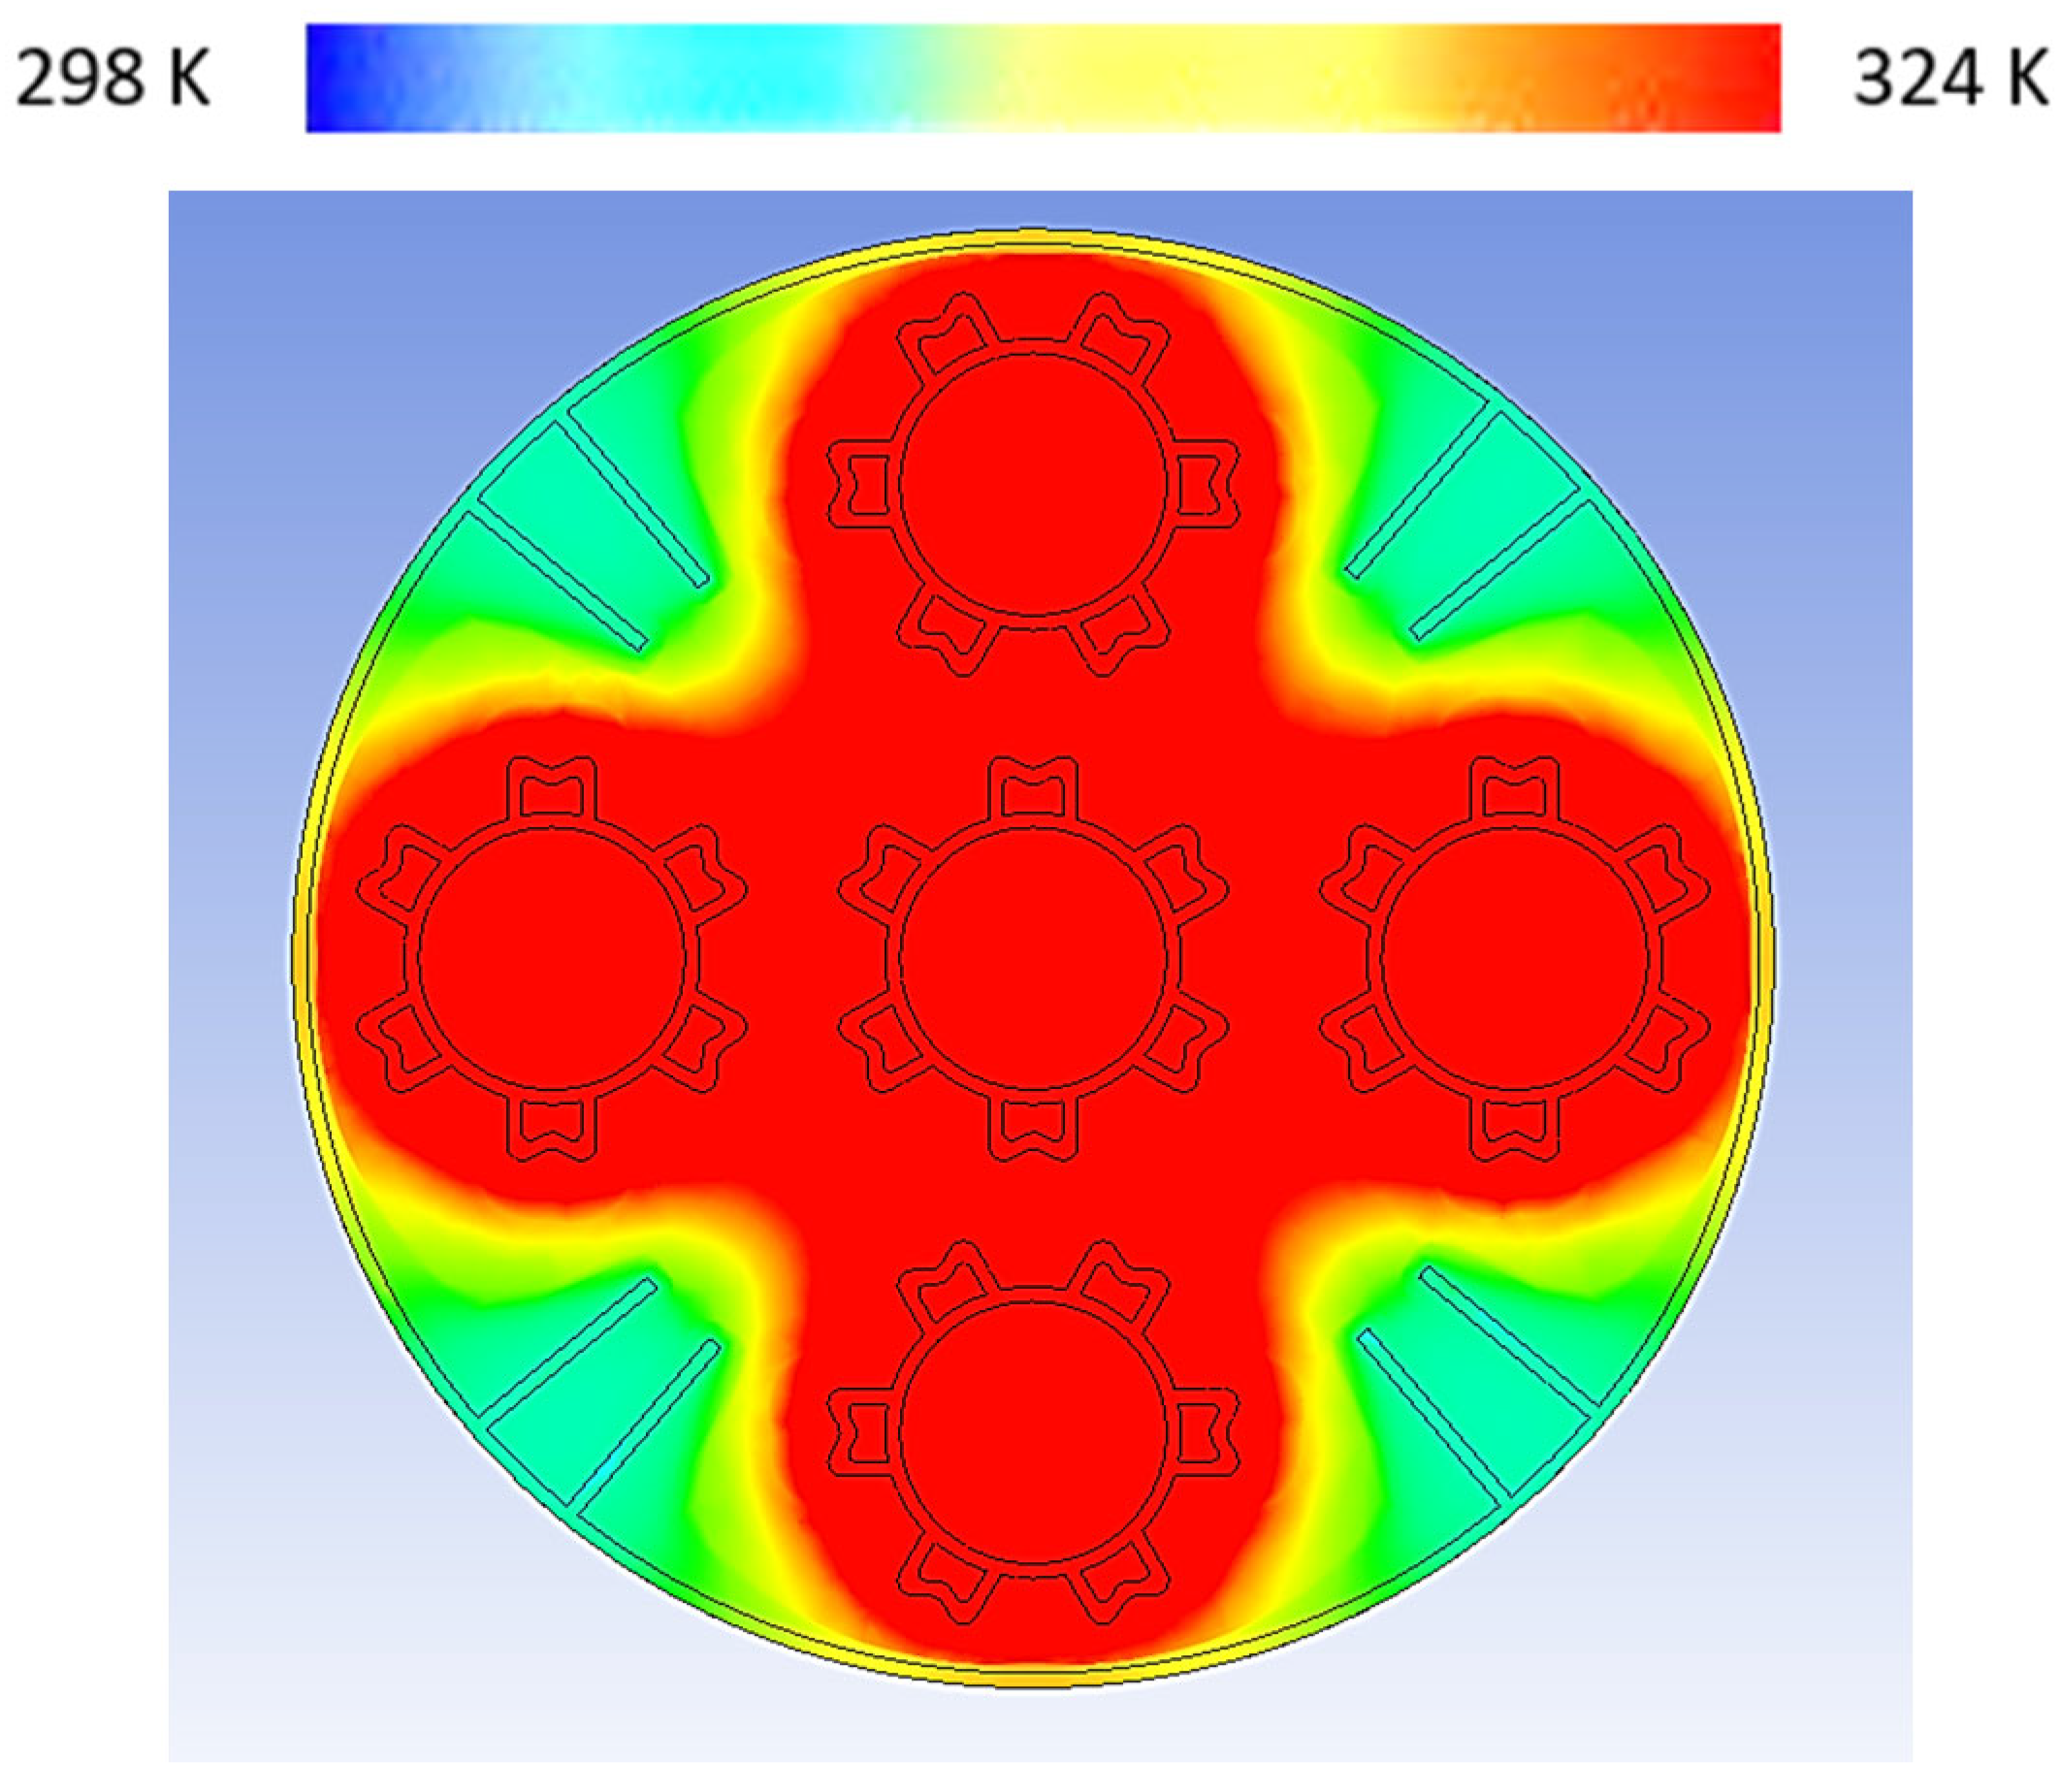
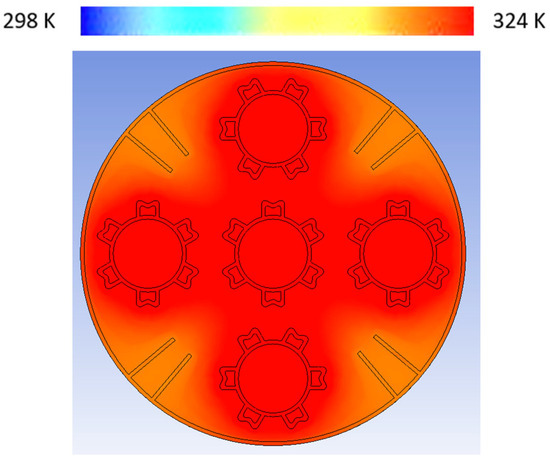
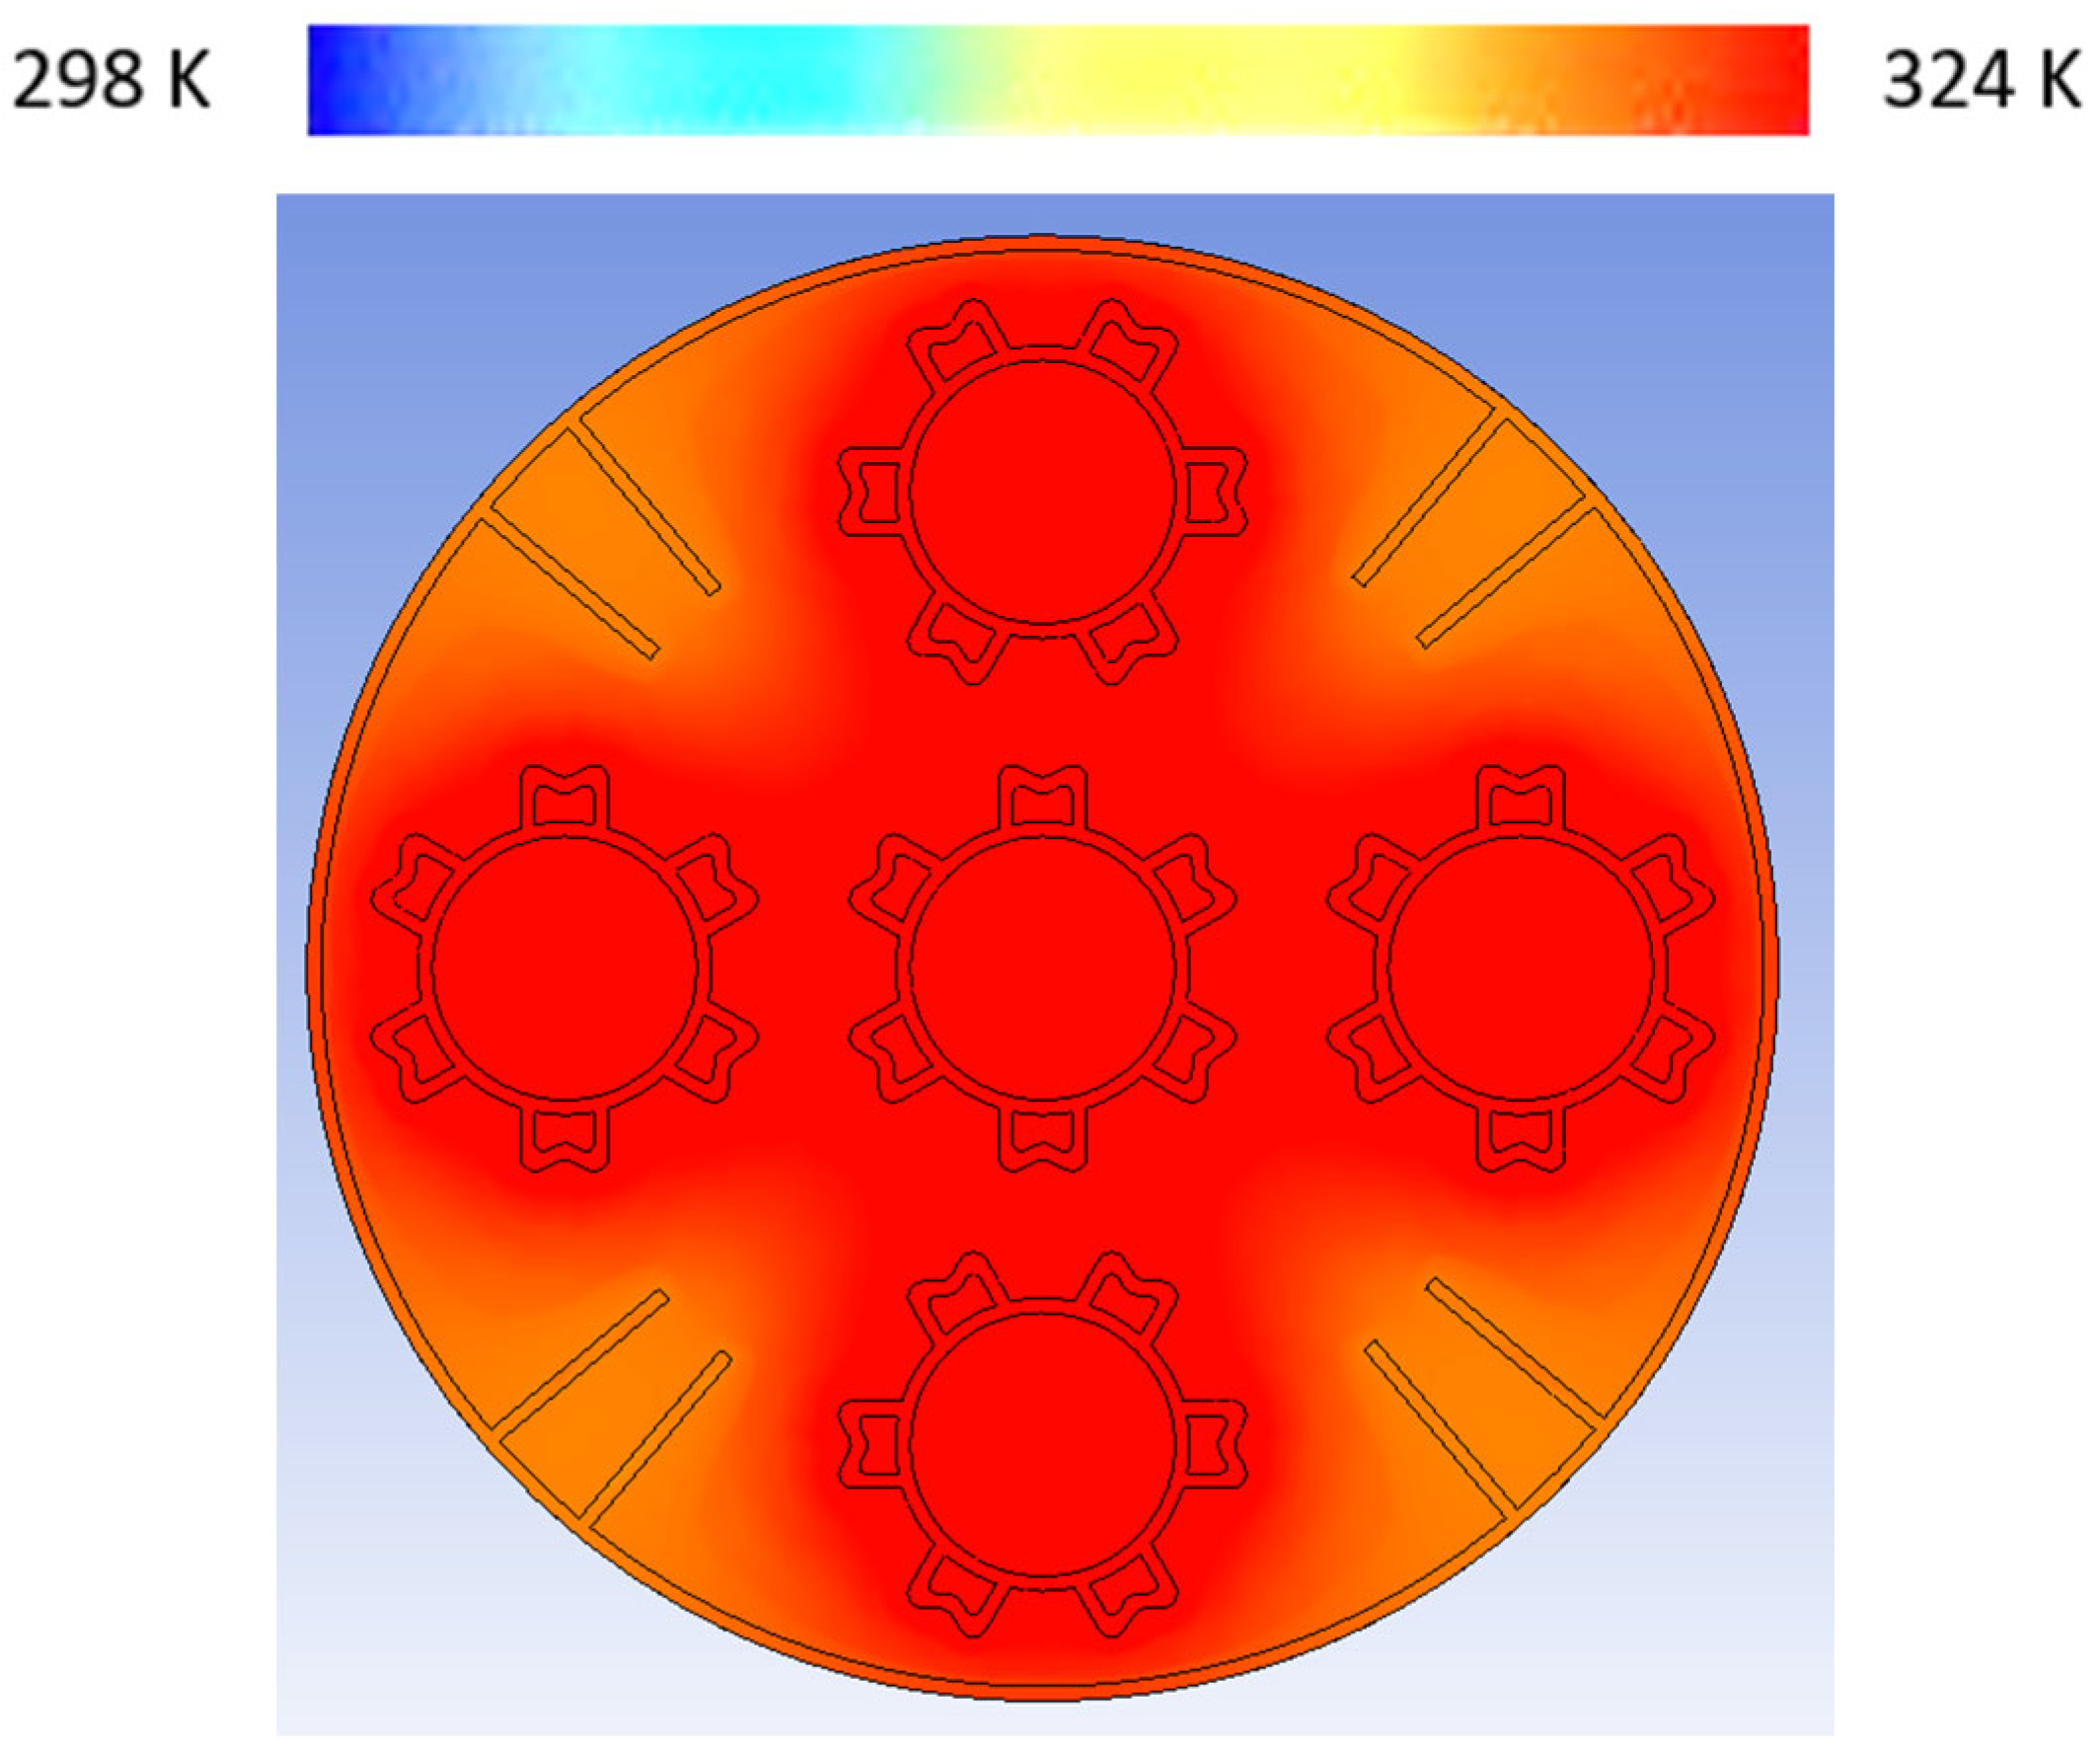
Temperature variations at the tank’s inlet and outlet are more rapid compared to the central region, as heat is dissipated to the surrounding environment at these locations. Figure 5b shows a higher liquid fraction compared to Figure 5a,c. This is attributed to the rapid solid-to-liquid transition near the HTF tubes due to the presence of fins. By enhancing thermal conductivity with fins on the HTF tube surface, the conduction mode is enhanced due to a larger surface area being exposed to PCM, conduction is superior in initial durations of charging. In Figure 6, temperature contours are represented for further clarification regarding PCM transition. A red color represents the highest temperature; however, yellow indicates temperature at which PCM enters into a plastic state.
Figure 6.
Thermal gradients after 5 min of charging.
3.3. Liquid Fraction After 20 min (1200-Time Steps)
Increasing the time steps from 300 to 1200 influenced the liquid fraction, as depicted in Figure 7. A similar trend was observed in the solid-to-liquid conversion process, with the amount of molten material being slightly lower near the tank inlet compared to the center region. This discrepancy was attributed to increased heat losses at the tank’s ends. Figure 7b represent the center portion of LHS tank having maximum melting due to little involvement of environment. The dominant mode of heat transfer shifted from conduction to convection as the solid material surrounding the HTF tubes fully melted into liquid. However, conduction remained significant at the outer boundaries of the HTF tubes where the liquid PCM was in contact with the tube surfaces. The solid PCM transitioned into a viscous liquid, potentially forming a layer that adhered to the tube surfaces and behaved like a solid wall. Nevertheless, the substantial temperature difference between the HTF and the liquid PCM, as shown in Figure 8, promoted convection, driven by natural convection currents between the layers. The generation of localized vortices, particularly noticeable at the solid–liquid interface, further enhanced heat transfers in the convection mode, marking the shift in the dominant heat transfer mechanism.
Figure 7.
Liquid fraction at (a) inlet, (b) center, and (c) outlet of storage tank after 20 min of charging.
Figure 8.
Thermal gradients after 20 min of charging.
3.4. Liquid Fraction After 35 min (2100-Time Steps)
The liquid fraction percentage, as shown in Figure 9, increased notably after 35 min of charging. A significant portion of the solid PCM transitions to its liquid state due to rapid heat transfer through the molten material. The thermal conductivity of the molten material improves, enhancing conduction through the viscous liquid; however, convection remains the primary mode of heat transfer. After 2100-time steps, the inlet region exhibited a larger portion of solid PCM compared to the center and outlet of the tank, as illustrated in Figure 9a–c. The substantial temperature gradient of approximately 40 K accelerated the phase transition of the PCM. Melting progressed rapidly in the transverse direction of the HTF tubes due to the extended surfaces. However, the region between the HTF tubes and adjacent to the tank’s outer wall retained solid PCM due to the material’s low thermal conductivity. The installation of rectangular fins in this area enhanced melting, as depicted in Figure 9b.
Figure 9.
Liquid fraction at (a) inlet, (b) center, and (c) outlet of storage tank after 35 min of charging.
The increment in thermal performance of the storage tank is attributed to fins utilization because these fins improved thermal conduction in the initial phase. Additionally, convection mode was also enhanced due to vortices generation at boundaries of molten PCM because there was an interaction between solid and liquid PCM. Vortices amount was not much greater due to high viscosity of PCM. Figure 10 depicts thermal variations inside a storage tank which witnessed the solid-to-liquid transition of PCM.
Figure 10.
Thermal gradients after 35 min of charging.
3.5. Liquid Fraction After 44 min (2640-Time Steps)
The complete melting of the solid PCM was achieved within 44 min, as shown in Figure 11. The rectangular fins attached to the outer tank significantly facilitated phase transition in that region, which would have otherwise been delayed due to the PCM’s low thermal conductivity. These fins improved thermal conductivity toward the tank’s outer wall, accelerating the process.
Figure 11.
Liquid fraction at (a) inlet, (b) center, and (c) outlet of storage tank after 44 min of charging.
The PCM fully melted after 2640-time steps, a notably rapid result attributed to the effectiveness of the extended surfaces. In comparison with bare HTF tubes, melting was achieved 52.3% faster because of these innovatively shaped fins. Figure 12 shows the temperature contours for a storage tank after 44 min and revealed thermal equilibrium. These results are consistent with the findings reported in ref. [43], which also showed that TES units without fins require much longer charging/discharging times-typically around 100 min or more. Therefore, the orientation and geometry of fins are critical for achieving rapid charging and discharging performance.
Figure 12.
Thermal gradients at center of storage tank after 44 min of charging.
4. Development and Assembly of Experimental Setup
The manufacturing of the thermal energy storage tank having fins was carried out in a fabrication workshop due to superior thermal performance, utilizing stainless steel as the primary material for both the tank and its fins. Shielded Metal Arc Welding (SMAW) was employed to join all the fins to the tank. RT50 was selected because its melting temperature (approx. 50 °C) matches the available charging-temperature window of the flat-plate solar collectors used in this study and easy availability in the local market are the prime selection reasons.
Fabrication of Storage Tank
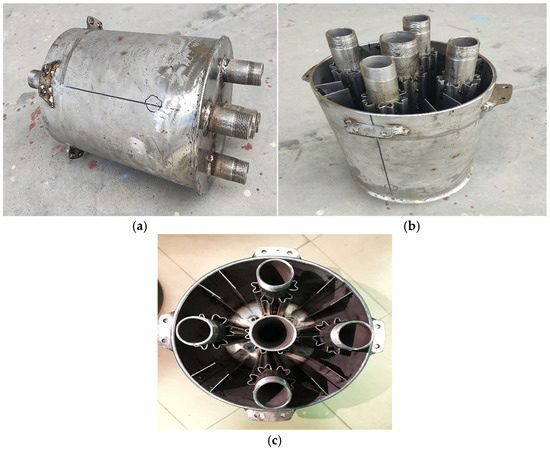
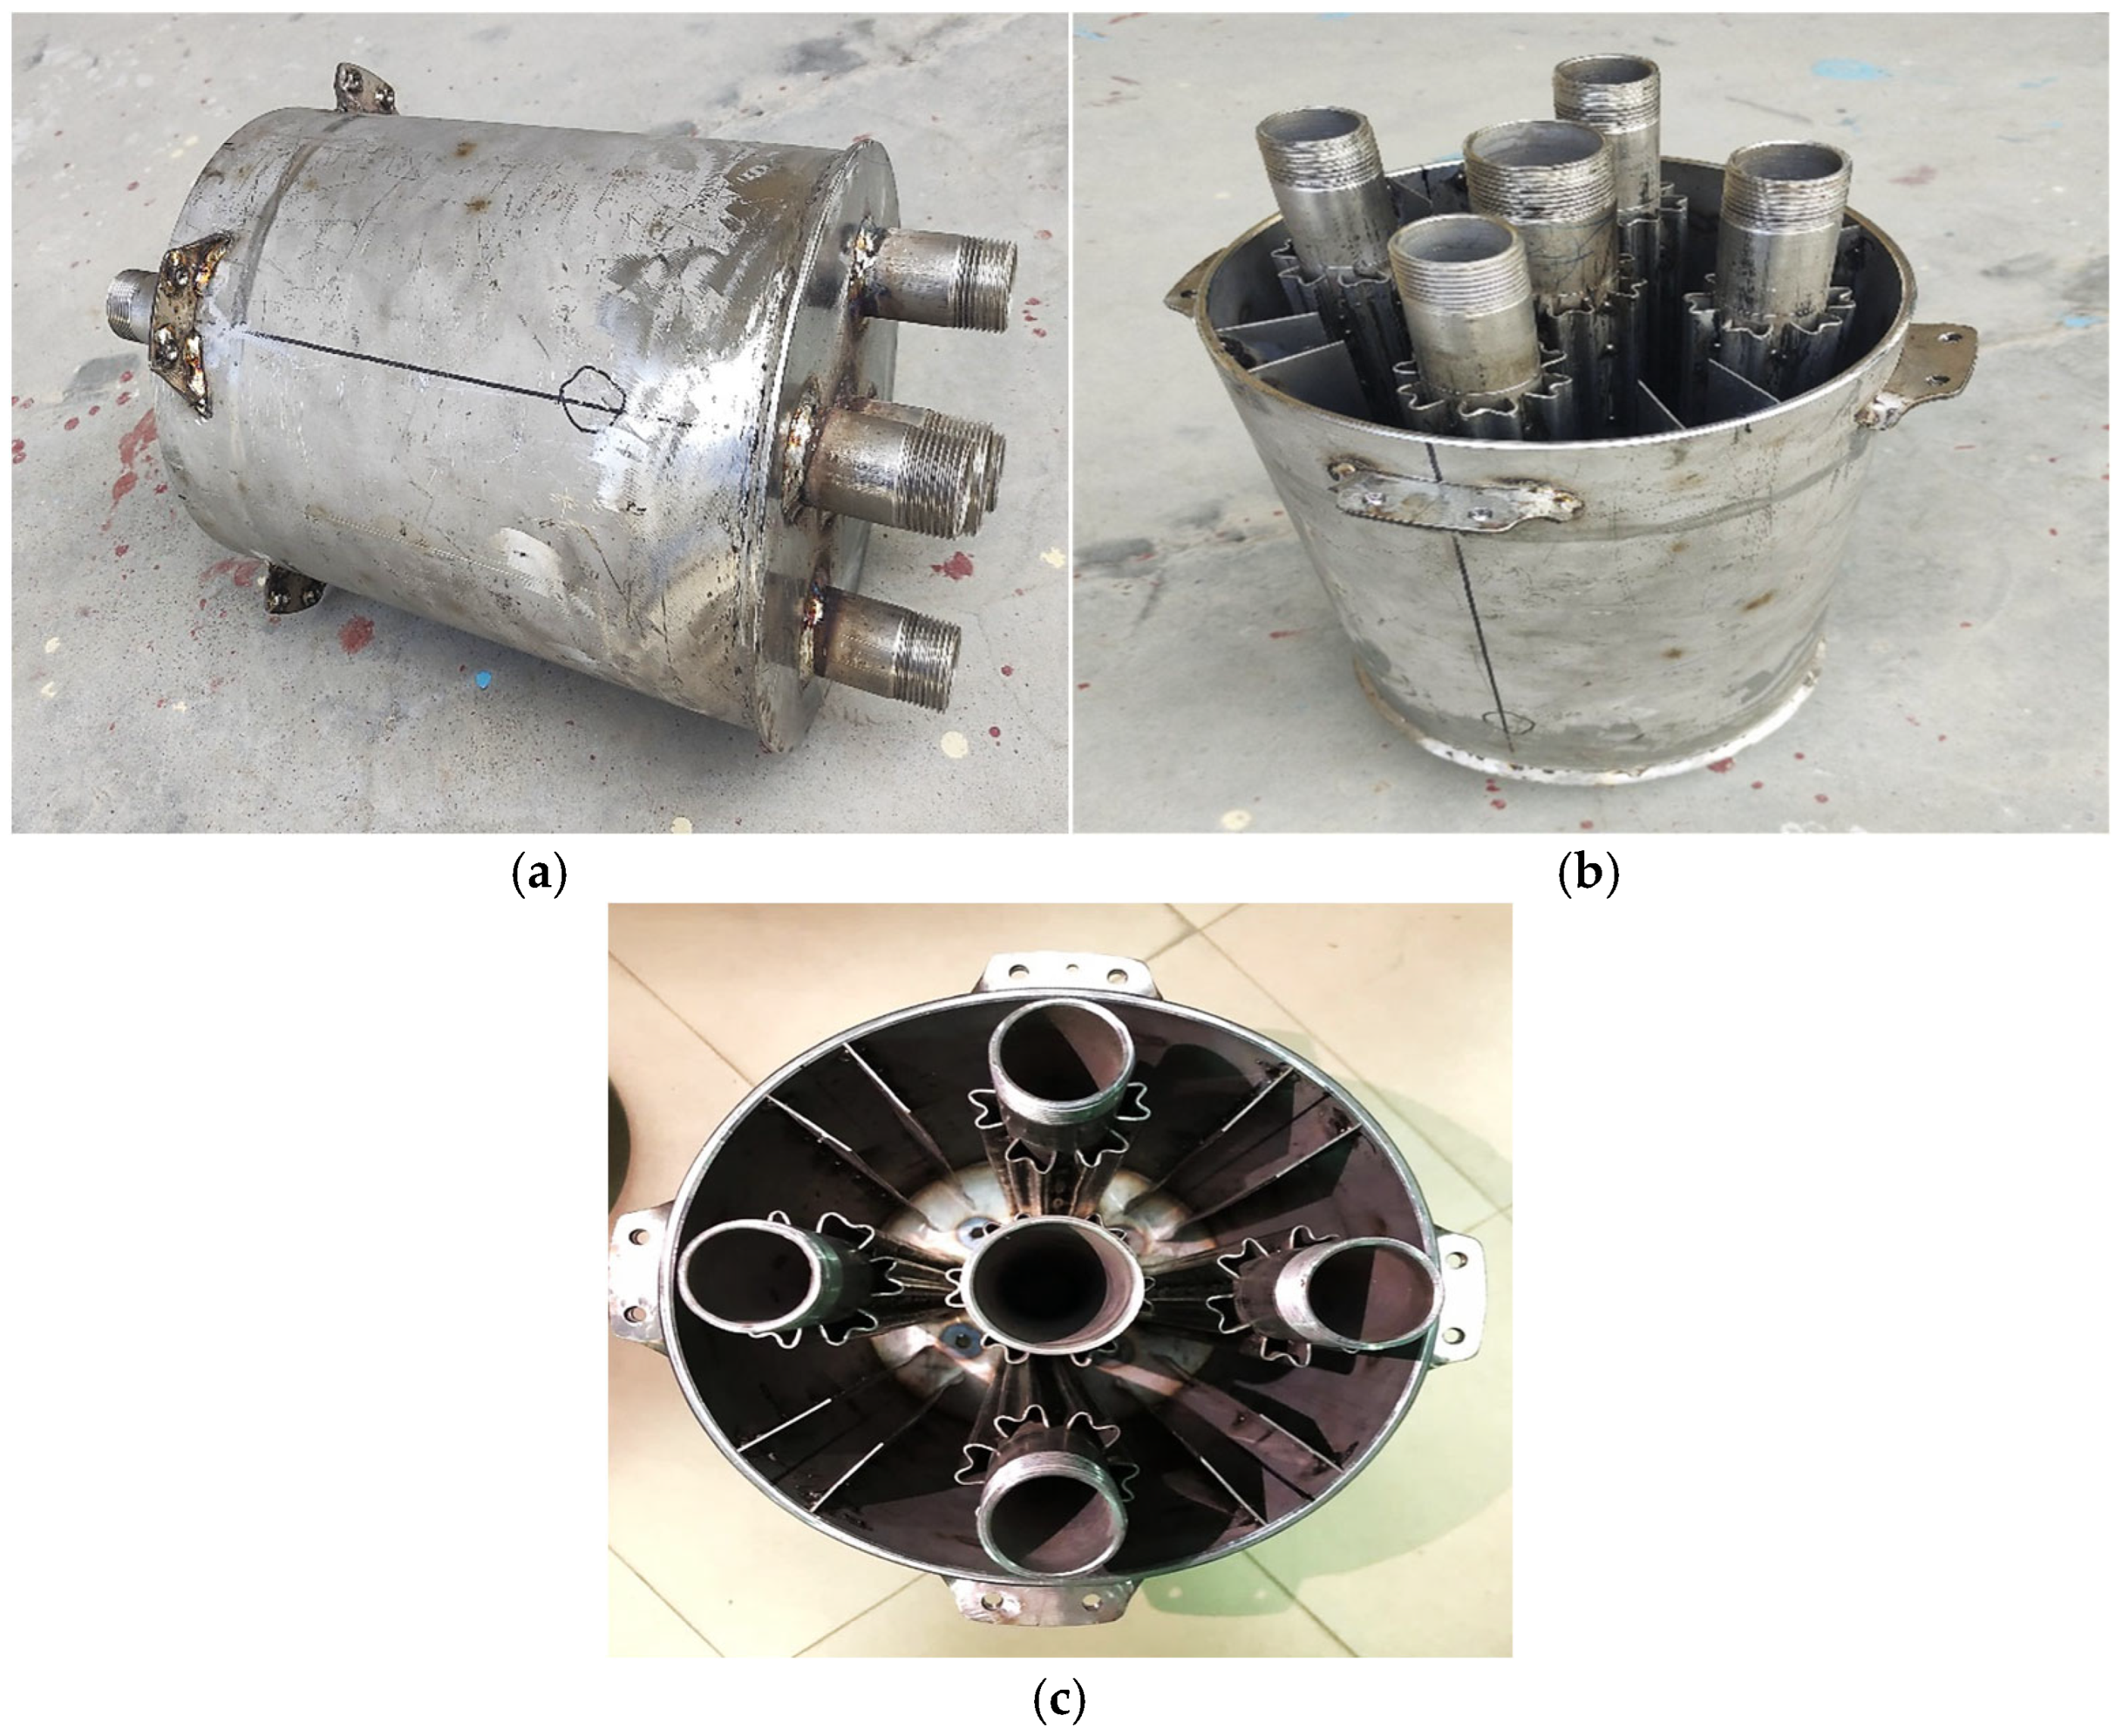
Figure 13 provides various perspectives of the storage tank, highlighting its development stages. Notably, Figure 13c displays the top view of the tank, clearly illustrating the attachment of six M-shaped fins and eight rectangular fins to the tank body.
Figure 13.
Manufacturing of experimental setup (a) side view, (b) front view, (c) top view.
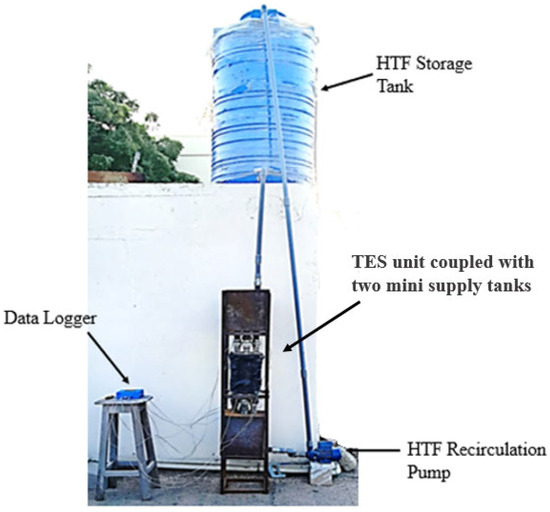
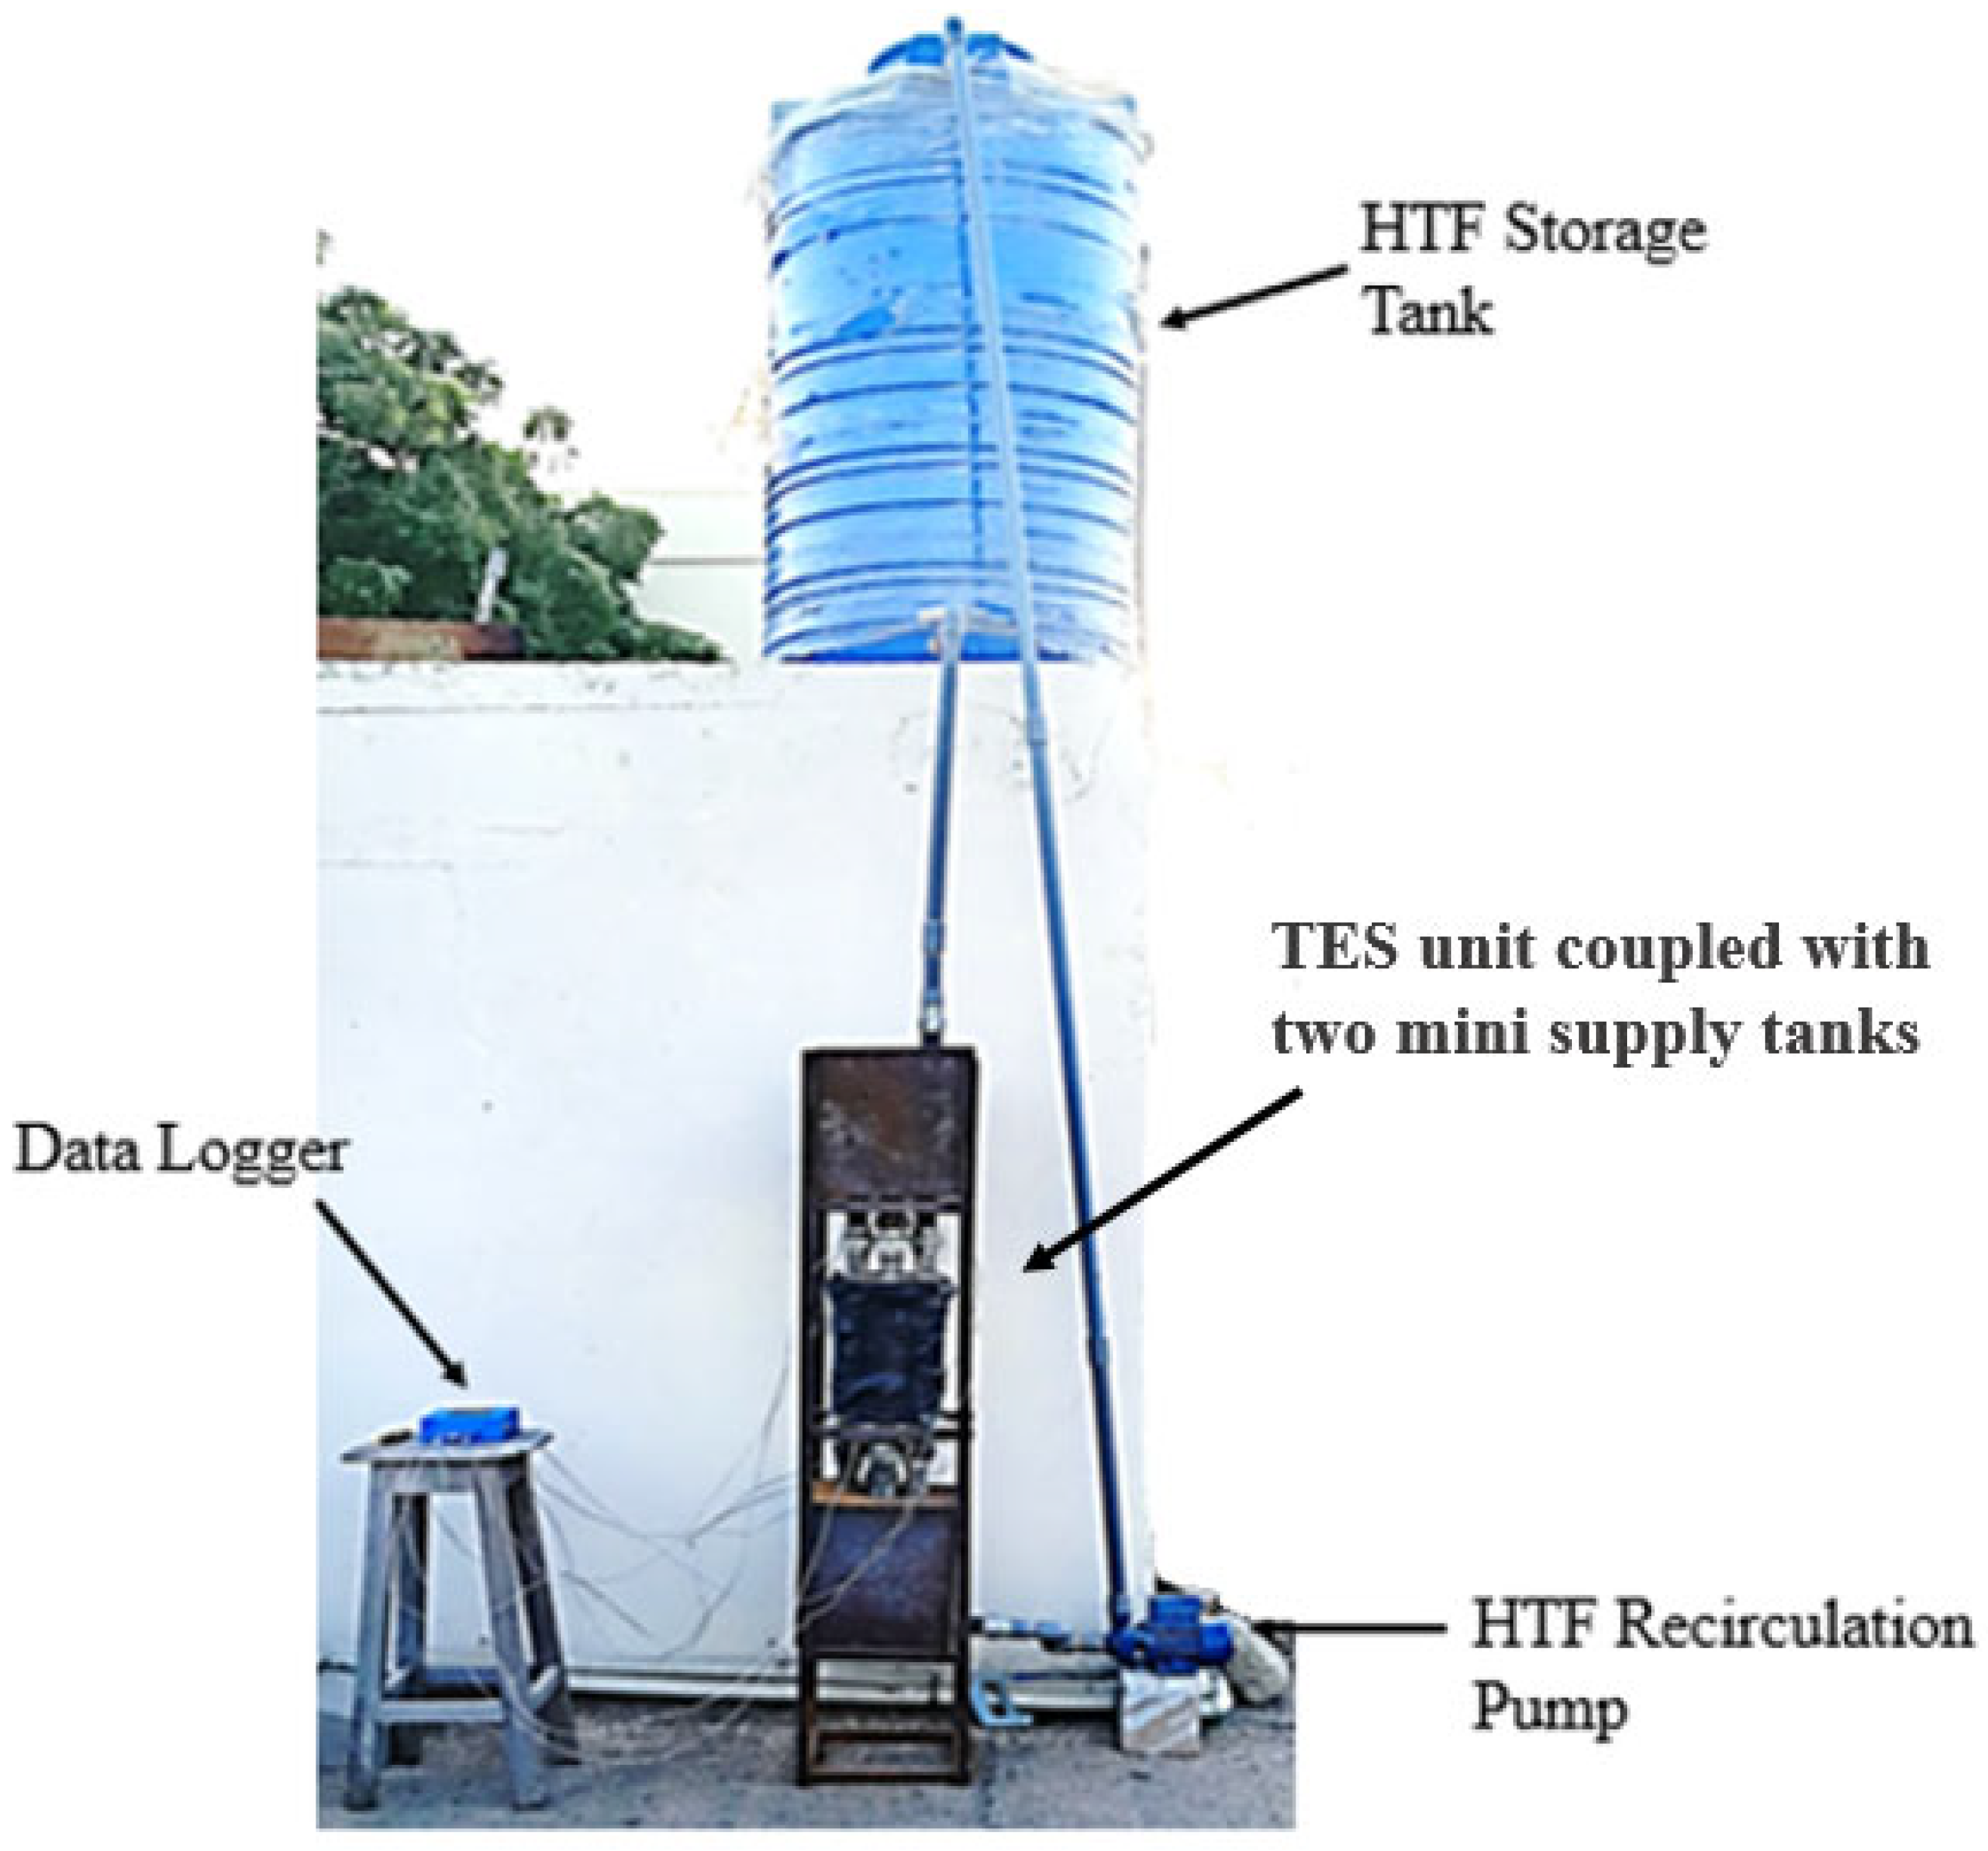
The development of the storage tank was not an easy task due to the intricate shape of fins attached to the HTF tubes. Many fabrication processes, like rolling, bending and welding, etc., were employed for construction. The assembly of the energy storage tank, along with the HTF storage tanks, was carried out to investigate the impact of different fins on practical thermal performance. The HTF storage tanks, each measuring 400 mm by 400 mm, were utilized to distribute the fluid into five pipes originating from a single supply line. These storage tanks were fabricated from mild steel (MS) sheets with a thickness of 5 mm, ensuring durability and effective fluid handling. A supply tank with a capacity of 3000 L was strategically installed on the rooftop to facilitate the gravitational flow of HTF, as illustrated in Figure 14. Given the poor thermal conductivity of plastic and the hot and humid weather conditions during the testing period, insulation for the supply tank was deemed unnecessary.
Figure 14.
Integration of different equipment.
This blue supply tank was replenished using a pump connected to the outlet of the Flat-Plate Collector (FPC), ensuring a steady supply of HTF for the system. To regulate the flow of the HTF entering the storage tank, a ball valve was employed at the HTF inlet. The system incorporated two pumps to ensure efficient fluid circulation. The first pump was dedicated to maintaining a closed-loop circulation of HTF from the outlet of the HTF storage tank back to the supply tank. The second pump, located at the outlet of the FPC, was used to deliver HTF at a high head, ensuring optimal flow throughout the system. The closed-loop circulation of the HTF was maintained using a 1.5-horsepower pump, ensuring a consistent flow throughout the system. Two FPCs were connected in a series to enhance the temperature of the HTF, which in this case was water. Each FPC had dimensions of approximately 1 m by 2 m, enabling a significant surface area for solar energy absorption. This large surface area, combined with the high intensity of solar irradiance, made it possible to heat roughly 100 L of water. The performance of an FPC is directly influenced by useful energy (Qu), along with the heat capacity and temperature difference in the HTF. These parameters are essential for determining the mass flow rate of the HTF, which is a critical aspect of optimizing the system’s efficiency and ensuring effective heat transfer. K-type thermal sensors are particularly well-suited for immersion applications, where their sensing element comes into direct contact with molten or liquid substances. The K-type thermocouple mounting with a TES tank is shown in Figure 15, this type of thermocouple has an impressive operating temperature range, capable of measuring from −200 °C to 1200 °C, making it ideal for monitoring a wide spectrum of thermal conditions. The principle behind its operation is the Seebeck effect, which involves generating an electromotive force (EMF) when the sensor is exposed to a thermal gradient. Specifically, when the sensing junction (hot junction) of the thermocouple experiences a temperature, it produces a voltage. This voltage is directly proportional to the temperature difference between the hot junction and the reference junction (cold junction), enabling precise temperature measurements.
Figure 15.
K-type thermocouple mounting.
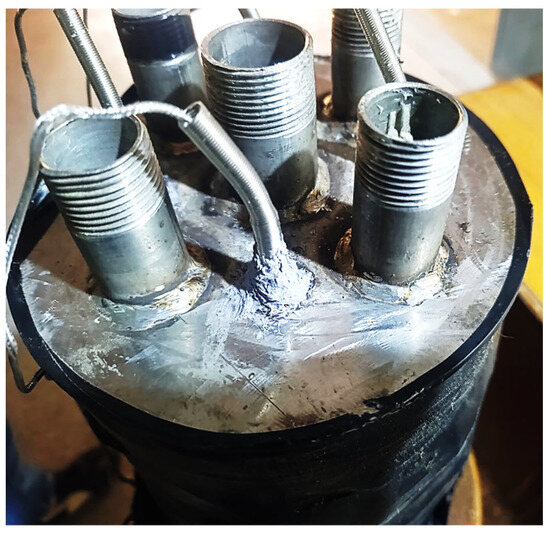
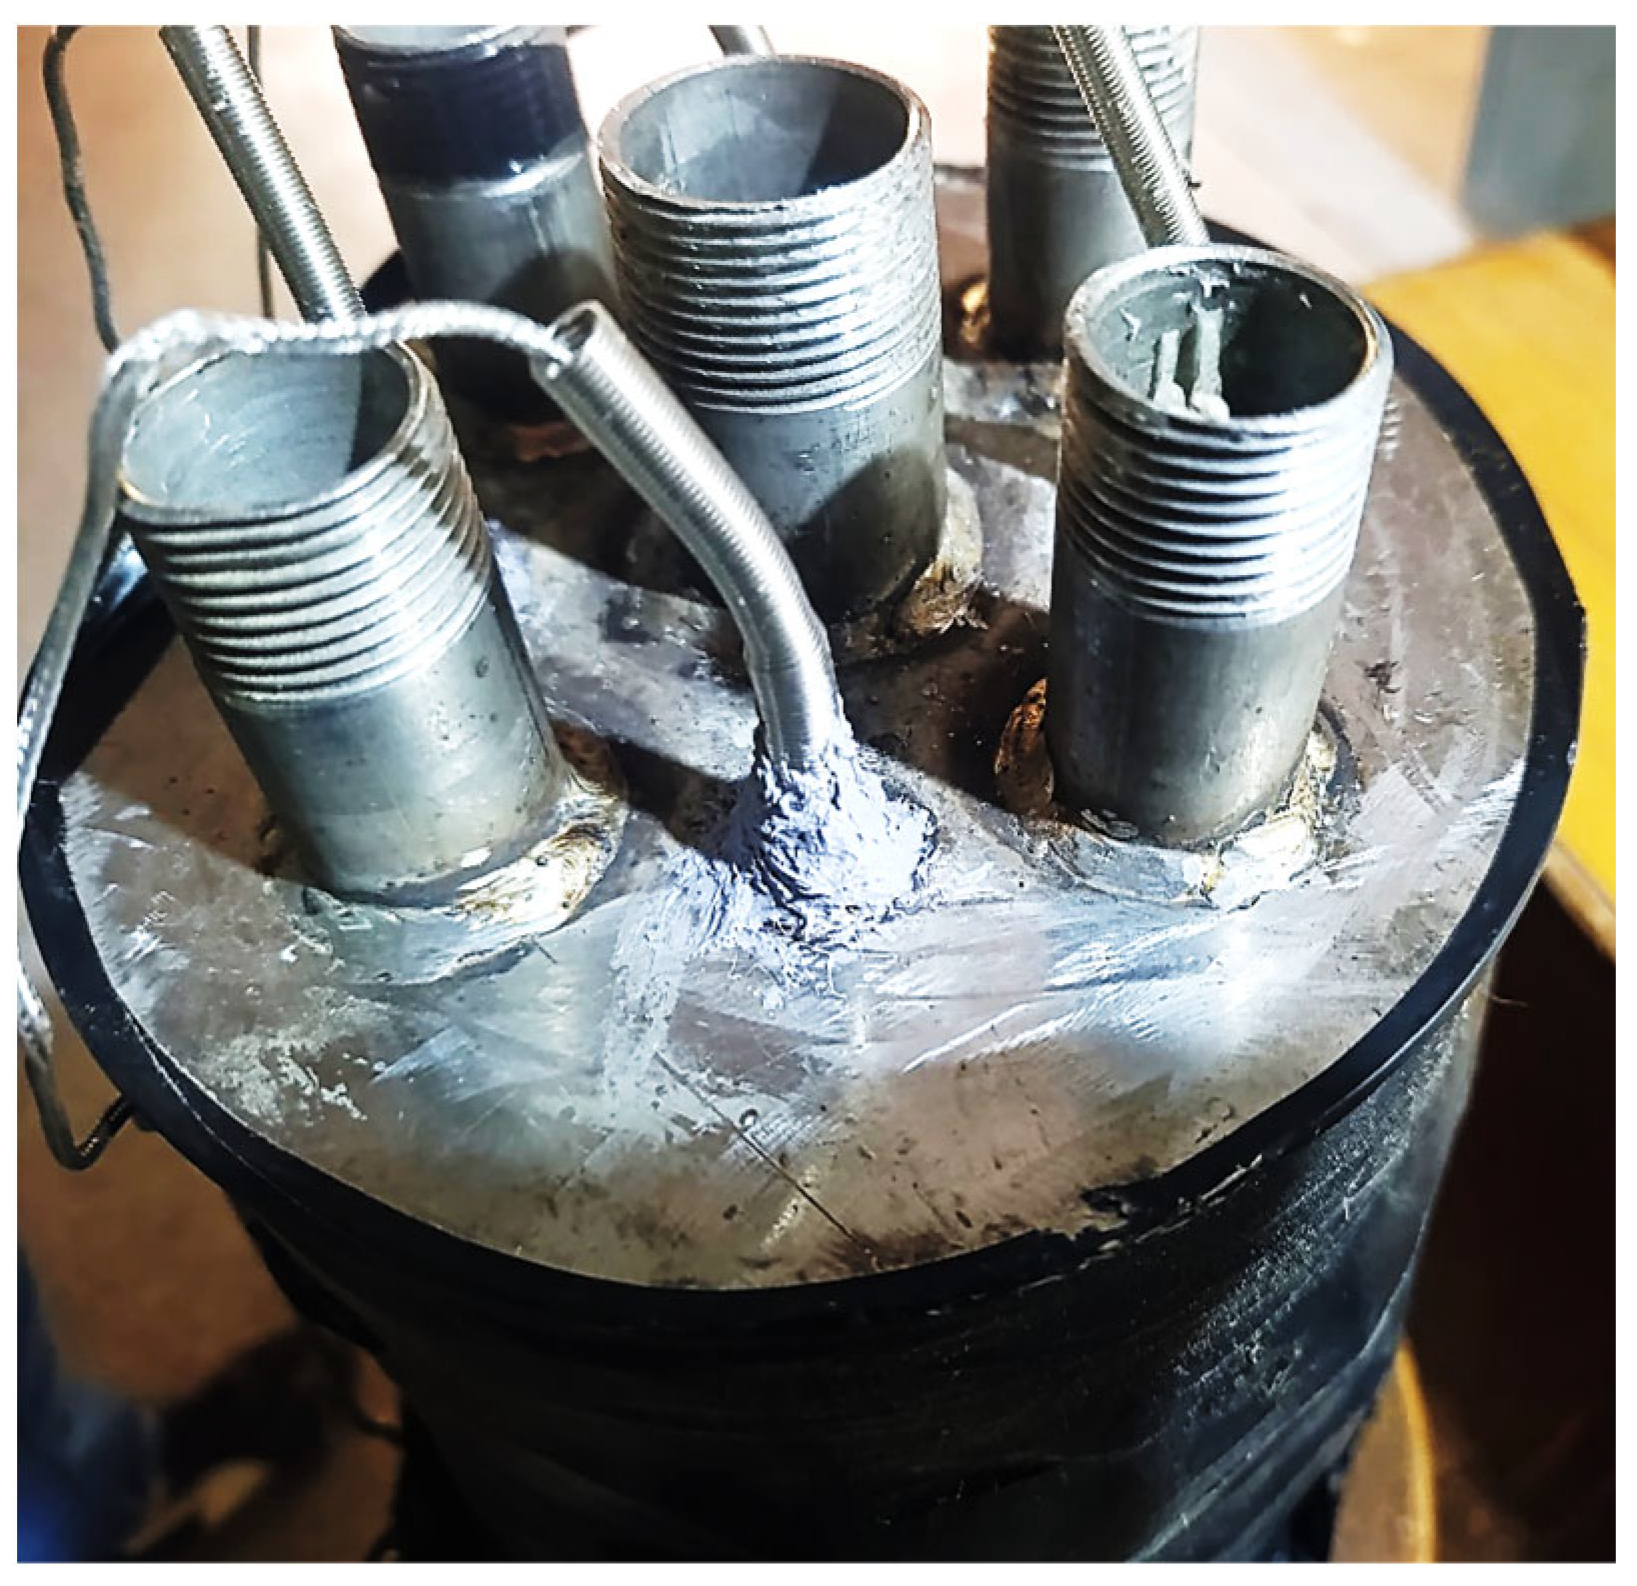
To prevent any potential leakage from the sensor entry points, Room-Temperature Vulcanizing (RTV) silicone sealant was applied around the outer surfaces of the sensors. This sealing provided a reliable, leak-proof installation, ensuring the integrity of the tank and accurate thermal data collection.
5. Physical Melting of Paraffin Wax RT50 in TES
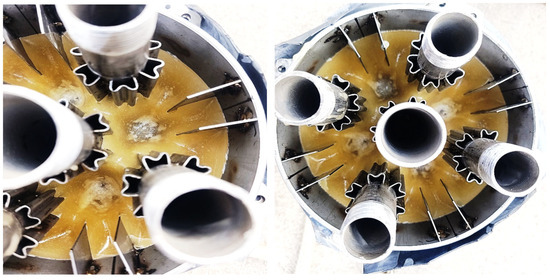
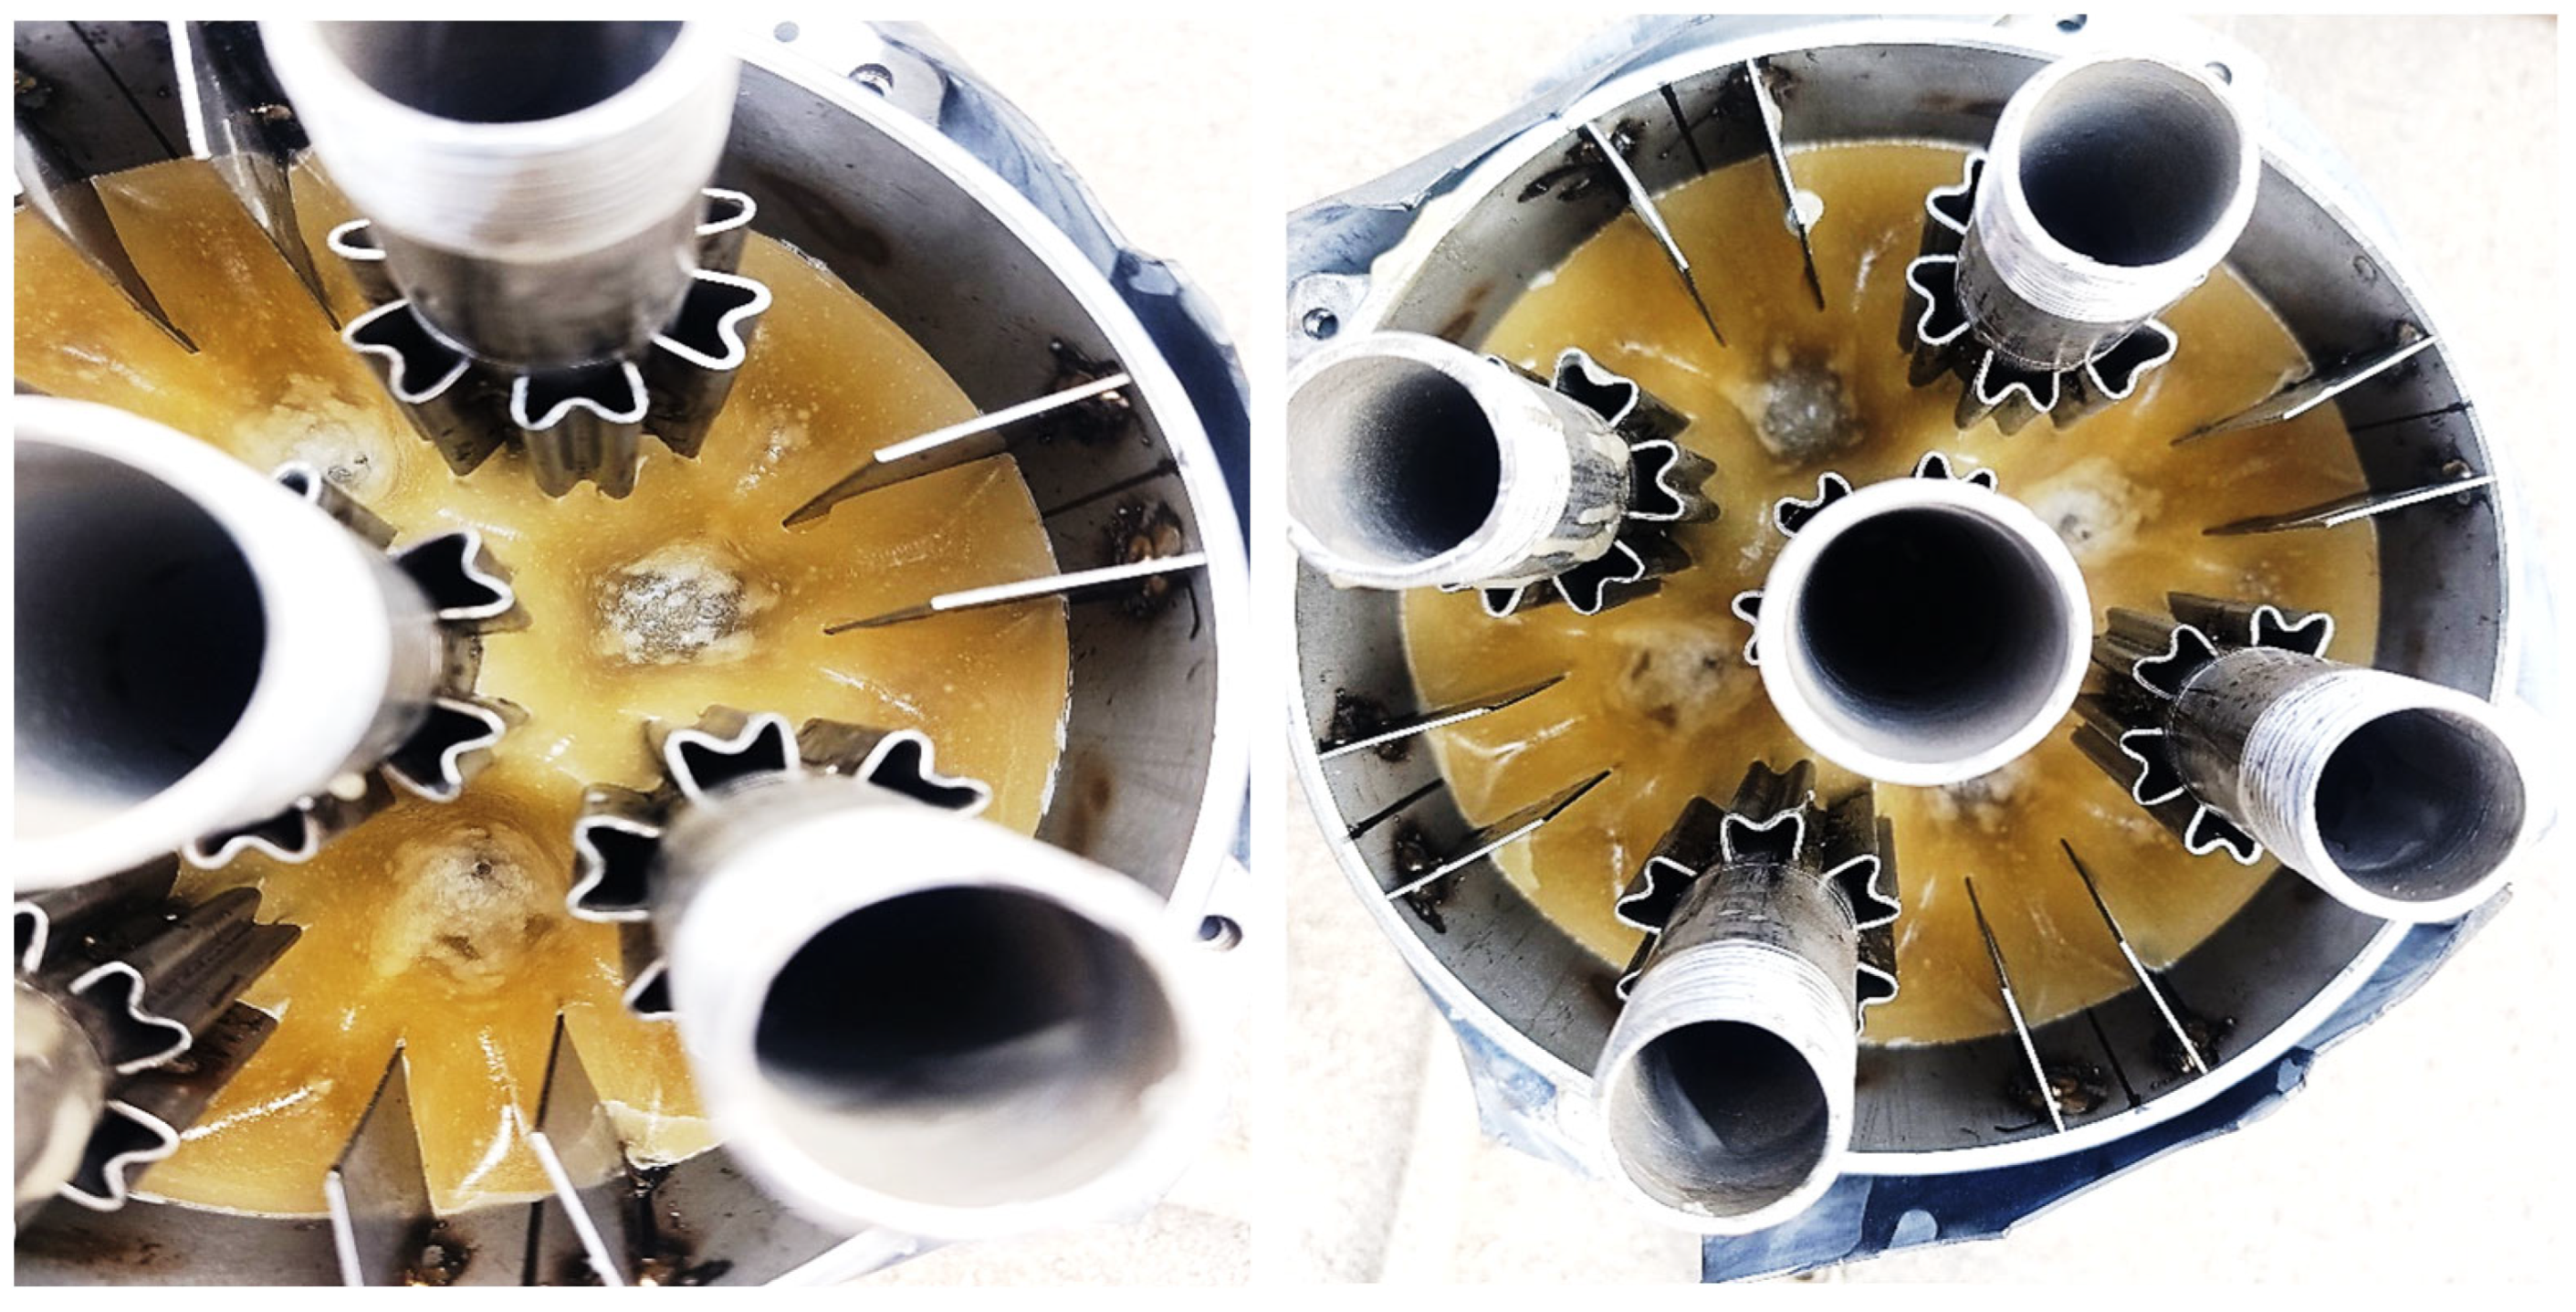
The melting process of the PCM, as discussed earlier, was analyzed using a numerical approach. This method allows for a detailed, step-by-step assessment of the liquid content within the PCM storage tank. By setting specific time intervals, the numerical approach provides precise insights into the progression of melting, enabling the quantification of the liquid fraction over time. However, in real-world applications, visually inspecting the extent of melting is challenging due to the time-consuming nature of dismantling the storage system. To address this issue, temperature sensors were strategically installed around the periphery of the storage tank. These sensors serve as indirect indicators of the PCM’s thermal state, as the recorded temperature changes are intrinsically linked to the melting process. The progression of melting is illustrated in Figure 16, which shows that complete melting was achieved within 51 min of the charging process. The melting duration in a practical situation was 7 min greater than the simulation results from fluent software due to several parameters like heat losses to environment, non-ideal heat distribution inside the tank, etc. During this time, the temperature of the PCM rose to 50.8 °C (324 K). At this point, the temperature remained stable due to the latent heat absorption characteristic of the PCM, which mitigates temperature fluctuations during the phase transition.
Figure 16.
Melting of PCM in practically developed LHS unit.
While minor discrepancies were observed between the readings of the various temperature sensors, once the reading indicated fully thermal equilibrium by having the same reading from every thermocouple, the tank was dismantled for visual inspection. After 51 min, thermal deviations were almost zero, indicating a PCM phase shift from solid to liquid. The storage tank was intentionally not filled to its full capacity with PCM; approximately 5% of its volume was left unfilled to facilitate easier handling and dismantling. This design choice was crucial for enabling the convenient removal of the tank from its mounting frame for visual inspection purposes. Upon dismantling, no signs of solidification were observed, confirming that the PCM had fully transitioned into the liquid phase.
This also indicated that the PCM retained sufficient latent heat to prevent re-solidification during the dismantling process. The removal of the storage tank from the mounting frame took approximately 4–5 min. During this time, as shown in Figure 16, no solid PCM was detected. To minimize heat loss and ensure thermal stability, the tank was insulated using a layer of rubber. This insulation effectively functioned as an adiabatic barrier, as corroborated by the CFD analysis conducted earlier. Experimental melting was rapid due to this fin approach and was 16 min faster than bare tubes, as indicated in Figure 4d.
6. Experimental Investigations About Discharging/Solidification of RT50
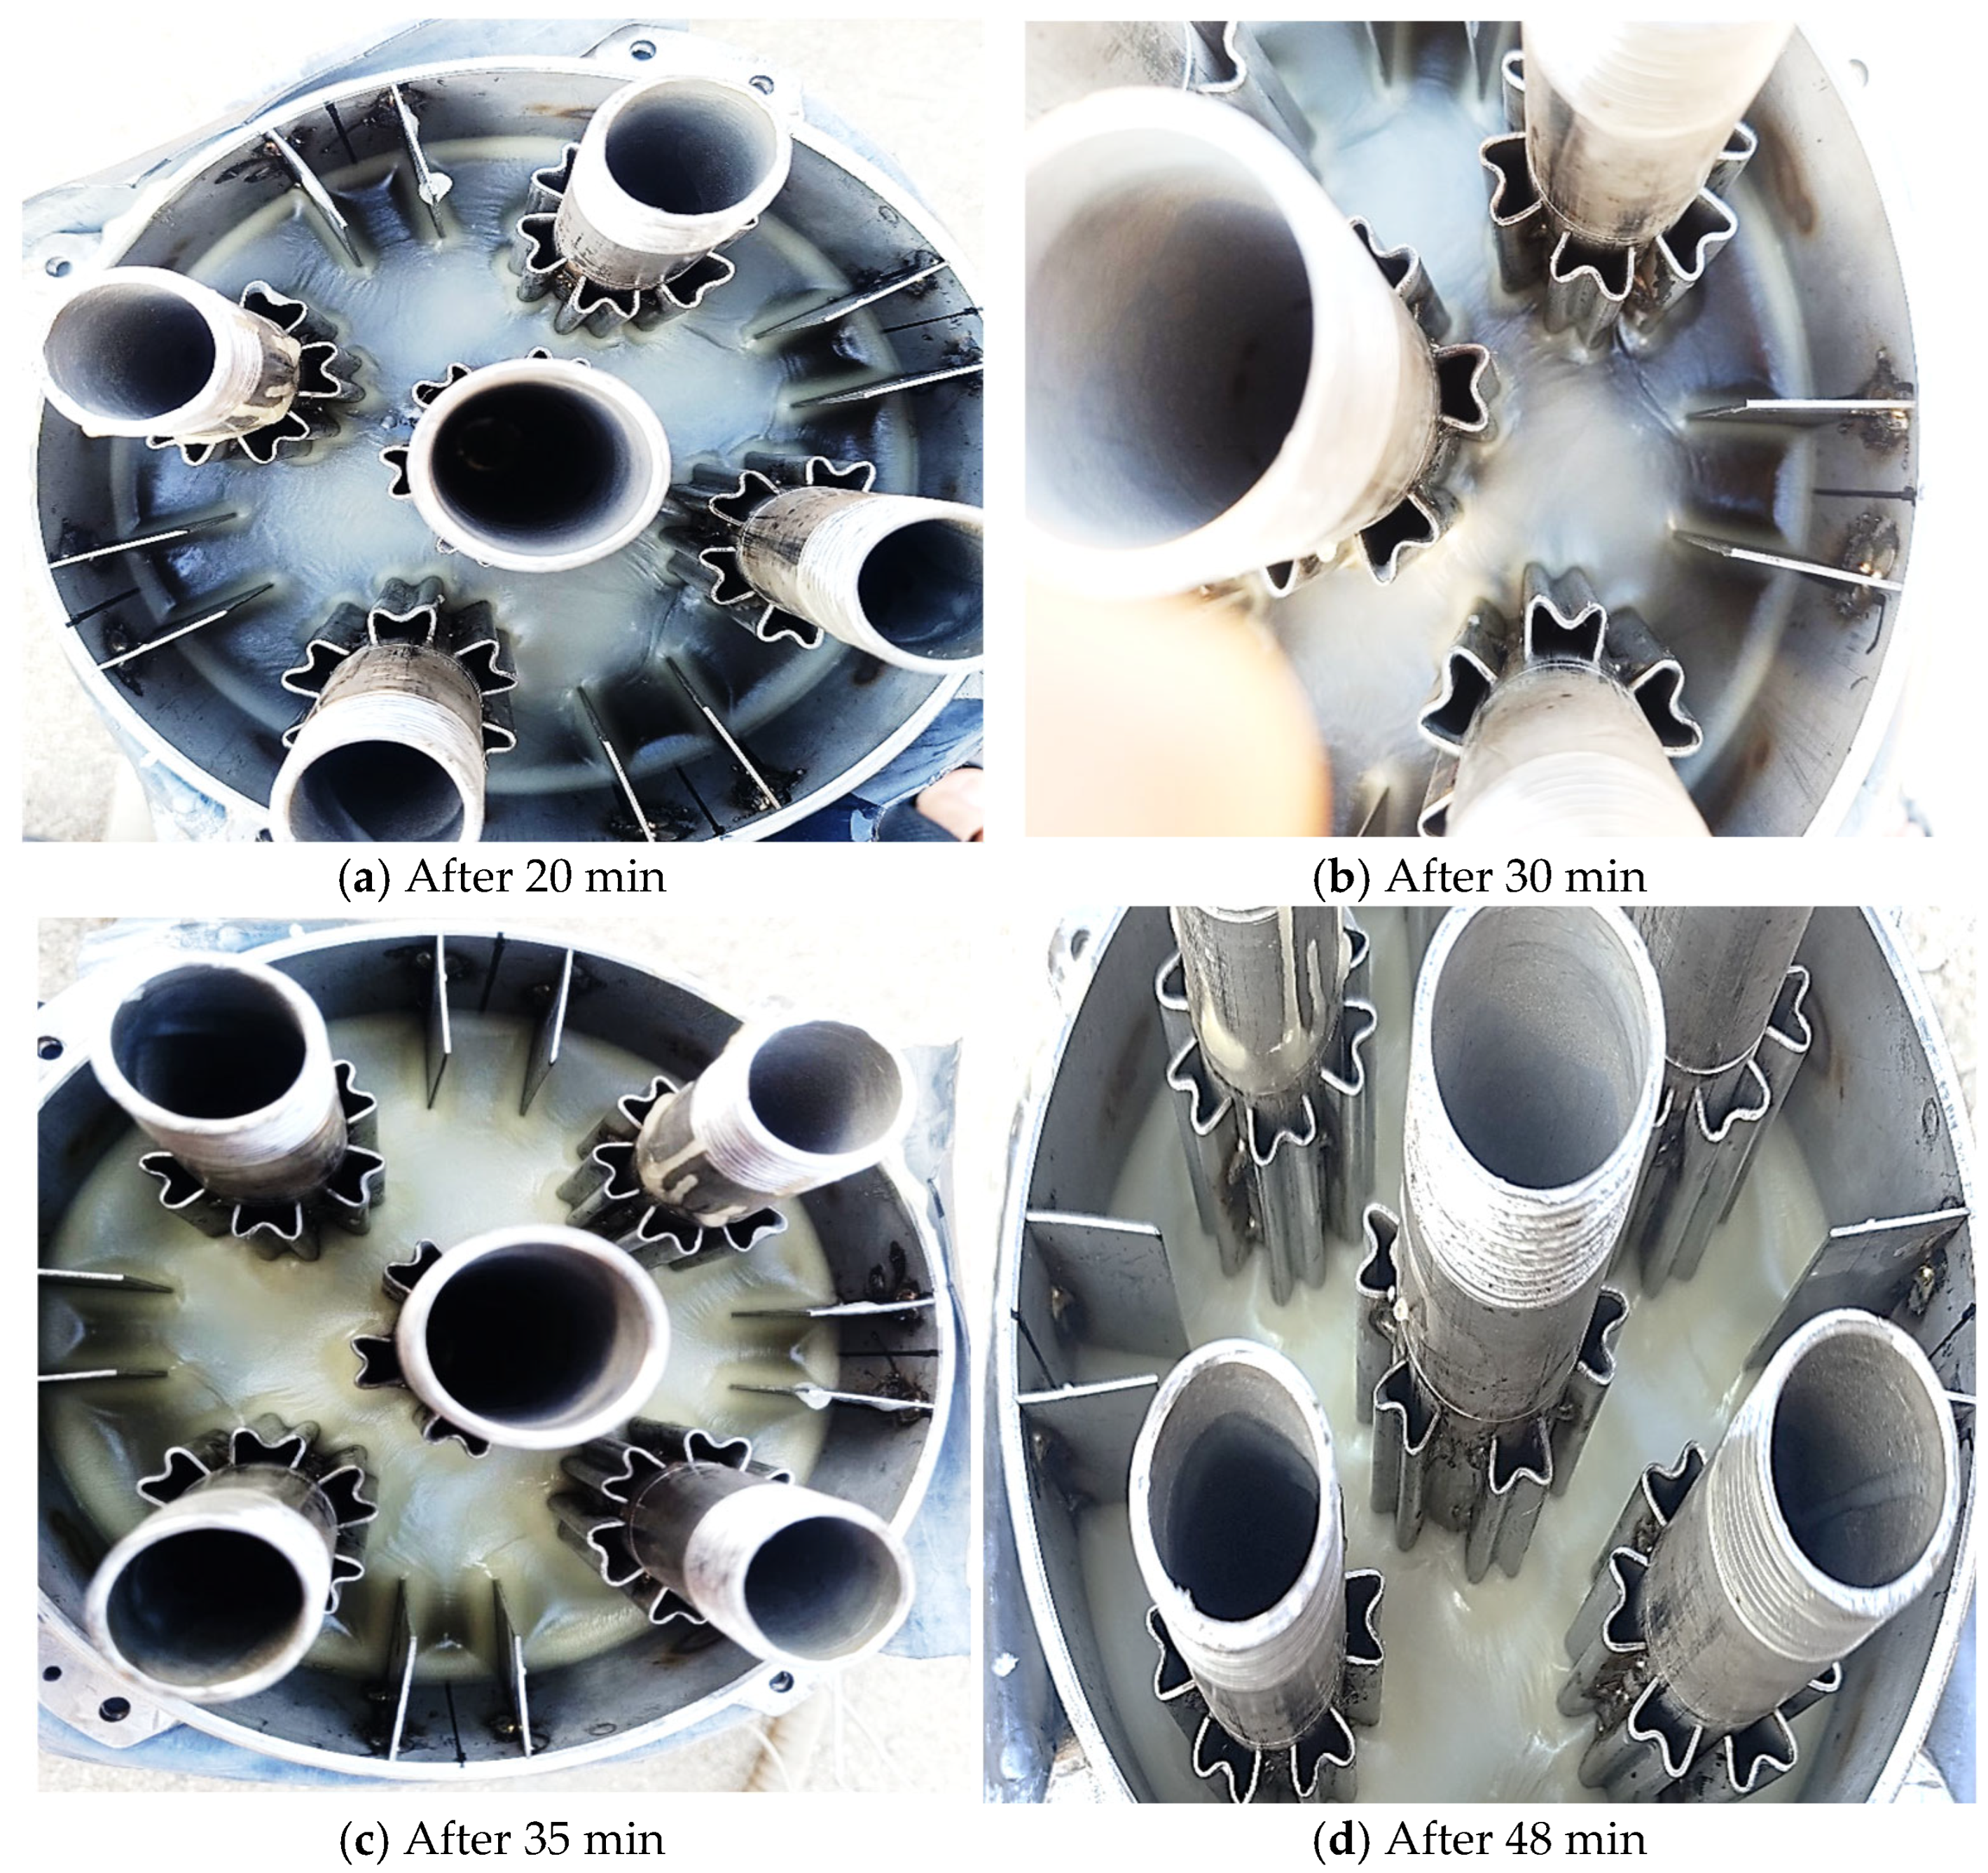
During the charging process, the phase transformation from solid to liquid occurred as heat was absorbed from the HTF to facilitate the phase transition. Conversely, during the discharging process, the liquid PCM transitioned back to a solid state while releasing heat to the circulating fluid. This system was integrated with water supply lines, where water entered at a normal atmospheric temperature of 20 °C and maintained the same flow rate as the HTF. The complete transition from liquid to solid was achieved within 48 min as demonstrated in Figure 17. A total of 8.9 kg of mass of PCM was used experimentally in this tank having combined fins, and 1.1 kg of mass was replaced because of the fins.
Figure 17.
Complete solidification of RT50.
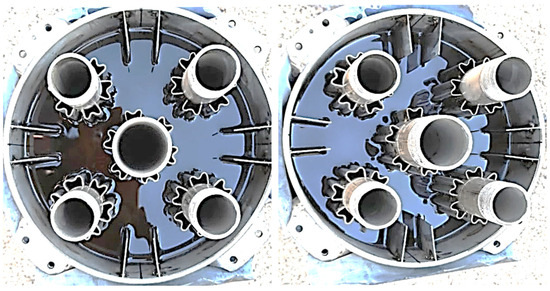
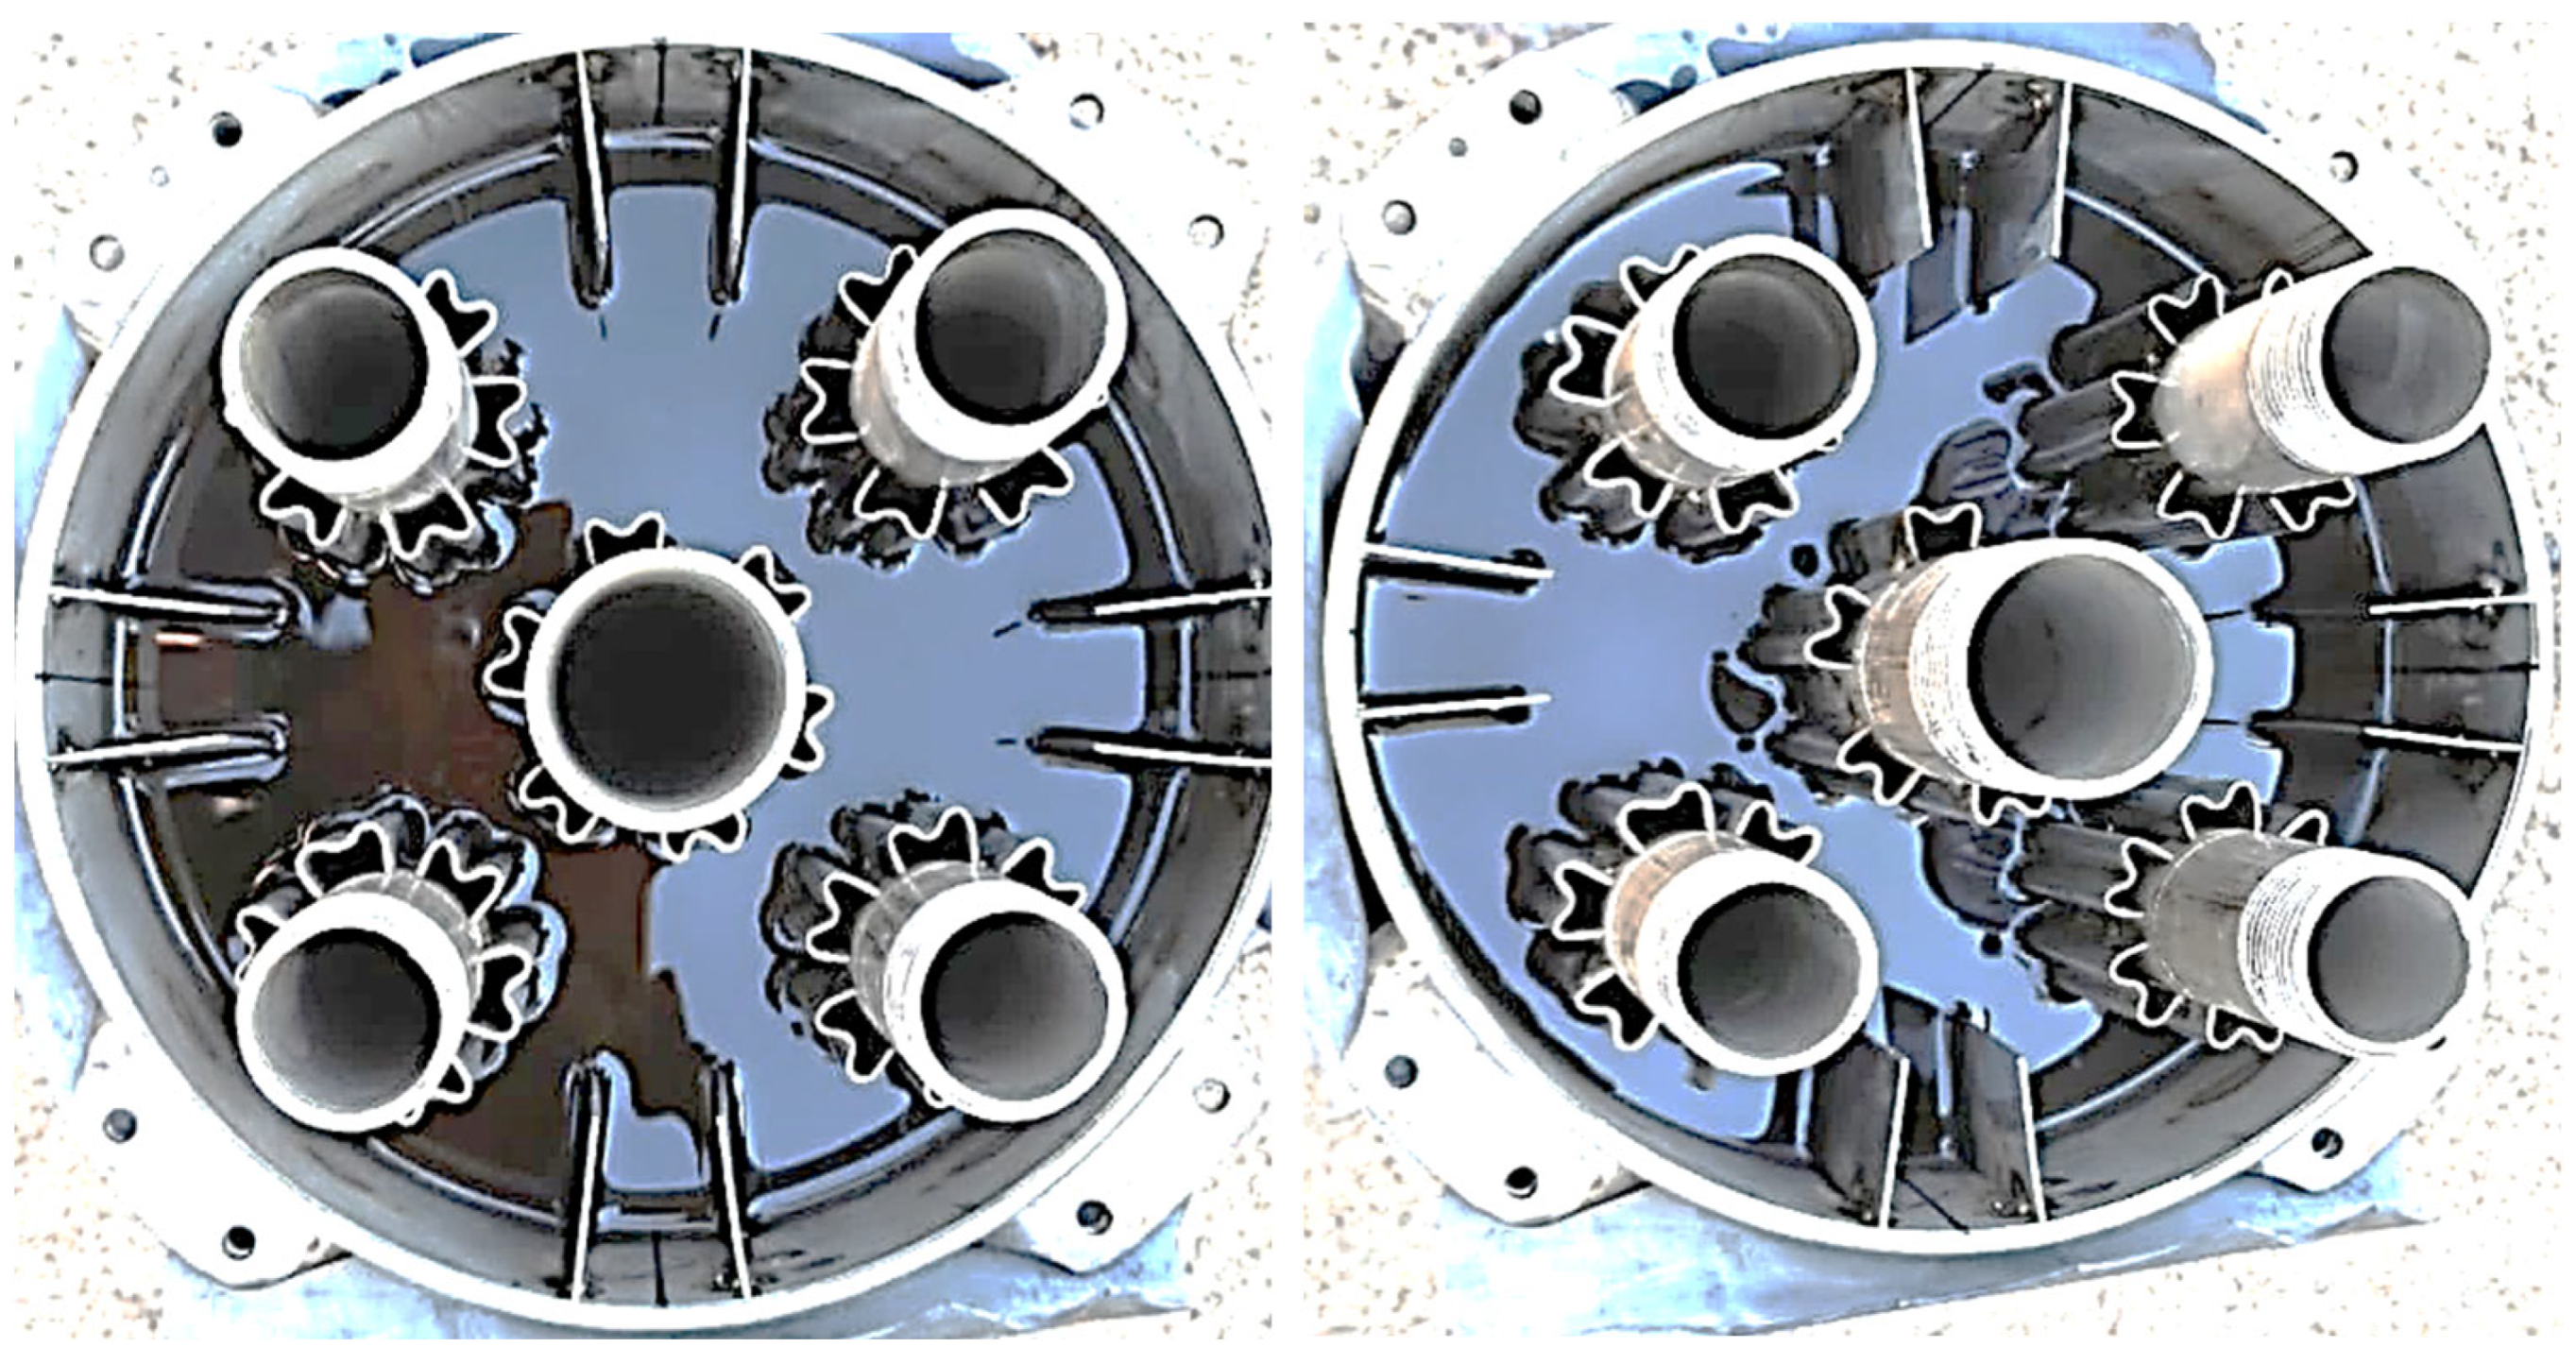
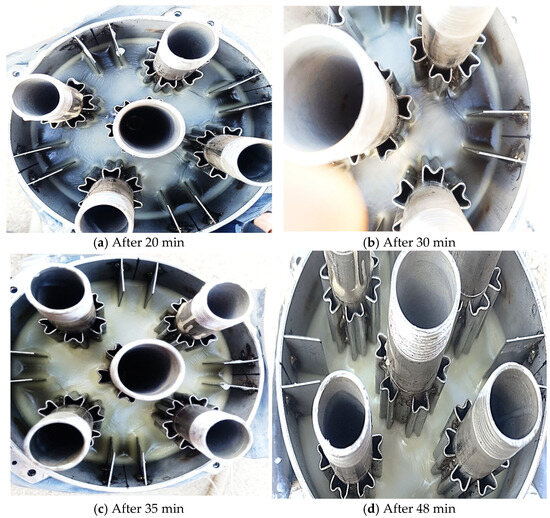
Figure 18 illustrates the full phase transition of liquid PCM into a solid. Temperature sensors were used to monitor thermal variations, thereby linking the melting and solidification processes. The discharging process was examined by detaching the storage tank from the water supply lines. The storage tank was covered by top covers and thermal sensors mounted on them, and covers removed for visual inspection. A visual inspection showed that approximately 50% of the PCM had undergone phase change after 30 min of discharging. This transformation was most prominent near the central HTF tube and its surroundings, due to the higher rate of heat transfer in these regions. As the process progressed, shifting from a liquid to a solid resulted at a faster rate due to the formation of large nucleation sites and natural convection bolstered heat dissipation from liquid PCM to the environment. Figure 18d demonstrates this concept by illustrating complete solidification after a 48 min duration.
Figure 18.
Discharging/solidification of PCM inside storage tank at different time durations.
Consequently, after 30 min, only a minimal phase transformation was observed, and regions farther from the HTF tubes retained a liquid fraction of the PCM, as depicted in Figure 18b. By 35 min, the PCM near the tank walls transitioned into a viscous solid state, as shown in Figure 18c. Temperature sensor readings stabilized after 48 min, indicating thermal equilibrium within the storage tank and the completion of the phase change from liquid to solid. The discharging duration was 3 min shorter than the charging duration due to factors such as the convection mode, imperfect thermal insulation, and the brief opening of the upper lid which, although minor, still influenced the phase transition. The inlet and outlet regions of the tank were covered by covers which were removed for visual inspection only.
7. Experimental and Numerical Results Comparison for Validation
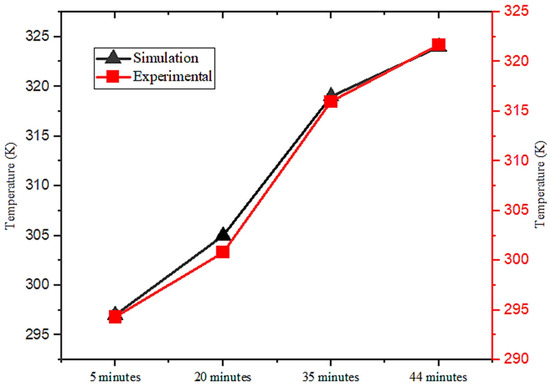
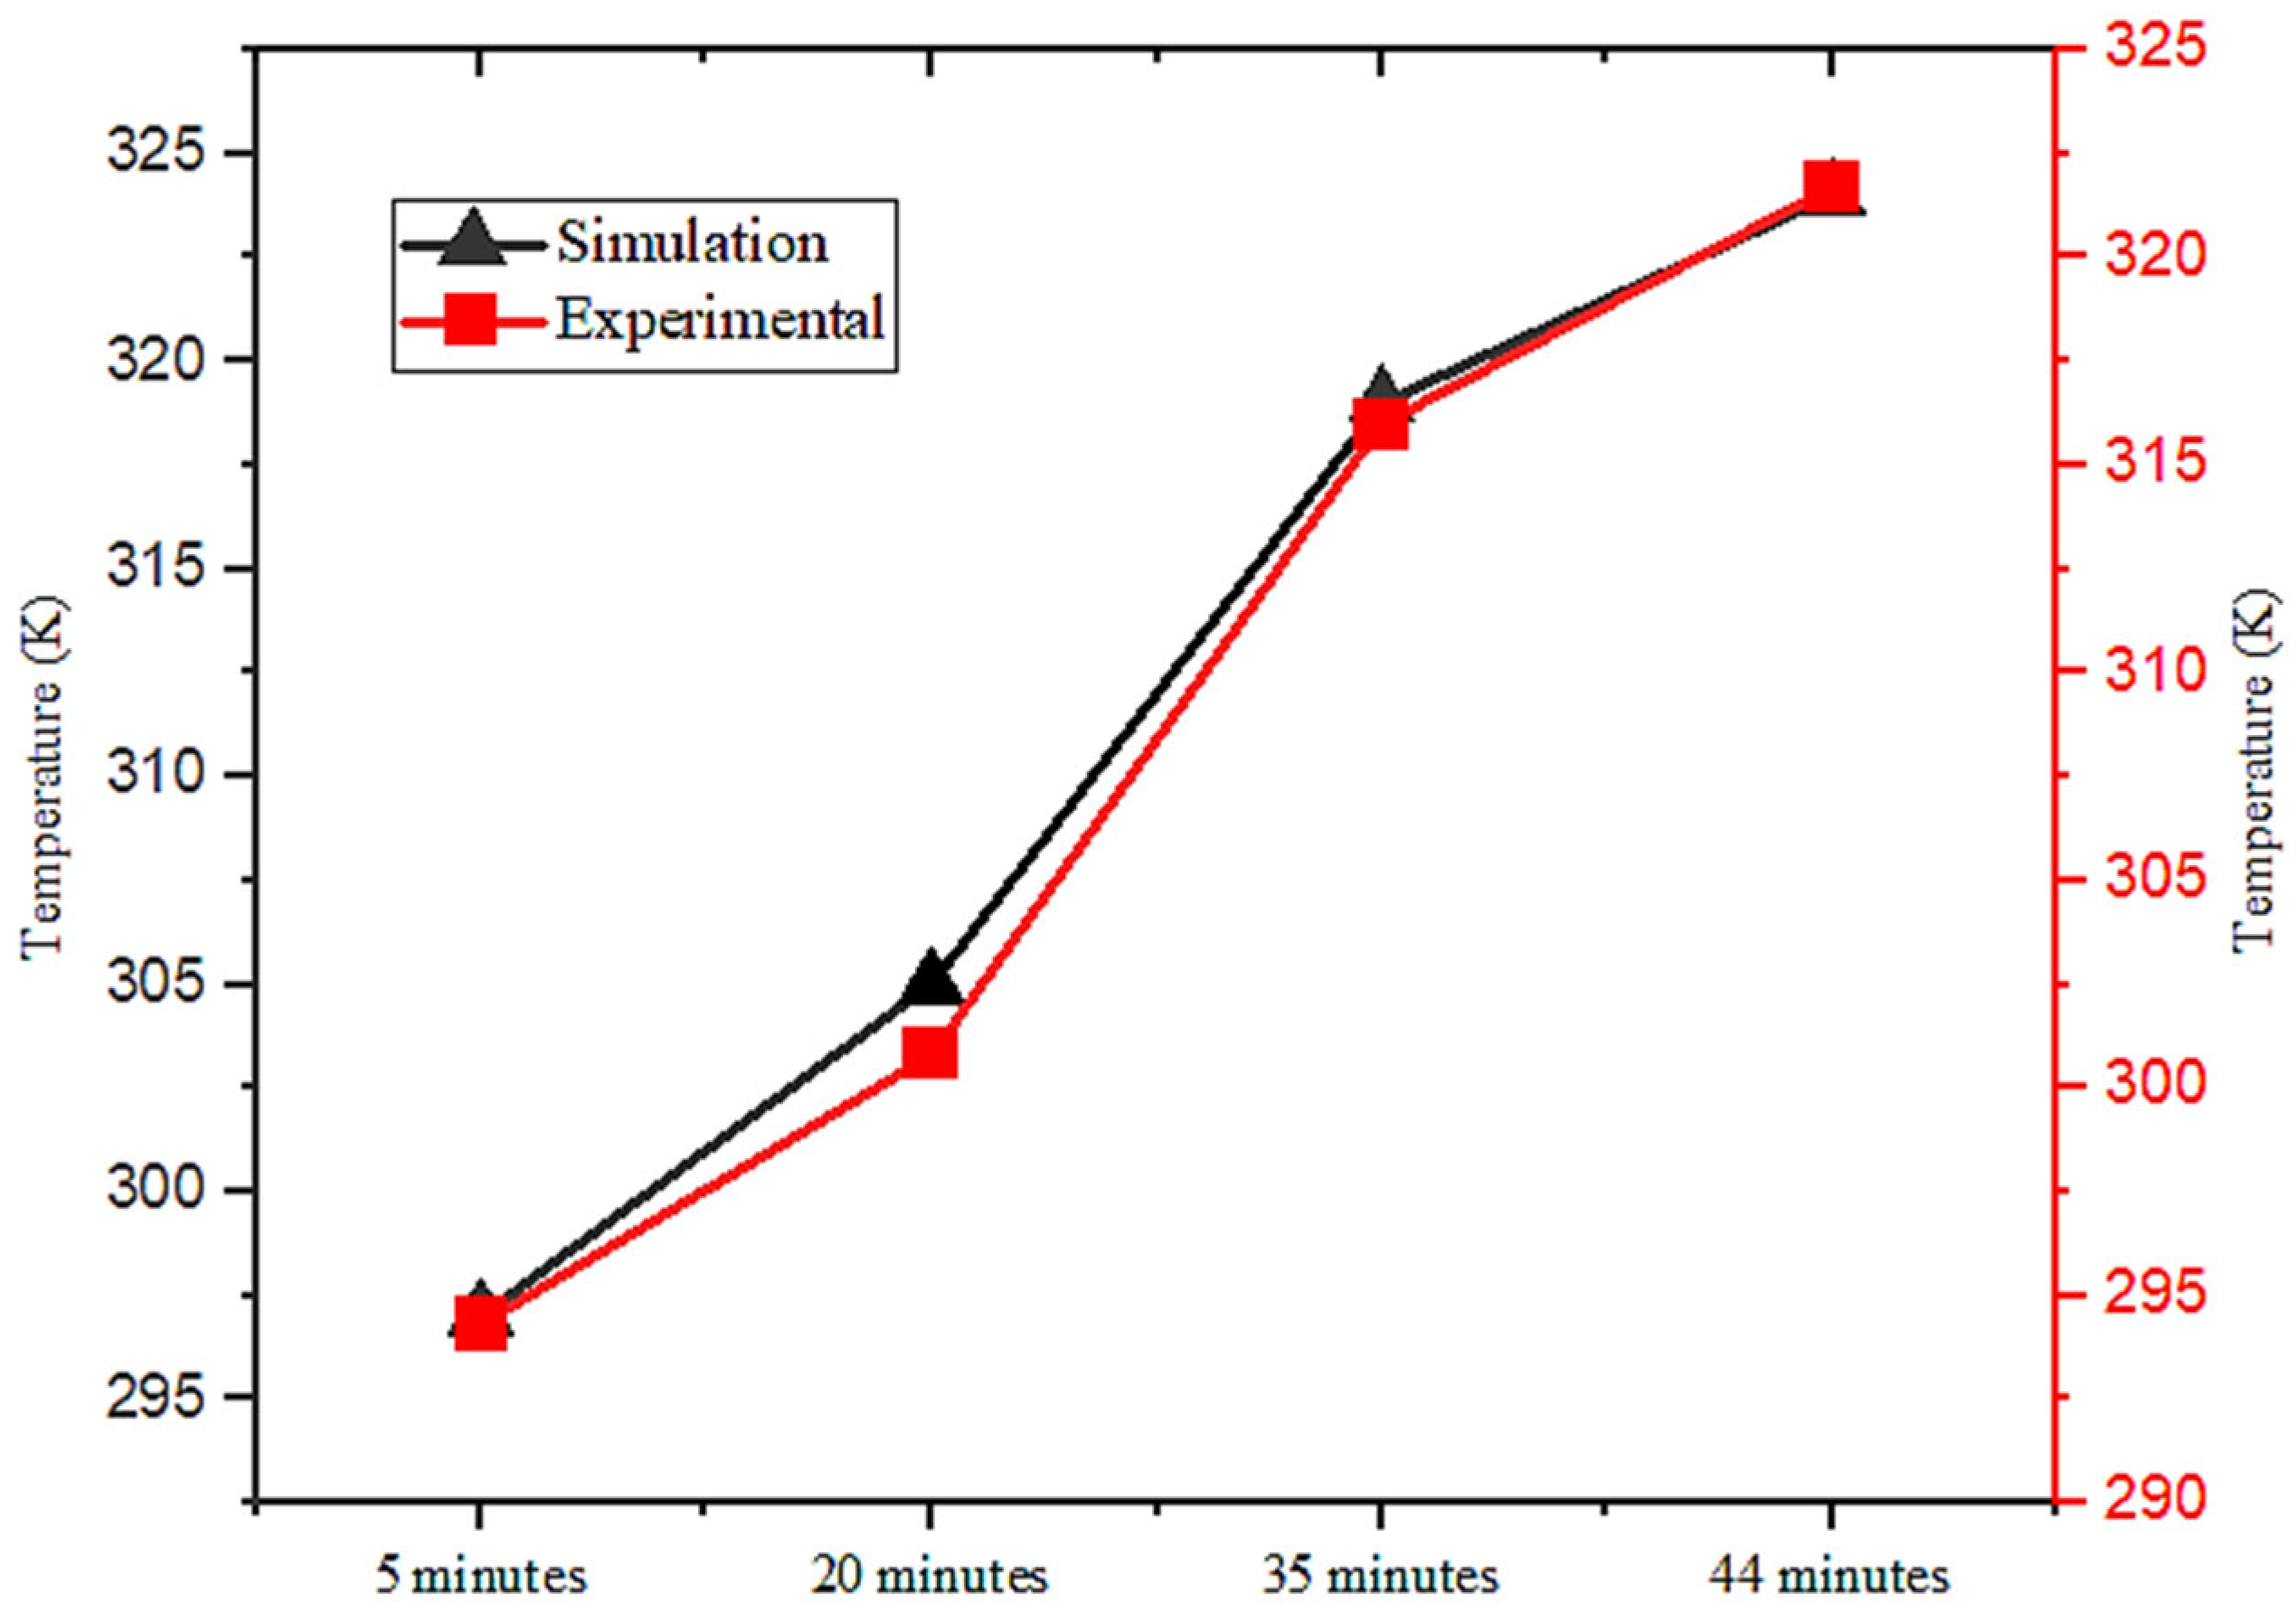
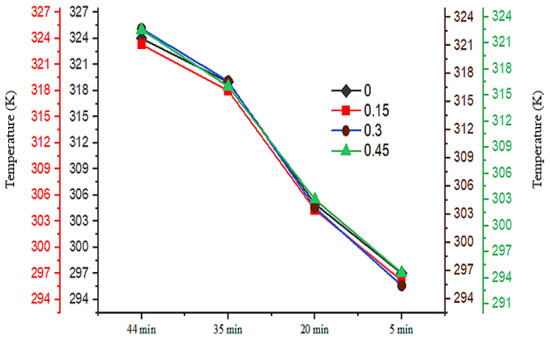
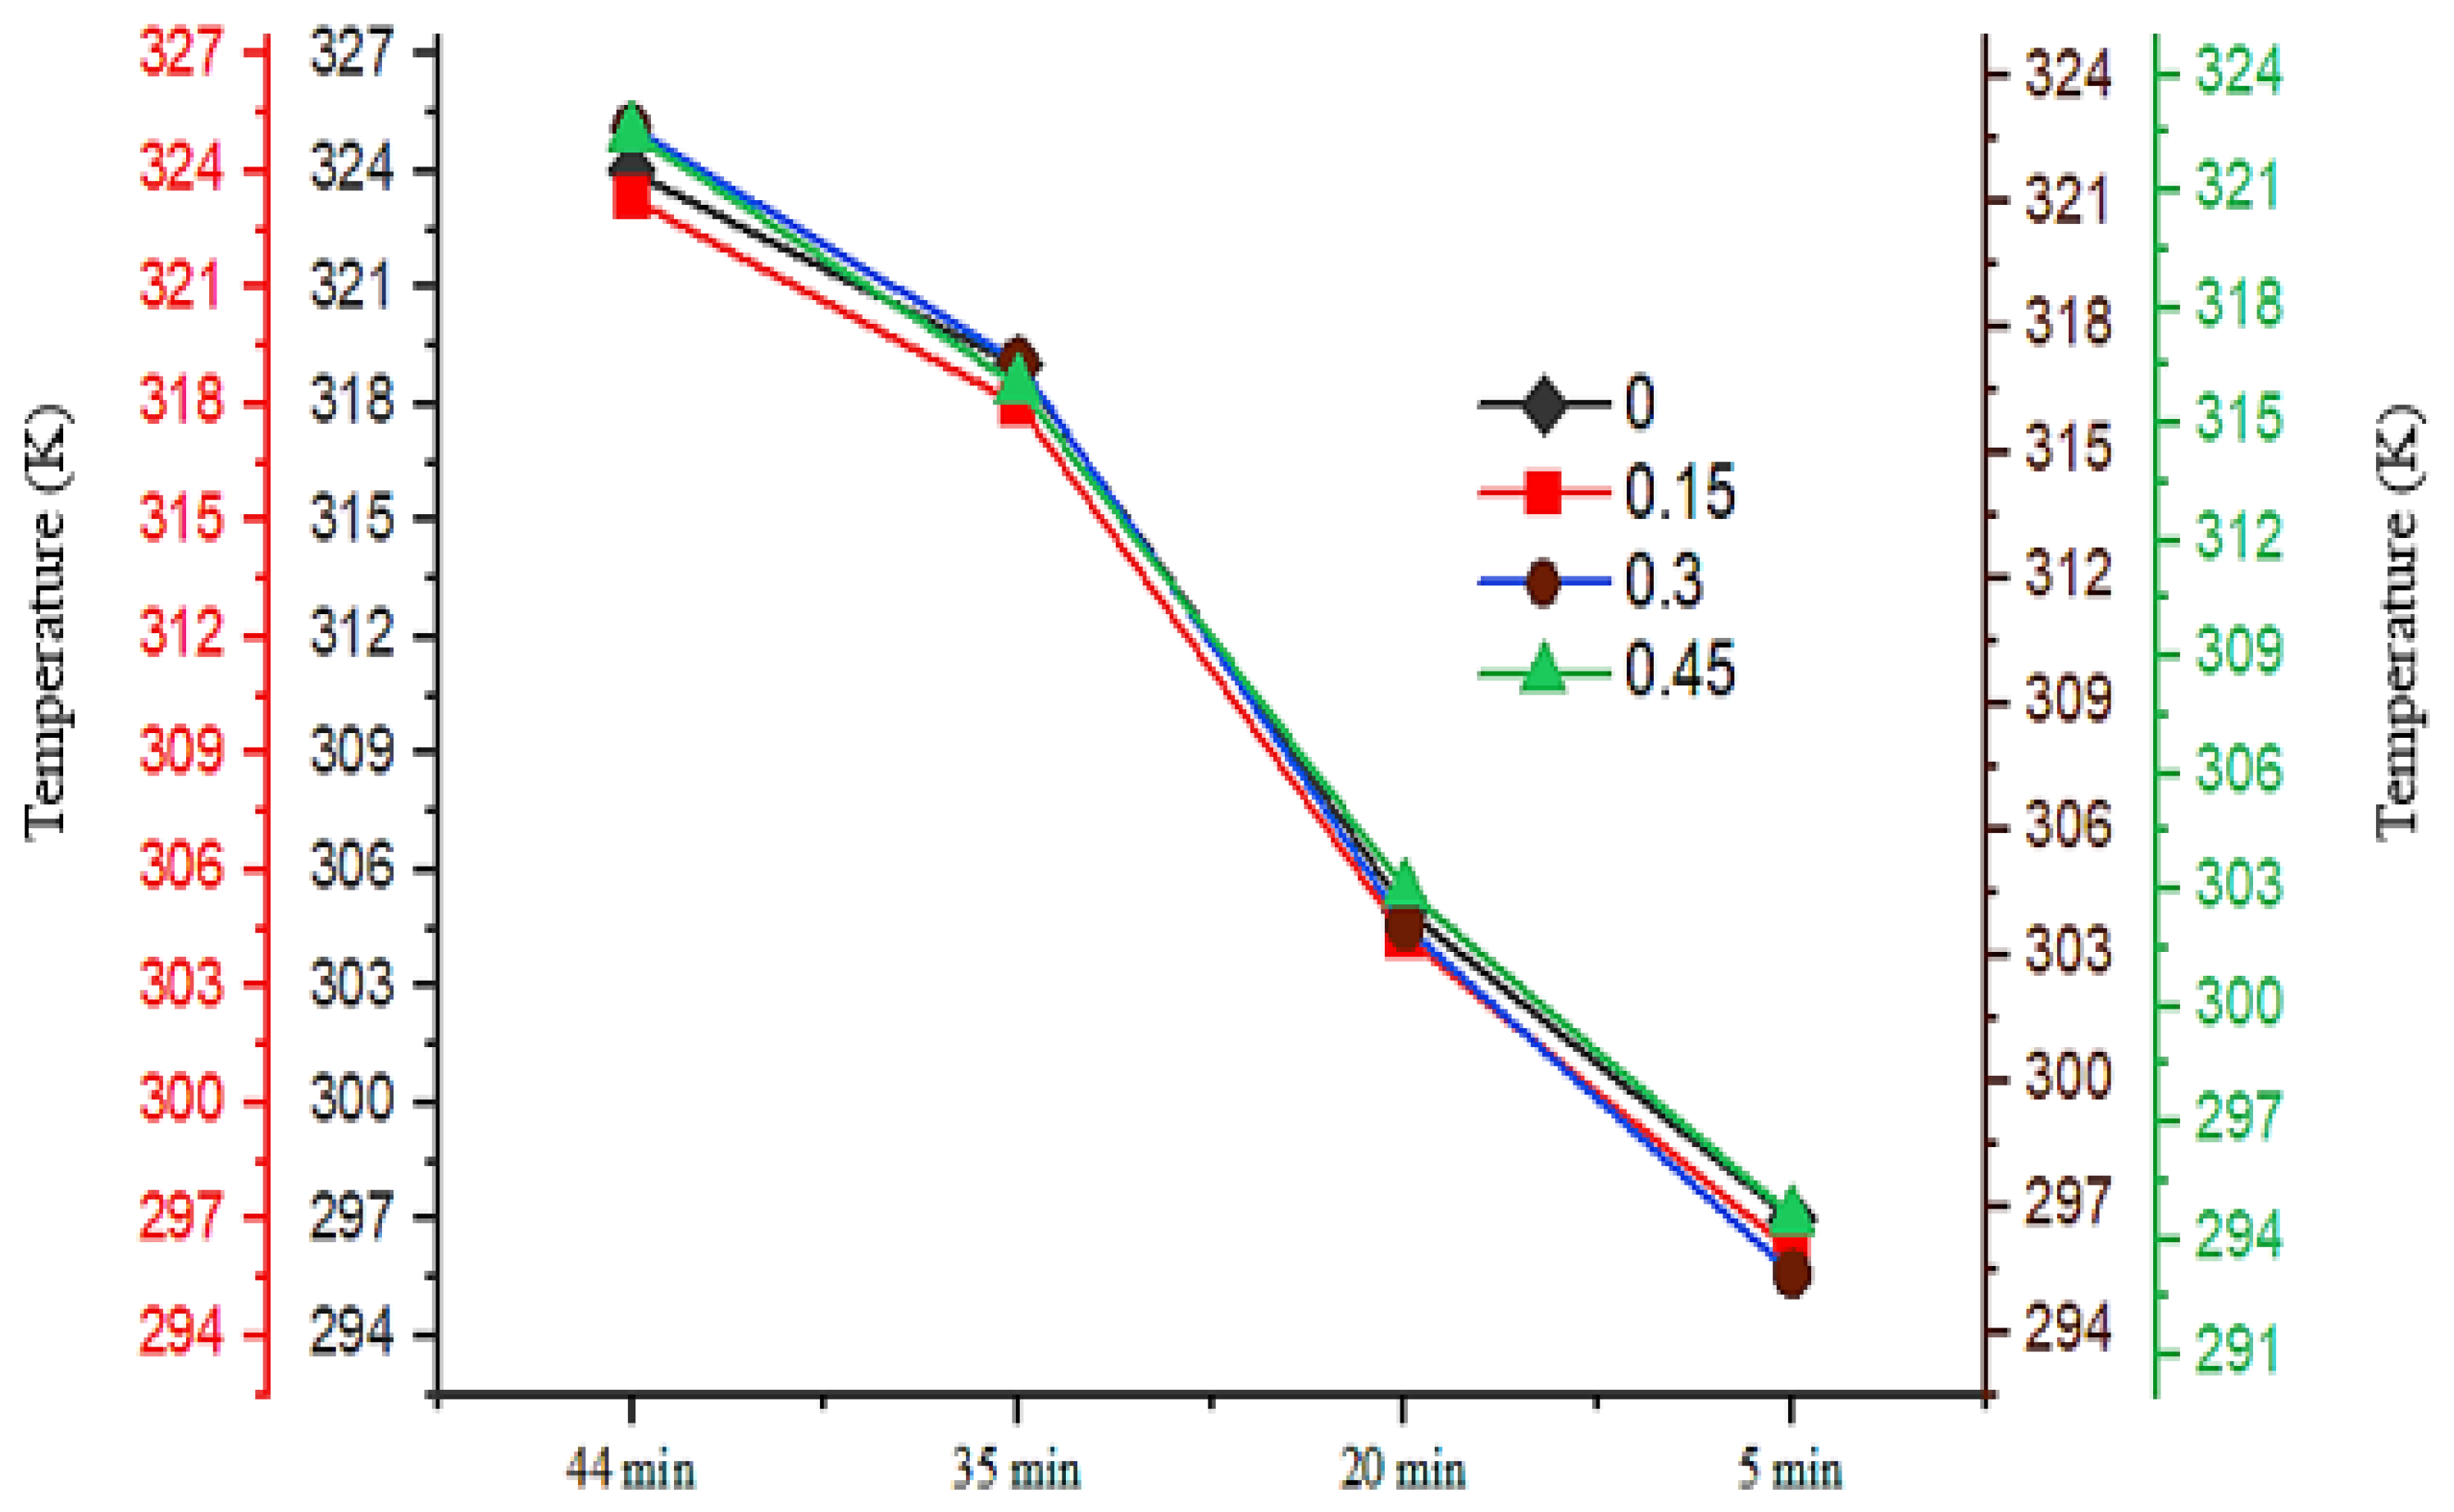
The results of the heat transfer analysis were primarily presented in terms of the liquid fraction. However, temperature readings at specific locations were separately recorded to enable a comparison between experimental and simulation results. To capture the heat transfer dynamics between the HTF tubes and the PCM, K-type thermal sensors were intentionally installed along a 150 mm pitch circle diameter (PCD). These sensors facilitated the accurate measurement of temperature values, which were then compared with simulation data obtained at the same PCD position. Additionally, thermal sensors were mounted at both the inlet and outlet faces of the heat storage tank to validate the results comprehensively. This arrangement ensured that the comparison covered critical entry and exit points of the tank. The experimental temperature readings closely matched the simulation results, although slight discrepancies were observed. These differences are highlighted in Figure 19, particularly at the inlet face of the tank. This comparison underscores the importance of sensor placement and simulation accuracy in achieving reliable validation. The observed differences between the simulation and experimental results can be attributed to several factors, including minor imperfections in the system. These factors include heat losses to the surrounding atmosphere, variations in the thermal conductivity of the tubes due to the welding of fins, and slight deviations in equipment performance. A maximum temperature difference of up to 4 K was recorded at the inlet face of the heat storage tank when comparing the two sets of results.
Figure 19.
Temperature variations at inlet of storage tank.
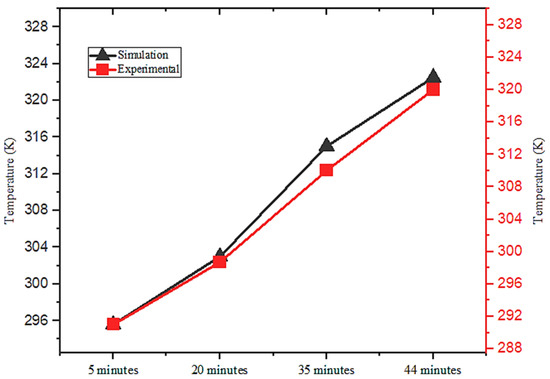
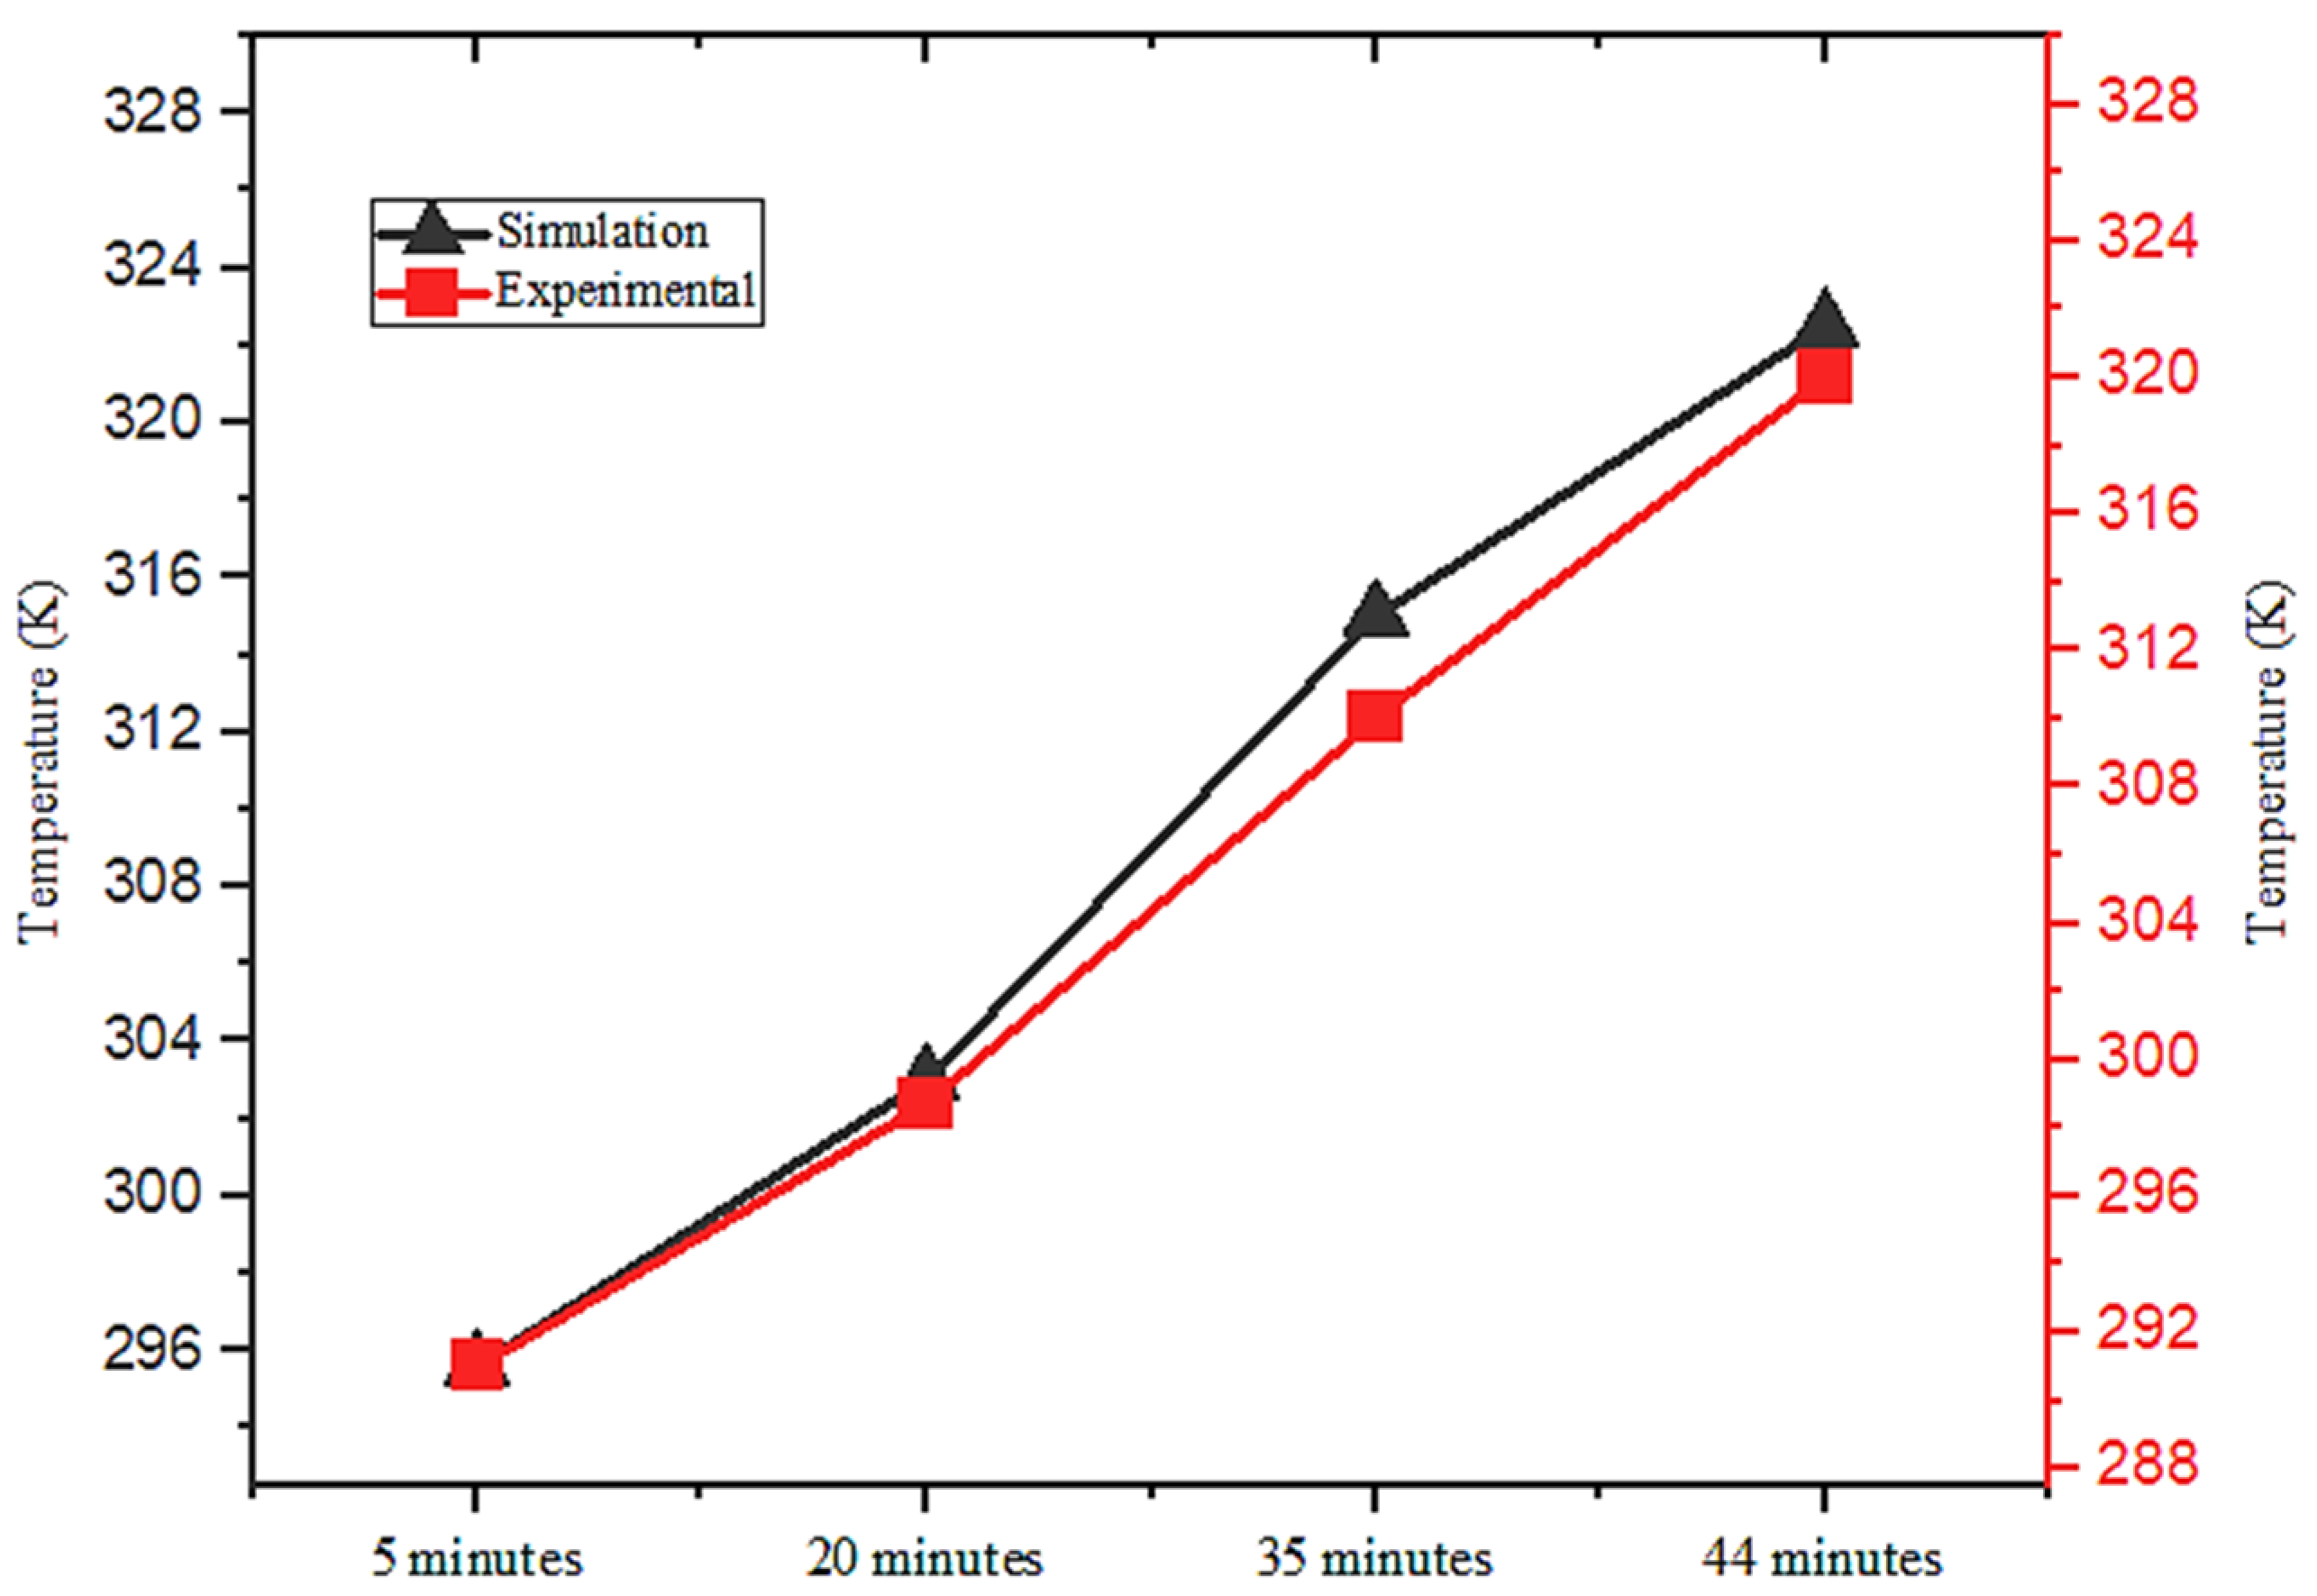
Despite this small discrepancy, the simulations demonstrated a high level of accuracy and were effectively validated by the experimental data. The close agreement between the results highlights the reliability of the simulation approach, with the minor temperature differences falling well within acceptable limits for such analyses. Figure 20 presents a detailed comparison of the temperature readings at the outlet face of the heat storage tank. Upon analysis, a temperature difference of 4 K was observed between the experimental and simulation results. This discrepancy can be attributed to the progressive reduction in the thermal content of the HTF as it flows along the length of the tank. After 44 min, the HTF temperature at the outlet face of the tank reached 322.5 K, which was 1.5 K lower than the corresponding temperature at the inlet face during the same time period. This gradual decline highlights the heat exchange process occurring within the tank. Despite the noted temperature difference, the simulation results demonstrated a high degree of accuracy, effectively capturing the thermal dynamics of the system. The comparison at the outlet face validated the reliability of the simulation model, showcasing its capability to closely replicate experimental observations and provide valuable insights into the heat transfer behavior of the system. Thermal variations along the length of the storage tank were carefully monitored, and the findings are illustrated in Figure 21, highlighting the effectiveness of uniform heat distribution throughout the tank.
Figure 20.
Temperature variations at outlet of storage tank.
Figure 21.
Temperature variations along storage tank length.
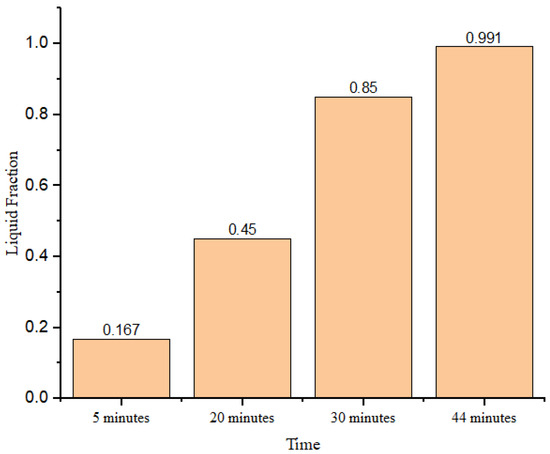
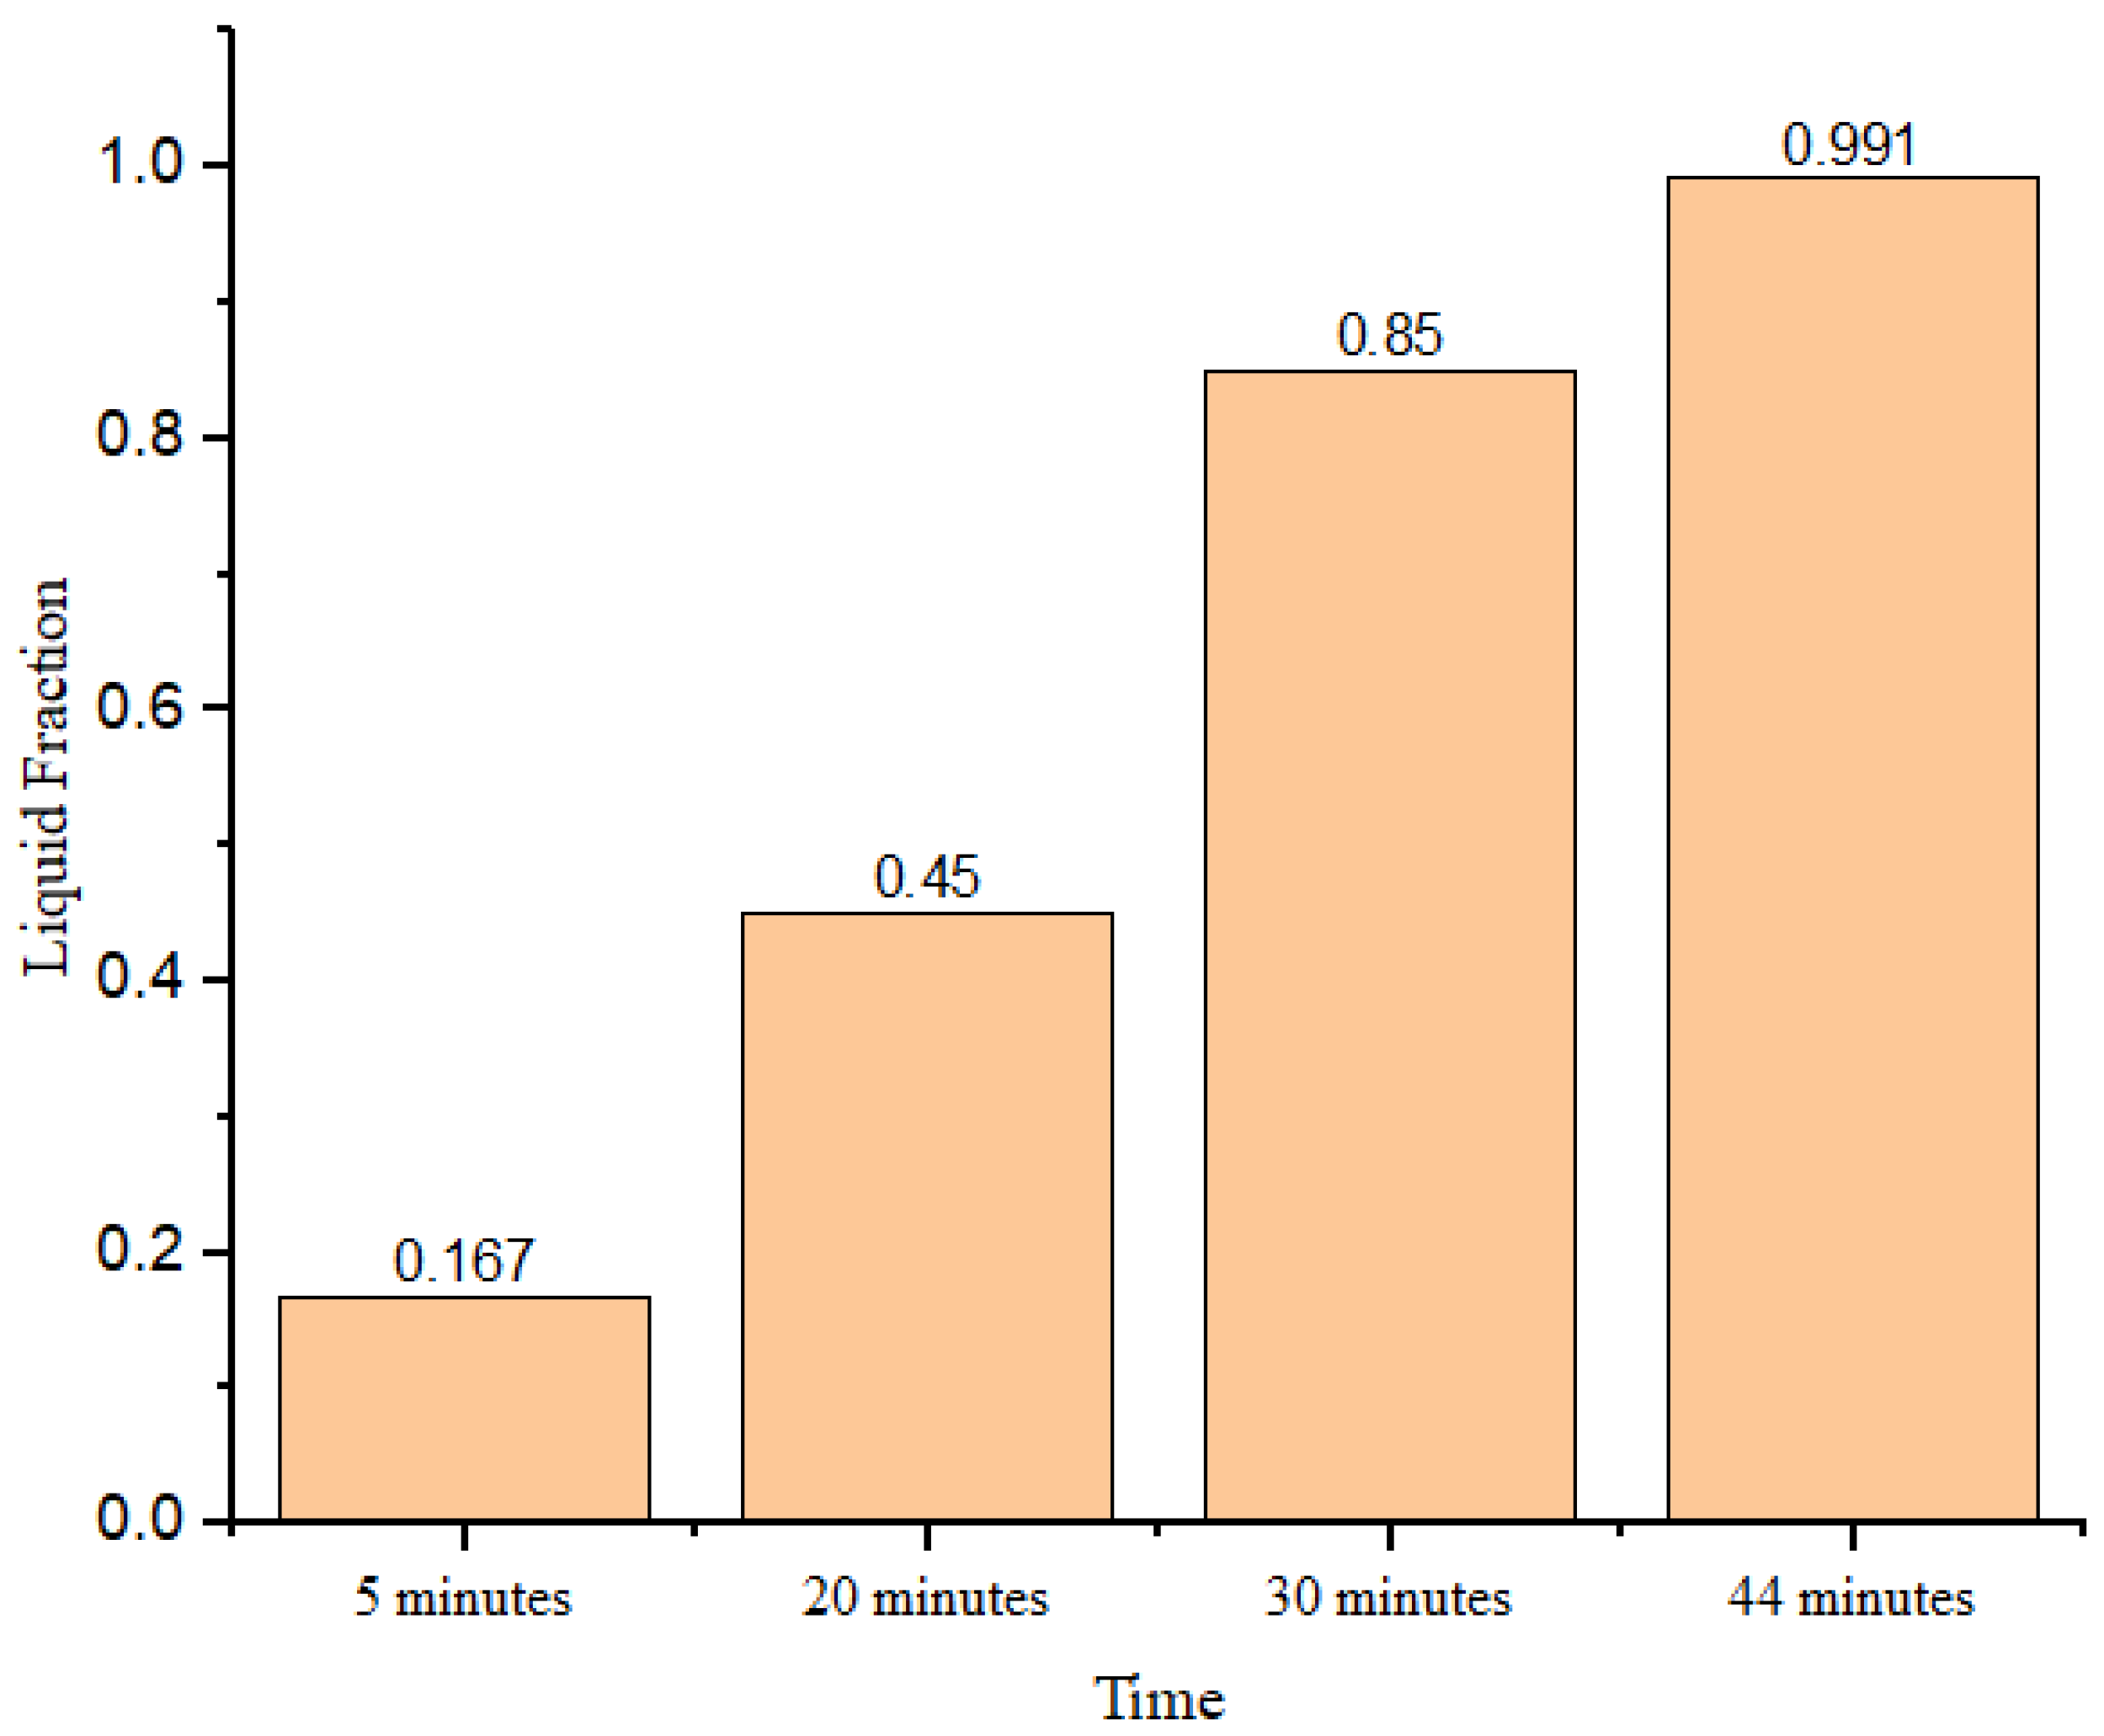
With the tank spanning approximately half a meter in length, a temperature difference in only 2 K was recorded across this distance, demonstrating efficient thermal management. The different color diagrams can easily be read out by their respective temperature color column. The observed temperature difference between the inlet and outlet faces of the tank underscores the rapid heat distribution facilitated by the presence of multiple fins. This difference diminished significantly once the phase transition from solid to liquid was complete, as the system reached thermal equilibrium. Furthermore, Figure 22 provides insights into the liquid fraction at various time intervals. According to the simulation results, the complete phase transition was achieved in 44 min. Table 5 represents the accuracy among temperature data at different points of the storage tank.
Figure 22.
Liquid fraction variations.
Table 5.
Errors measurement in temperature data.
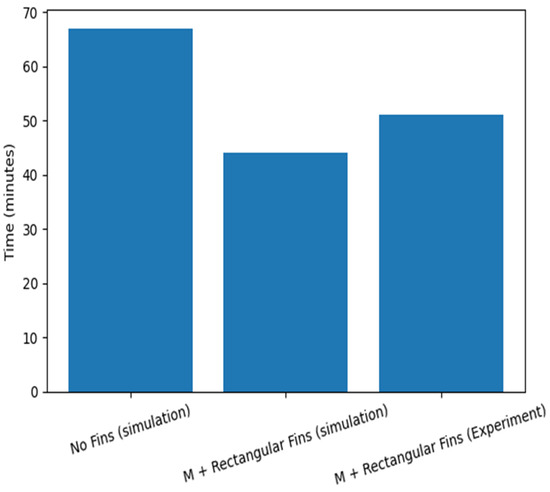
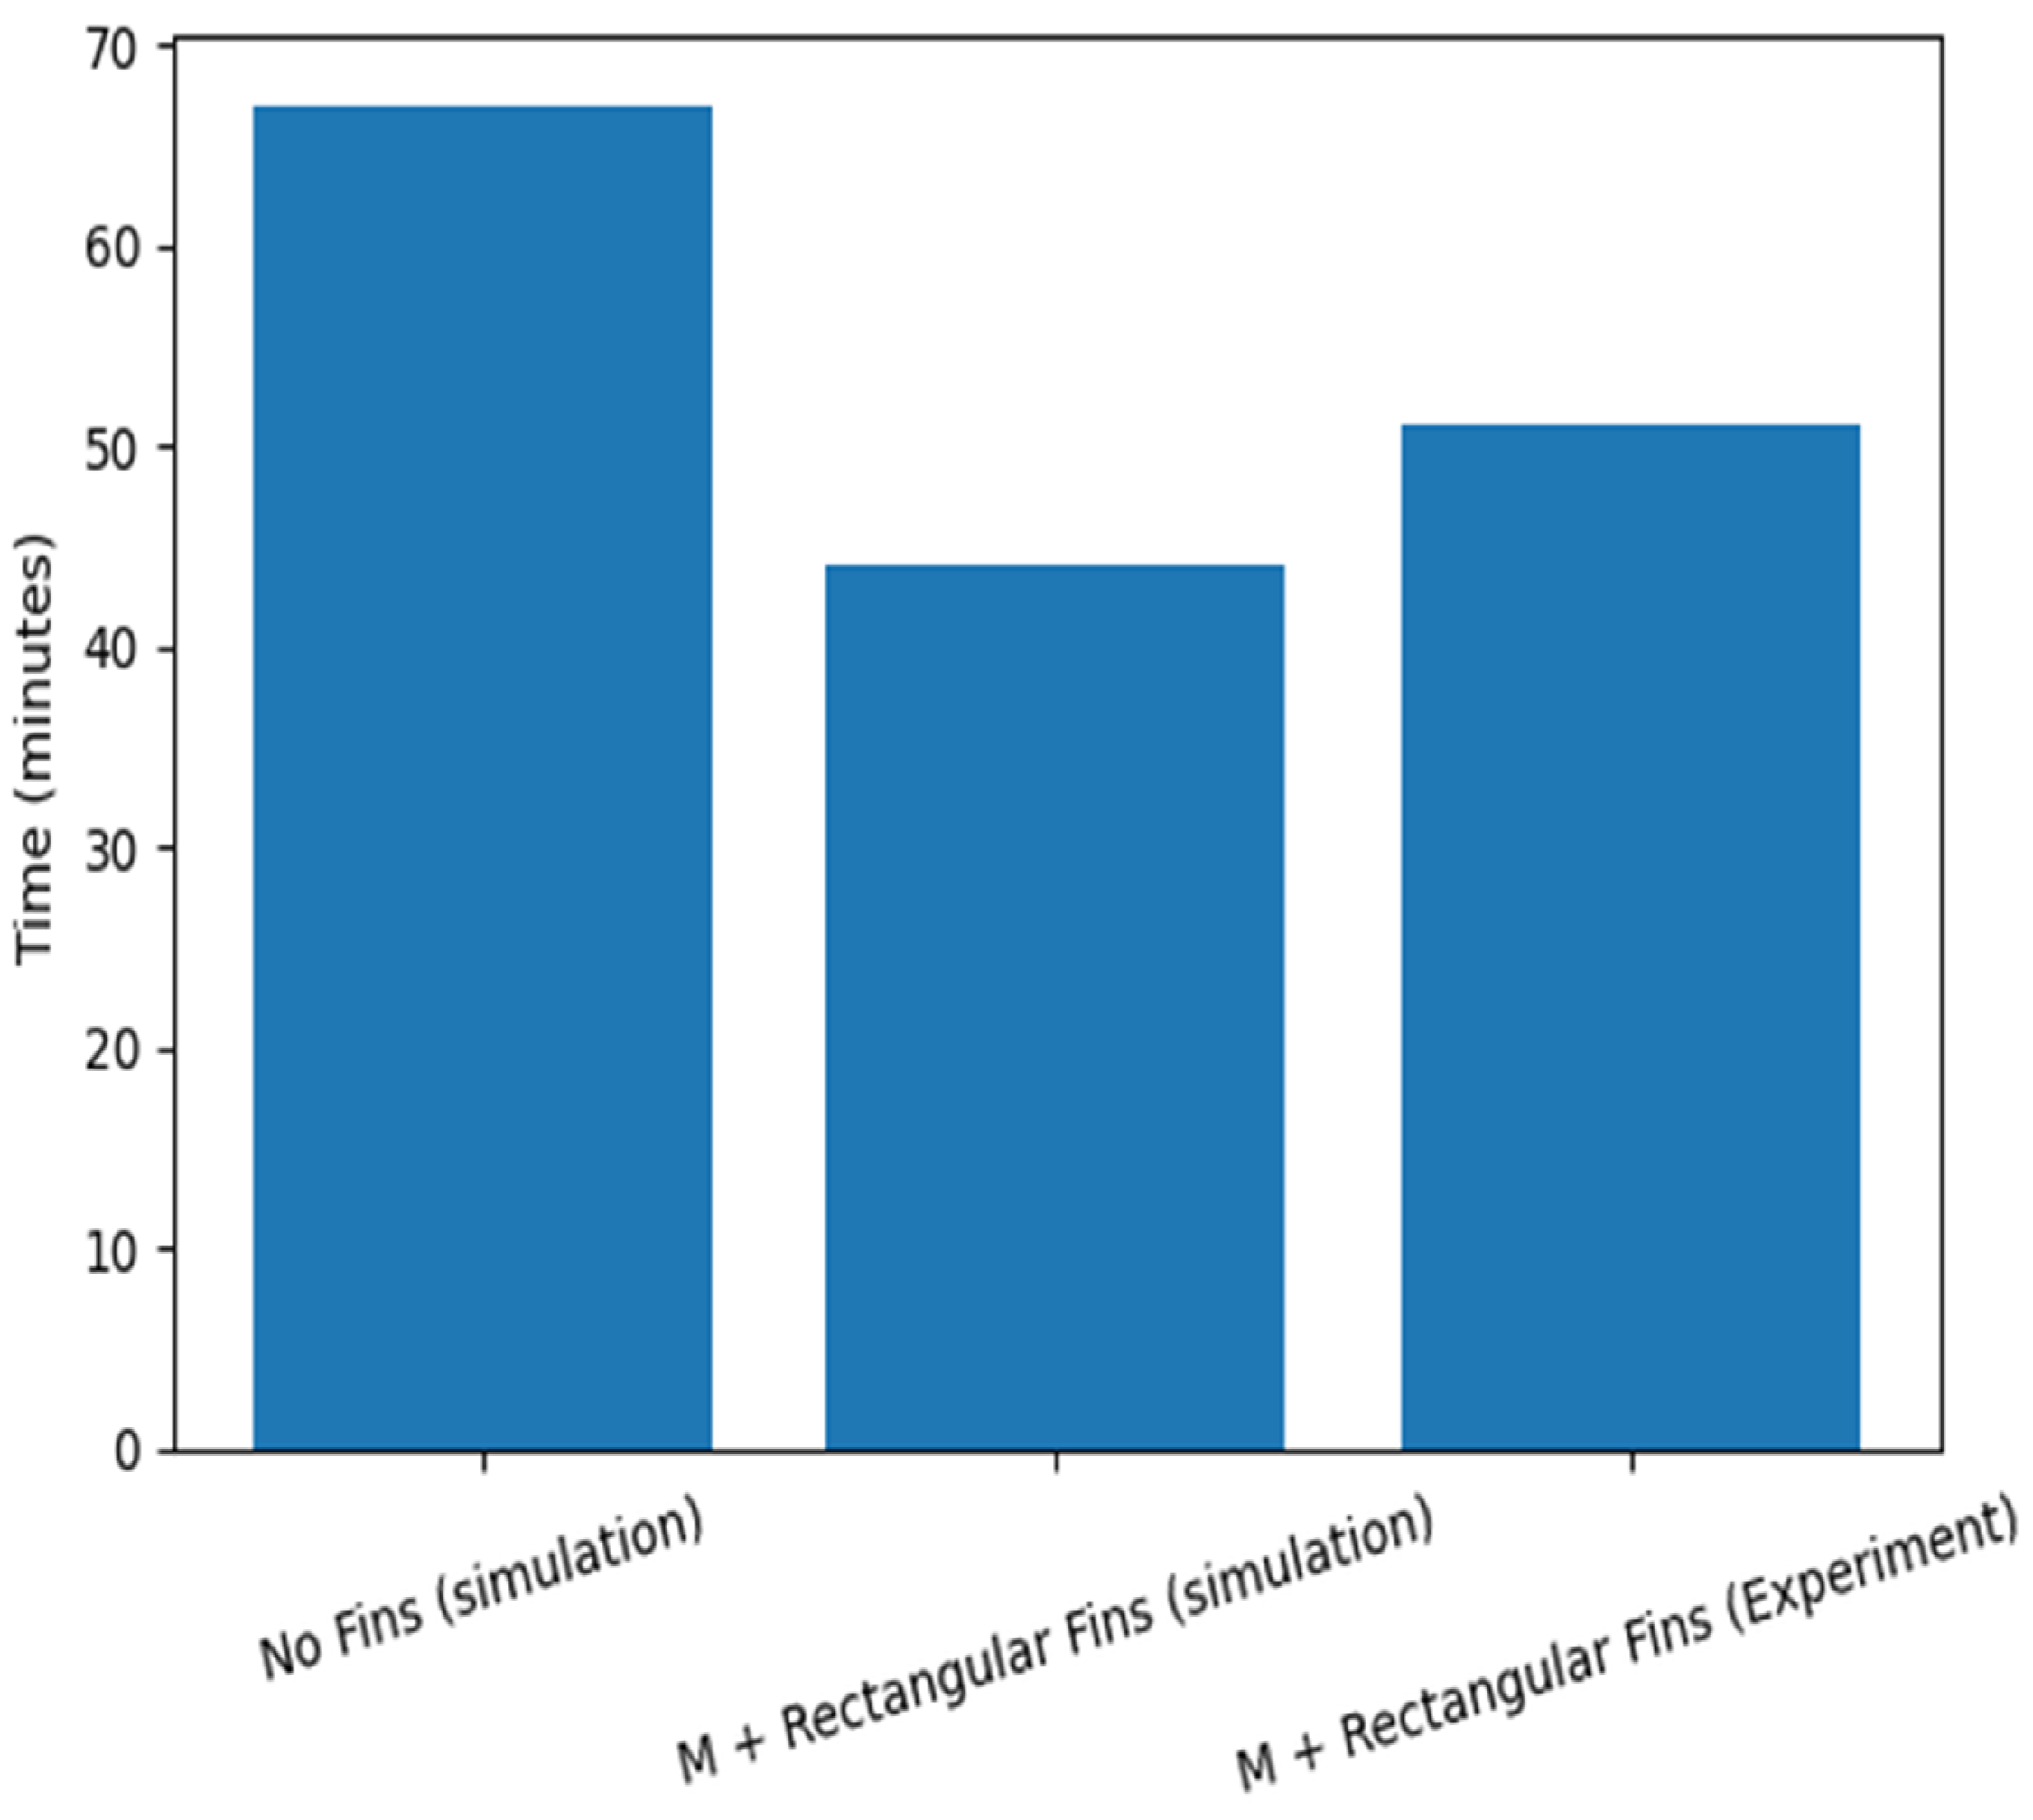
However, in the actual system, the phase change required 51 min to complete, primarily due to minor imperfections such as heat losses, material inconsistencies, and equipment efficiency. These findings emphasize the simulation’s ability to closely approximate real-world behavior while highlighting areas for system optimization. Figure 23 indicates a substantial decrease in required time, the no-fin simulation is 67 min; whereas the M + rectangular-fin simulation is 44 min, giving a 23 min reduction equal to 34.3%. The M + rectangular-fin experimental result is 51 min, which is 7 min greater than the finned simulation (51 − 44), i.e., 15.9% higher relative to the simulated finned value. Despite this difference, the finned experiment still outperforms the no-fin case by 16 min, corresponding to a 23.9% decrease.
Figure 23.
Melting time evaluation.
Exergy/Energy Analysis
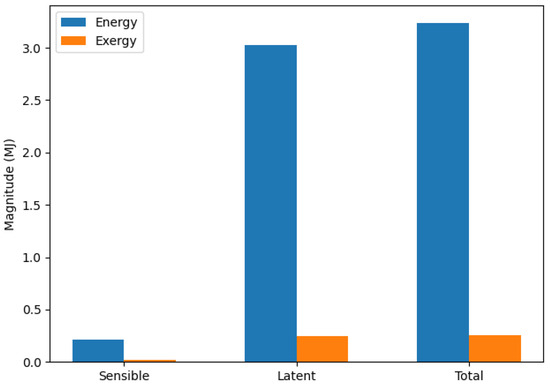
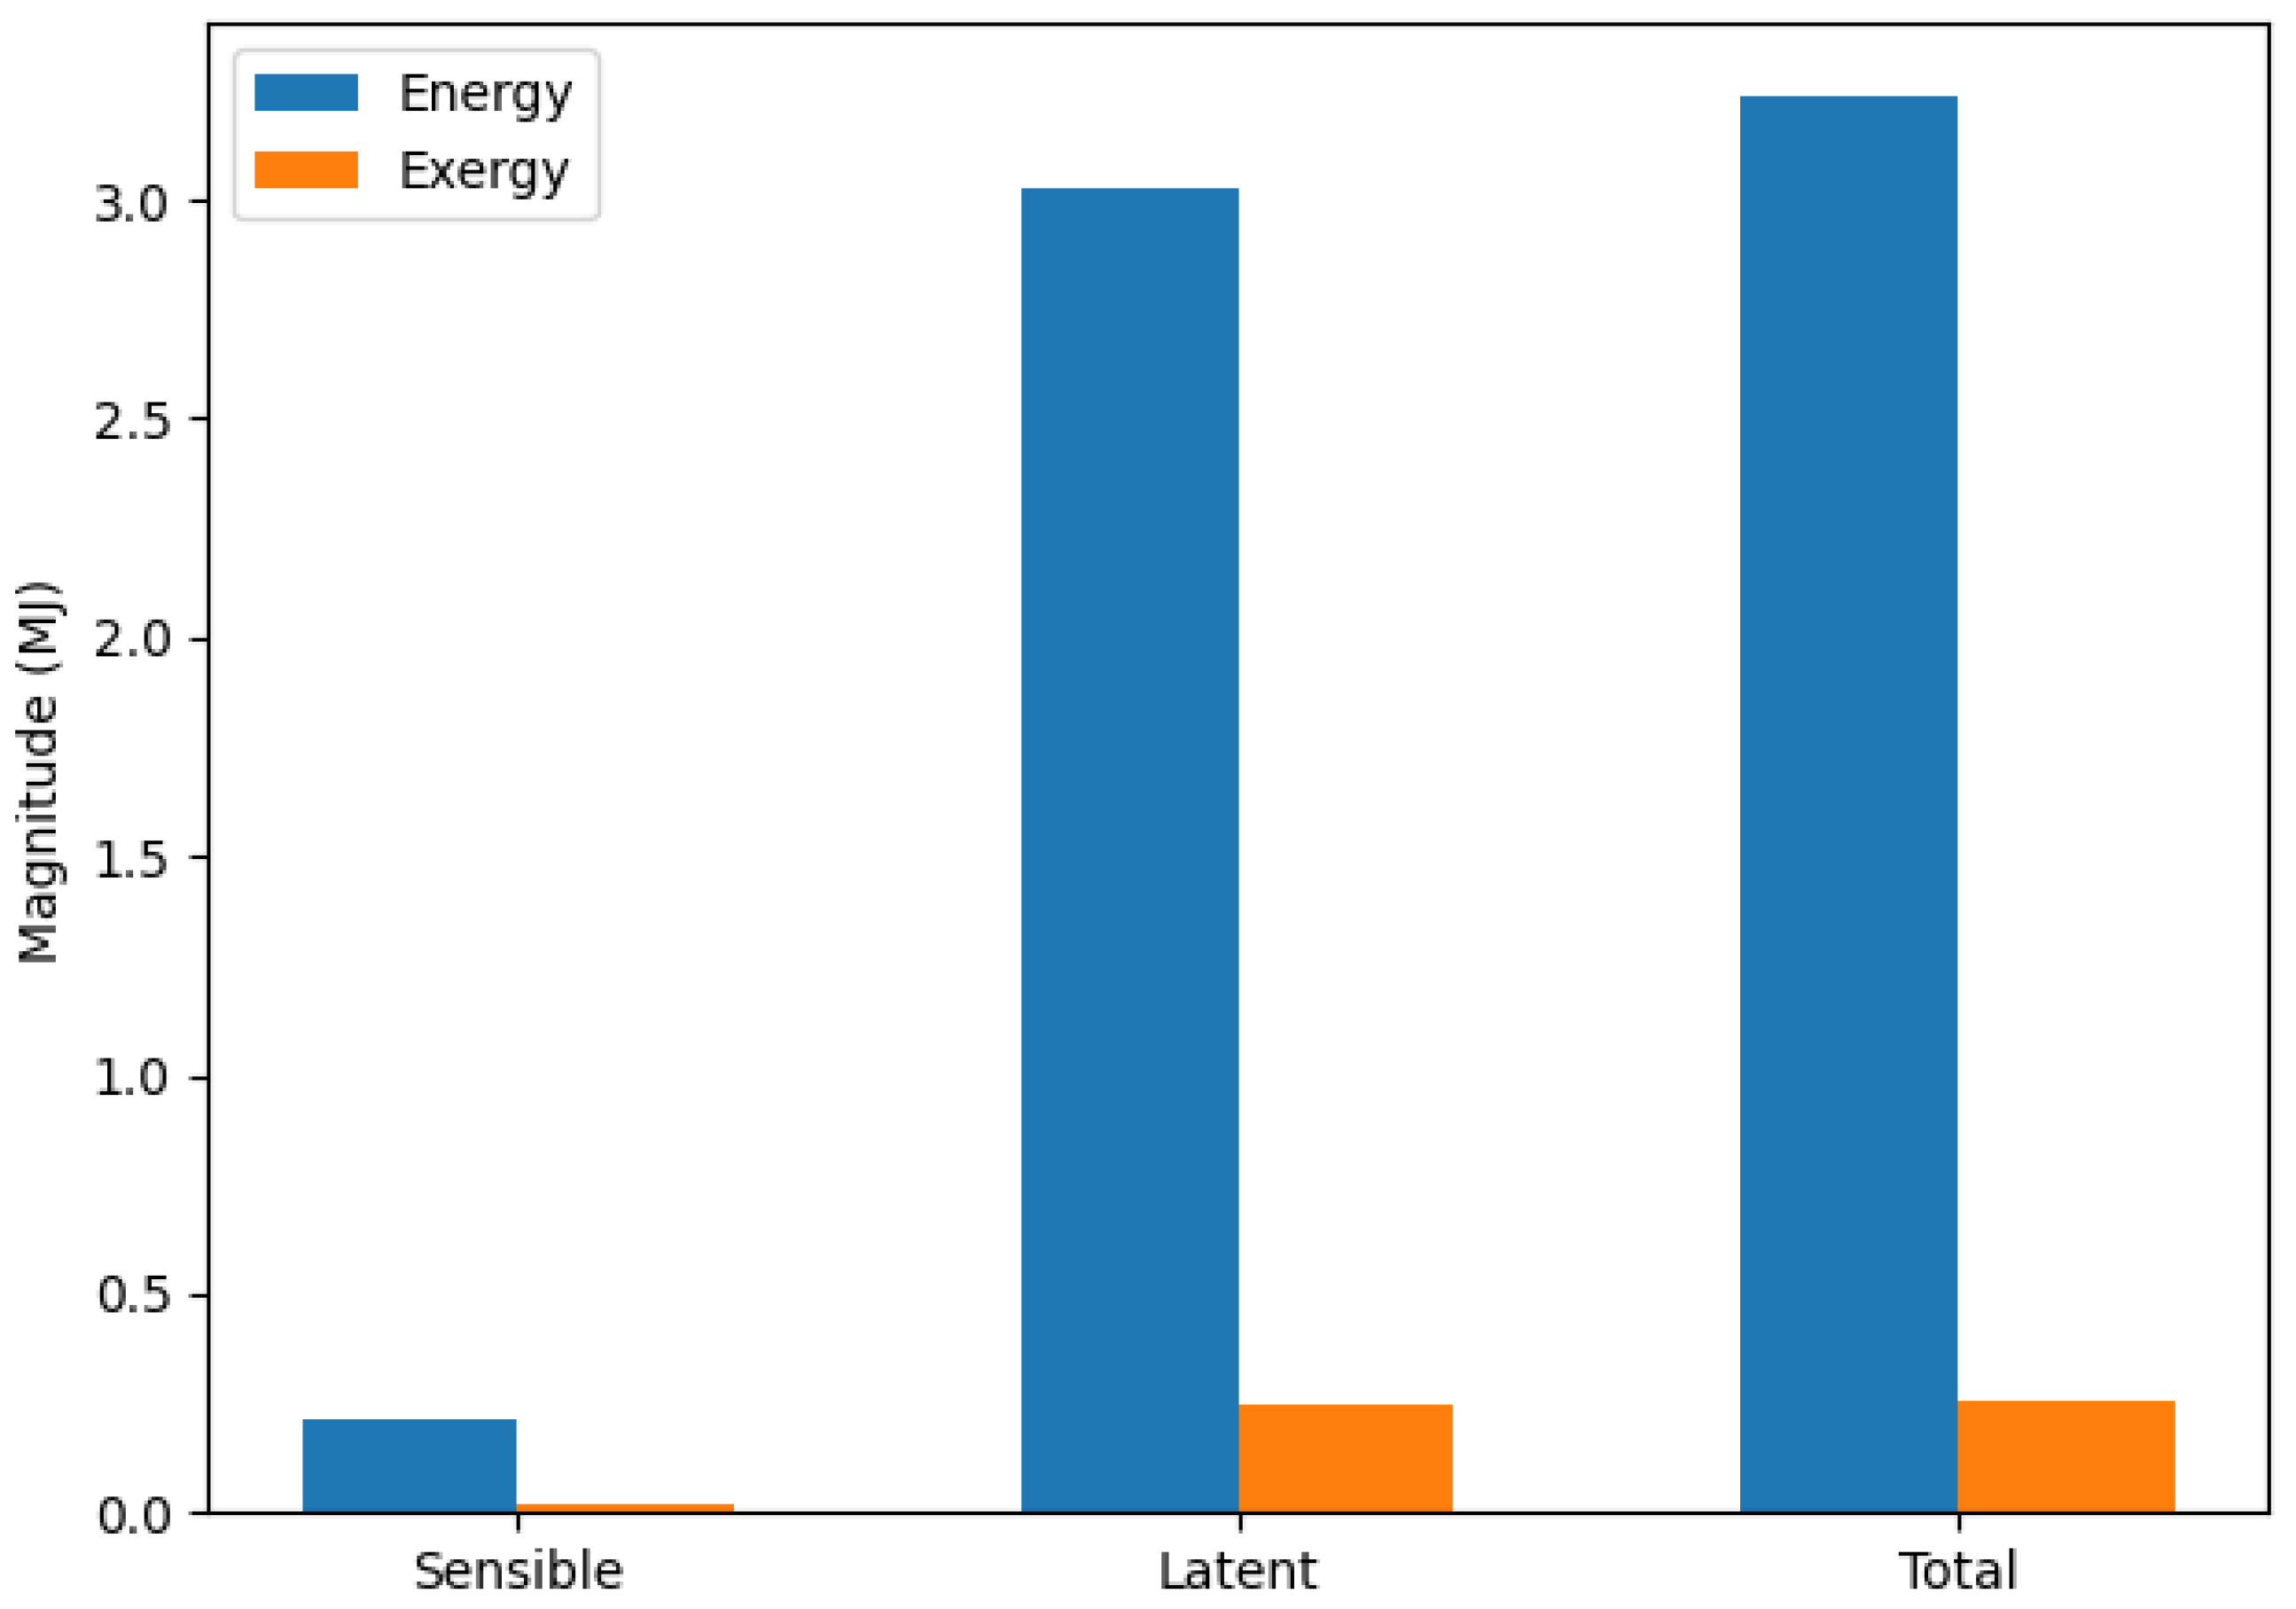
Comparison of stored energy and corresponding exergy in an RT50 PCM unit, separated into pre-melting sensible storage, phase-change latent storage, and overall storage. The latent component contributes the major share of stored heat, while exergy remains substantially lower due to the limited temperature driving potential relative to ambient conditions. Quantitatively, Figure 24 depicts that the sensible storage is minor (0.2 MJ) compared with the latent storage (3.0 MJ), so the total stored energy (3.25 MJ) is governed primarily by the phase-change contribution. In contrast, the corresponding exergy values are much smaller (0.02 MJ sensible and 0.24 MJ latent, giving 0.25 MJ total), consistent with low-grade heat stored near the RT50 melting temperature.
Figure 24.
Energy and exergy comparison.
Latent energy contributes 93.75% of the total energy while sensible energy contributes 6.25%. The difference is much greater, as shown in Figure 24. Latent exergy is higher than sensible exergy, giving 96.15% of total exergy from latent exergy and 3.85% from sensible exergy. When energy and exergy are compared within each category, exergy is much smaller: sensible exergy is 95.0% lower than sensible energy, latent exergy is 91.67% lower than latent energy (0.25 vs. 3.00), and total exergy is 91.88% lower than total energy (0.26 vs. 3.20), showing that although most heat is stored in latent form, only a small fraction is available as useful work potential.
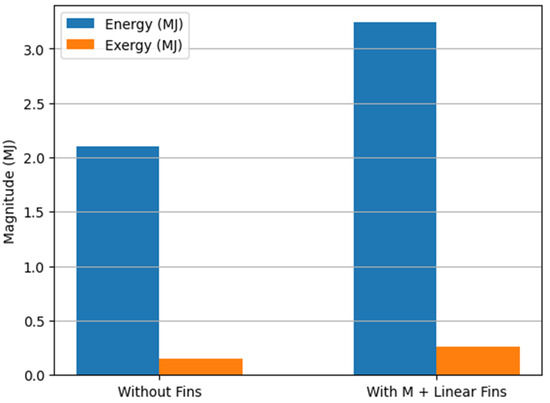
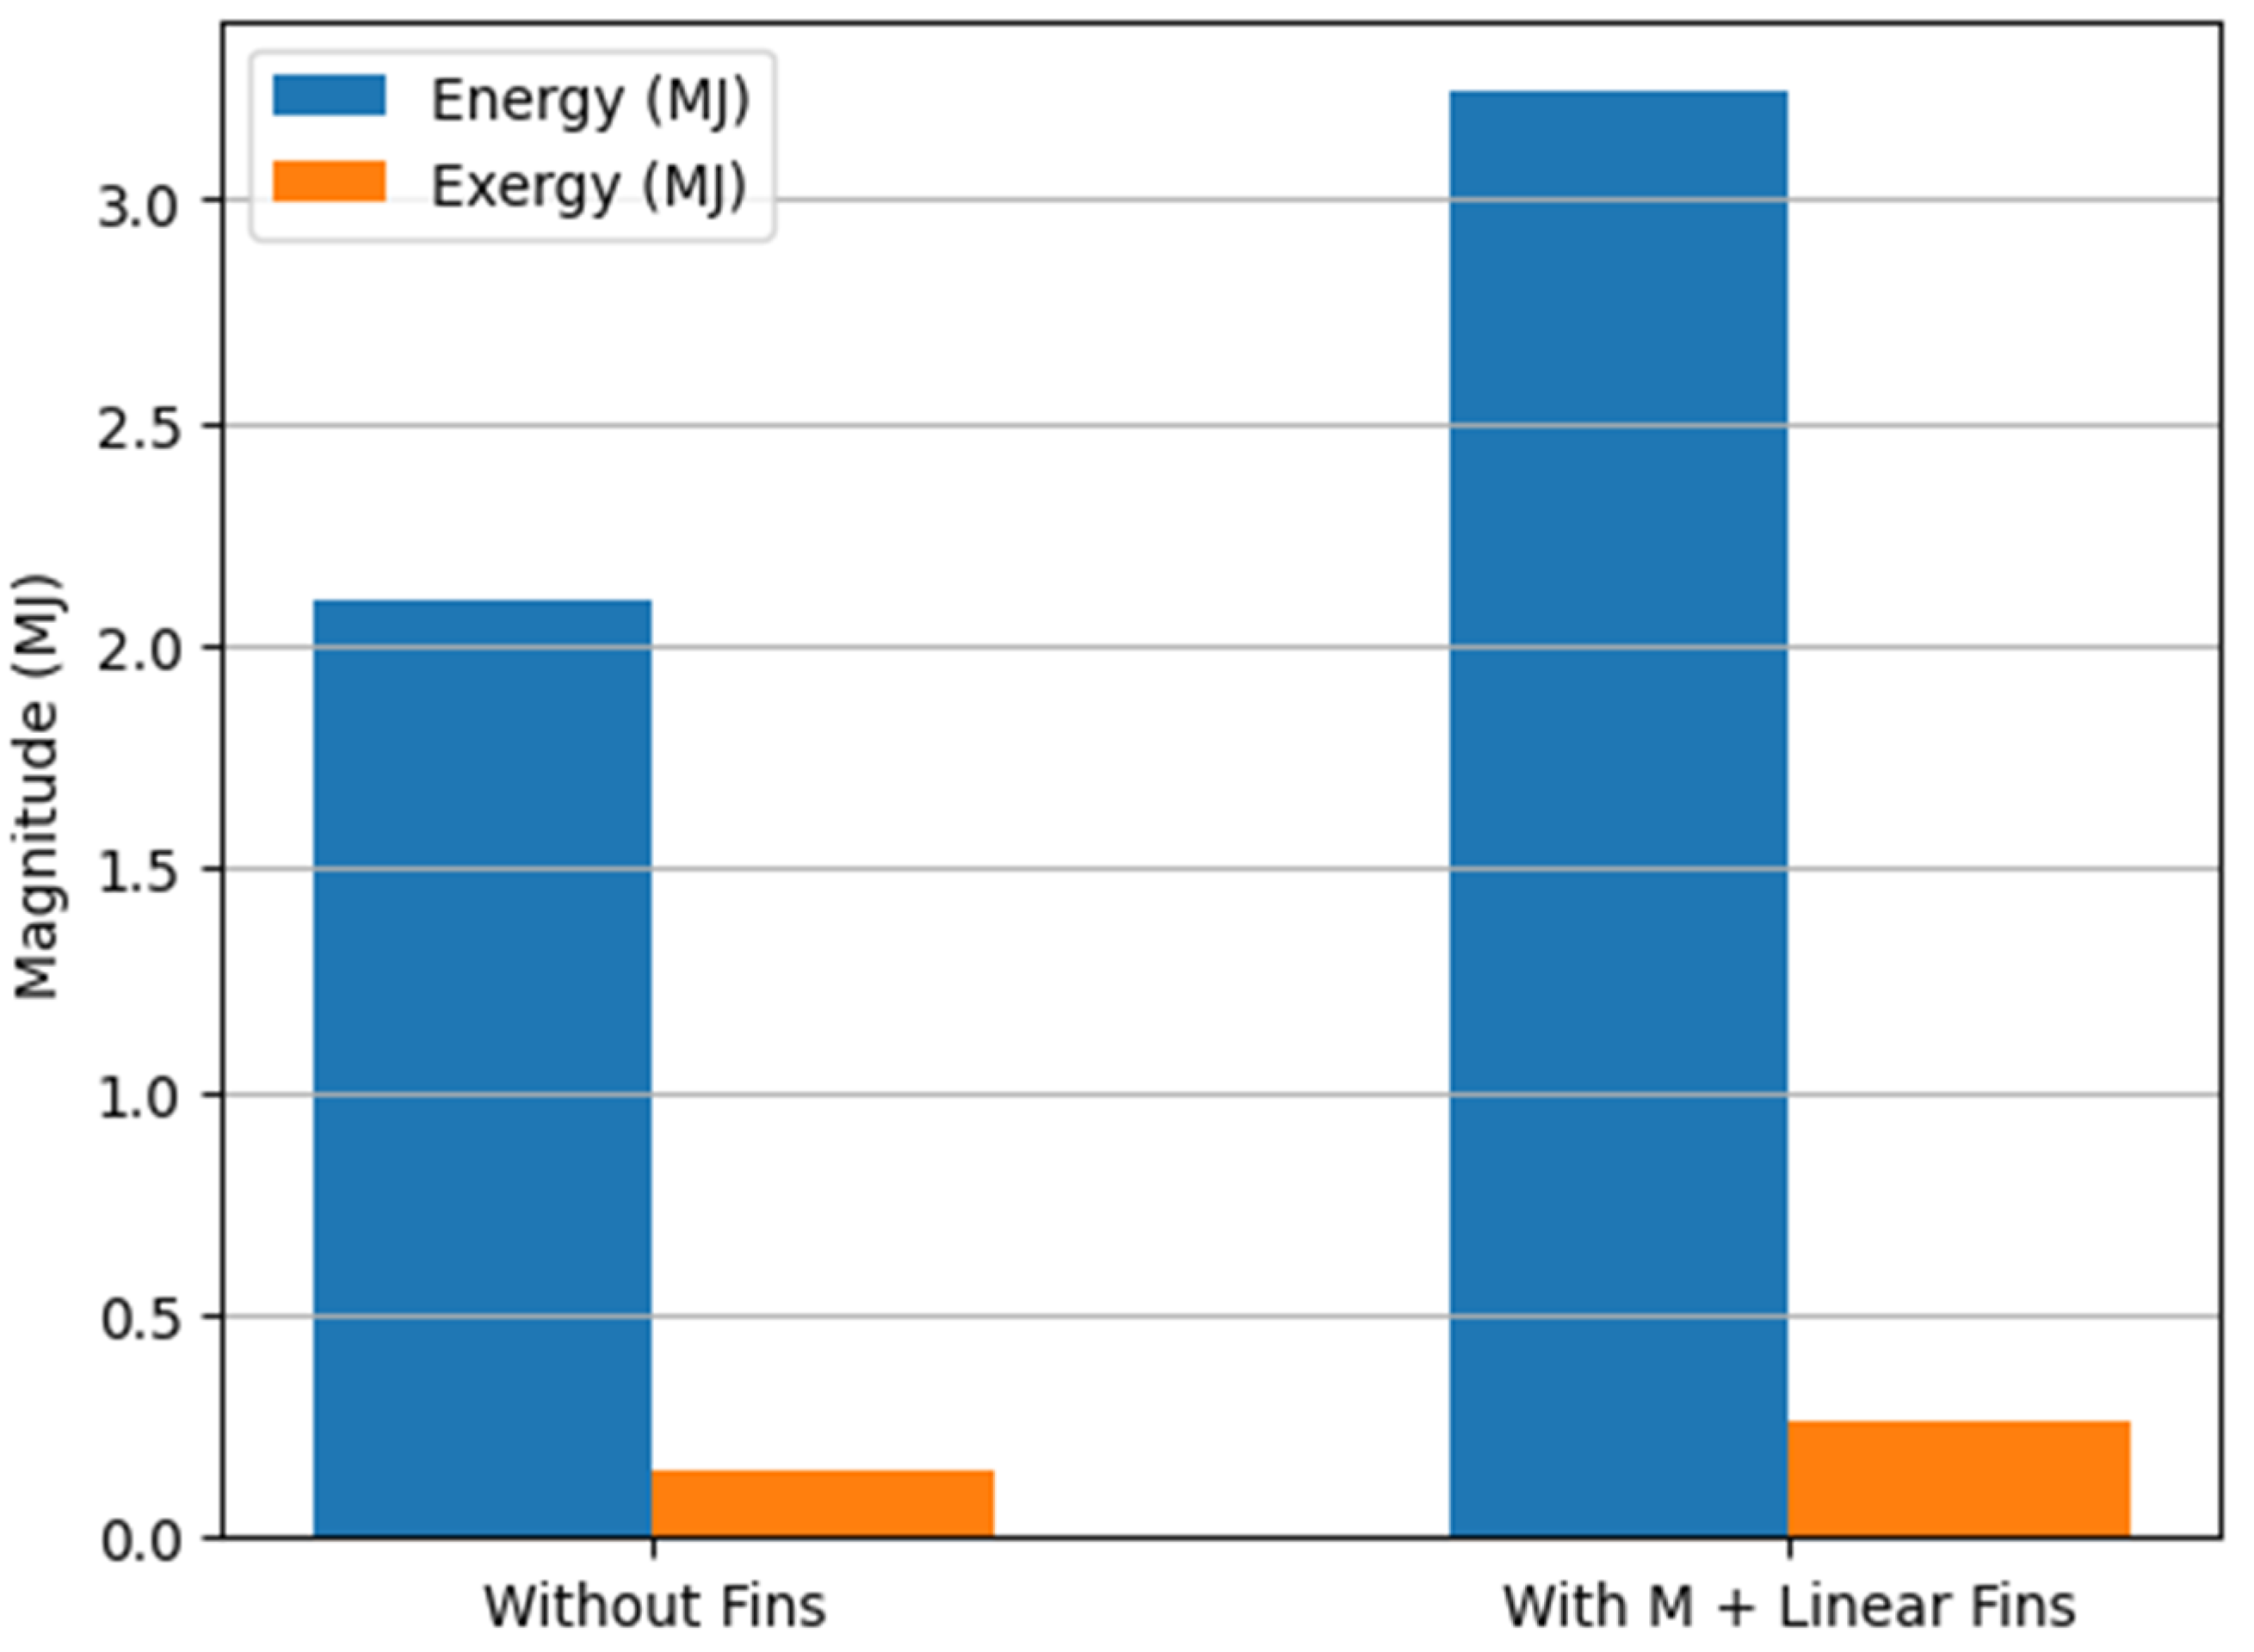
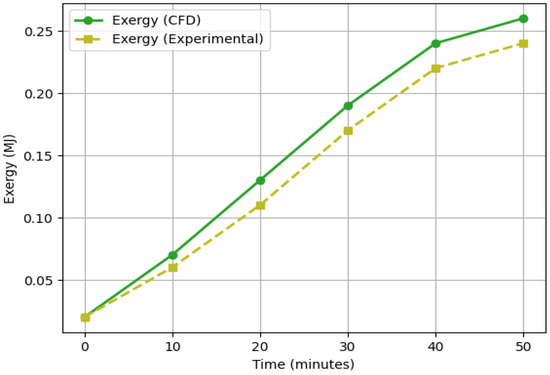
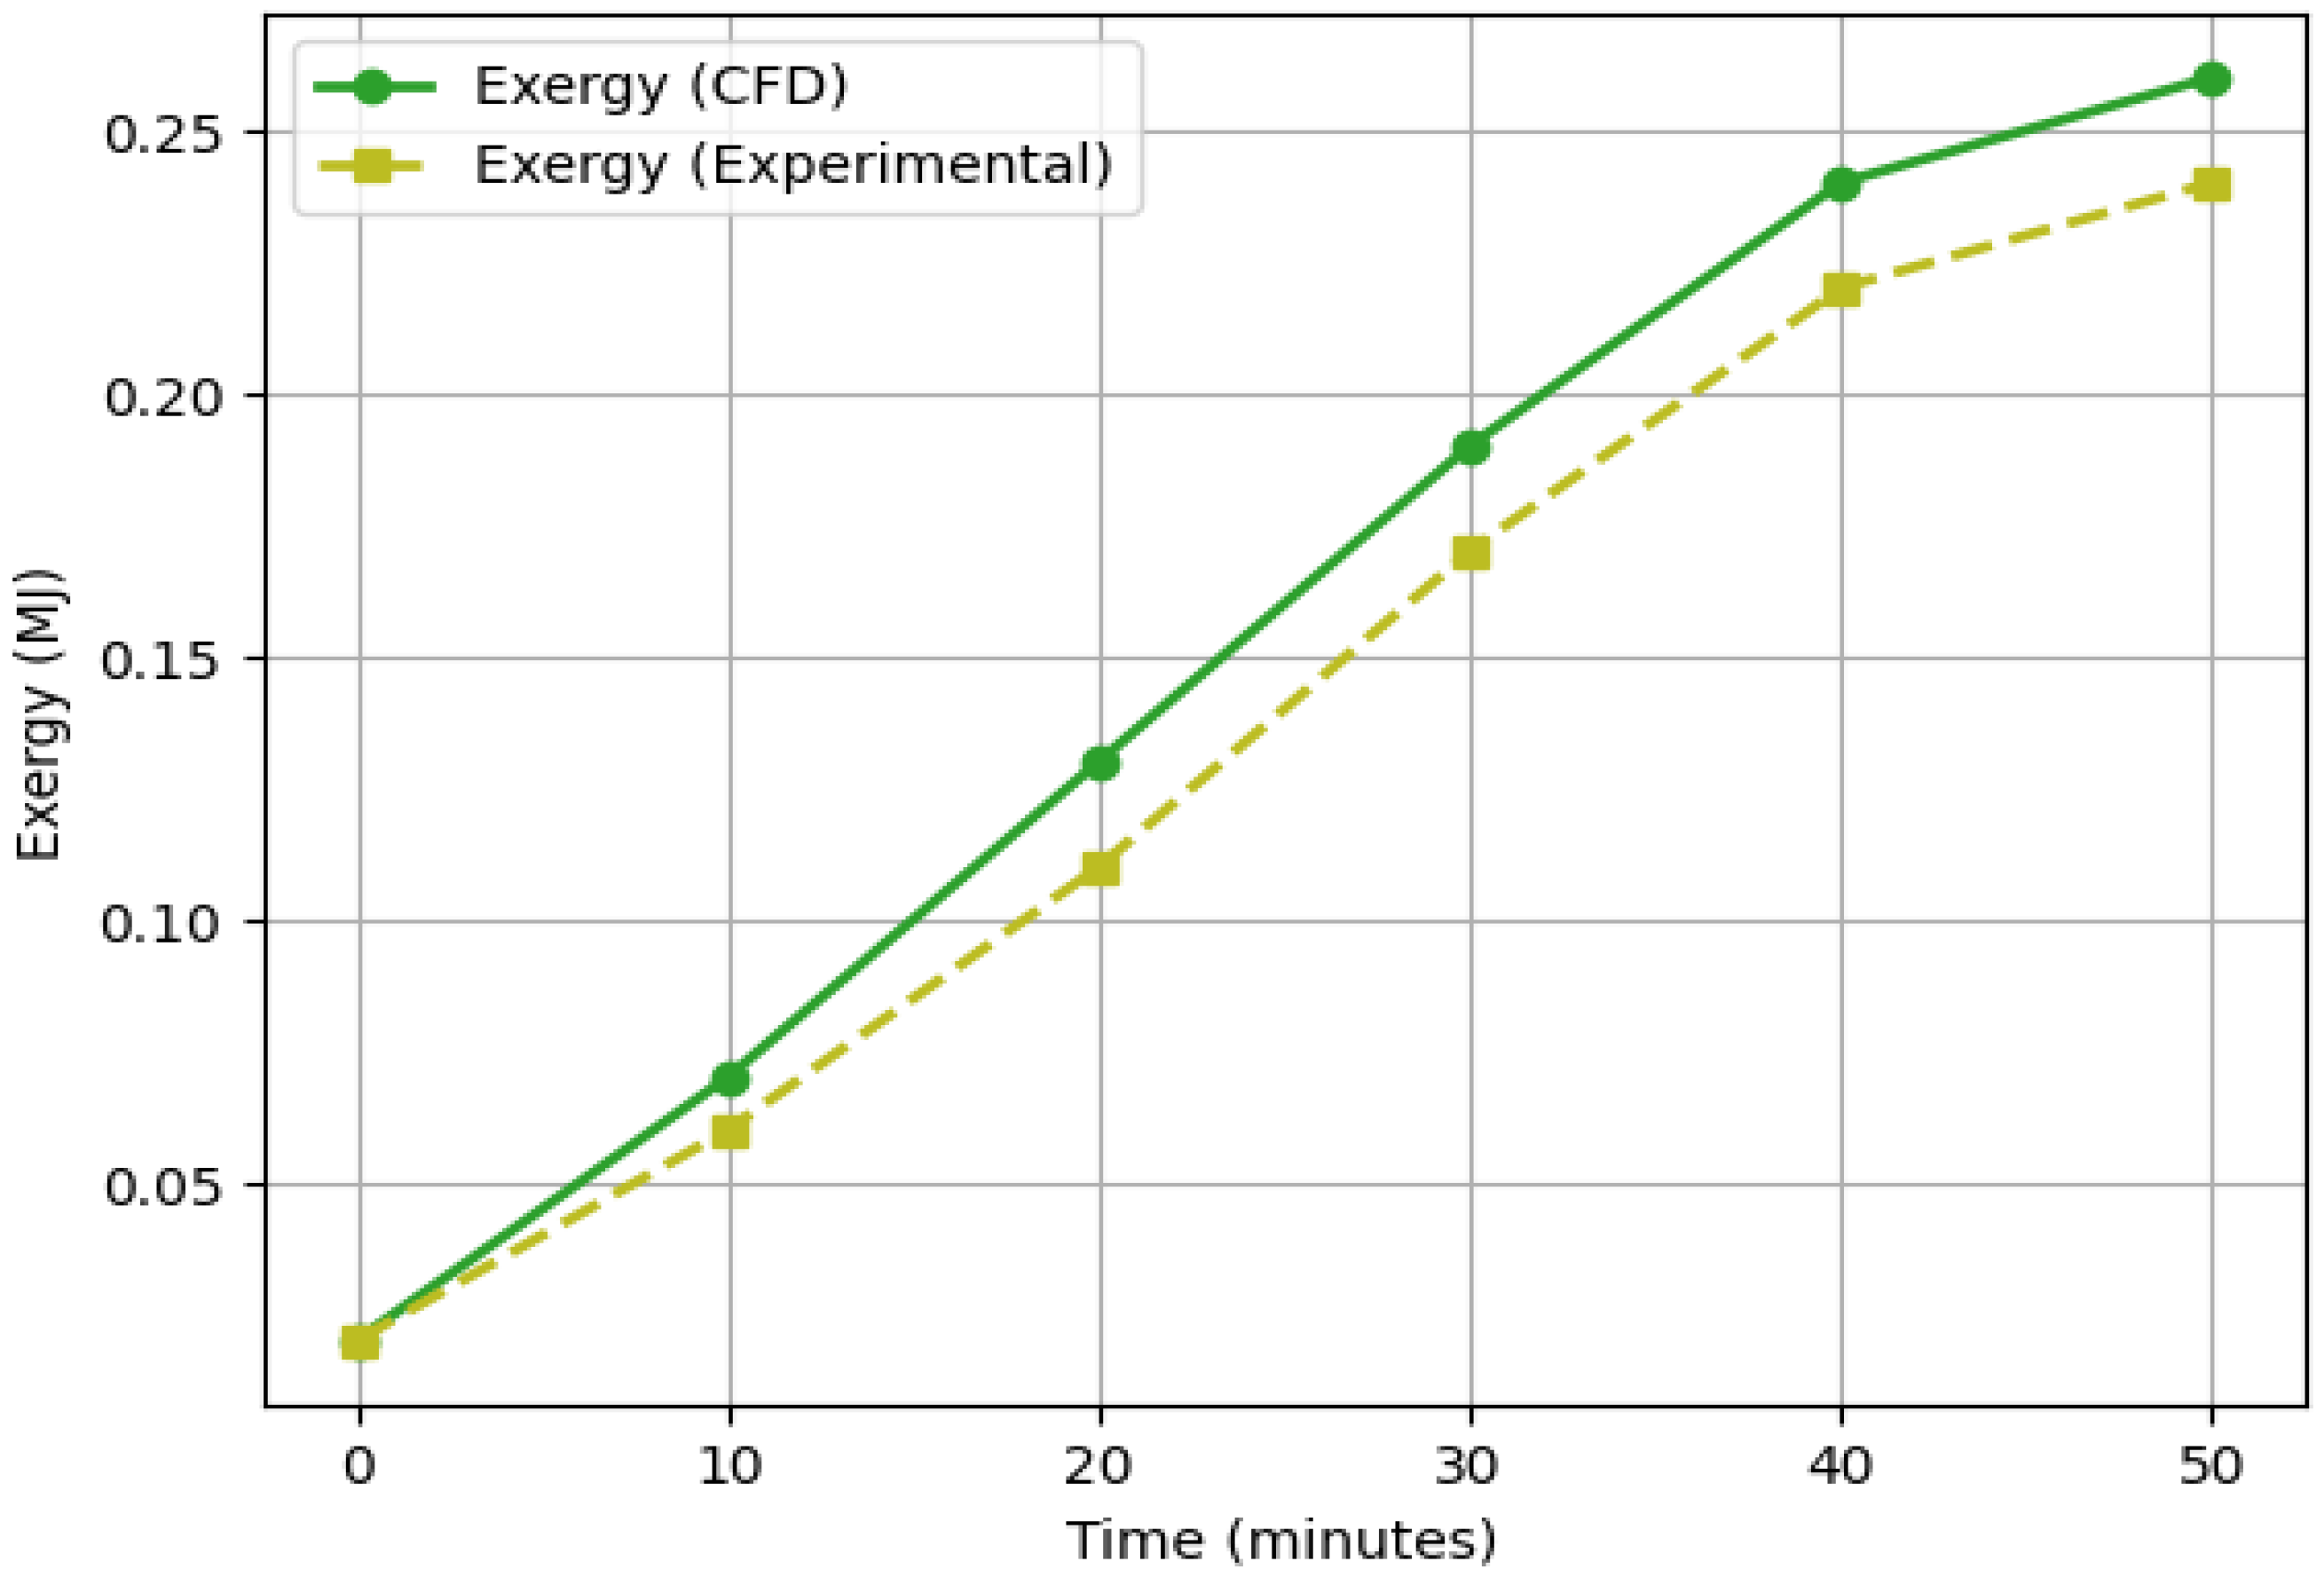
The bar results in Figure 25 indicate that adding the M + rectangular fins increased both the energy and the corresponding exergy relative to the no-fin configuration. The energy rose from 2.10 MJ (without fins) to 3.25 MJ (with fins), representing a 54.8% increase. Over the same comparison, exergy increased from 0.15 MJ to 0.27 MJ, corresponding to an 80.0% gain. Nevertheless, exergy remained far smaller than energy in both cases: it was 92.9% lower than energy without fins and 91.7% lower with fins, indicating that fins enhanced the stored quantity while the useful work potential still constituted only a small fraction of the total heat stored. As shown in Figure 26, both CFD and experimental exergy increased monotonically with time, reflecting a progressive rise in useful energy storage as the PCM heated up.
Figure 25.
Effect of fins on exergy/energy storage.
Figure 26.
Exergy variations between experimental and numerical process.
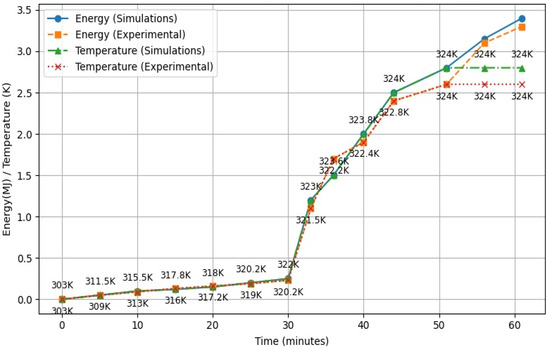
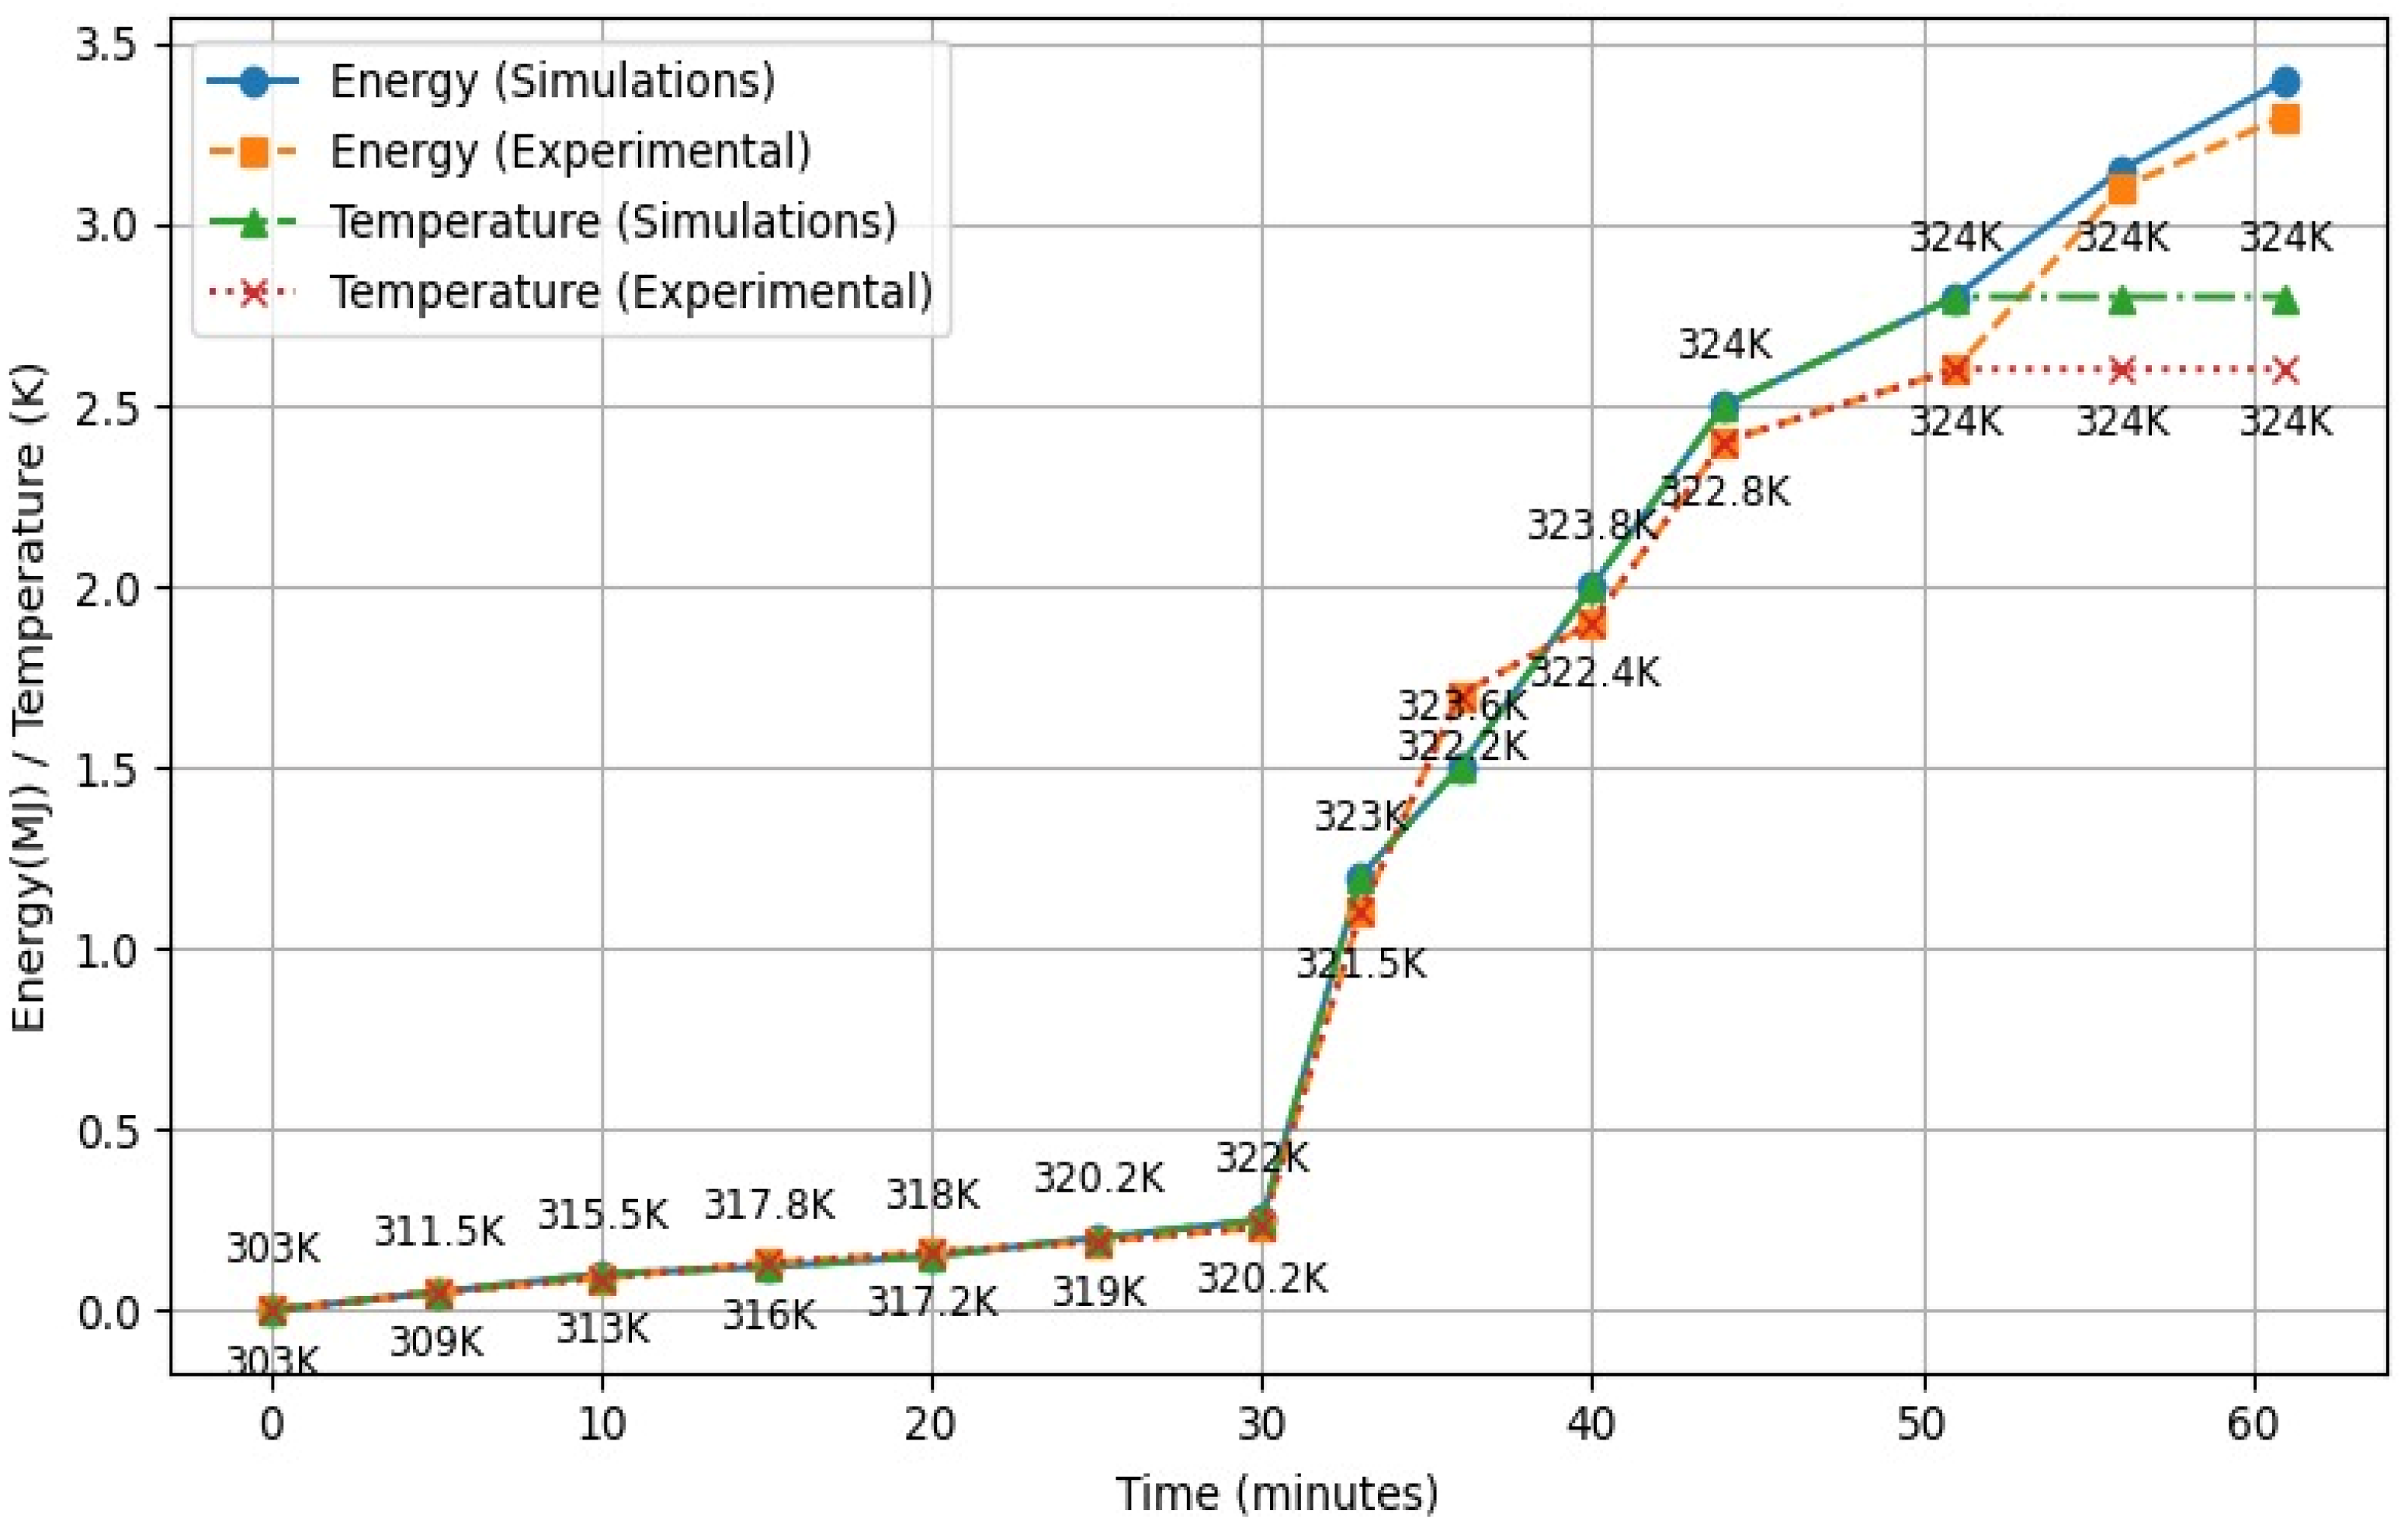
The CFD predictions remained higher than the experimental values at all-time points, and the deviation became more pronounced after approximately 20–30 min. This discrepancy was likely attributable to un-modeled heat losses, interfacial/contact thermal resistance, and experimental measurement uncertainties. The observed trend in Figure 27 is characteristic of PCM charging, where the sensible and latent storage stages behave very differently. In the initial period (pre-melting), the energy increased only slightly because the heat input primarily raised the PCM temperature (sensible heating), so even a relatively small energy addition produced a noticeable temperature rise from about 303 K to 320 K. Once the PCM reached its phase-change range (around 320 K–324 K), melting began and the temperature rise slowed markedly, tending to remain near the melting temperature.
Figure 27.
Total energy analysis.
During this interval, the added heat was predominantly absorbed as latent heat to drive the solid–liquid transition rather than increasing the temperature, which explains why the latent heat span was much larger than the sensible portion while the temperature stayed nearly constant. Consequently, the energy curve showed a steep increase through the melting period whereas the temperature curve exhibited a plateau near 324 K, indicating that most of the supplied heat was stored in the form of phase-change enthalpy.
8. Conclusions
This study aimed to enhance the thermal performance of a latent heat storage unit by integrating an innovative fin design, combining rectangular fins with M-shaped fins to optimize the charging process.
- The HTF tubes without fins was analyzed in rudimentary stages, complete melting attained after 67 min of charging. The inclusion of M-shaped fins significantly improved convective heat transfer by generating localized vortices near their surfaces.
- Additionally, the extended surface area provided by the fins considerably enhanced conduction within the solid phase-change material, thereby facilitating efficient heat dissipation from the heat transfer fluid tubes to the PCM and expediting the phase transition from solid to liquid. The inclusion of fins promoted phase transition from 67 min to 44 min, indicating 52.3% increment in thermal performance.
- While the formation of local vortices was somewhat constrained due to the high viscosity of paraffin wax, the rapid heat transfer promoted strong natural convective currents, which played a crucial role in accelerating the solid-to-liquid transformation.
- An experimental setup was developed to validate the numerical findings, and the charging and discharging cycles over specific time intervals confirmed strong agreement between experimental and simulated results. The experimental data indicated a 7 min delay in melting, with complete melting occurring in 51 min, whereas the discharging process was completed in 48 min.
- Energy vs. temperature (charging behavior): During PCM charging, sensible heating causes a quick temperature rise with only a small energy increase, but once the PCM enters the melting range (320–324 K), the energy rises steeply, showing that most input heat is absorbed as latent heat (phase-change enthalpy) rather than raising temperature.
- Energy vs. exergy (useful potential): Adding M + rectangular (linear) fins substantially increases energy from 2.10 MJ to 3.25 MJ (54.8%) and exergy from 0.15 MJ to 0.27 MJ (80.0%), yet exergy remains a small fraction of energy (about 92.9% lower without fins and 91.7% lower with fins), meaning fins enhance the total stored heat more than they improve the recoverable work potential; CFD exergy stays higher than the experiment, likely due to losses/contact resistance not fully captured.
- The 3 min difference between charging and discharging durations highlights the more efficient heat dissipation during solidification, attributed to the formation of numerous nucleation sites and the limitations of the insulation system. Furthermore, an approximate 4 °C temperature difference between the results was observed, primarily due to uncontrolled heat losses in the experimental setup.
Future Recommendation
The current combined M-shaped + rectangular fin configuration can be further optimized using modern topographic/biomimetic design techniques, such as introducing tree-shaped (branching) fin networks to enhance heat spreading and accelerate charging/discharging, while nano-enhanced (nano-induced) RT50 PCM may also be employed to increase effective thermal conductivity and further improve the overall thermal performance of the TES system.
Author Contributions
Conceptualization, A.S. and M.U.; Methodology, A.S., M.U. and A.H.; Software, A.S. and M.S.; Validation, A.S. and M.S.; Formal analysis, A.S. and M.U.; Investigation, F.A.; Resources, F.A.; Data curation, A.H.; Writing—original draft preparation, A.S.; Writing—review and editing, M.U. and A.H.; Visualization, M.S.; Supervision, A.S. and A.H.; Project administration, F.A.; Funding acquisition, F.A. All authors have read and agreed to the published version of the manuscript.
Funding
The research was funded by Deanship of Scientific Research (DSR) at King Abdulaziz University, Jeddah, under grant number IPP:328-135-2025 and the APC was funded by Fouad Abolaban.
Data Availability Statement
The data presented in this study are available on request from the corresponding author due to large file size and storage limitations.
Acknowledgments
The authors gratefully acknowledge the technical and financial support provided by DSR.
Conflicts of Interest
The authors declare no conflicts of interest.
Abbreviations and Nomenclature
The following abbreviations are used in this manuscript:
| Specifications | Units | Symbols |
| Specific heat capacity | kJ/kg·K | Cp |
| Thermal conductivity | W/m·K | K |
| Latent heat energy | J/g | L |
| Useful heat energy | J | Qu |
| Reynold number | - | Re |
| Nusselt number | - | Nu |
| Density | Kg/m3 | ρ |
| Thermal expansion coefficient | °C−1 | ᵅ |
| Radius | mm | r |
| Inner radius | mm | ri |
| Radius of HTF pipe (inner) | mm | r1 |
| Radius of central pipe (outer) | mm | r2 |
| Radius of outer piper | mm | r3 |
| Mean radius | mm | rm |
| Temperature | K | T |
| Initial | - | ini |
| Heat transfer fluid tube temperature | K | THTFT |
| Density at specific temperature | Kg/m3 | ρ1 |
| expansion coefficient | 1/K | |
| Reference Temperature | K | Tref |
| Dynamic viscosity | Pa·s | |
| Liquid fraction | - | |
| Inlet | - | in |
| Mushy zone | - | mush |
| Reference state | - | ref |
| Initial/reference temperature | K | T1 |
| Final/desired temperature | K | T2 |
| Initial | - | i |
| Time | s | t |
| Velocity vector | m/s | |
| Mushy zone constant | kg/s·m−3 | Zmush |
| Inner diameter | m | |
| Velocity of fluid | m/s | U |
| Diameter of pipe | m | Dp |
| Length of pipe | m | Lp |
| Friction factor | - | |
| Height difference between the top and the bottom of the system | - | hs |
| Mass flow | kg/s | Mv |
| Gravity | m/s2 | g |
| Sensible enthalpy | J/kg | h |
| Total enthalpy | J | H |
| Source term | - | |
| Pressure | Pa | P |
References
- Ozili, P.; Ozen, E. Global Energy Crisis: Impact on the Global Economy. In The Impact of Climate Change and Sustainability Standards on the Insurance Market; Elsevier: Amsterdam, The Netherlands, 2022. [Google Scholar] [CrossRef] [Scilit]
- Mumtaz, J. Evaluating Energy Security and Sustainability in Pakistan: A Review of Challenges and Opportunities; The Federation of Pakistan Chamber of Commerce and Industry: Karachi, Pakistan, 2022. [Google Scholar]
- Shazad, A.; Uzair, M. Utilization of Solar Energy for Cooling Applications: A Review. Mem. Investig. Ing. 2023, 24, 69–91. [Google Scholar] [CrossRef] [Scilit]
- World Bank Group. Pakistan—Issues and Options in the Energy Sector (English); World Bank Group: Washington, DC, USA, 2010; Available online: http://documents.worldbank.org/curated/en/394861468774946366 (accessed on 5 June 1980).
- Shazad, A.; Tufail, M.; Uzair, M. Trends in research on latent heat storage using PCM, a bibliometric analysis. Trans. Can. Soc. Mech. Eng. 2023, 48, 1–14. [Google Scholar] [CrossRef] [Scilit]
- Jia, B.; Song, Z.; Li, X.; Hu, Z.; Li, Q. Enhancing thermal performance: The evolution and future of solar air heaters with baffles. Case Stud. Therm. Eng. 2025, 75, 107163. [Google Scholar] [CrossRef] [Scilit]
- Hossain, E.; Faruque, H.; Sunny, M.; Mohammad, N.; Nawar, N. A comprehensive review on energy storage systems: Types, comparison, current scenario, applications, barriers, and potential solutions, policies, and future prospects. Energies 2020, 13, 3651. [Google Scholar] [CrossRef] [Scilit]
- Shang, B.; Zhang, L.; Li, B.; Huo, Y. Thermal energy storage system based on nanoparticle distribution optimisation for enhanced heat transfer. J. Energy Storage 2024, 80, 110075. [Google Scholar] [CrossRef] [Scilit]
- Findik, F.; Ermis, K. Thermal energy storage. Sustain. Eng. Innov. 2020, 2, 66–88. [Google Scholar] [CrossRef] [Scilit]
- Khudhair, A.M.; Farid, M.M. A review on energy conservation in building applications with thermal storage by latent heat using phase change materials. Energy Convers. Manag. 2004, 45, 263–275. [Google Scholar] [CrossRef] [Scilit]
- González-Portillo, L.F. An analytical optimization of thermal energy storage for electricity cost reduction in solar thermal electric plants. Appl. Energy 2016, 188, 111–122. [Google Scholar] [CrossRef] [Scilit]
- Katsanevakis, M. Aggregated applications and benefits of energy storage systems with application-specific control methods: A review. Renew. Sustain. Energy Rev. 2017, 75, 719–741. [Google Scholar] [CrossRef] [Scilit]
- Rashid, F.L. Recent Advances, Development, and Impact of Using Phase Change Materials as Thermal Energy Storage in Different Solar Energy Systems: A Review. Designs 2023, 7, 66. [Google Scholar] [CrossRef] [Scilit]
- Bejan, A.; Rosen, M.A. Thermal Energy Storage: Systems and Applications; Wiley: Hoboken, NJ, USA, 2015. [Google Scholar]
- Wang, L.; Xiao, F. Performance Analysis of Thermal Energy Storage for Distributed Energy Systems. Energy Procedia 2019, 123, 456–467. [Google Scholar] [CrossRef] [Scilit]
- Habeebullah, B.A. Economic feasibility of thermal energy storage systems. Energy Build. 2007, 39, 355–363. [Google Scholar] [CrossRef] [Scilit]
- Shazad, A.; Uzair, M.; Tufail, M. Impact of blending of phase change material for performance enhancement of solar energy storage. Renew. Energy 2024, 227, 120530. [Google Scholar] [CrossRef] [Scilit]
- Shazad, A.; Uzair, M.; Tufail, M. Thermal performance enhancement of latent heat energy storage unit. J. Therm. Anal. Calorim. 2025, 150, 7767–7777. [Google Scholar] [CrossRef] [Scilit]
- Navarro, L.; Gracia, A.D. Thermal energy storage in building integrated thermal systems: A review. Part 1. active storage systems. Renew. Energy 2016, 88, 526–547. [Google Scholar] [CrossRef] [Scilit]
- Hasnain, S.M. Review on sustainable thermal energy storage technologies, Part II: Cool thermal storage. Energy Convers. Manag. 1998, 39, 1139–1153. [Google Scholar] [CrossRef] [Scilit]
- Jaworski, M. Thermal performance of heat spreader for electronics cooling with incorporated phase change material. Appl. Therm. Eng. 2012, 35, 212–219. [Google Scholar] [CrossRef] [Scilit]
- Pakrouh, R.; Hosseini, M.J.; Ranjbar, A.A.; Bahrampoury, R. A numerical method for PCM-based pin fin heat sinks optimization. Energy Conversat. Manag. 2015, 103, 542–552. [Google Scholar] [CrossRef] [Scilit]
- Souayfane, F.; Fardoun, F.; Biwole, P. Phase change materials (PCM) for cooling applications in buildings: A review. Energy Build. 2016, 129, 396–431. [Google Scholar] [CrossRef] [Scilit]
- Osterman, E.; Tyagi, V.; Stritih, U. Review of PCM based cooling technologies for buildings. Energy Build. 2012, 49, 37–49. [Google Scholar] [CrossRef] [Scilit]
- Cabeza, L.; Castell, A.; Barreneche, C. Materials used as PCM in thermal energy storage in buildings: A review. Renew. Sustain. Energy Rev. 2011, 15, 1675–1695. [Google Scholar] [CrossRef] [Scilit]
- Li, D.; Wang, J.; Ding, Y.; Yao, H.; Huang, Y. Dynamic thermal management for industrial waste heat recovery based on phase change material thermal storage. Appl. Energy 2018, 236, 1168–1182. [Google Scholar] [CrossRef] [Scilit]
- Malik, F.; Khan, M.; Ahmed, H.F.; Irfan, M.; Ahad, I. Performance characteristics of PCM based thermal energy storage system for fluctuating waste heat sources. Case Stud. Therm. Eng. 2022, 34, 102012. [Google Scholar] [CrossRef] [Scilit]
- Lozhkina, O.; Lozhkin, V. Recycling of Waste Heat Energy from Engine Exhausts. In Waste-to-Wealth; CRC Press eBooks: Boca Raton, FL, USA, 2024; pp. 152–161. [Google Scholar] [CrossRef] [Scilit]
- Kamimoto, M.; Abe, Y.; Sawata, S.; Tani, T.; Ozawa, T. Latent thermal storage unit using Form-Stable high density polyethylene; Part I: Performance of the storage unit. J. Sol. Energy Eng. 1986, 108, 282–289. [Google Scholar] [CrossRef] [Scilit]
- Morcos, V.H. Investigation of a latent heat thermal energy storage system. J. Sol. Wind. Technol. 1990, 7, 197–202. [Google Scholar] [CrossRef] [Scilit]
- Shaikh, M.; Uzair, M.; Allauddin, U. Effect of geometric configurations on charging time of latent-heat storage for solar applications. Renew. Energy 2021, 179, 262–271. [Google Scholar] [CrossRef] [Scilit]
- Dardouri, S.; Medjahed, B.; Arıcı, M.; Mokhtari, A.; Bouhenni, F.; Sghaier, J. Comparative thermal analysis of heat transfer fluid injection orientation in phase change material based latent heat thermal energy storage systems. J. Therm. Anal. Calorim. 2026. [Google Scholar] [CrossRef] [Scilit]
- Mahboobtosi, M.; Gholami, A.; Ganji, D.D. Enhanced PCM solidification in triplex-tube thermal energy storage with optimized configuration of branched-angled fins and hybrid nanofluid integration. Results Eng. 2025, 27, 106214. [Google Scholar] [CrossRef] [Scilit]
- Jabbar, W.K.; Alshara, A.K.; Allawy, A.S. Experimental study of solar thermal energy storage finned tanks filled with different storage materials (PCM, gravel, and water). Results Eng. 2025, 26, 105041. [Google Scholar] [CrossRef] [Scilit]
- Dongellini, M.; Martino, G.; Naldi, C.; Lorente, S.; Morini, G.L. Experimental study on the heat transfer performance of finned-tube heat exchangers in latent thermal energy storages: Effects of PCM types and operating conditions. Appl. Therm. Eng. 2025, 271, 126273. [Google Scholar] [CrossRef] [Scilit]
- Naldi, C.; Martino, G.; Dongellini, M.; Biserni, C.; Morini, G.L. Experimental analysis of a thermal storage with a PCM-loaded finned heat exchanger. Int. J. Hydromechatron. 2024, 7, 250–263. [Google Scholar] [CrossRef] [Scilit]
- Shaikh, M.; Uzair, M.; Raza, S. Optimization of thermal storage using different materials for cooking with solar power. Trans. Can. Soc. Mech. Eng. 2022, 46, 490–502. [Google Scholar] [CrossRef] [Scilit]
- Sagade, N.A.; Sagade, A.A.; Tawfik, M.A.; Saxena, A. Ensuring self-sustainability in decentralized communities through solar cookers combined with food dryers. Sol. Energy 2023, 260, 83–93. [Google Scholar] [CrossRef] [Scilit]
- Esen, M. Thermal performance of a solar-aided latent heat store used for space heating by heat pump. J. Sol. Energy 2000, 69, 15–25. [Google Scholar] [CrossRef] [Scilit]
- Esen, M.; Durmus, A. Geometric design of solar-aided latent heat store depending on various parameters and phase change materials. J. Sol. Energy 1998, 62, 19–28. [Google Scholar] [CrossRef] [Scilit]
- Jegadheeswaran, S.; Pohekar, S.D. Performance enhancement in latent heat thermal storage system: A review. Renew. Sustain. Energy Rev. 2009, 13, 2225–2244. [Google Scholar] [CrossRef] [Scilit]
- Gasia, J.; Miró, L.; Cabeza, L.F. Experimental evaluation of a paraffin as phase change material for thermal energy storage in laboratory equipment and in a shell-and-tube heat exchanger. Appl. Sci. 2016, 6, 112. [Google Scholar] [CrossRef] [Scilit]
- Rahimi, M.; Ranjbar, A.A.; Ganji, D.D.; Sedighi, K.; Hosseini, M.J. Experimental investigation of phase change inside a finned-tube heat exchanger. J. Eng. 2014, 2014, 641954. [Google Scholar] [CrossRef] [Scilit]
- Rathod, M.K.; Banerjee, J. Thermal performance enhancement of shell and tube Latent Heat Storage Unit using longitudinal fins. Appl. Therm. Eng. 2014, 75, 1084–1092. [Google Scholar] [CrossRef] [Scilit]
- Khan, L.A.; Khan, M.M. Role of orientation of fins in performance enhancement of a latent thermal energy storage unit. Appl. Therm. Eng. 2020, 175, 115408. [Google Scholar] [CrossRef] [Scilit]
- Dhaidan, N.S.; Khodadadi, J.M. Improved performance of latent heat energy storage systems utilizing high thermal conductivity fins: A review. J. Renew. Sustain. Energy 2017, 9, 034103. [Google Scholar] [CrossRef] [Scilit]
- Xiao, Z.; Mishra, P.; Nejad, A.M.; Tao, M.; Granados-Focil, S.; Van Dessel, S. Thermal optimization of a novel thermo-optically responsive SS-PCM coatings for building enclosures. Energy Build. 2021, 247, 111129. [Google Scholar] [CrossRef] [Scilit]
- El Ouaragli, J.; Xiao, Z.; Tao, M.; Granados-Focil, S.; Van Dessel, S. A novel passive polymer-sorbent thermal battery for low-temperature energy applications: A numerical feasibility study. J. Energy Storage 2022, 56, 105971. [Google Scholar] [CrossRef] [Scilit]
- Shazad, A.; Akhtar, M.; Hussain, A.; Alsaleh, N.; Haldar, B. Thermal Performance Assessment of Heat Storage Unit by Investigating Different Fins Configurations. Energies 2025, 18, 5920. [Google Scholar] [CrossRef] [Scilit]
- Available online: https://www.rubitherm.eu/en/index.php/productcategory/organische-pcm-rt (accessed on 9 October 2020).

Disclaimer/Publisher’s Note: The statements, opinions and data contained in all publications are solely those of the individual author(s) and contributor(s) and not of MDPI and/or the editor(s). MDPI and/or the editor(s) disclaim responsibility for any injury to people or property resulting from any ideas, methods, instructions or products referred to in the content. |
© 2026 by the authors. Licensee MDPI, Basel, Switzerland. This article is an open access article distributed under the terms and conditions of the Creative Commons Attribution (CC BY) license.