


Abstract
Biodiesel composition largely affects its combustion and emission performance in diesel engines, while the pilot–main injection strategy has the potential to simultaneously improve engine efficiency and alleviate the soot–NOx trade-off. Accordingly, soybean oil (SO), animal fat (AF), and waste cooking oil (WCO) biodiesels were numerically investigated under single injection and pilot–main double injection strategies with pilot energy ratios of 5.6%, 10%, and 15% over a range of main injection timings. The CFD framework was validated against the experimental in-cylinder pressure and AHRR, showing good agreement across the tested operating conditions. The results show that advancing the injection timing increases the AHRR peak and MPRR, whereas the pilot–main injection strategy reduces the AHRR peak and generally advances combustion phasing. A stable CA10 at injection timing ranges of 350–358 °CA persists across biodiesels and injection strategies. Emissions correlate with MICT, where NOx increases while soot decreases with the rise in MICT, suggesting an intermediate MICT window for a balance between efficiency and emissions. Furthermore, at the respective highest gross ITE of biodiesels, SO provides the most favorable combination of MPRR and efficiency, whereas WCO shows lower NOx but stronger indicators of incomplete combustion.
1. Introduction
Biofuels derived from biowaste (e.g., food waste and manure) are increasingly regarded as promising low-carbon alternatives that can simultaneously valorize waste streams and reduce disposal burdens [1]. In terms of diesel engines, biodiesel is widely considered a near-term renewable surrogate for reducing life-cycle carbon footprints, because it can be used in existing engines with limited hardware changes. However, because feedstocks vary, biodiesel can be a complex mixture containing hundreds of compounds, with fatty acid methyl esters (FAMEs) as the major components [2]. Fortunately, advances in catalysts and production processes make biodiesel composition increasingly tunable. In this context, for biodiesel to be widely adopted, the effects of FAME composition on combustion and emissions need to be clarified, and consequently pave the way for the adoption of biodiesel.
Large-scale biodiesel application remains constrained by emission challenges. Previous studies consistently show that oxygenated biodiesel often reduces soot [3] and particulate matter (PM) [4] emissions, relative to conventional diesel. In contrast, the nitrogen oxide (NOx) emissions are unpredictable and may increase, decrease, or remain nearly unchanged depending on engine calibration, operating conditions, and biodiesel composition. This variability in NOx emissions has therefore been widely regarded as a controversial issue. Mueller et al. reported that variations in biodiesel NOx emissions may arise from a combination of changes in combustion phasing and spray–flame structure, leading to differences in temperature and local air–fuel ratio [5]. In this context, even if the start of combustion and the premixed burn fraction are controlled, the in-cylinder temperature and high-temperature residence time may still increase. This can result from reduced radiative heat losses due to soot [6] and from the mixture being closer to stoichiometric conditions [5]. Fuel chemistry is central to combustion phasing and the spray–flame structure, and thus variations in FAME composition undoubtedly influence ignition behavior, heat-release dynamics, and pollutant formation. Several studies have reported that increasing unsaturation can shift the NOx–soot trade-off [7,8], highlighting the need to interpret biodiesel combustion and emission performance using detailed FAME profiles.
In parallel, injection strategies have evolved into a key lever for managing in-cylinder spray combustion in modern diesel engines [9]. Multi-injection strategies can reshape in-cylinder pressure (ICP), apparent heat release rate (AHRR), and pressure rise rate (PRR), thereby influencing efficiency and emissions [10]. Multi-injection strategies also enable low-temperature combustion (LTC) concepts, such as homogeneous charge compression ignition (HCCI), where mixture stratification achieved by multi-injection strategies is used to mitigate PRR [11,12]. However, using too many injections per cycle can be constrained by control complexity. Therefore, double injection is widely deployed with the pilot–main or main–post configurations. The essence of pilot–main injection is the use of a pilot injection to modify the thermochemical environment encountered by the main injection [13]. Specifically, the pilot injection creates an active atmosphere through changes in thermodynamic conditions and the formation of radical species from low- and high-temperature reactions, which alters the ignitable mixture region when the main injection arrives. As a result, the main injection ignition delay and flame lift-off length become highly sensitive to the pilot–main interval and ambient conditions [13]. Nevertheless, the benefits of pilot injection may depend nonlinearly on injection parameters, such as the pilot energy ratio and main injection timing. Consequently, diverging trends have been reported for NOx and soot when pilot parameters are varied [14,15,16]. Thus, uncovering the influence of pilot energy ratios and injection timings is essential to deploy pilot–main injection in biodiesel-fueled engines.
Despite extensive work on biodiesel or on double injection strategy separately, comprehensive comparisons that jointly concentrate on biodiesel FAME composition and pilot–main injection parameters remain limited. Specifically, prior studies have mainly focused either on biodiesel composition effects under a fixed injection strategy or on injection-strategy effects for a single fuel. A systematic comparison of how biodiesel FAME composition interacts with pilot–main injection parameters to influence combustion phasing, combustion intensity, efficiency, and the NOx–soot trade-off remains lacking. Accordingly, soybean oil, animal fat, and waste cooking oil biodiesels are numerically investigated under single injection and pilot–main double injection strategies, with pilot energy ratios of 5.6%, 10%, and 15% across a range of main injection timings to elucidate the coupled effects of FAME composition and injection strategy on combustion dynamics and emissions.
2. Materials and Methods
2.1. Biodiesel Samples
In this study, the samples were selected as waste cooking oil (WCO), animal fat (AF), and soybean oil (SO) biodiesels, as they are representative feedstocks. The gas chromatography with a flame ionization detector was employed to measure the fatty acid methyl ester (FAME) compositions of 3 biodiesels within the range of C14:0–C20:1. The FAME mole fractions of samples are summarized in Table 1, where FAME with very low mole fractions is not illustrated.
Table 1.
The FAME mol.% of soybean, animal fat, and waste cooking oil biodiesel.
Apparently, the variation in feedstocks leads to substantial fluctuation in FAME distribution patterns, especially the C16:0, C18:1, and C18:2 mol.%, resulting in the difference in C=C bonds. To describe this trend, the degree of unsaturation (DU), a molar weighted factor of C=C bonds, is introduced and defined in Equation (1). The DU values of the SO, AF, and WCO biodiesels are 1.4370, 0.9687, and 0.4889.
where the Ni and Yi refer to the number of C=C bonds and mol.% of FAME i.
2.2. Property Estimations and Oxidation Mechanism of Surrogate Fuel
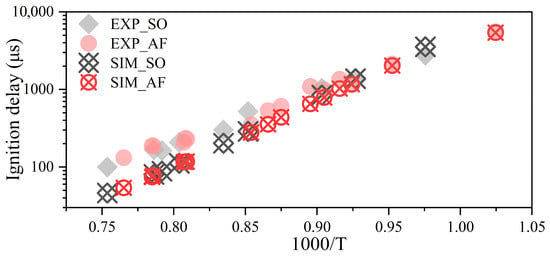
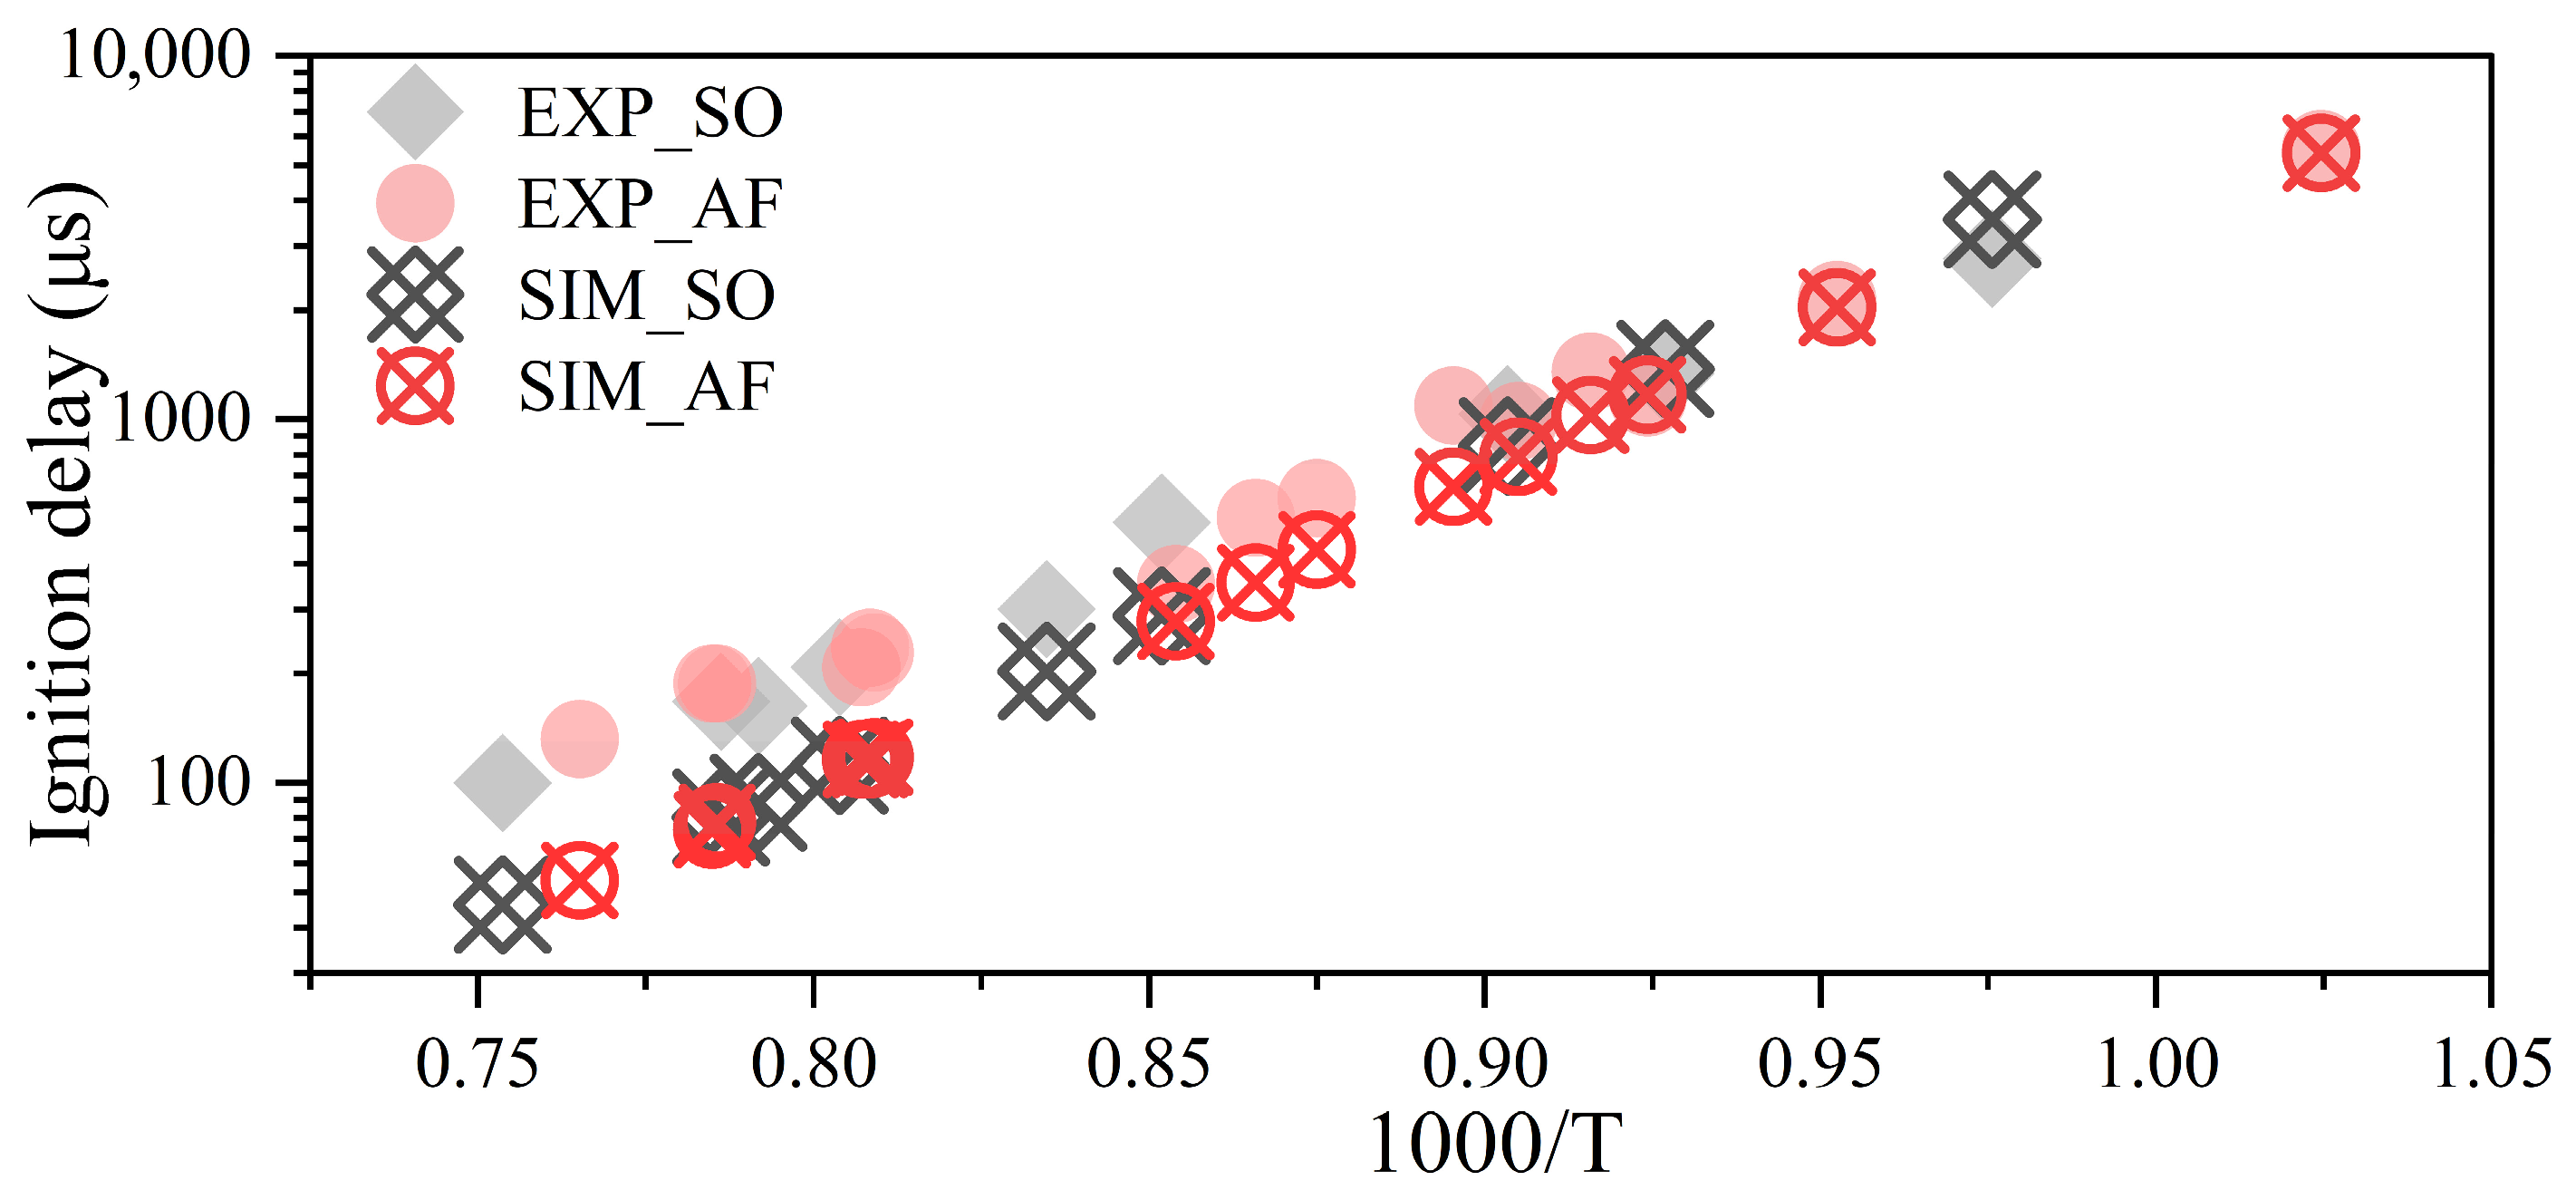
The tri-component surrogate mechanism developed by Herbinet et al. was widely employed in simulating the ignition, combustion, and pollutant formation of biodiesel [17]. It consists of methyl decanoate (MD), methyl 9-decenoate (MD9D), and n-heptane (NPH), where MD represents saturated methyl esters, MD9D represents unsaturated methyl esters, and NPH represents the methyl esters of a similar size, allowing for flexibility in matching the physical and chemical properties of real biodiesel from different feedstocks [17]. However, for balancing accuracy and computational time, the reduced version by Luo et al. was ultimately deployed in this work [18]. To validate the selected chemical kinetics, the ignition delay was modeled in a constant volume reactor and was further compared with the measured ignition delay from Wang et al. [19]. As illustrated in Figure 1, the tri-component mechanism accurately predicts the ignition delay of both soybean biodiesel and animal fat biodiesel within the 1000/T range of 0.85–1.05, although there is a slight underestimation when 1000/T < 0.85.
Figure 1.
The comparison between predicted and measured ignition delay (Wang et al. [19]) under global equivalence ratio of 0.25.
In this MD/MD9D/NPH framework, the target DU was matched by adjusting the MD and MD9D mol.%. To mimic the C/H/O ratio and lower heating value of real biodiesel, in this study, the NPH was fixed at 50 mol.% [20], while the mol.% of saturated and unsaturated surrogates were calculated by Equations (2) and (3). This approach allowed us to maintain an almost constant oxygen mass fraction (avg. real: 11.10 mass% and avg. surrogate: 11.24 mass%) and the oxygen ratio of the fuel (avg. real: 0.0369 and avg. surrogate: 0.0368), while also enabling the characterization of the fuel and real biodiesel to have similar lower heating values (avg. real: 37.72 MJ/kg and avg. surrogate: 37.91 MJ/kg).
Additionally, the precise description of thermophysical properties is vital for capturing the evaporation, diffusion, and other physical processes of fuel [21,22], especially biodiesel, which consists of various FAMEs. Therefore, in this work, the critical properties were first calculated using the Joback method. Then, the Ambrose–Walton corresponding-states method, the Watson relation, the group contribution method, the Sastri–Rao correlation, the Latini method, and a corresponding-states correlation were employed to calculate the vapor pressure, enthalpy of vaporization, enthalpy, liquid viscosity, thermal conductivity, and surface tension, respectively. The accuracy of these methods is acceptable and thus commonly utilized in engineering applications. Details can be found in Ref. [23].
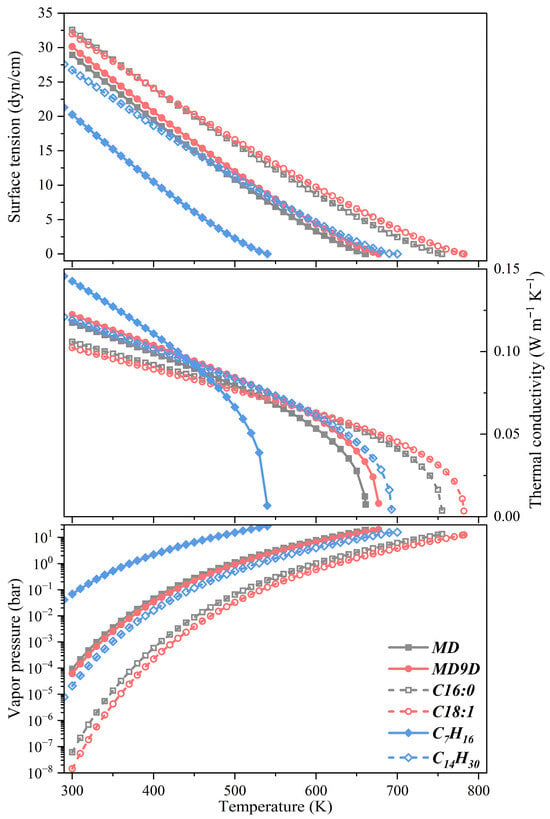
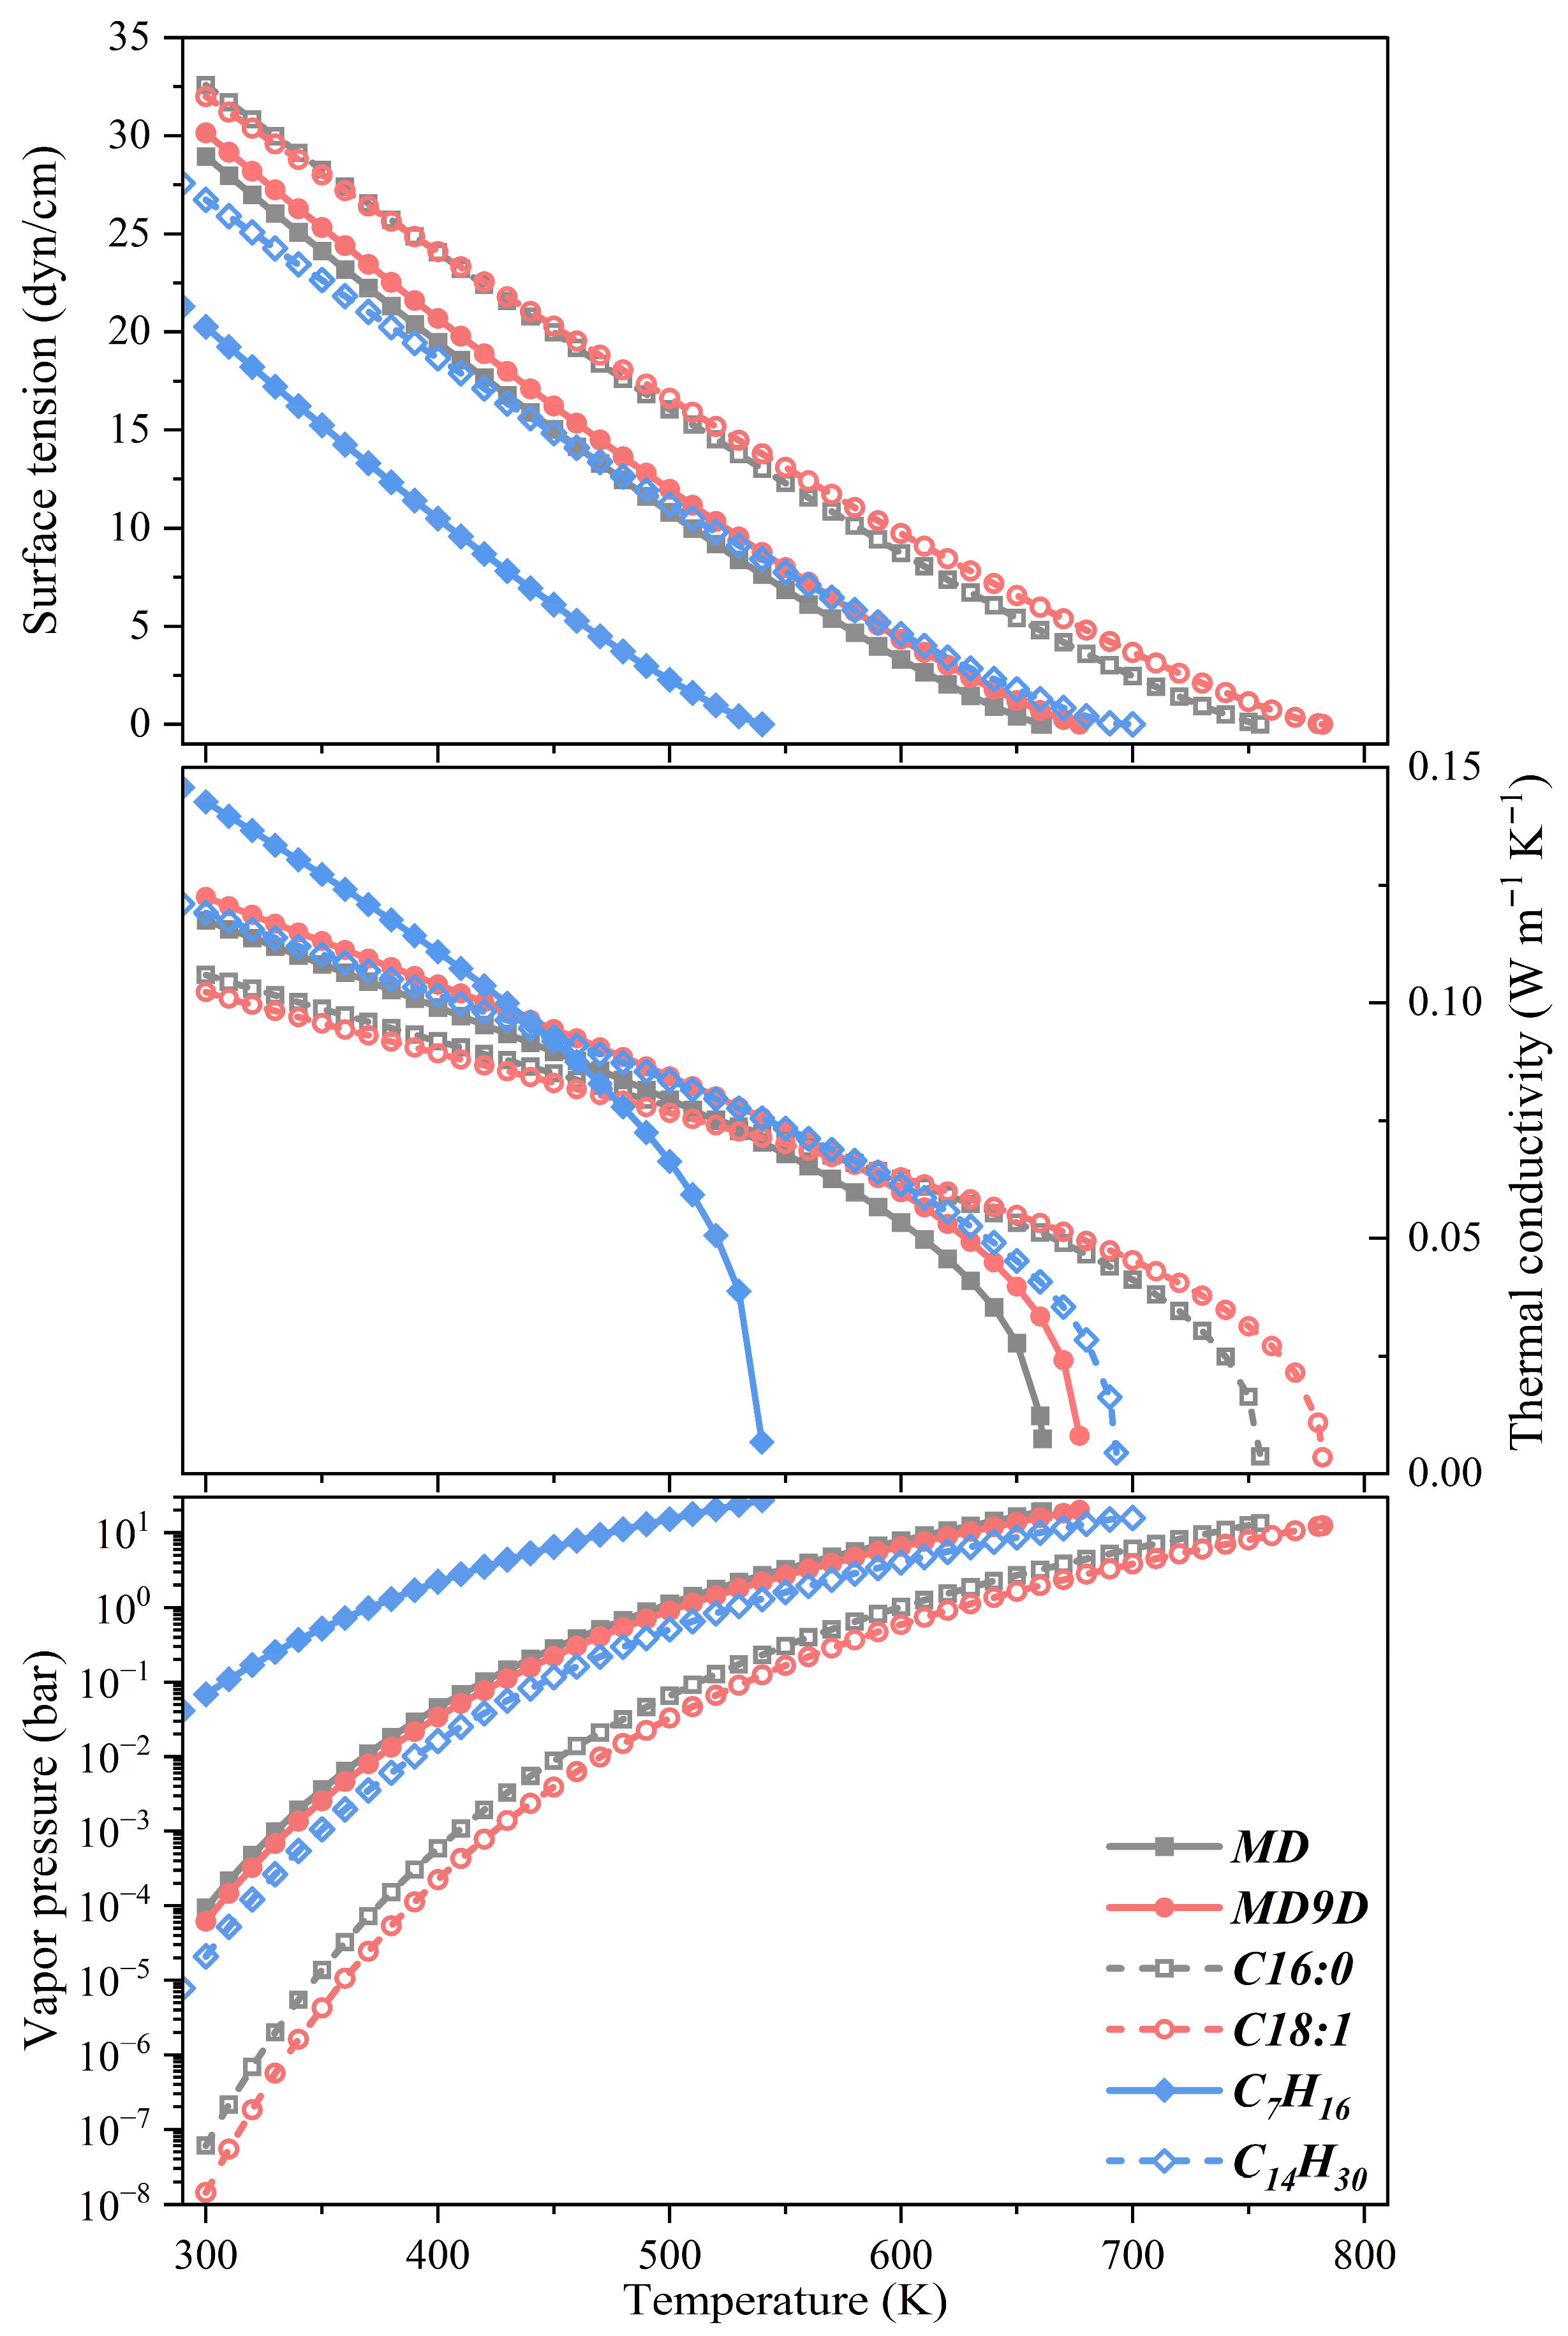
As depicted in Figure 2, discrepancies arise between the surrogate and FAME properties due to differences in carbon-chain length, resulting in an overestimation of evaporation and, consequently, an error in mixture preparation. In this context, the decoupling physical–chemical method was deployed to describe the biodiesel spray behavior. Specifically, the thermophysical properties of C16:0, C18:1, and n-tetradecane were assigned to saturated surrogate MD, unsaturated surrogate MD9D, and NPH, respectively. This decoupling physical–chemical method has demonstrated its favorable capability in capturing the biodiesel spray liquid penetration [24]. In this framework, SO biodiesel contains a larger fraction of heavier components, leading to lower vapor pressure and higher surface tension, and consequently possesses undesirable evaporation characteristics.
Figure 2.
Surface tension, thermal conductivity, and vapor pressure of representative FAME species and surrogate components as a function of temperature.
2.3. Numerical Model and Operating Conditions
The researched engine is a Ford light-duty diesel engine, with the main engine parameters summarized in Table 2. This engine is equipped with a common rail injection system and a high-pressure, water-cooled exhaust gas recirculation (EGR) system. Moreover, its electric control unit (ECU) is tailored to enable up to 6 injections per cycle, with pilot–main injection as the default setting.
Table 2.
Key specifications of the Ford light-duty diesel engine.
The simulation in this study is the closed-chamber simulation, from intake valve closing (IVC) to exhaust valve opening (EVO), and it is performed by the customized KIVA3V-II program. The biodiesel spray behavior is resolved by the Eulerian–Lagrangian approach. The gas phase was simulated by the generalized renormalization group k-epsilon model [25], while the biodiesel spray breakup and evaporation were captured by the Taylor analogy breakup (TAB) model [26] and preferential evaporation model [27], respectively. Moreover, as discussed above, the decoupling physical–chemical method was introduced to model the multi-component evaporation characteristics of multi-FAME biodiesel; this treatment is effective in mitigating the thermophysical property differences between real biodiesel and surrogates.
On the other hand, the biodiesel ignition and combustion dynamics were resolved by an in-house chemical solver. The chemical solver is developed based on Cantera and is capable of solving the chemical kinetics for each finite volume cell efficiently. More details about this solver can be found in our previous study [28]. For capturing the evolution of nitrogen oxides, a 4-species and 12-step NOx sub-mechanism [29] was included in the biodiesel surrogate mechanism. Additionally, the Hiroyasu model and Nagle and Strickland-Constable model were employed to simulate the formation and oxidation of soot. Although this is an empirical model, its accuracy is sufficient to capture the semi-quantitative trend of soot changes with the injection time.
The operating conditions in this work are listed in Table 3. In this research, the engine speed was 1000 rpm and the EGR rate was 19.2% across all biodiesels. Calculation details of the EGR rate can be found in Ref. [30]. Furthermore, the injected biodiesel mass was fixed at 17.92 mg per cycle, corresponding to a 5 bar brake effective mean pressure (BMEP) in the given engine speed, EGR rate, and default ECU settings. This operating condition is a representative low speed, medium load, and diluted condition for the studied light-duty diesel engine under low temperature combustion conditions, under which the interactions between the pilot injection behavior, mixture preparation, and fuel chemistry are sufficiently pronounced [30].
Table 3.
Operating conditions.
To investigate the influence of different injection strategies, namely the single and pilot–main injection modes, on the performance of biodiesel derived from various feedstocks, both strategies were simulated. To reveal the effect of the injection timing, it was varied from 340 to 362 °CA, which refers to the main injection timing for pilot–main injection. The pilot energy ratios of 5.6%, 10%, and 15% were selected to represent the low, medium, and high pilot energy, respectively. The purpose is to investigate how the chemical and thermal atmospheres formed by different pilot energy affect the engine performance in terms of the combustion and emission characteristics. Furthermore, although the pilot–main interval influences the main combustion process, a constant interval of 16 °CA was adopted for all pilot–main cases, because a longer interval was found to be beneficial for reducing NOx and smoothing combustion in the pre-simulations.
As this study is closed-chamber modeling, the subsequent engine efficiency is the gross indicated thermal efficiency (ITE), considering work delivered to the piston over the compression and expansion strokes only [31].
where p and V refer to cylinder pressure and volume, and and are the injected fuel mass per cycle and the lower heating value of fuel, respectively.
The emission was normalized by the injected fuel mass, i.e., emission index (EI) [31]. Take EICO, for example:
with similar expressions for NOx.
2.4. Mesh Independence and Model Validation
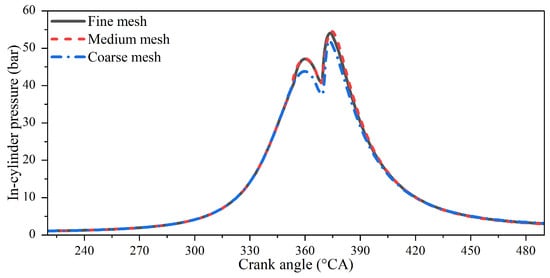
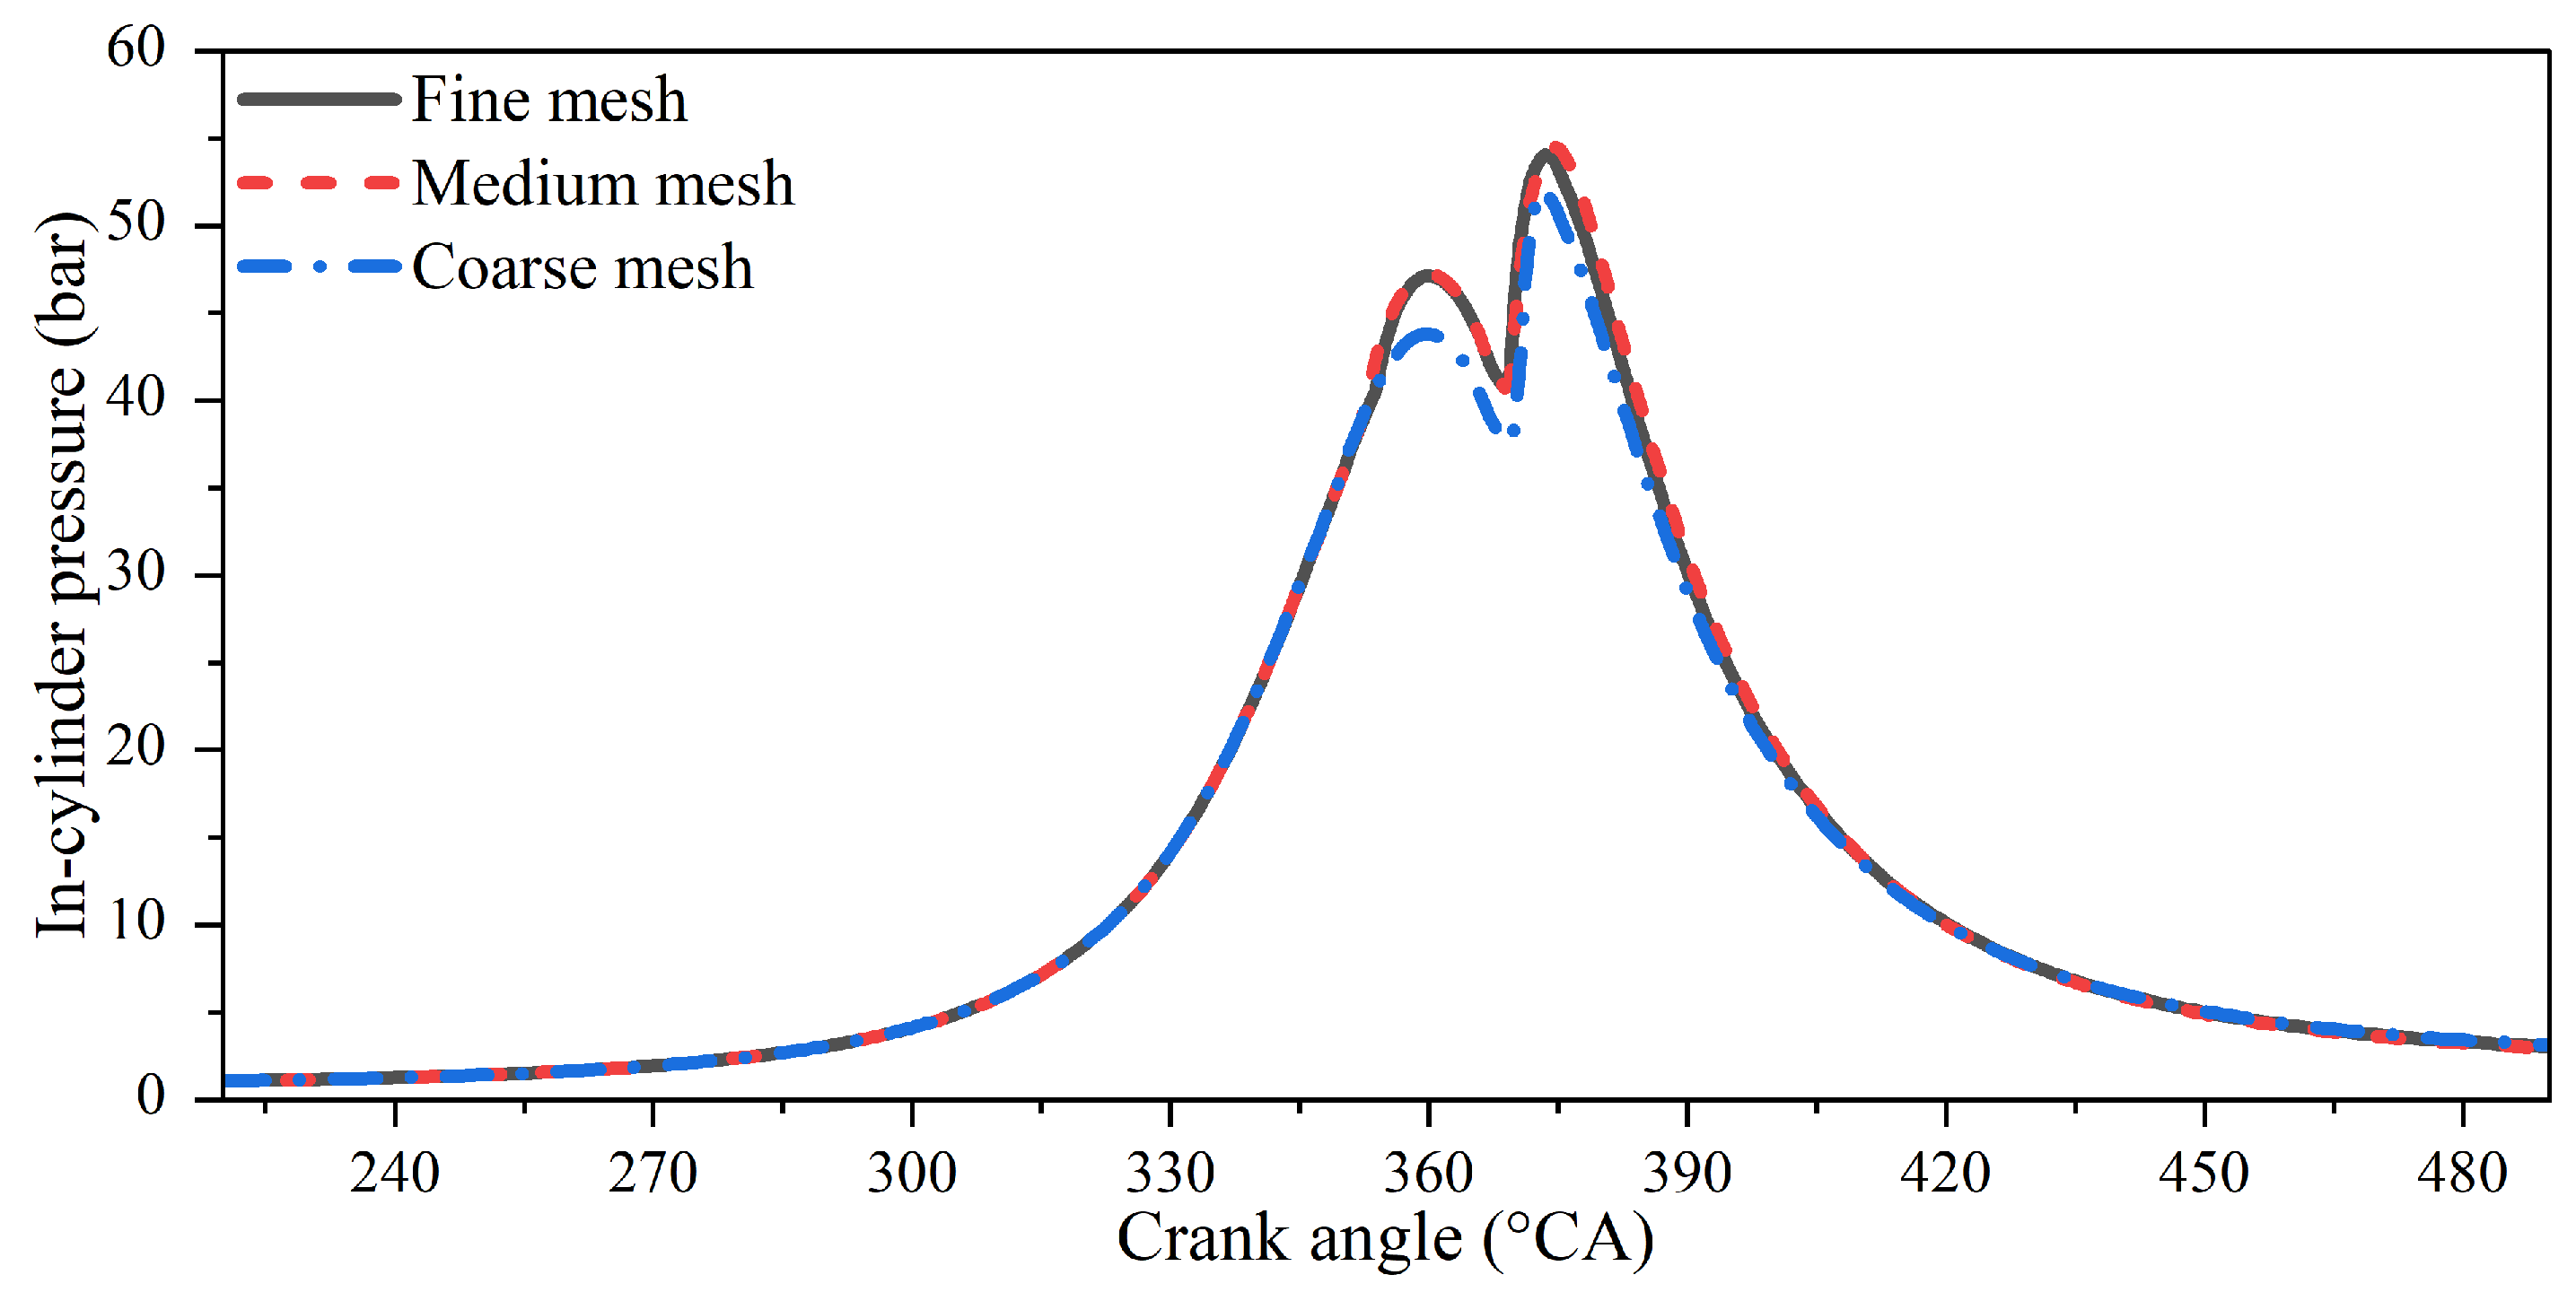
To evaluate the mesh independence, three sector meshes, including coarse, medium, and fine meshes, were formed according to the cylinder geometry of the Ford engine. Notably, to reduce the computational cost, only 1/6 combustion chamber was modeled, since the injector is centrally mounted and its 6-nozzle is symmetrically arranged. It is also worth noting that this treatment neglects the asymmetries of in-cylinder swirl and turbulence, and thus may limit the accuracy of local pilot–main interaction details associated with asymmetric swirl and turbulence structures, such as the plume-to-plume variation. However, this error in the treatment is acceptable; as reported by Wang et al. [32], the strong entrainment of the fuel jet tends to dominate the local flow field. Then, these meshes were deployed to model the same operating conditions from IVC to EVO. The in-cylinder pressure (ICP) traces are illustrated in Figure 3, where the differences between medium and fine meshes are negligible. On the other hand, although the coarse mesh is able to predict the ICP reasonably during the compression and exhaust strokes, it underestimates the pressure in the expansion stroke. Thus, the medium mesh was deployed.
Figure 3.
The in-cylinder pressure traces for coarse, medium, and fine meshes.
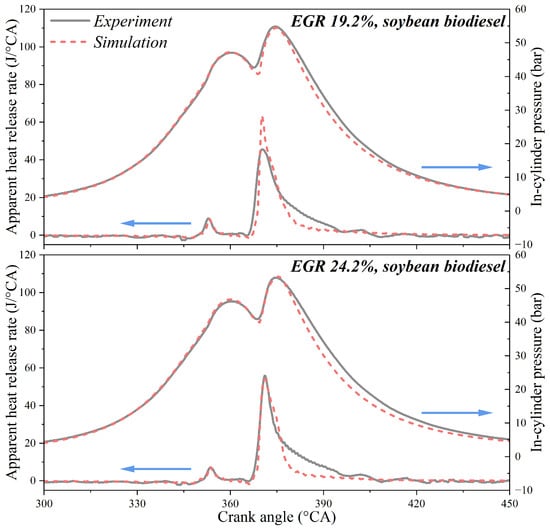
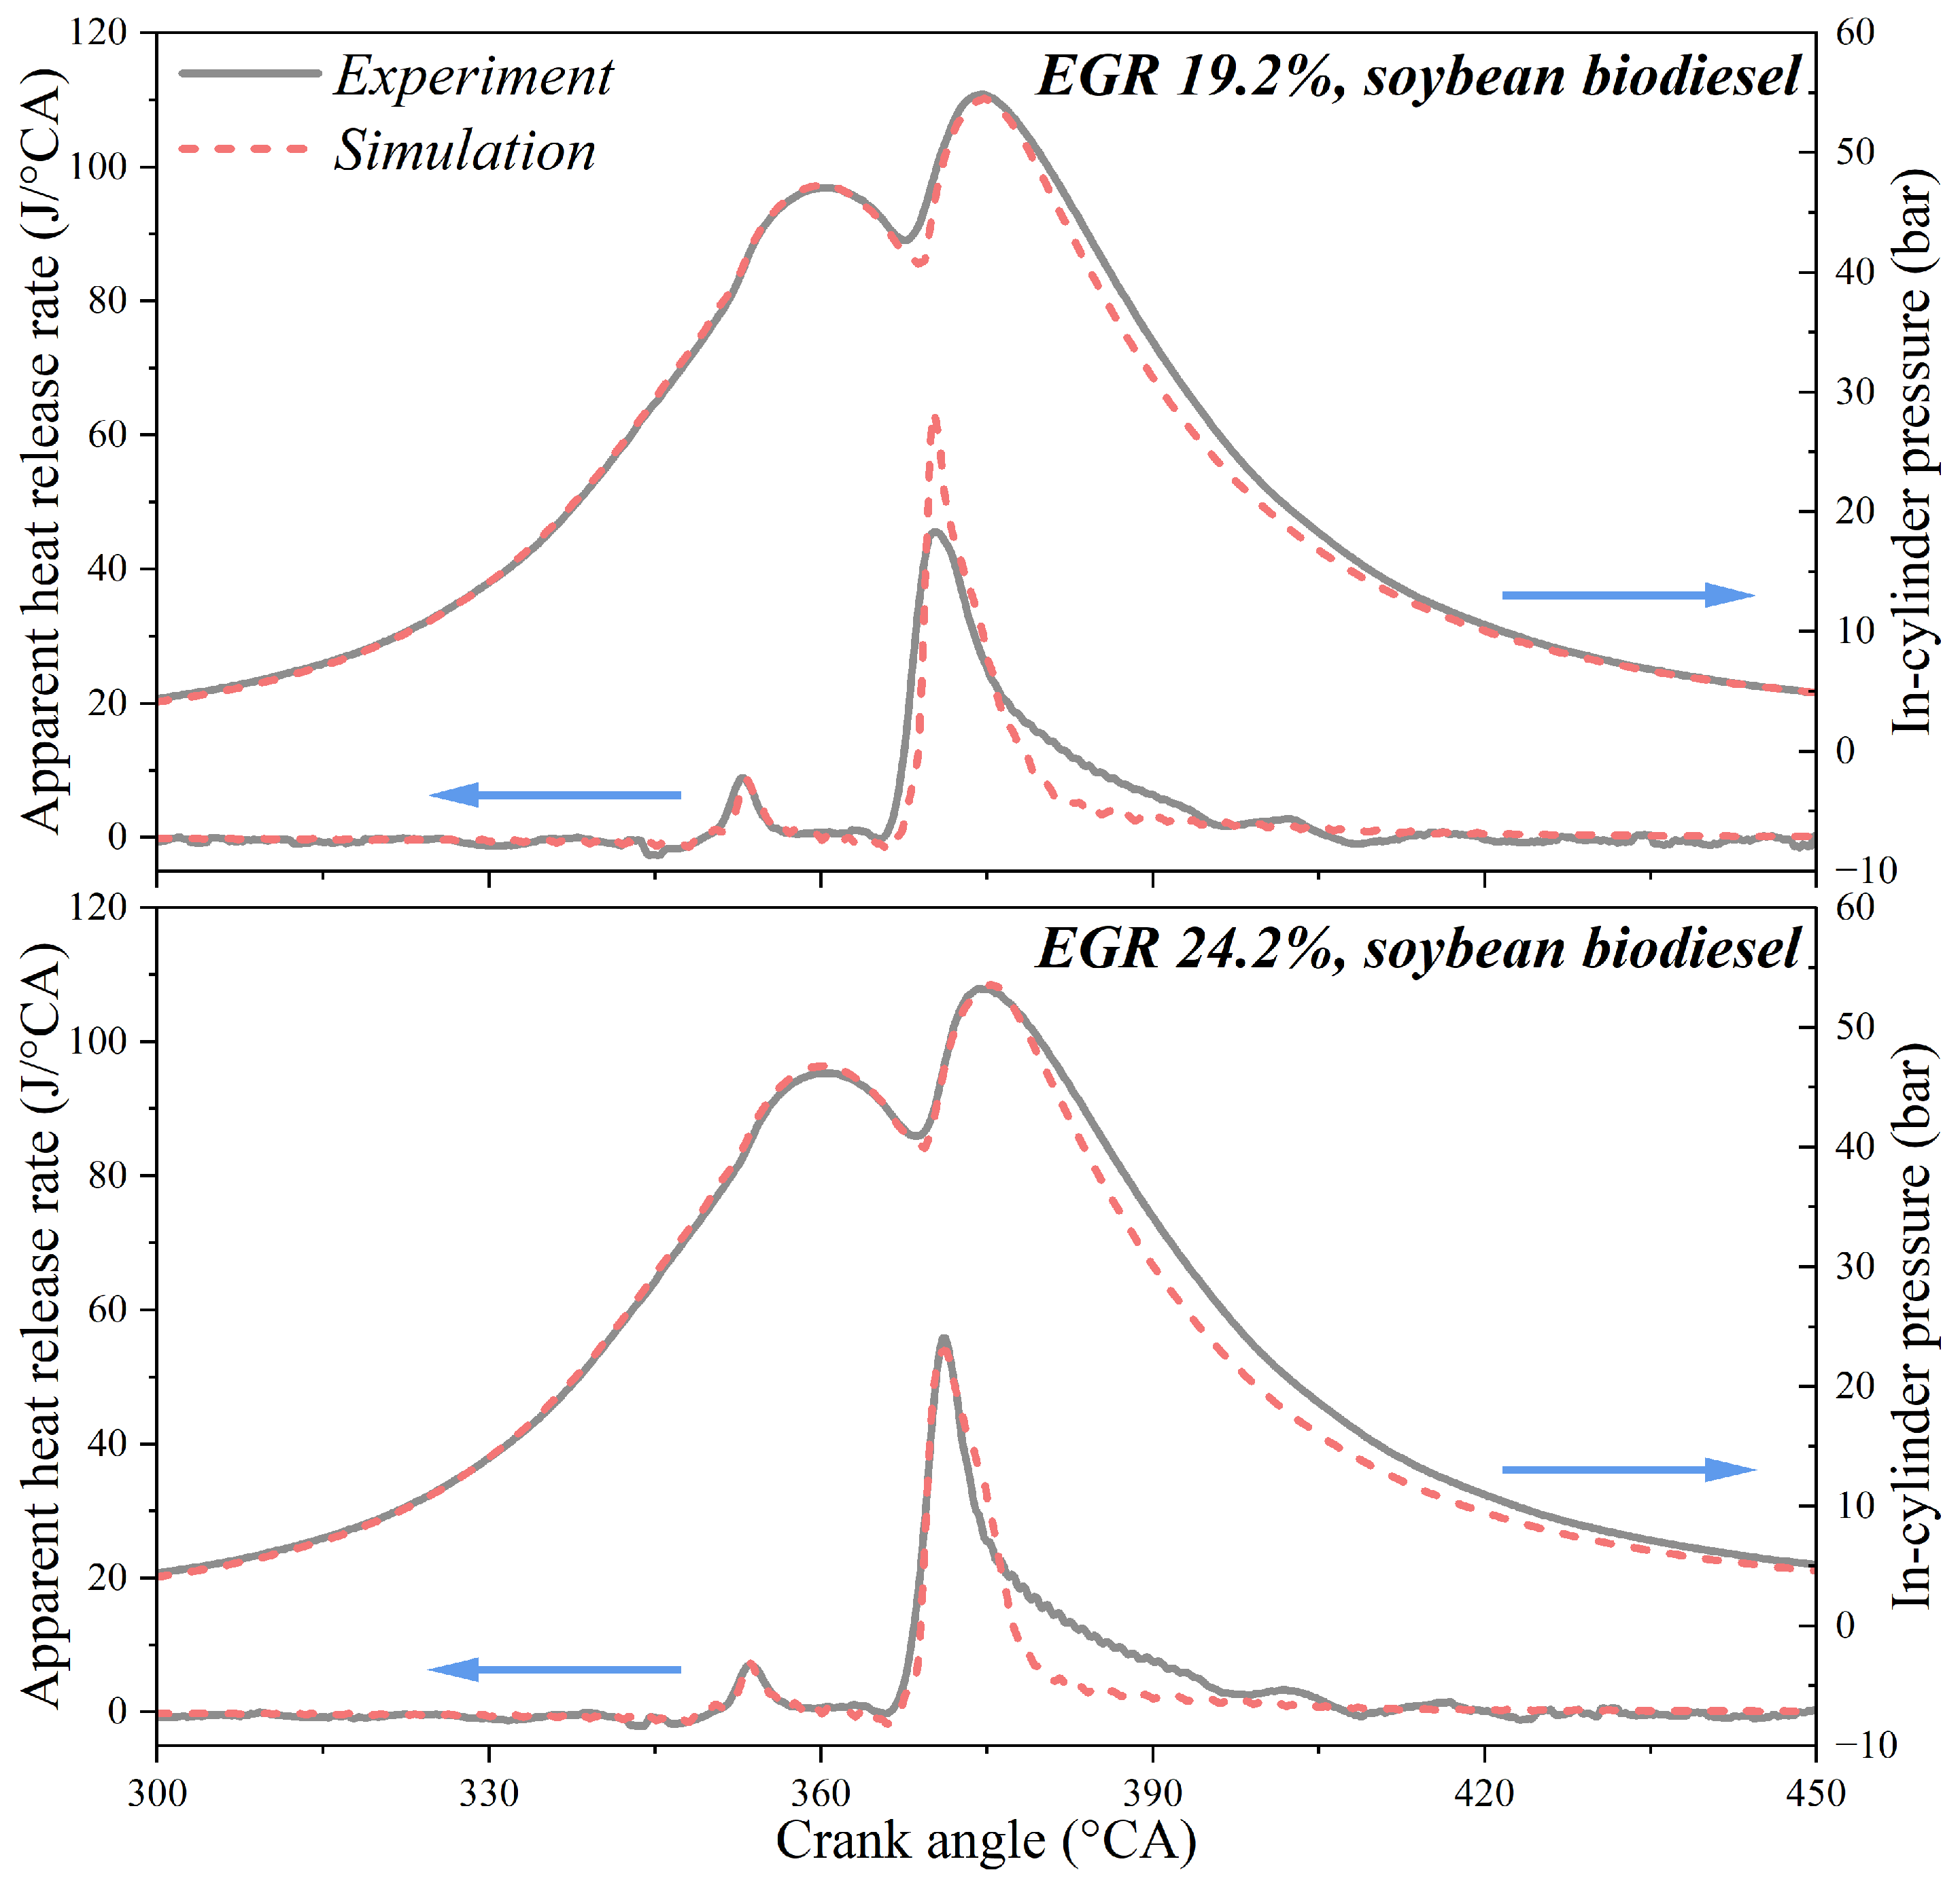
To validate this simulation framework, the modeled ICP and apparent heat release rate (AHRR) were further compared with the experimental results under different EGR rates (see Figure 4). The experimental results were performed by the author’s lab [30,33], and soybean biodiesel was selected as fuel. Additionally, the AHRR is derived from the pressure profiles:
where the γ is the specific heat and θ is the crank angle.
Figure 4.
The comparison between simulation and experiment under various EGR rates.
As illustrated in Figure 4, the simulation reasonably predicts the ignition behavior and heat release characteristics of SO biodiesel under different EGR rates, manifesting the reliability of the selected submodels. However, there are still differences between the simulation and the experiment. This phenomenon may stem from the fact that the FAME composition of experimental SO biodiesel is unknown, so the FAME composition of the abovementioned SO biodiesel sample is employed. Thus, based on the validation of the chemical mechanism and SO biodiesel, this workflow is capable of simulating biodiesels derived from different feedstocks.
3. Results and Discussion
In this section, under single and pilot–main injection strategies, we compare the combustion and emission performance of three biodiesels derived from different feedstocks and thus with different degrees of unsaturation (DU), including waste cooking oil (WCO, DU = 0.4889), animal fat (AF, DU = 0.9687), and soybean oil (SO, DU = 1.4370).
3.1. Effects of Single and Pilot–Main Injection Strategies on Combustion Dynamics for Biodiesels Derived from Different Feedstocks
3.1.1. The Influence of Biodiesel Feedstocks
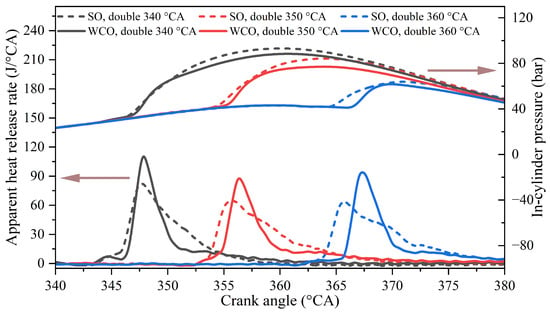
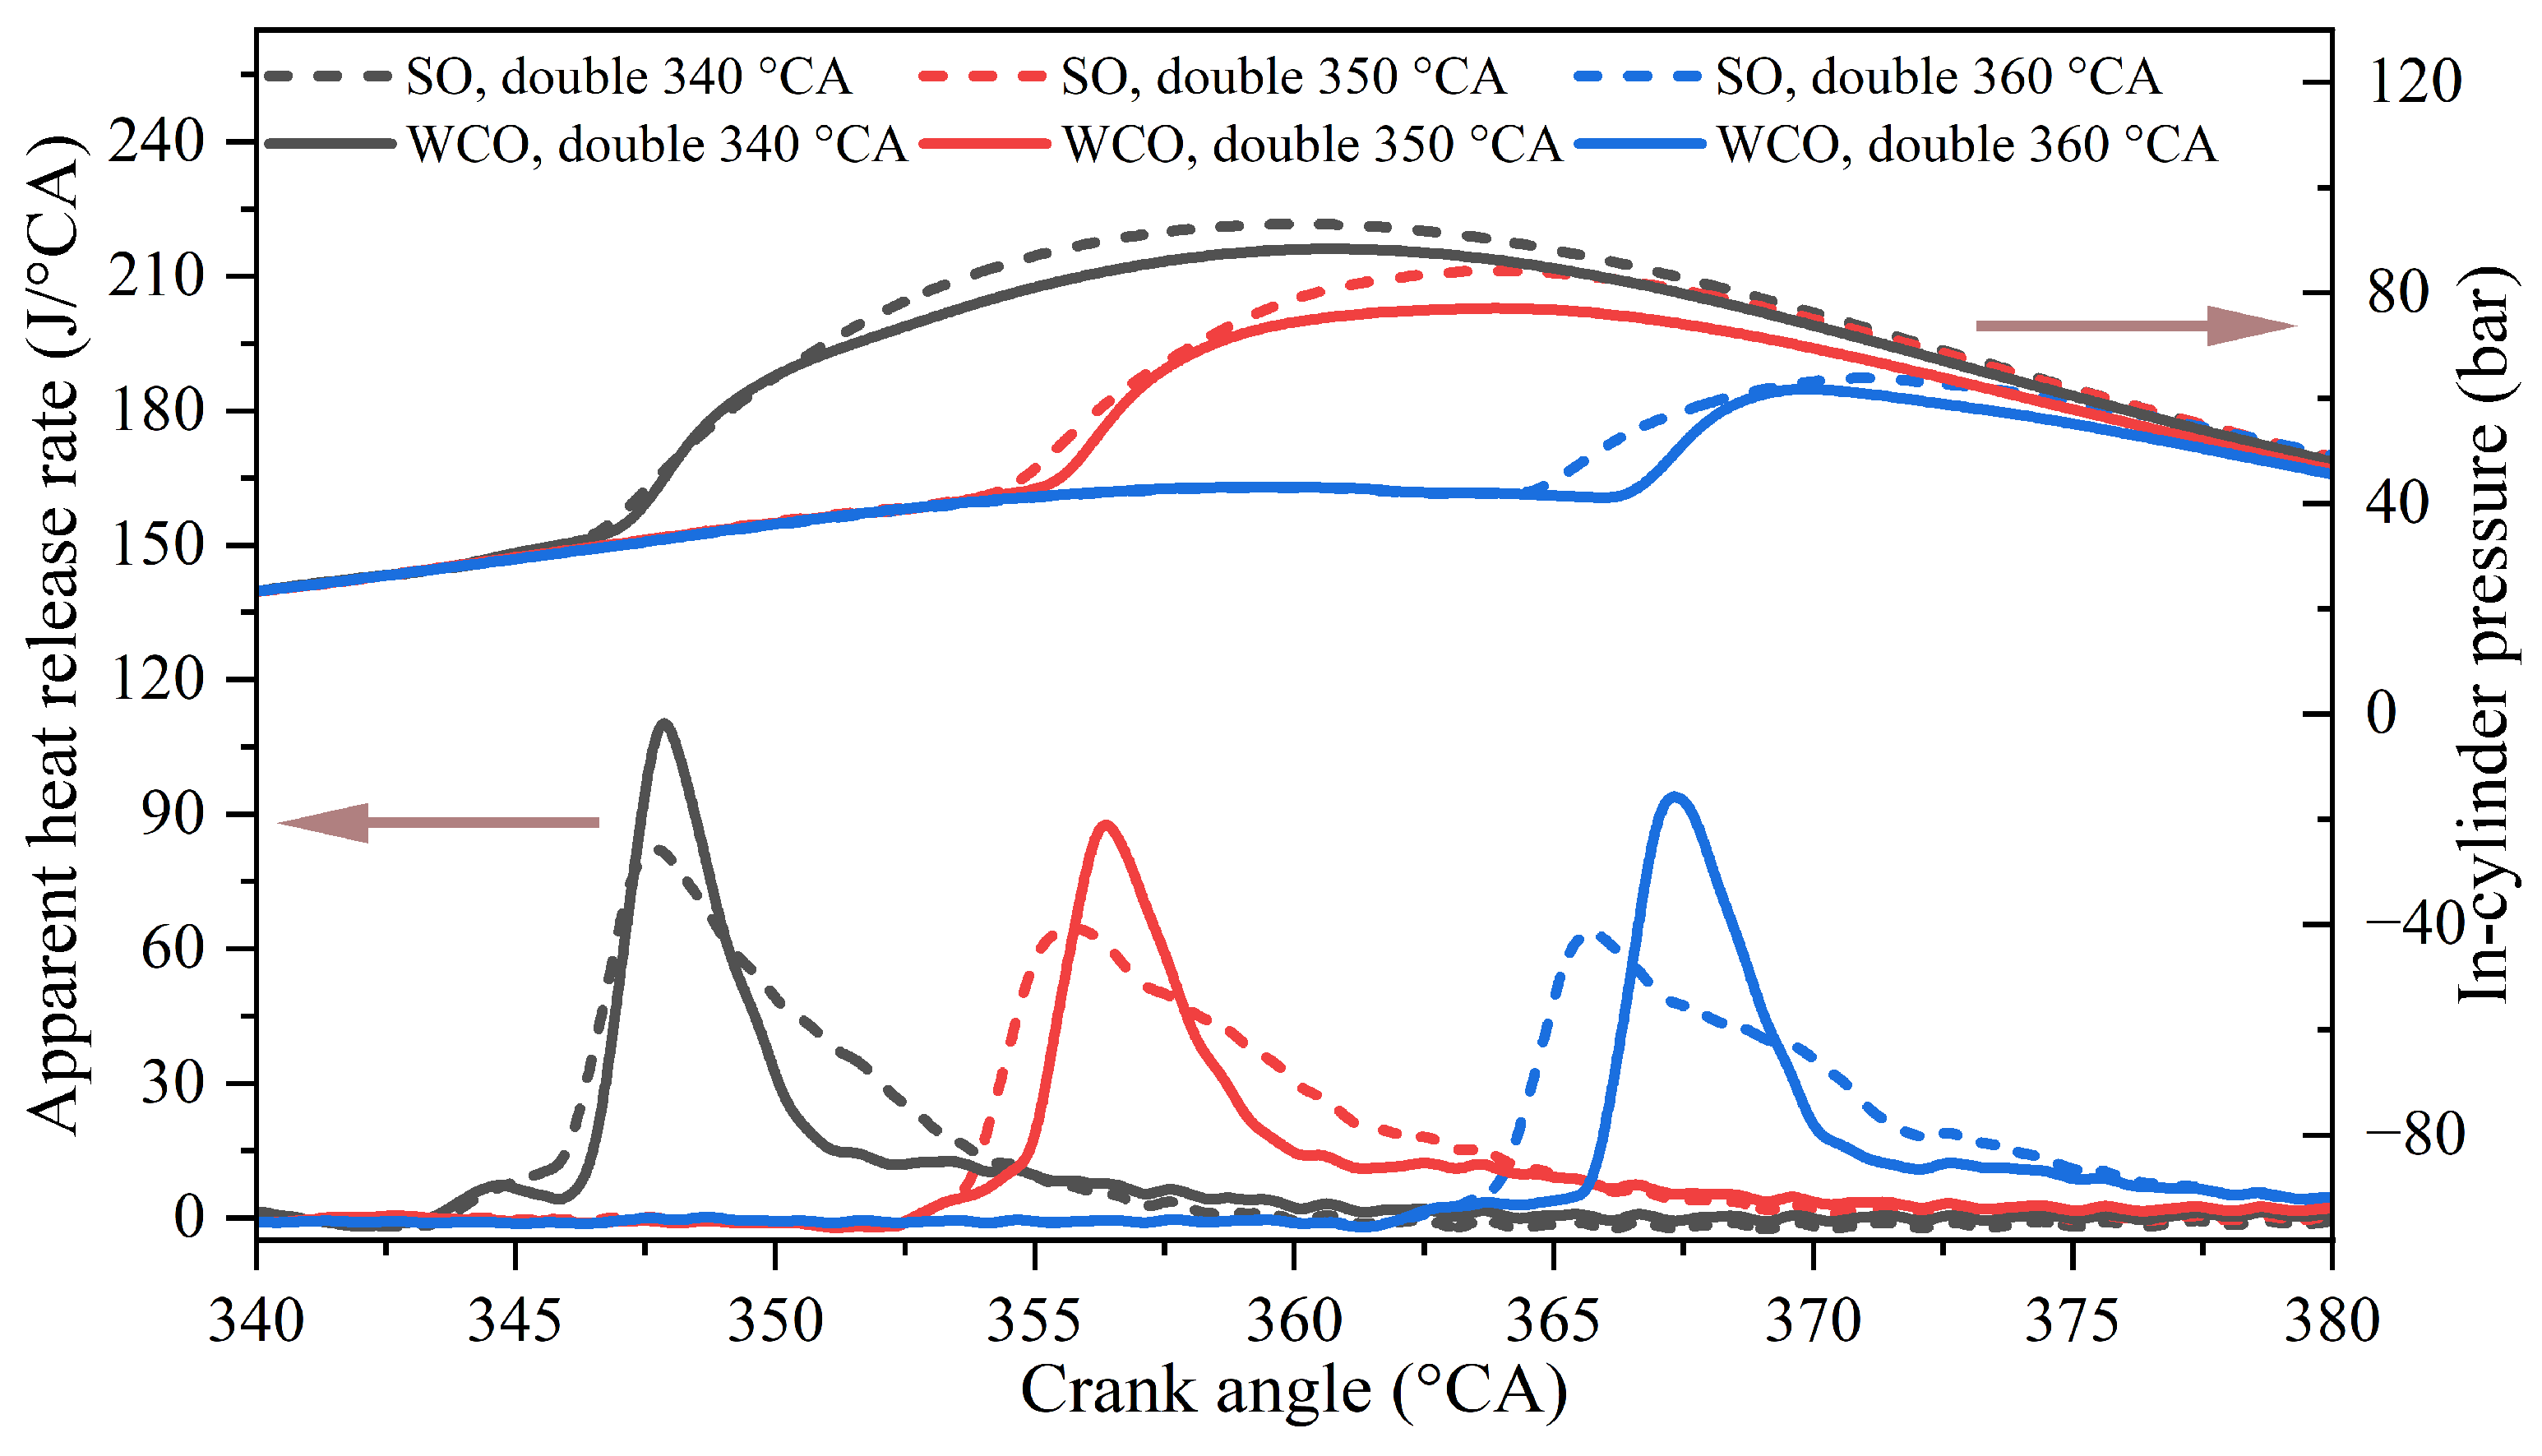
Figure 5 depicts the in-cylinder pressure (ICP) and apparent heat release rate (AHRR) of SO and WCO biodiesels under a double injection strategy with a pilot energy ratio of 5.6%, with main injection timing at 340, 350, and 360 °CA. Here, the “double 340 °CA” refers to a main injection timing of 340 °CA, with a 16 °CA interval between the pilot and main injections. As the main injection timing is retarded, the AHRR and ICP peaks are correspondingly delayed. Furthermore, when the main injection timing is 340 °CA, the AHRR peak is significantly higher than those at the other injection timings. This may be attributed to the earlier injection timing, which promotes the transition of the conventional combustion mode toward the partially premixed compression ignition (PPCI) mode. On the other hand, although high-DU SO biodiesel features poor evaporation characteristics, i.e., the high surface tension and low vapor pressure (see Figure 2), it exhibits an earlier CA10 (the interval from the start of the main injection to the crank angle at 10% cumulative heat release of the entire pilot–main injection event) than low-DU WCO biodiesel, indicating its better chemical reactivity. The difference in CA10 becomes more pronounced as the injection timing is retarded. Consequently, WCO biodiesel, with a desirable evaporation process and longer CA10, exhibits a stronger premixed combustion and a higher AHRR peak.
Figure 5.
In-cylinder pressure and apparent heat release rate of different biodiesels under double (pilot energy ratio 5.6%) injection strategies.
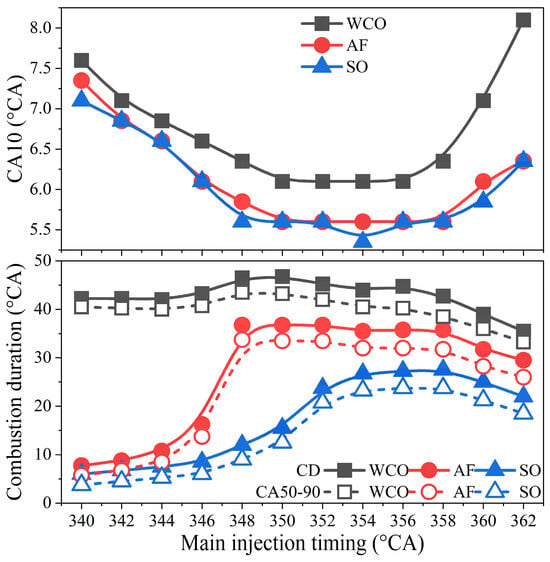
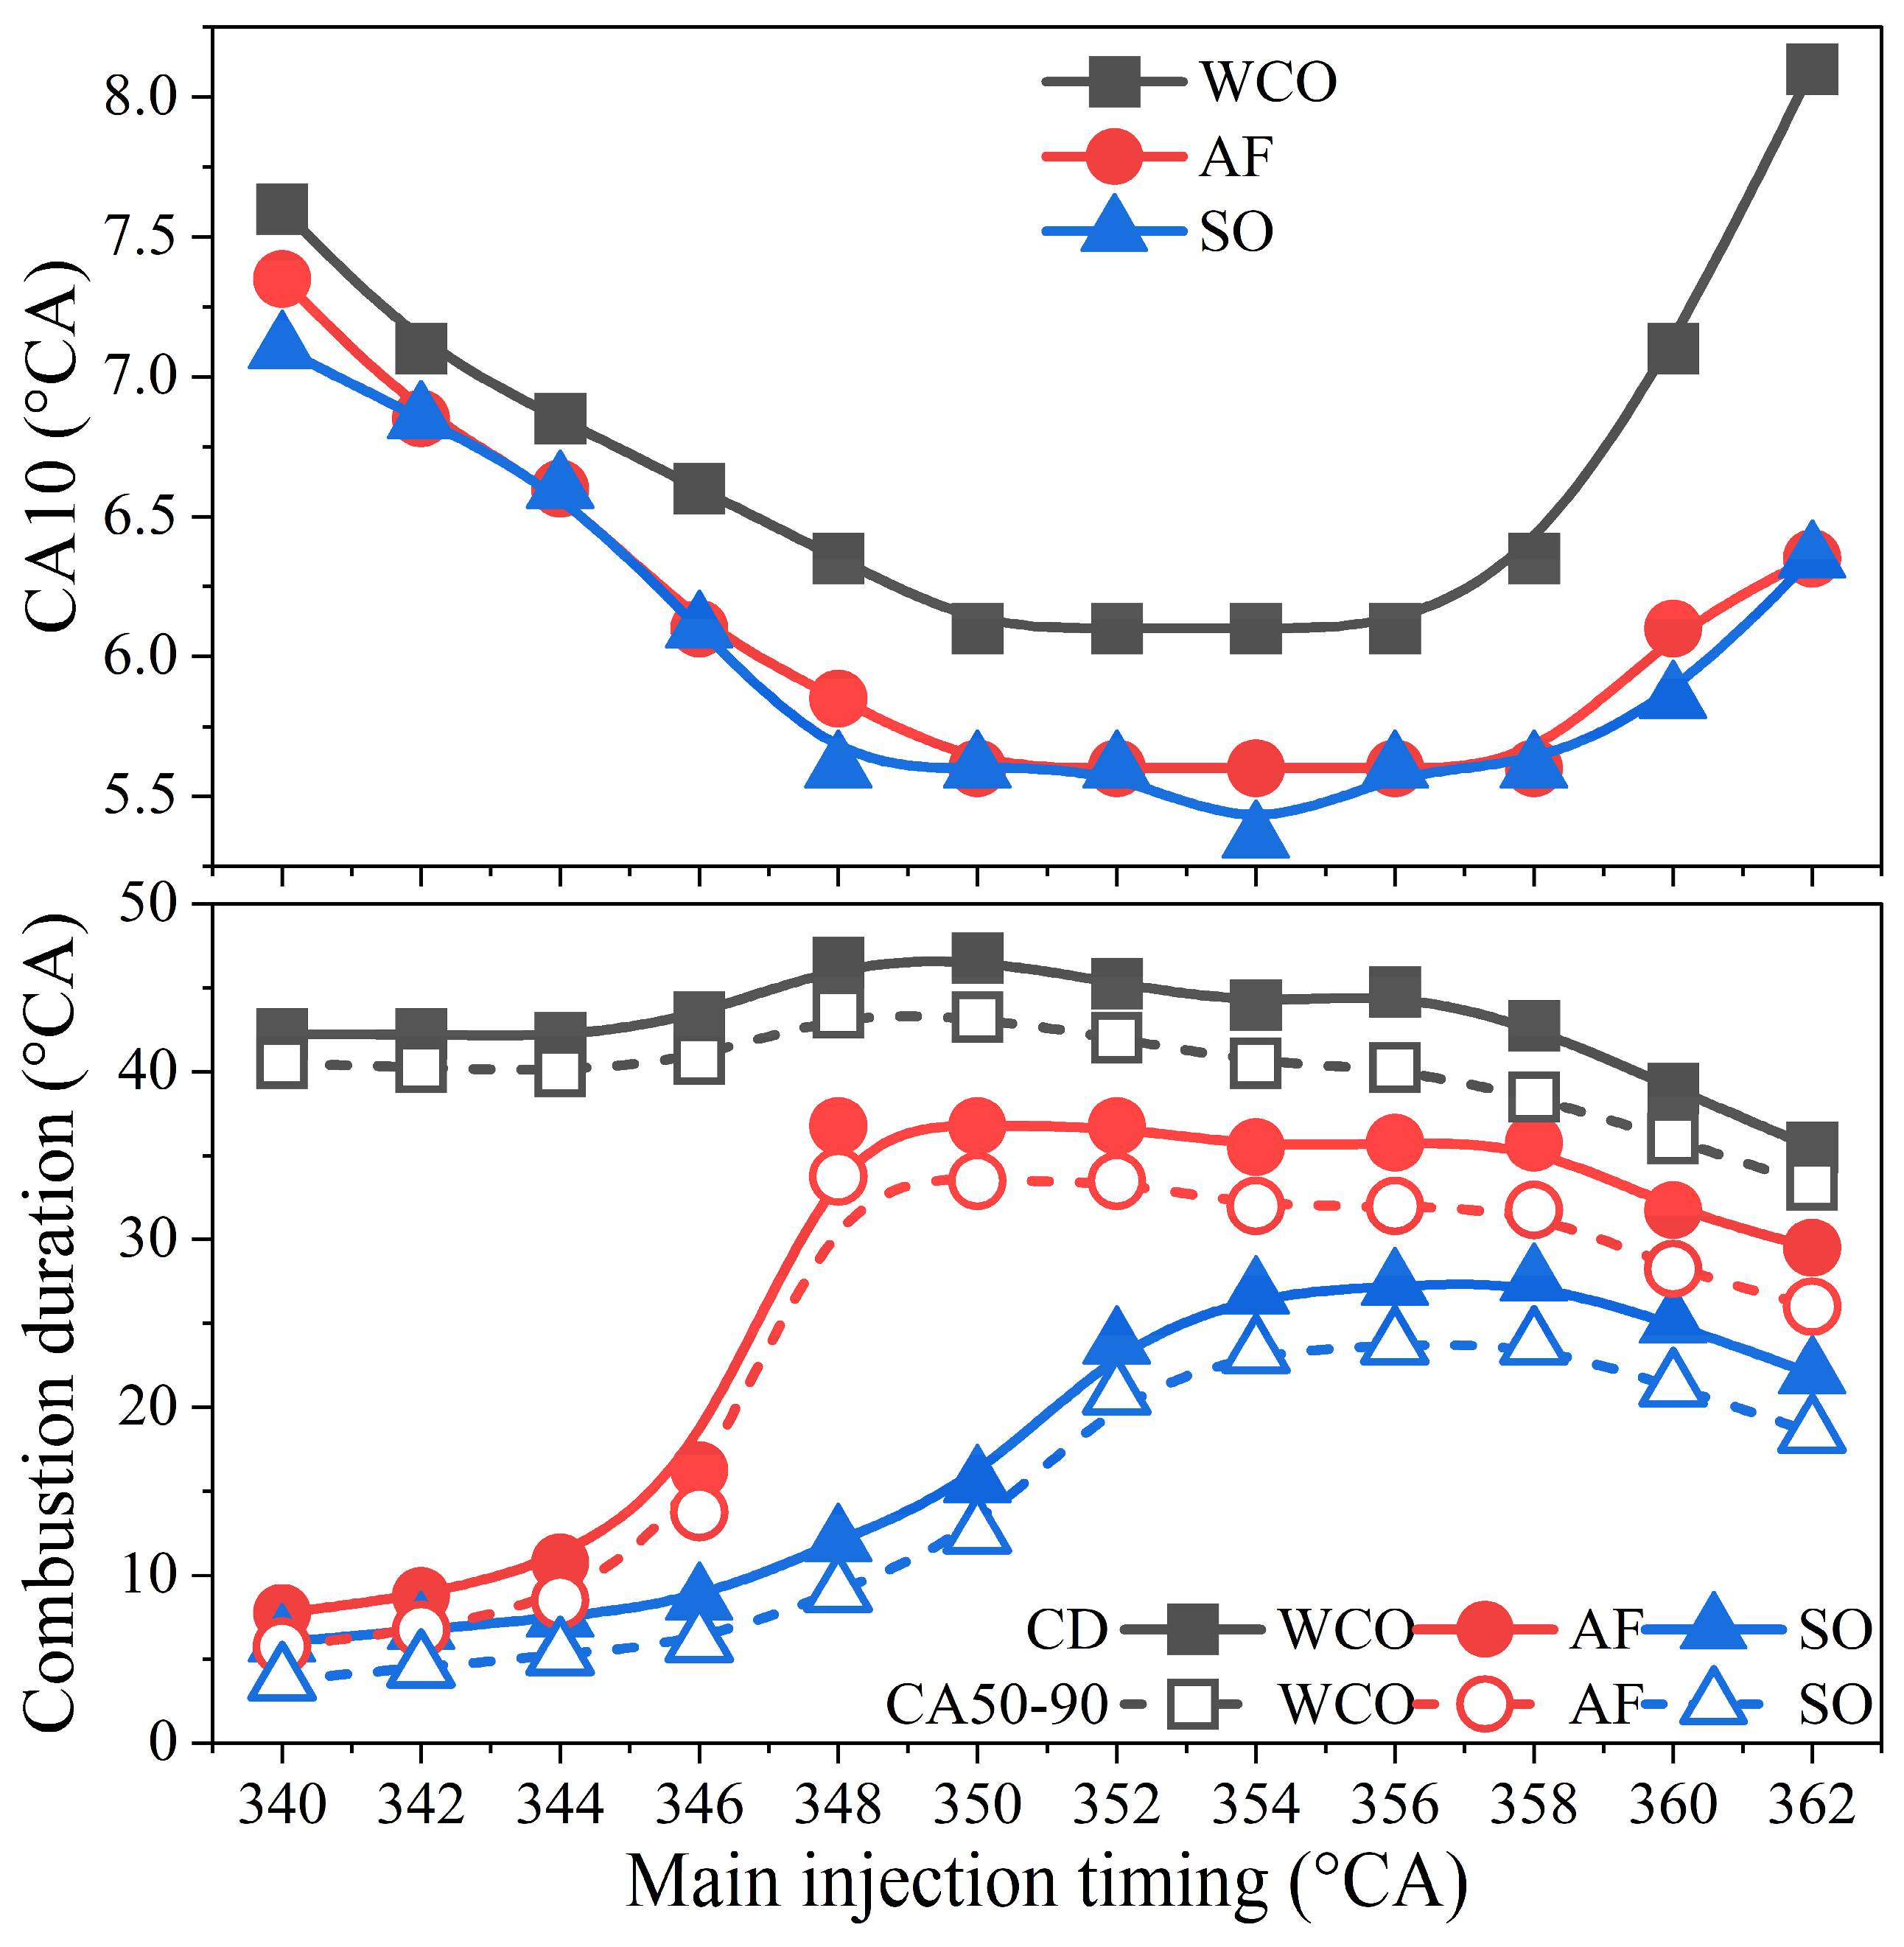
Figure 6 compares the CA10 and combustion duration of the biodiesels under a double injection strategy, with a pilot energy ratio of 5.6%. With the delay of the main injection timing, the CA10 shows a trend of first decreasing, then stabilizing, and finally increasing. The CA10 shortens as the main injection timing is retarded from 340 to 350 °CA. When the main injection timing is between 350 °CA and 358 °CA, the CA10 remains relatively unchanged, regardless of the feedstock from which the biodiesel is derived. A similar trend of nearly constant ignition delay was also observed under a relatively higher engine speed and load by Zhang et al. [34]. The CA10 then lengthens when the main injection timing is later than 358 °CA. Across all main injection timings, the SO and AF consistently exhibit shorter CA10 than WCO, while the difference between SO and AF is negligible.
Figure 6.
CA10 and combustion duration (CD) of different biodiesels under double (pilot energy ratio 5.6%) injection strategies.
The variation in combustion duration with the main injection timing is also presented in Figure 6, where the variation trend of combustion duration with respect to the main injection timing is opposite to that of CA10. It increases within 340–350 °CA as the main injection timing is retarded, remains relatively stable within 350–358 °CA, and decreases within 358–362 °CA. Notably, SO exhibits the shortest combustion duration, WCO the longest, and AF lies between the two. According to the CA50–90 duration (the interval from the start of the main injection to the crank angle at 50%/90% cumulative heat release of the entire pilot–main injection event), the primary difference in combustion duration among the three biodiesels originates from the CA50–90 interval. WCO exhibits a longer post-combustion stage, resulting in a longer overall combustion duration, even if its main injection timing is within the range of 340–346 °CA.
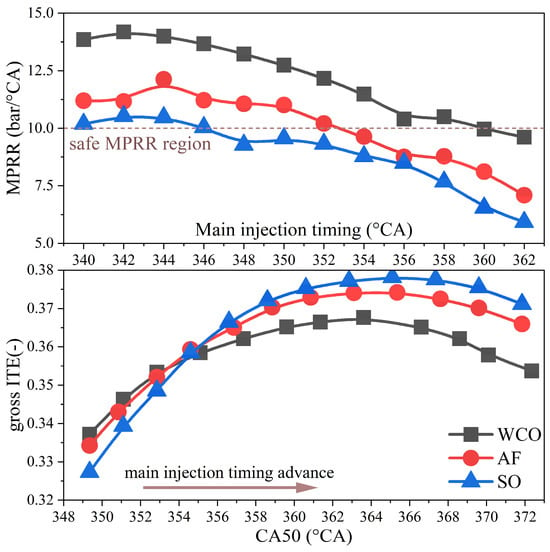
Figure 7 shows the maximum pressure rise rate (MPRR) of the biodiesels derived from different feedstocks, with the limit set at 10 bar/°CA. A lower MPRR improves the engine stability and mitigates the combustion noise. Among the three biodiesel samples, SO biodiesel exhibits a more gradual heat release, resulting in a lower MPRR, whereas WCO biodiesel undergoes more intense combustion, leading to a higher MPRR. An earlier main injection timing promotes the formation of a more homogeneous mixture, while rapid combustion leads to a higher MPRR, which is also a major challenge in PPCI and HCCI modes achieved by earlier injection. For the SO, AF, and WCO biodiesels, the main injection timings at which the MPRR falls within the commonly accepted safe MPRR region are 348, 354, and 360 °CA, respectively. This manifests that the SO biodiesel offers better operational stability, as it remains within the safe PRR region over a wider injection timing range.
Figure 7.
Combustion intensity and energy performance of different biodiesels under double (pilot energy ratio 5.6%) injection strategies.
Figure 7 also plots the gross indicated thermal efficiency (ITE) as a function of the CA50. The variation in gross ITE with main injection timing can be divided into two stages, where Stage 1 spans 340–346 °CA, and Stage 2 spans 346–362 °CA. In Stage 1, the CA50 values of all three biodiesels occur before 355 °CA, and gross ITE ranges from 0.32 to 0.36. Among the three biodiesels, the WCO biodiesel exhibits the highest gross ITE in Stage 1. This may be attributed to its higher volatility, which may mitigate incomplete combustion associated with spray–wall impingement. In Stage 2, intense in-cylinder thermodynamic conditions enhance the fuel evaporation; in this regime, the SO biodiesel with favorable ignitability exhibits a higher gross ITE, whereas the WCO biodiesel shows the lowest gross ITE. Retarding the main injection timing progressively shifts the heat release closer to top dead center (TDC), reducing negative work during compression and thereby increasing the net indicated work and gross ITE. For WCO, AF, and SO, the peak gross ITE values are 0.36764, 0.37417, and 0.37811, respectively, occurring at CA50 values of 363.60, 365.35, and 365.10 °CA. In addition, SO shows a wider high gross ITE region; the corresponding main injection timing and CA50 ranges are 354–358 °CA and 363–368 °CA, respectively. In general, under the pilot–main injection strategy with a pilot energy ratio of 5.6%, the SO biodiesel offers favorable operational stability while maintaining high gross ITE.
3.1.2. The Influence of Pilot Energy Ratio
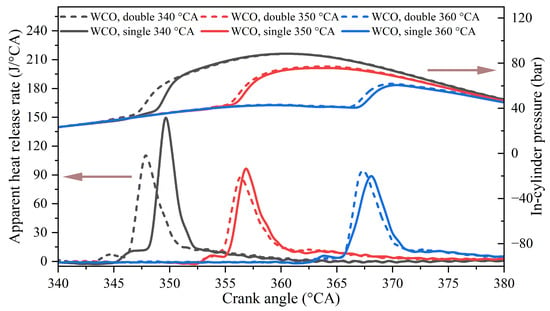
Figure 8 compares the ICP and AHRR of WCO biodiesel under a single or double injection strategy (with a pilot energy ratio of 5.6%), with the main injection timing at 340, 350, and 360 °CA. Here, the “double 340 °CA” has the same meaning as in Figure 5. As the injection timing is advanced, the peak AHRR increases in both single and double injection cases, which can be attributed to a shift toward PPCI enabled by the formation of a more homogeneous combustible mixture in the cylinder. However, the AHRR peak in the double injection case is lower than that in the single injection case. This is because the pilot injection promotes mixture stratification, which helps to mitigate the heat-release intensity [34]. Furthermore, at a main injection timing of 340 °CA, both strategies exhibit a dual-peak AHRR pattern. However, as the injection timing is retarded, the double injection AHRR transitions from a dual-peak pattern to a single-peak pattern, whereas the single injection case continues to exhibit a dual-peak pattern. Therefore, the first AHRR peak cannot be attributed to heat release caused by the pilot injection; instead, it may originate from the low-temperature chemistry of WCO biodiesel. Under retarded main injection timing, the transition from a dual-peak to a single-peak pattern in the double injection strategy suggests a strong influence from the pilot injection. The thermochemical environment produced by the pilot injection may cause the main injection fuel to bypass the low-temperature chemistry and proceed directly to the negative temperature coefficient (NTC) regime or high-temperature ignition.
Figure 8.
In-cylinder pressure and apparent heat release rate of WCO biodiesel under single and double (pilot energy ratio 5.6%) injection strategies.
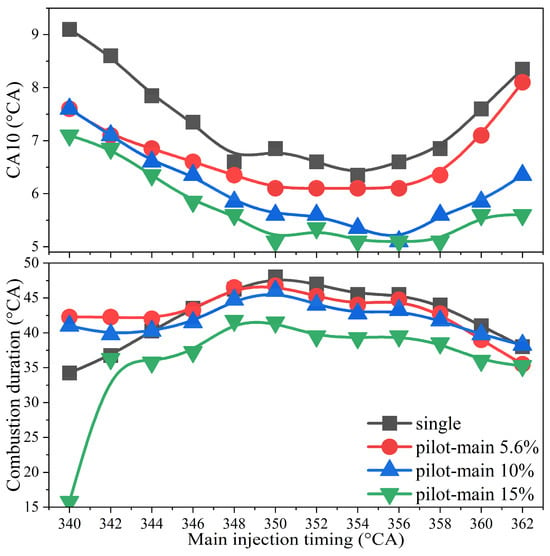
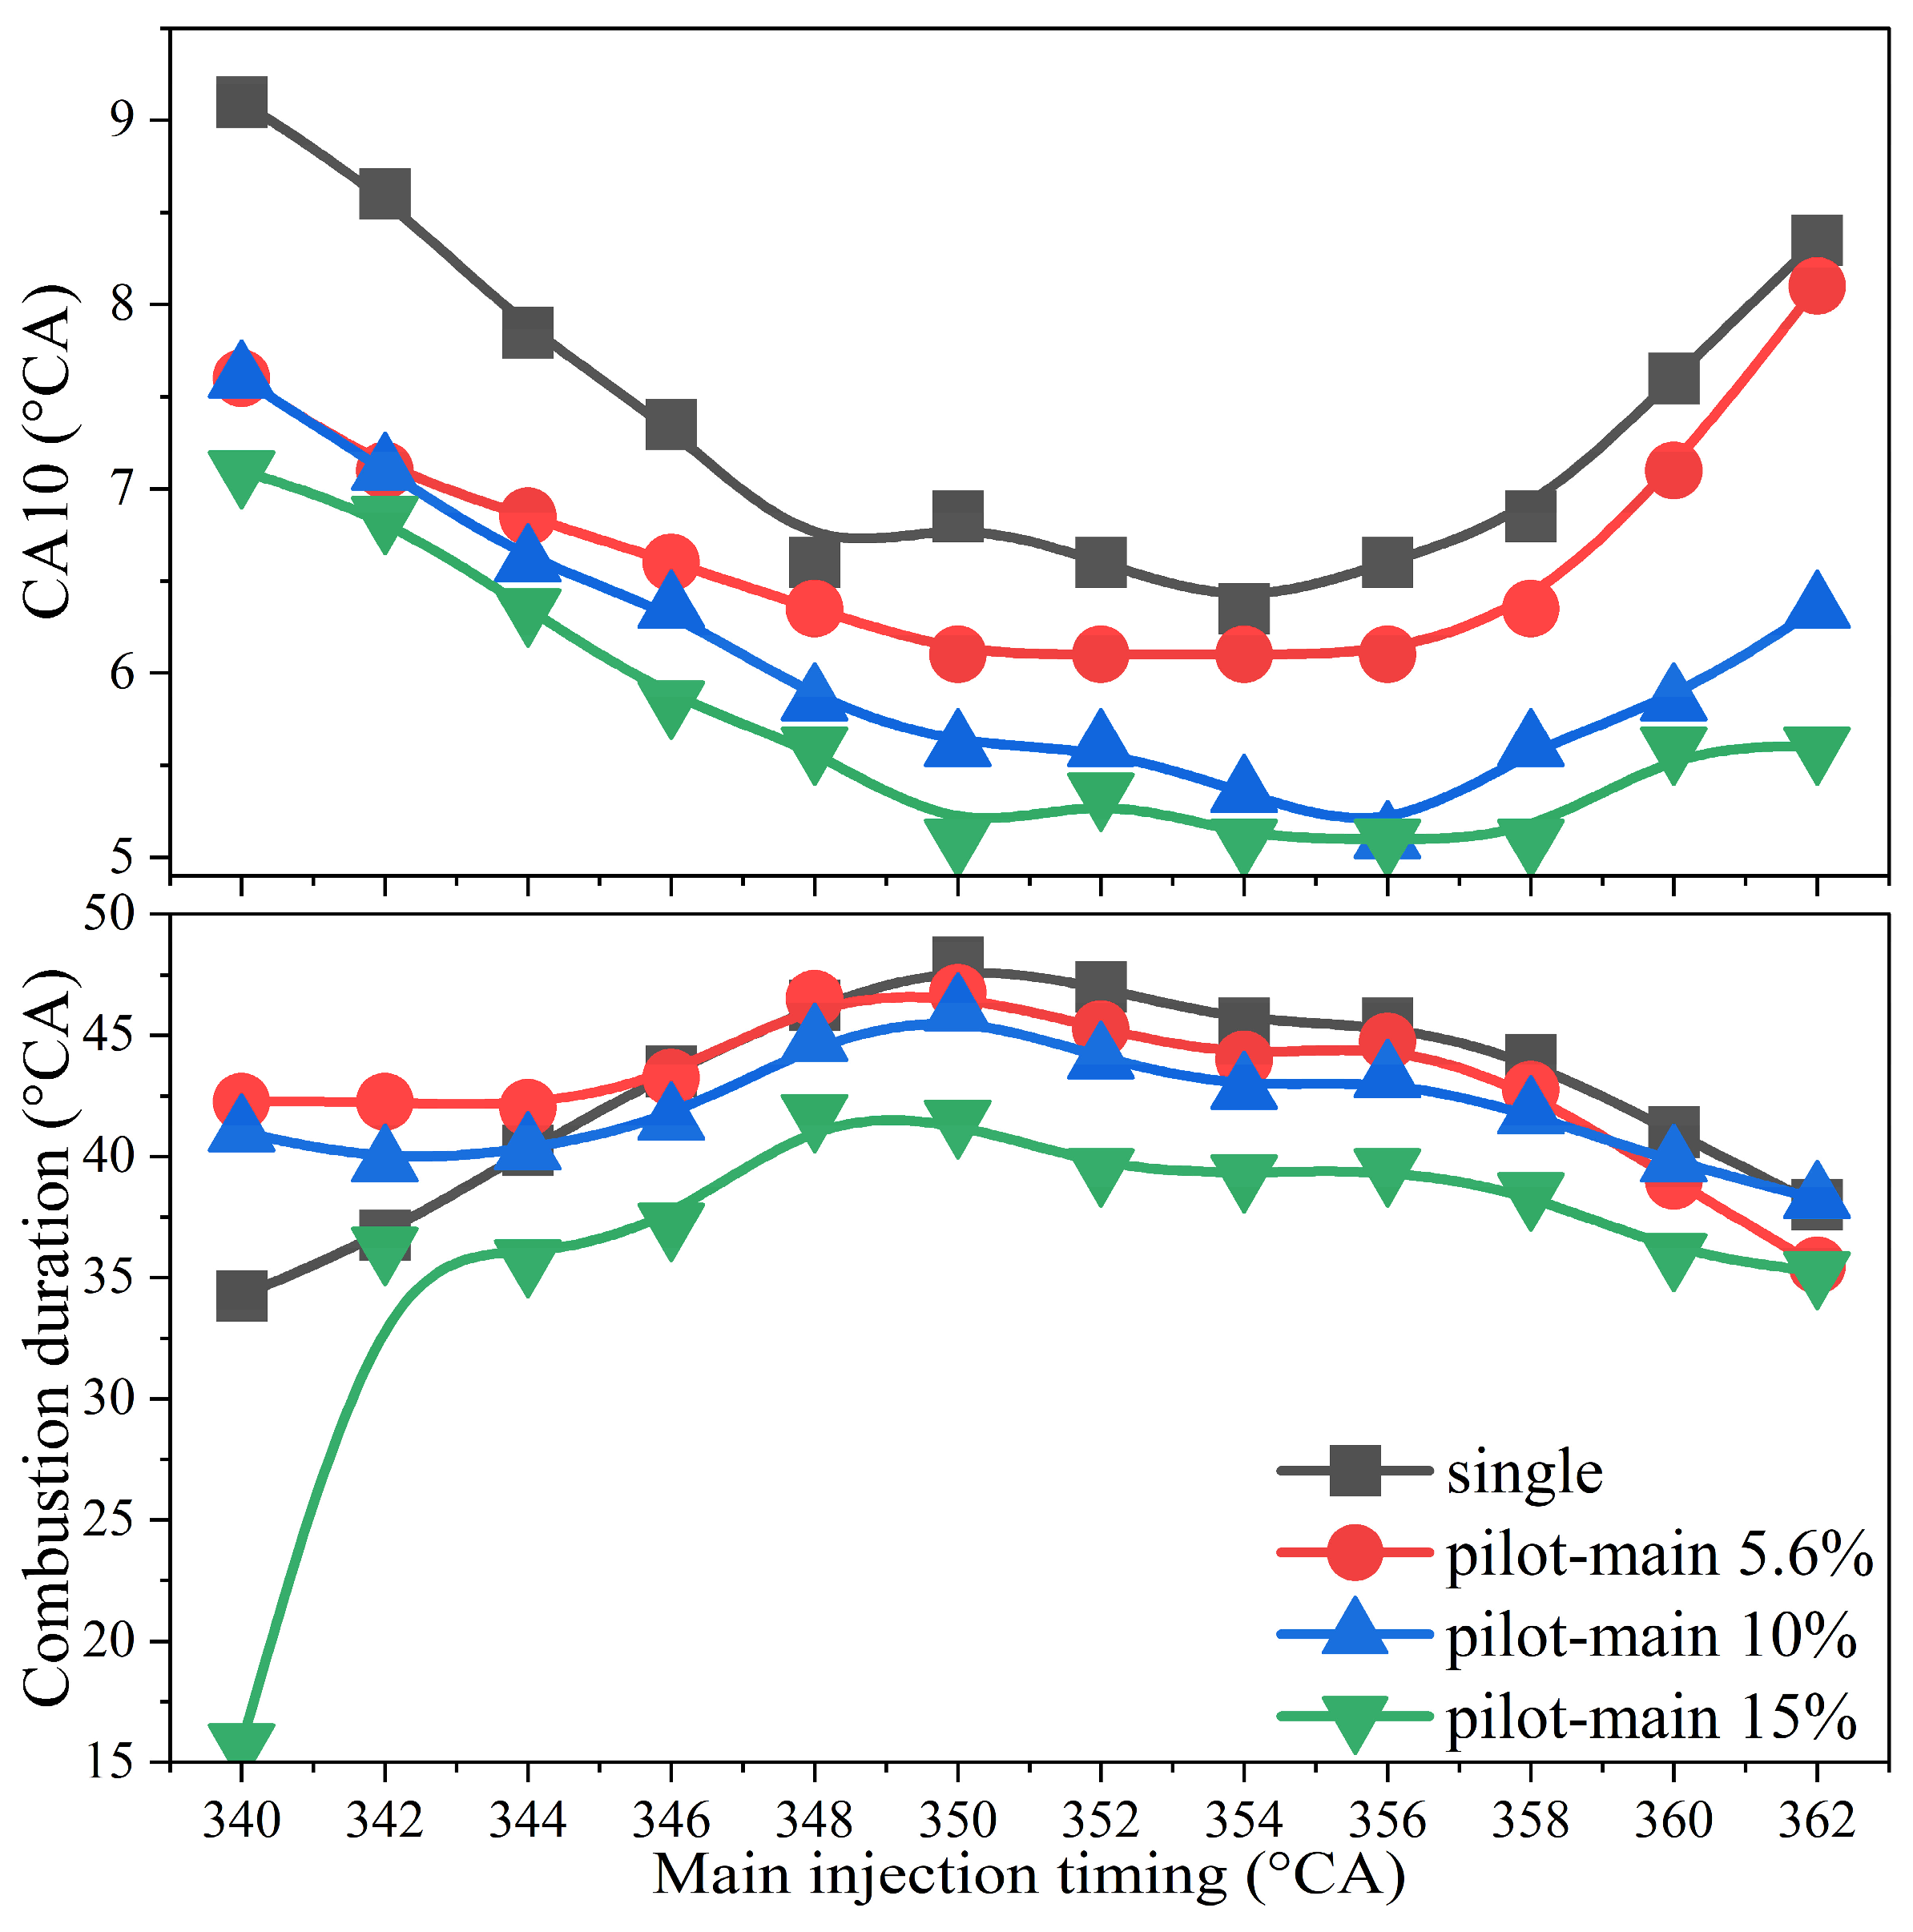
Figure 9 illustrates the CA10 and combustion duration of WCO biodiesel under single and double injection strategies. Changes in the injection strategy and pilot energy ratio do not alter the overall trend of CA10 with injection timing. A quasi-stable CA10 window is still observed over 350–358 °CA. However, the injection strategy and pilot energy ratio significantly affect the CA10 level. Compared with a single injection, the double injection strategy reduces CA10, and increasing the pilot energy ratio further reduces CA10. This can be explained by the CA10 definition used here: CA10 is defined as the interval between the start of the main injection and the crank angle at which the cumulative heat release of the entire pilot–main injection event reaches 10%. In this context, CA10 reflects the combined influence of the pilot and main combustion processes. Accordingly, adopting double injection and increasing the pilot energy ratio can advance the overall combustion phasing.
Figure 9.
CA10 and combustion duration (CD) of WCO biodiesel under single and double injection strategies.
Generally, pilot injection promotes mixture stratification and provides an early heat-release event that increases the overall burn rate. As a result, combustion duration under double injection tends to be shorter. Notably, over 340–344 °CA, the effect of the pilot energy ratio exhibits a different trend. In this range, low (5.6%) and medium (10%) pilot energy ratios tend to prolong the combustion duration, whereas a high pilot energy ratio (15%) tends to shorten it. In particular, at 340 °CA, the combustion duration at a pilot energy ratio of 15% is only 14.25 °CA, which is approximately 60% shorter than in the single injection.
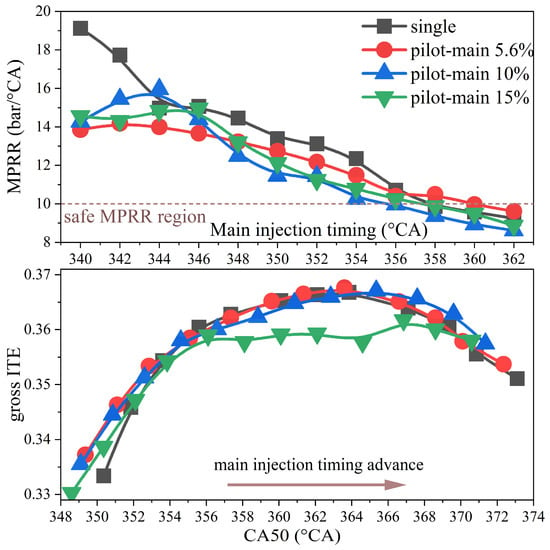
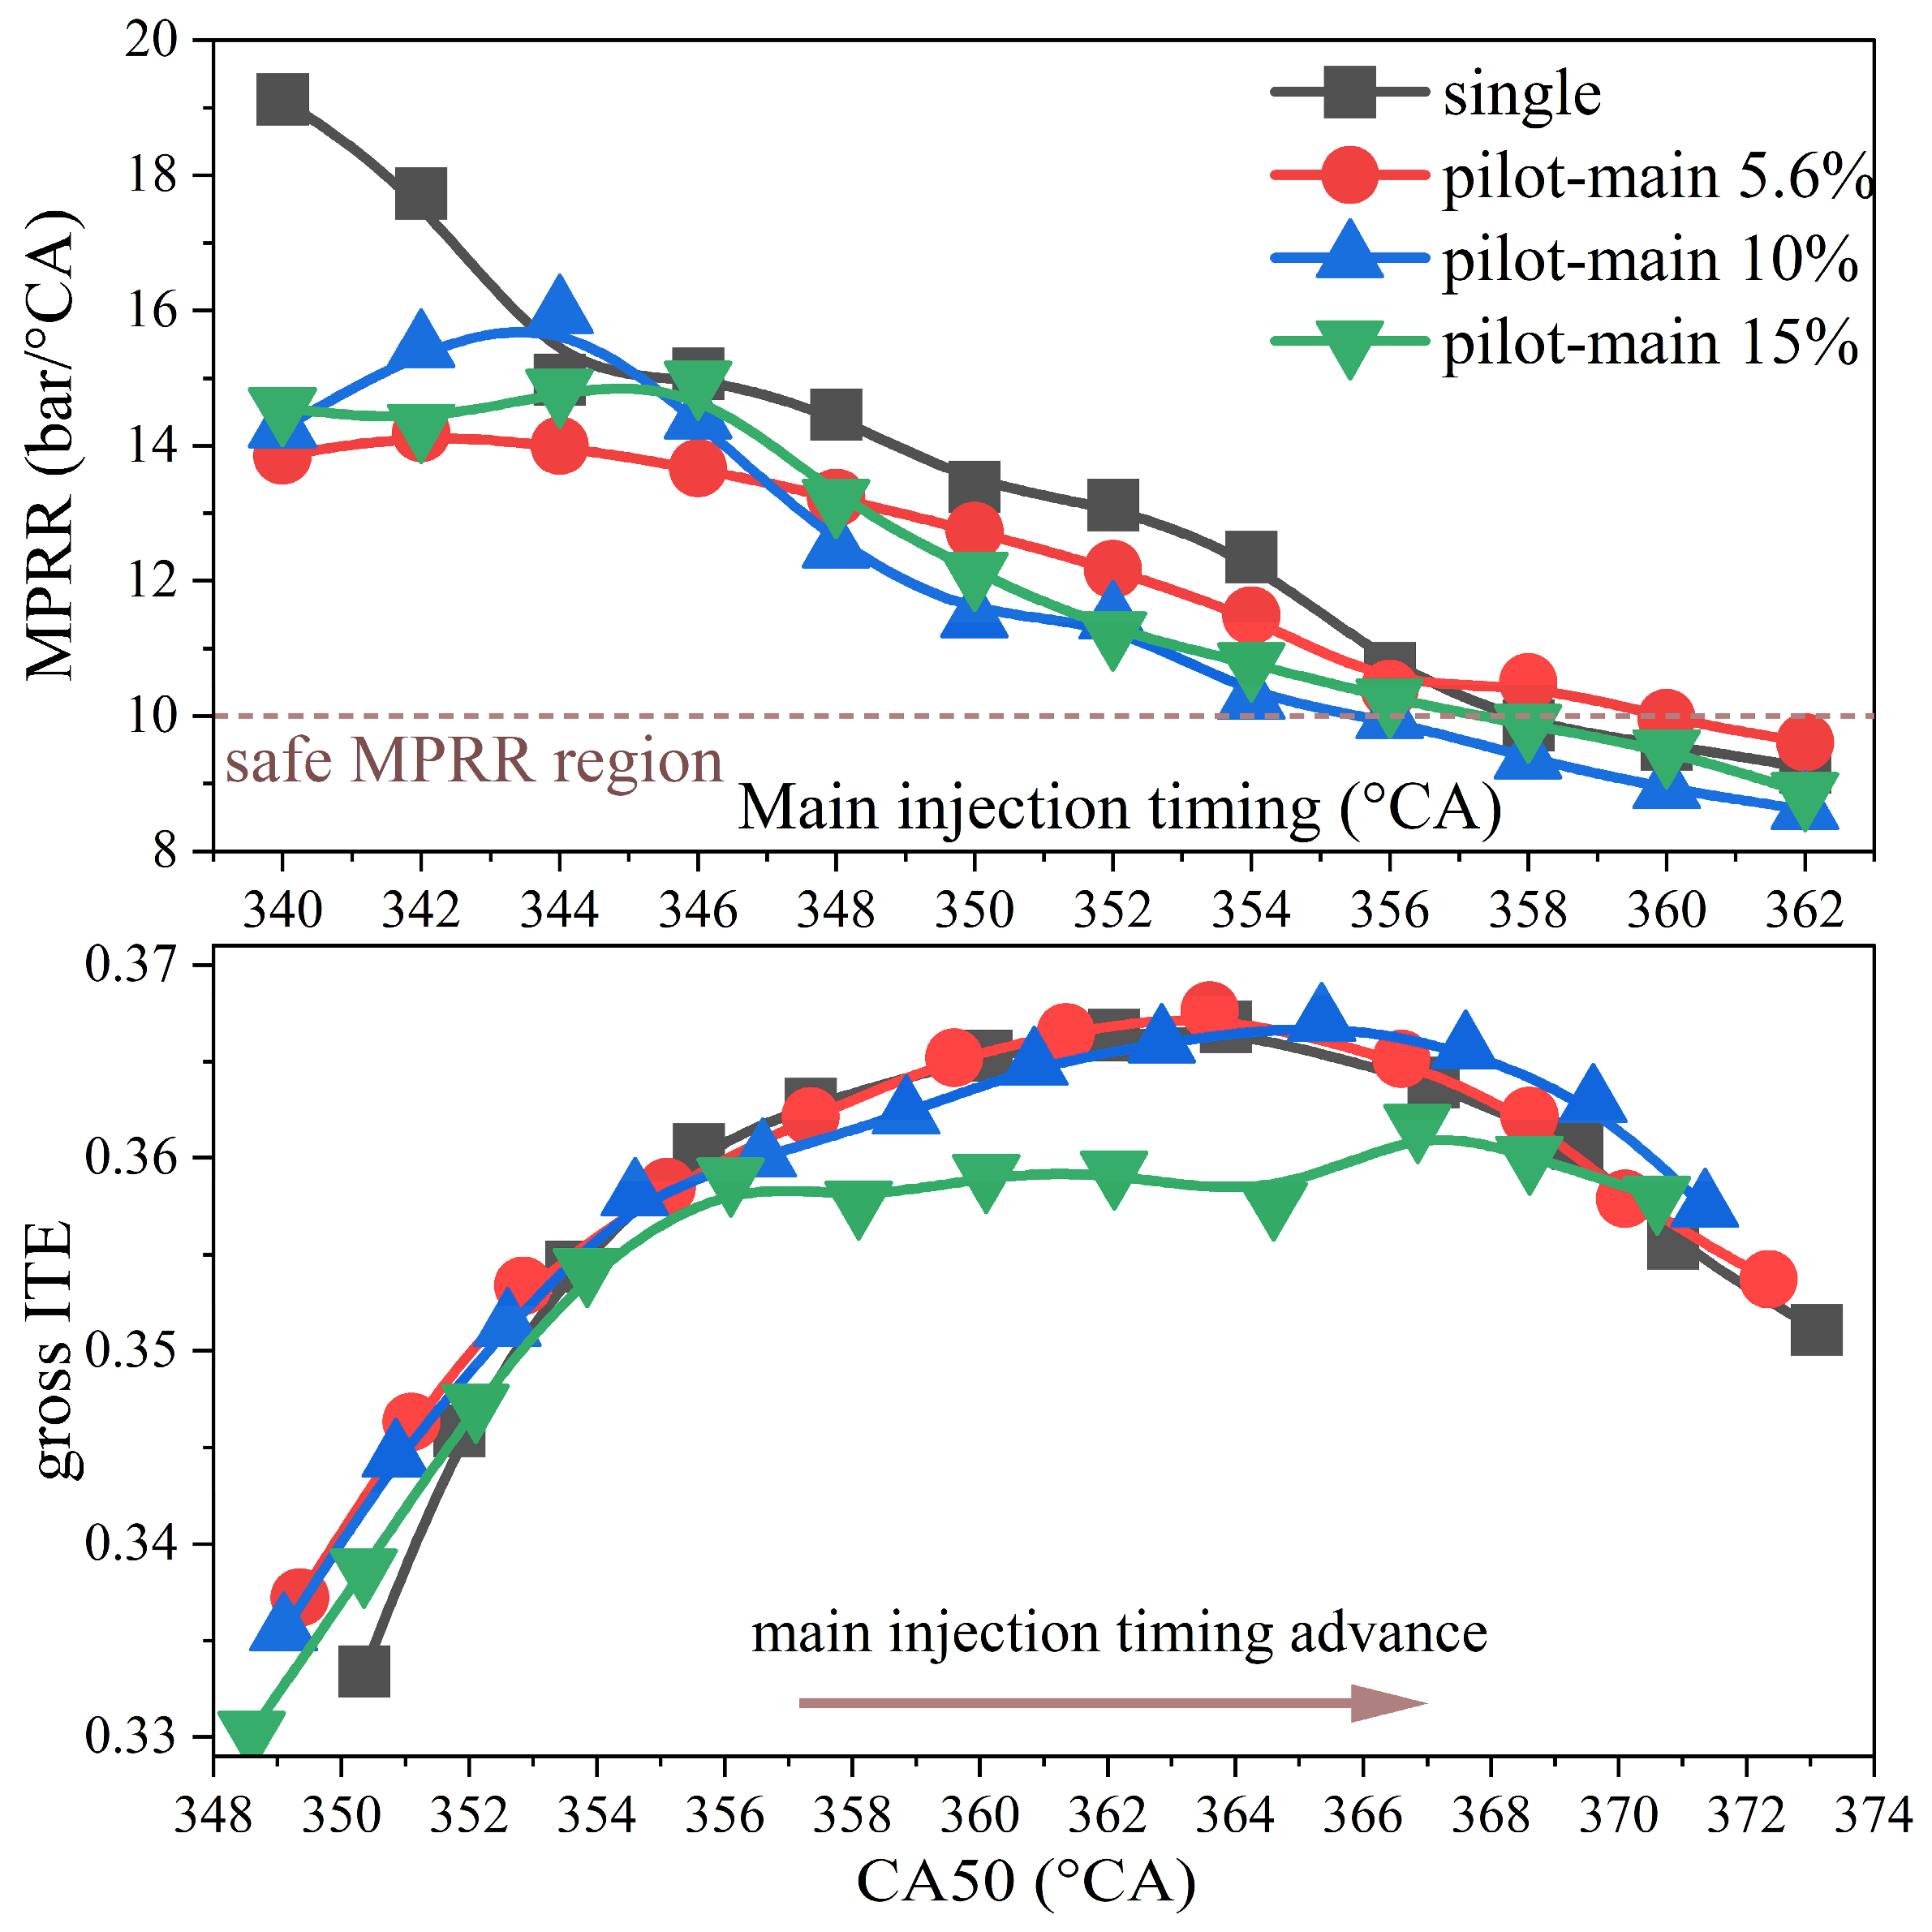
Figure 10 displays the MPRR and gross ITE of WCO biodiesel under single and double injection strategies. In terms of MPRR, the effect of the injection strategy is less significant than that of the biodiesel composition observed in Figure 7. Overall, the MPRR decreases as the injection timing is retarded, and the double injection strategy slightly further reduces the MPRR. Interestingly, the effect of the pilot energy ratio on MPRR is nonlinear, and MPRR varies with the injection timing in a non-monotonic manner. At advanced injection timings, the 10% pilot energy ratio yields the highest MPRR. As the injection timing is further retarded after 346 °CA, the 5.6% pilot energy ratio produces the highest MPRR. The 15% pilot energy ratio consistently falls between the other two cases.
Figure 10.
Combustion intensity and energy performance of WCO biodiesel under single and double injection strategies.
For gross ITE, combustion phasing is a key factor. As noted earlier, adopting a double injection and increasing the pilot energy ratio tend to advance the combustion phasing. Thus, relative to a single injection, the double injection curves shift toward earlier CA50, particularly at a 15% pilot energy ratio. However, overly advanced combustion phasing appears to be unfavorable for heat-to-work conversion. When the injection timing is retarded beyond 358 °CA, the gross ITE at a 15% pilot energy ratio exceeds that of the single injection case. For the 5.6% and 10% pilot energy ratios, this crossover occurs at 350 °CA and 354 °CA, respectively. Interestingly, although the highest gross ITE remains nearly unchanged, the CA50 corresponding to the peak shifts to a later crank angle under double injection. For the single injection case and the double injection cases with pilot energy ratios of 5.6%, 10%, and 15%, the peak gross ITE values are 0.36679, 0.36764, 0.36707, and 0.36172, respectively. The corresponding CA50 is 363.85 °CA (injection timing 354 °CA), 363.6 °CA (injection timing 354 °CA), 365.35 °CA (injection timing 356 °CA), and 366.85 °CA (injection timing 358 °CA). Furthermore, the higher gross ITE injection timing window delays are from 350 to 354 °CA in the single injection case to 352–356 °CA, 354–358 °CA, and 356–360 °CA for double injection, with pilot energy ratios of 5.6%, 10%, and 15%, respectively.
In general, for WCO, double injection advances combustion phasing, and the increasing pilot energy ratio further magnifies this phenomenon. Thus, to reach the high gross ITE operation, retarded main injection timing is necessary for double injection.
3.2. Effects of Single and Pilot–Main Injection Strategies on Emission Profiles for Biodiesels Derived from Different Feedstocks
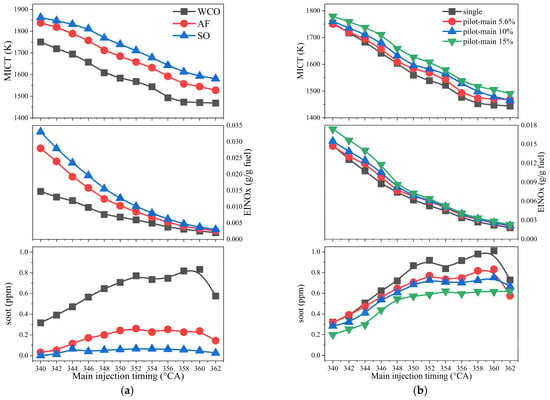
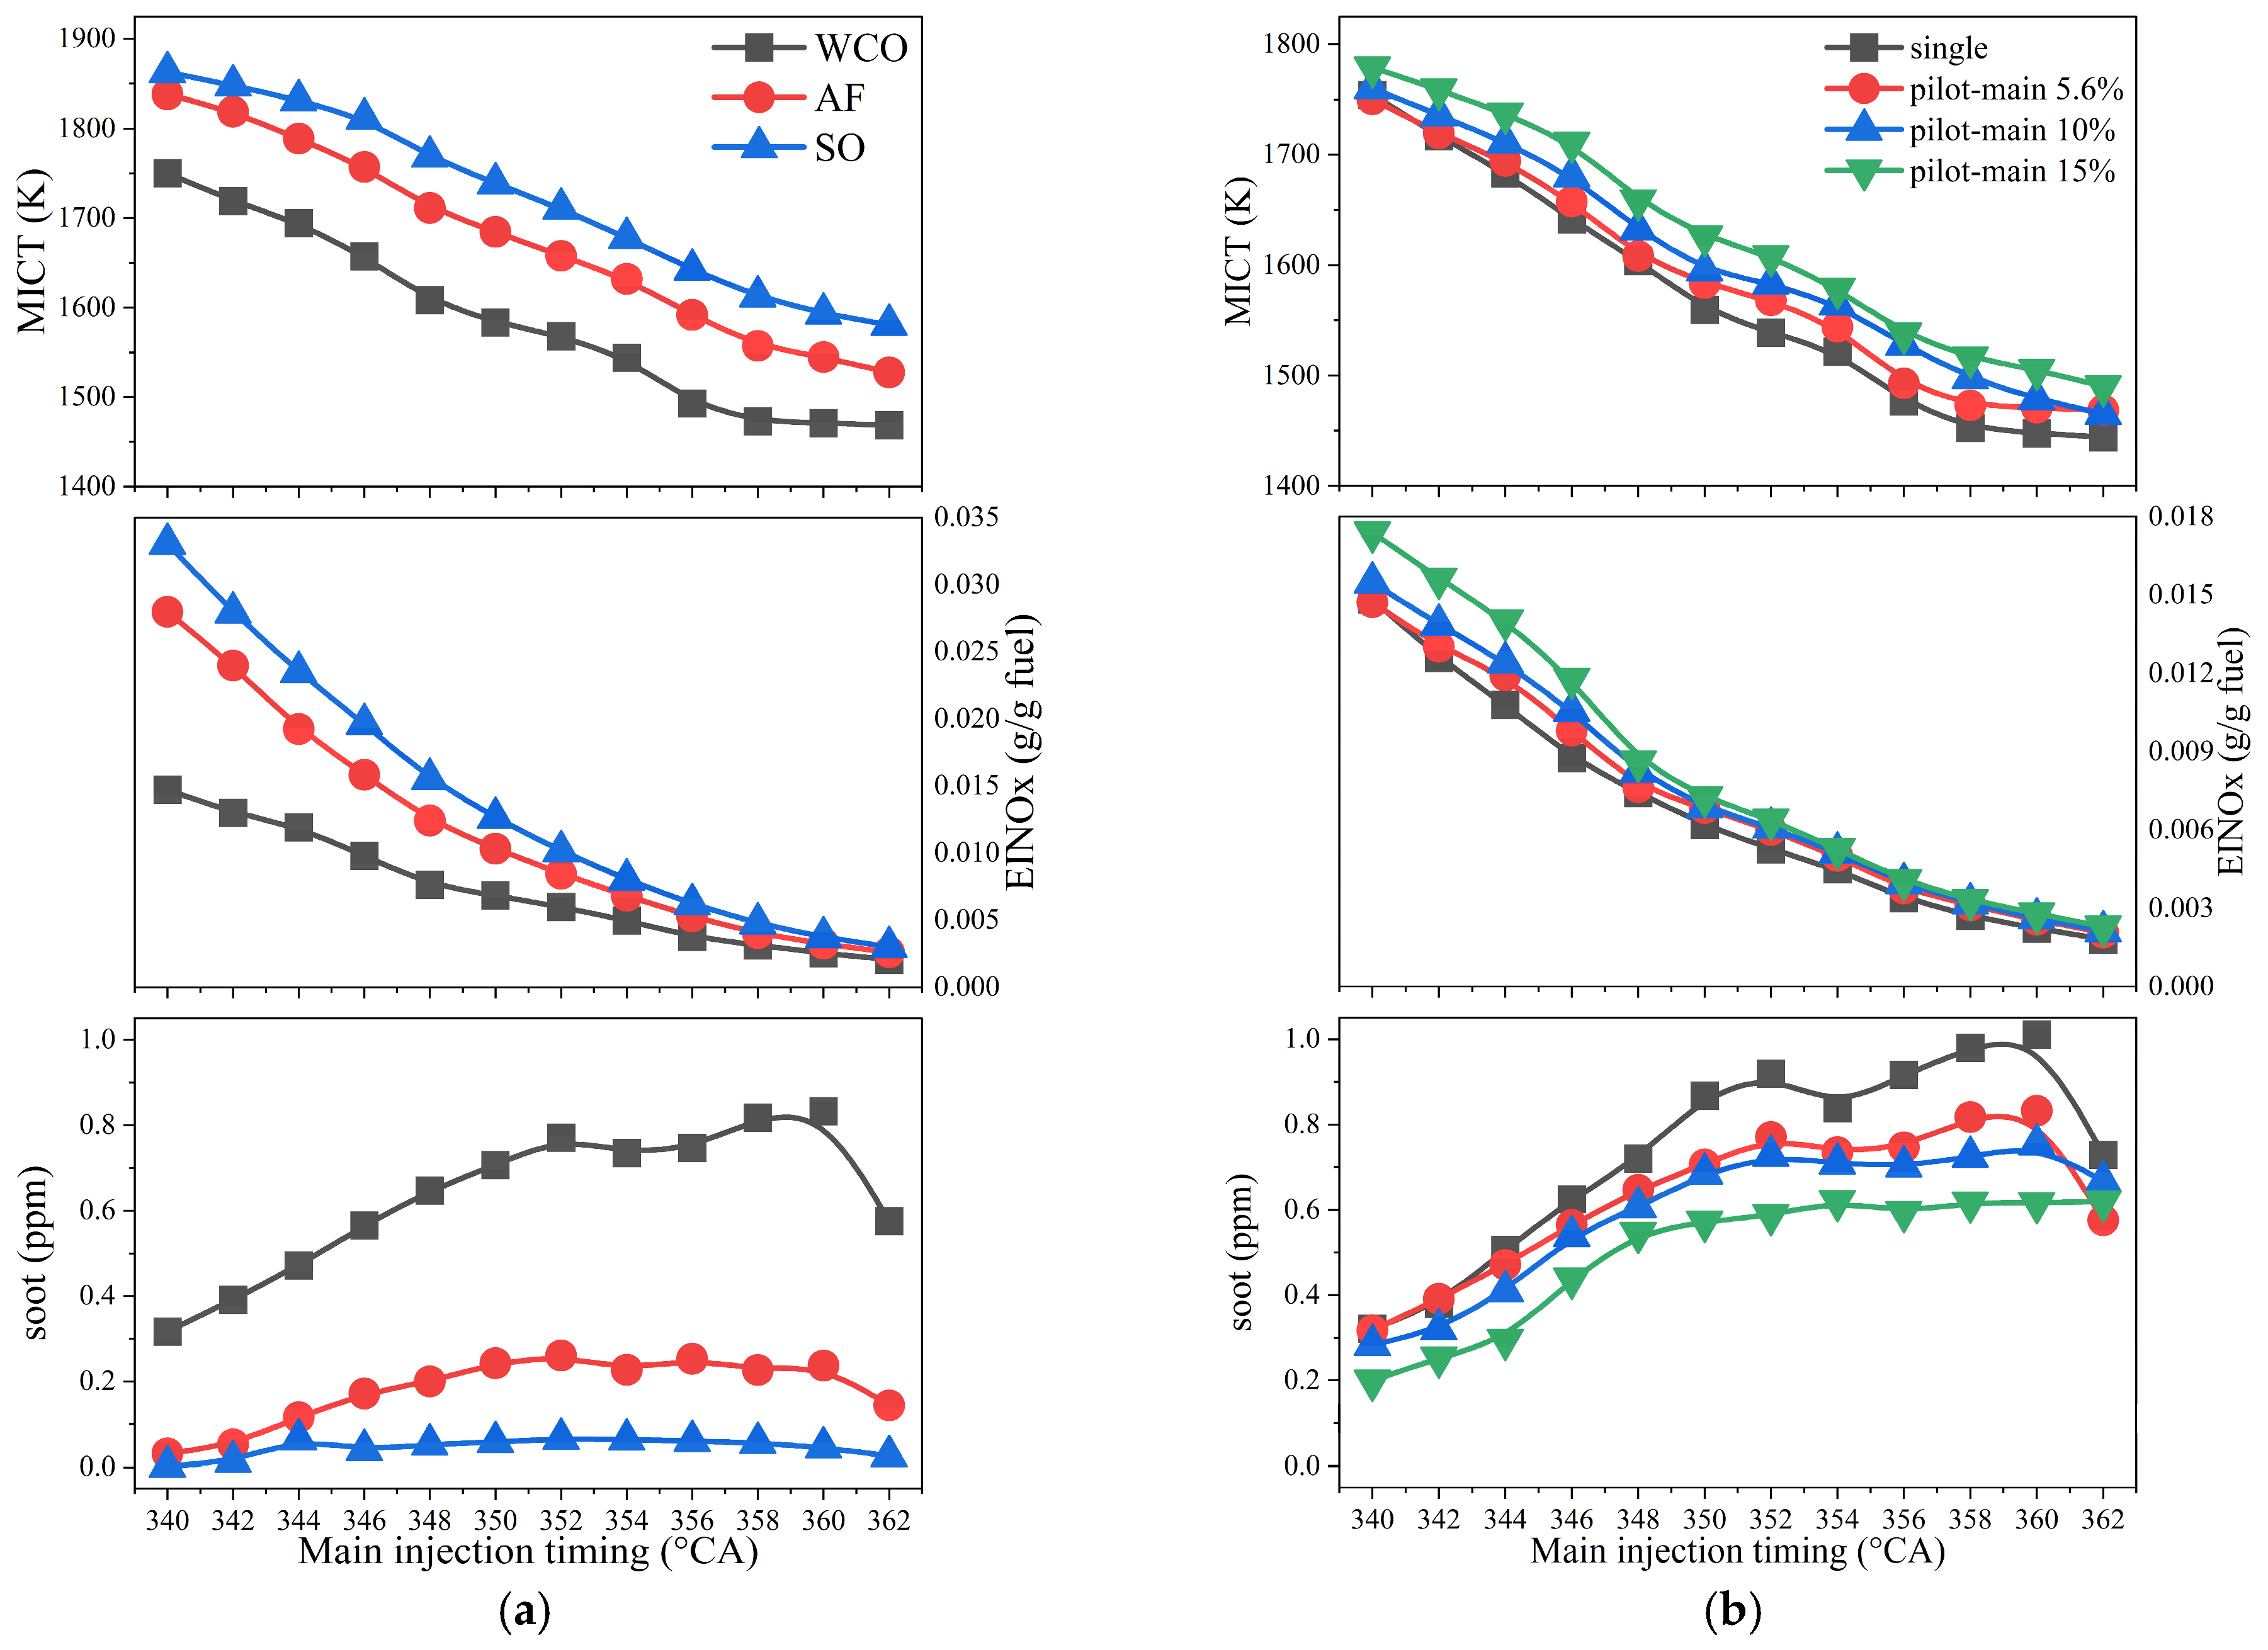
Figure 11 presents the maximum in-cylinder temperature (MICT), the emissions index of nitrogen oxides (EINOx), and soot emissions for different biodiesels under a pilot–main injection strategy with a pilot energy ratio of 5.6%. It also compares WCO biodiesel under single and double injection strategies. The MICT is defined as the maximum density-averaged temperature in the combustion chamber, which typically occurs near the end of the main combustion stage. Within the injection timing range investigated, MICT decreases as the injection timing is retarded. Both the biodiesel composition and injection strategy affect the MICT. Specifically, the MICT follows the order SO > AF > WCO. Moreover, introducing double injection increases the MICT, and this increase becomes more pronounced as the pilot energy ratio increases. In this study, cases with a higher MICT generally correspond to shorter combustion durations. In general, a shorter combustion duration leads to a more concentrated heat release and a higher degree of constant volume heat release, thereby increasing the in-cylinder temperature.
Figure 11.
Maximum in-cylinder temperature and emissions of (a) different biodiesels under double (pilot energy ratio 5.6%) injection strategies, and (b) WCO biodiesel under single and double injection strategies.
In diesel engines, nitrogen oxides (NOx) are primarily formed in high-temperature and oxygen-rich regions. The higher the combustion temperature and the more advanced the combustion phasing (i.e., the longer the high-temperature duration), the more NOx is produced. Accordingly, EINOx decreases as the injection timing is retarded. In addition, increasing the pilot energy ratio results in higher NOx emissions, which is consistent with the study of Choi et al. [16]. Regarding soot, higher in-cylinder temperatures promote lower soot emissions. This is because soot oxidation requires high-temperature, oxygen-rich conditions [31]. Therefore, higher in-cylinder temperatures can promote the oxidation of soot formed early in combustion. Thus, SO biodiesel with higher MICT produces substantially lower soot emissions than WCO, with near-zero soot under the conditions studied. Moreover, although double injection can reduce soot emissions, the reduction is less pronounced than that achieved by optimizing biodiesel FAME composition.
Nevertheless, neither tailoring the biodiesel composition nor introducing the pilot–main injection strategy can fully eliminate the soot–NOx trade-off. Therefore, a promising approach to alleviate the soot–NOx trade-off is to identify an optimal temperature window that reduces emissions without sacrificing the thermal efficiency.
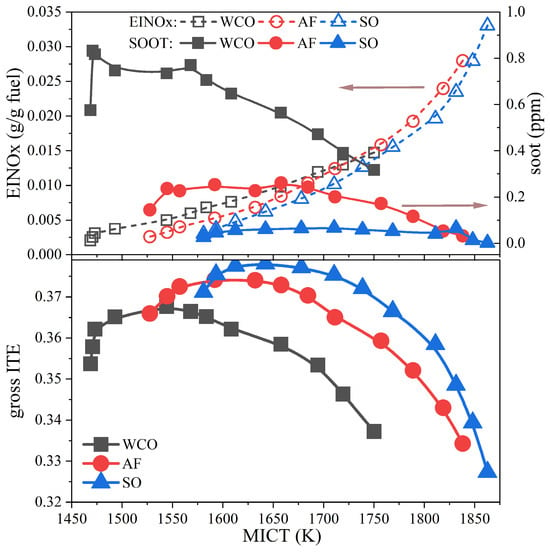
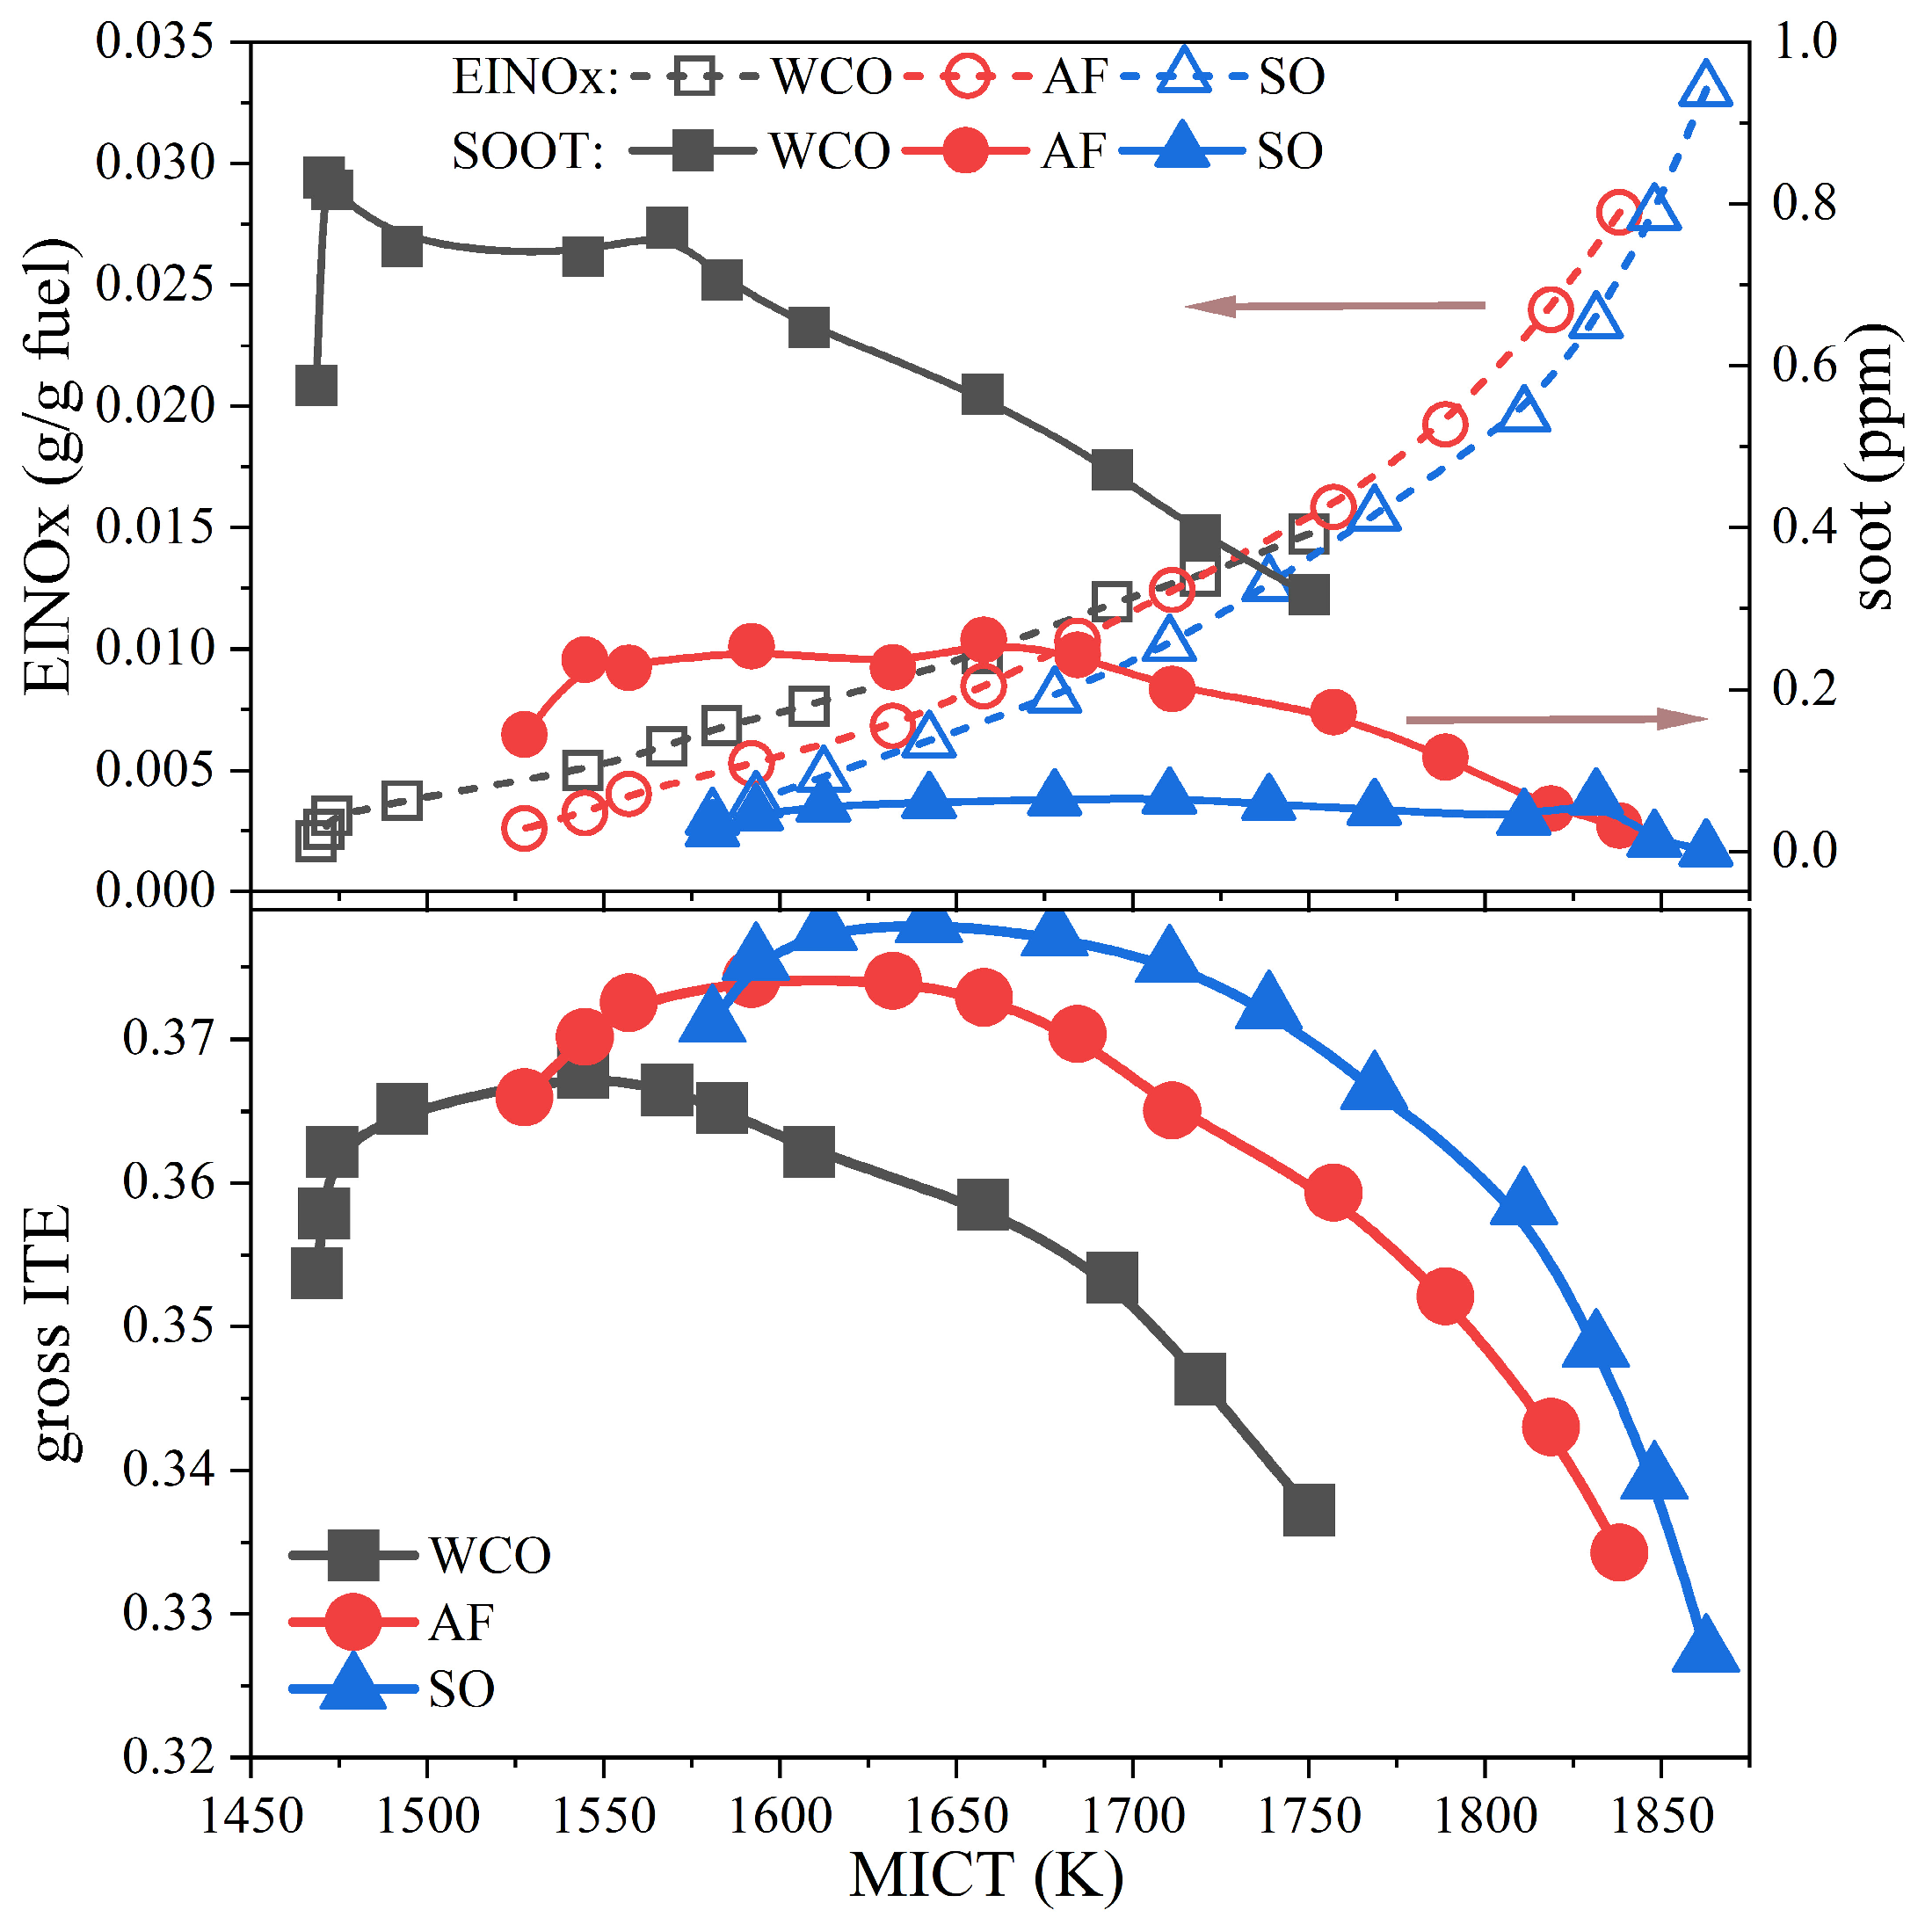
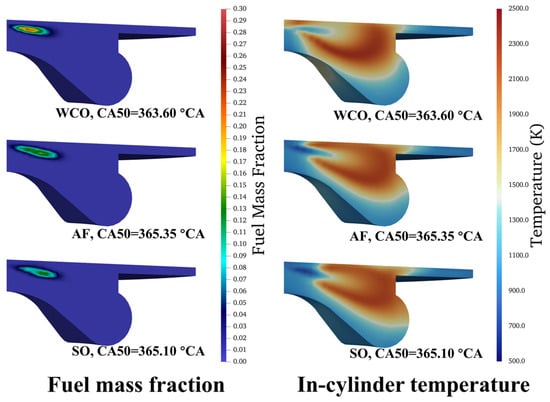
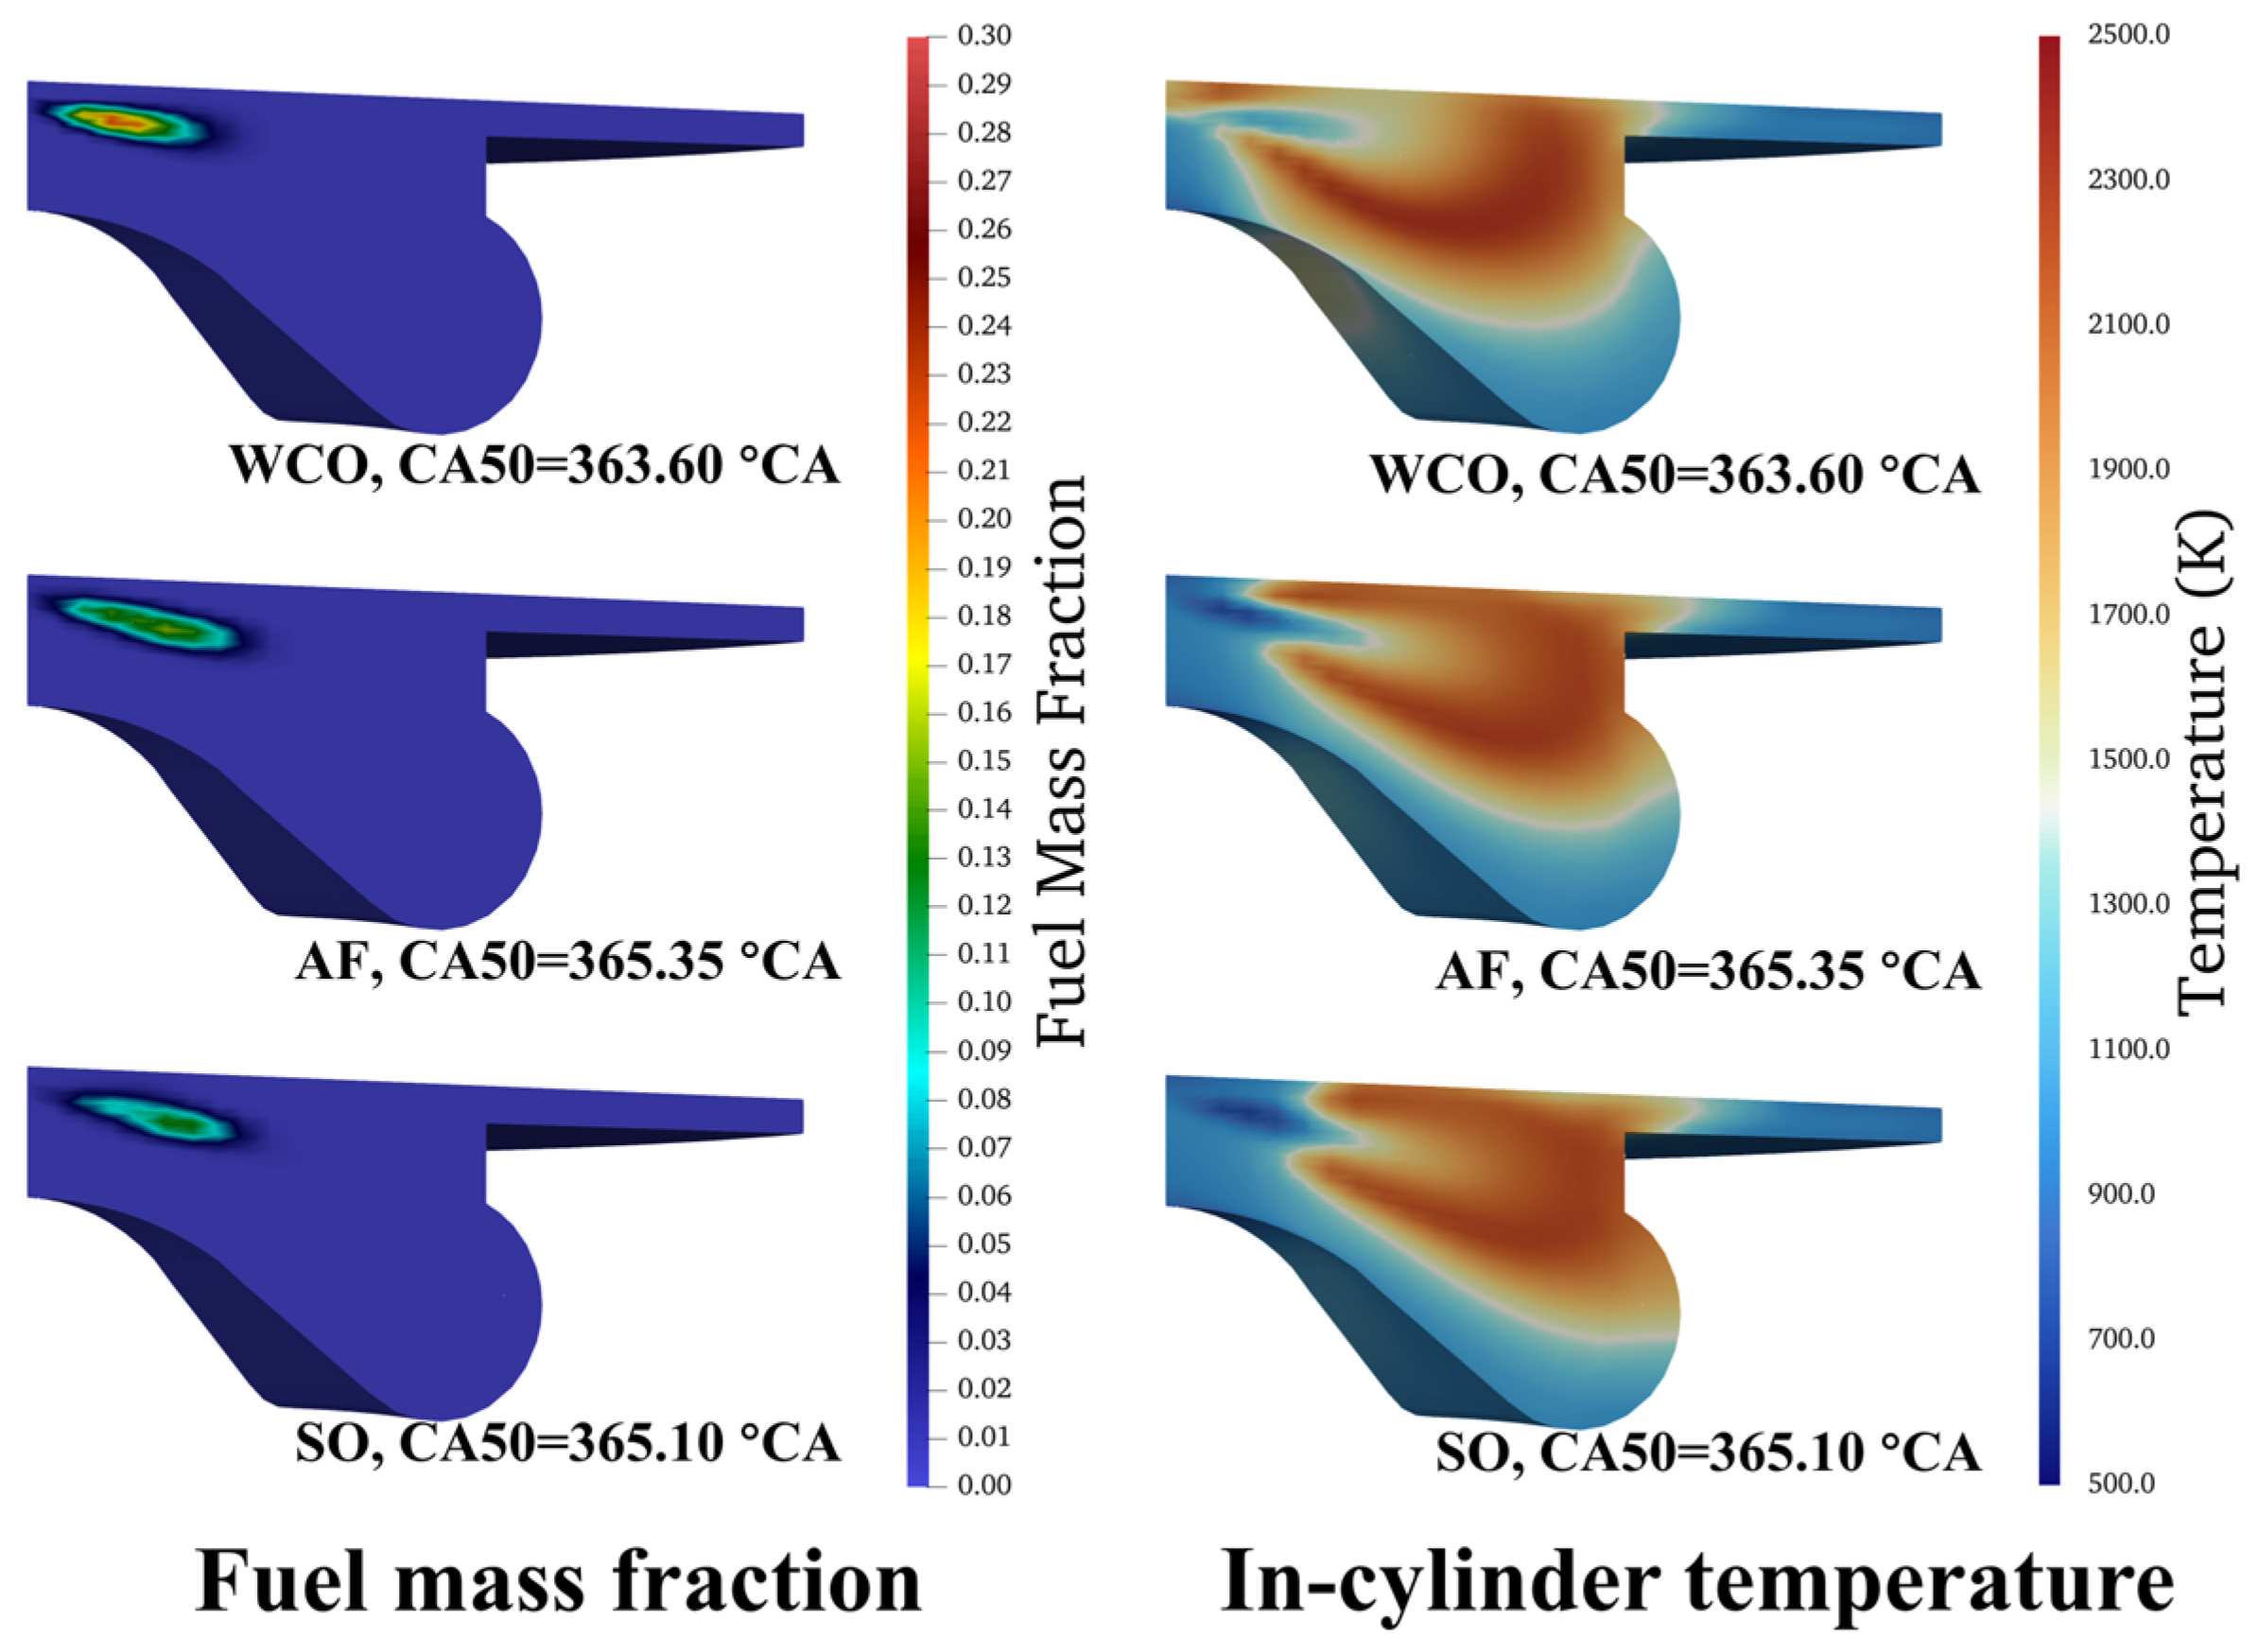
Given that, Figure 12 plots the EINOx, soot, and gross ITE as functions of MICT of the WCO, AF, and SO biodiesels under the pilot–main injection strategy with a pilot energy ratio of 5.6%. As MICT increases, EINOx increases while soot decreases, demonstrating the typical NOx–soot trade-off in diesel engines. EINOx correlates strongly with the temperature and shows no pronounced differences across biodiesel feedstocks. Notably, at the same MICT, SO biodiesel produces slightly lower NOx, which is different from the trend at a given injection timing. However, at a given MICT, soot emissions still vary significantly among the biodiesels, especially in the lower MICT range. This phenomenon indicates that in addition to MICT, soot is also sensitive to the local fuel vapor distribution and spray–flame structure. Figure 13 compares the fuel mass fraction and in-cylinder temperature of biodiesels at their respective CA50 timing under the highest gross ITE condition with double (pilot energy ratio 5.6%) injection strategies. The contours reveal distinct spray-flame structures among the three biodiesels. For SO, the high-temperature reaction zone remains relatively downstream of the fuel vapor region, indicating a conventional mixing-controlled combustion mode. AF shows an intermediate behavior, with the reaction zone extending closer to the nozzle and a slightly more concentrated near-nozzle fuel-rich region. In contrast, WCO has a richer vapor core, while the high-temperature reaction zone wraps around it, indicating a higher soot tendency [35].
Figure 12.
EINOx, soot, and gross ITE of WCO, AF, and SO biodiesels as a function of MICT under double (pilot energy ratio 5.6%) injection strategies.
Figure 13.
Comparison of fuel mass fraction and in-cylinder temperature of CA50 timing for different biodiesels under maximum gross ITE conditions with double (pilot energy ratio 5.6%) injection strategies.
Meanwhile, the gross ITE shows a non-monotonic trend with MICT, increasing first and then decreasing, which indicates the existence of a favorable temperature window that balances efficiency and emissions. As shown in Figure 12, high soot appears in the low-MICT range, whereas high NOx appears in the high-MICT range; both ranges are associated with lower gross ITE. Therefore, the optimal compromise is expected to lie in an intermediate MICT window near the high gross ITE region. In addition, the biodiesel composition affects the range of this trade-off window, as well as the emissions. Specifically, the intermediate-MICT window and the associated emissions differ substantially among the biodiesels. Among them, SO biodiesel shows the most favorable trade-off, achieving a balanced performance within an MICT range of 1590–1680 K (at main injection timings of 354–360 °CA).
3.3. Comparison of the Maximum Gross ITE Conditions Under Single and Pilot–Main Injection Strategies for Biodiesels Derived from Different Feedstocks
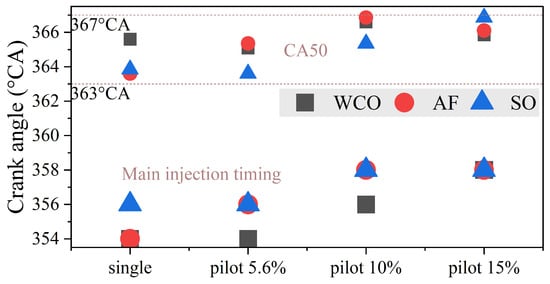
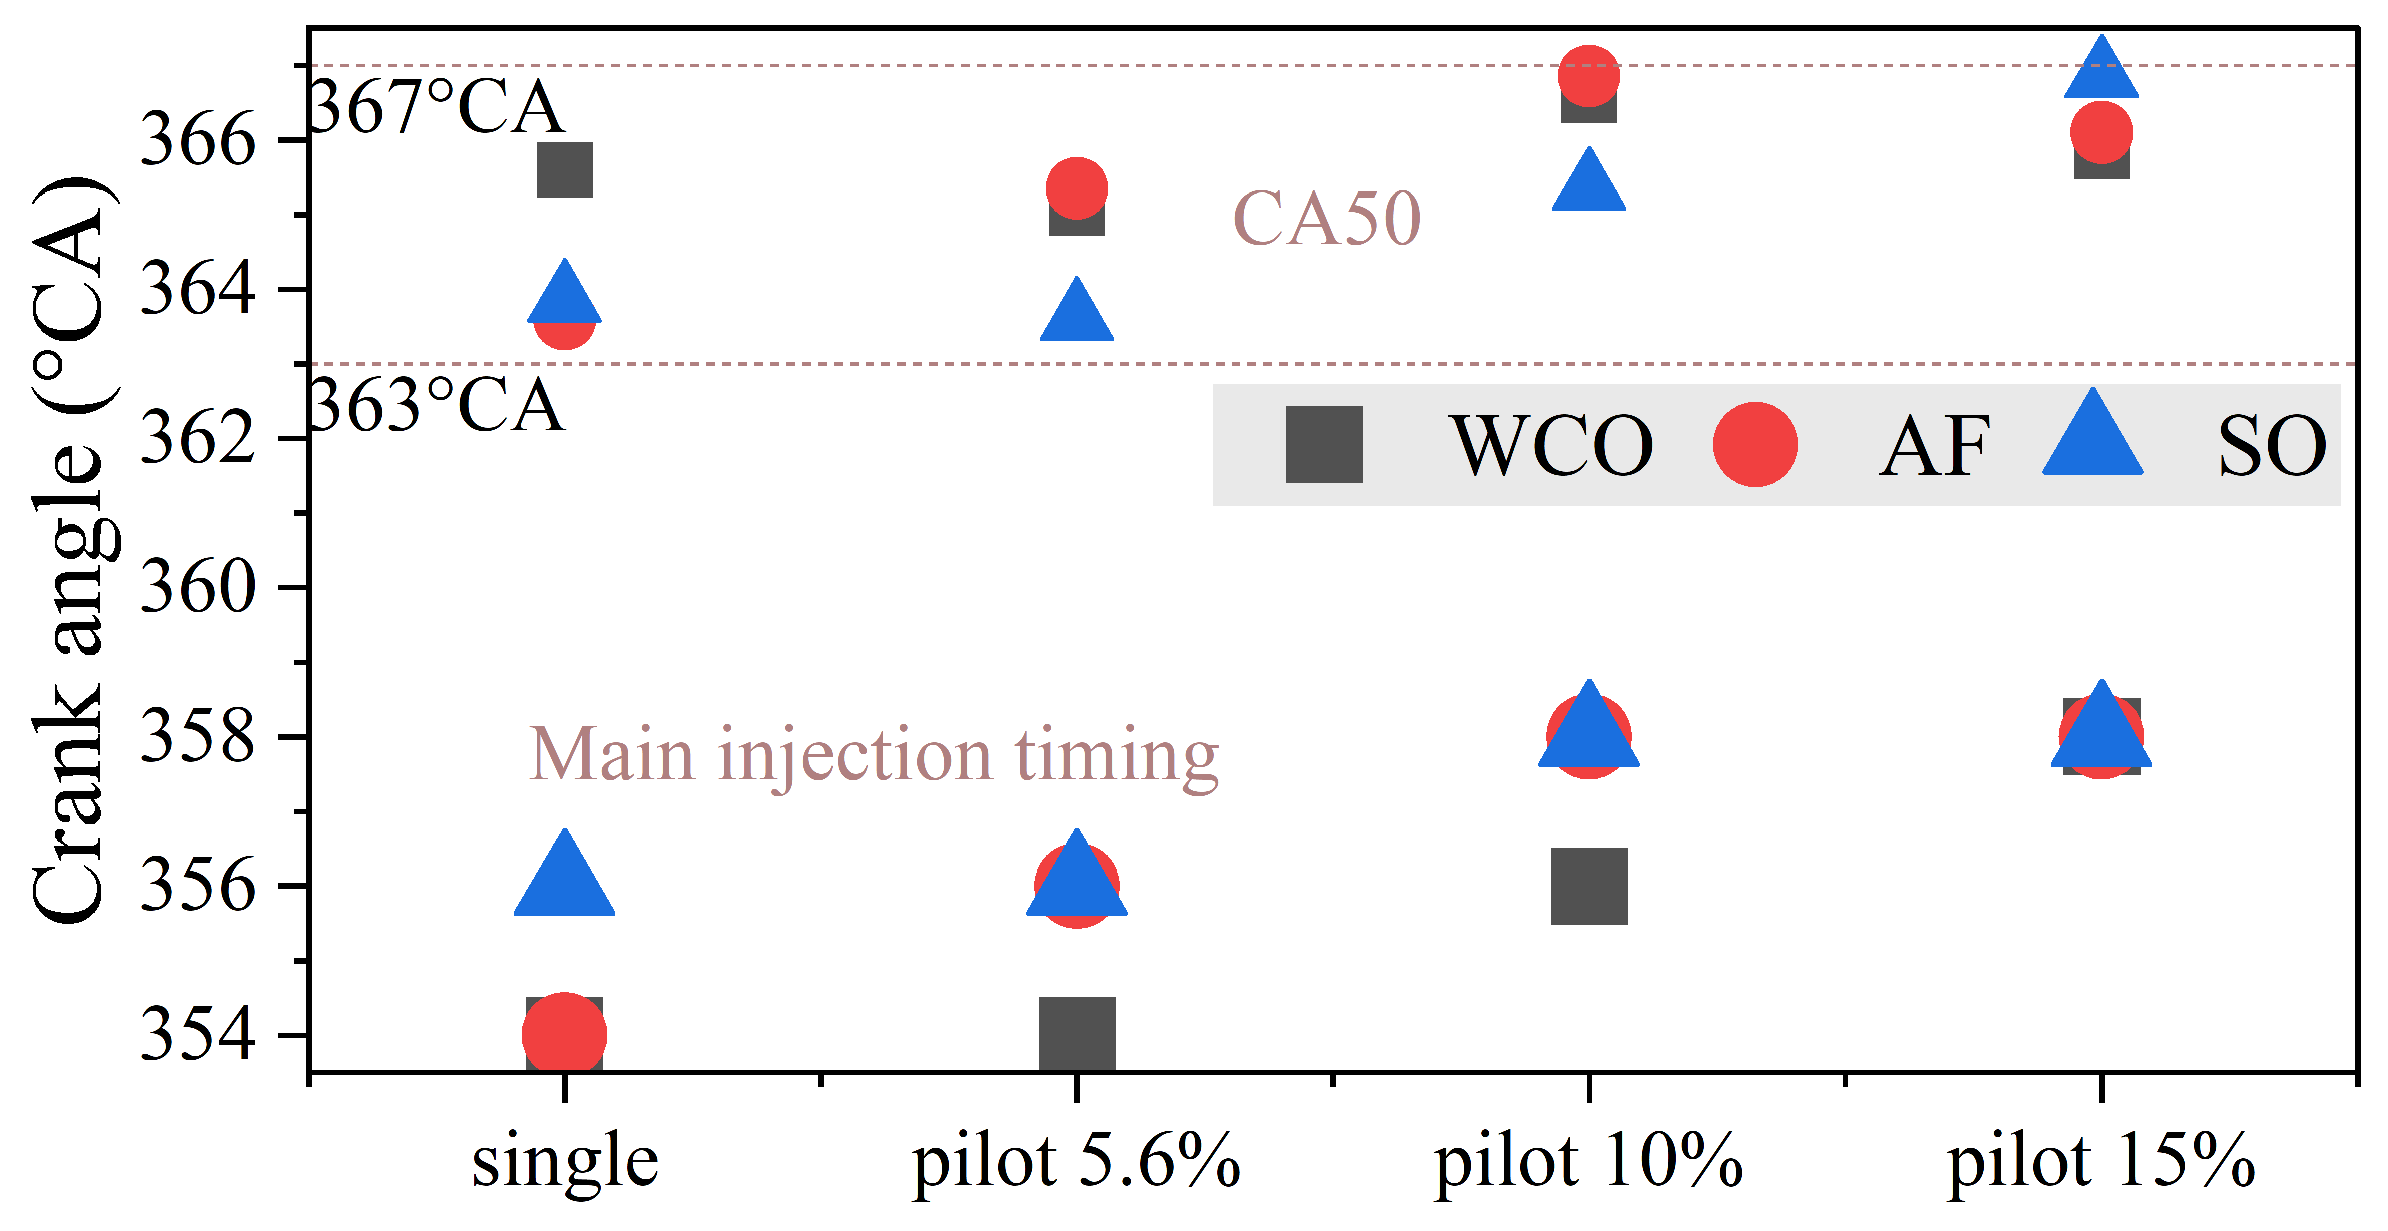
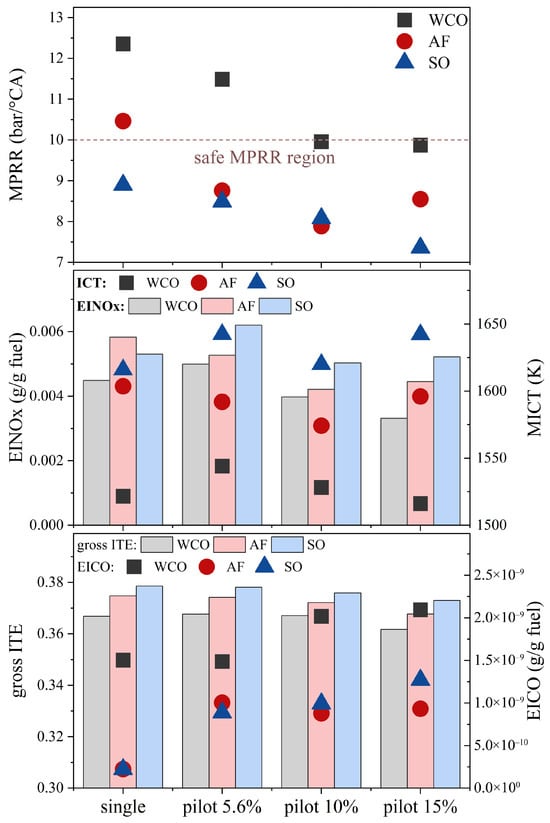
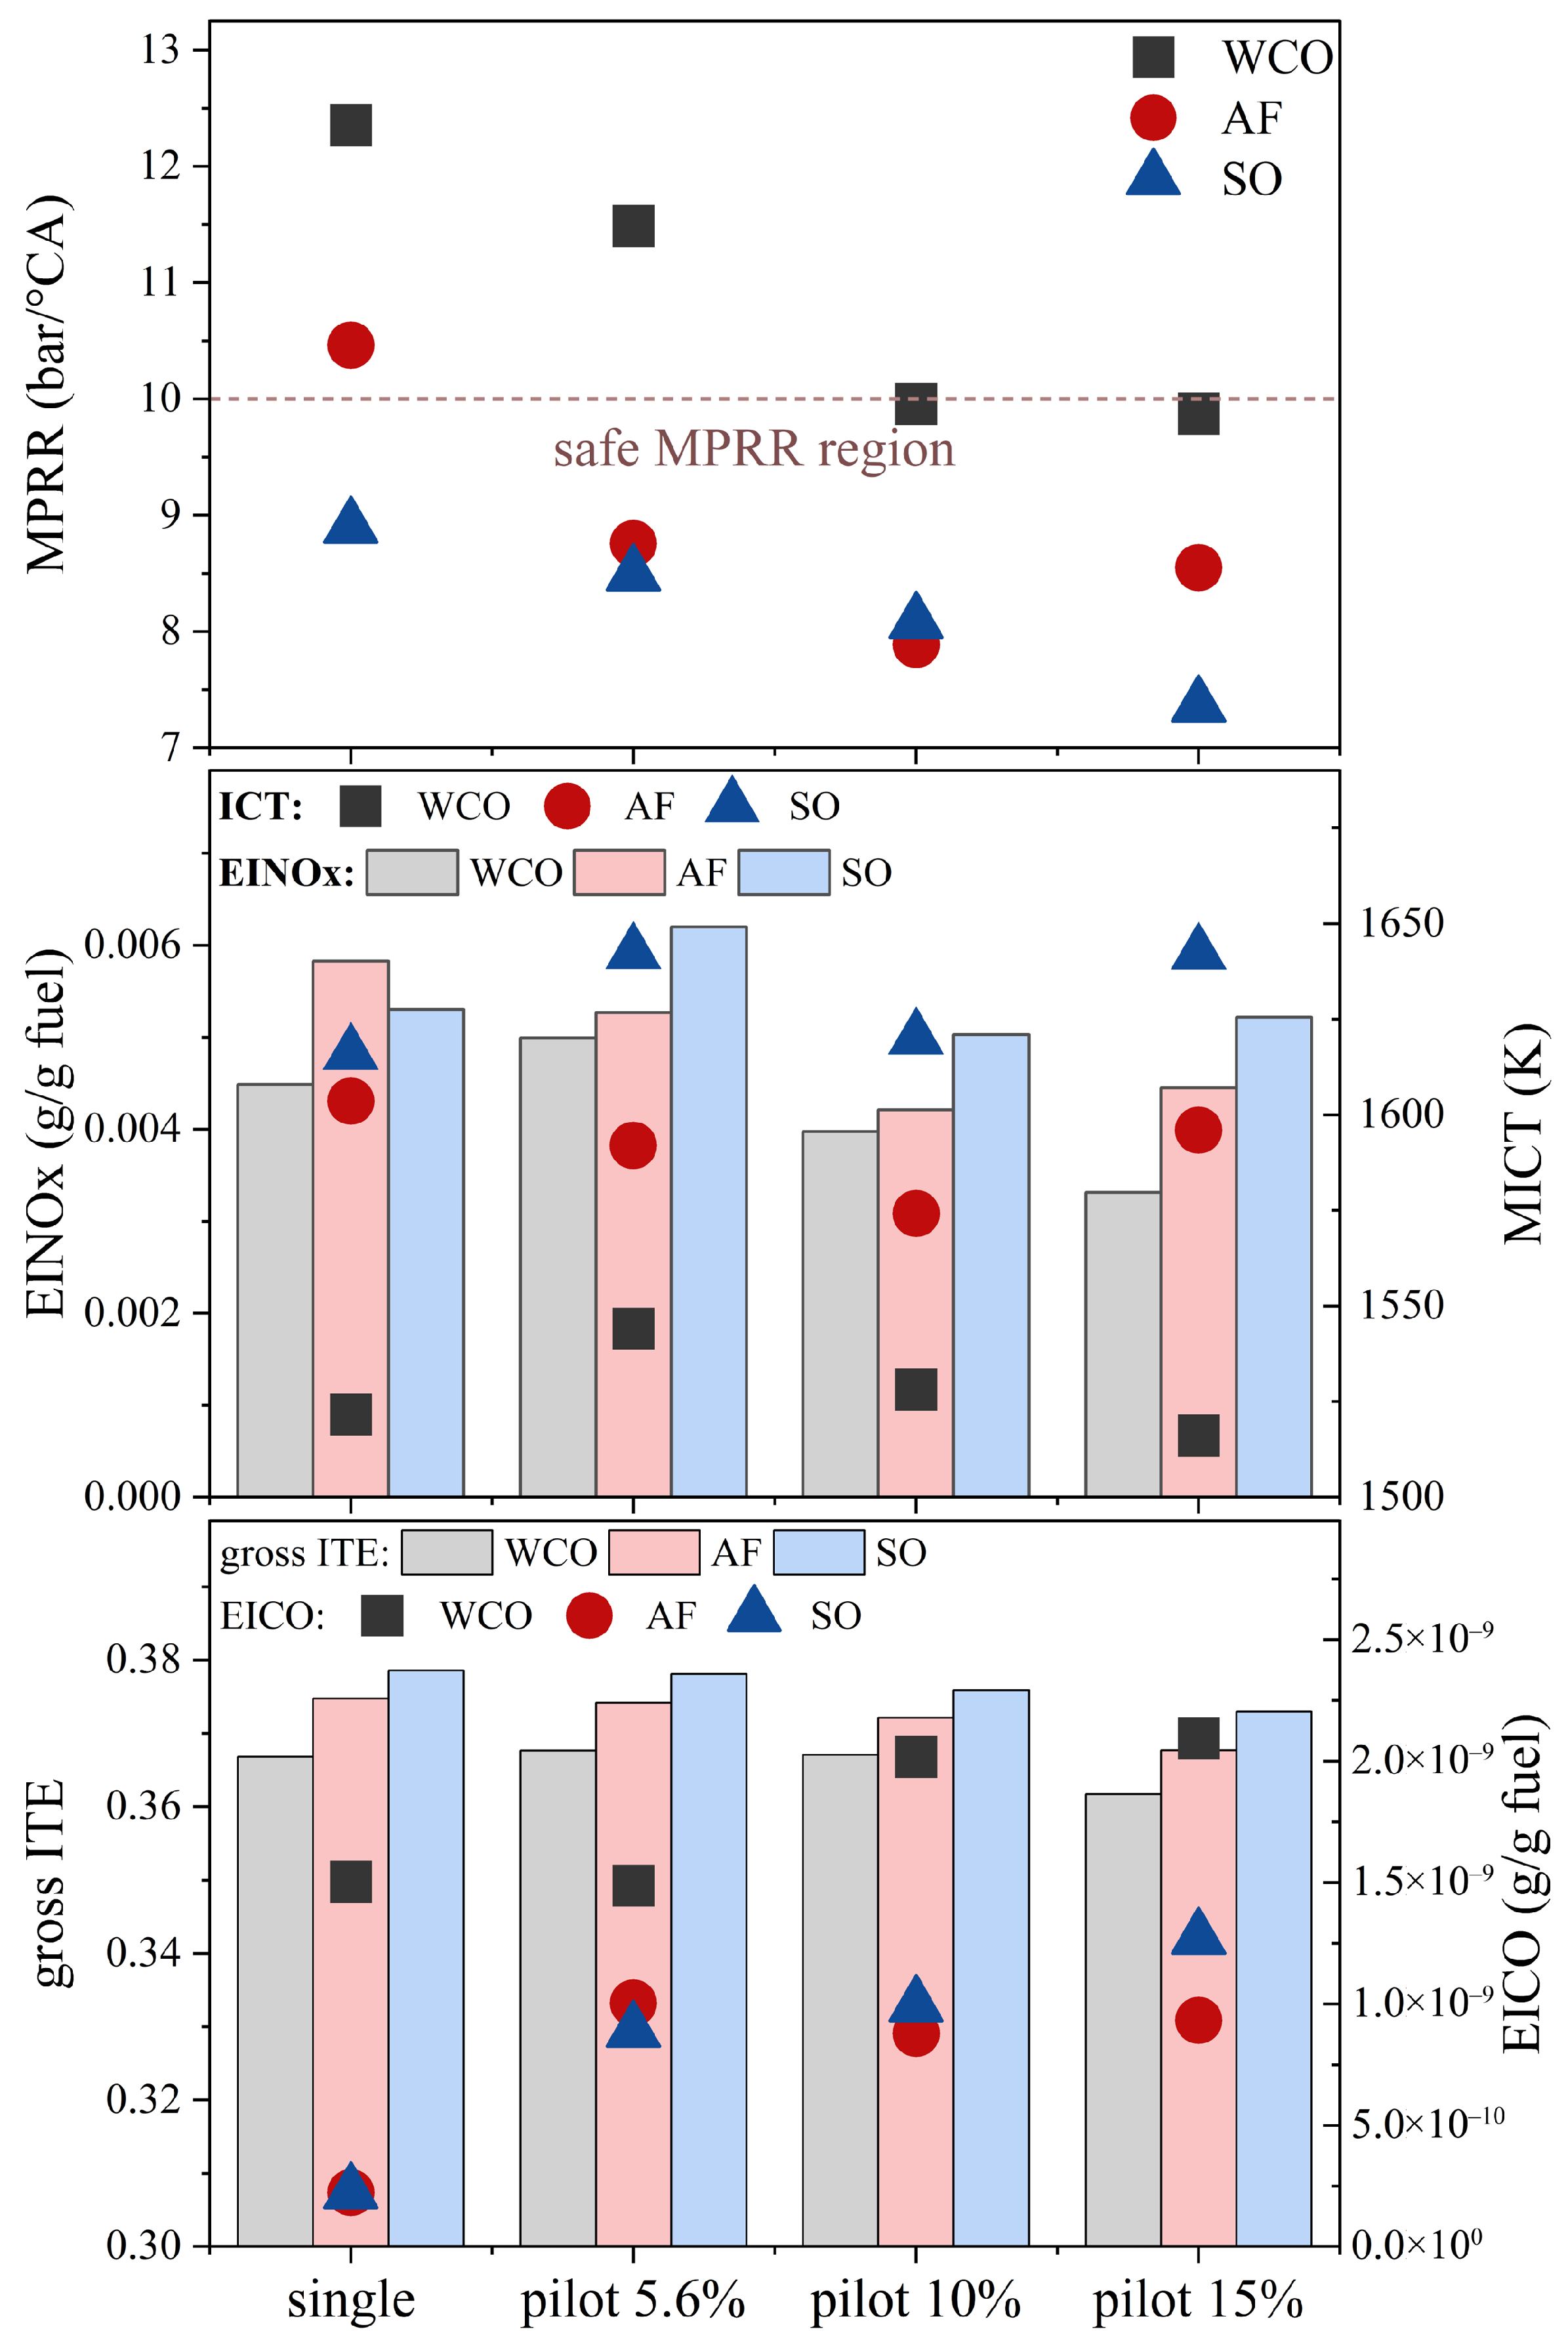
Figure 14 and Figure 15 summarize the combustion phasing as well as the combustion and emission characteristics for the WCO, AF, and SO biodiesels under single and double injection strategies (pilot energy ratios of 5.6%, 10%, and 15%) at each condition corresponding to the highest gross ITE.
Figure 14.
Comparison of combustion phase (top: CA50, bottom: main injection timing) for different biodiesels under maximum gross ITE conditions with single and pilot–main injection strategies.
Figure 15.
Comparison of engine performance for different biodiesels under maximum gross ITE conditions with single and pilot–main injection strategies.
In general, double injection advances the combustion phasing; therefore, a later injection timing is required compared with a single injection to reach its highest gross ITE condition. However, these differences in injection timing do not substantially change the corresponding CA50. The CA50 values for all biodiesels fall within 363–367 °CA, indicating the optimal heat release phasing window for the studied engine.
Figure 15 shows that, regardless of the injection strategy, WCO exhibits a significantly higher MPRR than AF and SO. Double injection generally reduces the MPRR. Nevertheless, for WCO, the MPRR exceeds the acceptable 10 bar/°CA limit at a 5.6% pilot energy ratio and remains very close to the limit at 10% and 15% pilot energy ratios. However, a higher combustion intensity does not necessarily translate into higher thermal efficiency. As depicted in Figure 15, WCO consistently exhibits a lower gross ITE than AF and SO. This may be attributed to lower combustion completeness for WCO. This phenomenon is supported by the higher emissions index of carbon monoxide (EICO) for WCO, since CO is commonly used as an indicator of incomplete combustion.
For all biodiesels, double injection increases the EICO, and the increase becomes more pronounced as the pilot energy ratio increases. The increase in incomplete combustion products and the change in combustion phasing may contribute to a reduction in gross ITE under double injection. This reduction becomes more pronounced as the pilot energy ratio increases. However, its average decrease (1.6%) is smaller than the effect of biodiesel composition (2.9%). Despite its lower gross ITE, WCO produces the lowest NOx emissions, which can be attributed to its lower MICT. NOx emissions show no clear trend with an increasing pilot energy ratio under double injection.
Overall, SO exhibits a desirable highest gross ITE across the injection strategies. This is mainly because SO exhibits a shorter combustion duration, leading to a more concentrated heat release. Its higher combustion temperature promotes the oxidation of soot, thereby reducing soot emissions. In addition, for SO, the MICT at the highest gross ITE falls within the balanced MICT window identified above, indicating the feasibility of double injection for practical application. However, when minimizing NOx emissions is prioritized, WCO shows an advantage. Its lower combustion temperature significantly reduces EINOx, but this benefit is accompanied by higher incomplete combustion products, CO, and reduced gross ITE.
4. Conclusions
This work numerically investigates the effects of biodiesel fatty acid methyl ester (FAME) composition and a pilot–main double injection strategy for the combustion and emission characteristics of a light-duty diesel engine. The main conclusions are as follows.
- (1)
- Advancing the main injection timing increases the apparent heat release rate (AHRR) peak and maximum pressure rise rate (MPRR), whereas waste cooking oil biodiesel sharpens the AHRR peak and MPRR and delays combustion phasing. Nevertheless, pilot–main injection and a higher pilot energy ratio can moderate the combustion, advance combustion phasing, and reduce the combustion duration.
- (2)
- A stable CA10 regime appears within the main injection timing of 350–358 °CA, and it persists across biodiesels and injection strategies. In addition, despite differences in the main injection timing across the highest gross indicated thermal efficiency (ITE) conditions, a favorable CA50 window of 363–367 °CA also emerges.
- (3)
- The emissions index of nitrogen oxides (EINOx) increases with the maximum in-cylinder temperature (MICT), while soot generally decreases. However, soot still differs among biodiesels at the same MICT. The SO biodiesel achieves the most favorable balance between efficiency and emissions within an intermediate MICT window of 1590–1680 K, whereas the WCO biodiesel offers an advantage when NOx reduction is prioritized, at the cost of higher soot emissions and reduced gross ITE.
- (4)
- At the respective highest gross ITE conditions of biodiesels, WCO exhibits consistently higher MPRR and a higher emissions index of carbon monoxide (EICO), suggesting lower combustion completeness, whereas its NOx emission is favorable. On the other hand, the SO biodiesel maintains a lower MPRR and higher gross ITE, but there is more NOx formed, accompanied by higher MICT. Pilot–main injection tends to smooth the combustion while increasing the EICO, which is associated with a reduction in gross ITE.
Author Contributions
Conceptualization, Z.G.; Methodology, Z.G., Y.H. and H.J.; Software, Z.G., Y.H. and H.J.; Validation, Z.G.; Investigation, Z.G., Y.H. and H.J.; Resources, T.H.-y.L.; Writing—original draft, Z.G.; Writing—review & editing, Y.H., H.J. and T.H.-y.L.; Supervision, T.H.-y.L.; Project administration, T.H.-y.L.; Funding acquisition, T.H.-y.L. All authors have read and agreed to the published version of the manuscript.
Funding
This research was funded by the National Natural Science Foundation of China, grant number W2433115.
Data Availability Statement
The original contributions presented in this study are included in the article. Further inquiries can be directed to the corresponding author.
Conflicts of Interest
The authors declare no conflicts of interest.
Abbreviations
The following abbreviations are used in this manuscript:
| AF | Animal Fat |
| AHRR | Apparent Heat Release Rate |
| CA10 | Crank Angle at 10% Cumulative Heat Release |
| CA50 | Crank Angle at 50% Cumulative Heat Release |
| CA90 | Crank Angle at 90% Cumulative Heat Release |
| EICO | Emissions Index of Carbon Monoxide |
| ECU | Electric Control Unit |
| EGR | Exhaust Gas Recirculation |
| EINOx | Emissions Index of Nitrogen Oxides |
| FAME | Fatty Acid Methyl Ester |
| HCCI | Homogeneous Charge Compression Ignition |
| ICP | In-Cylinder Pressure |
| ITE | Indicated Thermal Efficiency |
| MICT | Maximum In-Cylinder Temperature |
| MPRR | Maximum Pressure Rise Rate |
| PPCI | Partially Premixed Compression Ignition |
| SO | Soybean Oil |
| WCO | Waste Cooking Oil |
References
- Agarwal, A.K.; Mounaïm-Rousselle, C.; Brequigny, P.; Dhar, A.; Hespel, C.; Patel, C.; Srivastava, D.K.; Duraisamy, G.; Le Moyne, L.; Sharma, N.; et al. Future of internal combustion engines using sustainable, scalable, and storable E-fuels and biofuels for decarbonizing transport and enabling advanced combustion technologies. Prog. Energy Combust. Sci. 2025, 110, 101236. [Google Scholar] [CrossRef] [Scilit]
- Knothe, G.; Razon, L.F. Biodiesel fuels. Prog. Energy Combust. Sci. 2017, 58, 36–59. [Google Scholar] [CrossRef] [Scilit]
- Nerva, J.-G.; Genzale, C.L.; Kook, S.; García-Oliver, J.M.; Pickett, L.M. Fundamental spray and combustion measurements of soy methyl-ester biodiesel. Int. J. Engine Res. 2012, 14, 373–390. [Google Scholar] [CrossRef] [Scilit]
- Ge, J.C.; Kim, H.Y.; Yoon, S.K.; Choi, N.J. Optimization of palm oil biodiesel blends and engine operating parameters to improve performance and PM morphology in a common rail direct injection diesel engine. Fuel 2020, 260, 116326. [Google Scholar] [CrossRef] [Scilit]
- Mueller, C.J.; Boehman, A.L.; Martin, G.C. An Experimental Investigation of the Origin of Increased NOx Emissions When Fueling a Heavy-Duty Compression-Ignition Engine with Soy Biodiesel. SAE Int. J. Fuels Lubr. 2009, 2, 789–816. [Google Scholar] [CrossRef] [Scilit]
- Cheng, A.S.; Upatnieks, A.; Mueller, C.J. Investigation of the impact of biodiesel fuelling on NOx emissions using an optical direct injection diesel engine. Int. J. Engine Res. 2006, 7, 297–318. [Google Scholar] [CrossRef] [Scilit]
- Dhamodaran, G.; Krishnan, R.; Pochareddy, Y.K.; Pyarelal, H.M.; Sivasubramanian, H.; Ganeshram, A.K. A comparative study of combustion, emission, and performance characteristics of rice-bran-, neem-, and cottonseed-oil biodiesels with varying degree of unsaturation. Fuel 2017, 187, 296–305. [Google Scholar] [CrossRef] [Scilit]
- Benjumea, P.; Agudelo, J.R.; Agudelo, A.F. Effect of the Degree of Unsaturation of Biodiesel Fuels on Engine Performance, Combustion Characteristics, and Emissions. Energy Fuels 2010, 25, 77–85. [Google Scholar] [CrossRef] [Scilit]
- Buchanan, K.; Dhotre, A.; Sen, D.; Srna, A.; Rajasegar, R. Interaction and ignition process of multiple injections of oxygenated fuels in an optical, heavy-duty diesel engine. Proc. Combust. Inst. 2025, 41, 105820. [Google Scholar] [CrossRef] [Scilit]
- Mohan, B.; Yang, W.; Chou, S. Fuel injection strategies for performance improvement and emissions reduction in compression ignition engines—A review. Renew. Sustain. Energy Rev. 2013, 28, 664–676. [Google Scholar] [CrossRef] [Scilit]
- Yang, Y.; Dec, J.E.; Dronniou, N.; Sjöberg, M. Tailoring HCCI heat-release rates with partial fuel stratification: Comparison of two-stage and single-stage-ignition fuels. Proc. Combust. Inst. 2011, 33, 3047–3055. [Google Scholar] [CrossRef] [Scilit]
- Sjöberg, M.; Dec, J.E. Smoothing HCCI Heat-Release Rates Using Partial Fuel Stratification with Two-Stage Ignition Fuels; SAE Technical Paper Series; SAE International: Warrendale, PA, USA, 2006. [Google Scholar] [CrossRef] [Scilit]
- Rajasegar, R.; Srna, A. A Review of Current Understanding of the Underlying Physics Governing the Interaction, Ignition and Combustion Dynamics of Multiple-Injections in Diesel Engines. SAE Int. J. Adv. Curr. Pract. Mobil. 2022, 05, 117–134. [Google Scholar] [CrossRef] [Scilit]
- Fang, T.; Lee, C.-f.F. Bio-diesel effects on combustion processes in an HSDI diesel engine using advanced injection strategies. Proc. Combust. Inst. 2009, 32, 2785–2792. [Google Scholar] [CrossRef] [Scilit]
- Tian, Z.; Feng, X.; Wang, Y.; Zhen, X.; Li, X. Impact of pilot injection quantity and fuel composition via pressure difference control in a same-needle diesel-methanol dual-fuel injector on engine performance. Fuel 2026, 407, 137380. [Google Scholar] [CrossRef] [Scilit]
- Choi, M.; Park, S. Optimization of multiple-stage fuel injection and optical analysis of the combustion process in a heavy-duty diesel engine. Fuel Process. Technol. 2022, 228, 107137. [Google Scholar] [CrossRef] [Scilit]
- Herbinet, O.; Pitz, W.J.; Westbrook, C.K. Detailed chemical kinetic mechanism for the oxidation of biodiesel fuels blend surrogate. Combust. Flame 2010, 157, 893–908. [Google Scholar] [CrossRef] [Scilit]
- Luo, Z.; Plomer, M.; Lu, T.; Som, S.; Longman, D.E.; Sarathy, S.M.; Pitz, W.J. A reduced mechanism for biodiesel surrogates for compression ignition engine applications. Fuel 2012, 99, 143–153. [Google Scholar] [CrossRef] [Scilit]
- Wang, W.; Gowdagiri, S.; Oehlschlaeger, M.A. The high-temperature autoignition of biodiesels and biodiesel components. Combust. Flame 2014, 161, 3014–3021. [Google Scholar] [CrossRef] [Scilit]
- Li, H.; Yang, W.; Zhou, D.; Yu, W. Numerical study of the effects of biodiesel unsaturation on combustion and emission characteristics in diesel engine. Appl. Therm. Eng. 2018, 137, 310–318. [Google Scholar] [CrossRef] [Scilit]
- Ra, Y.; Reitz, R.D.; McFarlane, J.; Daw, C.S. Effects of Fuel Physical Properties on Diesel Engine Combustion using Diesel and Bio-diesel Fuels. SAE Int. J. Fuels Lubr. 2008, 1, 703–718. [Google Scholar] [CrossRef] [Scilit]
- Chakravarthy, K.; McFarlane, J.; Daw, S.; Ra, Y.; Reitz, R.; Griffin, J. Physical Properties of Bio-Diesel and Implications for Use of Bio-Diesel in Diesel Engines; SAE Technical Paper Series; SAE International: Warrendale, PA, USA, 2007. [Google Scholar] [CrossRef] [Scilit]
- Poling, B.E.; Prausnitz, J.M.; O’Connell, J.P. The Properties of Gases and Liquids, 5th ed.; McGraw-Hill: Columbus, OH, USA, 2001. [Google Scholar]
- Wang, P.; Jia, M.; Zhang, Y.; Xu, G.; Chang, Y.; Xu, Z. Development of a decoupling physical-chemical surrogate (DPCS) model for simulation of the spray and combustion of multi-component biodiesel fuels. Fuel 2019, 240, 16–30. [Google Scholar] [CrossRef] [Scilit]
- Wang, B.-L.; Bergin, M.J.; Petersen, B.R.; Miles, P.C.; Reitz, R.D.; Han, Z. Validation of the Generalized RNG Turbulence Model and Its Application to Flow in a HSDI Diesel Engine. In SAE Technical Paper Series; SAE International: Warrendale, PA, USA, 2012. [Google Scholar] [CrossRef] [Scilit]
- O’Rourke, P.J.; Amsden, A.A. The Tab Method for Numerical Calculation of Spray Droplet Breakup; SAE Technical Paper Series; SAE International: Warrendale, PA, USA, 1987. [Google Scholar] [CrossRef] [Scilit]
- Zeng, Y.; Lee, C.-F. A preferential vaporization model for multicomponent droplets and sprays. At. Sprays 2002, 12, 163–186. [Google Scholar] [CrossRef] [Scilit]
- Wang, M.; Lee, C.-F.F. Efficient Computation Methods for Combustion Reaction Kinetics. In Proceedings of the ASME 2014 Internal Combustion Engine Division Fall Technical Conference, Columbus, IN, USA, 19–22 October 2014. [Google Scholar]
- Kong, S.-C.; Sun, Y.; Rietz, R.D. Modeling Diesel Spray Flame Liftoff, Sooting Tendency, and NOx Emissions Using Detailed Chemistry With Phenomenological Soot Model. J. Eng. Gas Turbines Power 2005, 129, 245–251. [Google Scholar] [CrossRef] [Scilit]
- Leick, M.; Feng, X.; Lee, C.-F.; Hansen, A. Reducing NOx Emissions from a Common-Rail Engine Fueled with Soybean Biodiesel; SAE Technical Paper Series; SAE International: Warrendale, PA, USA, 2011. [Google Scholar] [CrossRef] [Scilit]
- Heywood, J.B. Internal Combustion Engine Fundamentals, 2nd ed.; McGraw-Hill Education: Columbus, OH, USA, 2018. [Google Scholar]
- Zeng, W.; Sjöberg, M.; Reuss, D. Using PIV Measurements to Determine the Role of the In-Cylinder Flow Field for Stratified DISI Engine Combustion. SAE Int. J. Engines 2014, 7, 615–632. [Google Scholar] [CrossRef] [Scilit]
- Leick, M. Optimizing Conventional Combustion and Implementing Lowtemperature Combustion of Biodiesel in a Common-Rail High-Speed Direct-Injection Engine. Master’s Thesis, University of Illinois at Urbana-Champaign, Champaign, IL, USA, 2010. [Google Scholar]
- Zhang, S.; Tang, Q.; Yang, R.; Liu, H.; Yao, M. Experimental study on combustion and emission characteristics of an ammonia-diesel dual-fuel engine under single and double injection strategies. Proc. Combust. Inst. 2025, 41, 105872. [Google Scholar] [CrossRef] [Scilit]
- Guo, Z.; Wu, C.-W.; Wu, Y.-L.; Lee, Y.-Y.; Lin, S.-L.; Lee, T.H. Spray combustion characteristics and soot formation potential of Nano-Al2O3 diesel at low ambient temperatures. Fuel 2024, 371, 132086. [Google Scholar] [CrossRef] [Scilit]

Disclaimer/Publisher’s Note: The statements, opinions and data contained in all publications are solely those of the individual author(s) and contributor(s) and not of MDPI and/or the editor(s). MDPI and/or the editor(s) disclaim responsibility for any injury to people or property resulting from any ideas, methods, instructions or products referred to in the content. |
© 2026 by the authors. Licensee MDPI, Basel, Switzerland. This article is an open access article distributed under the terms and conditions of the Creative Commons Attribution (CC BY) license.