1. Introduction
China is transitioning from high-speed growth to high-quality development, which requires more sustainable and comprehensive economic and social progress [
1]. As a foundational sector supporting economic operation and livelihoods, the energy system is central to this transition and faces both strategic opportunities and practical constraints [
2,
3]. Following the goals of carbon peaking and carbon neutrality, China’s energy production, consumption, and resource allocation are undergoing profound adjustments [
4]. Accordingly, shifting from a high-consumption, high-emission model toward a green, low-carbon, safe, and efficient pathway has become critical for advancing the energy transition and supporting economic modernization [
5].
Nevertheless, China’s energy transition remains constrained by rising demand and tightening resource–environment pressures [
6,
7], alongside persistent bottlenecks in energy efficiency improvement, industrial upgrading, and technological innovation [
8]. Although the scale of renewable energy has expanded rapidly, fossil fuels still dominate the energy mix, slowing the overall low-carbon transition [
9]. Under the dual-carbon targets, improving the quality of energy development has therefore become a key policy priority [
10].
At the spatial scale, China’s energy development exhibits pronounced regional disparities. Significant differences exist across provinces due to variations in resource endowments, economic foundations, technological capabilities, and policy implementation [
11,
12]. Eastern coastal provinces often progress faster in efficiency improvement and green energy deployment due to stronger markets and technological foundations [
13], whereas many central and western provinces face greater pressures associated with industrial lock-in and weaker innovation support [
14]. Since provinces are the primary implementation units of energy and climate policies, provincial-level assessment can help benchmark performance, diagnose constraints, and support differentiated transition pathways [
15].
High-quality energy development is inherently multidimensional, involving green transition, efficiency, innovation, security, coordination, and external openness [
16,
17]. However, existing provincial evaluations often remain insufficient for decision-making because they (i) do not consistently provide integrated, system-level coverage across these dimensions, (ii) may suffer from indicator redundancy and multicollinearity that weaken robustness and cross-provincial comparability, and (iii) emphasize overall rankings while providing limited dimension-level diagnostics that can be translated into actionable strategies. To address these gaps, this study develops a transparent, multidimensional, and comparable evaluation framework and links the resulting patterns to differentiated transition pathways at the provincial level.
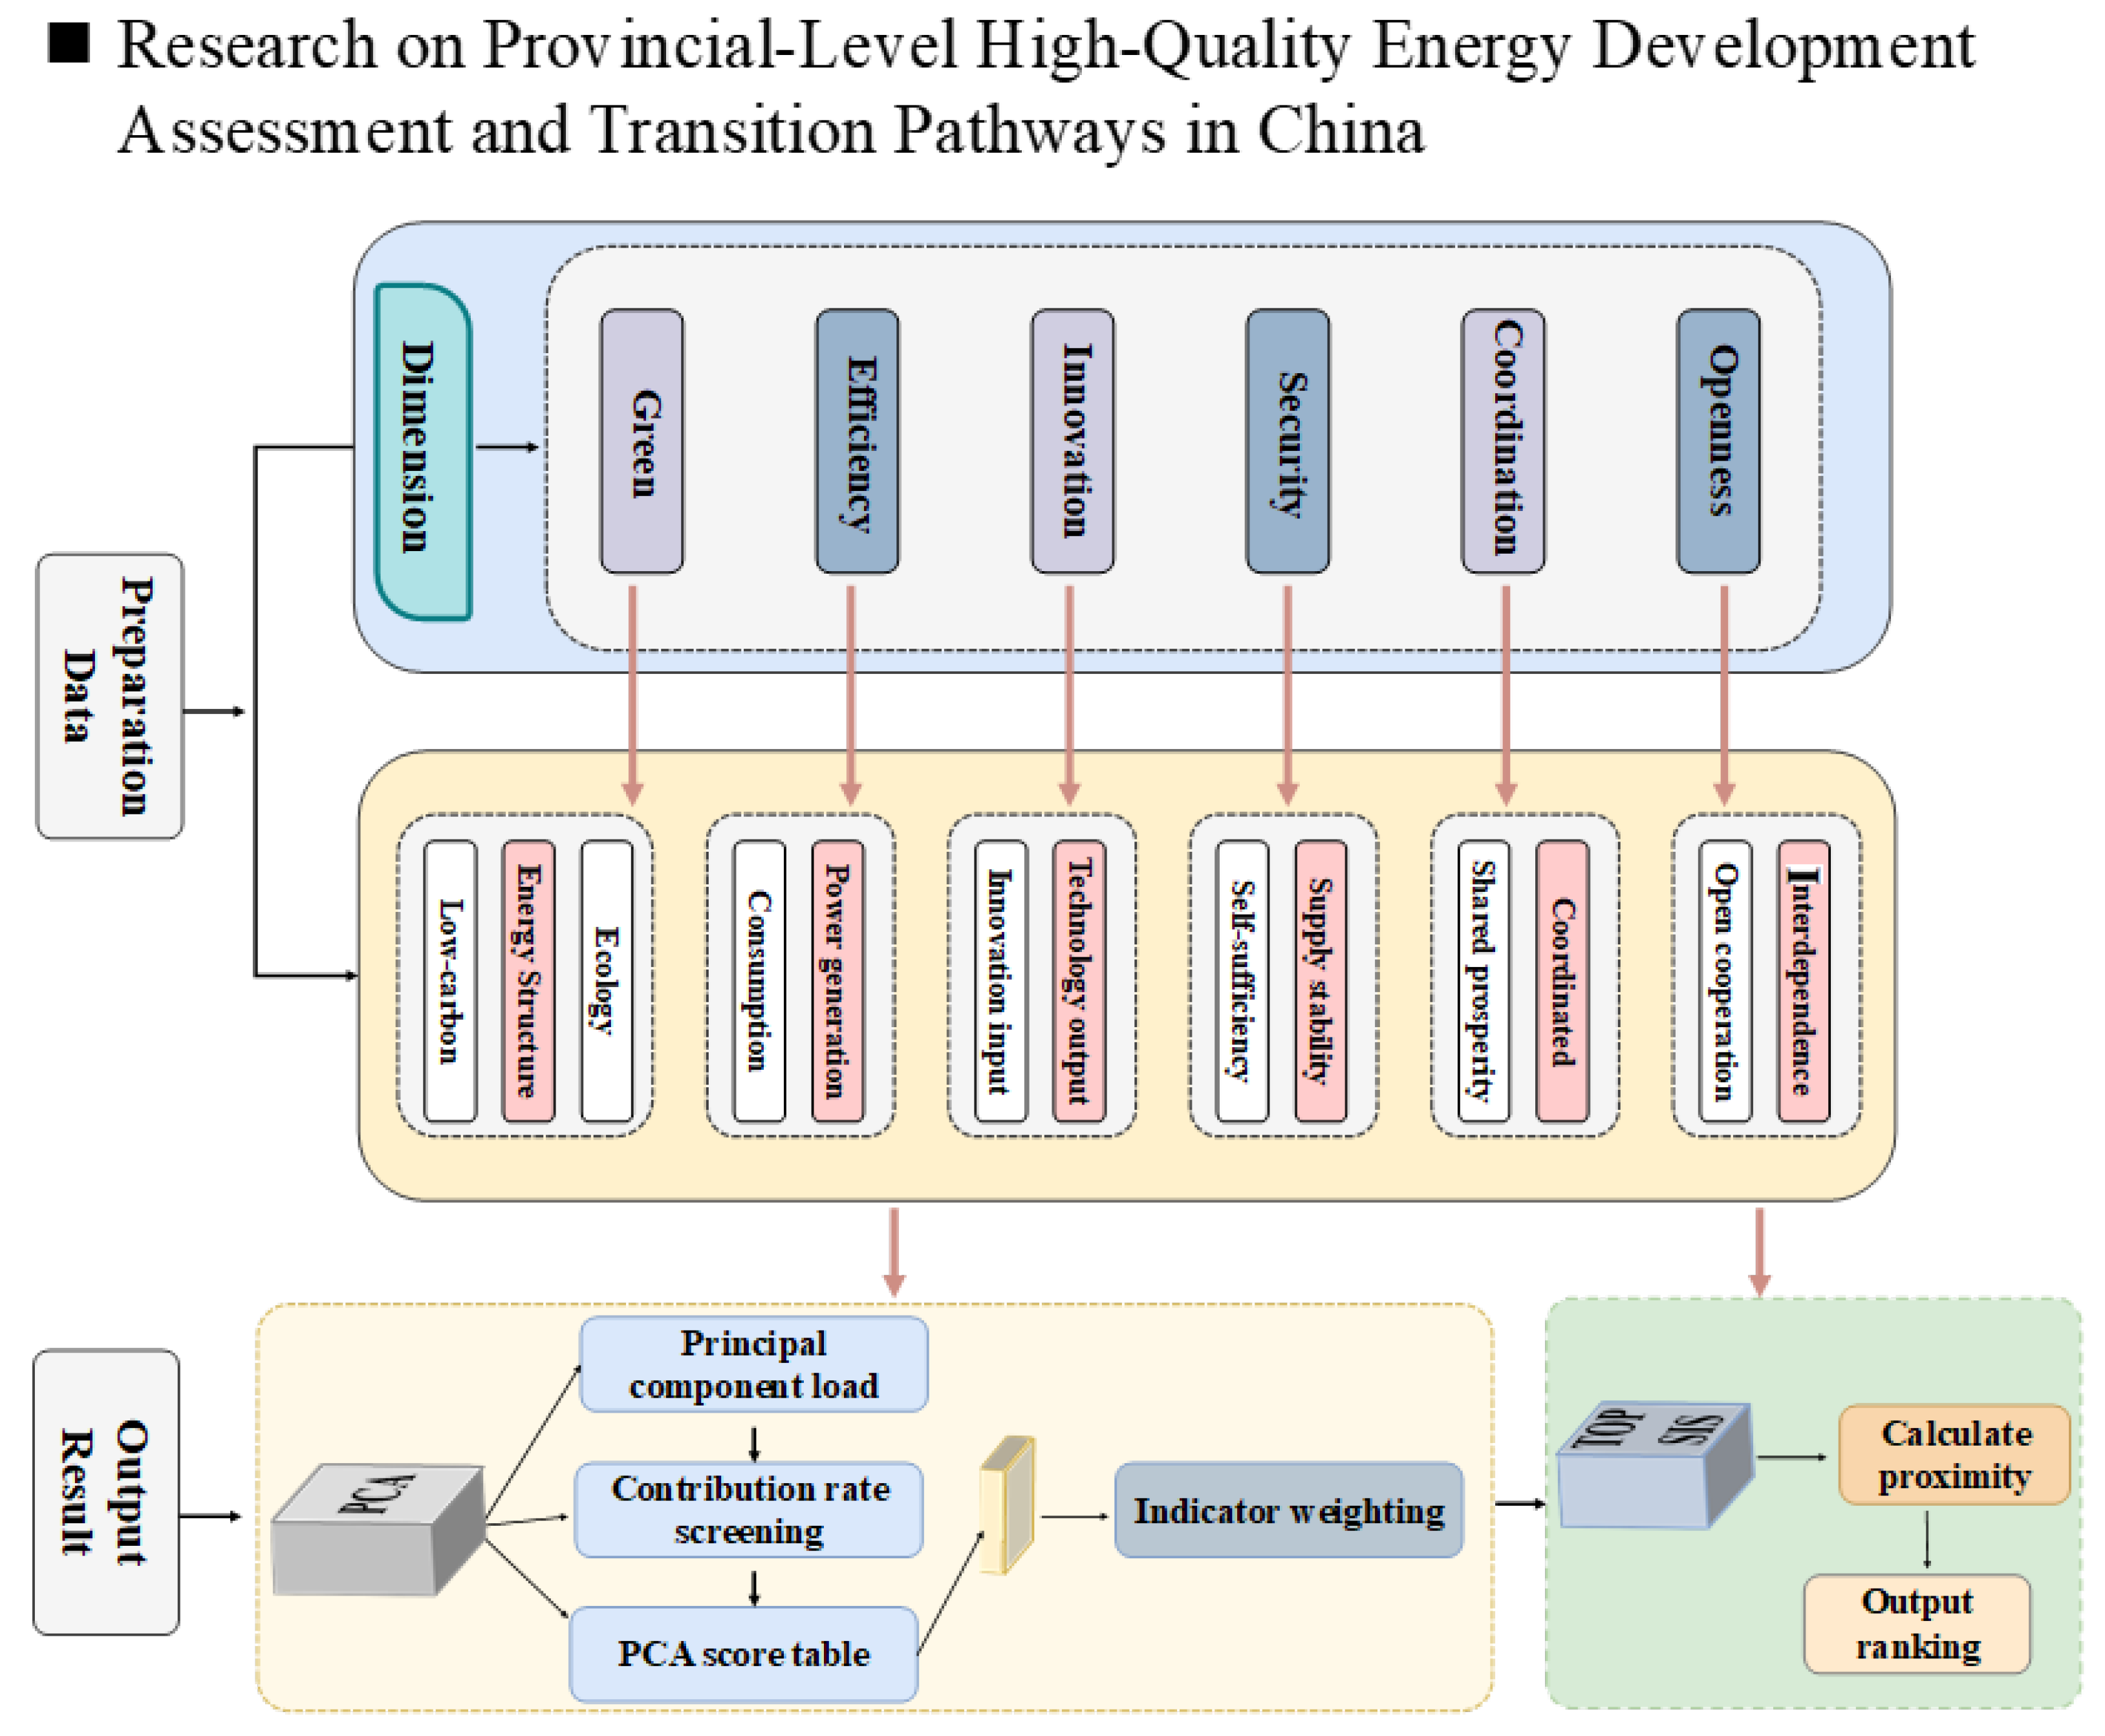
Based on the above considerations, this paper examines 30 provincial-level administrative regions in China during 2011–2022. As illustrated in
Figure 1, we standardize provincial-year indicators and organize them into six dimensions (green energy, efficiency, innovation, security, coordination, and openness; see Table 1). We then apply Principal Component Analysis (PCA)to derive objective weights and integrate these weights into Technique for Order Preference by Similarity to Ideal Solution (TOPSIS) to compute composite scores and rankings, followed by cluster-based pattern identification to summarize regional development modes and inform differentiated transition pathways. This study provides a multidimensional provincial evaluation framework and an objective PCA-TOPSIS assessment that produces comparable rankings and supports differentiated, evidence-based transition implications.
3. Methodology
To evaluate high-quality energy development across Chinese provinces, this study constructs a framework of 24 indicators across six dimensions: green energy, energy efficiency, energy innovation, energy security, energy coordination, and energy openness (
Table 1). Given the strong multicollinearity among indicators, the entropy method may yield biased weights by neglecting correlations, while AHP suffers from subjectivity. Accordingly, a PCA-TOPSIS model was adopted. PCA first orthogonalizes the high-dimensional data to remove correlations and derive objective weights, after which TOPSIS assesses provincial development levels based on multidimensional distance measurement. This approach retains the main information of the original data and enhances the robustness of the evaluation results.
3.1. Construction of the Indicator System and Rationale
The evaluation system is based on the multidimensional concept of high-quality energy development, integrating the objectives of decarbonization, efficiency, security, and equity. Accordingly, six dimensions comprising 24 indicators are constructed, and their rationales are described as follows.
(1) Green Energy.
This dimension reflects the core objective of the energy transition, decoupling economic growth from carbon emissions and environmental degradation. Low-carbon transition is measured by carbon emission intensity and the share of non-fossil power in installed capacity, which directly capture structural decarbonization. Ecological friendliness is assessed using standard coal consumption, indicating the cleanliness of thermal power generation, and the solid waste utilization rate, reflecting industrial circularity. Forest coverage and urban green coverage are further included as carbon sink indicators representing environmental carrying capacity.
(2) Energy Efficiency.
Energy efficiency captures the input–output performance of the energy system. On the consumption side, energy intensity and electricity intensity measure energy use per unit of economic output, reflecting industrial upgrading and energy-saving technologies. On the production side, equipment utilization hours indicate the operational efficiency of power generation assets and the effectiveness of resource allocation.
(3) Energy Innovation.
Innovation provides the endogenous driving force for high-quality energy development and is evaluated from both input and output perspectives. R&D intensity, innovation investment ratio, and R&D personnel ratio represent financial and human capital, while patents per capita serve as a proxy for technological output and knowledge creation in energy-related sectors.
(4) Energy Security.
Energy security constitutes the fundamental requirement for stable energy development. Supply reliability is measured by the energy self-sufficiency rate and per capita installed capacity, reflecting baseline supply capacity. Growth potential is captured by energy industry investment and production growth rates, indicating future expansion capability. Energy consumption elasticity is used as an early-warning indicator of potential supply–demand imbalance.
(5) Energy Coordination.
This dimension emphasizes the inclusiveness and equity of energy services. Natural gas access rate and urban gas coverage reflect residents’ quality of life and infrastructure modernization, while per capita energy consumption represents basic energy access and the mitigation of energy poverty.
(6) Energy Openness.
Energy openness reflects the interaction between regional energy systems and external markets. Export dependence and trade dependence ratios measure the degree of integration into external markets and the use of external resources to optimize the regional energy–economic structure.
The detailed definitions and attributes of all selected indicators are presented in
Table 1.
Table 1.
Evaluation index system for high-quality energy development at the provincial level.
Table 1.
Evaluation index system for high-quality energy development at the provincial level.
| Dimension | Sub-Dimension | Indicator | Variable Definition | Unit | Direction | Data Source |
|---|
| Green Energy | Clean and Low-Carbon | Carbon Emission Intensity | Ratio of total CO2 emissions to regional GDP | Tons/104 CNY | − | [16] |
| | | Non-Fossil Power Share | Percentage of non-fossil fuel power generation in total power generation | % | + | [37] |
| | | Non-Fossil Energy Installed Capacity Share | Share of non-fossil fuel installed capacity in total installed capacity | % | + | [37] |
| | | Solid Waste Utilization Rate | Percentage of industrial solid waste comprehensively utilized | % | + | [17] |
| | Energy Structure | Standard Coal Consumption | Average coal consumption for power generation | g/kWh | − | [37] |
| | Ecological Improvement | Forest Coverage Rate | Ratio of forest area to total land area | % | + | [38] |
| | | Urban Green Coverage | Ratio of green area to total built-up area in urban districts | % | + | [38] |
| Energy Efficiency | Consumption Efficiency | Energy Intensity | Ratio of total energy consumption to regional GDP | tce/104 CNY | − | [39] |
| | | Electricity Intensity | Ratio of total electricity consumption to regional GDP | kWh/104 CNY | − | [37] |
| | Generation Efficiency | Equipment Utilization Hours | Average annual operating hours of power-generating equipment | Hours | + | [37] |
| Energy Innovation | Innovation Input | Innovation Investment Ratio | Ratio of R&D investment to total fixed asset investment | % | + | [31] |
| | | R&D Intensity | Proportion of internal R&D expenditure to regional GDP | % | + | [31] |
| | | R&D Personnel Ratio | Ratio of R&D personnel (full-time equivalent) to total employees | % | + | [31] |
| | Sci-Tech Output | Patents per Capita | Number of patents granted per person | Patents/Person | + | [37] |
| Energy Security | Self-Sufficiency | Energy Industry Investment | Total investment in energy industry infrastructure | 108 CNY | + | [30] |
| | | Energy Self-Sufficiency Rate | Ratio of primary energy production to total energy consumption | % | + | [30] |
| | Supply Stability | Consumption Elasticity | Ratio of energy consumption growth rate to GDP growth rate | Dimensionless | − | [39] |
| | | Per Capita Installed Capacity | Installed power generation capacity per capita | kW/person | + | [39] |
| | | Production Growth Rate | Year-on-year growth rate of primary energy production | % | + | [19] |
| Energy Coordination | Sharing Level | Natural Gas Access Rate | Percentage of urban population with access to natural gas | % | + | [16] |
| | | Urban Gas Coverage | Ratio of population with gas access to total urban population | % | + | [16] |
| | Coordinated Balance | Per Capita Energy Consumption | Total energy consumption per capita | tce/Person | − | [16] |
| Energy Openness | Open Cooperation | Export Dependence | Ratio of total export value to regional GDP | % | + | [31] |
| | Trade Dependency | Trade Dependence Ratio | Ratio of total import and export value to regional GDP | % | + | [31] |
3.2. Data Sources and Preprocessing
This study utilizes panel data from 30 provincial-level administrative regions in China (excluding Tibet, Hong Kong, Macao, and Taiwan due to data availability) spanning from 2011 to 2022. Raw data were primarily obtained from the China Statistical Yearbook, China Energy Statistical Yearbook, China Electric Power Yearbook, and various provincial statistical bulletins. To ensure the reproducibility and scientific rigor of the evaluation, a standardized data preprocessing protocol was implemented as follows:
Outlier Handling: Potential anomalies were identified using the 3σ (three-sigma) rule. Upon meticulous verification, these extreme values were found to stem from objective disparities in provincial resource endowments and development stages (e.g., structural differences between energy-producing hubs and consumption centers) rather than data entry or statistical errors. Consequently, these outliers were retained to authentically reflect the regional structural non-uniformity of China’s energy landscape.
Missing Data Treatment: For the minimal missing observations (representing less than 1% of the total dataset), linear interpolation was employed based on temporal trends to ensure the continuity and integrity of the panel data.
Data Normalization: All raw indicators were normalized using the Z-score method to eliminate dimensional effects and ensure that the data distribution aligns with the variance-based computational requirements of PCA.
Following preprocessing, the suitability for dimensionality reduction was verified. The Kaiser–Meyer–Olkin (KMO) value of 0.695 (exceeding the 0.5 threshold) and Bartlett’s test of sphericity (p < 0.001) confirm significant structural correlations among the 24 indicators, thereby validating that the dataset is highly appropriate for PCA.
3.3. Determining Indicator Weights via PCA
PCA is a multivariate statistical method that transforms multiple correlated indicators into a set of uncorrelated principal components. This study uses PCA to determine the weights of indicators in the comprehensive evaluation. The specific steps and economic meanings are as follows:1. Data standardization:
(1) Data Standardization:
Since the indicators have different units (e.g., “Tons/104 CNY” vs. “%”), the Z-score method is first used to standardize the raw data
(the j-th indicator for the i-th province):
where
is the mean and
is the standard deviation of the
j-th indicator.
(2) Correlation matrix calculation:
Construct the indicator correlation matrix
, where
to analyze linear correlations among indicators.
(3) Solve eigenvalues and eigenvectors:
Solve for eigenvalues
and eigenvectors
of the correlation matrix
:
where
is the total number of indicators,
represents the variance contribution of the
th principal component, and
is the loading vector.
(4) Principal component selection:
The first
principal components based on cumulative variance contribution or the principle that eigenvalues exceed 1:
Rationale: Selecting 85% is a standard statistical threshold, implying that the selected k principal components retain the vast majority of information from the original indicator system, effectively achieving dimensionality reduction while filtering out noise.
(5) Calculate principal component loadings and indicator weights:
Indicator loading on the
mth principal component:
Composite coefficient for each indicator:
Note: In the PCA-based weighting process, since the method determines importance based on the information contribution (variance) of each indicator, the absolute values of the component loadings are utilized for weight calculation. This ensures that the magnitude of an indicator’s impact is captured regardless of its original direction. The specific cost or benefit orientation of negative indicators is subsequently and systematically addressed during the TOPSIS stage (as shown in Equations (9) and (10)) by determining the relative distance to the positive and negative ideal solutions.
It is essential to clarify that the indicator weights determined via PCA in this study do not represent subjective “policy priority” in the traditional sense; instead, they reflect “informational discriminatory contribution” from an information-theoretic perspective. When evaluating high-dimensional and complex energy systems, significant statistical correlations often exist among indicators, leading to information redundancy that can bias evaluation outcomes. The weighting logic of PCA relies on extracting independent components through orthogonal transformation and assigning weights according to each indicator’s contribution to the total variance of the original system. From a statistical robustness standpoint, a larger variance implies a higher degree of dispersion across different samples (provinces), thus encoding more abundant discriminatory information. Consequently, this variance-driven weighting mechanism is essentially an objective process grounded in the intrinsic structural features of the dataset. By quantifying the statistical resolution of each indicator, this approach ensures the rigor and reliability of the evaluation results, effectively mitigating the subjective bias and stochastic errors inherent in human-assigned weighting schemes.
3.4. TOPSIS Comprehensive Ranking
TOPSIS is a multi-criteria decision-making method based on Euclidean distance. It ranks objects by calculating their distance to the “Positive Ideal Solution” (optimal state) and “Negative Ideal Solution” (worst state).
This study constructs the PCA-TOPSIS integrated framework, aiming to leverage the mathematical complementarity of the two algorithms when handling high-dimensional data. The role of PCA is to address the common issue of strong correlation (multicollinearity) between energy indicators through orthogonal transformation, converting the original indicators with redundant information into mutually independent composite components, thereby extracting objective weight vectors. Subsequently, the TOPSIS method uses these weights to calculate the Euclidean distance between each province and the optimal and worst ideal solutions. This combination not only eliminates evaluation bias caused by indicator overlap but also enables the final closeness index to quantify the actual gap between regions and the ideal transformation state, enhancing the statistical robustness of the evaluation results.
To ensure the transparency of the evaluation process, the computational workflow is standardized as follows:
Step 1: Normalize raw panel data using Z-score standardization.
Step 2: Conduct PCA on the correlation matrix to derive objective weights based on variance contribution.
Step 3: Construct the weighted decision matrix V and identify the positive () and negative () ideal solutions.
Step 4: Calculate the Euclidean distances ( and ) for each province.
Step 5: Calculate the relative proximity (, Equation (12)) to determine provincial rankings.
The specific calculation formula is as follows:
(1) Weighted Decision Matrix Construction: The standardized data are weighted using the weights determined by PCA:
(2) Determining Ideal Solutions: The optimal and worst vectors are defined based on the indicator properties (benefit-oriented or cost-oriented):
Positive Ideal Solution
:
Negative Ideal Solution
:
(3) The Euclidean distance of the i-th province to the positive and negative ideal solutions:
(4) Relative proximity calculation:
A larger indicates that the province is farther from the negative ideal solution and closer to the positive ideal solution, representing a higher level of high-quality energy development.
3.5. Robustness and Sensitivity Analysis
To overcome the limitations of single methods, the PCA-TOPSIS framework employed in this study possesses intrinsic robustness. PCA reduces the interference of random errors and multicollinearity on weights through dimensionality reduction, while the TOPSIS method is insensitive to sample size variations and fully utilizes original data information. Furthermore, through Z-score standardization, the model maintains robustness against outliers.
To verify the robustness of the PCA method for evaluating provincial high-quality energy development, three eigenvalue thresholds (lambda > 0.8, lambda > 1.0, and lambda > 1.2) were tested. The number of extracted principal components under these thresholds was 8, 6, and 5, with cumulative variance contributions of 83.83%, 76.26%, and 71.63%, respectively, all indicating strong explanatory power. Notably, the top five provinces in the comprehensive rankings remained identical across thresholds, demonstrating that the evaluation results are stable and confirming the high robustness and reliability of PCA.
4. Research Findings
4.1. Validity of PCA Results
PCA was conducted on 24 indicators that reflect the coordinated development of the regional economy and environment in Guizhou Province. The KMO test, combined with Bartlett’s sphericity test, validated the suitability of the data for PCA, with results presented in
Table 2. The overall KMO value was 0.6951, indicating basic suitability for PCA. Bartlett’s sphericity test yielded a
p-value of 0.00 < 0.05, leading to rejection of the null hypothesis. This confirms significant correlations among the indicators, confirming the applicability of PCA for analyzing this indicator system.
The results show that the cumulative variance explained by the top seven principal components reached 80.12%, exceeding the industry-standard threshold of 80%. This indicates that these seven principal components effectively capture the core information from the original 24 indicators. The first principal component exhibits the highest loadings on R&D intensity (0.907), patents per capita (0.821), and trade dependence ratio (0.823), reflecting the dimension of “technology innovation and openness-driven development.” The second principal component is dominated by per capita energy consumption (0.852) and energy intensity (0.785), reflecting the characteristic of “energy consumption scale.” The third principal component highlights the correlation between equipment utilization hours (0.705) and energy self-sufficiency rate (−0.530), representing “system operation and supply security.” The fourth principal component links primary energy growth with carbon emission ratios, pointing to “production expansion and carbon control coordination.” The fifth to seventh components, respectively, capture information on urban ecological construction and investment, energy consumption elasticity, and structural policy responses. Overall, the development of regional energy–environment–economy systems is shaped by multiple interrelated dimensions, including technological capacity, consumption patterns, supply efficiency, carbon emission management, ecological construction, and policy regulation.
4.2. Robustness Analysis
To verify the reliability of the evaluation results and address the potential sensitivity of the model to parameter selection, a rigorous robustness and sensitivity analysis was conducted. We systematically varied the principal component extraction criteria by setting three distinct eigenvalue thresholds (λ > 0.8, λ > 1.0, and λ > 1.2). As shown in
Table 3, although the number of extracted principal components was adjusted from 8 to 5, the cumulative variance contribution rates consistently remained above 70% (83.83%, 76.26%, and 71.63%, respectively), ensuring that the core information of the original indicator system was sufficiently captured. Critically, the sensitivity test revealed that the comprehensive rankings of the top five provinces remained perfectly consistent across all threshold scenarios. This high degree of stability indicates that the assessment framework is insensitive to variations in the component extraction process. These findings provide empirical evidence that the PCA-based model is both robust and reliable, ensuring that the policy implications derived for provincial-level energy high-quality development are not artifacts of specific mathematical configurations.
4.3. Evaluation of the Indicator System
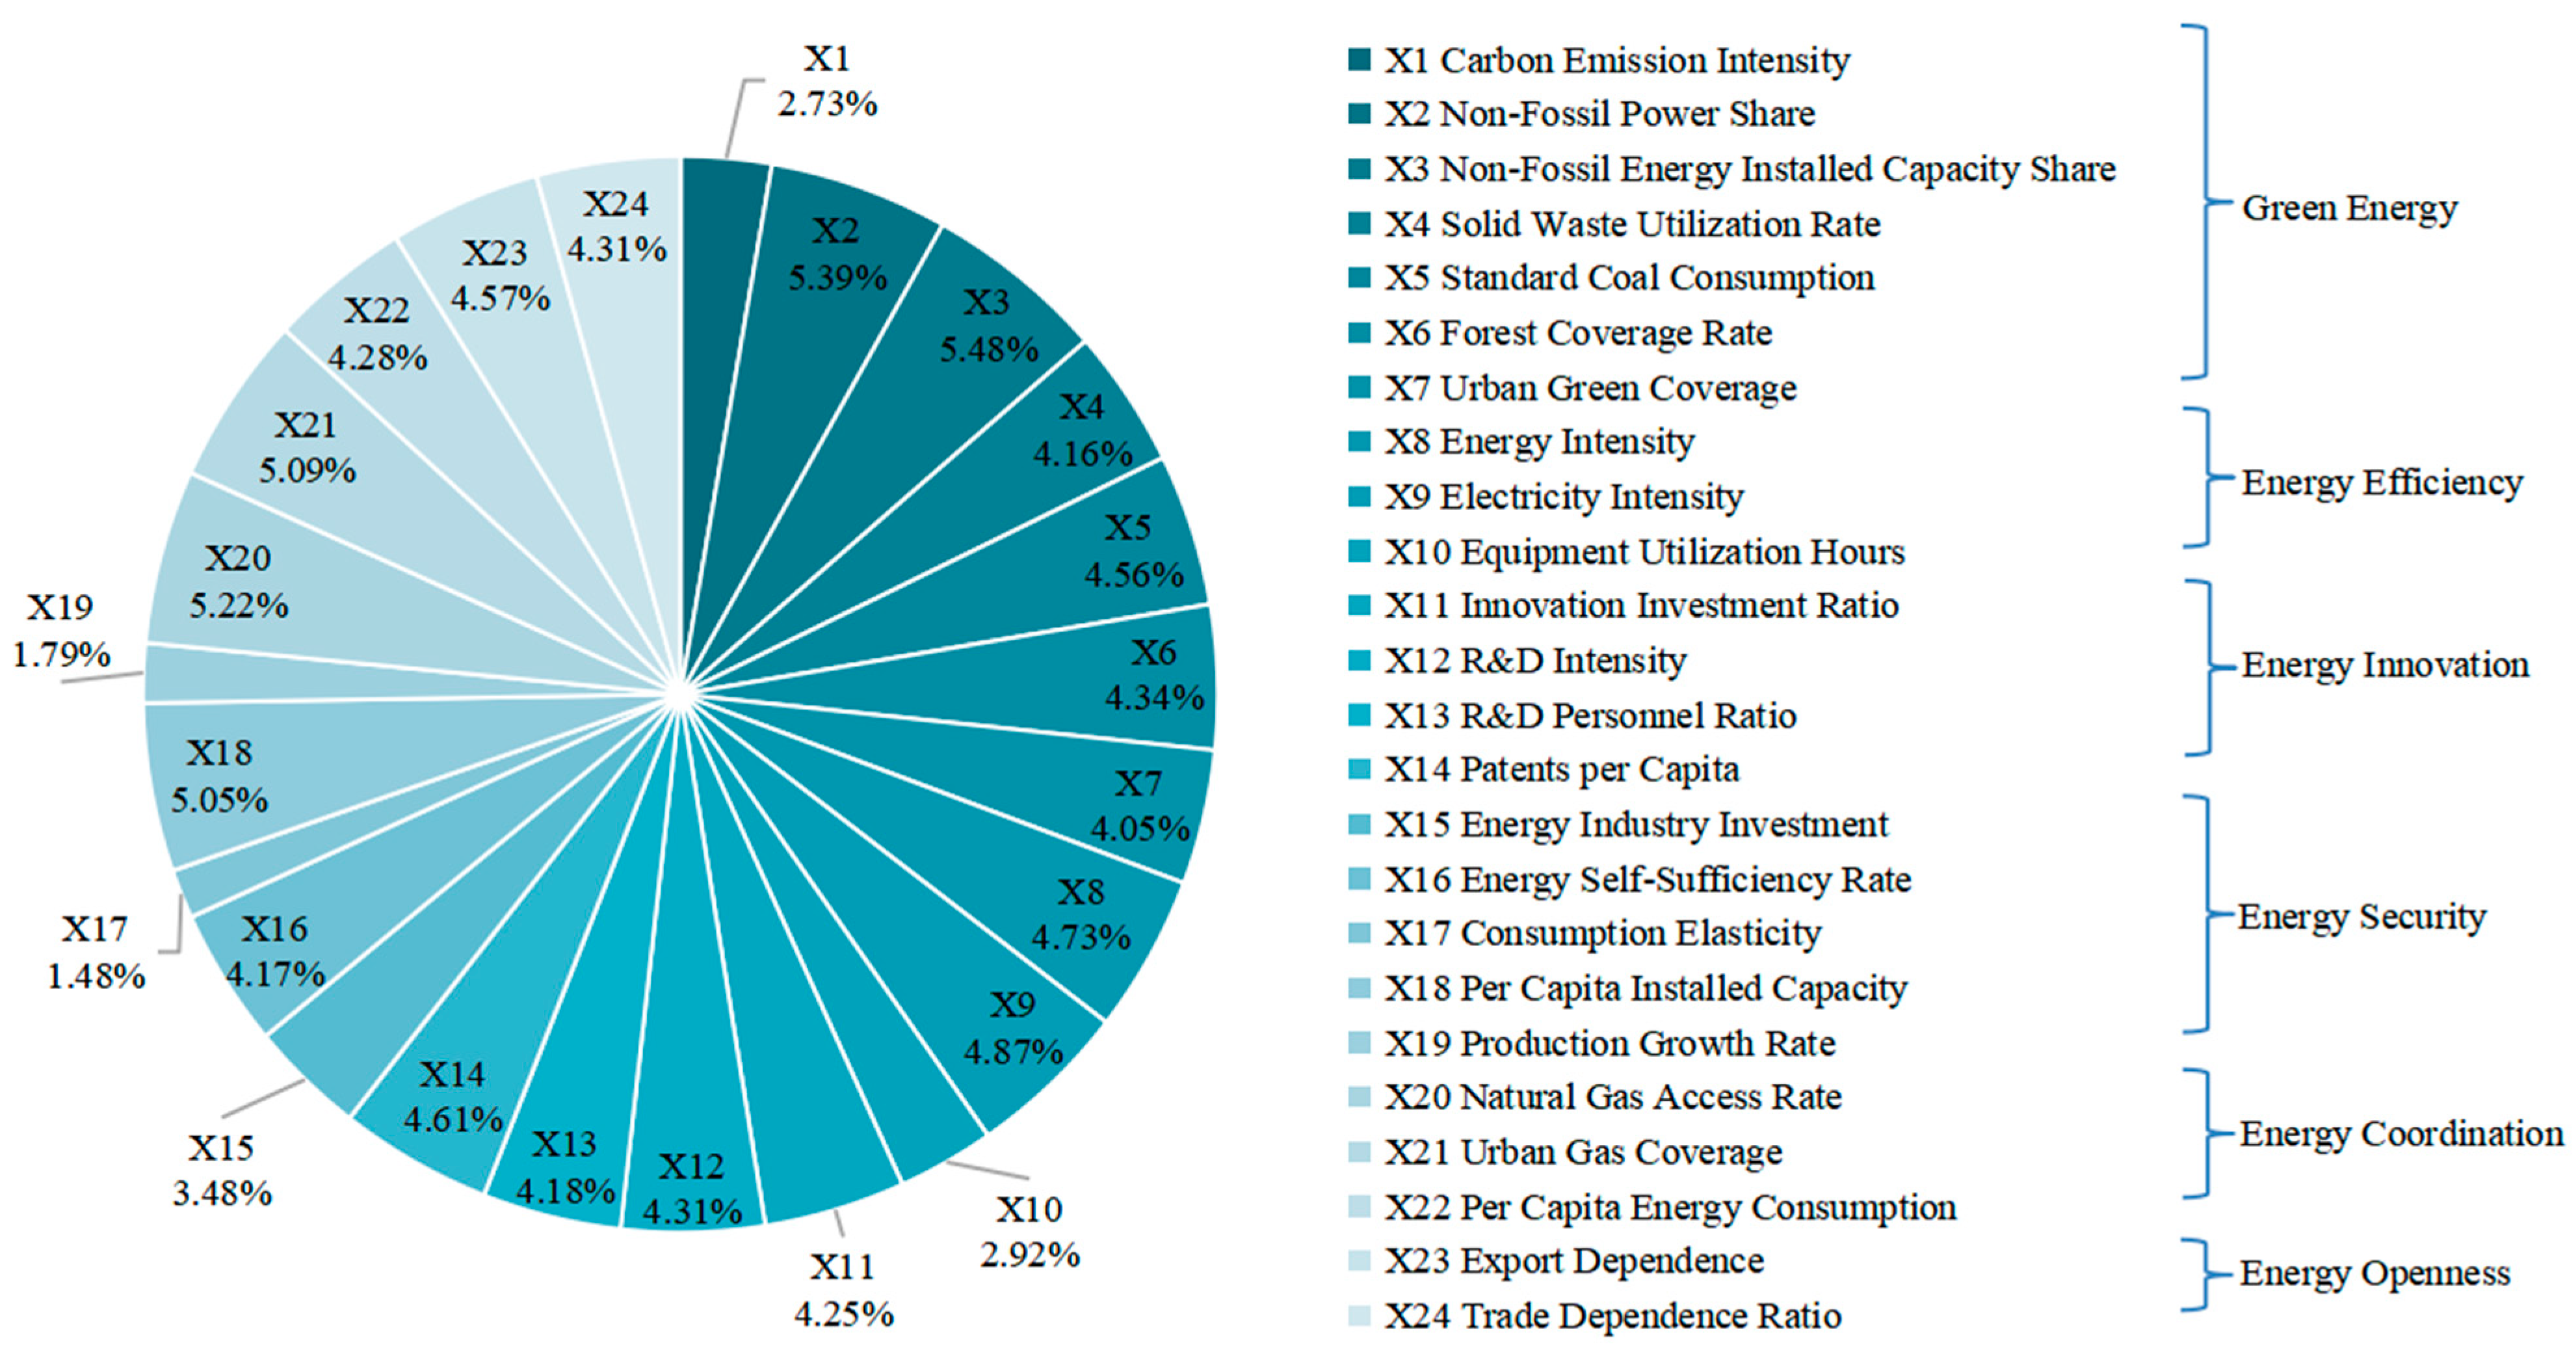
Based on the PCA framework, the weights for 24 specific indicators were derived from their factor loadings and the variance contribution rates of the principal components (as shown in
Figure 2). Rather than merely representing static “importance,” these weights reflect the information load and the degree of spatial differentiation that each indicator contributes to the comprehensive evaluation of energy development. Among the primary dimensions, Green Energy (30.70%) exhibits the highest explanatory power for the variance in regional development levels. This suggests that the “low-carbon transition” is currently the most significant factor driving the divergence in energy quality across different provinces, echoing the strategic shift under China’s “Dual Carbon” goals. Following this, Energy Innovation (17.34%) and Energy Security (15.96%) act as the core internal drivers and essential boundary conditions, respectively. The high weighting of innovation indicates that technological advancement has transitioned from a supplementary factor to a primary determinant of regional competitive advantage in the energy sector.
Within the green energy dimension, non-fossil energy installed capacity share and non-fossil power share carry the highest weightings (5.48% and 5.39%, respectively), highlighting that scale expansion remains the most direct metric for measuring the current green transition. In contrast, total energy consumption and carbon emission intensity carry relatively low weight (2.73%), potentially indicating that the current evaluation system remains focused on supply-side substitution benefits. The synergistic management of demand-side energy conservation and carbon emissions has yet to be fully reflected in the indicator weighting. This structure aligns with the current status of the national carbon market, which remains limited to power generation, steel, cement, and aluminum smelting, and has not yet comprehensively covered end-use energy sectors [
40].
In the energy innovation dimension, patents per capita (4.61%) and R&D intensity (4.31%) carry significant weight, providing empirical evidence that technological leadership is now a primary determinant of regional energy disparities. The high prioritization of these metrics reflects the intensive patenting activity and capital allocation in frontier fields such as long-duration energy storage, green hydrogen electrolysis, and Carbon Capture, Utilization, and Sequestration (CCUS). Specifically, the weighting of innovation indicators is corroborated by the rapid industrial scaling of these technologies: according to the Special Action Plan for Scaling Up New Energy Storage (2025–2027), China’s installed capacity is projected to exceed 100 GW by 2027, a transition heavily reliant on the commercialization of R&D-stage battery chemistries and thermal storage patents [
41]. Similarly, the expansion of hydrogen demonstration projects across 30 provinces [
42] is not merely a policy phenomenon but a result of localized technological breakthroughs in fuel cell stacks and high-pressure storage systems, which are captured by our patent-based metrics. Consequently, the prominent weighting of innovation indicators confirms that resolving “bottleneck” constraints—such as system flexibility and intermittency—is no longer a theoretical goal but a quantified core driver of high-quality energy development in the evaluation framework.
In the energy innovation dimension, the patents per capita (4.61%) and R&D intensity (4.31%) carry significant weight, indicating that technological innovation capacity has become a key indicator for measuring energy development. These metrics are particularly relevant to critical technological fields such as energy storage, hydrogen energy, and CCUS. According to the latest national deployment, the “Special Action Plan for Scaling Up New Energy Storage (2025–2027)” projects that China’s newly installed capacity will exceed 100 gigawatts within three years. Meanwhile, hydrogen energy demonstration projects have advanced in over 30 provinces nationwide [
42]. The prominent weighting of patents confirms, at the evaluation system level, that innovation-driven development is regarded as the core approach to resolving bottlenecks in new energy integration and system flexibility.
In the energy security dimension, per capita installed capacity (5.05%) and energy self-sufficiency rate (4.17%) carry relatively high weights, aligning with China’s strategic orientation of “relying on domestic resources to ensure supply security.” Notably, the weight assigned to consumption elasticity is relatively low (1.48%). This may be closely related to economic structural transformation: as the share of the tertiary sector increases (reaching 56% in 2023 [
43]), economic growth has become less reliant on traditional energy consumption. Energy consumption now exhibits a “weak coupling” characteristic with GDP growth; a structural shift reflected in the indicator weighting [
44].
The weighting differences among indicators in the energy coordination dimension are not significant. Natural gas access rate (X20, 5.22%) serves as a key indicator for low-carbon transformation of provincial energy structures; urban gas coverage (X21, 5.09%) reflects the “residential-end sense of fulfillment” in energy development transformation; per capita energy consumption (X22, 4.28%) serves as a crucial basis for assessing whether energy consumption supports economic growth and safeguards energy access for basic living needs. Collectively, these three indicators demonstrate that provincial-level energy development in China should pursue a synergistic trajectory of “clean terminal energy-universal access to energy for basic living needs-rationalization of consumption scale.”
The energy openness dimension carries the lowest overall weight (8.88%), potentially reflecting that internationalization indicators hold lower priority than domestic transformation and security issues within provincial energy evaluation systems. Among these, the export dependence (X23) can be regarded as an indirect measure of the energy sector’s international competitiveness, while the trade dependence ratio (X24) relates to the external dependence of energy trade. The weight distribution indicates that provincial energy development evaluations continue to prioritize internal structural adjustments and security safeguards, while considerations of integration into international markets and risk exposure remain relatively limited.
4.4. Spatio-Temporal Analysis of High-Quality Development in District Energy Systems
Employing the PCA-TOPSIS methodology [
45], this study assessed the level of high-quality energy development across 30 provinces of China (excluding Hong Kong, Macao, Taiwan, and Tibet) from 2011 to 2022. The results are presented in
Table 4.
Table 4 indicates that the four provinces with the highest comprehensive scores for high-quality energy development are, in descending order: Beijing (0.5475, 95% Bootstrap confidence interval [0.5380, 0.5571]), Guangdong (0.5239, 95% Bootstrap confidence interval [0.5175, 0.5305]), Zhejiang (0.5080, 95% Bootstrap confidence interval [0.4999, 0.5178]), and Shanghai (0.5017, 95% Bootstrap confidence interval [0.4960, 0.5065]), all situated in the eastern region. The overall average score for the eastern region (0.4623) was significantly higher than that of the central (0.3824) and western (0.4025) regions. Furthermore, the 95% Bootstrap confidence intervals indicate that the score ranges for the core eastern provinces shifted upwards overall and did not overlap with those of the central and western provinces, reflecting pronounced regional agglomeration advantages and score stability. These provinces leverage their coastal location advantages, robust economic foundations, dynamic technological innovation, and coordinated industrial structures to strongly underpin the comprehensive performance of their energy systems in terms of efficiency, cleanliness, and sustainability [
16].
In stark contrast to the leading position of eastern regions, provinces exhibiting relatively lower levels of high-quality energy development include Inner Mongolia (0.3438, 95% Bootstrap confidence interval [0.3370, 0.3516]), Shanxi (0.3530, 95% Bootstrap confidence interval [0.3456, 0.3588]), Henan (0.3550, 95% Bootstrap confidence interval [0.3452, 0.3654]), and Guizhou (0.3567, 95% Bootstrap confidence interval [0.3501, 0.3635]), predominantly located in the central and western regions. Most of these provinces are inland regions where energy structures rely heavily on traditional fossil fuels such as coal. They face significant pressures for economic transformation, with relatively lagging development in clean energy infrastructure and the adoption of energy technologies. Concurrently, complex topography and fragile ecosystems in certain areas further constrain the optimization of energy facility layouts and energy consumption structures, thereby delaying the progress of high-quality energy development.
From a regional perspective, the eastern region holds a leading position in the high-quality energy transition, leveraging its dual advantages in economy and technology. While the average score of the western region slightly exceeds that of the central region, significant internal disparities exist. Provinces such as Sichuan and Qinghai demonstrate strong performance due to their clean energy endowments, whereas others still face challenges such as high energy dependency and inadequate clean energy adoption. The central region recorded the lowest overall score and faces the most pressing transformation pressures. Beyond lagging industrial upgrading and sluggish energy structure adjustments, it grapples with pronounced structural and institutional barriers. Structurally, heavy industrialization has led to path dependence, with energy supply heavily reliant on coal and scaled clean energy substitution remaining limited. The outflow of high-quality resources constrains endogenous transformation momentum. Institutionally, multiple barriers are interwoven, including insufficient regional policy coordination, incomplete market mechanisms, assessment systems that are overly focused on traditional economic indicators, and a lack of ecological compensation mechanisms. The targeted removal of these obstacles is essential to advancing high-quality energy transformation.
Overall, China’s provincial-level energy development exhibits pronounced regional disparities in quality, manifesting as a spatial pattern where the eastern regions lead, the western regions follow, and the central regions lag behind. The issue of regional development imbalance remains pronounced. Moving forward, it will be necessary to implement differentiated and coordinated energy transition pathways tailored to each region’s resource endowments and developmental stage [
46]. Particular attention must be paid to addressing the structural and institutional challenges in the central regions. This requires a multi-pronged approach encompassing industrial restructuring, institutional innovation, and policy optimization to enhance the quality and efficiency of regional energy transitions.
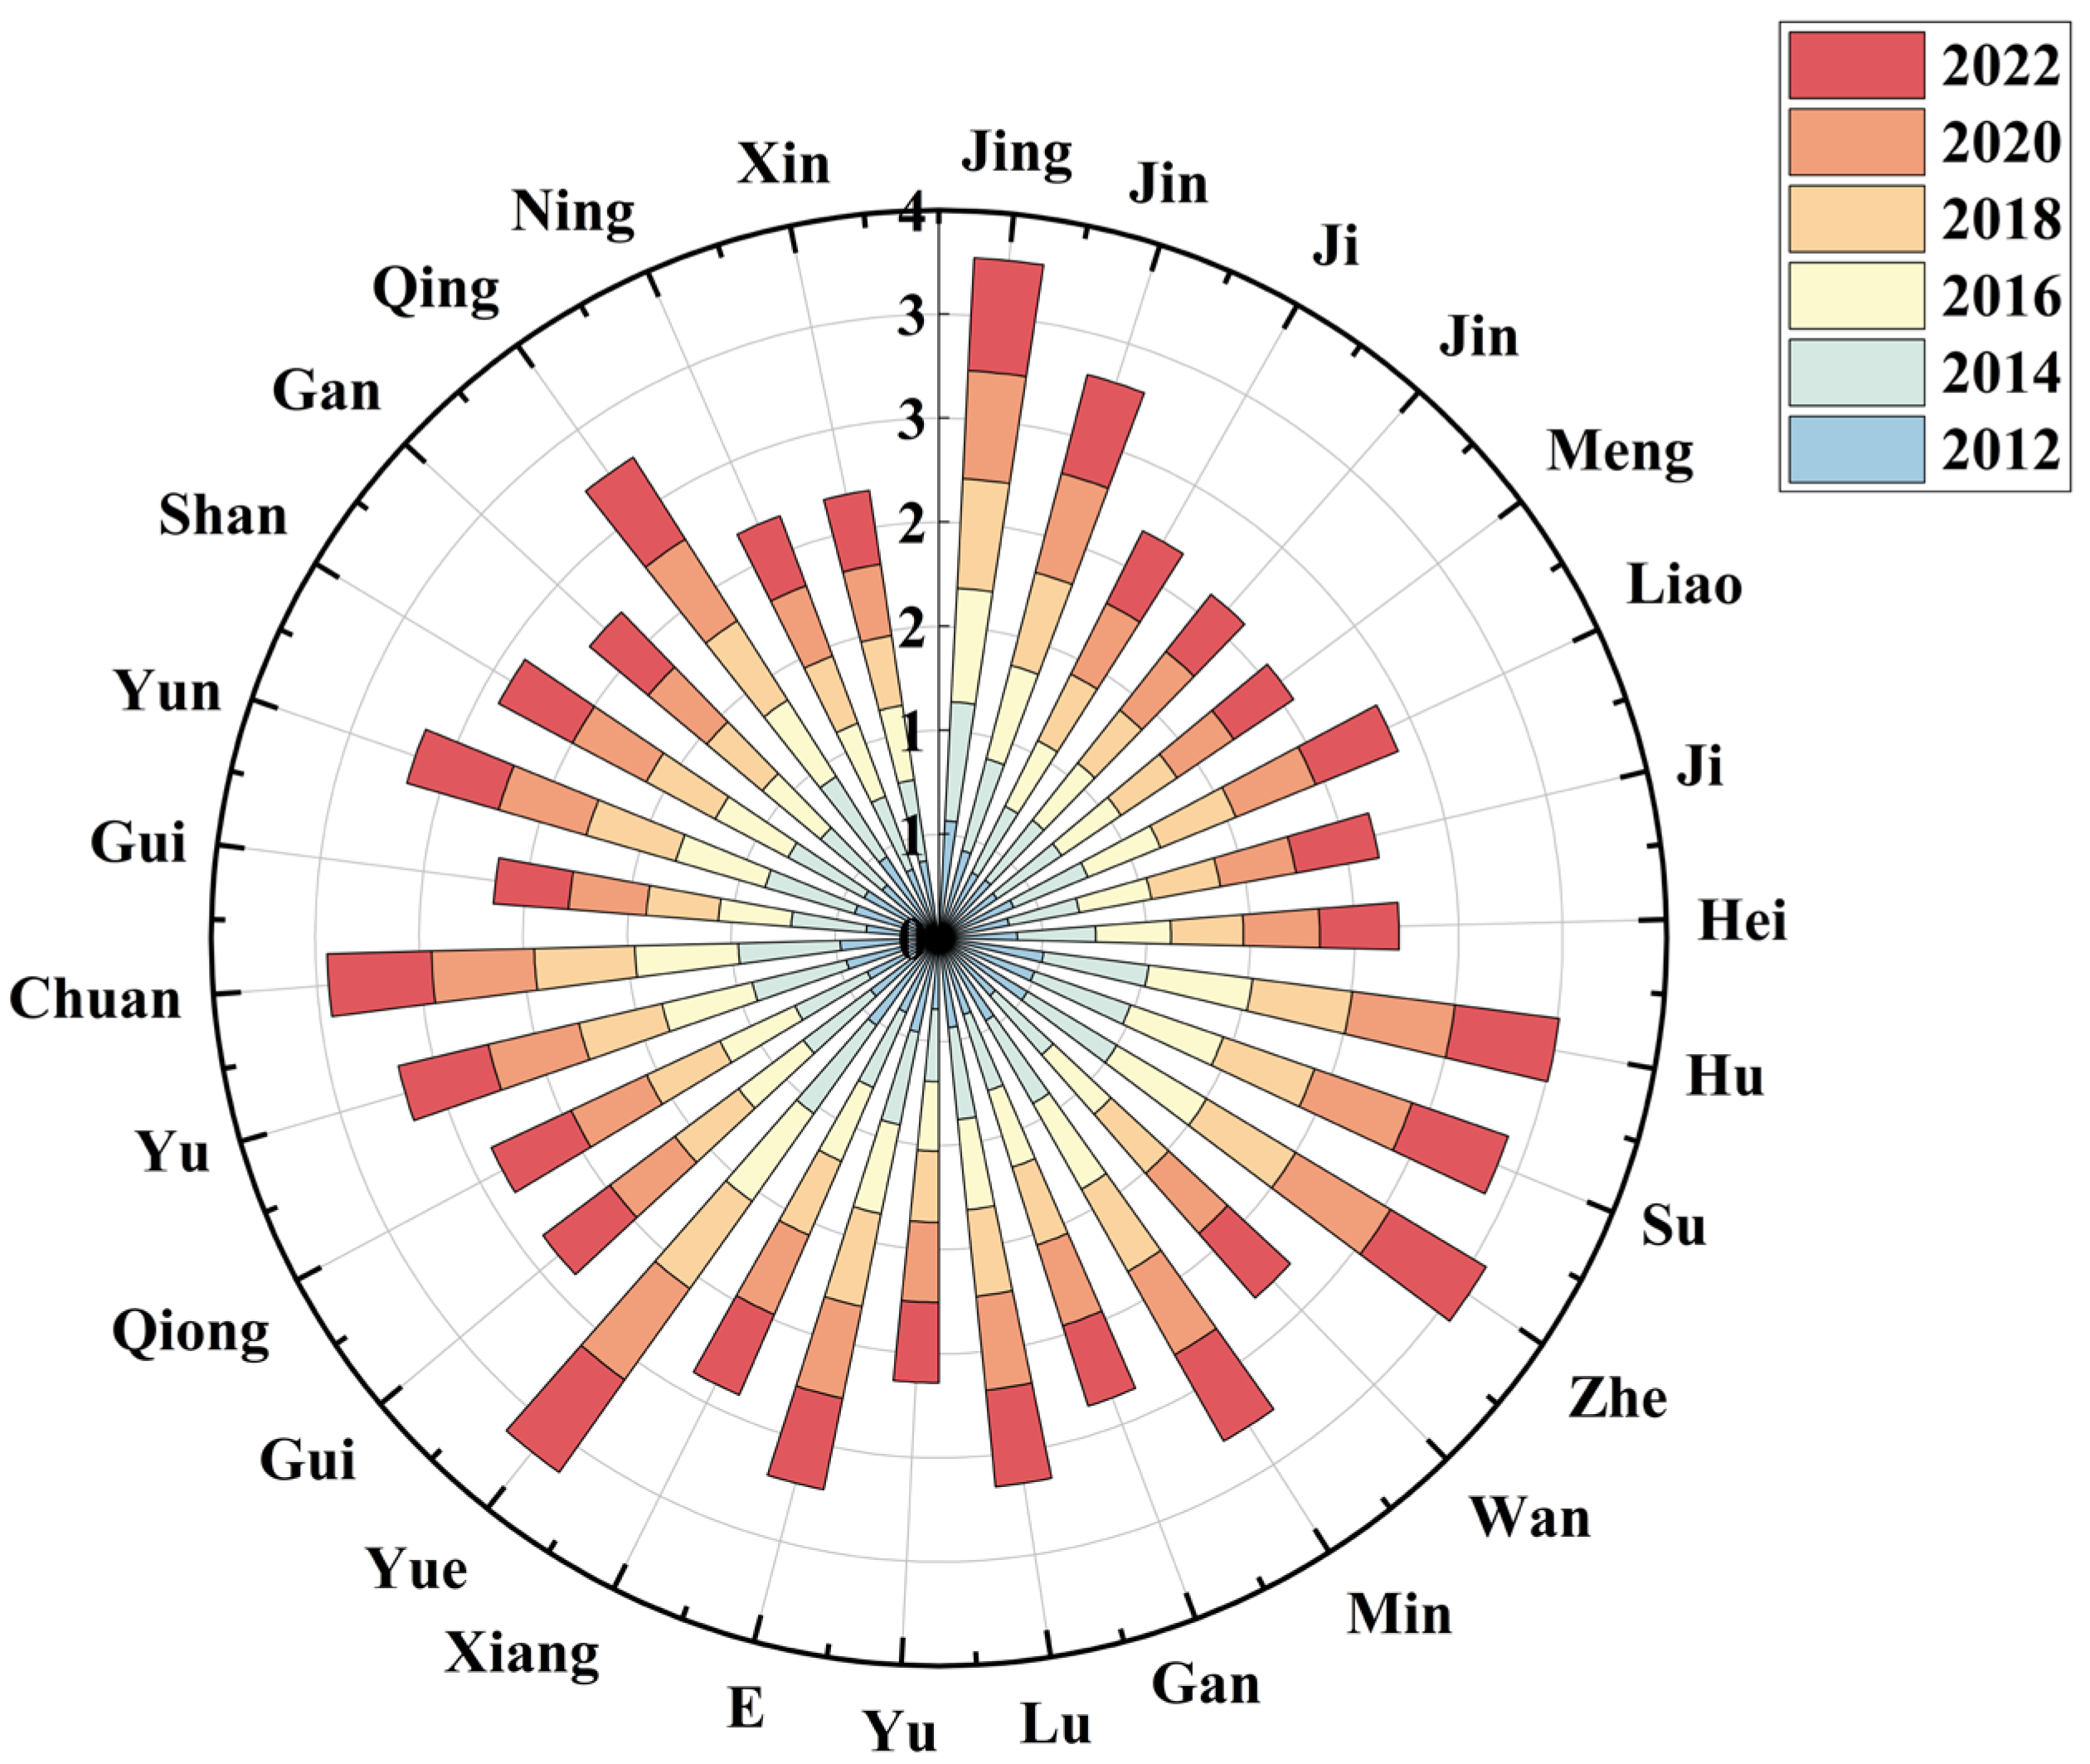
Additionally, we have produced spatiotemporal distribution radar charts illustrating the levels of high-quality energy development across China’s provincial regions for the years 2012, 2014, 2016, 2018, 2020, and 2022. As illustrated in
Figure 3, a pronounced gradient diminishing trend emerges from eastern coastal provinces to central and western inland provinces: color blocks representing indicators for eastern coastal provinces, such as Beijing and Guangdong, consistently expand towards higher scale regions, whilst color blocks for central and western inland provinces including Inner Mongolia and Guizhou remain concentrated within the medium-to-low scale range. This pattern aligns closely with the regional disparity characteristics observed in earlier ranking assessments.
Specifically, although eastern coastal provinces possess relatively limited energy resources, they have leveraged their advantageous transport networks to facilitate the efficient circulation of energy technologies and equipment. Coupled with robust energy infrastructure, ample talent reserves, and deeply ingrained green development principles, these factors—supported by a solid economic foundation that underpins technological innovation—have enabled them to consistently lead in achieving high-quality energy development. In contrast, inland provinces in central and western China, despite possessing relatively abundant energy production, face constraints in the circulation of high-end factors due to geographical limitations. The promotion of energy conservation and carbon reduction concepts remains insufficient, and their economic foundations provide relatively weaker support for energy transition, resulting in a slower pace of advancement in high-quality energy development [
47].
Another noteworthy feature is that the color blocks representing high-quality energy development in all provinces show an outward expansion trend: In 2012 (light blue), the blocks were predominantly clustered near the ‘1’ mark, whereas by 2022 (red), they generally extended beyond the ‘2’ mark, with some leading provinces approaching the ‘4’ mark. This clearly demonstrates the effectiveness of energy transition policies implemented over the past decade, with nationwide policy guidance providing favorable conditions for the sustained advancement of high-quality energy development across all provinces.
5. Conclusions and Implications
To effectively observe the energy development status across China’s provinces, this study employs a coupled approach of PCA and TOPSIS. It constructs a provincial-level evaluation framework for high-quality energy development, encompassing six dimensions: green energy, energy innovation, energy security, energy efficiency, energy coordination, and energy openness. This framework quantitatively assesses and conducts spatiotemporal analyses of energy development levels across 30 provincial-level administrative regions of China (excluding Tibet, Hong Kong, Macao, and Taiwan) from 2011 to 2022. systematically revealing the driving logic, regional differentiation, and evolutionary characteristics of provincial-level high-quality energy development.
5.1. Conclusions
China’s provincial-level energy high-quality development exhibits a pronounced spatial disparity characterized by ‘higher levels in the east, lower levels in the west, and a dip in the central regions’. Eastern regions (average score 0.4623), leveraging dual advantages in economic strength and innovation, demonstrate comprehensive leadership in green energy development, technological innovation, and energy system coordination. Western regions (average score 0.4025) exhibit considerable internal variation. Provinces with prominent clean energy endowments, such as Sichuan and Qinghai, demonstrate relatively strong performance, whereas traditional energy-dependent provinces like Inner Mongolia and Guizhou remain at persistently low development levels due to rigid industrial structures and delayed clean energy transitions. The central region (average score 0.3824), representing the weakest link in the nation’s high-quality energy development, faces the most pronounced transformation pressures. This stems from multiple structural and institutional barriers, including heavy industrialization, high-carbon lock-ins within its energy mix, and insufficient policy coordination.
5.2. Policy Implications Based on an Indicator System
Drawing upon the empirical findings from PCA-TOPSIS evaluation (which revealed a distinct spatial pattern of ‘high in the east, low in the west, and moderate in the center’) and the objective weightings of the 24 indicators, this study proposes differentiated policy pathways. These strategies aim to align provincial actions with specific indicators identified as key drivers of high-quality energy development.
Firstly, for the leading eastern regions, policies should focus on consolidating their advantages, prioritizing the indicators with the highest weights in the system: green energy supply and innovation. Given the highest weighting within the green energy dimension (30.70%), where non-fossil energy installed capacity (5.48%) and non-fossil energy generation share (5.39%) are the most heavily weighted individual indicators, the East must prioritize the development of offshore wind power and distributed photovoltaic power generation. Furthermore, to fully leverage the region’s strengths in patents per capita (4.61% weighting) and R&D intensity (4.31% weighting), policy incentives should shift from general subsidies towards targeted support for the industrialization of ‘hard technologies’ such as energy storage and hydrogen. This strategy capitalizes on the region’s high scores in innovation investment, directly addressing renewable energy grid integration bottlenecks to consolidate its leading position in the comprehensive evaluation.
Secondly, the Central Catch-up Zone must overcome structural bottlenecks causing its ‘valuation trough’ (average score 0.3824). Assessment reveals the region is primarily constrained by path dependency in high-carbon industries, reflected in low scores for carbon intensity and energy intensity. To address these specific shortcomings, establishing a dedicated fund for low-carbon transformation in the steel and chemical sectors is recommended. Moreover, accelerating integration into the national carbon market is crucial to address weaknesses in energy openness and market mechanisms. Advancing energy usage rights trading will introduce price signals to optimize the energy mix, thereby enhancing energy consumption elasticity (weighting 1.48%) and mitigating the negative impacts of high carbon dependency.
Thirdly, Western Special Development Zones require a dual-track strategy to accommodate significant internal variations in resource endowments. For provinces like Sichuan and Qinghai, rich in clean energy resources, policies should focus on leveraging their comparative advantages in energy self-sufficiency rate (weighting 4.17%) and per capita installed capacity (weighting 5.05%). Developing integrated wind–solar–hydro-storage bases will enhance system operational efficiency, directly boosting their already high scores in the energy security dimension. Conversely, resource-dependent provinces like Inner Mongolia and Guizhou, hampered by ecological indicators, must redirect policy emphasis towards forest coverage (4.34% weighting) and urban green space coverage (4.05% weighting). Exploring models such as ‘photovoltaics plus ecological restoration’ would enable these regions to concurrently elevate their green energy and ecological improvement scores.
Finally, to narrow the significant score gap between eastern regions (e.g., Beijing, scoring 0.5475) and lagging central-western provinces, establishing inter-provincial coordination mechanisms is imperative. A national energy transition platform should be created to facilitate the transfer of eastern technological advantages—addressing western regions’ low innovation investment rates (weighted at 4.25%)—in exchange for clean energy supply from the west. Furthermore, it is recommended to implement cross-provincial green power trading and ecological compensation mechanisms to mitigate transition costs in central and western regions. These mechanisms aim to enhance scores in energy coordination indicators such as per capita energy consumption (weighted at 4.28%), thereby fostering a more balanced and synergistic national energy landscape.
5.3. Research Limitations and Future Prospects
Future research can be advanced from two perspectives: data and research scale. At the data and indicator level, integrating multi-source data and incorporating emerging indicators such as energy digitalization, energy storage, and social equity, as well as expanding the coverage of provincial samples, can help build an evaluation framework more closely aligned with the dual-carbon goals. At the scale and perspective level, extending analysis to the city and county levels can reveal intra-provincial disparities, while international comparisons and strengthened policy evaluation can help identify key driving mechanisms. In addition, multi-scenario forecasting models can be used to simulate the evolution of provincial energy systems toward carbon peaking and carbon neutrality under different pathways, thereby enhancing policy foresight. Given the current limitations related to data definitions, timeliness, sample, and indicator coverage, and the constraints of province-level macro analysis, these extensions would contribute to improving a high-quality development evaluation framework aligned with the dual-carbon objectives.