


Abstract
Renewable Energy Communities (RECs) represent a key instrument for enabling decentralized energy systems and enhancing local renewable energy utilization. Preliminary assessment of REC performance relies on simulation tools that differ in computational complexity, assumptions, and input data. Despite the growing literature, a systematic comparison of tools applied to identical community configurations is still missing. This study provides a systematic cross-comparison of four tools representing different modelling paradigms: a VBA-based prefeasibility model (MERCm), a MATLAB-based detailed framework (UNIPGm), a national open-access simulator (RECON), and a commercial platform (COMMm). The tools were applied to six residential configurations in three Italian provinces representing different solar irradiation levels. Scenarios are defined to ensure high energy sharing potential, considering a ratio of shared energy to energy fed into the grid above 60%. Key performance indicators, including physical self-consumption and shared energy, are analyzed. Results show broadly consistent trends across tools, although these findings refer to PV-only, residential RECs and may differ in more complex community configurations, with coefficients of variation below 15% for most relevant indicators, particularly shared energy, while confirming that differences in input data and modelling assumptions can still influence outcomes. These findings support the reliability of simplified simulation tools for preliminary REC feasibility assessments and provide guidance for policymakers and technical operators.
1. Introduction
1.1. Background Context
In recent years, the efforts of international organizations, such as the European Union, have focused on the transition towards decentralized energy systems and the widespread integration of renewable energy sources in buildings. This shift introduces new challenges for power grids, primarily related to the unpredictability of renewable generation, such as solar and wind, which increases the mismatch between production and energy demand and complicates the maximization of self-consumption [1,2].
In this context, renewable energy communities (RECs) and collective self-consumption schemes (CSCs) have become one of the pillars of the European strategy. First introduced in the Clean Energy Package and subsequently consolidated through the RED II and RED III directives, these configurations aim to enable the virtual sharing of energy produced from renewable sources, facilitate citizens’ access to technological and financial resources, and strengthen the active role of citizens in local energy production, thereby increasing awareness and sense of community [3,4]. The different configurations mainly differ in scale and organizational structure. CSCs refer to energy sharing between at least two actors within the same building, whereas RECs extend this logic to larger areas, up to the primary substation, involving multiple types of actors (citizens, companies, local authorities) and featuring more structured organizational frameworks.
The Italian transposition of the European directive was enacted through Legislative Decree 199/2021, which defines RECs as legal entities based on open and voluntary participation, composed of citizens, Small and Medium Enterprises (SMEs), local authorities, and other stakeholders, united to produce, consume, and share energy from renewable sources. These communities aim to achieve social, environmental, and economic benefits from collective self-consumption and the valorization of local resources. Users within RECs can be classified as consumers, producers, or prosumers (i.e., users who both consume and produce renewable energy). Shared energy is calculated on an hourly basis as the minimum between the energy fed into the grid by renewable installations and the energy withdrawn by users within the same primary substation; in other words, it represents the energy simultaneously produced and consumed by community members [5,6]. This virtual self-consumption is fundamental not only for the energy benefits it provides but also because it determines the basis for economic incentives, which are added to the benefits from self-consumption and the sale of energy fed into the grid, as established by Italian legislation [7].
To maximize the energy and economic benefits derived from shared energy, it is essential to ensure a proper balance between the behaviors of consumers and prosumers, aligning production and consumption with the goal of improving energy self-sufficiency. In this context, public administrations can facilitate the establishment and coordination of RECs, supporting citizens and other local actors in overcoming technical, organizational, and regulatory barriers [8]. Consumers, particularly residential users, play a key role due to their flexibility and ability to shift their loads according to the community’s needs, thereby maximizing economic benefits while having virtuous behaviors, which can be considered during the redistribution of incentives [9,10].
1.2. Simulation Tools and Methodologies for RECs
To assess whether the implementation of a REC represents a viable investment, it is essential to estimate not only the potential energy production and physical self-consumption but also the amount of energy virtually shared among community members. In the literature, models and tools used for such simulations are different and can be categorized based on the treatment of input data, their availability, and the intended purpose of the simulation. Some tools are designed for REC design, aiming to identify the most efficient configuration; others focus on monitoring user behavior to optimize interactions within the community, while others aim at optimizing energy production and consumption flows to maximize both energy and economic outputs [11].
Some tools rely on data collected directly on-site, including hourly consumption, building characteristics, and installed systems and appliances. For example, Blečić et al. [12] and Moretti et al. [13] developed tools for the techno-economic assessment of RECs in Italian municipalities (Cagliari and Assisi, respectively), gathering local data from potential community members with varying levels of detail, including hourly consumption data. However, this data collection process can be limited by citizens’ skepticism towards REC initiatives, which may constitute a barrier for such studies. Moreover, a limited sample size can introduce uncertainties in the results, despite the high granularity of the collected data. Other studies, such as Mazzola et al. [14], simulated the role of RECs in achieving the Sustainable Energy and Climate Action Plan (SECAP) objectives in the city of Villorba (Trieste, Italy), collecting input data locally through technical tools, such as regional technical maps, to characterize existing buildings and estimate their energy consumption. These data enable highly accurate, multi-scenario simulations to evaluate the most efficient configurations; however, they require significant user engagement and/or detailed local data, limiting their applicability in the preliminary design phases of a REC.
Other tools adopt a co-simulation approach, integrating specialized models, such as building or system simulations, to estimate overall consumption and forecast future production. These frameworks, extensively analyzed by Brandi et al. [11], are often implemented in Python and may combine different software for specific functions. For instance, Pizzuti et al. [15] proposed an integrated approach combining tools for energy demand modeling (TRNSYS for thermal energy demand, pymoo for photovoltaic system optimization, and pyRES for simulating energy sharing). Some tools also leverage geospatial analysis, combining georeferenced data with advanced building and energy system simulations (UBEM, QGIS, SimStock, EnergyPlus, MATLAB), allowing the assessment of solar potential and load distribution at urban or district scales [16,17].
For analyses applicable to large areas or heterogeneous groups of buildings and users, tools such as Tools4Cities [18], URBANopt [19], and City Energy Analyst [20] have been developed, which allow the modeling of extensive building stocks without detailed metered data, integrating photovoltaic generation, hourly demand, and post-processing for storage within the same data environment. Open-source tools such as PROCSIM and pyECOM enable multi-source simulations and energy optimization [21,22]. These approaches, while highly powerful, require advanced technical expertise and a deep understanding of the characteristics of the users involved.
In more complex contexts, some tools adopt advanced optimization approaches, based on Mixed Integer Linear Programming (MILP), or stochastic strategies, to evaluate standardized consumption profiles or simulate user behavior scenarios [9,23]. The integration of artificial intelligence algorithms enables the prediction of typical loads and behaviors, supporting optimal decision-making for the configuration and management of RECs [24].
The complexity of advanced tools has motivated the development of simpler tools, accessible also to technical operators and public authorities. For example, Martiniello et al. [25] developed VBA-based tools in Excel designed to perform quick and simple simulations without requiring extensive input data. Similarly, platforms such as RECON [26], developed by ENEA, allow preliminary energy, economic, and financial assessments to be conducted even by non-expert users, using readily available data. In addition to these open-source tools, numerous commercial software solutions offer similar functionalities for the study and design of RECs. The detailed characteristics of these tools will be described more thoroughly in the following sections.
1.3. Aim and Contributions
In the literature, several reviews and comparisons of existing tools are available. For example, Vecchi et al. [27] conducted a review of the main tools available for the simulation of RECs or energy communities in urban contexts, while other studies, such as Brandi et al. [11], have examined co-simulation approaches. However, these works did not systematically analyze how variability in input data can influence results in terms of shared energy, nor did they assess the robustness of the outputs. Despite the extensive literature, a systematic cross-comparison of simulation tools applied to identical REC configurations is still lacking. The existing studies typically rely on a single modeling approach, often custom-built for specific case studies or embedded in proprietary software. Consequently, prefeasibility studies carried out by different stakeholders (public administrations, energy agencies, consultants, or researchers) may produce divergent results solely due to differences in tool structure, temporal resolution, or internal assumptions related to photovoltaic modeling, load profiles, or energy-sharing rules. This issue is particularly relevant in residential communities with high sharing potential, where small variations in modeling parameters can lead to significant differences in estimated shared energy, self-consumption, and overall techno-economic performance.
To address this gap, the present study performs a comparative multi-scenario analysis of four simulation tools with distinct modelling paradigms:
- MERCm, a VBA-based prefeasibility model widely used by Italian public authorities;
- UNIPGm, a MATLAB-implemented framework using hourly balances and detailed PV-load interactions;
- RECON (Version 2.2), an open-access national REC simulator developed for policy and planning;
- COMMm, a commercial tool adopted in professional feasibility studies and engineering practice.
These tools are applied to six residential REC configurations powered exclusively by photovoltaic systems, located in three Italian provinces (Trento, Perugia, and Siracusa), representing progressively higher levels of solar irradiation and therefore different energy-sharing potentials. Italy represents a particularly relevant context for this analysis, as it is among the European countries that implemented an operational regulatory framework for RECs, characterized by incentive mechanisms linked to hourly shared electricity. Following the implementation of this regulatory mechanism, the country has experienced a significant expansion of REC initiatives, making it a mature and structured environment for assessing simulation tools used in prefeasibility analyses. Key performance indicators such as physical self-consumption and shared energy are evaluated to assess the degree to which modelling choices influence the representation of REC performance.
The findings provide quantitative evidence of how different simulation tools can produce varying outcomes even when applied to identical community configurations. By identifying the underlying causes of these discrepancies, whether related to photovoltaic modelling, load aggregation, or the implementation of energy-sharing algorithms, this work contributes to improving transparency, standardization, and robustness in REC prefeasibility analyses. The results are intended to support researchers, policymakers, and practitioners involved in the design and evaluation of renewable energy communities, ultimately contributing to more reliable and comparable planning methodologies.
2. Materials and Methods
2.1. Computational Tools
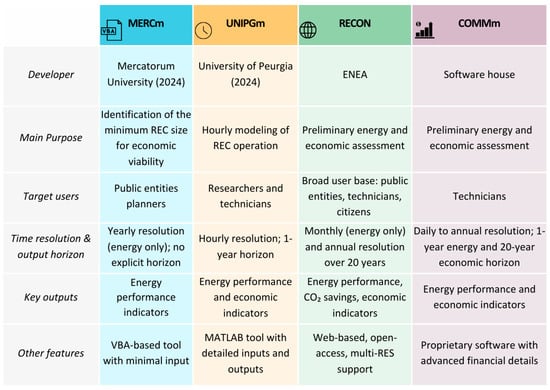
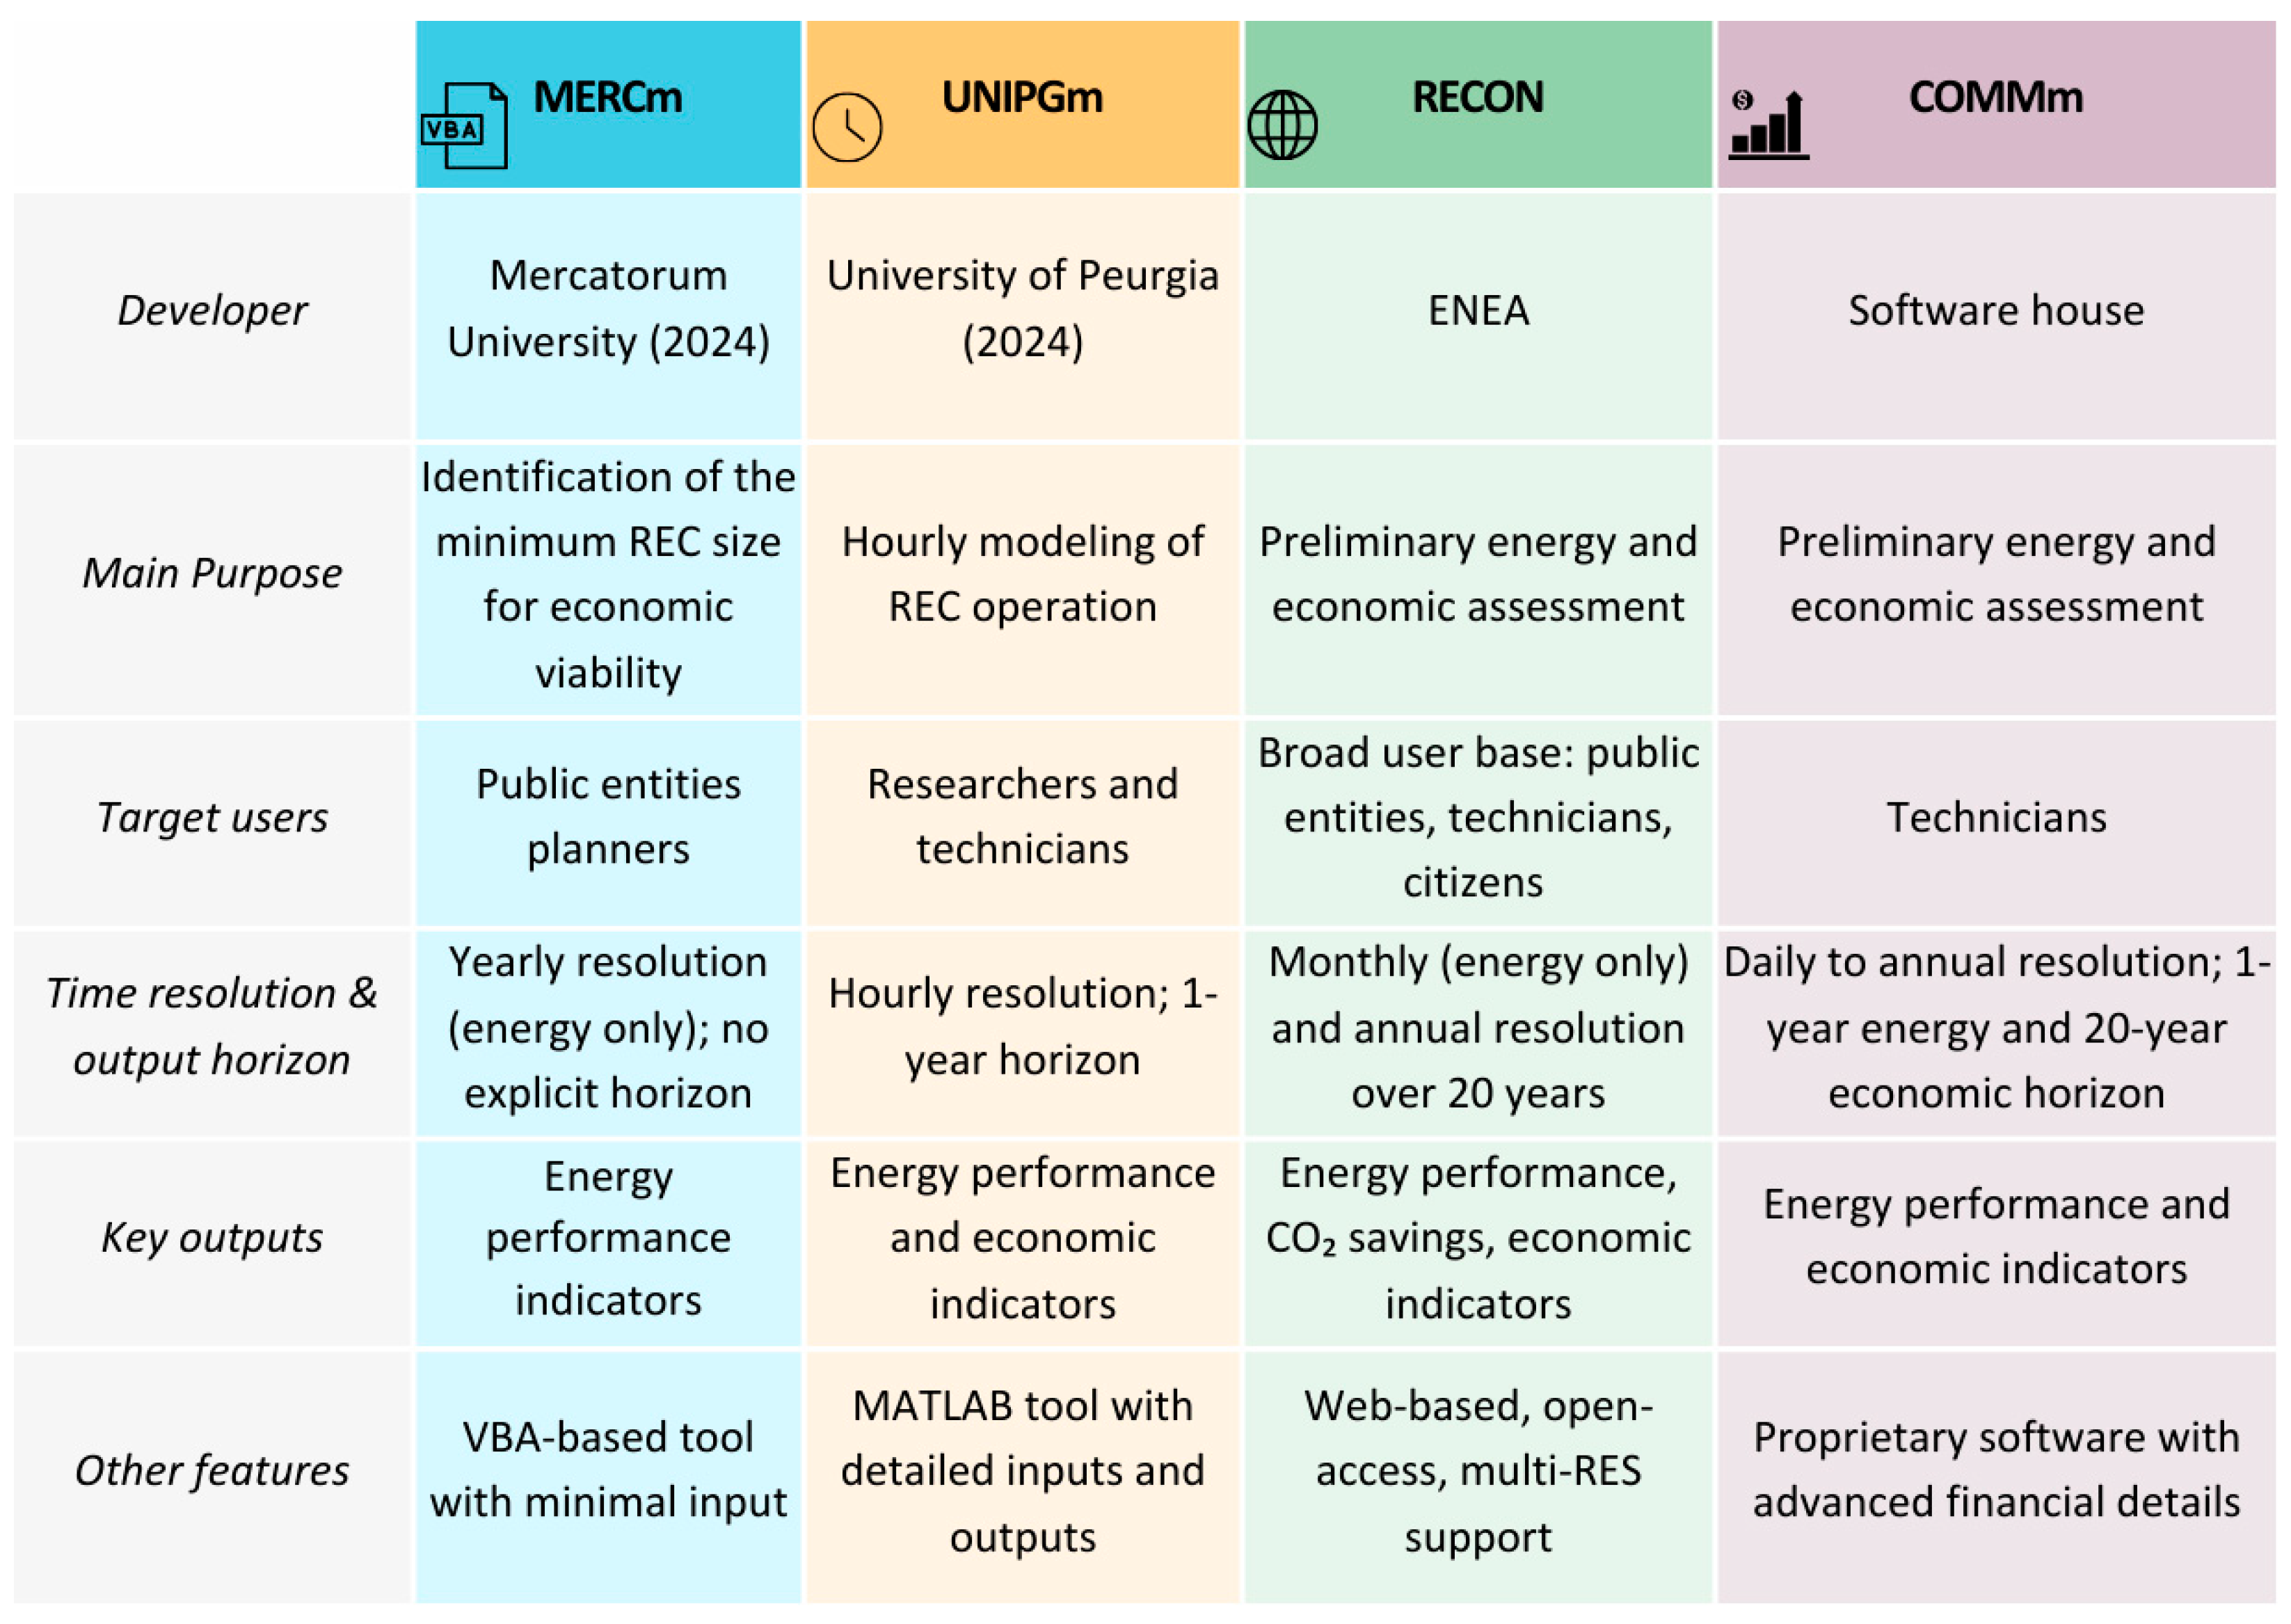
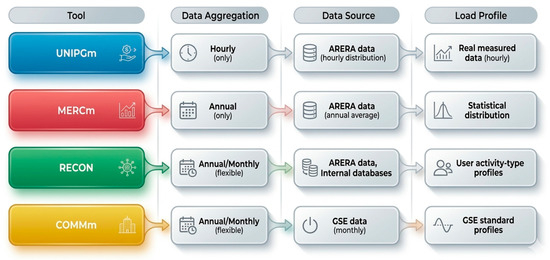
In this study, four models for the techno-economic prefeasibility assessment of configurations for shared self-consumption are compared, each characterized by a different level of detail and complexity. The key features of each tool are represented in Figure 1.
Figure 1.
Key features of computational tools.
2.1.1. MERCm
This model is a VBA-based tool developed to perform preliminary techno-economic analyses for the establishment of RECs. The tool allows for the estimation of the minimum number of participants required for an REC to be economically viable, considering the presence of prosumers and consumers with residential load profiles, and optionally accounting for the integration of storage systems. The tool was developed in 2024 by the telematic University Mercatorum as part of a broader technical–legal support project aimed at Public Administrations interested in creating new RECs, supported by the incentives provided for small municipalities under the Italian National Recovery and Resilience Plan (PNRR) framework [25].
Hourly solar radiation data are obtained using the Liu and Jordan model [28], employing solar radiation values on a horizontal surface provided by UNI10349. Consumption values for the residential sector are provided by ARERA, while those for other sectors were obtained from an internal archive. The algorithm requires a limited amount of input data, making it suitable for preliminary evaluations with low computational effort.
2.1.2. UNIPGm
This model is an algorithm developed in MATLAB (Version 9.14.0.2254940 (R2023a) Update 2), designed to perform detailed preliminary techno-economic assessments of RECs. The tool enables annual simulations of REC operation by using hourly consumption and renewable energy production profiles of the participating users. The algorithm was developed in 2024 by the University of Perugia with the aim of preliminarily evaluating the operation of a recently implemented REC in the municipality of Assisi, in central Italy. The tool development was also part of a broader project aimed at investigating the role of Public Administrations in the development of RECs [13].
Specifically, the tool evaluates, on an hourly basis, the minimum between the electricity fed into the grid and the electricity withdrawn, in order to calculate the shared energy for each user and to identify the members that contribute the most to energy sharing. The analysis provides, as hourly outputs, the electricity production, consumption, and self-consumption of the REC, and allows the assessment of energy self-sufficiency indicators. The type of users simulated may vary, as long as hourly consumption profiles are available. For the simulated year, the tool also estimates economic parameters such as savings from self-consumption, revenues from energy fed into the grid, and a range of incentives associated with shared energy.
Due to its higher level of detail, this tool enables the simulation of real REC operation, replicating the methodology used for calculating shared energy eligible for incentives under the current regulatory framework. However, it requires a more complex and time-consuming data collection process, as it relies on detailed consumption profiles of individual users, making the simulation challenging when future REC members are not yet known.
2.1.3. RECON (Renewable Energy Community Economic Simulator)
RECON (Version 2.2) is a free, web-based simulator developed by ENEA (National Agency for New Technologies, Energy and Sustainable Economic Development) in collaboration with RSE (Research on the Energy Systems institute), designed to support preliminary techno-economic and financial assessments for the development of RECs and CSCs. The tool is intended to assist national and local authorities, as well as stakeholders, in making informed decisions aimed at establishing RECs and CSCs, while encouraging citizen engagement in the energy transition. The platform allows users to simulate various renewable energy generation technologies (photovoltaic, wind, hydropower), different financing schemes, and a wide range of user profiles (residential, commercial, offices, schools, industries). Among its main outputs, RECON computes energy flows, physical self-consumption for each prosumer, shared energy within the community, energy self-sufficiency, environmental benefits in terms of CO2 emissions reduction, savings and revenues from shared energy, and financial indicators such as payback time.
Simulations are performed over a 20-year time horizon, corresponding to the typical incentive duration, while energy performance can also be evaluated on a monthly basis [29].
2.1.4. COMMm
This tool is one of the main simulators available on the market, developed by a national software house. Similarly to RECON, this tool was developed to support technicians in the preliminary design and management of new RECs, with a particular focus on economic assessment. Its primary purpose is to evaluate the financial performance of a REC, including the estimation of incentive-based tariffs derived from the operation of photovoltaic systems in a collective self-consumption configuration.
The tool allows the simulation of communities composed of different types of members, including citizens, companies, and public entities, and considers energy produced from renewable sources, specifically photovoltaic systems. For each prosumer, COMMm provides key outputs such as produced, fed into grid, consumed, and shared energy, with varying levels of temporal detail, including the possibility to analyze hourly profiles of typical days. By incorporating economic data, COMMm also enables the assessment of revenues and expenditures for each REC participant over a 20-year horizon, corresponding to the typical duration of incentives. This allows the evaluation of cash flows and overall profitability of the community energy scheme.
Considering the capabilities of the analyzed software, the algorithms were applied to perform preliminary assessments of RECs powered exclusively by photovoltaic energy (only RECON allows the simulation of additional renewable technologies) and composed of only residential users, both as consumers and prosumers. The choice to focus only on residential users in this paper is motivated by the availability of standardized consumption profiles, which enables a homogeneous comparison among the different models. Moreover, the native workflows of each tool were maintained to reflect their practical use by typical users, rather than enforcing fully standardized inputs, ensuring that the comparison captures realistic methodological differences in prefeasibility analyses.
2.2. Input Data and Preprocessing
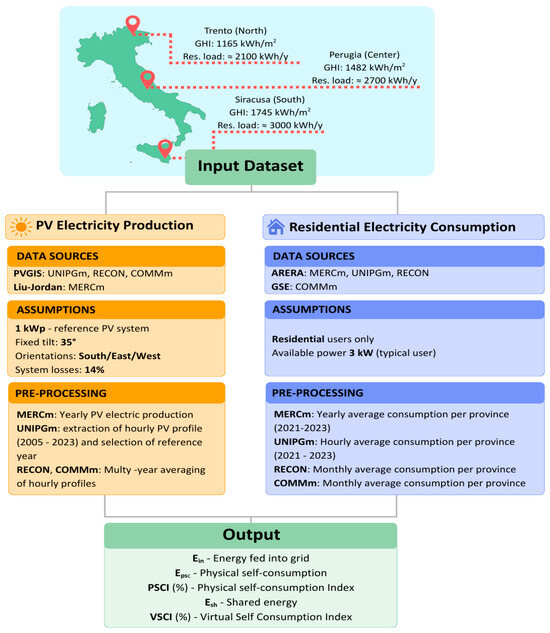
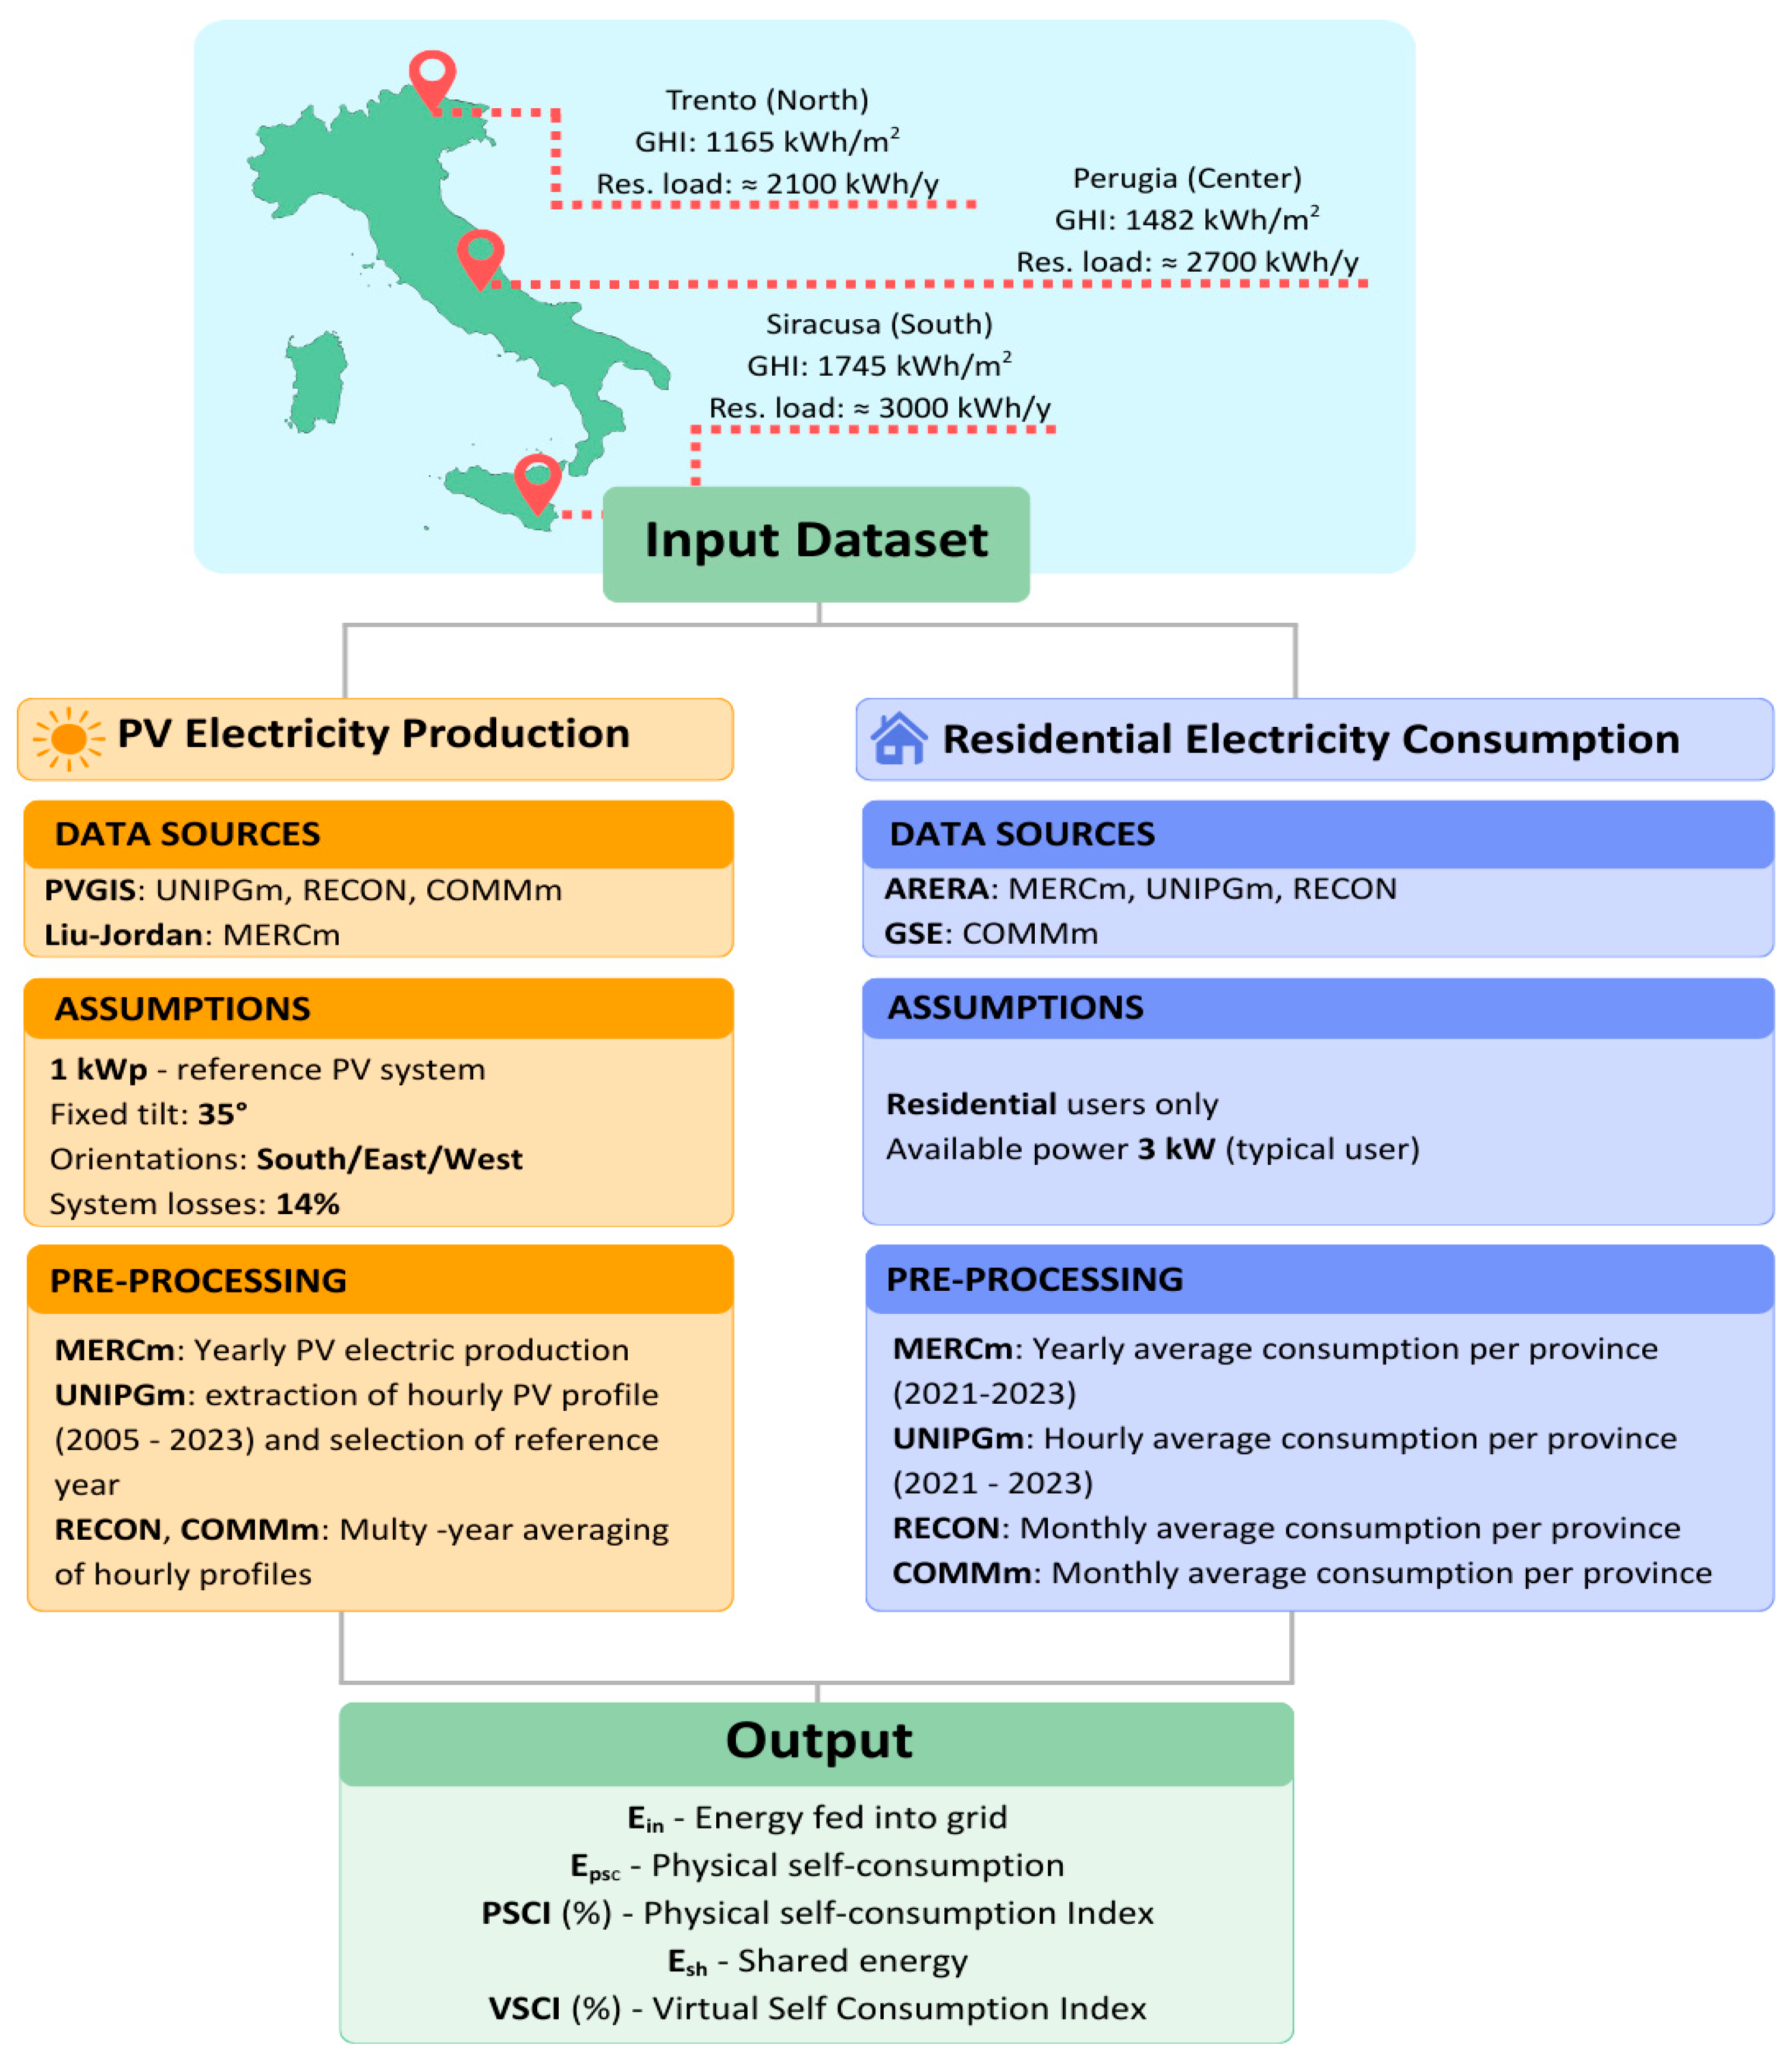
The comparative analysis of the four simulation tools is based on a common methodological framework defining input datasets, preprocessing steps, and output indicators. Figure 2 summarizes the computational workflow adopted in this study, highlighting the main inputs, data processing stages, and energy performance indicators. The procedures used to derive photovoltaic production and residential electricity consumption profiles are detailed in the following sections. A comparison of the input data structures supported by each software tool is instead provided in Table 1. All tools compute shared energy on an hourly basis according to the Italian regulatory framework, where shared energy corresponds to the minimum between feed-in and withdrawal at each time step.
Figure 2.
Computational workflow of the comparative analysis, from input data to energy performance indicators.
Table 1.
Structural comparison of simulation tools input data.
The algorithms rely on two fundamental datasets: electricity production from renewable sources and electricity consumption of residential consumers and prosumers. Although shared energy is calculated on an hourly basis in all models, the temporal resolution of the input data varies across tools, ranging from annual or monthly aggregated values to fully hourly profiles, depending on the specific modelling approach.
These inputs are intrinsically dependent on the geographical location of the REC, since photovoltaic production is influenced by local solar irradiation, while consumption patterns may strongly vary according to users’ habits and building characteristics. To ensure generalizability of the analysis, the study focuses on three Italian provinces selected to represent extreme and average conditions. The selection was carried out based on the annual horizontal solar irradiation (Global Horizontal Irradiation—GHI) values reported in the UNI 10349 standard [30]. Specifically, the province with the highest irradiation in Southern Italy (Siracusa, 37.0633° N, 15.2944° E), the one with the lowest irradiation among Northern regions (Trento, 46.0686° N, 11.1228° E), and an intermediate case located in Central Italy (Perugia, 43.1136° N, 12.3897° E) were identified. This approach enables the comparison of REC energy performance outputs across the considered tools under extreme and average irradiation scenarios. For the selected locations, the corresponding photovoltaic production profiles and user consumption profiles were identified accordingly, as described in the following sections.
2.2.1. Photovoltaic Electricity Production Modelling
The photovoltaic (PV) energy production profile is proportional to the incident solar radiation on the PV module surface and to the Balance of System (BOS), which accounts for losses such as mismatch, inverter efficiency, and other device-related factors. Without directly measured data, the most reliable source for solar radiation across the national territory is PVGIS-SARAH3 (2005–2023) [31]. PVGIS allows selecting a location and download hourly solar radiation, together with the estimated energy output of a PV system, for all available years through the online portal. For the COMMm and RECON tools, PVGIS-SARAH3 data were used and processed internally to generate PV production profiles.
For UNIPGm, which requires detailed hourly profiles for a specific year, PVGIS-SARAH3 hourly production profiles were employed. These profiles refer to a 1 kWp PV system, assuming a fixed tilt angle of 35° (considered a typical value for installations based on the average latitude of Italy), variable azimuths (south, east, west), and a PV technology system loss percentage of 14%. The profiles were averaged over all available years to obtain a mean annual value, and the year closest to the mean was selected as the most representative (Reference Year—RY). In this way, the resulting dataset provides the hourly producibility of a 1 kWp PV system for each location considered, which can be scaled proportionally to simulate systems of any installed capacity.
In particular, the MERCm tool differs from other simulators, as it relies exclusively on the temporal distribution of average annual solar radiation data provided by the UNI 10349 standard for each Italian province, using the Liu–Jordan model. The Liu and Jordan model (1963) [32] is an isotropic model used to estimate the total solar radiation on a tilted surface. This method estimates radiation on tilted surfaces by combining direct, diffuse, and ground-reflected components using aggregated meteorological data. It assumes that diffuse radiation is uniformly distributed across the sky dome and that ground-reflected radiation is also diffused and isotropic.
While widely used due to its simplicity, the Liu and Jordan model can sometimes underestimate or overestimate irradiance under certain atmospheric conditions or for surfaces with steep tilt angles. This is due to its simplifying assumption that diffuse radiation is isotropic.
The annual PV producibility (in kWh/kW) defined by the two models, subdivided by location and panel orientation, is reported in Table 2.
Table 2.
Annual PV producibility (kWh/kW) comparison.
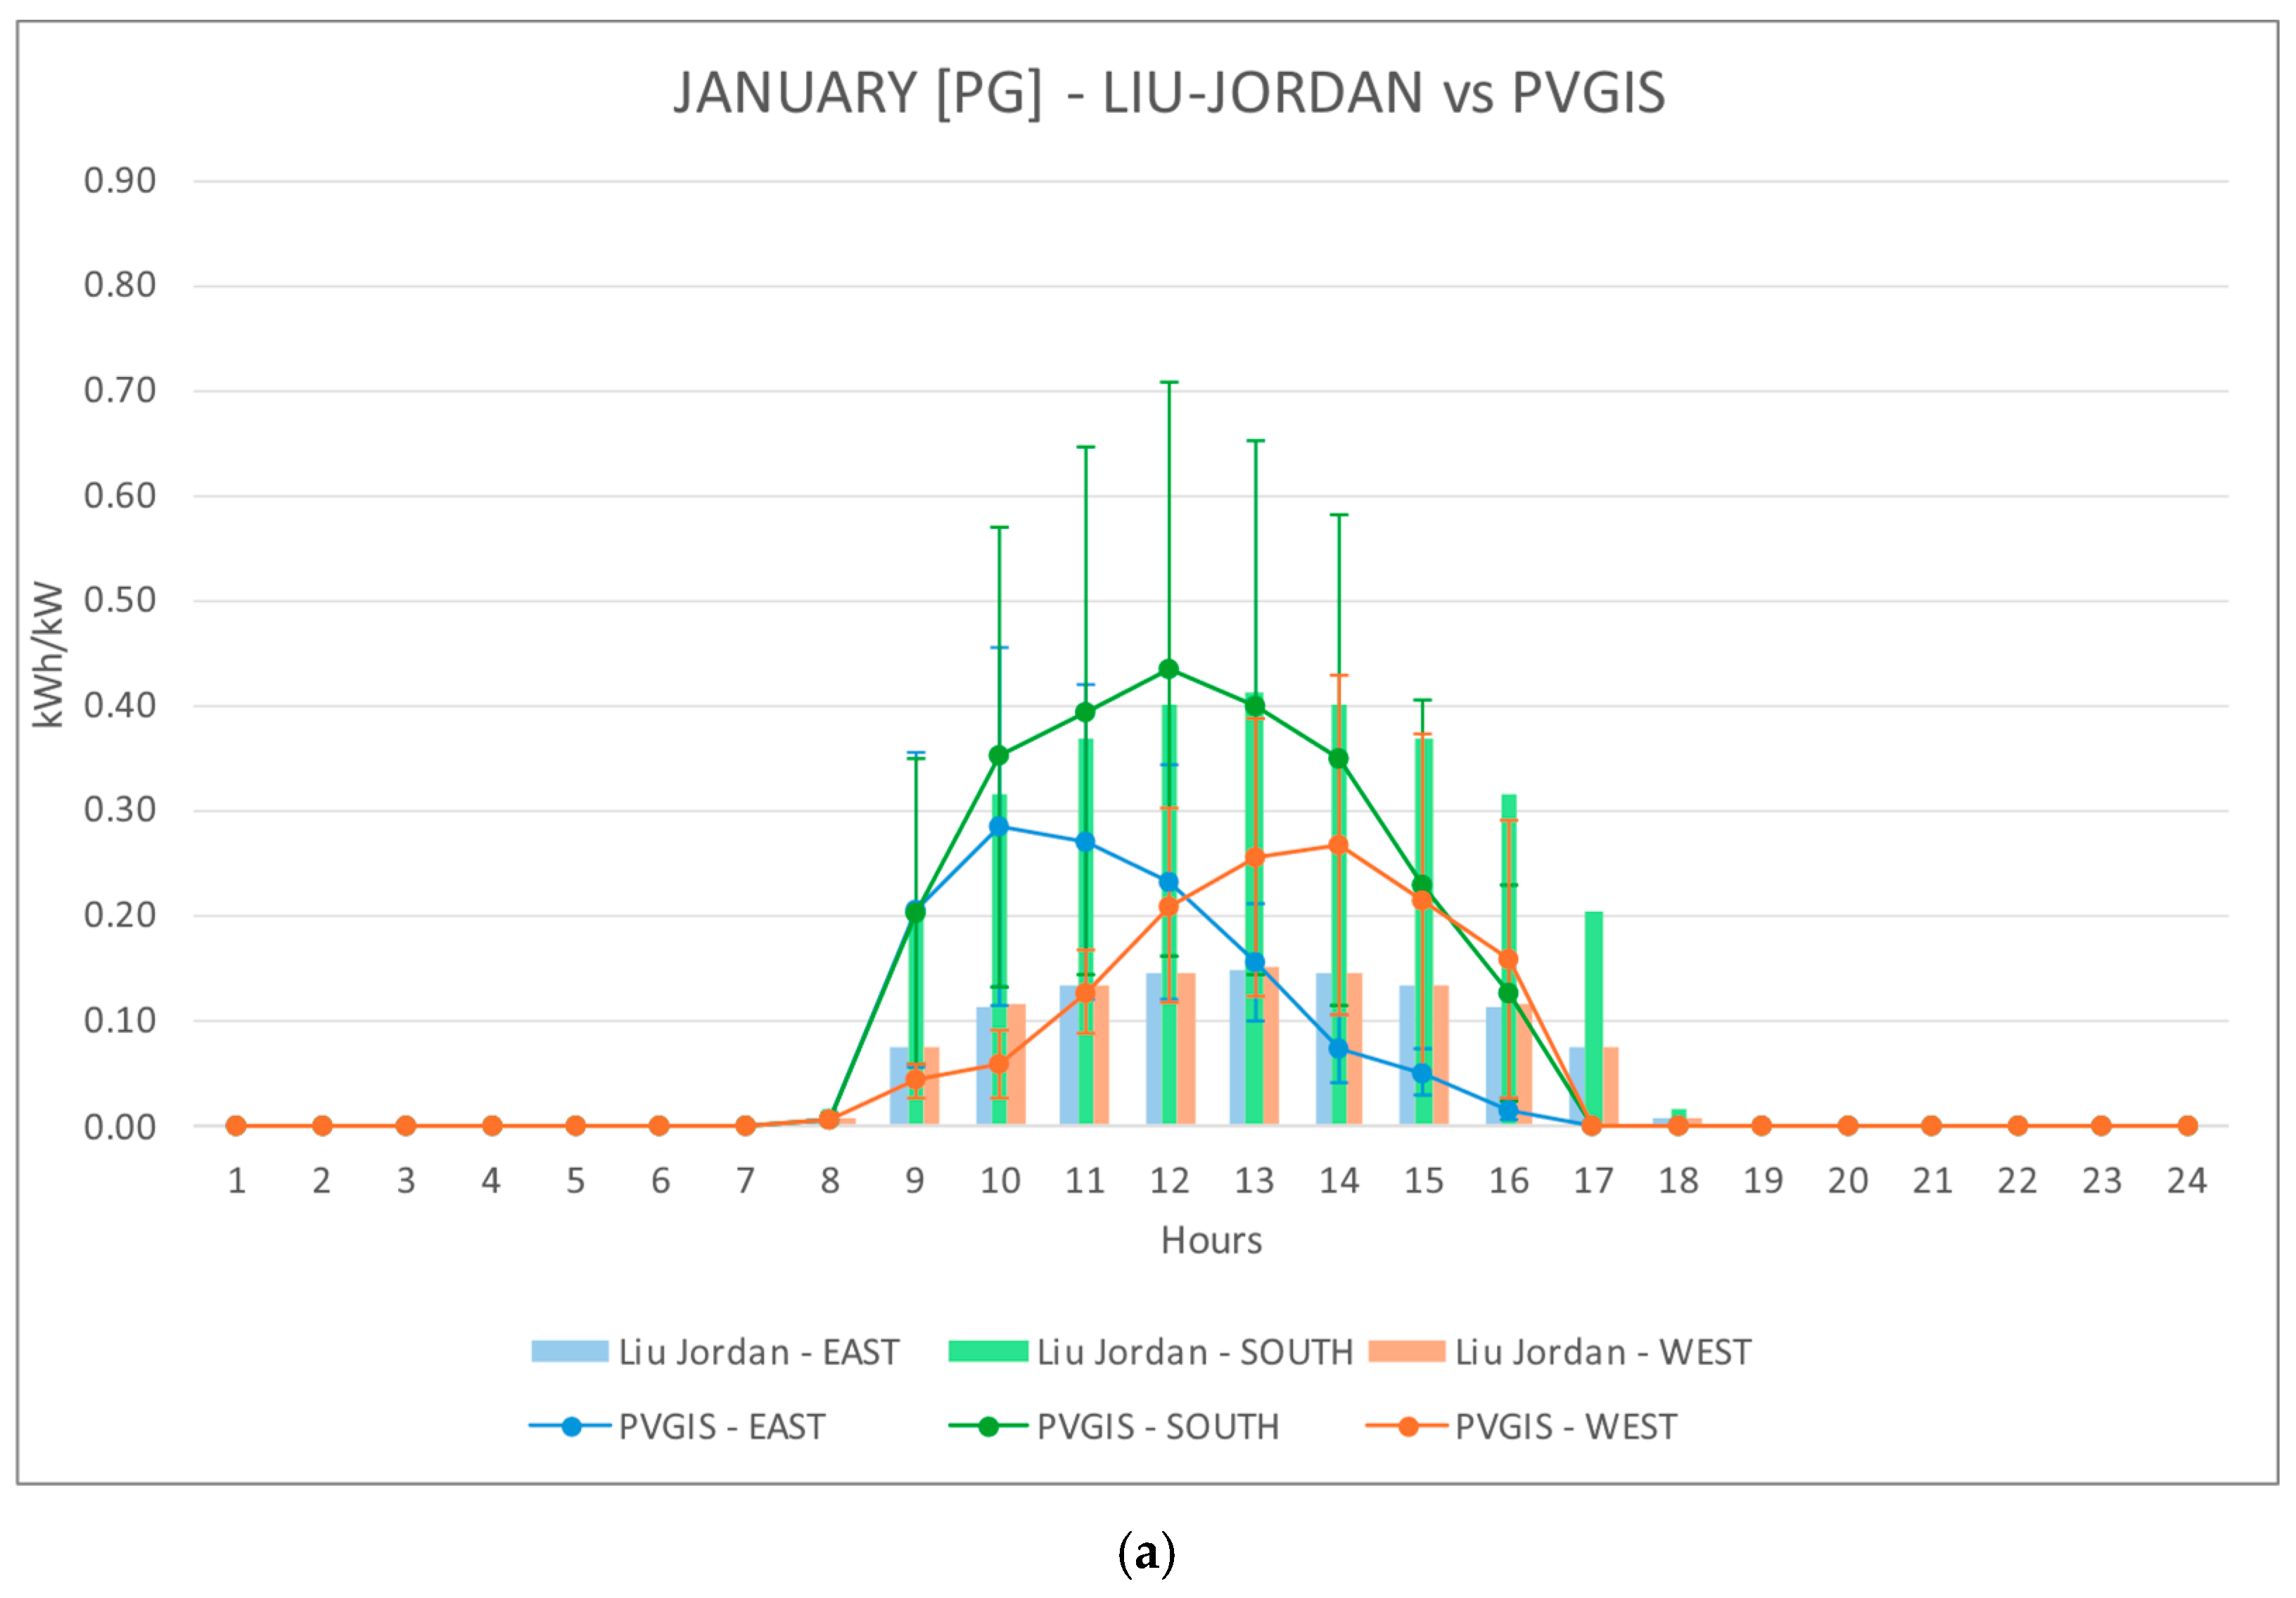
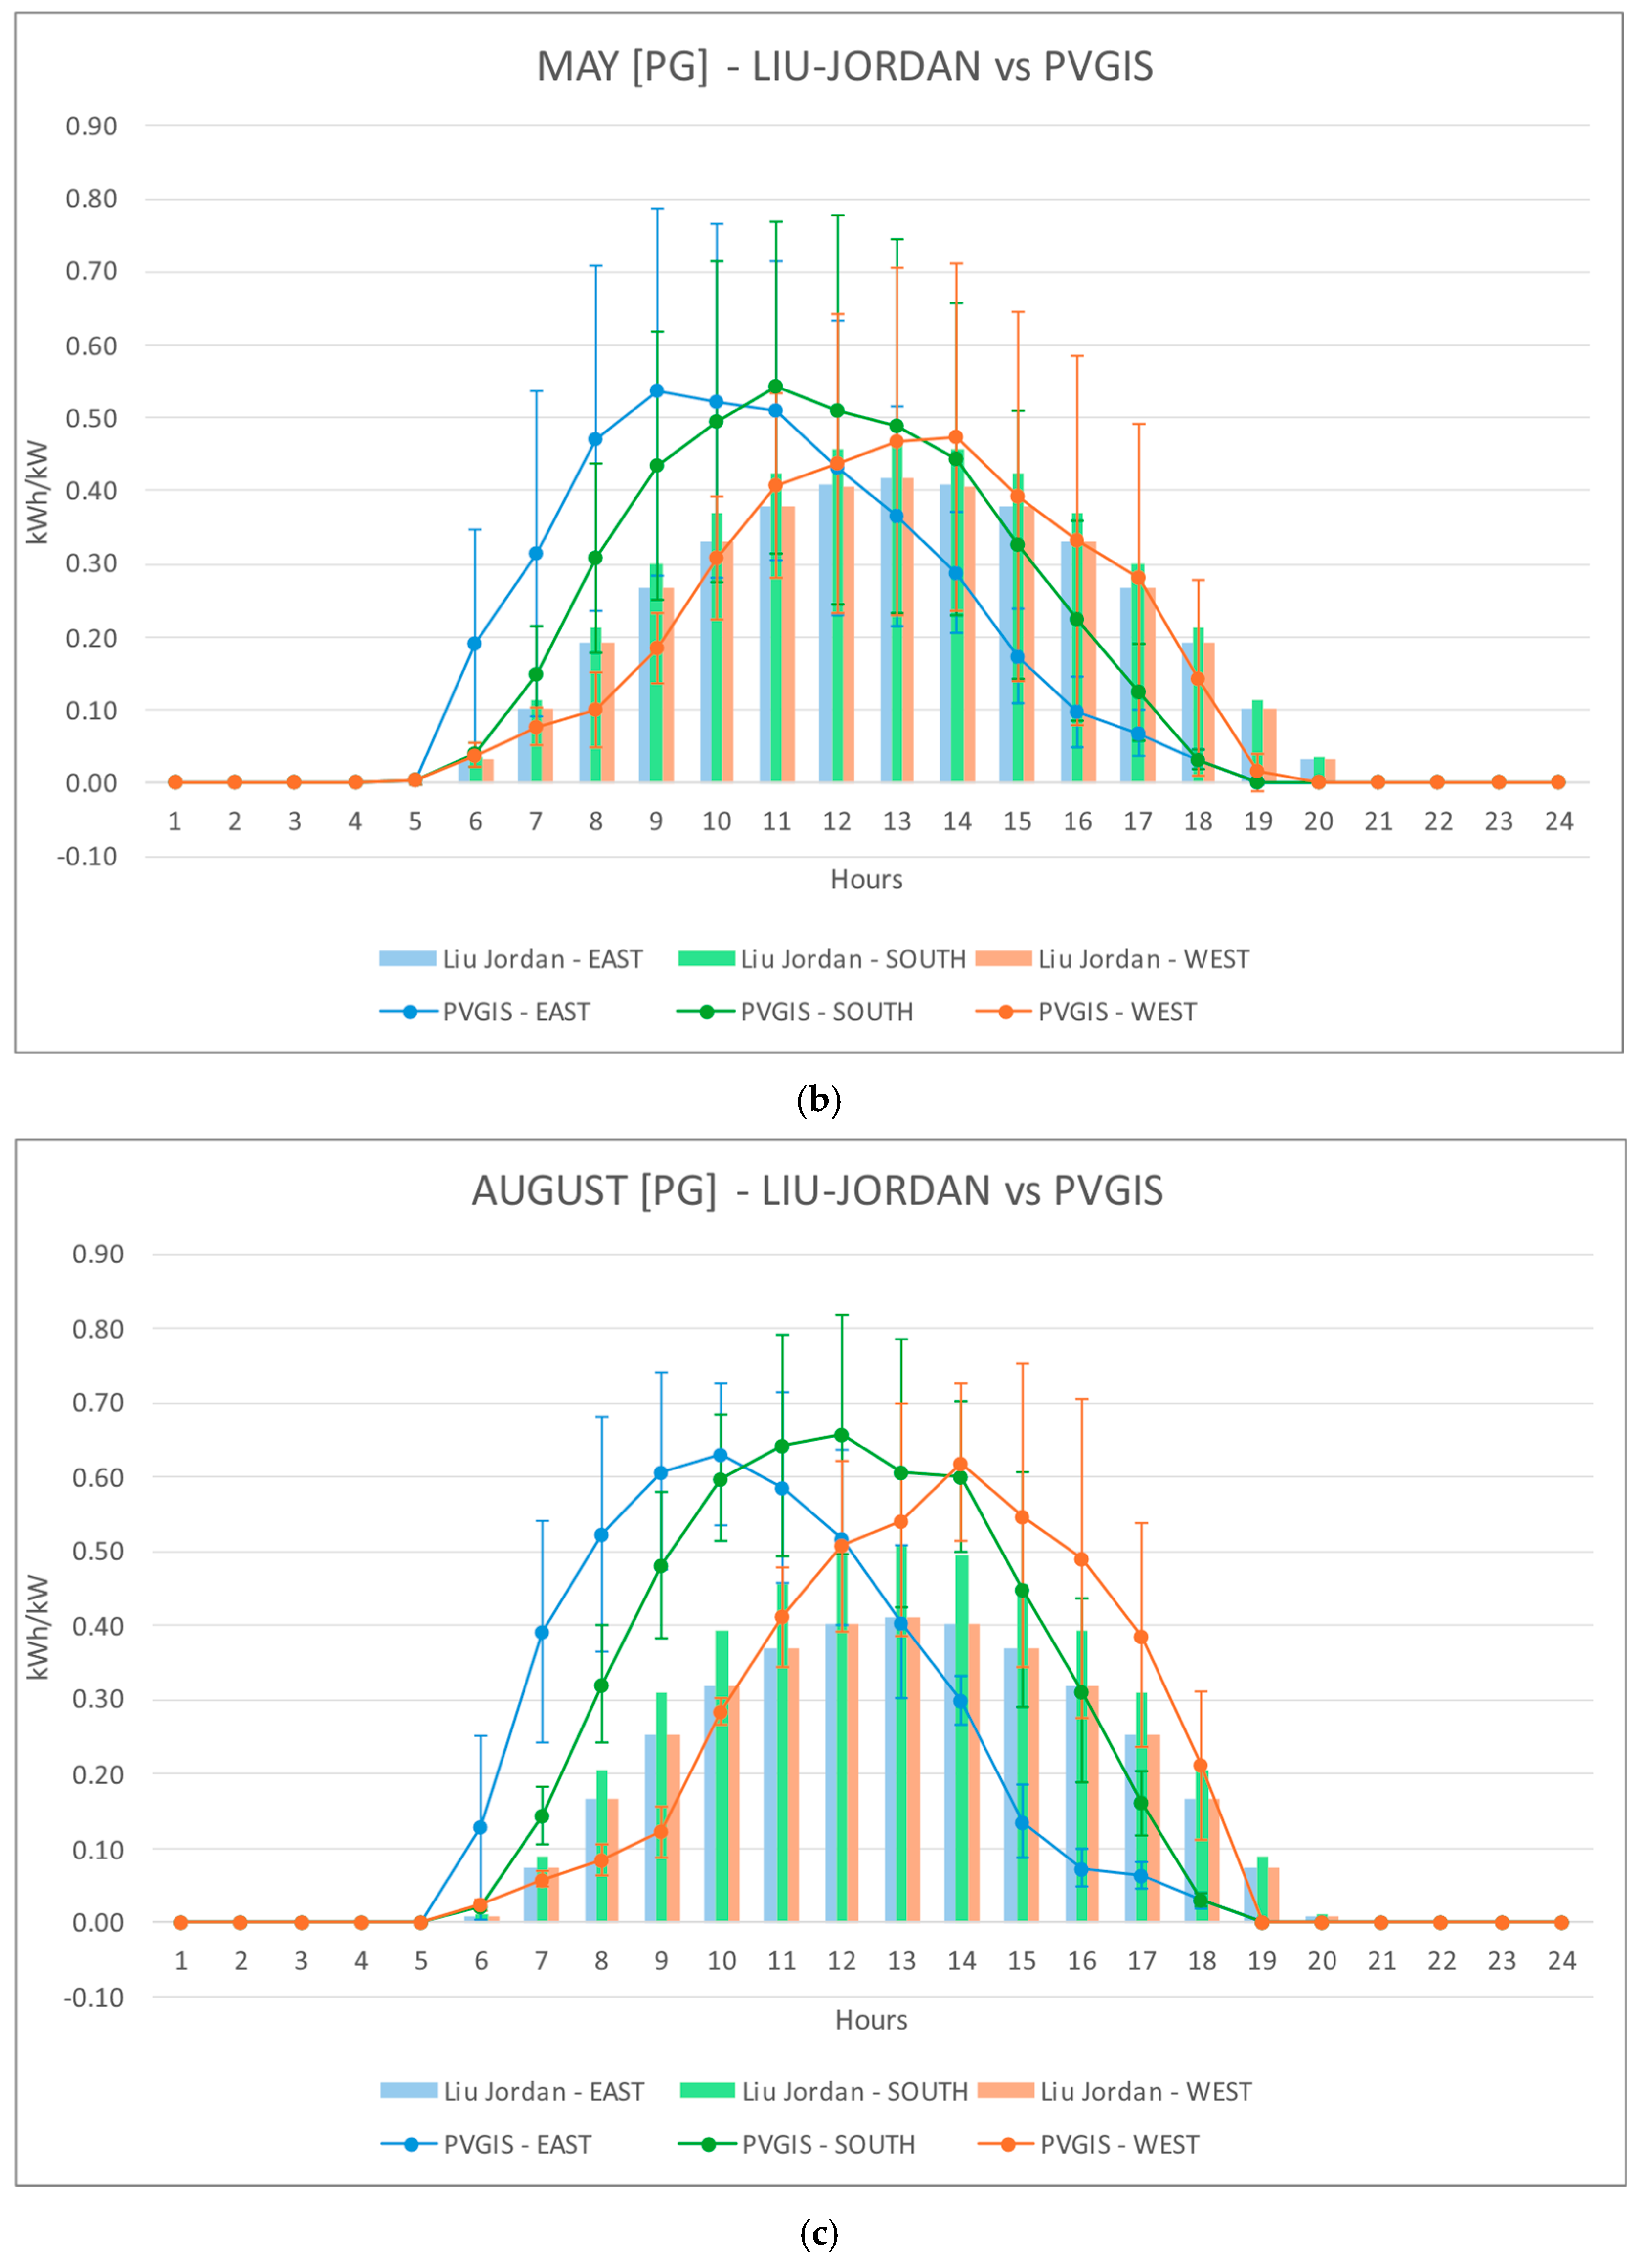
To further compare the production profiles obtained from PVGIS (after processing in UNIPGm) and the Liu–Jordan model, average daily producibility curves were generated for three representative months: January, May, and August. These curves allow a direct comparison of hourly PV production patterns between PVGIS and Liu–Jordan for a given location.
2.2.2. Residential User Consumption Profiles
To ensure that the comparisons conducted in this study are generalizable, residential user consumption profiles were not collected on-site, even though most energy distributors currently provide access to detailed consumption data, including quarter-hourly measurements. The use of real consumption data presents several challenges:
- Limited representativeness: available data often refer to a specific period, which may not reflect the average behavior of users.
- Small sample size: even when multiple datasets are collected, a small number of users is not statistically significant. Also replicating a few user profiles to increase sample size is unrealistic, as actual consumption patterns vary greatly among users.
Therefore, an approach based on aggregated statistical profiles was adopted, as is common in open-source and commercial simulators. These tools, including RECON, allow the use of aggregated residential consumption data from official sources, while still enabling the insertion of specific consumption data when available. Generally, for residential consumers, the main used sources are the standard normalized consumption profiles provided by the Italian national energy agency (Gestore dei Servizi energetici—GSE) [33] and data from the Italian national energy authority (Autorità di Regolazione per Energia Reti e Ambiente—ARERA) [34]. The first source reconstructs hourly electricity injection and withdrawal curves year by year and consumption data are provided as percentages over 24 h and averaged across the Italian territory. On the other hand, ARERA provides, among other data, the average hourly withdrawal (in kWh) for domestic customers. These data are available on a monthly basis, distinguished by weekdays, Saturdays, and Sundays, for all Italian provinces, with the possibility to select the power class, market segment (regulated and free markets), and residential status of the end user.
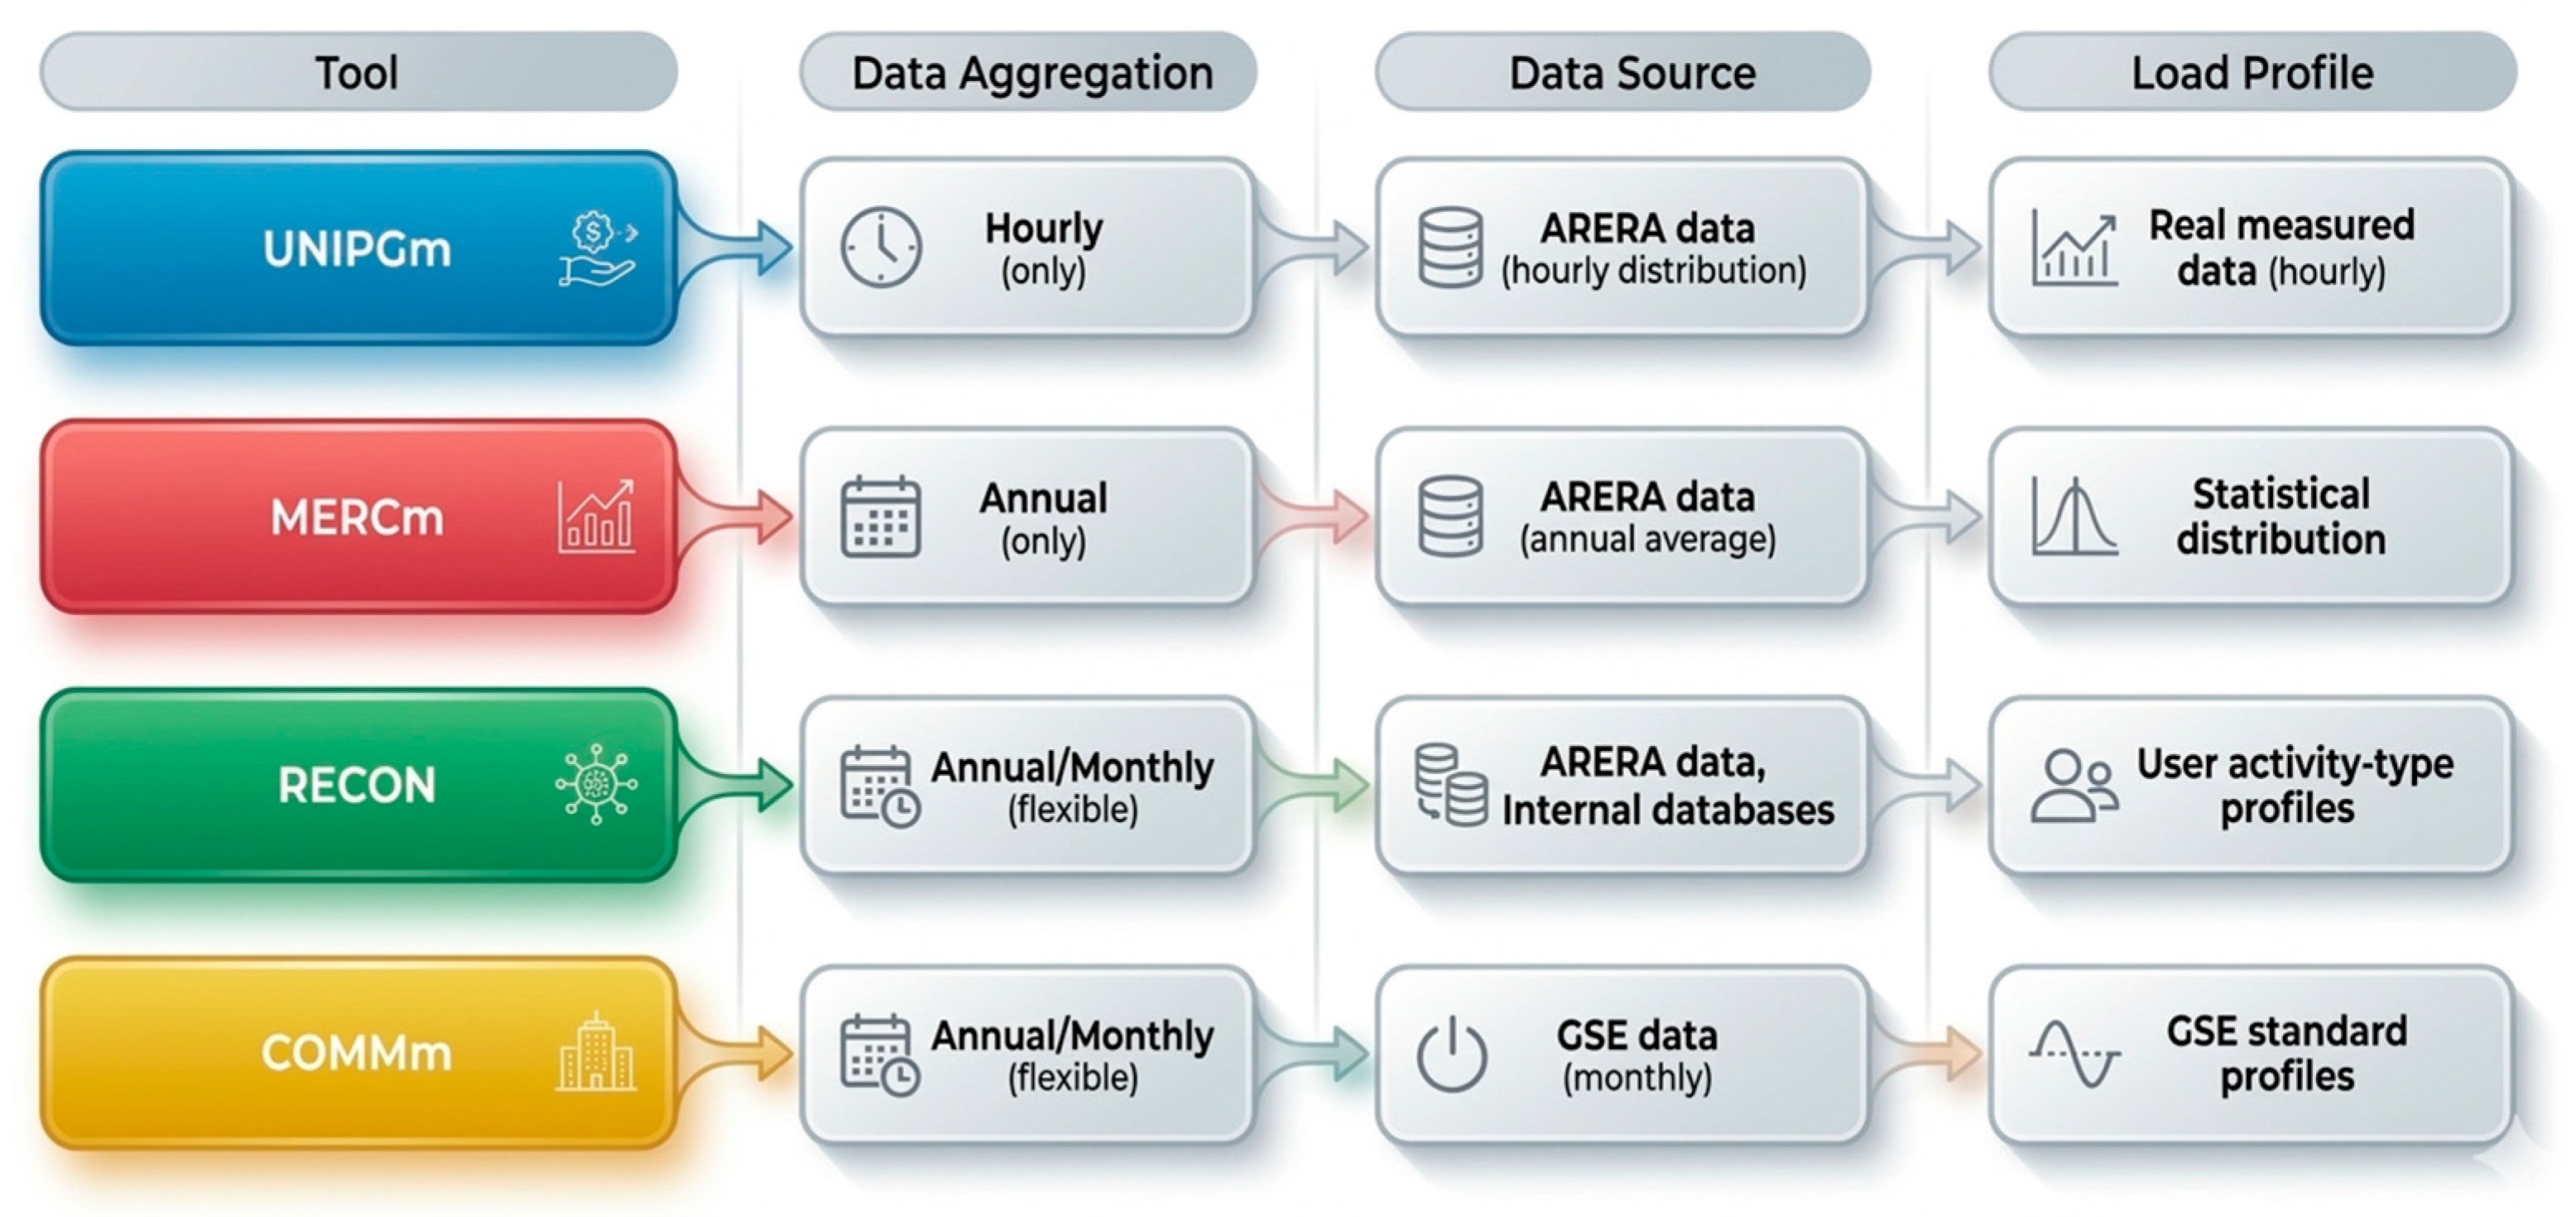
The two tools developed by universities also adopted the same strategy, using ARERA data, which offer a higher level of detail and allow alignment of inputs across different models, ensuring that the consumption profiles are as realistic as possible. Referring to other tools, RECON uses ARERA data, while the COMMm tool relies on GSE data.
For UNIPGm and MERCm, ARERA data were preprocessed as follows. For each location hypothesized, the following parameters were considered: all market types (regulated and free), users with residential status, and available power classes of 1.5–3 kW and 3–4.5 kW, which were averaged to obtain a typical power of 3 kW, selectable in all tools. Since data were available from 2021 to 2023, they were averaged over the entire period. Specifically, for UNIPGm, annual data were further processed to generate hourly values for all 8760 h of the year. To achieve this, ARERA data were distributed across the entire year.
Figure 3 shows the aggregation levels of user consumption data that the four tools can employ. Depending on the data source, such as ARERA, GSE, utility bills, internal software databases, or the distribution system operator (DSO), the input data can be provided at annual, monthly, daily, or hourly aggregation level. UNIPGm is the only software that exclusively requires hourly data, whereas MERCm relies solely on annual aggregated data. The other tools allow multiple input aggregation levels (annual, monthly) from each the mentioned data source. Figure 3 also describes how the user’s hourly load profile is defined. Depending on the data source, the profile can be derived using statistical distributions, such as those provided by ARERA or GSE, average profiles from internal databases, user-specific average profiles, profiles based on user activity type, or real measured data. Despite these differences in input data resolution and processing, all tools compute shared energy on an hourly basis in accordance with the Italian regulatory framework, ensuring a consistent and comparable evaluation across models.
Figure 3.
Some examples of data aggregation levels, data sources and profile definition employed by each tool.
Although the use of aggregated ARERA and GSE statistical profiles ensures consistency and comparability across tools, it does not fully capture individual behavioural diversity, short-term intra-day demand fluctuations, or potential demand-side flexibility effects. This average representation is appropriate for prefeasibility analyses but should be considered when interpreting results for communities characterized by high behavioural heterogeneity or active load management strategies.
2.3. Case Studies Definition
Based on the methodology described above, three geographical case studies were defined, located in Trento, Perugia, and Siracusa. The analysis focuses on PV-only, residential RECs, and the findings may differ in more complex communities that include battery storage, electric vehicle charging, or demand-side flexibility strategies. The analyzed RECs include exclusively residential users, acting either as consumers or prosumers, and the renewable energy generation considered within the community is produced by PV systems. The size of each REC, intended as the number of participating users and total installed PV capacity, was defined based on evidence from previous studies. A key performance indicator for RECs is the share of locally shared energy, defined as the ratio between the total energy virtually self-consumed within the community and the total energy fed into the grid, expressed as a percentage. This share generally increases with the consumption-to-generation ratio, and the literature [35] suggests that a ratio of at least 2 is typically required to consistently achieve a high level of shared energy (>60%) in residential REC configurations.
Following this consideration, two REC configurations were defined, both tested for each of the three locations, resulting in six simulation scenarios. In both configurations, 30 prosumers were considered, each equipped with a 3.3 kWp PV system, equally distributed by orientation (10 facing south, 10 east, 10 west), while the total number of users varies as follows:
- 100 users (30 prosumers + 70 consumers)
- 150 users (30 prosumers + 120 consumers)
A summary of all simulated scenarios is provided in Table 3.
Table 3.
Definition of simulated case studies.
2.4. Performance Indicators
The four algorithms under comparison were tested on the six case studies, and their results were evaluated considering the following energy outputs:
- Energy fed into grid (Ein)
- Physical self-consumption (Epsc): PV energy physically consumed by the prosumers.
- Physical Self-Consumption Index (PSCI): ratio of physical self-consumption to total PV production.
- Shared energy (Esh): PV energy virtually consumed by other REC members.
- Virtual Self-Consumption Index (VSCI): ratio of shared energy to total energy fed into the grid.
3. Results and Discussion
3.1. Comparison of PV Generation Profiles: Liu-Jordan vs. PVGIS
To clarify the origin of differences observed among the simulation tools, the first set of results compares the hourly PV production profiles generated using the Liu–Jordan and PVGIS models, which constitute the basis for PV generation inputs in the analyzed software. These results help explain some of the differences observed in the simulation outputs produced by the various software, as detailed in the following sections. For this analysis, the average daily producibility curves were compared for three representative months: January, May, and August. Subsequently, the city of Perugia was selected, and daily production curves were evaluated for different panel orientations, illustrating how PV generation varies throughout the day and across seasons in each database.
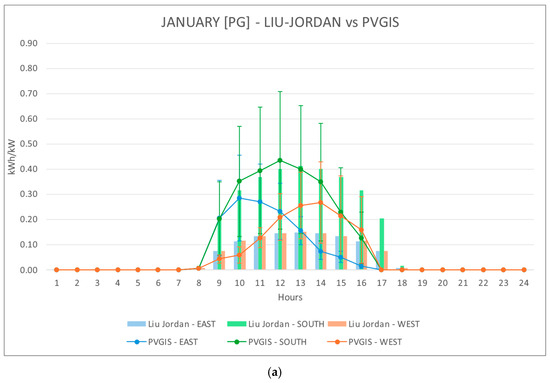
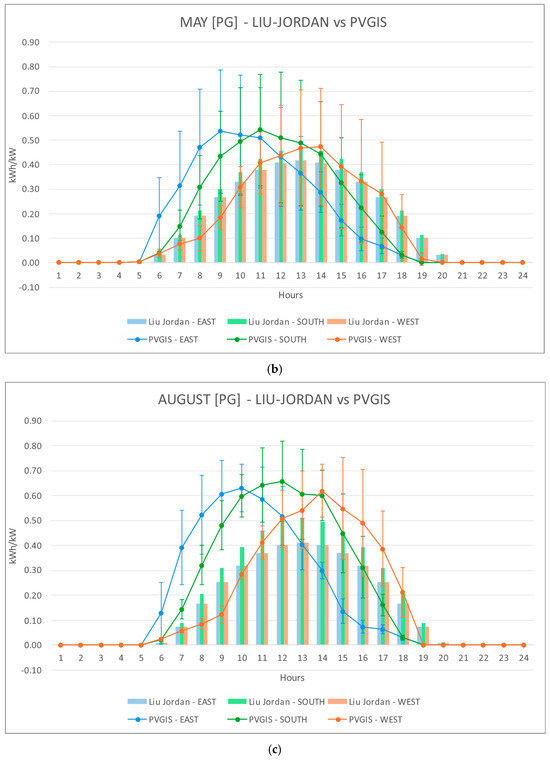
The results of this comparison are shown in Figure 4. In the figure, hourly PV production curves for a typical day in January, May, and August are presented. Production obtained with the Liu–Jordan model is represented using bars, defining the daily curve for the considered month. For PVGIS, monthly hourly averages are shown, and the corresponding standard deviation is represented with error bars, highlighting the variability of solar radiation. Since shared energy in RECs is calculated on an hourly basis as the overlap between production and consumption, differences in the temporal distribution of PV generation profiles directly affect the estimated amount of shared energy.
Figure 4.
Hourly PV production curves for a typical day in January (a), May (b), and August (c) comparing Liu–Jordan model and PVGIS.
As expected, PV producibility is significantly higher during the summer months, particularly in August, due to the greater availability of solar radiation. However, the two databases show notable differences in the hourly distribution of radiation. In the Liu–Jordan model, radiation is distributed uniformly during the central hours of the day. For south-facing panels, this results in higher production compared to east- and west-facing orientations, which exhibit identical values. This difference is particularly pronounced in winter months, when PV producibility is lower, and tends to diminish during months with higher solar availability, such as May and August.
In contrast, PVGIS provides a more realistic representation of panel orientation. For south-facing panels, production is concentrated during the central hours of the day; for east-facing panels, a peak occurs in the early morning, while for west-facing panels, the peak shifts to the late afternoon, as is typical in the Northern Hemisphere. Additionally, producibility peaks are higher than those obtained with the Liu–Jordan model, particularly during the summer months. Overall PV producibility from the two databases is similar, as shown in Table 1, although PVGIS tends to provide slightly higher values. It is important to note that PVGIS producibility is based on a specific year selected for the analysis, chosen because it is close to the average producibility, but it may still reflect year-to-year variations. This effect does not occur in the Liu–Jordan model, which produces more regular values. These differences in production profiles directly influence the estimation of shared energy and self-consumption indicators, contributing to the variability observed in the outputs of the different simulation tools, as discussed in the following sections.
3.2. Comparative Assessment of REC Simulation Outputs Across Tools
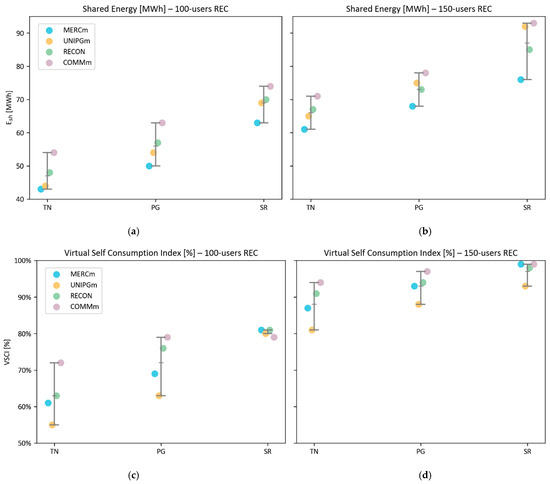
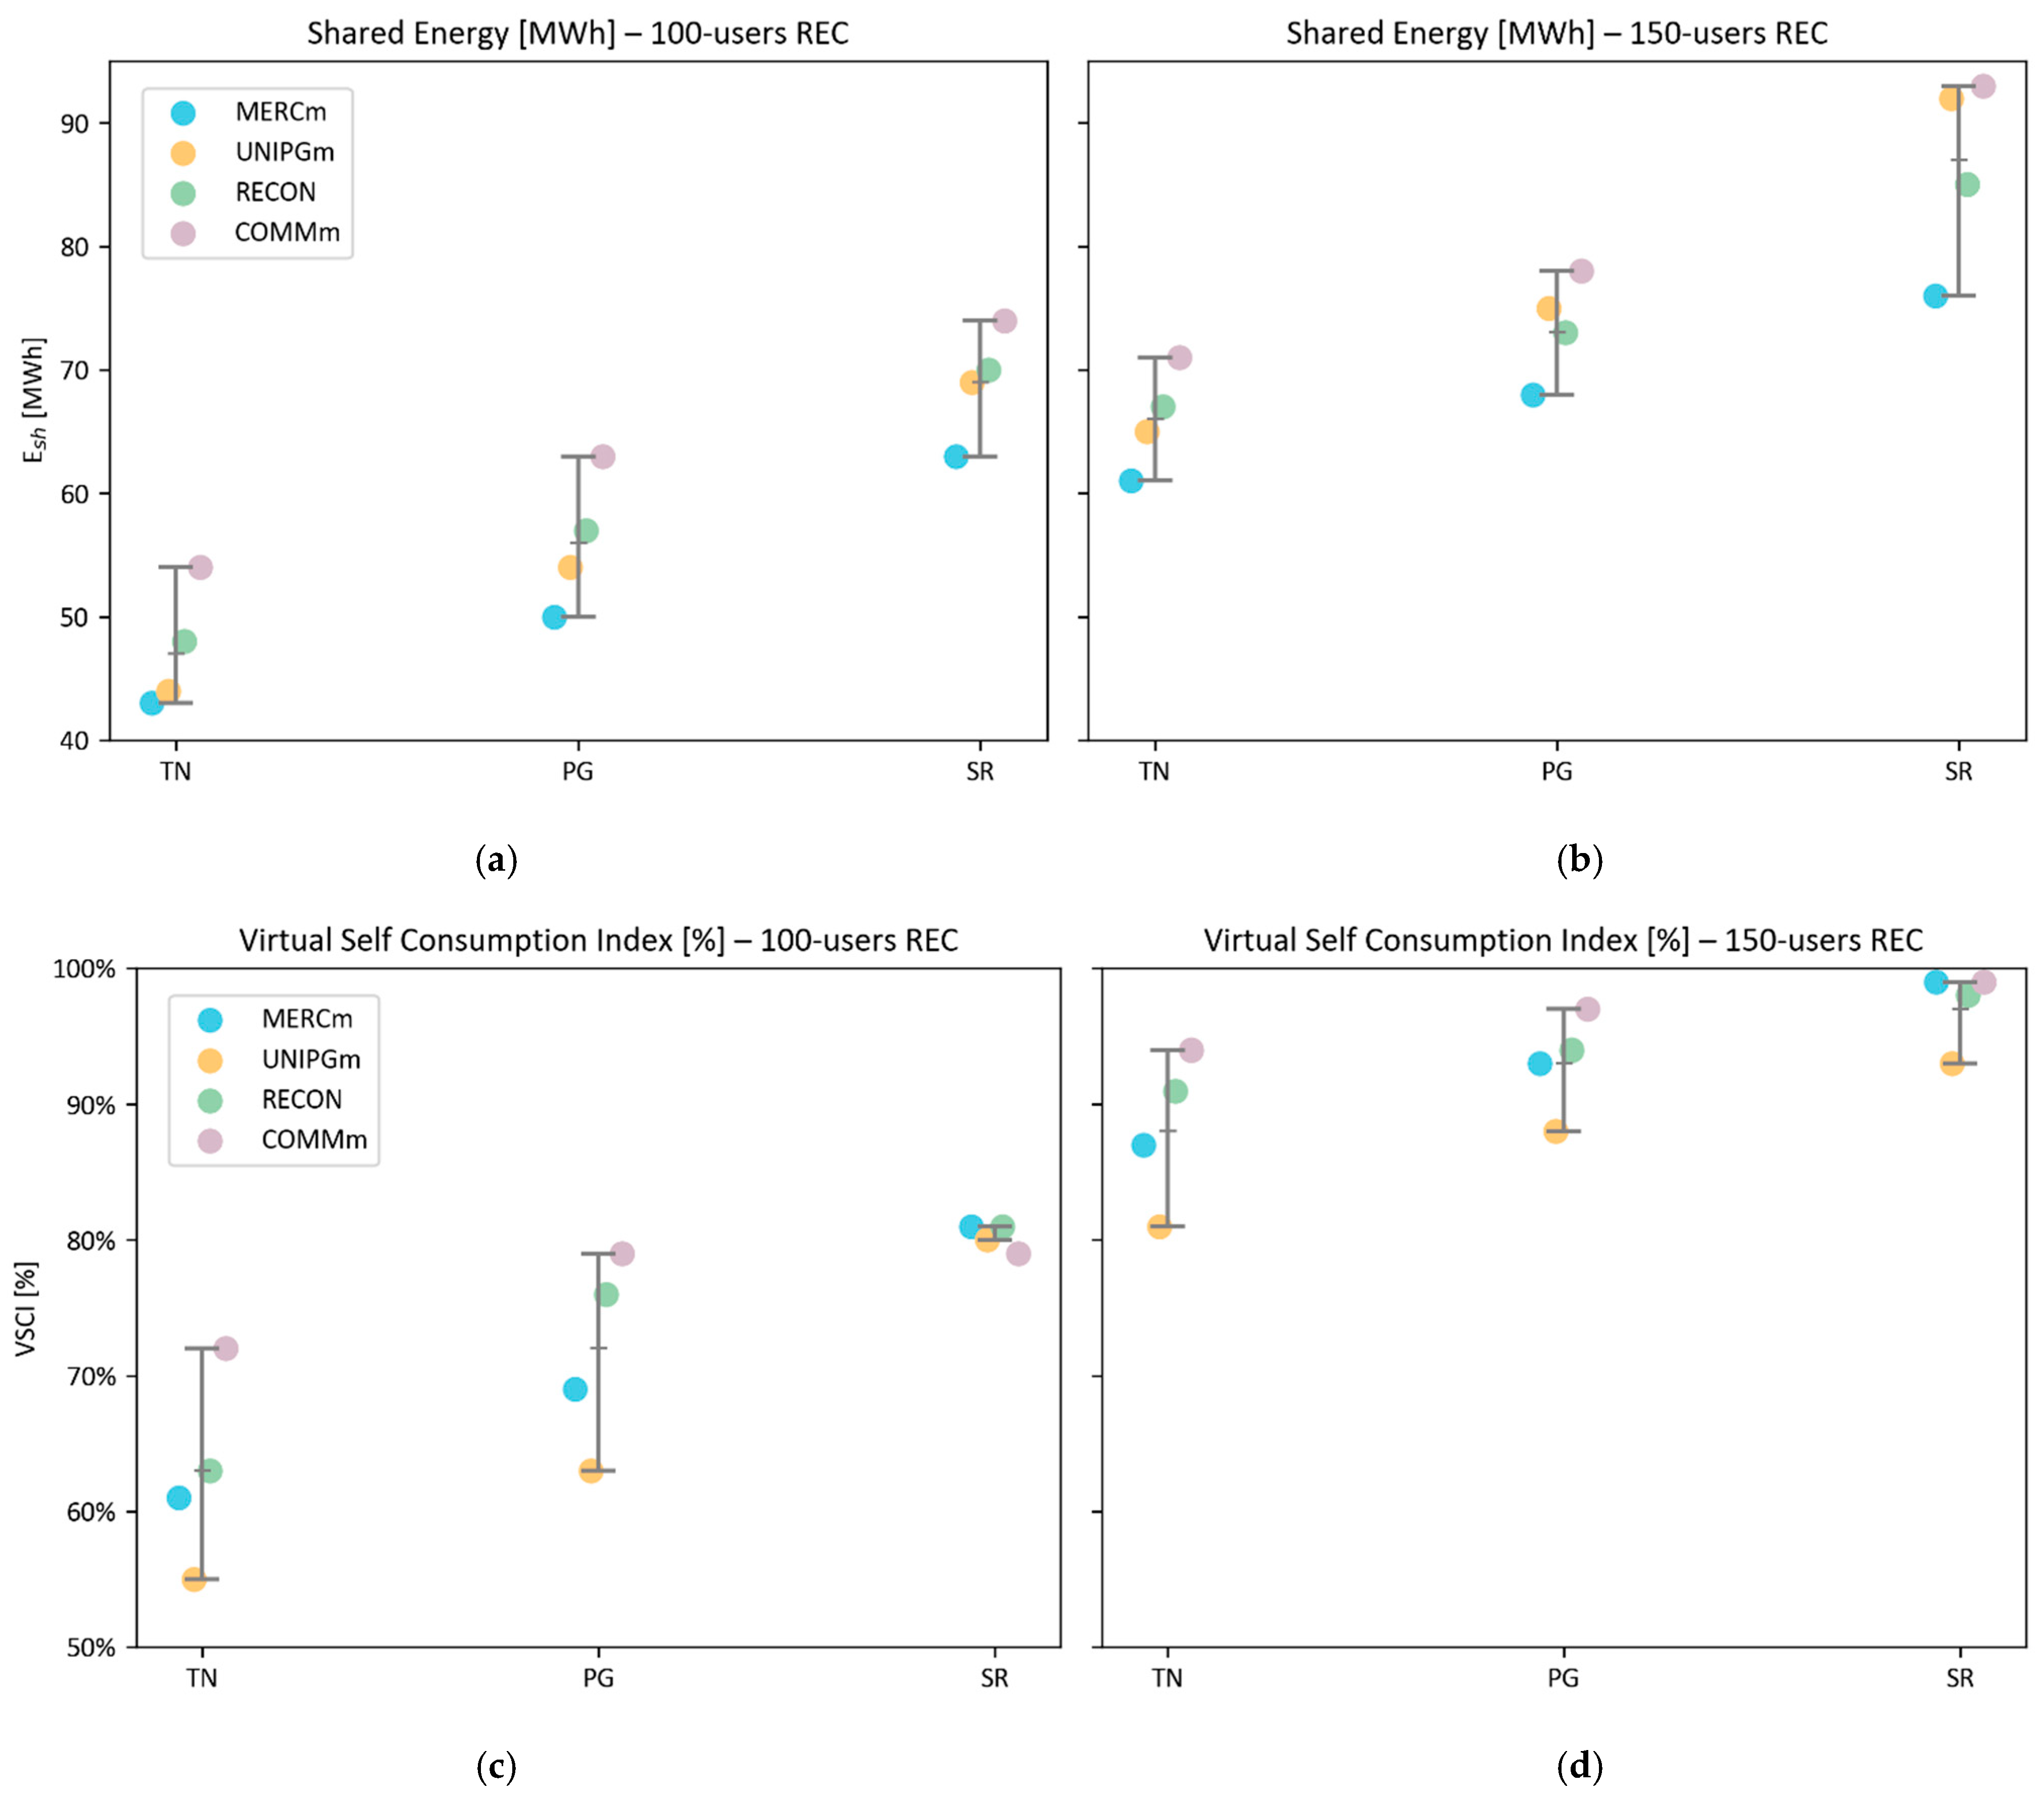
The simulations carried out using the various algorithms produced the results summarized below. Table 4 presents the energy performance indicators obtained for the 100-user scenario, together with the coefficient of variation (CV), which is reported to assess the variability of the results among the different methods. The energy fed into the grid, physical self-consumption, and the physical self-consumption index remain unchanged between the 100-user and 150-user scenarios, as the total installed PV capacity and prosumer configuration are identical. Conversely, Figure 5 graphically illustrates the results for shared energy and the corresponding virtual self-consumption index for the two REC sizes.
Table 4.
Energy performance indicators for the analyzed REC configurations, for the 100-user scenario.
Figure 5.
Shared energy (a,b) and virtual self-consumption index (c,d) for the 100-user and 150-user REC scenarios across locations and simulation tools.
3.2.1. Influence of Geographical Location and REC Size
Geographical location significantly influences REC performance. At a geographic level, the percentage of energy shared is higher in Southern Italy. This is partly due to greater PV producibility, but primarily associated with higher per capita consumption: the ratio between consumption and production is indeed higher than in the North. As a result, a larger portion of the energy produced is effectively shared among the community users, increasing both the total amount of shared energy and its percentage relative to the energy fed into grid.
Increasing the number of consumer users in the REC while keeping the total produced energy constant leads to a higher consumption-to-production ratio, and consequently, to an increase in total shared energy. The mechanism is similar to that observed for the higher share of energy in Southern Italy: as the number of users grows, more individuals can potentially benefit from the available energy, thereby increasing the overall share of energy that is actually shared.
Despite differences in absolute values, all simulation tools consistently capture these trends, confirming the robustness of relative performance comparisons across tools.
3.2.2. Impact of Modelling Assumptions on REC Performance Results
A comparison across simulation tools highlights systematic differences that can be interpreted considering their underlying modelling assumptions. The differences among the tools remain consistent across different REC sizes.
- MERCm shows the highest values of physical self-consumption and its share relative to production. This may be due to the use of the Liu–Jordan model for the profiles, which simplifies the PV production curve, resulting in greater simultaneity between production and consumption, and consequently increasing physical self-consumption.
- UNIPGm generally presents higher values of energy fed into the grid and not shared. This is likely linked to the more detailed historical profiles, which highlight a greater mismatch between production and consumption, leading to increased energy fed into grid that is not directly self-consumed by the users.
- COMMm, on the other hand, shows higher values of shared energy in most cases. This behaviour can be attributed to differences in the definition of residential consumption profiles, based on GSE data.
- RECON provides intermediate values compared to the other tools.
Overall, the results indicate that algorithm outputs exhibit limited variability across tools for the analyzed scenarios, although non-negligible differences can still arise due to tool-specific assumptions and input handling. For example, MERCm, despite relying on limited input data, provides results that are consistent with those obtained using more detailed tools for the analyzed scenarios. However, selecting a tool requires careful consideration of each tool’s underlying assumptions and a case-by-case evaluation of whether they are appropriate for the intended simulation. In the case of UNIPGm, a production profile based on a specific year is used, which may not necessarily represent the expected producibility for the year under analysis. Conversely, using an average across multiple years may also fail to perfectly capture reality. For COMMm, monthly consumption profiles were standardized, as the tool does not allow for input of annual data that are internally distributed. This limitation, combined with the absence of more detailed monthly consumption data, can influence the final results. RECON, on the other hand, tends to provide intermediate values compared to the other tools, making it a balanced choice for preliminary simulations, also due to its ease of use and moderate complexity of required input data.
Thus, the choice of computational tool can influence the final results; consequently, it is never completely neutral and must be carefully evaluated considering the assumptions and data available.
3.2.3. Variability Analysis and Robustness of Simulation Outputs
To evaluate the reliability of simulation results, the coefficient of variation (CV = standard deviation/mean) was calculated across tools for each performance indicator and simulation scenario. Results show that variability among tools remains below 15% for all analyzed indicators. Shared energy exhibits the highest variability, while physical self-consumption indicators show lower dispersion.
To provide a physical context for the results, the variability of shared energy was compared with the historical variability of PV producibility in the three locations considered (PG, TN, SR) derived from multi-year datasets (2005–2023). The CV of PV producibility generally ranges from 3% to 6%, while the variability of shared energy across tools ranges from 5% to 9%, considering scenarios with 100 and 150 users. These results confirm that variability remains stable across community sizes.
Overall, the variability introduced by different simulation tools is comparable to the intrinsic climatic variability of PV production and remains within the same order of magnitude. Since PV production is the primary driver of shared energy, and, consequently, of the economic performance of a REC, this level of variability is consistent with the uncertainty that naturally characterizes prefeasibility assessments. In other words, differences within the 5–15% range reflect a magnitude of uncertainty that is comparable to the inter-annual variability of the solar resource itself, which directly affects both technical and economic outcomes. While this suggests a certain robustness of shared energy estimates across tools, tool-specific assumptions can still affect individual performance indicators and should therefore be carefully considered in REC prefeasibility analyses. Additional economic parameters, such as energy price assumptions, may further amplify or mitigate these effects, reinforcing the need for transparent sensitivity analyses when supporting investment or policy decisions.
4. Conclusions
This study focuses on the analysis of models supporting the transition to decentralized energy systems, with particular reference to RECs, which represent a key pillar of the European energy strategy. In particular, this work provides a systematic quantitative cross-comparison of different REC simulation tools applied to identical community configurations, addressing a gap in the current literature where tools are typically evaluated separately or under heterogeneous modelling assumptions.
In the preliminary assessment of the sustainability of implementing a REC, one of the main parameters is shared energy, for which numerous simulation tools have been developed in the literature, mainly differing in the treatment of input data related to user consumption profiles and renewable energy production, in this case from photovoltaic systems. However, despite the extensive literature, a systematic comparison of simulation tools applied to identical REC configurations is still lacking, which is necessary to evaluate how differences in input data and modeling assumptions may influence the estimation of shared energy and the robustness of the results.
To address this issue, a multi-scenario comparative analysis was conducted on four simulation tools, developed in academic contexts (MERCm, UNIPGm), as open tools by research institutions (RECON), and as commercial software (COMMm), characterized by different modelling complexity and input data requirements. The main differences among the tools concern both photovoltaic energy production and user consumption profiles: most tools (UNIPGm, RECON, and COMMm) rely on the PVGIS database, with different assumptions regarding the selection of annual profiles, whereas one tool is based on the Liu–Jordan model for estimating annual solar radiation. Similarly, residential consumption profiles are derived from average data provided by national agencies (GSE and ARERA), with varying approaches to data preprocessing and aggregation. The tools were applied to six residential REC configurations in three Italian locations with different solar irradiation levels. Each configuration included prosumers equipped with photovoltaic systems with multiple orientations and different community sizes in order to evaluate the influence of both geographical and structural parameters on shared energy estimation.
A first relevant result emerges from the comparison of photovoltaic production modelling approaches. Although total annual production values are generally comparable, significant differences emerge in the hourly distribution of photovoltaic generation. PVGIS-based models provide a more realistic representation of module orientation effects, particularly for east and west exposures. In contrast, the Liu–Jordan model tends to produce more homogeneous profiles, resembling a south-oriented installation, with a lower capacity to represent intra-day variability related to orientation.
The most significant outcome of the study concerns the comparison of simulation outputs across tools. Despite differences in modelling assumptions and data aggregation methods, deviations in shared energy values remain generally limited, with coefficients of variation reaching a maximum of 15%. This provides quantitative evidence of the robustness of shared energy estimates with respect to the choice of simulation tool. Moreover, the observed level of variability is comparable to the intrinsic inter-annual variability of photovoltaic production, which represents the primary driver of REC economic performance; therefore, the modelling dispersion identified in this study remains within the range of uncertainty that naturally characterizes prefeasibility assessments. It should be noted that these findings specifically concern PV-only, residential RECs, and results may differ in more complex communities including battery storage, electric vehicle charging, or demand-side flexibility strategies.
These findings suggest that simple simulation tools, such as MERCm, can provide sufficiently reliable estimates of shared energy for preliminary REC prefeasibility analyses, particularly when detailed input data are not yet available. At the same time, the study confirms that the choice of tool is not fully neutral, as tool-specific assumptions related to photovoltaic modelling and consumption profile generation can influence individual performance indicators and should therefore be carefully interpreted by public administrations and technical operators. However, in economically borderline cases, where the expected return on investment is strongly dependent on incentive revenues linked to shared energy, variability of this magnitude may influence financial indicators such as payback time. In such contexts, tool selection may affect final decision-making, particularly when modelling assumptions alter the hourly overlap between production and consumption. From an applied perspective, the results support the use of simplified simulation frameworks as effective decision-support instruments for public administrations, energy planners, and technical operators involved in the early-stage design of Renewable Energy Communities.
Finally, the study identifies relevant future developments. First, the integration of real consumption datasets from statistically representative residential user samples would improve the reliability of simulation outputs, especially in contexts with a large number of users. Additionally, future studies should investigate behavioural changes of community members following REC implementation and evaluate the role of demand-side flexibility strategies in enhancing shared energy performance. These developments would contribute to further improving the accuracy and realism of REC simulation methodologies.
Author Contributions
Conceptualization, A.P. and E.M.; methodology, A.P. and E.M.; software, L.F. and A.P.; validation, A.P. and E.M.; formal analysis, L.F. and A.P.; investigation, L.F. and A.P.; resources, L.F. and A.P.; data curation, L.F. and A.P.; writing—original draft preparation, L.F.; writing—review and editing, L.F., A.P. and E.M.; visualization, L.F., A.P., E.M. and L.M.; supervision, A.P., E.M. and L.M.; project administration, A.P.; funding acquisition, A.P. and L.M. All authors have read and agreed to the published version of the manuscript.
Funding
The research was funded by Finanziamento competitivo di progetti di ricerca 2024 (25 FIN/RIC) Università telematica Mercatorum: Analisi comparativa tra simulatori ed implementazione del “Simulatore CER”. This work was also part of a project funded by the Program Agreement between the Italian National Agency for New Technologies, Energy and Sustainable Economic Development (ENEA) and the Ministry of Environment and Energy Safety (MASE) for the Electric System Research, in the framework of its Implementation Plan for 2022–2024, Project 1.5 High-efficiency buildings for the energy transition” (CUP I53C22003050001), Work Package 4 “Promotion of energy efficiency through increased consumption autonomy, enhanced building management flexibility, and the development of energy communities”.
Data Availability Statement
The original contributions presented in this study are included in the article. Further inquiries can be directed to the corresponding author.
Acknowledgments
The authors would like to extend their gratitude to the Municipality of Assisi for the collaboration in the research activity.
Conflicts of Interest
The authors declare no conflicts of interest.
Abbreviations
The following abbreviations are used in this manuscript:
| ARERA | Autorità di Regolazione per Energia Reti e Ambiente |
| BOS | Balance of System |
| CSC | Collective Self-Consumption |
| CV | Coefficient of Variation |
| DSO | Distribution System Operator |
| Ein | Energy fed into the grid |
| Epsc | Physical self-consumption |
| Esh | Shared energy |
| GHI | Global Horizontal Irradiation |
| GSE | Gestore dei Servizi Energetici |
| MILP | Mixed Integer Linear Programming |
| PNRR | Piano Nazionale di Ripresa e Resilienza |
| PSCI | Physical Self-Consumption Index |
| PV | Photovoltaic |
| PVGIS | Photovoltaic Geographical Information System |
| REC | Renewable Energy Community |
| RED II | Renewable Energy Directive II |
| RED III | Renewable Energy Directive III |
| RSE | Ricerca sul Sistema Energetico |
| RY | Reference Year |
| SECAP | Sustainable Energy and Climate Action Plan |
| SME | Small- and Medium-sized Enterprise |
| VBA | Visual Basic for Applications |
| VSCI | Virtual Self-Consumption Index |
References
- Ercoli, P.; Mugnini, A.; Arteconi, A. Demand response for renewable energy communities: Exploring coordination of prosumer-generated PV and flexible aggregated demand in the Italian framework. Energy Build. 2025, 340, 115814. [Google Scholar] [CrossRef] [Scilit]
- Zhou, Y. Energy-Sharing Economy with Renewable Integration and Management in Communities—A State-of-the-Art Review. Adv. Energy Sustain. Res. 2024, 5, 12. [Google Scholar] [CrossRef] [Scilit]
- European Parliament; Council of the European Union. Directive (EU) 2018/2001 of the European Parliament and of the Council of 11 December 2018 on the Promotion of the Use of Energy from Renewable Sources; European Parliament: Bruxelles, Belgium; Council of the European Union: Bruxelles, Belgium, 2018. [Google Scholar]
- European Parliament; Council of the European Union. Directive (EU) 2023/2413 of the European Parliament and of the Council of 18 October 2023 Amending Directive (EU) 2018/2001, Regulation (EU) 2018/1999 and Directive 98/70/EC as Regards the Promotion of Energy from Renewable Sources, and Repealing Council Directive (EU) 2015/652; European Parliament: Bruxelles, Belgium; Council of the European Union: Bruxelles, Belgium, 2023. [Google Scholar]
- Decreto Legislativo 8 Novembre 2021, n.199. Attuazione Della Direttiva (UE) 2018/2001 del Parlamento Europeo e del Consiglio, Dell’11 Dicembre 2018, Sulla Promozione Dell’uso Dell’energia da Fonti Rinnovabili. Available online: https://www.gazzettaufficiale.it/eli/id/2021/11/30/21G00214/sg (accessed on 19 December 2025).
- Hoicka, C.E.; Lowitzsch, J.; Brisbois, M.C.; Kumar, A.; Ramirez Camargo, L. Implementing a just renewable energy transition: Policy advice for transposing the new European rules for renewable energy communities. Energy Policy 2021, 156, 112435. [Google Scholar] [CrossRef] [Scilit]
- Ministero Dell’ambiente e Della Sicurezza Energetica. Regole Operative Elaborate e Trasmesse dal GSE S.p.A. ai Sensi Dell’articolo 11 del Decreto del Ministro Dell’ambiente e Della Sicurezza Energetica del 7 Dicembre 2023, n. 414. Available online: https://www.mase.gov.it/sites/default/files/ALLEGATO%201%20Regole%20operative%20CACER%20def.pdf (accessed on 19 December 2025).
- Moretti, E.; Stamponi, E. The Renewable Energy Communities in Italy and the Role of Public Administrations: The Experience of the Municipality of Assisi between Challenges and Opportunities. Sustainability 2023, 15, 11869. [Google Scholar] [CrossRef] [Scilit]
- Di Somma, M.; Dolatabadi, M.; Burgio, A.; Siano, P.; Cimmino, D.; Bianco, N. Optimizing virtual energy sharing in renewable energy communities of residential users for incentives maximization. Sustain. Energy Grids Netw. 2024, 39, 101492. [Google Scholar] [CrossRef] [Scilit]
- Giudice, R.; Piscitelli, M.S.; Capozzoli, A. A performance-based incentive sharing mechanism for communities of residential end users leveraging an ontology-driven approach. Build. Environ. 2026, 287, 113786. [Google Scholar] [CrossRef] [Scilit]
- Brandi, S.; Rando Mazzarino, P.; Schiera, D.S.; Bilardo, M.; Barbierato, L.; Bottaccioli, L.; Patti, E.; Capozzoli, A. Scenario analysis for renewable energy communities through advanced co-simulation infrastructure. Appl. Energy 2025, 394, 126106. [Google Scholar] [CrossRef] [Scilit]
- Blečić, I.; Carrus, A.S.; Congiu, E.; Desogus, G.; Muroni, E.; Saiu, V. Renewable energy communities design: A decision support tool for integrated impact assessment. Insights from the first REC in Cagliari, Italy. J. Clean. Prod. 2025, 510, 145600. [Google Scholar] [CrossRef] [Scilit]
- Moretti, E.; Fagotti, L.; Stoklin, S.; Stamponi, E. Assessing economic viability and community integration in renewable energy communities for a case study in Italy. In Proceedings of the 37th International Conference on Efficiency, Cost, Optimization, Simulation and Environmental Impact of Energy Systems (ECOS 2024), Rhodes, Greece, 30 June–4 July 2024; pp. 1315–1326. [Google Scholar] [CrossRef] [Scilit]
- Mazzola, E.; Scarpa, M.; Gastaldi, F. Renewable Energy Communities as Means of the Fulfilment of Sustainable Energy and Climate Action Plans in Historic Urban Districts: The Case Study of Villorba—Treviso (Italy). Energies 2025, 18, 5440. [Google Scholar] [CrossRef] [Scilit]
- Pizzuti, I.; Delibra, G.; Corsini, A. Design guidelines for renewable energy communities including end-use electrification scenarios. Energy Convers. Manag. 2025, 342, 120155. [Google Scholar] [CrossRef] [Scilit]
- Anselmo, S.; Safaeianpour, A.; Moghadam, S.T.; Ferrara, M. GIS-based solar radiation modelling for photovoltaic potential in cities: A sensitivity analysis for the evaluation of output variability range. Energy Rep. 2024, 12, 4656–4669. [Google Scholar] [CrossRef] [Scilit]
- Buonomano, A.; Giuzio, G.F.; Maka, R.; Russo, G.; Zizzania, S. GIS-driven planning of energy communities: Optimising renewables, storage, and demand aggregation in urban areas. Renew. Energy 2026, 256, 124521. [Google Scholar] [CrossRef] [Scilit]
- Fardian, A.K.; Ranjbar, S.; Cimmino, L.; Vecchi, F.; Hachem-Vermette, C.; Eicker, U.; Calise, F. Techno-Economic Assessment of Net Metering and Energy Sharing in a Mixed-Use Renewable Energy Community in Montreal: A Simulation-Based Approach Using Tool4Cities. Energies 2025, 18, 5756. [Google Scholar] [CrossRef] [Scilit]
- El Kontar, R.; Polly, B.; Charan, T.; Fleming, K.; Moore, N.; Long, N.; Goldwasser, D. URBANopt: An Open-Source Software Development Kit for Community and Urban District Energy Modeling. In Proceedings of the 2020 Building Performance Analysis Conference and SimBuild, Virtual, 29 September–1 October 2020. [Google Scholar]
- Darvishvand, L.; Kamkari, B.; Huang, M.J.; Hewitt, N.J. A systematic review of explainable artificial intelligence in urban building energy modeling: Methods, applications, and future directions. Sustain. Cities Soc. 2025, 128, 106492. [Google Scholar] [CrossRef] [Scilit]
- Velosa, N.; Gomes, E.; Morais, H.; Pereira, L. PROCSIM: An Open-Source Simulator to Generate Energy Community Power Demand and Generation Scenarios. Energies 2023, 16, 1611. [Google Scholar] [CrossRef] [Scilit]
- Gomes, E.; Pereira, L.; Esteves, A.; Morais, H. PyECOM: A Python tool for analyzing and simulating Energy Communities. SoftwareX 2023, 24, 101580. [Google Scholar] [CrossRef] [Scilit]
- Casella, V.; Ferro, G.; Parodi, L.; Robba, M. Maximizing shared benefits in renewable energy communities: A Bilevel optimization model. Appl. Energy 2025, 386, 125562. [Google Scholar] [CrossRef] [Scilit]
- Loggia, R.; Menichelli, R.; Flamini, A.; Galasso, A.; Massaccesi, A.; Moscatiello, C.; Jasinski, M.; Martirano, L. A Monitoring Platform Tool for Energy Communities Optimization and AI Applications. In Proceedings of 2025 IEEE/IAS 61st Industrial and Commercial Power Systems Technical Conference (I&CPS), Montreal, QC, Canada, 11–14 May 2025; pp. 1–6. [Google Scholar] [CrossRef] [Scilit]
- Martiniello, L.; Presciutti, A. Implementation Models of RECs in Public-Private Partnerships: The Distribution of Risks and Benefits among the Participants in the Operation. Sustainability 2024, 16, 7358. [Google Scholar] [CrossRef] [Scilit]
- RECON—Renewable Energy Community Simulator. Available online: https://recon.smartenergycommunity.enea.it (accessed on 19 December 2025).
- Vecchi, F.; Stasi, R.; Berardi, U. Modelling tools for the assessment of Renewable Energy Communities. Energy Rep. 2024, 11, 3941–3962. [Google Scholar] [CrossRef] [Scilit]
- Liu, B.Y.H.; Jordan, R.C. The interrelationship and characteristic distribution of direct, diffuse and total solar radiation. Sol. Energy 1960, 4, 1–19. [Google Scholar] [CrossRef] [Scilit]
- Meloni, C.; Blaso, L.; Branchetti, S.; Caldera, M.; Clerici Maestosi, P.; D’Agosta, G.; Frascella, A.; Gozo, N.; Massa, G.; Moretti, F.; et al. Energy and Digital Transitions for Energy Communities: Tools and Methodologies to Promote Digitalization in Italy. Electronics 2025, 14, 2027. [Google Scholar] [CrossRef] [Scilit]
- UNI 10349:2016; Prestazioni Termiche dei Fabbricati—Dati Climatici per la Progettazione. Ente Italiano di Normazione (UNI): Milano, Italy, 2016.
- Photovoltaic Geographical Information System (PVGIS)—The Joint Research Centre: EU Science Hub. 2024. Available online: https://joint-research-centre.ec.europa.eu/photovoltaic-geographical-information-system-pvgis_en (accessed on 19 December 2025).
- LeBaron, B.; Dirmhirn, I. Strengths and limitations of the Liu and Jordan model to determine diffuse from global irradiance. Sol. Energy 1983, 31, 167–172. [Google Scholar] [CrossRef] [Scilit]
- GSE. Standard Load Profiles for Renewable Energy Communities. 2025. Available online: https://www.gse.it/servizi-per-te/news/comunita-di-energia-rinnovabile-e-gruppi-di-autoconsumatori-pubblicati-i-profili-standard-per-prelievo-e-immissione-2025 (accessed on 19 December 2025).
- ARERA. Domestic Electricity Consumption Statistics. Available online: https://www.arera.it/dati-e-statistiche/dettaglio/analisi-dei-consumi-dei-clienti-domestici. (accessed on 19 December 2025).
- Presciutti, A.; Moretti, E.; Fagotti, L. Comparative analysis of Renewable Energy Community simulators. J. Phys. Conf. Ser. 2025, 3143, 012110. [Google Scholar] [CrossRef] [Scilit]

Disclaimer/Publisher’s Note: The statements, opinions and data contained in all publications are solely those of the individual author(s) and contributor(s) and not of MDPI and/or the editor(s). MDPI and/or the editor(s) disclaim responsibility for any injury to people or property resulting from any ideas, methods, instructions or products referred to in the content. |
© 2026 by the authors. Licensee MDPI, Basel, Switzerland. This article is an open access article distributed under the terms and conditions of the Creative Commons Attribution (CC BY) license.