


Abstract
High-temperature Solid Oxide Fuel Cells (SOFCs) typically operate under conditions involving repeated thermal cycling. The transient temperature rise during thermal cycling directly affects the stress distribution within the SOFC structure, particularly inducing non-uniform thermal stresses in the electrolyte layer. This can readily lead to cracking and fracture of the SOFCs, potentially degrading overall system performance. Therefore, investigating the effects of cyclic thermal loading on structural stress distribution is essential for optimizing SOFC design. To this end, this study developed a coupled thermo-chemo-mechanical finite element analysis for a planar tubular SOFC. The model is employed to analyze the influence of thermal impact on the thermal stress distribution within the cell structure under multiple thermal cycling conditions. The results indicate that both the transient temperature rise during SOFC operation and the number of thermal cycles significantly affect the peak stress in the electrolyte layer and the overall performance stability of the cell. By optimizing the geometric configuration of the flat-tubular and the transient temperature rise during thermal cycling, the thermal stress field distribution in the electrolyte can be improved. These findings provide theoretical guidance for optimizing the design and engineering application of high-temperature SOFCs.
1. Introduction
During the critical phase of the global energy structure transitioning toward cleaner and low-carbon development, the Solid Oxide Fuel Cell (SOFC), as a highly efficient and environmentally friendly energy conversion device, can directly use a variety of fuels such as hydrogen, natural gas, and biomass gas, which gives it significant competitive advantages. First, SOFCs exhibit high power generation efficiency, theoretically exceeding 60% in theory, and this efficiency can reach approximately 80% when combined with waste heat utilization. Second, they achieve zero-pollution emissions, producing only water and carbon dioxide, or only water when hydrogen is used. Due to these advantages, SOFCs are considered a key technical solution to the challenges of fossil energy shortage and environmental pollution. They have been applied in distributed power generation, transportation systems, and backup power supply [1,2]. Among these designs, the flat-tubular SOFC has gained attention in recent years because it combines the advantages of flat-plate and tubular structures. It retains the simple manufacturing process, short current conduction path with reduced ohmic loss, and high power density of flat-plate SOFCs, while also providing the ease of stacking, high assembly flexibility, and stable operation observed in tubular SOFCs [3,4,5].
The flat-tubular SOFCs operate at high temperatures ranging from 600 to 1000 °C [6]. This harsh environment presents major challenges to durability and reliability. High temperatures lead to extended start-up times, often requiring several hours to reach the operating temperature [7]. This slows system response and increases energy consumption and operational complexity. Additionally, different functional layers in the cell structure have different coefficients of thermal expansion (CTE) [8,9]. For example, the CTE of 8YSZ electrolyte [10] is approximately 10.3 × 10⁻⁶ K−1, that of the NiO-8YSZ [11] anode composite is about 12.2 × 10⁻⁶ K−1, and that of the LSCF cathode material is roughly 12.5 × 10⁻⁶ K−1. These mismatches can generate constrained deformation between layers during heat-up and cool-down, producing complex thermal stresses within the cell [12,13]. During practical operation, SOFCs frequently undergo repeated start-up, operation, and shutdown cycles. Each cycle includes heating, high-temperature operation, and cooling stages, and the temperature distribution in each stage is highly non-uniform [14]. For instance, temperature gradients appear between the cell edge and interior during heating. During operation, exothermic electrochemical reactions couple with gas flow and heat transfer, and during cooling, the difference in heat dissipation between the surface and inner regions can further exacerbate local stress concentration [15].
Long-term and repeated thermal stress is widely recognized as a primary cause of structural failure in the flat-tubular SOFCs [16,17]. The electrolyte layer, which is responsible for ion conduction, gas sealing, and structural support, is typically made of brittle ceramics such as 8YSZ [18]. Brittle ceramics generally have fracture strengths of about 400–500 MPa. When thermal stress approaches or exceeds this range, microcracks or through-thickness cracks may form, allowing fuel and oxidant mixing or interrupting the ion conduction path, leading directly to cell failure [19,20]. The anode support layer, with a porosity of approximately 0.23–0.46 [21], can buffer deformation to some extent. However, uneven thermal stress under repeated cycling may cause pore collapse or interfacial delamination, compromising its structural integrity and reducing its electronic conduction performance. The cathode layer may experience aggregation of active components or reduced interfacial bonding strength with the electrolyte under thermal stress, weakening electrocatalytic activity and slowing the oxygen reduction reaction [22,23,24]. In addition, the metal interconnect used in cell stacking is susceptible to oxidative corrosion at high temperatures. The formation of a Cr2O3 oxide film increases contact resistance, compromising the performance and reducing the service life of the SOFC stack [25,26,27,28]. Studies have shown that thermal stress-induced structural failures account for more than 60% of total SOFC failures. Therefore, the actual service life of SOFCs is often far shorter than the intended design life, which seriously restricts the industrialization of the flat-tubular SOFC technology [27,28].
Considerable research has been conducted both domestically and internationally to address the thermal stress issues of the flat-tubular SOFCs. For instance, Cai et al. [29] performed a numerical study on heat/fluid transfer and thermal stress in anode-supported flat-plate SOFCs, concluding that the composition of the fuel inlet significantly influences the distribution of temperature and gas concentration. Atkinson et al. [30] experimentally investigated the residual stress distribution of flat-plate SOFCs under thermal cycles and found that stress concentration in the electrolyte layer is the primary cause of crack initiation. Li et al. [31] studied the effect of sinusoidal flow channel structures on both steady-state and transient thermal stresses in SOFCs, with results indicating that the horizontal sinusoidal flow channel structure performs better in both aspects. Duan et al. [32,33] used numerical simulations to analyze the effect of heating rate on thermal stress in tubular SOFCs and suggested that reducing the heating rate can help alleviate stress accumulation. Xie et al. [33] focused on the impact of interface morphology on thermal stress in SOFCs and found that optimizing interface roughness can reduce stress concentration. Wang et al. [34] examined thermal effects in ammonia-fueled SOFCs and compared them with traditional flat-tubular SOFCs, discovering that symmetric SOFCs exhibit significantly improved stability during operation. Their findings showed that this structure offers stronger redox cycle resistance, better thermal cycle resistance, superior discharge performance, and more efficient stacking methods. Jiang et al. [35,36] investigated the effect of Z-type and serpentine flow channels on the thermal stress of the flat-tubular SOFCs. Luo et al. [37] studied the high-temperature creep damage and failure probability of symmetric flat-tubular SOFCs, discussing the effect of fuel channel size on thermal stress.
However, research on the thermo-mechanical behavior of the flat-tubular SOFCs with a dual-cathode symmetric structure under thermal cycling conditions remains limited. Most existing studies focus on flat-plate or traditional tubular SOFCs, and relatively few have investigated the thermal cycle stress in the flat-tubular SOFCs with complex structures, such as dual-cathode symmetric designs [36] or multi-fuel gas channels. In contrast to single-cathode designs, the symmetric placement of cathodes creates unique thermal boundary conditions and alters the stress distribution, factors that can profoundly affect the long-term durability of the cell. Specifically, there is a lack of systematic analyses of thermal stress evolution, stress distribution differences among various functional layers, and long-term failure risks, particularly under factors like maximum operating temperature, transient temperature rise during thermal cycling, and cycle number. For example, key issues such as the quantitative influence of different maximum operating temperatures on electrolyte layer stress, the criteria for selecting the optimal transient temperature rise during thermal cycling, and the critical threshold of stress accumulation after multiple thermal cycles remain unclear. These gaps make it challenging to provide accurate theoretical support for the structural optimization and operational parameter regulation of the flat-tubular SOFCs.
To address this, the present study focuses on the flat-tubular SOFCs with a dual-cathode symmetric structure. Using the COMSOL 6.3 finite element method, together with theoretical models [38,39] and the flat-tubular SOFC geometric model [40], a finite element analysis model for the thermo-chemo-mechanical multiphysics coupling of the SOFC was developed. The maximum operating temperatures were set at 700 °C, 800 °C, and 900 °C, while transient temperature rise rates were set at 5 °C/min, 10 °C/min, and 60 °C/min, and the number of thermal cycles was varied at 1, 4, 7, and 10 cycles. The study systematically investigates the influence of transient temperature rise during thermal cycling and number of thermal cycles on the thermal stress field distribution of SOFCs under thermal cycle service conditions. By analyzing the magnitude, distribution, and evolution trends of the first principal stress in each functional layer of SOFCs, key factors affecting thermal stress distribution are identified. In this study, the first principal stress refers to the maximum principal stress, which is commonly used as an indicator of tensile failure risk for brittle ceramic components. The aim of this study is to provide fundamental data for optimizing the structural design of the flat-tubular SOFCs, adjusting service environment parameters, and enhancing long-term reliability, offering valuable insights for the broader engineering application of the flat-tubular SOFC technology.
2. Theoretical Foundations
In this study, each layer of the cell is assumed to be undamaged and isotropic. Damage accumulation mechanisms such as microcrack propagation are neglected, and the deformation induced by thermal stress is small within the elastic range. The numerical solution method and procedure adopted in this study follow the general standard schemes commonly used in the field, as described in the relevant references [41].
2.1. Governing Equations for the Gas Flow Field
To account for the effect of porous materials on gas fuel flow in solid oxide fuel cells (SOFCs), the Navier–Stokes equations are modified by incorporating a Darcy term coupled with the effect of porosity [42]:
in Equation (1), , , represent the gas density, velocity vector, and mass source term; in Equation (2), , , , represent pressure, porosity, permeability, dynamic viscosity of the gas flow and represent the molecular weight of species , respectively.
2.2. Electrochemical Field Governing Equations
The Butler-Volmer equation relates the current density to the activation, concentration, and ohmic overpotentials [38]:
in Equations (5) and (6), , , , and denote the three-phase boundary length, exchange current density, electronic conductivity, number of transferred electrons, and concentration of species , respectively. Activation polarization is related to the charge transfer processes associated with the transport of ions and electrons [43]:
in Equations (7) and (8), , , and represent the electronic potential, ionic potential, the equilibrium potential of the anode (defined as 0 V), and the equilibrium potential of the cathode (defined as ), respectively. The expression for concentration polarization arising from porous media [43]:
in Equations (9) and (10), the subscripts and denote the anode surface and cathode surface, respectively.
The transport of ions and electrons in the electrolyte and electrodes of an SOFC gives rise to ohmic overpotential. The governing equations for ion and electron transport are as follows [42]:
in Equations (11) and (12), and denote the current density vector and electrical conductivity, the subscripts and represent ions and electrons, respectively.
The relevant parameters in the electrochemical model are listed in Table 1.
Table 1.
Electrochemical reaction parameters.
2.3. Theoretical Modelling of Heat Transfer
The operation of the flat-tubular SOFCs during service involves complex working principles. In this study, heat losses from the system to the surrounding environment are not considered in the mathematical model. A simplified adiabatic assumption is adopted for the thermal analysis, focusing on the thermal stress evolution under the prescribed thermal cycles. Based on the classical heat transfer governing equations, a three-dimensional heat transfer equation for the flat-tubular SOFCs was developed [39]:
in Equation (13), , and are the specific heat capacity of the material, the heat source term, and the effective thermal conductivity, respectively.
and are calculated as follows [38]:
in Equation (14), , and represent the porosity, the thermal conductivities of the solid and the gas, respectively. In Equation (15), , and are the effective conductivity for solid phase, effective conductivity for gas phase and gradient of temperature field, respectively.
These equations provide a quantitative description of the temperature field distribution during the three stages of thermal cycling in SOFCs: heating, high-temperature insulation, and cooling. The material properties related to the gas flow field and heat transfer for each functional layer of the SOFC are summarized in Table 2 [20].
Table 2.
Material properties.
2.4. Force Field Governing Equations
Assuming that each layer of the SOFC material behaves as an isotropic elastic body, the deformation induced by thermal stress is considered to be small, with plastic deformation and creep effects neglected. It is important to acknowledge the limitations associated with the linear elastic assumption employed in the present model. Given the operating temperature range of 700–900 °C for SOFCs, time-dependent inelastic deformations, particularly creep in the porous anode support layer, are likely to play a significant role in the long-term mechanical behavior and stress evolution of the cell. Consequently, the current predictions may not fully reflect the actual stress relaxation or accumulation mechanisms under prolonged thermal cycling. Based on isotropic elasticity theory, the governing equations for the force field are derived. Starting with the geometric equations, the relationship between strain and displacement is given by:
in Equation (16), and represent the strain and displacement, respectively.
According to static equilibrium conditions, the equilibrium equation between stress and body force is:
in Equation (17), and represent the stress and body force, respectively.
Finally, the constitutive equations are introduced to describe the relationship between stress and strain, as well as the calculation for the thermal expansion effect:
in Equations (18)–(20), , , , , are strain, stress, a fourth-order elastic stiffness tensor, elastic modulus, and Poisson’s ratio, respectively. , , , , , , , , , , , are the stress and strain components, respectively. , are the thermal expansion coefficient and the second-order identity tensor, respectively. The material parameters of the thermodynamic model are detailed in Table 3 [8,9]. The cathode layer is fabricated with high porosity to facilitate gas diffusion, resulting in its effective elastic modulus being substantially lower than that of the dense electrolyte or anode support layer. After sintering, the anode support layer exhibits relatively high density, and the nickel itself possesses a high modulus; therefore, its higher elastic modulus value is reasonable.
Table 3.
Mechanical model parameters.
2.5. Governing Equation for Species Diffusion Field
Considering the free diffusion between gas molecules and collisions on the surface of porous media, the diffusion behavior of species is described by Fick’s law combined with Knudsen diffusion law [44]:
in Equations (21)–(23), the , , , and represent the mass fraction of species , the flux of species , the tortuosity factor, the total diffusion coefficient determined by both Fick diffusion coefficient and Knudsen diffusion coefficient [45], and the mole fraction of species , respectively.
The mass conservation equation of the species diffusion model is given by:
in Equation (24), the mass source term of species is determined by the electrochemical reaction rate per unit volume per unit time. In the following Equations (25)–(27), represents the source terms for hydrogen, steam, and oxygen, respectively.
3. Finite Element Analysis of the Flat-Tubular SOFC Under Transient Thermal Cycling
3.1. Geometric Configuration
The flat-tubular SOFC combines the structural features of planar and tubular SOFCs. It inherits the advantages of planar SOFCs, such as simple fabrication, short current conduction paths, and high-power density, while also benefiting from the features of tubular SOFCs, including easy stacking, simple assembly, and good operational stability. However, under thermal cycling, the flat-tubular SOFC faces challenges such as structural deformation and potential damage due to the concentration and uneven distribution of thermal stress.
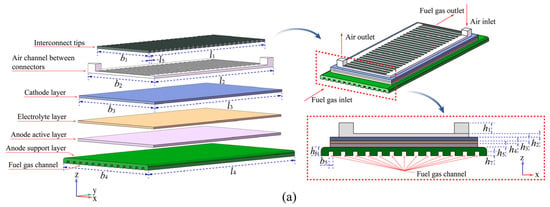
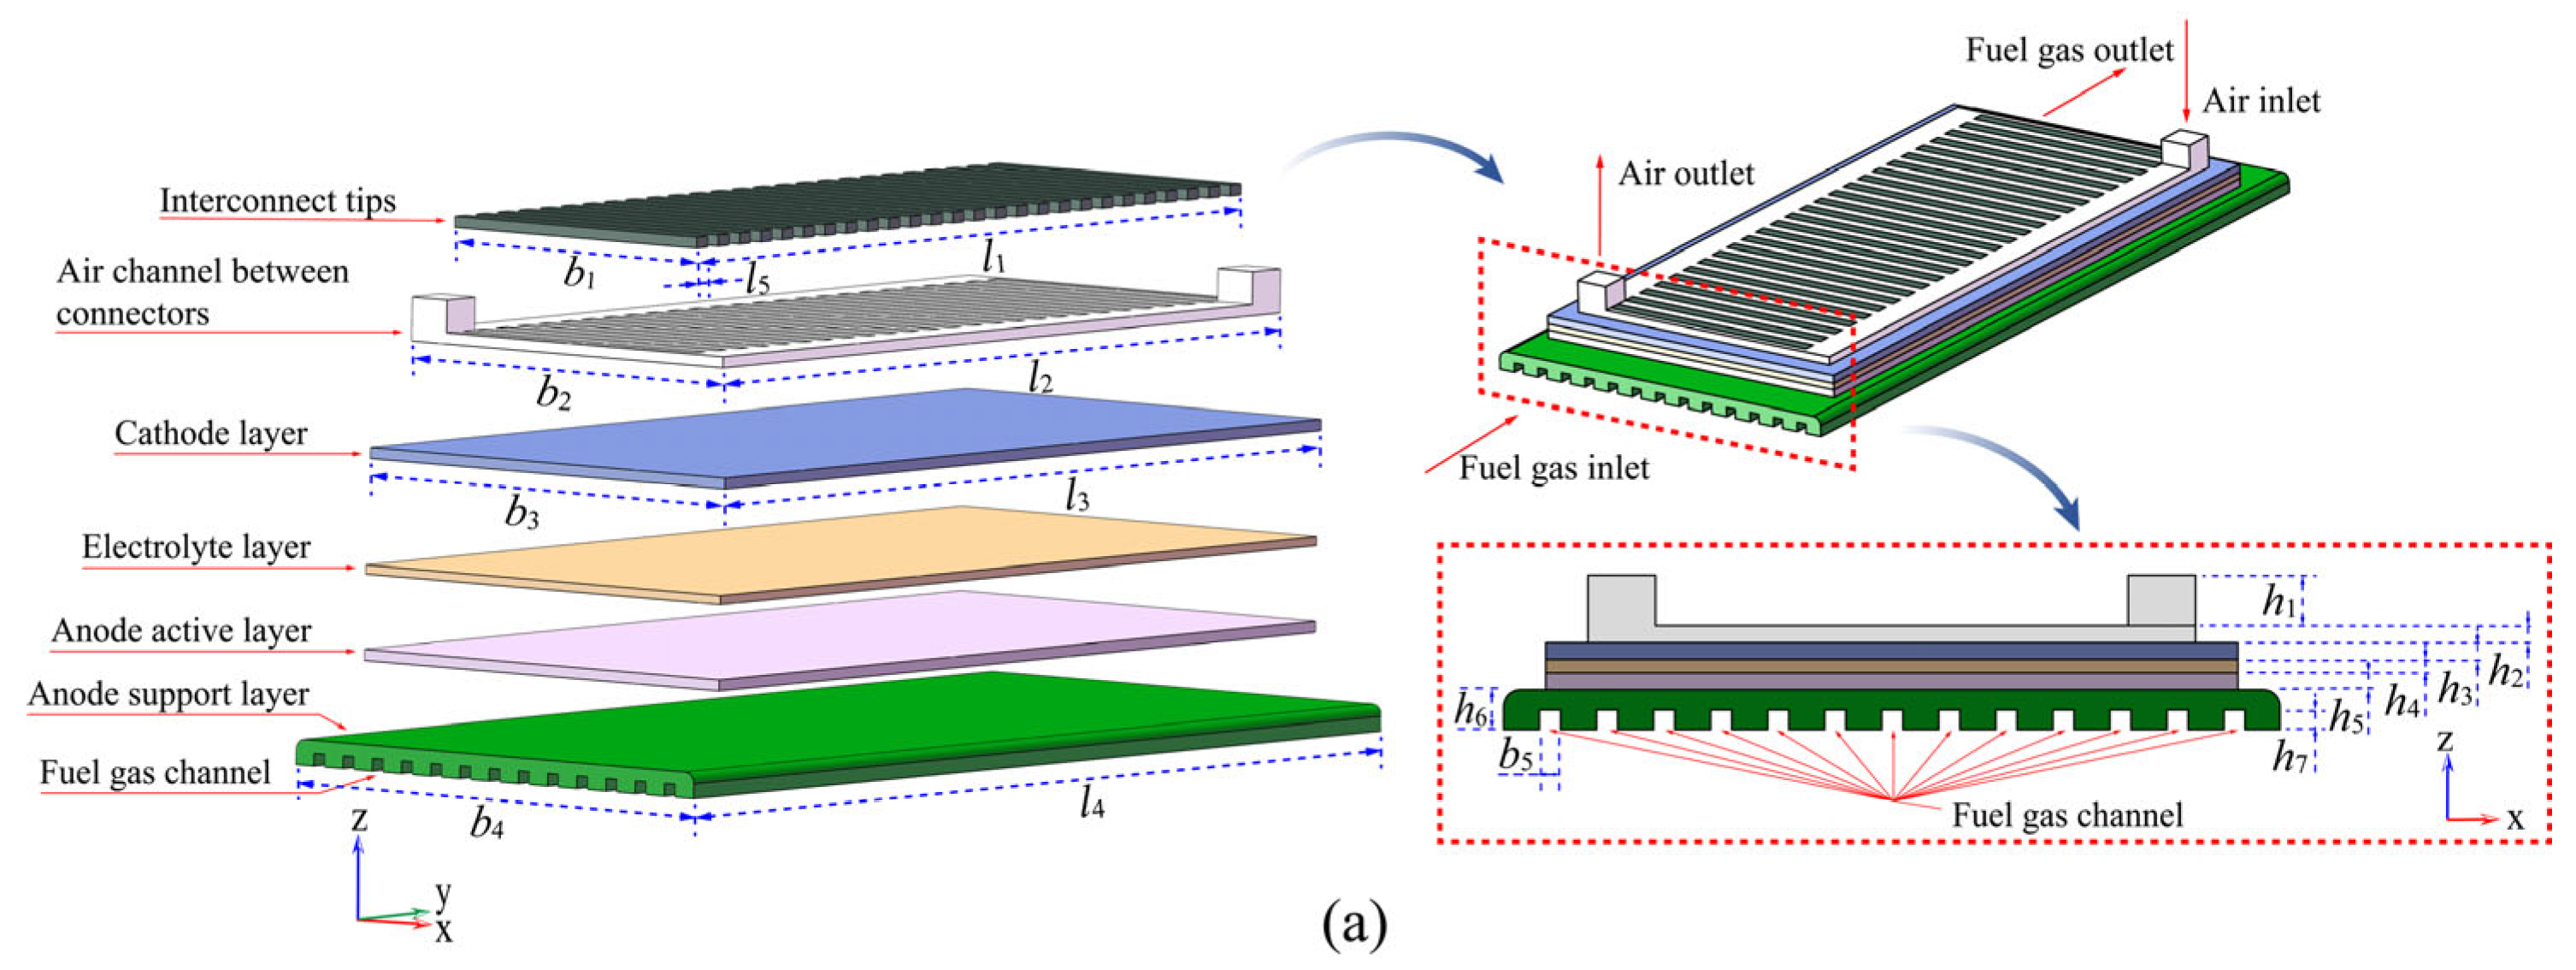
To investigate the heat and mass transfer processes and the thermal stress distribution in the flat-tubular SOFCs, this study establishes a three-dimensional geometric model of a dual-symmetric cathode SOFC [40]. This model includes the PEN layer, anode support layer, 13 fuel gas channels, and cell frame, based on the dimensions and material parameters of the dual-symmetric cathode flat-tubular SOFC manufactured by the Ningbo Institute of Materials Technology and Engineering. The anode support layer is relatively thick with a porosity of approximately 40–50%, serving as the primary mechanical support for the cell while enabling fuel gas transport to the active region. In contrast, the anode active layer is a thin layer with a slightly lower porosity and a higher density of triple-phase boundaries, optimized for electrochemical oxidation of the fuel. The distinct roles of these layers, mechanical support and electrochemical reaction, necessitate different microstructural designs, which in turn influence their thermo-mechanical behavior under thermal cycling. As shown in Figure 1, the anode support layer serves as the mechanical backbone of the cell, providing structural integrity while allowing fuel gas transport. The dual-cathode structure refers to the cell having symmetric cathode structures on both sides. Only the half-cell model is shown in Figure 1a; the full cell can be obtained by mirroring the half-cell with respect to the bottom surface of the anode support layer. This symmetric design offers potential advantages in terms of increased electrochemically active area per unit volume, improved current collection uniformity, and balanced thermal stress distribution compared to conventional single-cathode configurations. The geometric parameters for each component are detailed in Table 4.
Figure 1.
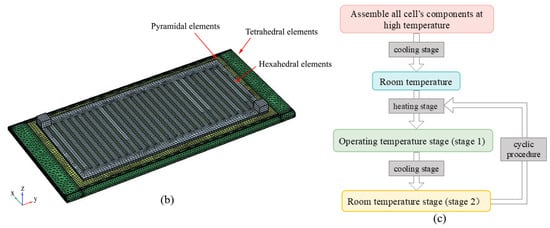
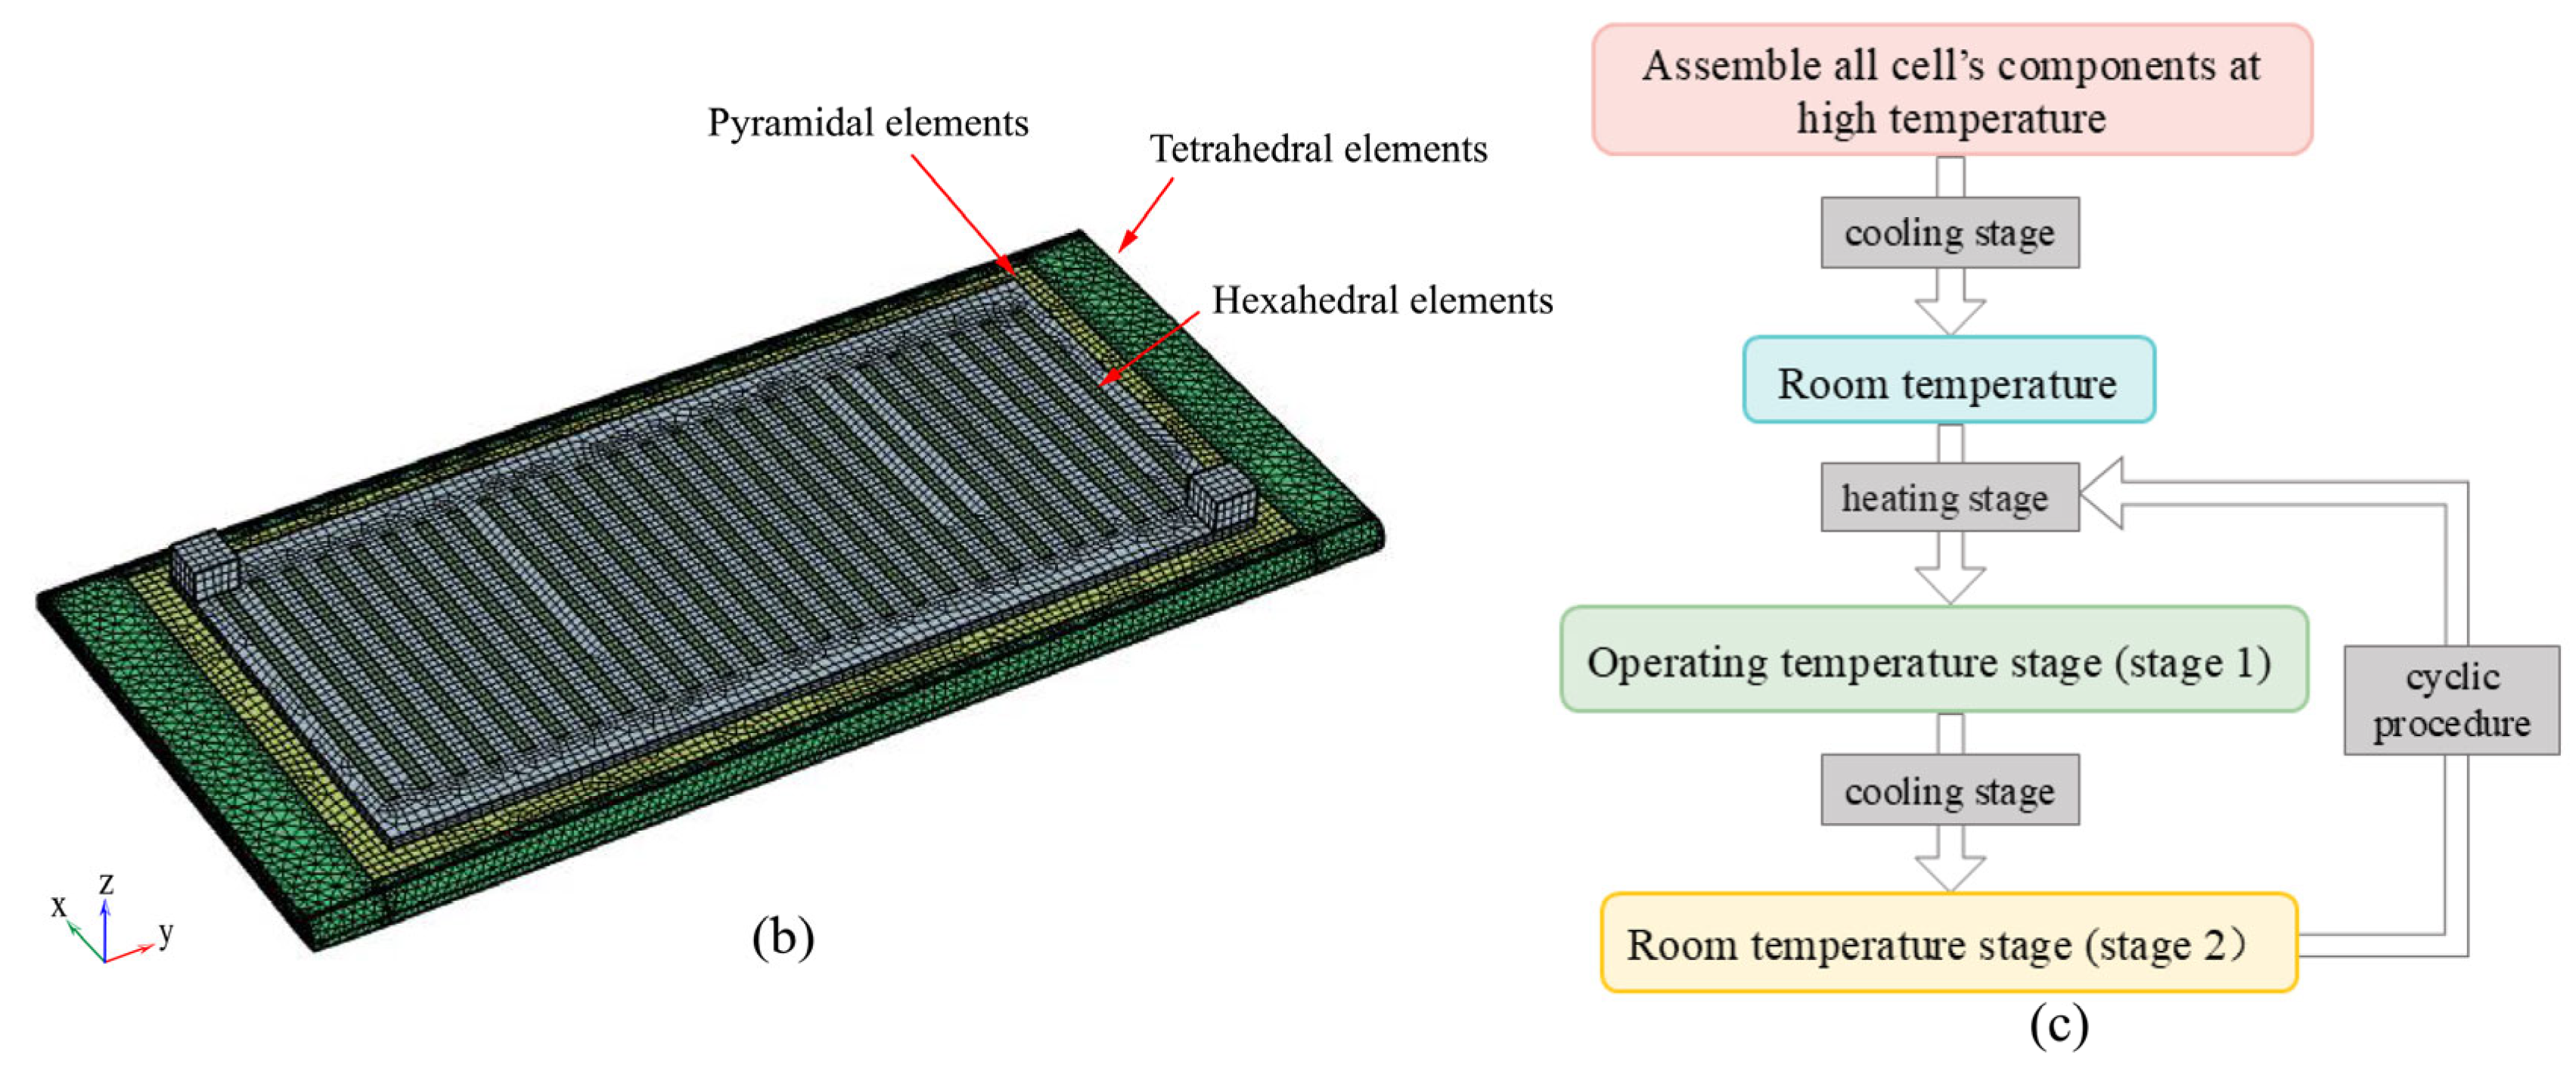
(a) Geometric model; (b) Finite analysis model of flat-tube solid oxide fuel cell; (c) Flowchart of the cooling and heating cycle process.
Table 4.
Flat-tubular SOFC’s geometric parameters.
3.2. Boundary Conditions
In this section, boundary conditions and relevant physical properties for the multi-physics coupling model are determined based on actual operating conditions and stack design principles. The material used for the SOFC cathode layer is La0.6Sr0.2Co0.2Fe0.8O3-δ, the electrolyte layer is made of 8YSZ, and the anode layer is composed of NiO-8YSZ [10,11]. The supporting anode layer is made from NiO-3YSZ. For the flat-tubular SOFCs, symmetric conditions are applied to the anode support layer, and the two end faces of this layer are fixed. These end faces act as the gas channel inlets and outlets. Laminar flow is assumed at the gas inlet, with the outlet pressure set to 1.013 × 10⁵ Pa, and backflow is suppressed. The anode gas inlet is composed of 3% water vapor and 97% hydrogen, while the cathode gas consists of 21% oxygen and 79% nitrogen. The anode gas inflow rate is 0.46 m/s, and the cathode gas inflow rate is 8.9 m/s. The initial temperature, boundary temperature, and inlet temperature are all set to 25 °C, reflecting typical operating conditions for the cell.
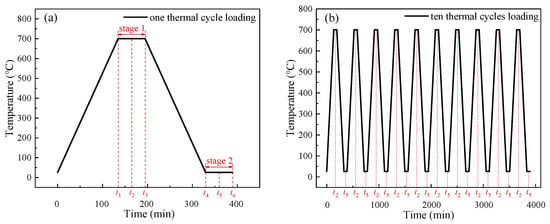
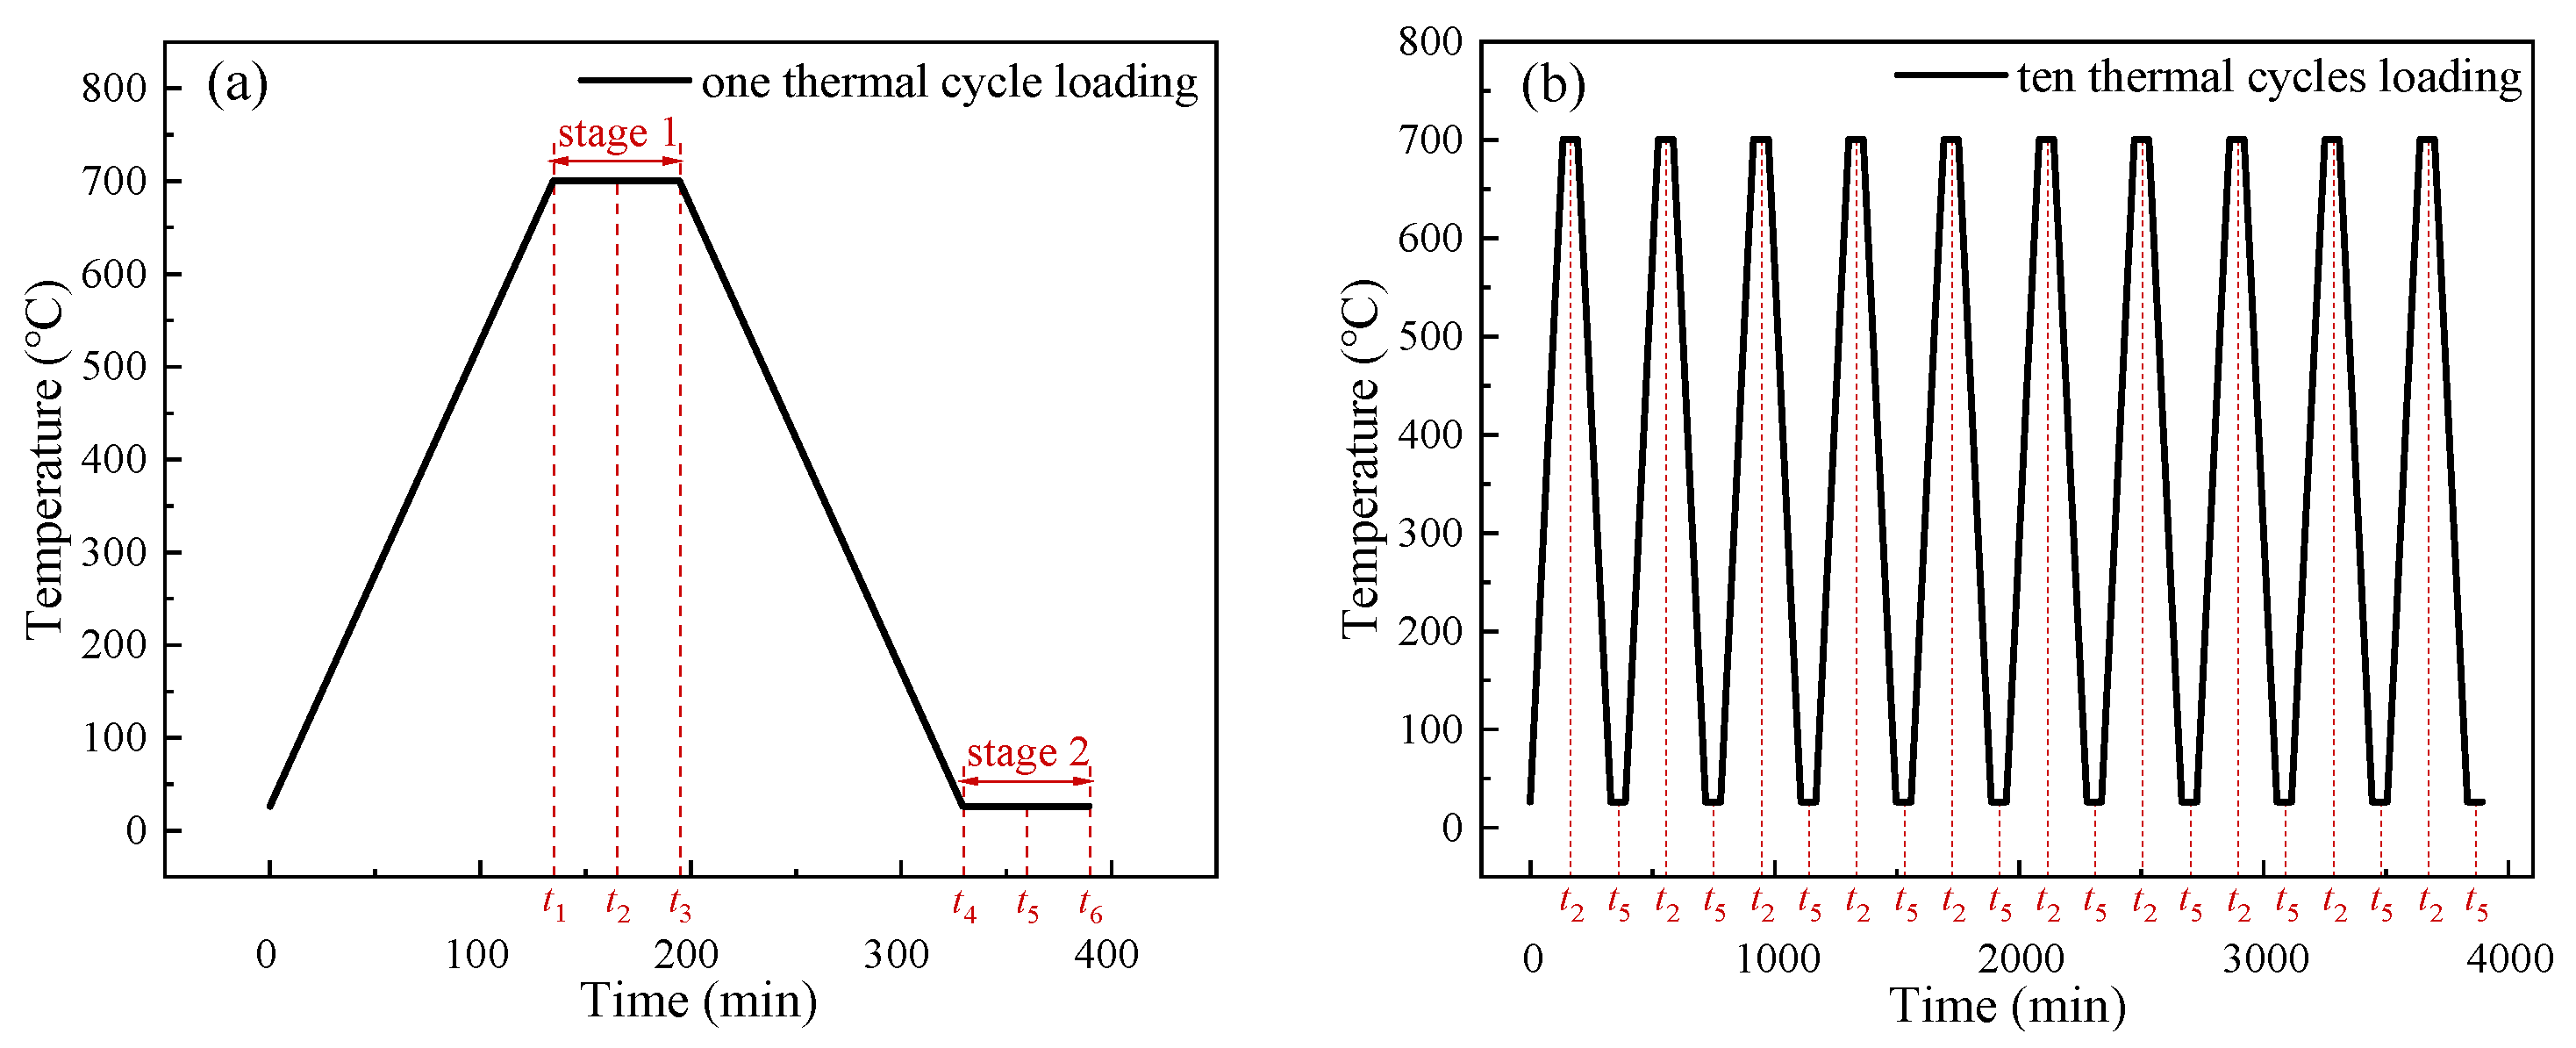
Figure 1c illustrates a flowchart of the thermal cycle. The model starts at room temperature, then rises to the operating temperature (stage 1). After holding the temperature for 60 min, the temperature is reduced back to room temperature (stage 2), with a similar hold time at stage 2. This process simulates a single cold-heat cycling load. The holding duration was selected to ensure that the internal temperature of the component was sufficiently uniform and that the thermal stress was fully relaxed. During the thermal cycle, the heating and cooling rates were set as 5 °C/min, 10 °C/min, and 60 °C/min, respectively. The heating and cooling rates were chosen to cover both slow and fast thermal shock conditions, so as to investigate the effects of different temperature change rates on the thermal deformation and stress distribution of the SOFC. It is assumed that the thermal load is applied to the external surface of the cell via convective heat flux. Figure 2 shows the temperature-time curves during the thermal cycle, where Figure 2a represents one thermal cycle and Figure 2b represents ten thermal cycles. In Figure 2a, the time when the temperature reaches the operating temperature is denoted as t1. 30 min after heat preservation begins from t1 is t2, and 60 min later is t3. The time it takes for the temperature to cool back to room temperature from t3 is t4, with t5 and t6 representing the subsequent 30 and 60 min intervals of heat preservation. The period between t1 and t3 is stage 1, while the period from t4 to t6 is stage 2.
Figure 2.
Temperature versus time curves during hot and cold cyclic loads: (a) one thermal cycle loading; (b) ten thermal cycles loading.
3.3. Meshing and Verification on Mesh Independence
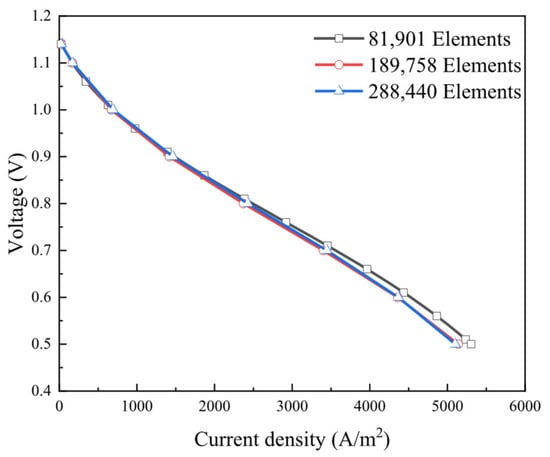
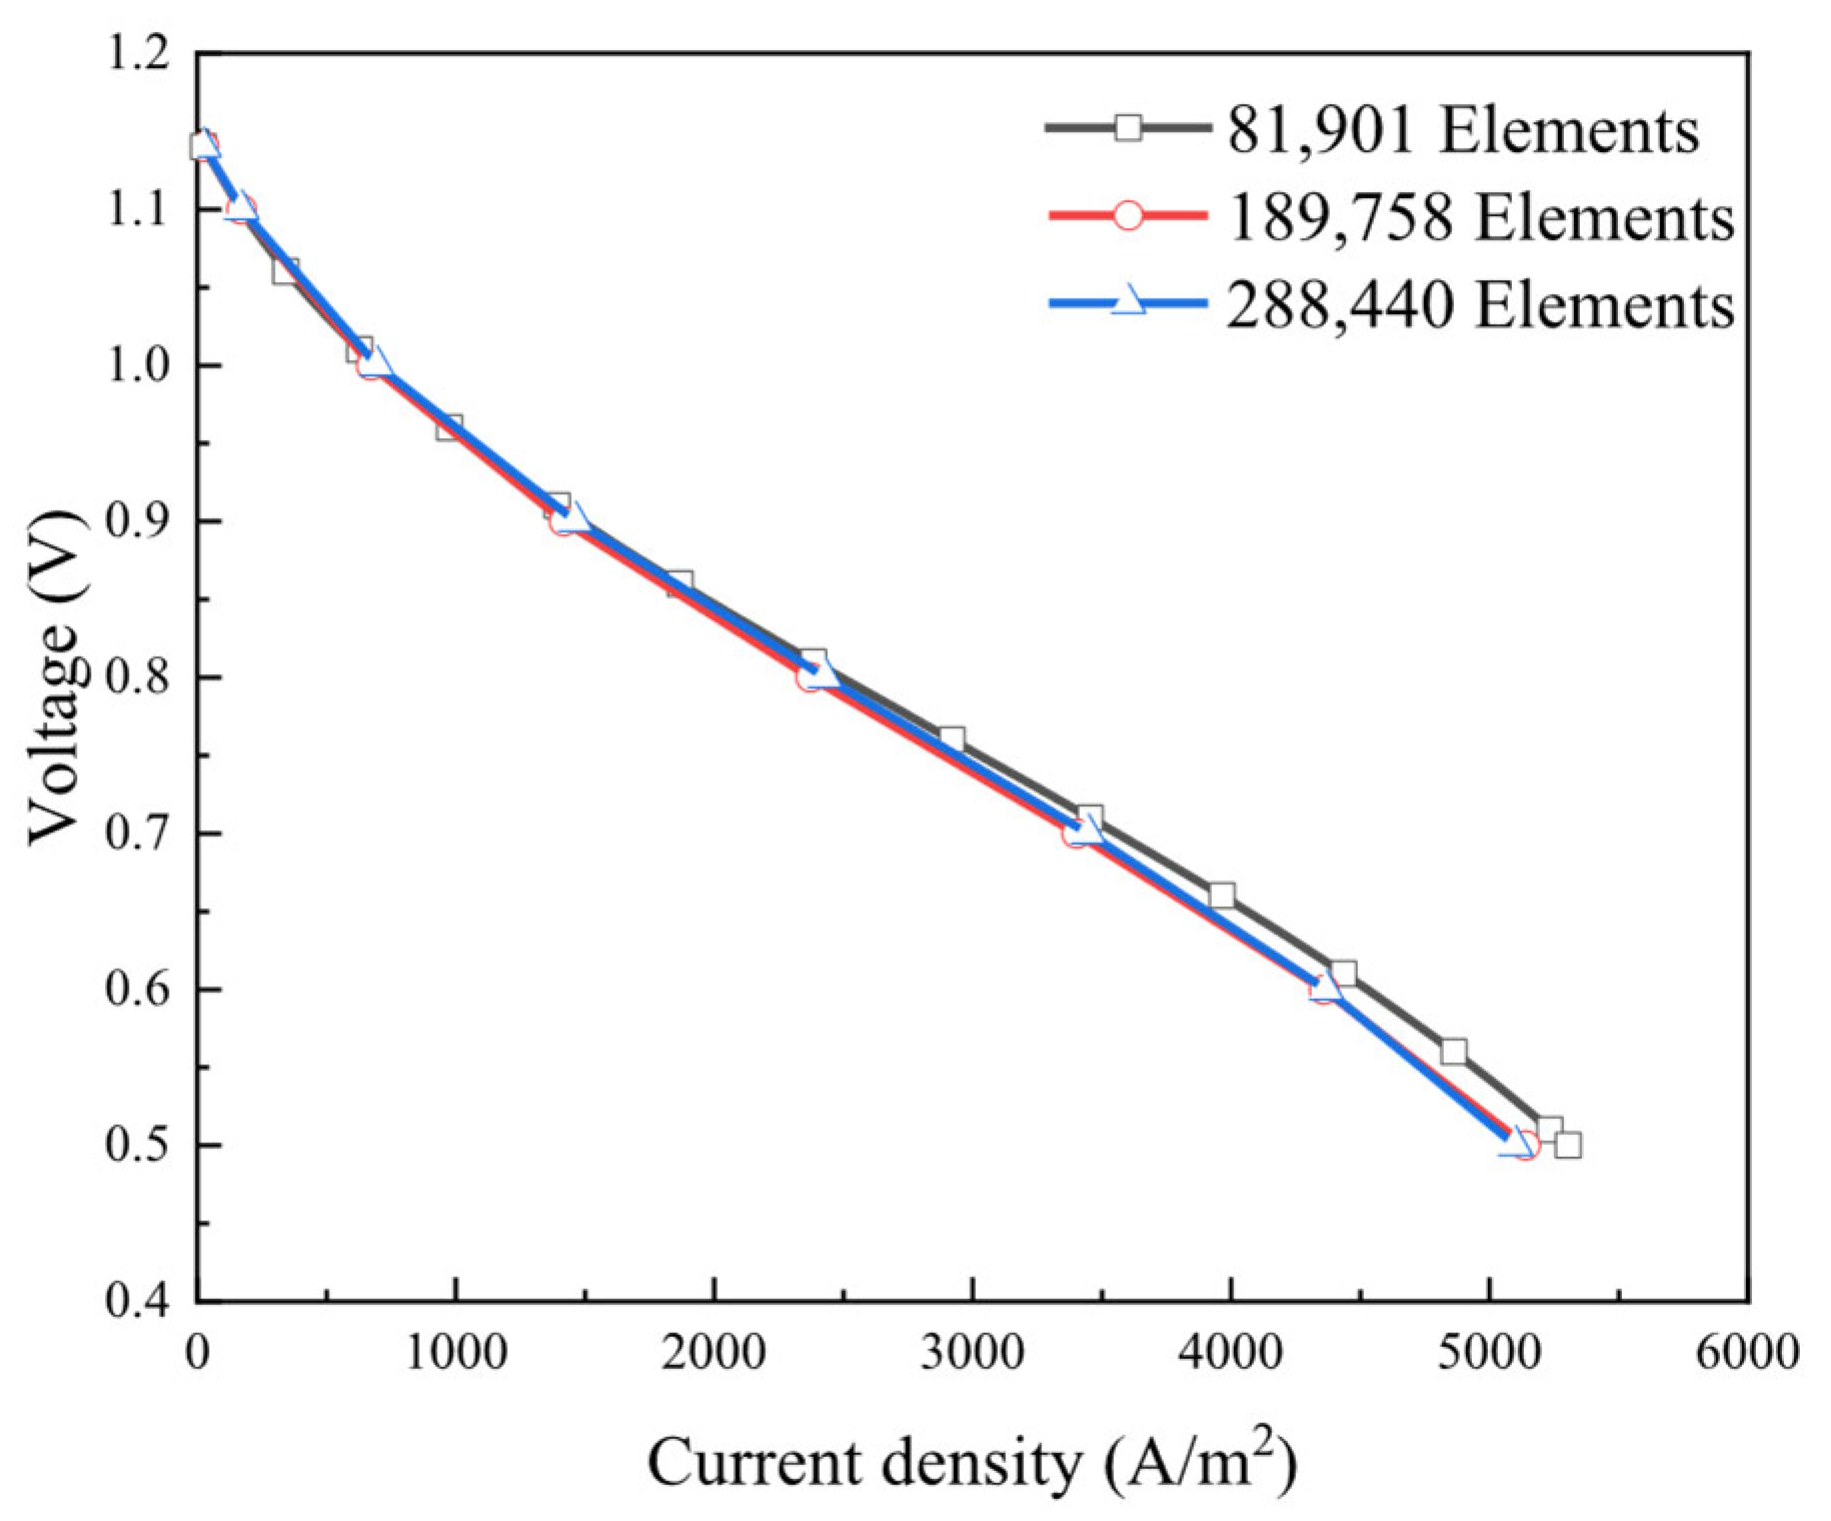
The number of mesh elements plays a significant role in the accuracy of the calculations. A larger mesh count improves accuracy but also increases computation time. To balance accuracy and efficiency, a mesh independence test is performed. As shown in Figure 3, simulations were carried out with four different mesh specifications: 81,901, 189,758, and 288,440 elements. By comparing the current densities across these mesh counts, it was found that the error between the 189,758-mesh and 288,440-mesh results was within 0.76%. Therefore, the 189,758-mesh was determined to meet the accuracy requirements and was selected for further model calculations. In addition to monitoring current density, the convergence behavior of the mechanical stress field was also examined during the grid refinement study. As the mesh resolution increased from coarse to fine, the variations in the maximum principal stress within the electrolyte layer and the interfacial stress gradients at layer boundaries were tracked. When the relative error in current density fell below 0.76%, the corresponding changes in peak stress values were also observed to be less than 2% across the four mesh configurations. This consistency indicates that the mesh resolution sufficient for current density convergence also yields a reasonably stable prediction of the thermal stress field, thereby supporting the reliability of the mechanical analysis presented in this study.
Figure 3.
I–V characteristics for different numbers of meshes.
For the SOFC model, hexahedral elements were used for the active anode layer, electrolyte layer, cathode layer, anode gas channel region, and cathode gas channel region, while tetrahedral elements were used for the anode support layer. As shown in Table 5, the model consists of a total of 189,758 computational elements, including 31,718 hexahedral elements, 151,306 tetrahedral elements, and 6673 pyramidal elements (used to connect hexahedral and tetrahedral elements).
Table 5.
Comparison of the number of elements.
To ensure the reliability and accuracy of the numerical results, in addition to the grid independence verification, the time step was fully adjusted and the convergence was examined during the transient calculation. Considering the computational accuracy, numerical stability and efficiency comprehensively, a time step of 1 min was adopted under the single thermal cycle condition, and a time step of 5 min was used under the ten thermal cycles condition. All transient cases were computed with satisfied convergence criteria, guaranteeing that the obtained temperature field, stress field and deformation results are stable and reliable.
3.4. Validation on Finite Element Analysis Model
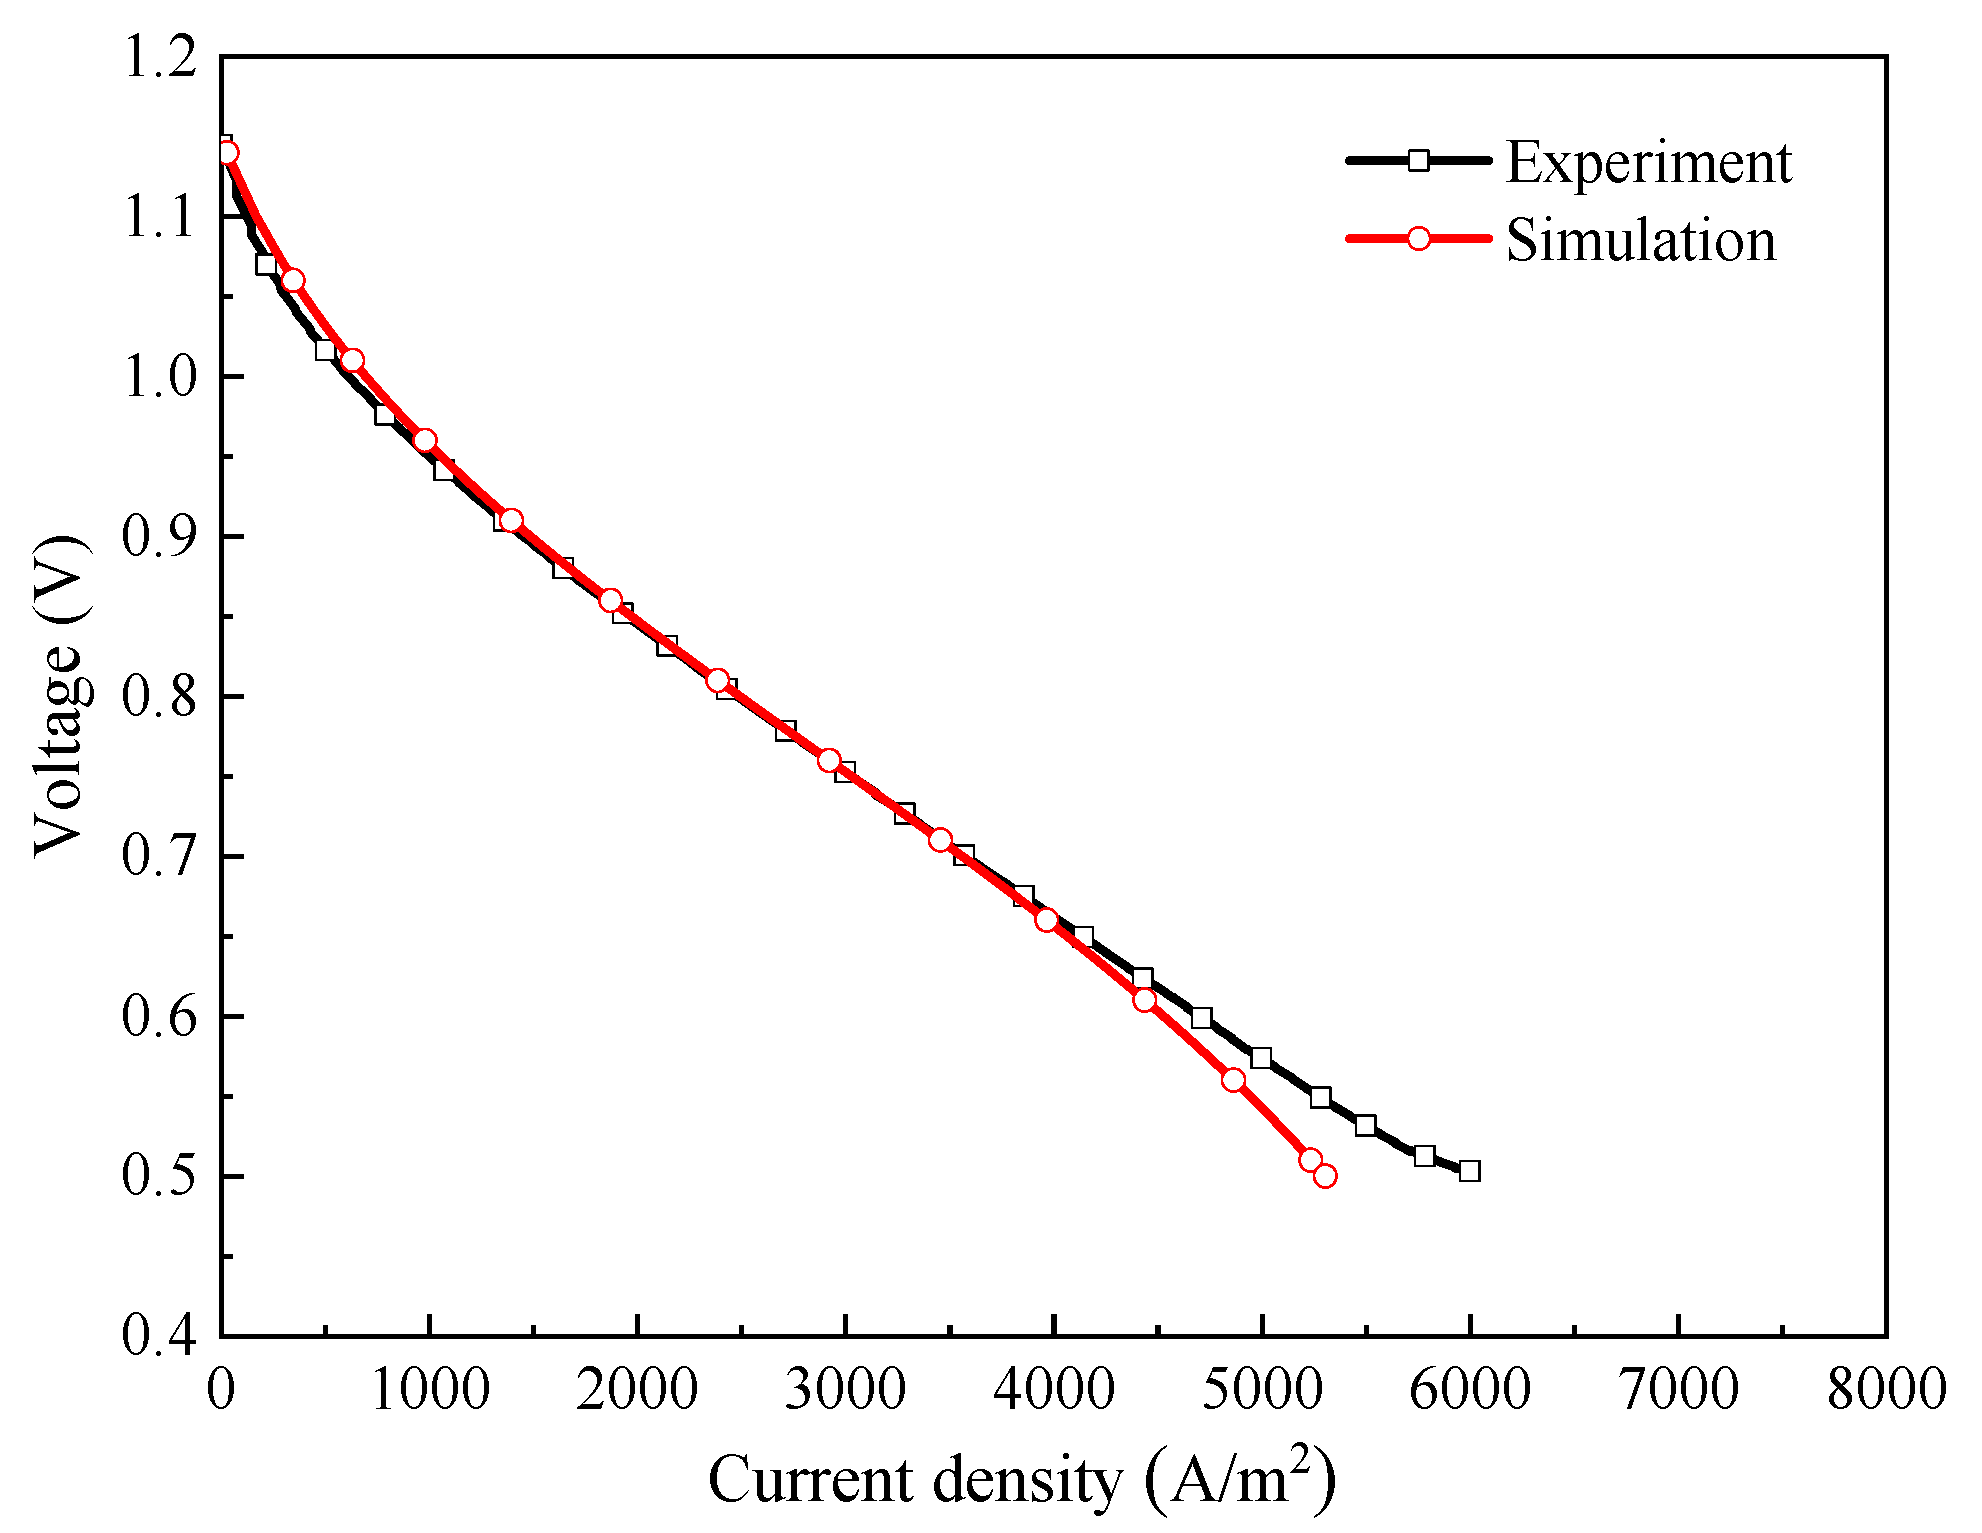
Due to the high operating temperature of SOFCs, it is difficult to experimentally measure internal physical quantities such as temperature fields and stress distributions within the cell. In contrast, current density and operating voltage are relatively easy to obtain through measurement. Therefore, comparing the experimentally measured current density-voltage (I–V) curves with those obtained from simulation provides an effective means of validating the model’s accuracy. The initial temperature in the experiments reported in the literature is consistent with that in the simulations of this work, while the anode gas composition differs. The anode gas employed in the experiments consists of 99.8% hydrogen and 0.2% water vapor, with the cathode gas composition being identical between the two. The flow rates and outlet pressures of the two gas fuels are kept the same, and the gas inlets both adopt a laminar flow profile. In the experiments of the reference literature, the ionic conductivity and electronic conductivity of the anode were S/m and 3.03 × 10⁴ S/m, respectively, with all other core material properties being consistent with those in this study. The OCV in the experiment was approximately 1.242 V [35].
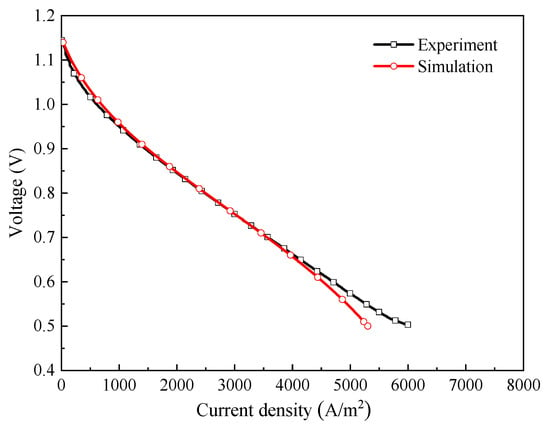
In this study, the average current density of the electrolyte layer was simulated at operating voltages ranging from 1.14 V to 0.5 V and compared with experimental data, as shown in Figure 4. The experimental results are in good agreement with the simulation data, thereby validating the accuracy of the model.
Figure 4.
SOFC I-V characteristics of experiment from Ref. [35] and simulation.
4. Results and Discussion
Transient temperature rise during thermal cycling is the core factor leading to thermal stress accumulation and structural failure in the flat-tubular SOFCs, and the evolution law of thermal stress field is jointly regulated by maximum operating temperature, transient temperature rise during thermal cycling and thermal cycle number [15,30,37]. To systematically reveal the response mechanism of the flat-tubular SOFCs with dual-cathode symmetric structure to cyclic thermal loading, this chapter first analyzes the thermal stress distribution characteristics of the key PEN structure under a single thermal cycle, clarifying the stress sensitivity of each functional layer. On this basis, the quantitative effects of different maximum operating temperatures and transient temperature rise on the thermal stress field of the electrolyte layer (the most failure-prone part) are further explored. Finally, the evolution trend of thermal stress in each layer under multiple thermal cycles is discussed, and the accumulation law of thermal stress and the key failure risk points of the cell under long-term cyclic operation are identified. The research results provide a direct data basis for the optimization of operating parameters and structural design of the flat-tubular SOFCs, and also lay a foundation for improving the long-term thermal cycle reliability of the cell [40].
4.1. Thermal Stress Analysis in the PEN Structure Under a Single Thermal Cycle
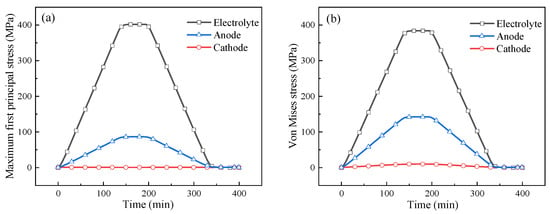
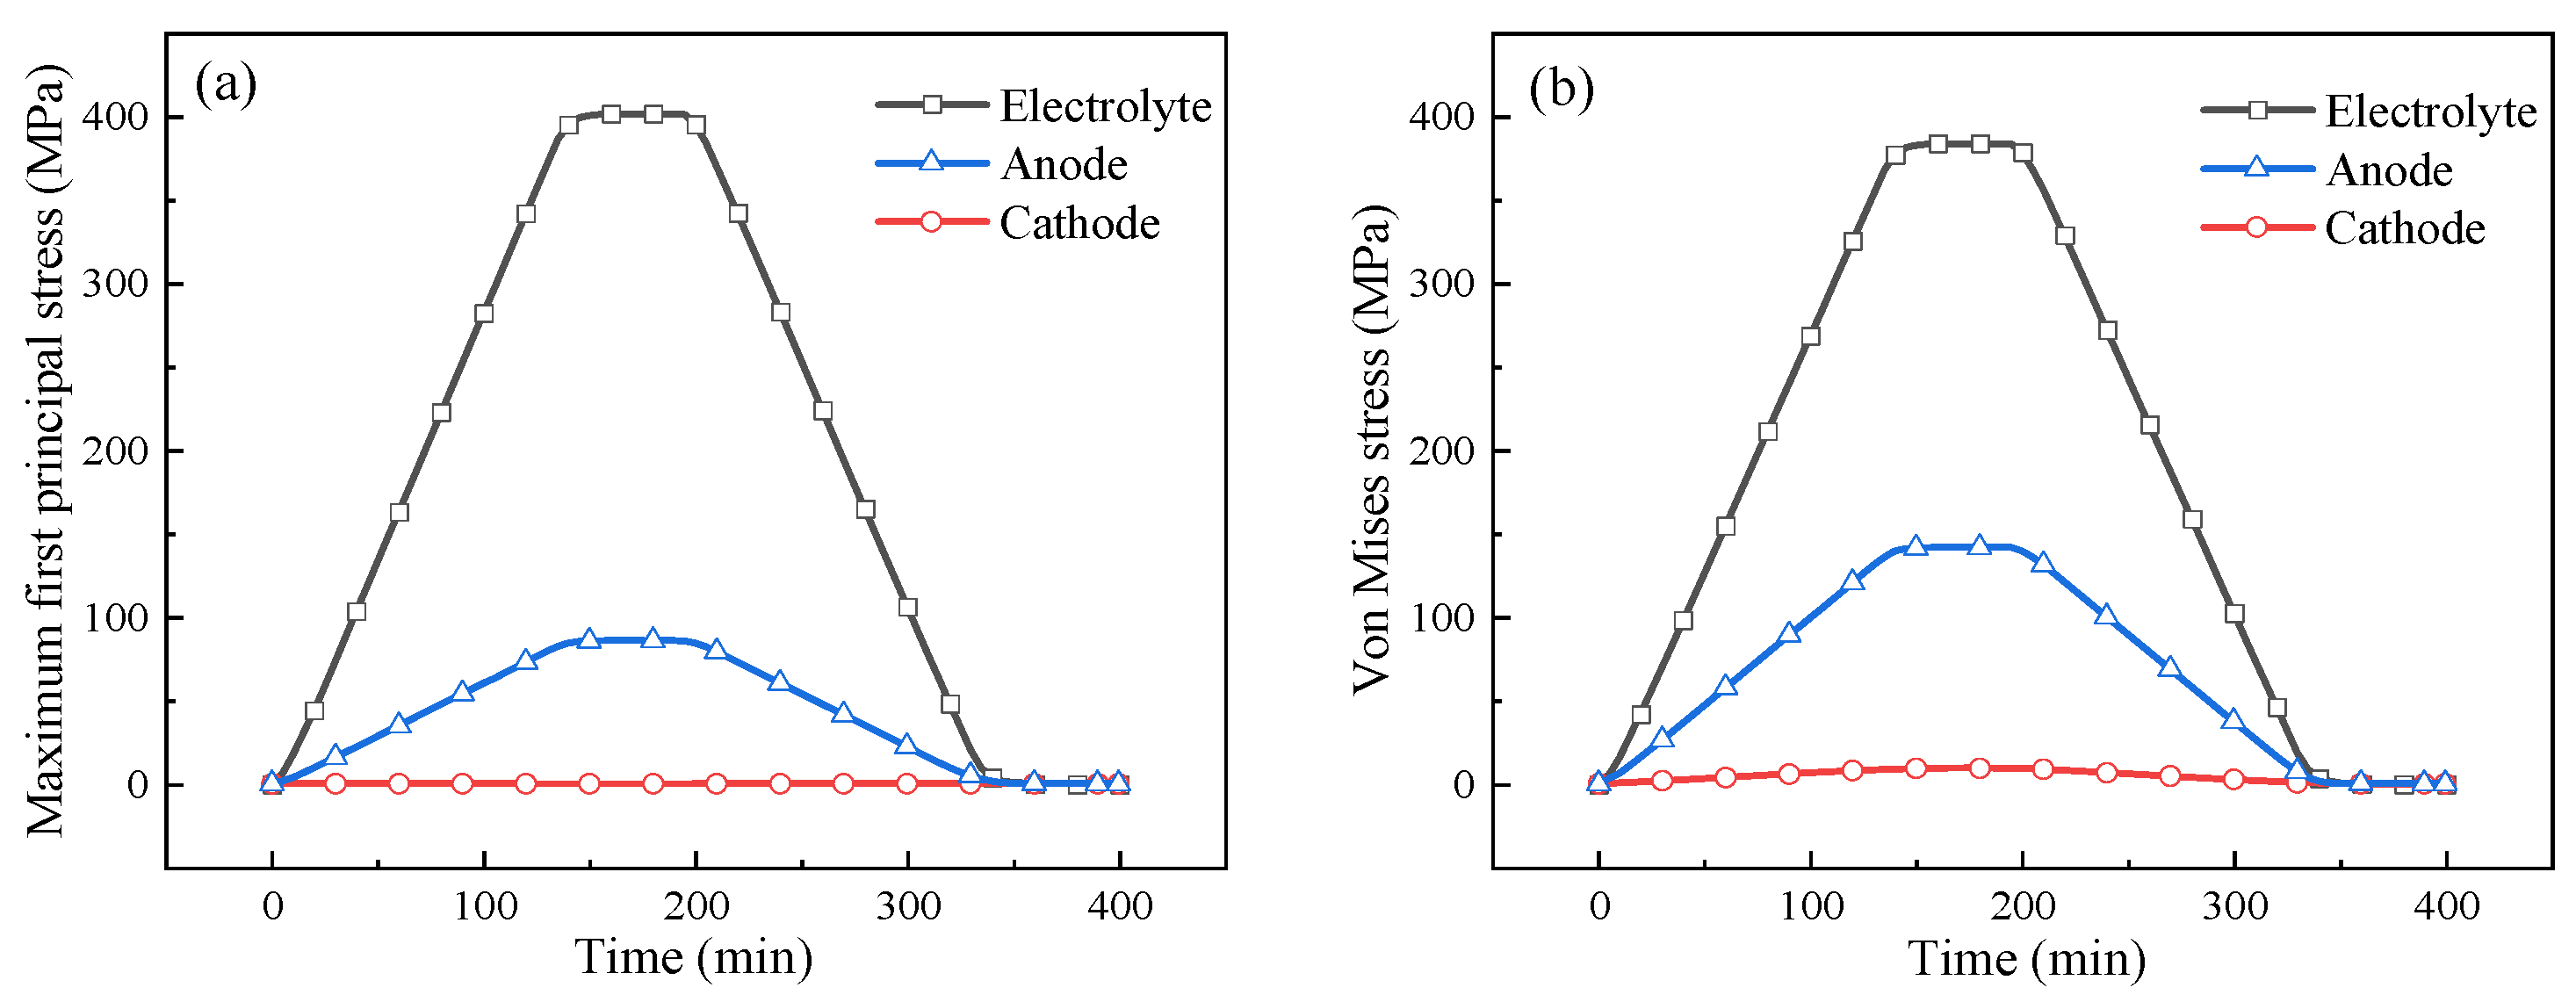
Figure 5a illustrates the maximum first principal stress in the anode, electrolyte, and cathode of the flat-tubular SOFC under a single thermal cycle at an operating temperature of 700 °C. As seen in the figure, the electrolyte layer experiences the highest first principal stress, followed by the anode, while the cathode experiences the lowest stress. The maximum first principal stress in the electrolyte is 393.81 MPa, in the anode it is 64.217 MPa, and in the cathode it is 0.89962 MPa. In addition, the first principal stress in the electrolyte layer increases and decreases at the fastest rate, followed by the anode, while the thermal stress in the cathode remains almost unchanged over time. Figure 5b presents the variation in Von Mises stress with time for the anode, electrolyte, and cathode under the same single thermal cycle condition at 700 °C. The electrolyte layer exhibits the highest maximum Von Mises stress at 383.84 MPa, followed by the anode layer at 141.73 MPa, and the cathode layer with the smallest Von Mises stress at 9.01 MPa. Moreover, the Von Mises stress in the electrolyte layer changes at a much faster rate—170% and 413% higher than that of the anode and cathode layers, respectively. These differences arise due to the varying thermal expansion coefficients of the materials in the electrodes, which leads to differing degrees of thermal deformation. To maintain the structural stability of the cell and ensure continuity between layers, thermal stresses are generated within the cell, especially in the electrolyte, which is sandwiched between the anode and cathode. Since the electrolyte must restrain the deformation of both the anode and cathode, it experiences the highest thermal stress, making it more susceptible to failure during a single thermal cycle. In contrast, the cathode is positioned at the top of the PEN structure, subject to less constraint than the anode, resulting in the smallest thermal stress among the three layers.
Figure 5.
Amplitudes of stress in the PEN structure under a single thermal cycle: (a) maximum 1st principal stress; (b) Mises stress.
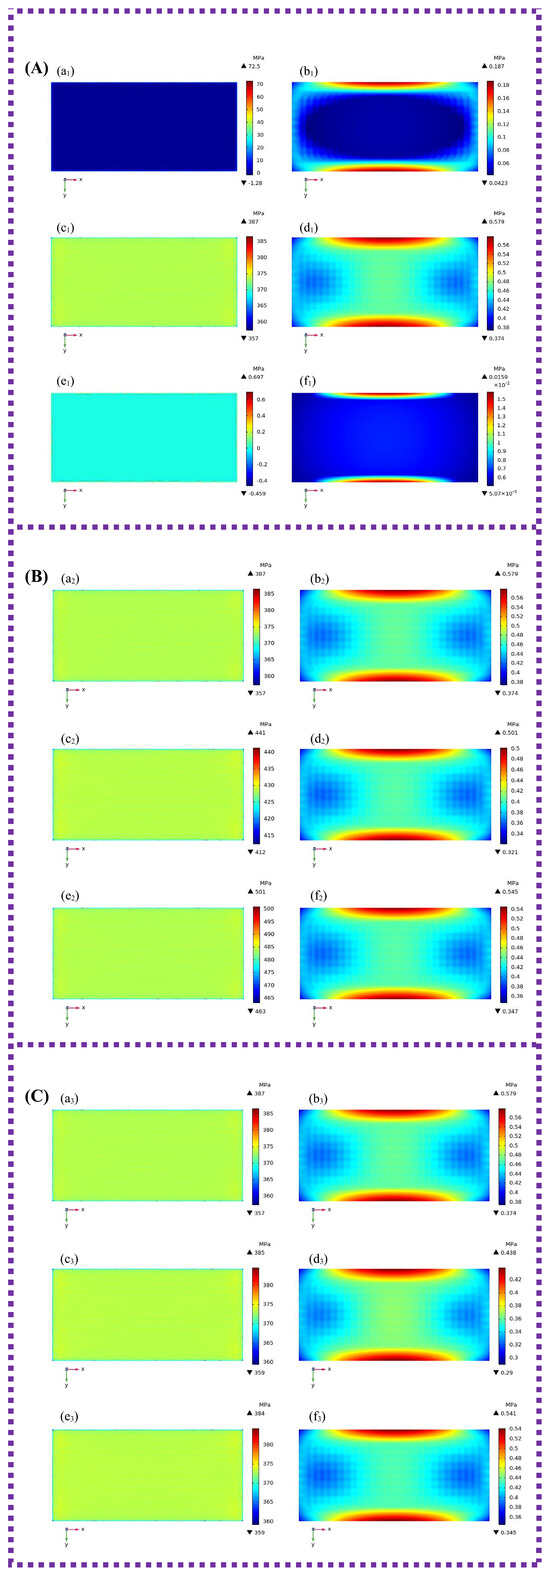
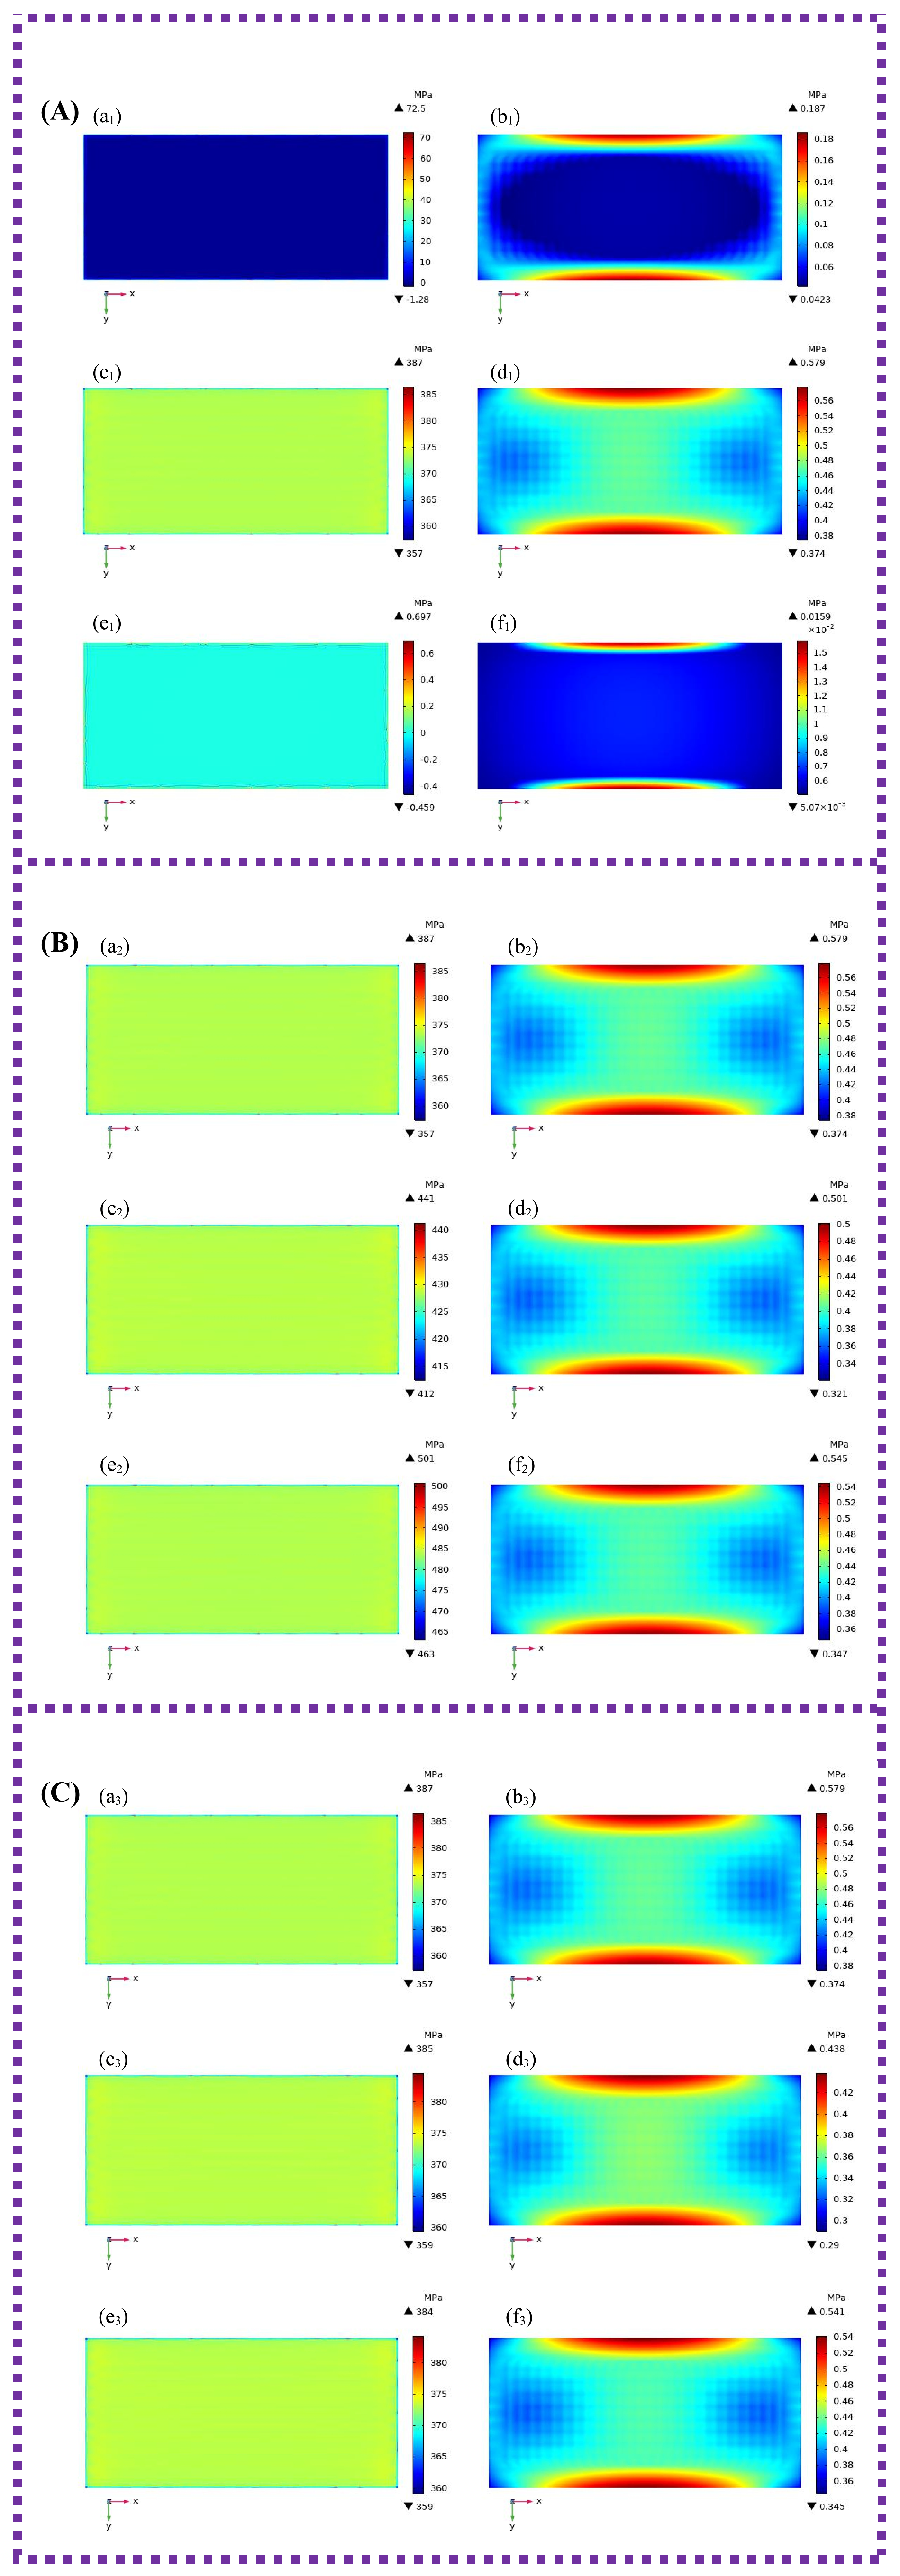
Figure 6A shows the thermal stress distribution in the anode, electrolyte, and cathode at time points t2 and t5 during a single thermal cycle. The heights of the selected cross-sections are located at the middle of each respective layer. At time point t2, the thermal stress distribution across all three layers is fairly uniform, with slightly lower stress at the edges compared to the center. During the heating process, since the external environment of the cell is heated by a high-temperature furnace, the edge of the cell heats up faster and experiences a larger temperature gradient than the interior. Once the cell reaches the operating temperature and stabilizes, the temperature at the edges remains almost constant, while the temperature in the interior increases at an accelerated rate, leading to a rise in internal thermal stress. At time t2, the maximum thermal stress values for the anode, electrolyte, and cathode are 72.5 MPa, 387 MPa, and 0.697 MPa, respectively. The anode and cathode layers also experience compressive stress at high temperatures. As the temperature cools to room temperature, the edge of the SOFC exhibits a larger temperature gradient due to faster heat dissipation compared to the middle part. The mutual constraints between the anode, electrolyte, and cathode at the edges cause thermal stress to concentrate, increasing the likelihood of fracture in the SOFC at the edges. At time t5, the maximum thermal stress values in the anode, electrolyte, and cathode are 0.187 MPa, 0.579 MPa, and 0.0159 MPa, respectively. The figure also shows that the thermal stress distribution in the cathode layer is more uniform, while the middle sections of both the cathode and anode layers experience tensile stress.
Figure 6.
Thermal stress distribution of (A) PEN structure: (a1) anode layer at t2, (b1) anode layer at t5, (c1) electrolyte layer at t2, (d1) electrolyte layer at t5, (e1) cathode layer at t2, (f1) cathode layer at t5; (B) electrolyte at different maximum temperatures: (a2) 700 °C at t2, (b2) 700 °C at t5, (c2) 800 °C at t2, (d2) 800 °C at t5, (e2) 900 °C at t2, (f2) 900 °C at t5; (C) electrolyte at different temperature loading rates: (a3) 5 °C/min at t2, (b3) 5 °C/min at t5, (c3) 10 °C/min at t2, (d3) 10 °C/min at t5, (e3) 60 °C/min at t2, (f3) 60 °C/min at t5.
4.2. Impact of Maximum Operating Temperature on Thermal Stress in the Flat-Tubular SOFCs
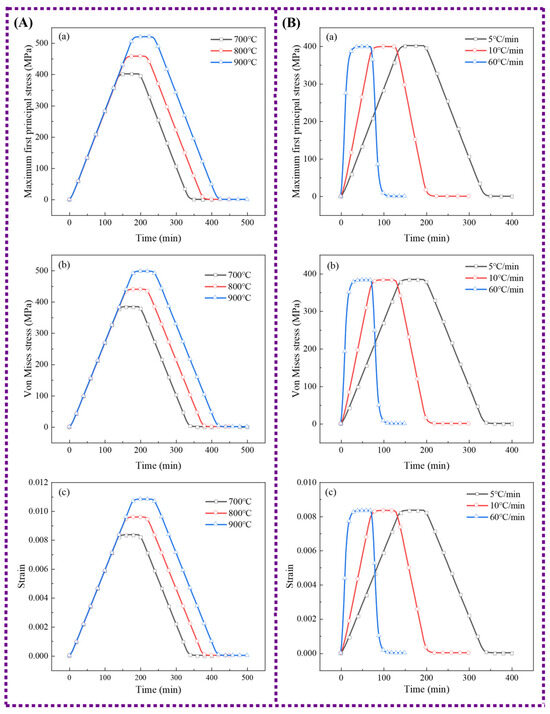
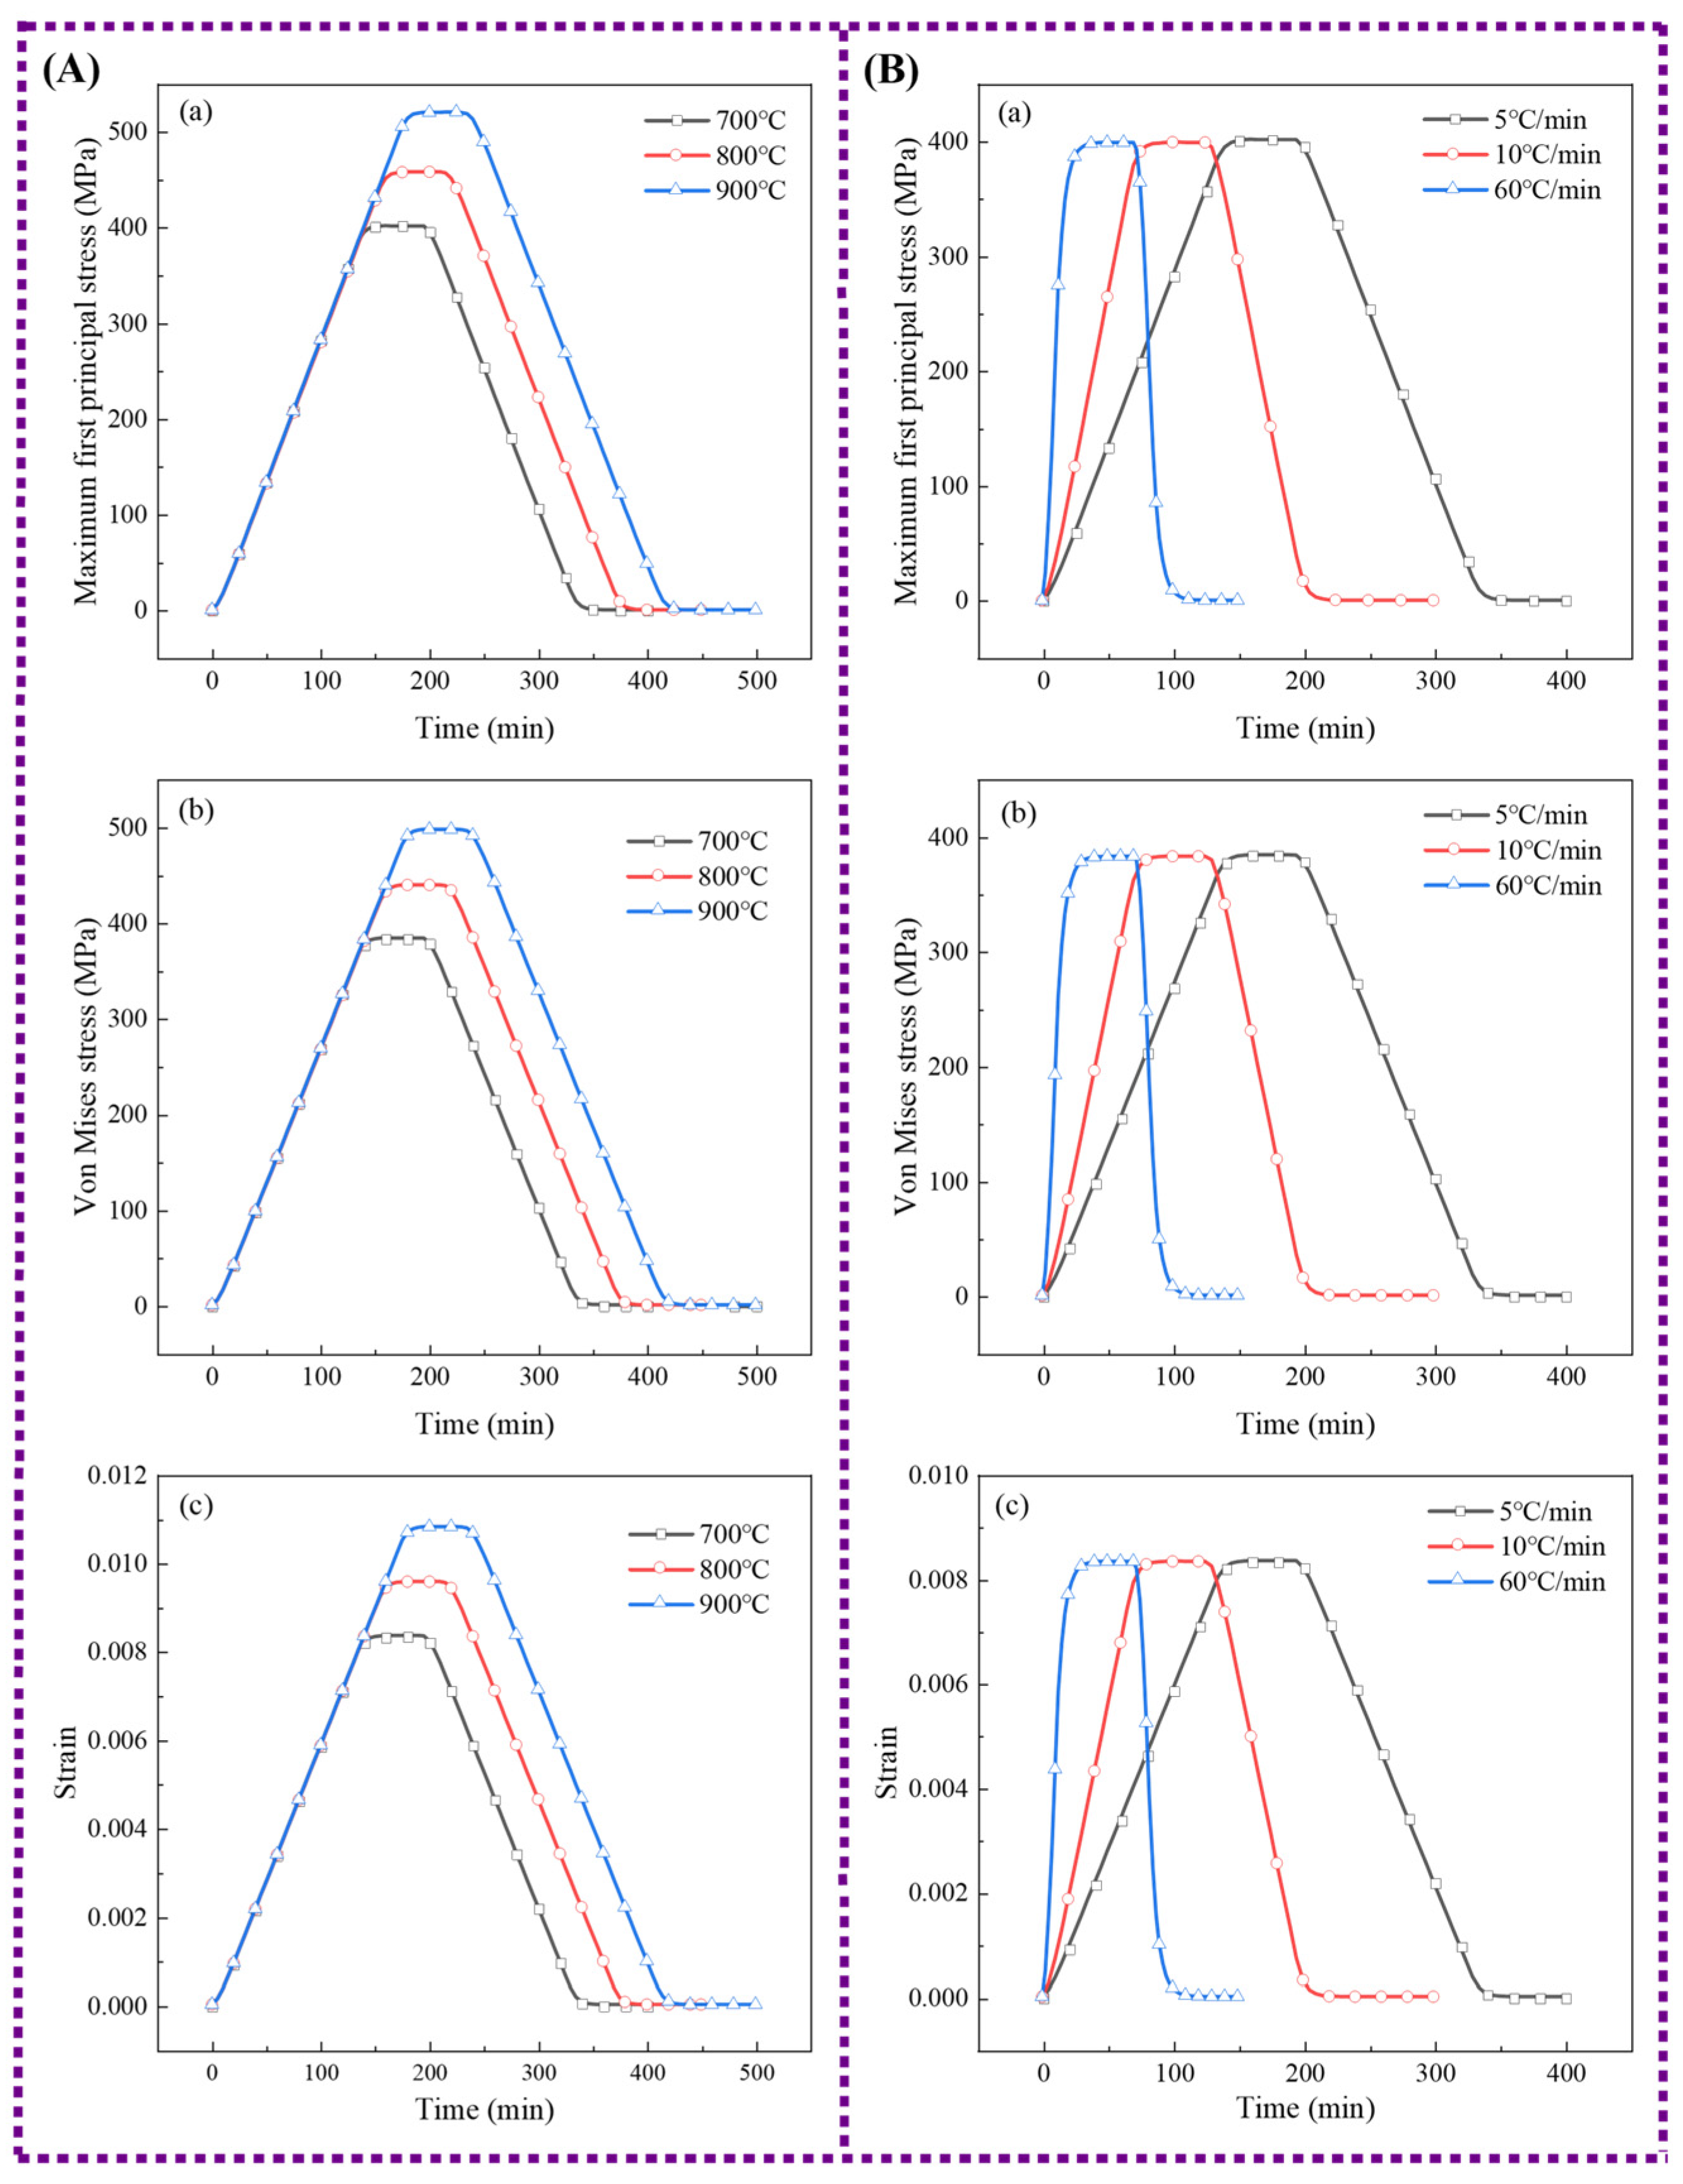
SOFCs need to be heated to a specific temperature to initiate the electrochemical reaction, and the maximum operating temperature plays a crucial role in the internal thermal stress within these cells. As discussed earlier, the electrolyte layer experiences the highest thermal stress during a single thermal cycle, making it the most likely point of failure. This section investigates how different maximum operating temperatures (700 °C, 800 °C, and 900 °C) affect the thermal stress in the electrolyte layer, using a transient temperature rise rate of 5 °C/min during thermal cycling. Figure 7A presents the time-dependent curves of maximum first principal stress, Von Mises stress, and principal strain in the electrolyte layer of the flat-tubular SOFC for operating temperatures of 700 °C, 800 °C, and 900 °C under a single thermal load cycle. From Figure 7A, it is clear that increasing the maximum temperature does not alter the general time-dependent trend of the thermal stress. As the operating temperature increases, the thermal stress in the electrolyte layer also rises. When the temperature reaches its maximum value, the thermal stress peaks as well. For operating temperatures of 700 °C, 800 °C, and 900 °C, the maximum first principal stresses in the electrolyte layer are 401.76 MPa, 458.23 MPa, and 520.60 MPa, respectively. Compared to 700 °C, the thermal stress increases by 14.06% at 800 °C and by 29.57% at 900 °C. Figure 7A shows that increasing the maximum temperature similarly does not affect the time-dependent trends of Von Mises stress and strain. The maximum Von Mises stresses at 700 °C, 800 °C, and 900 °C are 383.84 MPa, 439.38 MPa, and 497.58 MPa, respectively. The maximum principal strains at these temperatures are 8.34 × 10⁻³, 9.56 × 10⁻³, and 0.0108, respectively. Compared to 700 °C, the Von Mises stress increases by 14.47% at 800 °C and by 29.63% at 900 °C, while the principal strain increases by 14.66% and 29.64%, respectively. These results suggest that lowering the operating temperature can significantly reduce both the thermal stress and strain within the fuel cell.
Figure 7.
The (a) maximum 1st principal stress, (b) Mises stress and (c) strain of electrolytes: (A) at different maximum temperatures; (B) at different temperature loading rates under one thermal cycle.
Figure 6B presents the thermal stress distributions of the electrolyte layer at times t2 and t5 for different maximum operating temperatures. At time t2, the thermal stress in the electrolyte layer is concentrated mainly in the middle region, regardless of the operating temperature. This is because the temperature change rate is fastest in the center of the fuel cell at this time, generating greater thermal stress. When the operating temperatures are 700 °C, 800 °C, and 900 °C, the maximum thermal stress values in the electrolyte layer are 387 MPa, 441 MPa, and 501 MPa, respectively. The differences in thermal stress for these temperatures are 30 MPa, 29 MPa, and 38 MPa, respectively. This shows that as the operating temperature increases, both the maximum thermal stress and the variation in thermal stress across the electrolyte layer also increase. At time t5, the thermal stress in the electrolyte layer is concentrated mainly at the upper and lower edge regions along the y-axis, while the thermal stress at the left and right ends along the x-axis is relatively smaller. The middle part of the electrolyte layer experiences lower thermal stress. Therefore, at time t5, the edge regions along the y-axis are more prone to cracking due to the higher concentration of thermal stress.
4.3. Effect of Transient Temperature Rise Rate During Thermal Cycling on Thermal Stress in the Flat-Tubular SOFCs
Figure 7B shows the curves of the maximum first principal stress, Von Mises stress, and principal strain in the electrolyte layer of the flat-tubular SOFC as a function of temperature, under a maximum operating temperature of 700 °C and transient temperature rise rates of 5 °C/min, 10 °C/min, and 60 °C/min during thermal cycling. As seen in Figure 7B, the transient temperature rise has little impact on the time-dependent trend of thermal stress in the electrolyte layer. At the different transient temperature rise rates of 5 °C/min, 10 °C/min, and 60 °C/min, the maximum first principal stresses in the electrolyte layer are 401.76 MPa, 399.30 MPa, and 399.12 MPa, respectively. From this, it can be concluded that a transient temperature rise rate of 60 °C/min is relatively optimal among the tested conditions, as it corresponds to the lowest probability of cracking in the brittle components of the fuel cell. Figure 7B shows the Von Mises stress and principal strain curves for the electrolyte layer under the same transient temperature rise rate. The maximum Von Mises stresses are 383.84 MPa, 382.72 MPa, and 382.69 MPa, while the maximum principal strains are 8.34 × 10⁻³, 8.33 × 10⁻³, and 8.32 × 10⁻³, respectively. It is evident that when the transient temperature rise rate is 60 °C/min, the thermal stress and principal strain acting on the internal materials of the SOFC are the smallest. In addition, it can be observed that as the transient temperature rise rate increases from 5 °C/min to 60 °C/min, the magnitudes of the maximum first principal stress, Von Mises stress, and principal strain also increase.
Figure 6C presents the thermal stress distributions in the electrolyte layer at times t2 and t5 for different transient temperature rise rates. At time t2, the thermal stress is primarily concentrated in the middle of the electrolyte layer. As shown in Figure 6C, the thermal stress differences in the electrolyte layer are consistently 19 MPa at transient temperature rise rates of 5 °C/min, 10 °C/min, and 60 °C/min. This indicates that the transient temperature rise does not significantly affect the magnitude or distribution of thermal stress in the SOFC at high temperatures. At time t5, the thermal stress is concentrated at the upper and lower edge regions along the y-axis, with relatively smaller stress in the middle part of the electrolyte layer. Notably, when the transient temperature rise rate is 10 °C/min, the maximum thermal stress of the electrolyte layer is 0.438 MPa, which is 32.19% lower than at 5 °C/min and 23.52% lower than at 60 °C/min. This suggests that a transient temperature rise rate of 10 °C/min performs favorably among the tested conditions, which can effectively reduce the magnitude of thermal stress acting on the fuel cell during a single thermal cycle.
In stage 1, at transient temperature rise rates of 5 °C/min, 10 °C/min, and 60 °C/min, the maximum thermal stresses in the electrolyte layer are 376.88 MPa, 376.61 MPa, and 376.84 MPa, respectively. In stage 2, the maximum thermal stresses of the electrolyte layer are 0.63 MPa, 0.28 MPa, and 0.51 MPa, respectively. It is worth noting that the optimal transient temperature rise requires a balanced consideration of both the transient peak stress during heating and the residual stress after cooling, as they govern different failure mechanisms. Although a transient temperature rise of 60 °C/min yields a slightly lower peak stress during the heating phase, this marginal benefit does not necessarily translate into improved long-term structural reliability. In contrast, the residual stress after cooling, which accumulates with thermal cycles and directly determines the initial stress state for subsequent operations, exhibits a more pronounced dependence on the transient temperature rise rate. From an engineering perspective, prioritizing the minimization of residual stress is essential to ensure a wider safety margin and enhanced durability under prolonged cyclic loading. Therefore, a conservative transient temperature rise within the range of 10 °C/min is recommended, as it effectively mitigates residual stress buildup while maintaining acceptable thermal gradients, thereby supporting long-term cyclic stability despite a slight trade-off in peak stress during individual heating events.
4.4. Influence of Multiple Thermal Cycles on Thermal Stress in the Flat-Tubular SOFCs
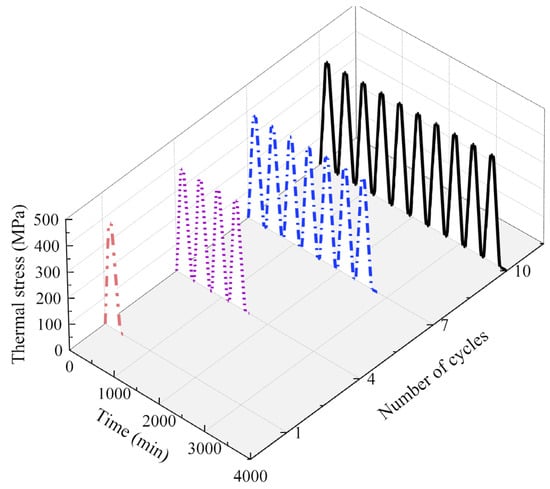
SOFCs experience multiple start-up and shutdown cycles during their operation, making it important to understand how thermal stress behaves under these conditions. As discussed in Section 2.1, the electrolyte layer experiences the highest thermal stress during a thermal cycle, making it the most vulnerable to failure. Therefore, this section analyzes how the thermal stress in the electrolyte layer of the flat-tubular SOFC changes after undergoing 1, 4, 7, and 10 thermal cycles, with the maximum operating temperature set at 700 °C and the transient temperature rise rate at 5 °C/min. Figure 8 shows the thermal stress versus time curves for the electrolyte layer after 1, 4, 7, and 10 thermal cycles. It can be seen from the figure that, under multiple thermal cycle conditions, the thermal stress in the electrolyte layer fluctuates periodically over time. The peak thermal stress in the electrolyte layer remains around 400 MPa. When comparing the results with a single thermal cycle, the thermal stress increases by 1.8%, 1.89%, and 2% after 4, 7, and 10 thermal cycles, respectively. This indicates that the peak thermal stress in the electrolyte layer escalates with successive thermal cycles, driven by continuous internal temperature fluctuations. These fluctuations arise because the internal temperature of cell is still stabilizing while being subjected to alternating heating and cooling from the external environment. These fluctuations gradually increase the internal thermal stress. Therefore, with each additional thermal cycle, the thermal stress in the electrolyte layer increases, and the risk of failure rises accordingly.
Figure 8.
The influence of multiple thermal cycles on electrolyte layer thermal stress.
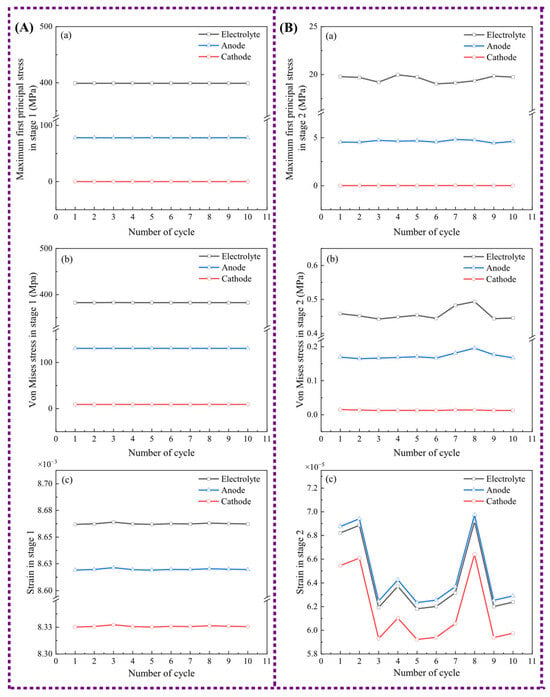
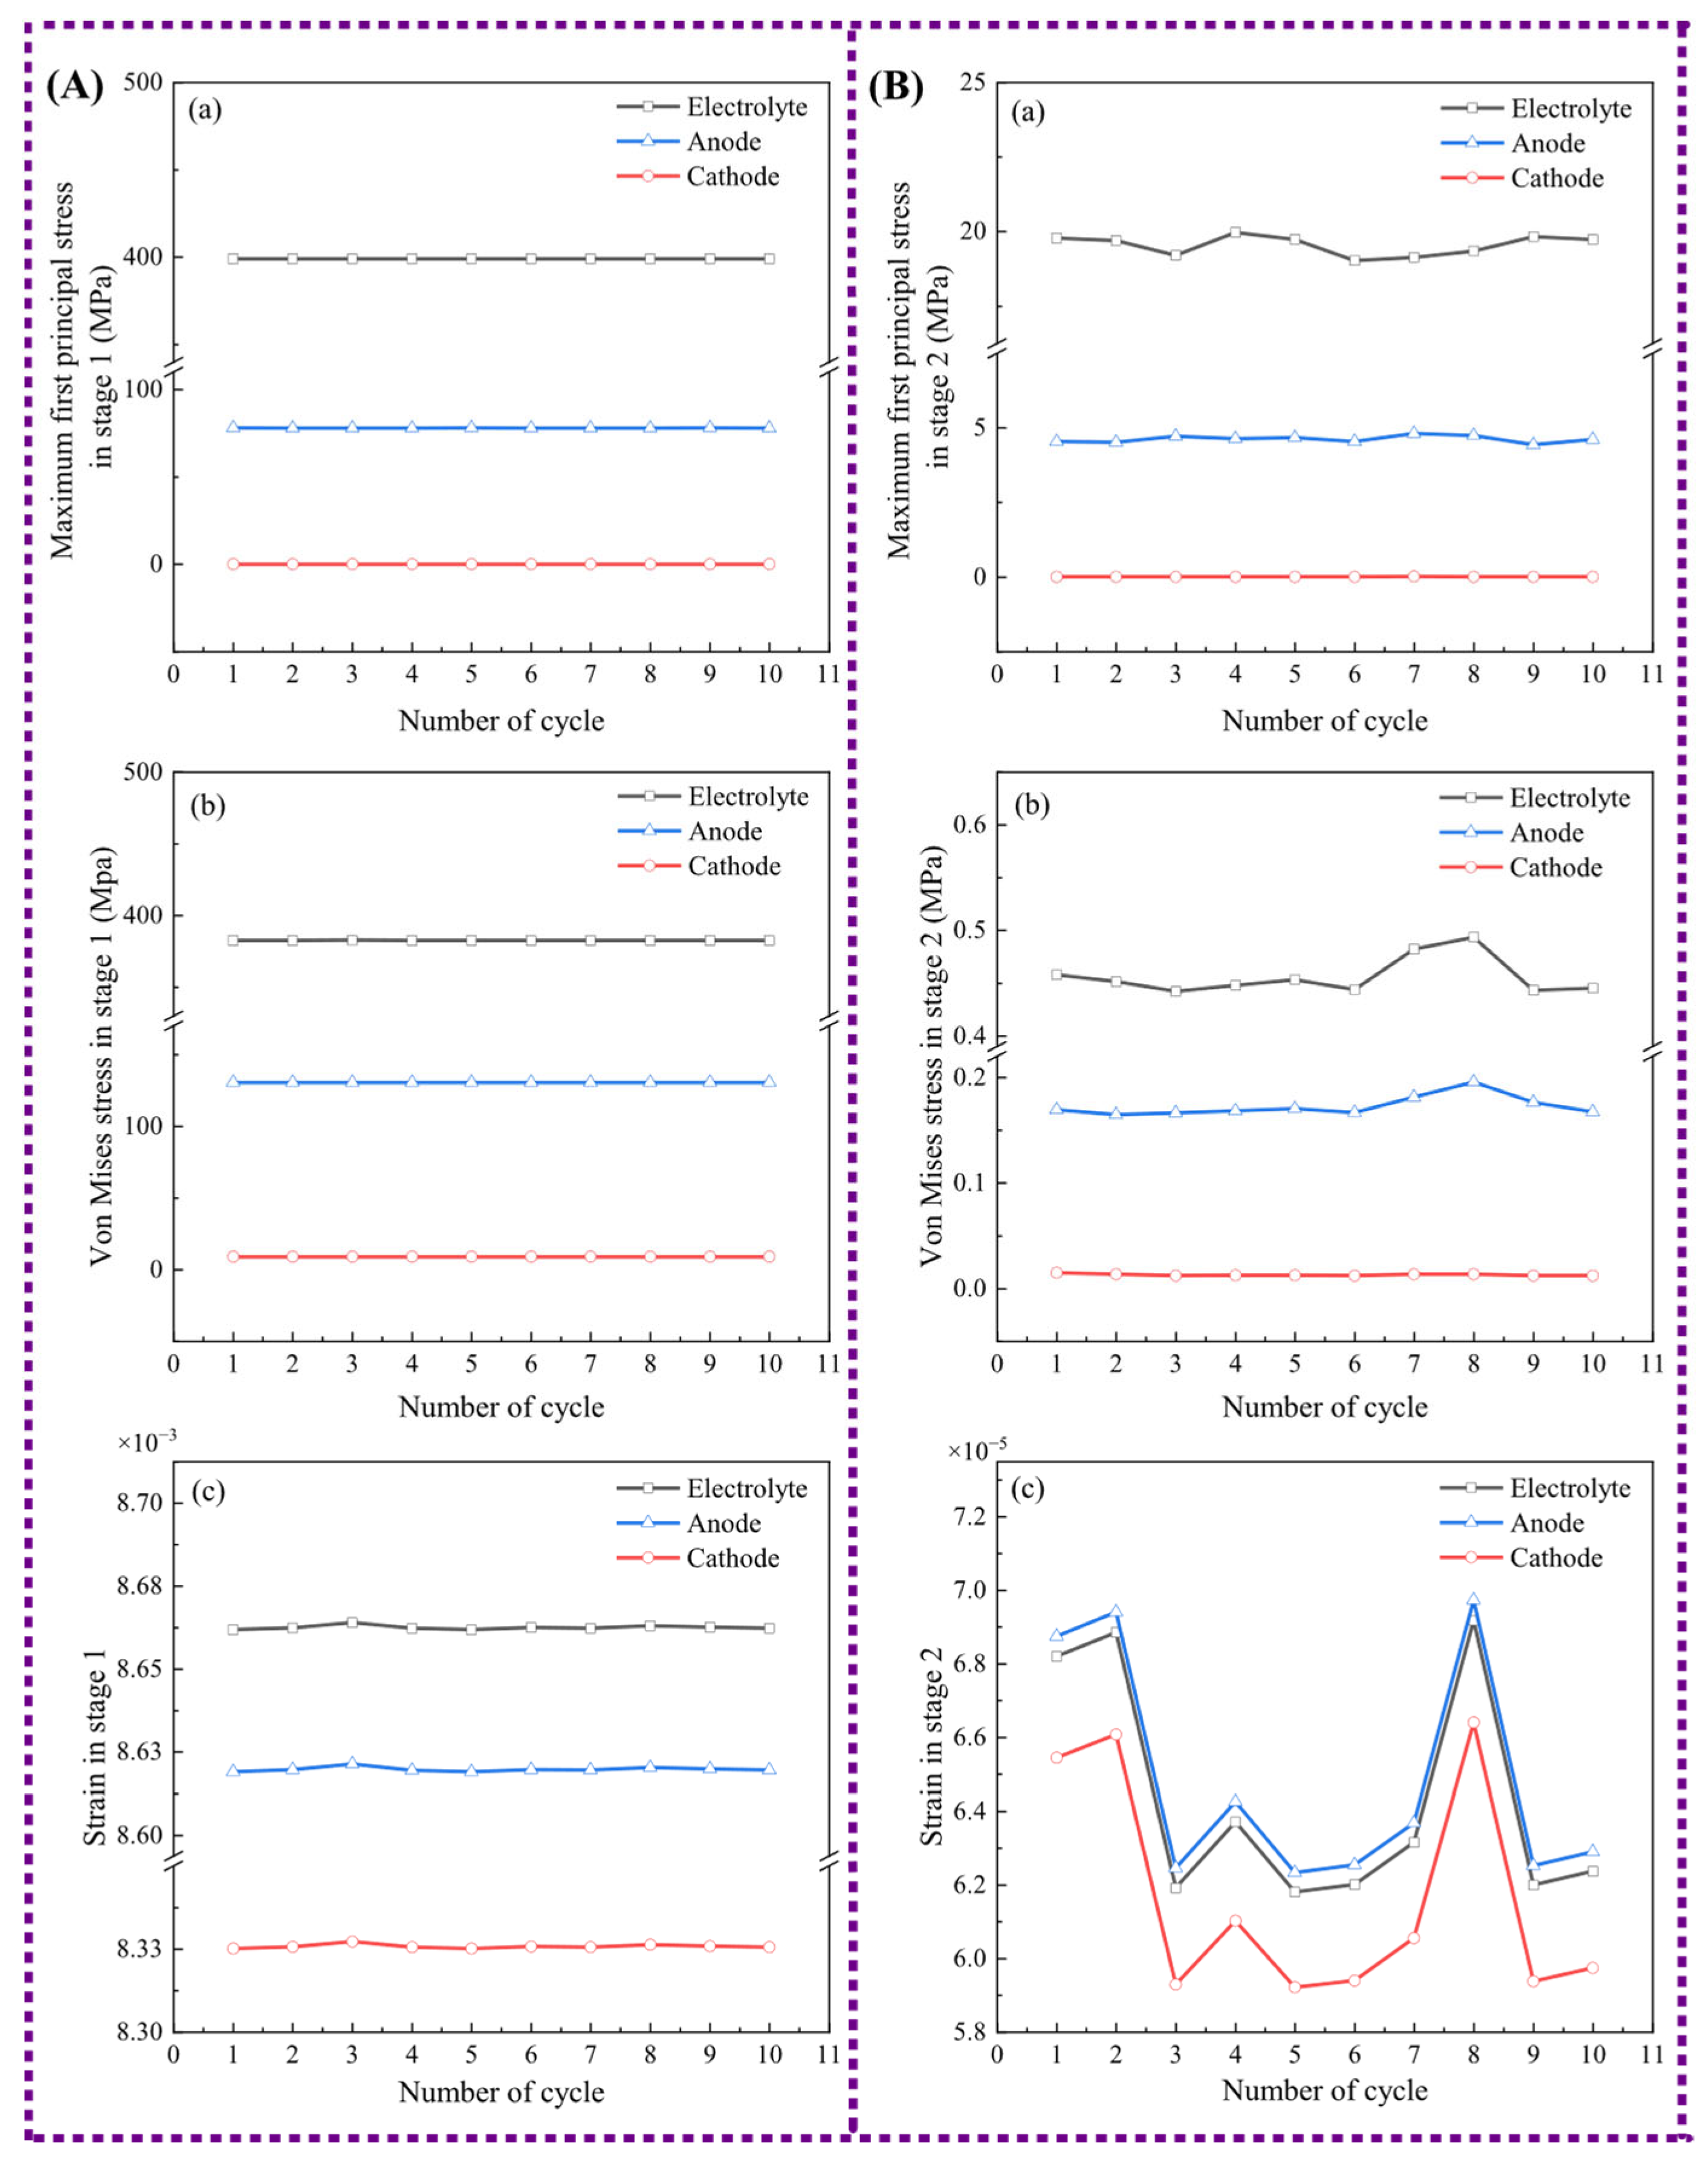
Figure 9 presents the variation in the maximum first principal stress, Von Mises stress, and principal strain in each layer of the PEN structure during stage 1 and stage 2 as a function of the number of cycles. Among these, t2 is chosen as the representative time instant for stage 1, and t5 for stage 2. t2 and t5 correspond to the moment when the temperature gradient reaches its maximum and the transient thermal stress peaks during the heating and cooling stages, respectively. At these moments, the internal temperature distribution of the cell is most non-uniform, and the thermal stress generally reaches its maximum value during heating and cooling. These two time instants were selected to capture the most severe stress conditions during thermal cycling. As shown in the figure, and consistent with findings from previous studies [19], the maximum values of the first principal stress, Von Mises stress, and principal strain in each layer do not significantly change during stage 1 as the number of cycles increases. For the anode, the maximum first principal stress, Von Mises stress, and principal strain are approximately 85.5 MPa, 130.5 MPa, and 8.623 × 10⁻³, respectively. For the electrolyte layer, the corresponding values are 401 MPa, 382.7 MPa, and 8.665 × 10⁻³. For the cathode, the maximum thermal stress is around 0.017 MPa, the maximum Von Mises stress is 382.7 MPa, and the maximum strain is 8.325 × 10⁻³. Therefore, during the insulation stage, when the temperature reaches the operating point and is maintained, the thermal stress of the fuel cell remains relatively stable even after multiple cycles. Among all the layers, the electrolyte layer experiences the highest thermal stress and thus has the greatest risk of failure. In stage 2, as seen in the figure, the maximum first principal stress and Von Mises stress in both the anode and electrolyte layers fluctuate during each cycle. These fluctuations range from 0.2 MPa to 0.7 MPa for the first principal stress and from 0.05 MPa to 0.03 MPa for the Von Mises stress. In contrast, the maximum thermal stress and Von Mises stress in the cathode layer remain stable during each cycle in stage 2. The strain fluctuations in the anode, electrolyte, and cathode layers follow similar trends, with all fluctuations within the range of 7.4 × 10⁻⁶. Among the three layers, the anode experiences the largest principal strain, while the cathode layer experiences the smallest. These findings indicate that the electrolyte layer continues to experience the highest thermal stress, both in stage 1 and stage 2. This is primarily due to the significant difference in thermal expansion coefficients between the electrolyte and the anode and cathode layers. Under thermal cycling conditions, these differences in expansion lead to higher thermal stress in the electrolyte. From a structural perspective, the electrolyte layer is positioned between the anode and cathode, and its temperature changes more slowly compared to the other layers, resulting in a larger temperature gradient. Additionally, the electrolyte must constrain the thermal deformation of both the anode and cathode layers, further contributing to the relatively higher thermal stress. Given these factors, special attention should be paid to the performance of the electrolyte layer during the long-term operation of the flat-tubular SOFCs. Ensuring the integrity of the electrolyte layer is critical to maintaining the reliability and extending the service life of the fuel cell.
Figure 9.
Maximum 1st principal stress, Mises stress and principal strain of the PEN structure at (A) stages 1 and (B) stage 2 under ten thermal cycles: (a) maximum 1st principal stress, stage 1; (b) maximum 1st principal stress at stage 2; (c) Mises stress at stage 1.
5. Conclusions
In this study, a thermo-chemo-mechanical multi-physics field coupled finite element analysis was developed to analyze the thermal stress behavior of solid oxide fuel cells (SOFCs) featuring a dual-cathode symmetric structure under thermal cycling conditions. The model was employed to investigate the effects of operating temperature, transient temperature rise rate, and multiple thermal cycles on the internal stress distribution. The results indicate that both the operating temperature and the transient temperature rise rate significantly influence thermal stress. Specifically, higher operating temperatures lead to increased stress: compared to the stress level at 700 °C, the internal stress rises by 14.77% at 800 °C and by 29.52% at 900 °C. Regarding the transient temperature rise rate, the simulations reveal a non-monotonic relationship: excessively rapid or slow transient temperature rise rates both elevate internal stress. A moderate rate, specifically within the range of 10 °C/min, is recommended to minimize thermal stress. The stress distribution across the cell components is non-uniform, with the electrolyte layer experiencing the highest stress, followed by the anode, while the cathode exhibits the lowest levels. This multi-physical field coupling model supplements existing models by accounting for changes in material properties caused by microstructural variations in the SOFCs induced by thermal cycling, particularly at the layer interfaces and within the porous electrodes. It advances the computational framework by implementing a cycle-by-cycle update of the material constitutive model. The simulation results indicate that the peak stress in the electrolyte layer increases by approximately 2% after 10 thermal cycles, an increment that serves as an indicator for reassessing the aging state of the SOFCs. A more comprehensive assessment of long-term durability would require coupling the thermo-mechanical model with damage mechanics or phase-field approaches to simulate crack evolution and its feedback on material performance; such extensions are planned in future work.
Author Contributions
Y.H.: Visualization, formal analysis, data curation, investigation, writing—edit draft preparation; Q.X.: Methodology, software, investigation, writing—original draft preparation; C.W.: Geometric model, validation; F.M.: Conceptualization, resources, funding acquisition, project administration, supervision, writing—review and editing. All authors have read and agreed to the published version of the manuscript.
Funding
This research was funded by the Municipal Key R&D Program of Ningbo (Grant no. 2023Z145) and the National Natural Science Foundation of China (Grant no. 12572436).
Data Availability Statement
The original contributions presented in this study are included in the article. Further inquiries can be directed to the corresponding author.
Conflicts of Interest
The authors declare that they have no known competing financial interests or personal relationships that could have appeared to influence the work reported in this work.
References
- Lin, C.K.; Huang, L.H.; Chiang, L.K.; Chyou, Y.P. Thermal stress analysis of planar solid oxide fuel cell stacks: Effects of sealing design. J. Power Sources 2009, 192, 515–524. [Google Scholar] [CrossRef] [Scilit]
- Neri, J.; Cammarata, A.; Donazzi, A. Experimental and Model Investigation of a Solid Oxide Fuel Cell Operated Under Low Fuel Flow Rate. J. Electrochem. Soc. 2023, 170, 124506. [Google Scholar] [CrossRef] [Scilit]
- Kuterbekov, K.A.; Nikonov, A.; Bekmyrza, K.Z.; Pavzderin, N.B.; Kabyshev, A.M.; Kubenova, M.M.; Kabdrakhimova, G.D.; Aidarbekov, N. Classification of Solid Oxide Fuel Cells. Nanomaterials 2022, 12, 1059. [Google Scholar] [CrossRef] [Scilit]
- Gong, C.Y.; Cai, S.S.; Gang, W.J.; Guan, Y.; Wen, C.; Tu, Z.K. Geometry and flow field optimization design of solid oxide fuel cell stack for temperature and flow rate uniformity improvement. Int. J. Hydrogen Energy 2025, 160, 150625. [Google Scholar] [CrossRef] [Scilit]
- Jian, J.T.; Fan, Y.C.; Mei, S.X.; Zhang, X.C.; Zhu, Y.; Wang, S.X. Analysis of a fitting model based on polarization characteristics of solid oxide fuel cells. J. Power Sources 2025, 629, 235941. [Google Scholar] [CrossRef] [Scilit]
- Damm, D.L.; Fedorov, A.G. Reduced-order transient thermal modeling for SOFC heating and cooling. J. Power Sources 2005, 159, 956–967. [Google Scholar] [CrossRef] [Scilit]
- Li, G.; Liao, Y.F.; Cheng, J.F.; Huo, H.B.; Xu, J.X. Coupled Electrochemical-Thermo-Stress Analysis for Methanol-Fueled Solid Oxide Fuel Cells. J. Electrochem. Soc. 2024, 171, 054502. [Google Scholar] [CrossRef] [Scilit]
- Frandsen, H.L.; Makowska, M.; Greco, F.; Chatzichristodoulou, C.; Ni, D.W.; Curran, D.J.; Strobl, M.; Kuhn, L.T.; Hendriksen, P.V. Accelerated creep in solid oxide fuel cell anode supports during reduction. J. Power Sources 2016, 323, 78–89. [Google Scholar] [CrossRef] [Scilit]
- Masini, A.; Siska, F.; Sevecek, O.; Chlup, Z.; Dlouhy, I. Elastic properties of multi-layered ceramic systems for SOCs. Int. J. Appl. Ceram. Technol. 2018, 15, 370–379. [Google Scholar] [CrossRef] [Scilit]
- Yakabe, H.; Ogiwara, T.; Hishinuma, M.; Yasuda, I. 3-D model calculation for planar SOFC. J. Power Sources 2001, 102, 144–154. [Google Scholar] [CrossRef] [Scilit]
- VanHerle, J.; Horita, T.; Kawada, T.; Sakai, N.; Yokokawa, H.; Dokiya, M. Low temperature fabrication of (Y,Gd,Sm)-doped ceria electrolyte. Solid State Ion. 1996, 86–88, 1255–1258. [Google Scholar] [CrossRef] [Scilit]
- Yusoff, W.; Baharuddin, N.A.; Somalu, M.R.; Muchtar, A.; Brandon, N.P.; Fan, H.Q. Recent advances and influencing parameters in developing electrode materials for symmetrical solid oxide fuel cells. Int. J. Miner. Metall. Mater. 2023, 30, 1933–1956. [Google Scholar] [CrossRef] [Scilit]
- Zhang, W.; Hu, Y.H. Material design and performance of carbon monoxide-fueled solid oxide fuel cells: A review. Energy Sci. Eng. 2023, 11, 3276–3288. [Google Scholar] [CrossRef] [Scilit]
- Matysko, R. Steady state and transient analysis of solid oxide fuel cell within the framework of thermodynamic energy cycles. Arch. Thermodyn. 2023, 44, 317–333. [Google Scholar] [CrossRef] [Scilit]
- Selimovic, A.; Kemm, M.; Torisson, T.; Assadi, M. Steady state and transient thermal stress analysis in planar solid oxide fuel cells. J. Power Sources 2005, 145, 463–469. [Google Scholar] [CrossRef] [Scilit]
- Peng, J.X.; Zhao, D.Q.; Xu, Y.W.; Wu, X.L.; Li, X. Comprehensive Analysis of Solid Oxide Fuel Cell Performance Degradation Mechanism, Prediction, and Optimization Studies. Energies 2023, 16, 788. [Google Scholar] [CrossRef] [Scilit]
- Zheng, H.X.; Jiang, W.C.; Luo, Y.; Song, M.; Zhang, X.C.; Tu, S.T. Electrochemical and mechanical performance degradation mechanisms of solid oxide fuel cell stacks under long-term operation. Renew. Energy 2025, 251, 123462. [Google Scholar] [CrossRef] [Scilit]
- Vinchhi, P.; Khandla, M.; Chaudhary, K.; Pati, R. Recent advances on electrolyte materials for SOFC: A review. Inorg. Chem. Commun. 2023, 152, 110724. [Google Scholar] [CrossRef] [Scilit]
- Anam, K.; Lin, C.K.; Purnowidodo, A. Simulation of Cracking Behavior in Planar Solid Oxide Fuel Cell during Thermal Cycling. Key Eng. Mater. 2015, 656–657, 484–489. [Google Scholar] [CrossRef] [Scilit]
- Zhang, Z.G.; Yue, D.T.; Yang, G.G.; Chen, J.F.; Zheng, Y.F.; Miao, H.; Wang, W.G.; Yuan, J.L.; Huang, N.B. Three-dimensional CFD modeling of transport phenomena in multi-channel anode-supported planar SOFCs. Int. J. Heat Mass Transf. 2015, 84, 942–954. [Google Scholar] [CrossRef] [Scilit]
- Ahmed, N.; Devi, S.; Dar, M.A.; Ibrahim, S.K.M.; Sharma, A.; Sharma, N.; Paul, S.; Ahamed, S.R. Anode material for solid oxide fuel cell: A review. Indian J. Phys. 2024, 98, 877–888. [Google Scholar] [CrossRef] [Scilit]
- Liu, F.J.; Su, Z.Q.; Li, H.Z.; Wang, Q.J.; Wang, X.; Shang, W.W.; Xu, B. Status and prospects of electrode materials for symmetrical solid oxide fuel cells: A concise review. Ionics 2025, 31, 3877–3894. [Google Scholar] [CrossRef] [Scilit]
- Liu, J.Y.; Chen, L.; Dong, H.; Fu, L.R.; Xiong, H.; Liu, Y.H.; Tang, Y.W. A numerical study on the performance of a novel arc-shaped solid oxide fuel cell. Int. J. Hydrogen Energy 2025, 105, 1207–1216. [Google Scholar] [CrossRef] [Scilit]
- Nguyen, X.V. Three-Dimensional Simulation of the Operating Characteristics of Cell Layers in Solid Oxide Fuel Cells. Appl. Sci. 2025, 15, 4462. [Google Scholar] [CrossRef] [Scilit]
- Qin, H.C.; Zhang, B.T.; Zhou, R.J.; Sun, Y.T.; Tian, H.C.; Wang, Z.C.; Wu, S.J.; Li, X.; Jiang, J.H. Efficiency and longevity trade-off analysis and real-time dynamic health state estimation of solid oxide fuel cell system. Appl. Energy 2024, 372, 123722. [Google Scholar] [CrossRef] [Scilit]
- Omri, B.; Garraoui, R.; Sbita, L. Multiphysics Modeling and Numerical Simulation of Solid Oxide Fuel Cells (SOFC) for the Optimization of Thermal, Electrical, Mechanical, and Electrochemical Performance. Arab. J. Sci. Eng. 2025, 15, 303. [Google Scholar] [CrossRef] [Scilit]
- Zeng, Z.Z.; Qian, Y.P.; Zhang, Y.J.; Hao, C.K.; Dan, D.; Zhuge, W.L. A review of heat transfer and thermal management methods for temperature gradient reduction in solid oxide fuel cell (SOFC) stacks. Appl. Energy 2020, 280, 115899. [Google Scholar] [CrossRef] [Scilit]
- Zheng, H.X.; Jiang, W.C.; Luo, Y.; Song, M.; Zhang, X.C.; Tu, S.T. Life prediction method of solid oxide fuel cells based on mechanistic damage and electrochemical performance degradation. J. Power Sources 2025, 631, 236202. [Google Scholar] [CrossRef] [Scilit]
- Weiqiang, C.; Jinliang, Y.; Qingrong, Z.; Wanneng, Y.; Zibin, Y.; Zhonggang, Z.; Yuyao, P.; Shian, L. Numerical Investigation of Heat/Flow Transfer and Thermal Stress in an Anode-Supported Planar SOFC. Crystals 2022, 12, 1697. [Google Scholar] [CrossRef] [Scilit]
- Atkinson, A.; Sun, B. Residual stress and thermal cycling of planar solid oxide fuel cells. Mater. Sci. Technol. 2007, 23, 1135–1143. [Google Scholar] [CrossRef] [Scilit]
- Li, M.; Huang, Z.; Yan, D.; Jia, L.C.; Zhang, W.Y. Investigation of the effect of sinusoidal flow channel structures on the steady state and transient characteristics of SOFC. Int. J. Hydrogen Energy 2025, 136, 477–490. [Google Scholar] [CrossRef] [Scilit]
- Duan, N.Q.; Yan, D.; Chi, B.; Pu, J.; Jian, L. High performance anode-supported tubular solid oxide fuel cells fabricated by a novel slurry-casting method. Sci. Rep. 2015, 5, 25640168. [Google Scholar] [CrossRef] [Scilit]
- Xie, J.; Li, J.; Hao, W.; Wang, F. Influence of Interface Morphology on the Thermal Stress Distribution of SOFC under Inhomogeneous Temperature Field. Energies 2023, 16, 7349. [Google Scholar] [CrossRef] [Scilit]
- Wang, D.; Wang, L.Y.; Liu, Y.X.; Zhang, X.; Liu, Z.C. Study of thermal effects in ammonia-fueled solid oxide fuel cells. J. Electroanal. Chem. 2024, 953, 118001. [Google Scholar] [CrossRef] [Scilit]
- Jiang, C.Y.; Gu, Y.C.; Guan, W.B.; Ni, M.; Sang, J.K.; Zhong, Z.; Singhal, S.C. Thermal Stress Analysis of Solid Oxide Fuel Cell with Z-type and Serpentine-Type Channels Considering Pressure Drop. J. Electrochem. Soc. 2020, 167, 044517. [Google Scholar] [CrossRef] [Scilit]
- Jiang, C.Y.; Gu, Y.C.; Guan, W.B.; Zheng, J.H.; Ni, M.; Zhong, Z. 3D thermo-electro-chemo-mechanical coupled modeling of solid oxide fuel cell with double-sided cathodes. Int. J. Hydrogen Energy 2020, 45, 904–915. [Google Scholar] [CrossRef] [Scilit]
- Luo, Y.; Feng, D.Z.; Zheng, Y.T.; Zhang, Y.C.; Jiang, W.C. High-temperature creep damage and failure of symmetrical flat-tube solid oxide fuel cell. Fuel 2025, 385, 134081. [Google Scholar] [CrossRef] [Scilit]
- Li, J.Y.; Lin, Z.J. Effects of electrode composition on the electrochemical performance and mechanical property of micro-tubular solid oxide fuel cell. Int. J. Hydrogen Energy 2012, 37, 12925–12940. [Google Scholar] [CrossRef] [Scilit]
- Xu, M.; Li, T.S.; Yang, M.; Andersson, M.; Fransson, I.; Larsson, T.; Sundén, B. Modeling of an anode supported solid oxide fuel cell focusing on thermal stresses. Int. J. Hydrogen Energy 2016, 41, 14927–14940. [Google Scholar] [CrossRef] [Scilit]
- Guan, W.; Du, Z.; Wang, J.; Jiang, L.; Yang, J.; Zhou, X.-D. Mechanisms of performance degradation induced by thermal cycling in solid oxide fuel cell stacks with flat-tube anode-supported cells based on double-sided cathodes. Int. J. Hydrogen Energy 2020, 45, 19840–19846. [Google Scholar] [CrossRef] [Scilit]
- Li, J.; Kong, W.; Lin, Z. Theoretical studies on the electrochemical and mechanical properties and microstructure optimization of micro-tubular solid oxide fuel cells. J. Power Sources 2013, 232, 106–122. [Google Scholar] [CrossRef] [Scilit]
- Xu, H.R.; Chen, B.; Liu, J.; Ni, M. Modeling of direct carbon solid oxide fuel cell for CO and electricity cogeneration. Appl. Energy 2016, 178, 353–362. [Google Scholar] [CrossRef] [Scilit]
- Zeng, S.M.; Yu, G.S.; Parbey, J.; Song, D.; Li, T.S.; Andersson, M. Effect of the Electrochemical Active Site on Thermal Stress in Solid Oxide Fuel Cells. J. Electrochem. Soc. 2018, 165, F105–F113. [Google Scholar] [CrossRef] [Scilit]
- Osman, S.; Ahmed, K.; Nemattalla, M.; Ookawara, S.; Ahmed, M. Performance and thermal stresses in functionally graded anode-supported honeycomb solid-oxide fuel cells. Int. J. Hydrogen Energy 2021, 46, 33010–33027. [Google Scholar] [CrossRef] [Scilit]
- Yakabe, H.; Hishinuma, M.; Uratani, M.; Matsuzaki, Y.; Yasuda, I. Evaluation and modeling of performance of anode-supported solid oxide fuel cell. J. Power Sources 2000, 86, 423–431. [Google Scholar] [CrossRef] [Scilit]

Disclaimer/Publisher’s Note: The statements, opinions and data contained in all publications are solely those of the individual author(s) and contributor(s) and not of MDPI and/or the editor(s). MDPI and/or the editor(s) disclaim responsibility for any injury to people or property resulting from any ideas, methods, instructions or products referred to in the content. |
© 2026 by the authors. Licensee MDPI, Basel, Switzerland. This article is an open access article distributed under the terms and conditions of the Creative Commons Attribution (CC BY) license.