


Abstract
Waste biomass represents both an environmental pollutant and a potential renewable energy source. This study examines the feasibility of hydrogen production from tea residue biomass and solid waste, focusing on pyrolysis-based hydrogen generation. Compared to atmospheric pyrolysis, vacuum conditions reduce the saturated vapor pressure of biomass volatiles, thereby promoting char gasification, gas-phase interactions, and secondary tar cracking. Utilizing a self-designed vacuum-pyrolysis-catalysis system, we investigated the effects of key parameters—vacuum level, temperature, catalyst-to-feedstock ratio, and retention time on pyrolysis product distribution and formation mechanisms. Results indicate that Ni was successfully and uniformly loaded onto waste calcium oxide desiccant (DC) support via impregnation, thereby significantly increasing the specific surface area of the catalyst. Optimization using response surface methodology identified the following optimal conditions: pressure of 5 kPa, temperature of 835.89 °C, catalyst/feedstock ratio of 110.02%, and retention time of 2.35 h. Under these conditions, a hydrogen yield of 256.39 mL·g−1 was achieved, corresponding to 95.3% of the simulated value. The process not only enabled efficient hydrogen production but also simultaneously yielded bio-oil and biochar, thereby facilitating carbon capture and recycling. These findings provide valuable insights into the resource-oriented application of vacuum pyrolysis-catalysis technology to waste biomass.
1. Introduction
Fossil fuels, as finite resources, have been extensively exploited, leading not only to rapid depletion but also to severe environmental issues, including ecosystem degradation and global warming [1,2,3]. Consequently, the development and research of sustainable energy alternatives have become imperative. Biomass energy, a renewable and clean energy source, plays a pivotal role in mitigating the scarcity of fossil fuels and environmental pollution. In particular, biomass hydrogen technology has emerged as a key research focus in the renewable energy field in recent years, owing to its energy-saving and environmentally friendly attributes [4].
The tea plant is one of the major economic crops in China. Tea residue, a solid organic byproduct generated throughout tea production, processing, deep processing, marketing, and consumption, exhibits typical biomass characteristics and demonstrates environmental compatibility, economic feasibility, and sustainability [5,6]. In recent years, driven by trends such as the rejuvenation of tea consumption, product diversification, and growing awareness of the health benefits of tea polyphenols, both the number of tea enterprises and the volume of tea production have increased substantially, resulting in a significant rise in tea residue generation. According to statistics, global tea consumption exceeded 6.3 million tons in 2020 and is projected to increase to 7.5 million tons by 2025 [7,8]. China leads the world in annual production, with 2.74 million tons [9]. This growth not only reflects the widespread popularity and global market potential of tea but also indicates that pressure to dispose of tea residue will continue to escalate. If traditional disposal methods such as landfilling or incineration are employed, not only will the resource utilization of tea residue remain unachieved, but severe environmental pollution to soil, water bodies, and the atmosphere will also result [10].
Pyrolysis is a critical technology for hydrogen production from biomass. Under anoxic or anaerobic heating conditions, biomass feedstocks undergo thermochemical conversion to produce hydrogen [11]. However, this process inevitably generates by-product gases, including CO, CH4, and CO2. These by-products not only lower the biomass-to-hydrogen conversion efficiency but also complicate the separation and purification process, thereby increasing hydrogen production costs [12]. Catalyst addition has emerged as an effective strategy to enhance H2 yield and suppress impurity gas formation, positioning catalytic biomass pyrolysis as a prominent research frontier [13]. Li et al. [3] investigated the use of activated carbon (AC), nickel oxide (NiO), and calcined dolomite as catalysts for sawdust pyrolysis. All three catalysts significantly enhanced H2 yield, with the NiO/activated carbon composite catalyst achieving the highest H2 concentration of 62.54 vol.%. Yue et al. [14] utilized corncob as a pyrolysis feedstock and attained an H2 content of 69.59 vol.% using a Mo0.5Ni1Ca7 catalyst. In a study conducted by Xu et al. [15], the pyrolysis of herbaceous residues was investigated under Ni/CaO catalysis, demonstrating that both CaO and 10 wt.% Ni/CaO effectively removed carbon dioxide from the gaseous products. Compared to hydrogen yields of 120.98 mL·g−1 obtained using a 3Fe1Ni0.4Mg catalyst [16] and 188.6 mL·g−1 achieved with a Ni–Co/Ca catalyst [17], the 10 wt.% Ni/CaO catalyst exhibited a markedly superior performance, generating 469.2 mL·g−1 of hydrogen [18]. Given its high activity and versatility in enhancing H2 selectivity, the 10 wt.% Ni/CaO catalyst was therefore selected for biomass pyrolysis aimed at syngas production. However, although previous studies have confirmed that 10 wt.% Ni/CaO exhibits good performance in biomass catalytic conversion; the novelty of this work lies in the first use of waste CaO recovered from food desiccants as the catalyst carrier, integrated with the tea residue pyrolysis process.
As a promising thermochemical conversion technology, vacuum pyrolysis has been widely applied to produce pyrolysis oil from biomass-derived materials, such as tires and plastics [19,20,21]. However, its application in biomass pyrolysis for gas production remains relatively underexplored in the literature. The industrial adoption of this technology depends on its economic viability, which is governed by the balance between high-value products and controllable costs. Although the vacuum system requires initial capital investment and ongoing energy consumption, its benefits—including lower operating temperatures, faster processing rates, and the elimination of carrier gas—can significantly reduce operational expenditures. Furthermore, the utilization of tea residue as a near-zero-cost feedstock, coupled with its negative disposal costs and external incentives such as carbon taxes and green subsidies under global carbon-neutrality policies, substantially improves the overall economic feasibility of the vacuum pyrolysis process.
In this study, Ni-based catalysts were employed to investigate hydrogen-rich gas production through the vacuum pyrolysis of tea residue, with the dual aims of promoting the rational recycling of tea residue and the reuse of waste calcium oxide desiccant. The catalysts were synthesized by impregnation and subsequently characterized. The effects of pyrolysis vacuum degree, pyrolysis temperature, catalyst-to-feedstock ratio, and holding time on in situ vacuum pyrolysis of tea residue were discussed. Furthermore, the optimal process parameters for hydrogen production were determined and refined using response surface methodology. The findings of this work offer a foundation for the engineering application of catalytic hydrogen production via vacuum pyrolysis.
2. Experiment
2.1. Raw Materials and Catalysts
The tea residue utilized in this study was sourced from a tea factory located in the Fanjing Mountain area of Jiangkou County, Tongren City, Guizhou Province (Table A1). The collected residue was initially dried at 110 °C for 24 h in a forced-air oven, then crushed, ground, and sieved through a 30–40 mesh sieve. The processed material was then stored in sealed bags for subsequent use. This study synthesized the composite catalyst using waste calcium oxide desiccant and nickel nitrate hexahydrate (Ni(NO3)2·6H2O) as precursors. The calcium oxide desiccant was sourced from commercially available independent desiccant packets contained within “Want Want” rice cracker packaging. Nickel nitrate hexahydrate (99.8% purity) was procured from Shanghai Aladdin Biochemical Technology Co., Ltd., Shanghai, China. Prior to use, the desiccant (hereafter designated as DC) underwent a pretreatment procedure. Specifically, the DC was ground into a fine powder and transferred to a muffle furnace. It was then heated to 900 °C at a ramp rate of 10 °C·min−1 and maintained at this temperature for 4 h to eliminate residual moisture and volatile impurities. The synthesis commenced by dissolving 4.55 g of nickel nitrate hexahydrate (Ni(NO3)2·6H2O) in 10 mL of deionized water. This resulting solution was gradually added to 5 g of the pretreated DC powder, and continuous stirring using a glass rod to ensure uniform dispersion. The mixture was subsequently aged in ambient air for 6 h to facilitate complete impregnation. Following aging, the sample was dried in an oven at 120 °C for 12 h. The final step involved calcination in a muffle furnace at 900 °C for 4 h.
2.2. Experimental Setup and Procedure
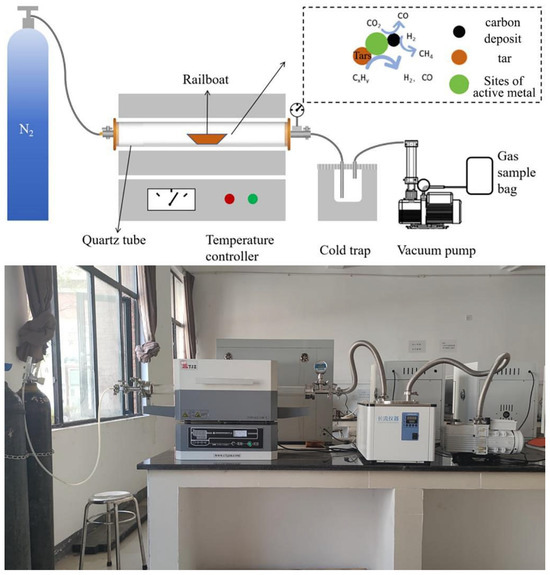
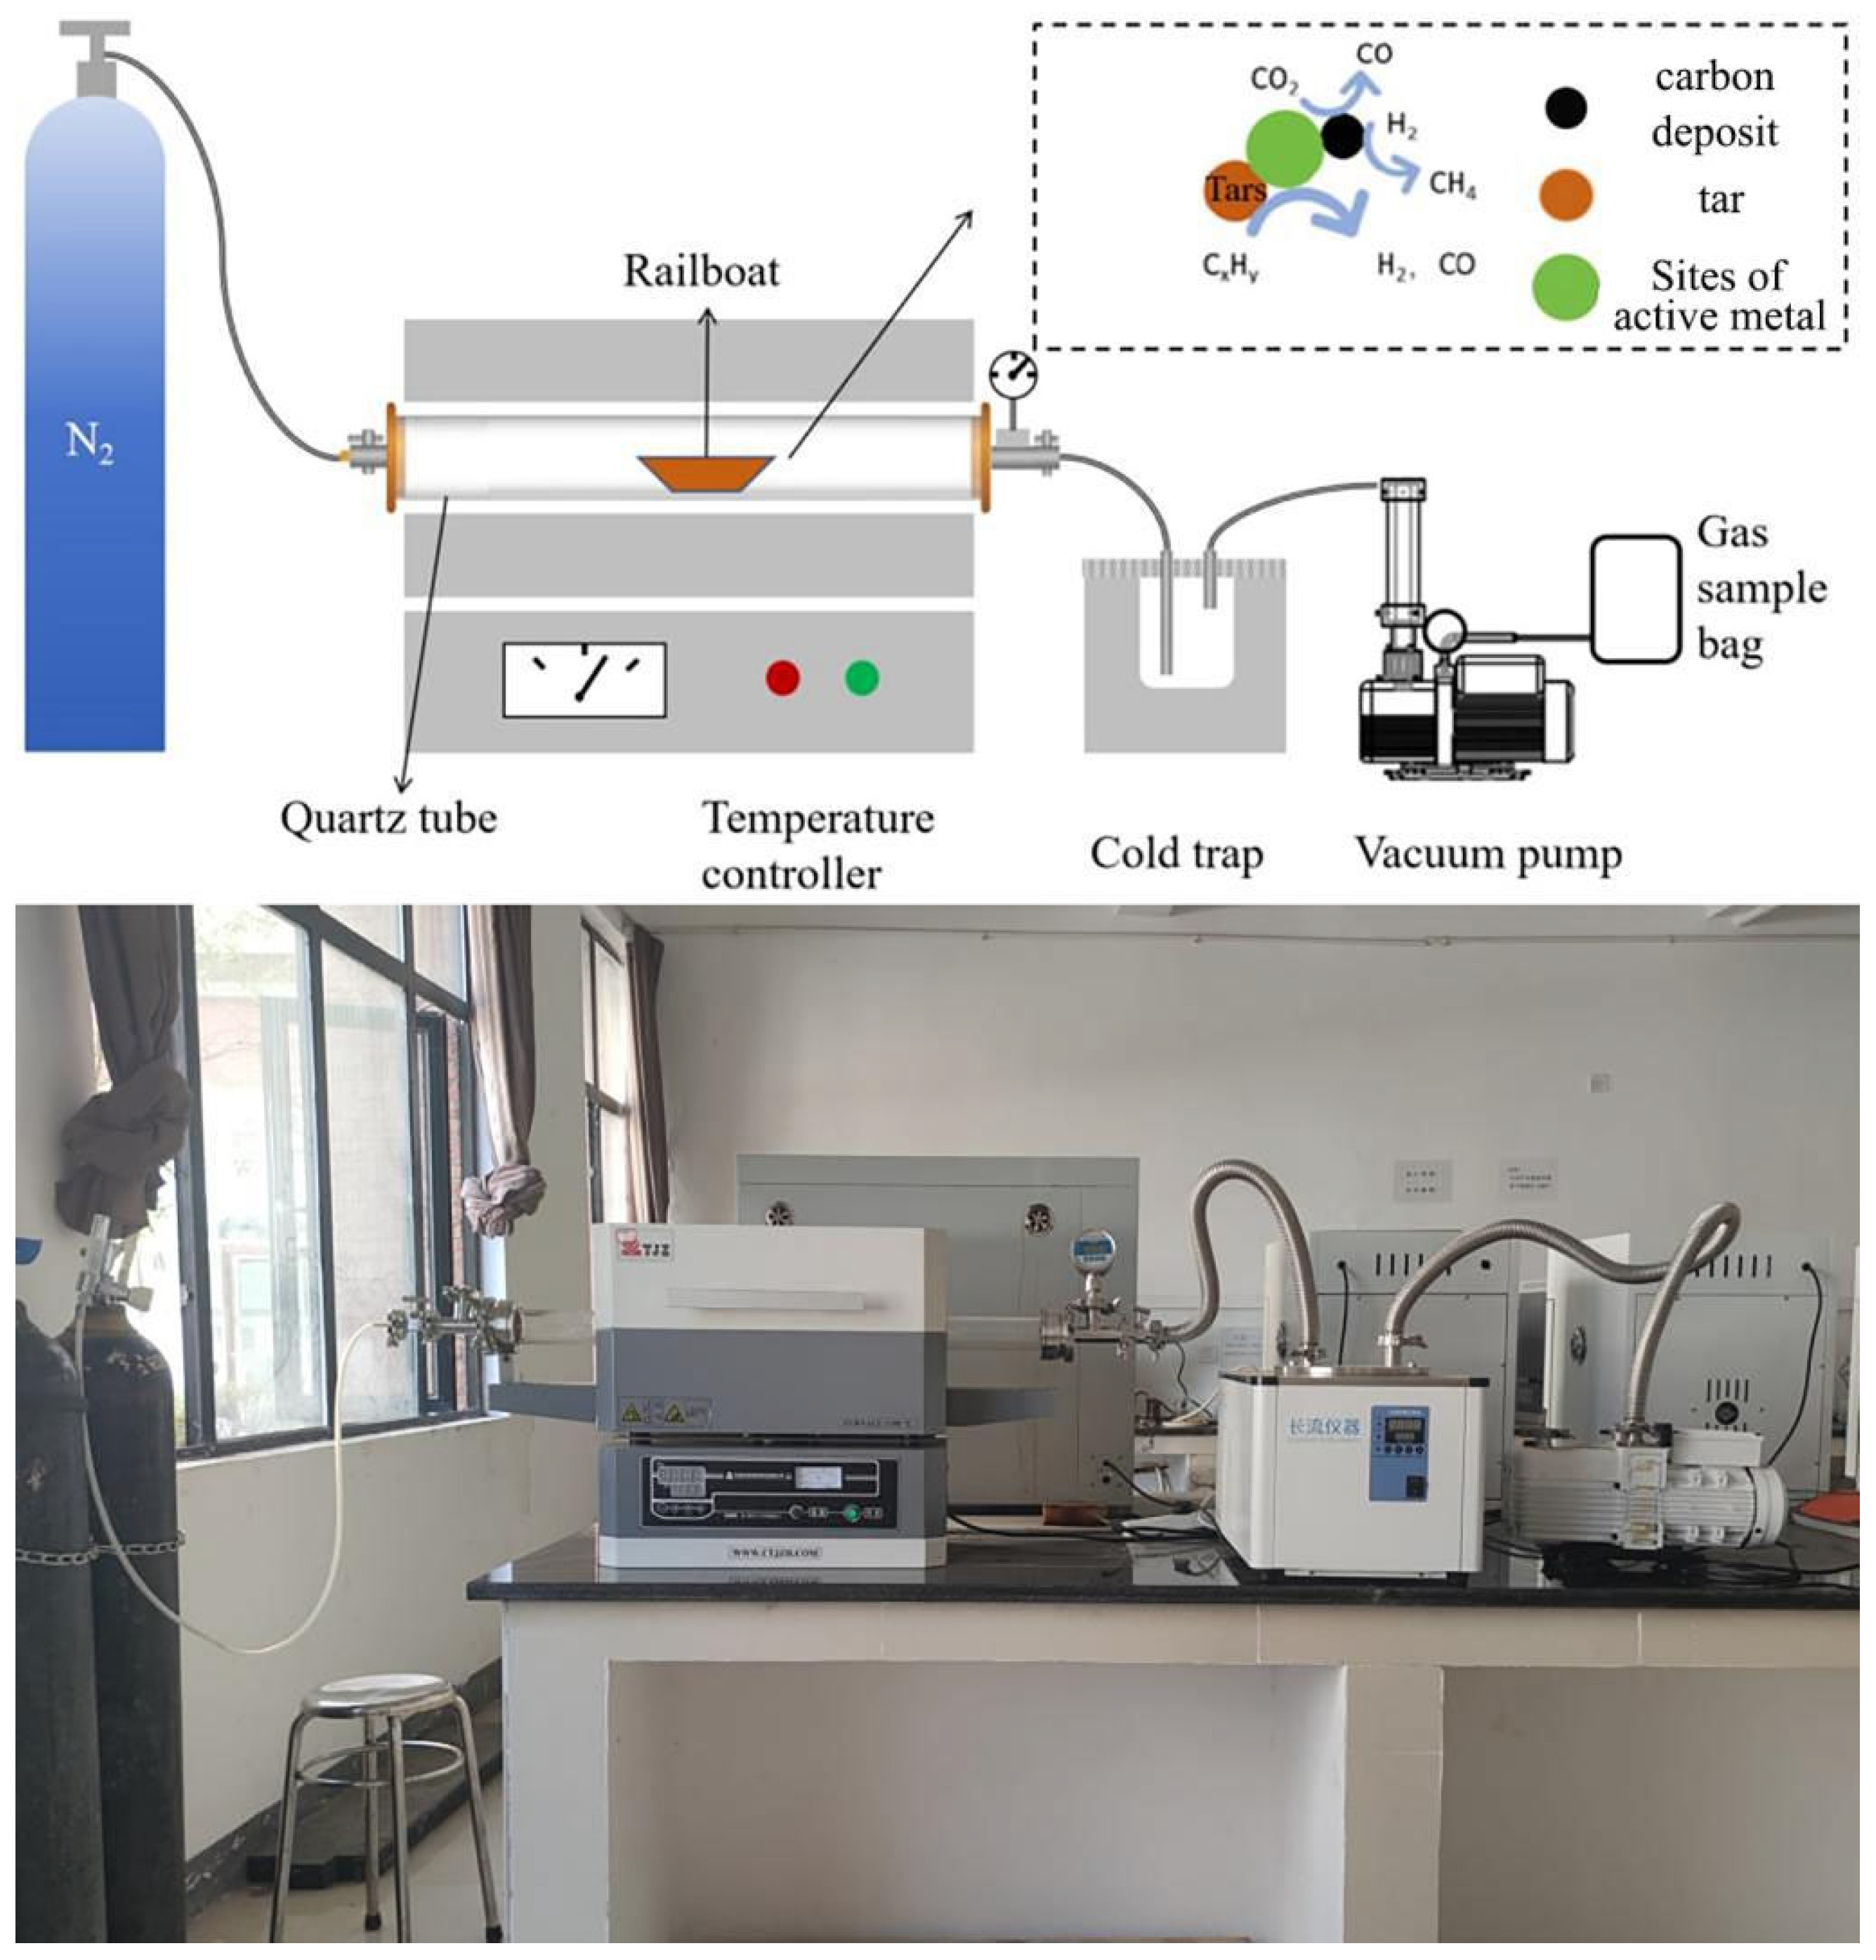
Figure 1 illustrates the schematic configuration of the vacuum pyrolysis experimental system (For detailed specifications of the experimental apparatus, refer to Table A2). The experimental protocol was executed as follows: Initially, the catalyst and tea residue were homogenously blended at a predetermined mass ratio. The resulting mixture was loaded into a pre-weighed quartz boat, and the total mass was documented. Subsequently, the quartz boat was positioned within the tubular furnace, with quartz plugs inserted at both ends. A sealing gasket was fitted, and the clamping mechanism was securely fastened to ensure hermetic integrity. Both gas valves were opened to purge the furnace chamber with nitrogen for 20 min, thereby establishing an inert atmosphere. Following this, the left-side gas valve was closed, and the vacuum pump was activated. The internal pressure was regulated to the designated initial value by adjusting the right-side gas valve, after which all system valves were closed to verify sealing efficacy. The furnace temperature was then elevated from ambient conditions to the target pyrolysis temperature at a constant heating rate of 10 °C·min−1, and it was maintained at this temperature for 2 h. Before the isothermal period concluded, the cold trap was activated, and the air within it was evacuated using the vacuum pump. Upon completion of the holding time, the downstream gas valve was opened to direct the generated gaseous products into a gas-tight sampling bag for collection. Subsequently, the left-side gas valve was opened to introduce nitrogen, thereby accelerating the cooling rate within the furnace. After the temperature decreased gradually decreased below 100 °C, the quartz boat containing the solid residue was weighed, and the corresponding mass was recorded. Each experiment was performed in triplicate to ensure reproducibility, and average values are reported. Gas volume was measured by the water displacement method, and the composition of the gaseous products was analyzed by gas chromatography. As nitrogen (N2) was employed as the carrier gas, its signal was excluded from the chromatographic data. The yield of each product was calculated based on the calibrated concentrations of the detected components (see Appendix A for details of the measurement and calculation methods).
Figure 1.
Mechanism diagram of experimental device for vacuum catalytic pyrolysis of tea residue. All non-English terms in this figure are defined as follows: Rail boat is a vessel for loading catalyst and biomass; Quartz tub refers to a high-temperature resistant sealed chamber; Temperature controller denotes a device for regulating reaction temperature; Cold trap serves as a cooling unit for condensing tar products; Vacuum pump represents equipment for evacuating the system and controlling pressure; Gas sample bag functions as a container for collecting gaseous reaction products; Carbon deposit indicates solid carbon formed on the surface of the catalyst; Tar refers to heavy organic by-products generated during the reaction; Sites of active metal correspond to catalytically active centers on the metal surface.
3. Results and Discussion
3.1. Physical Characterization
The instrument specifications and operational parameters for all characterization techniques are provided in Table A3.
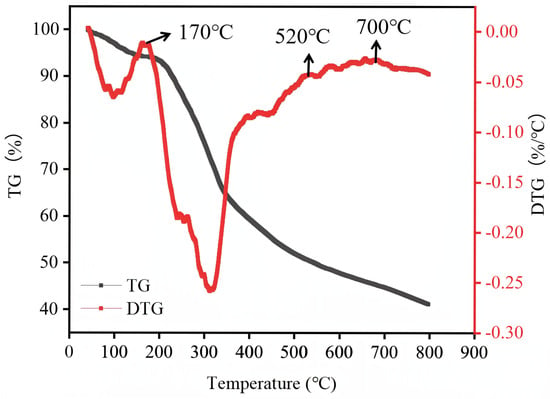
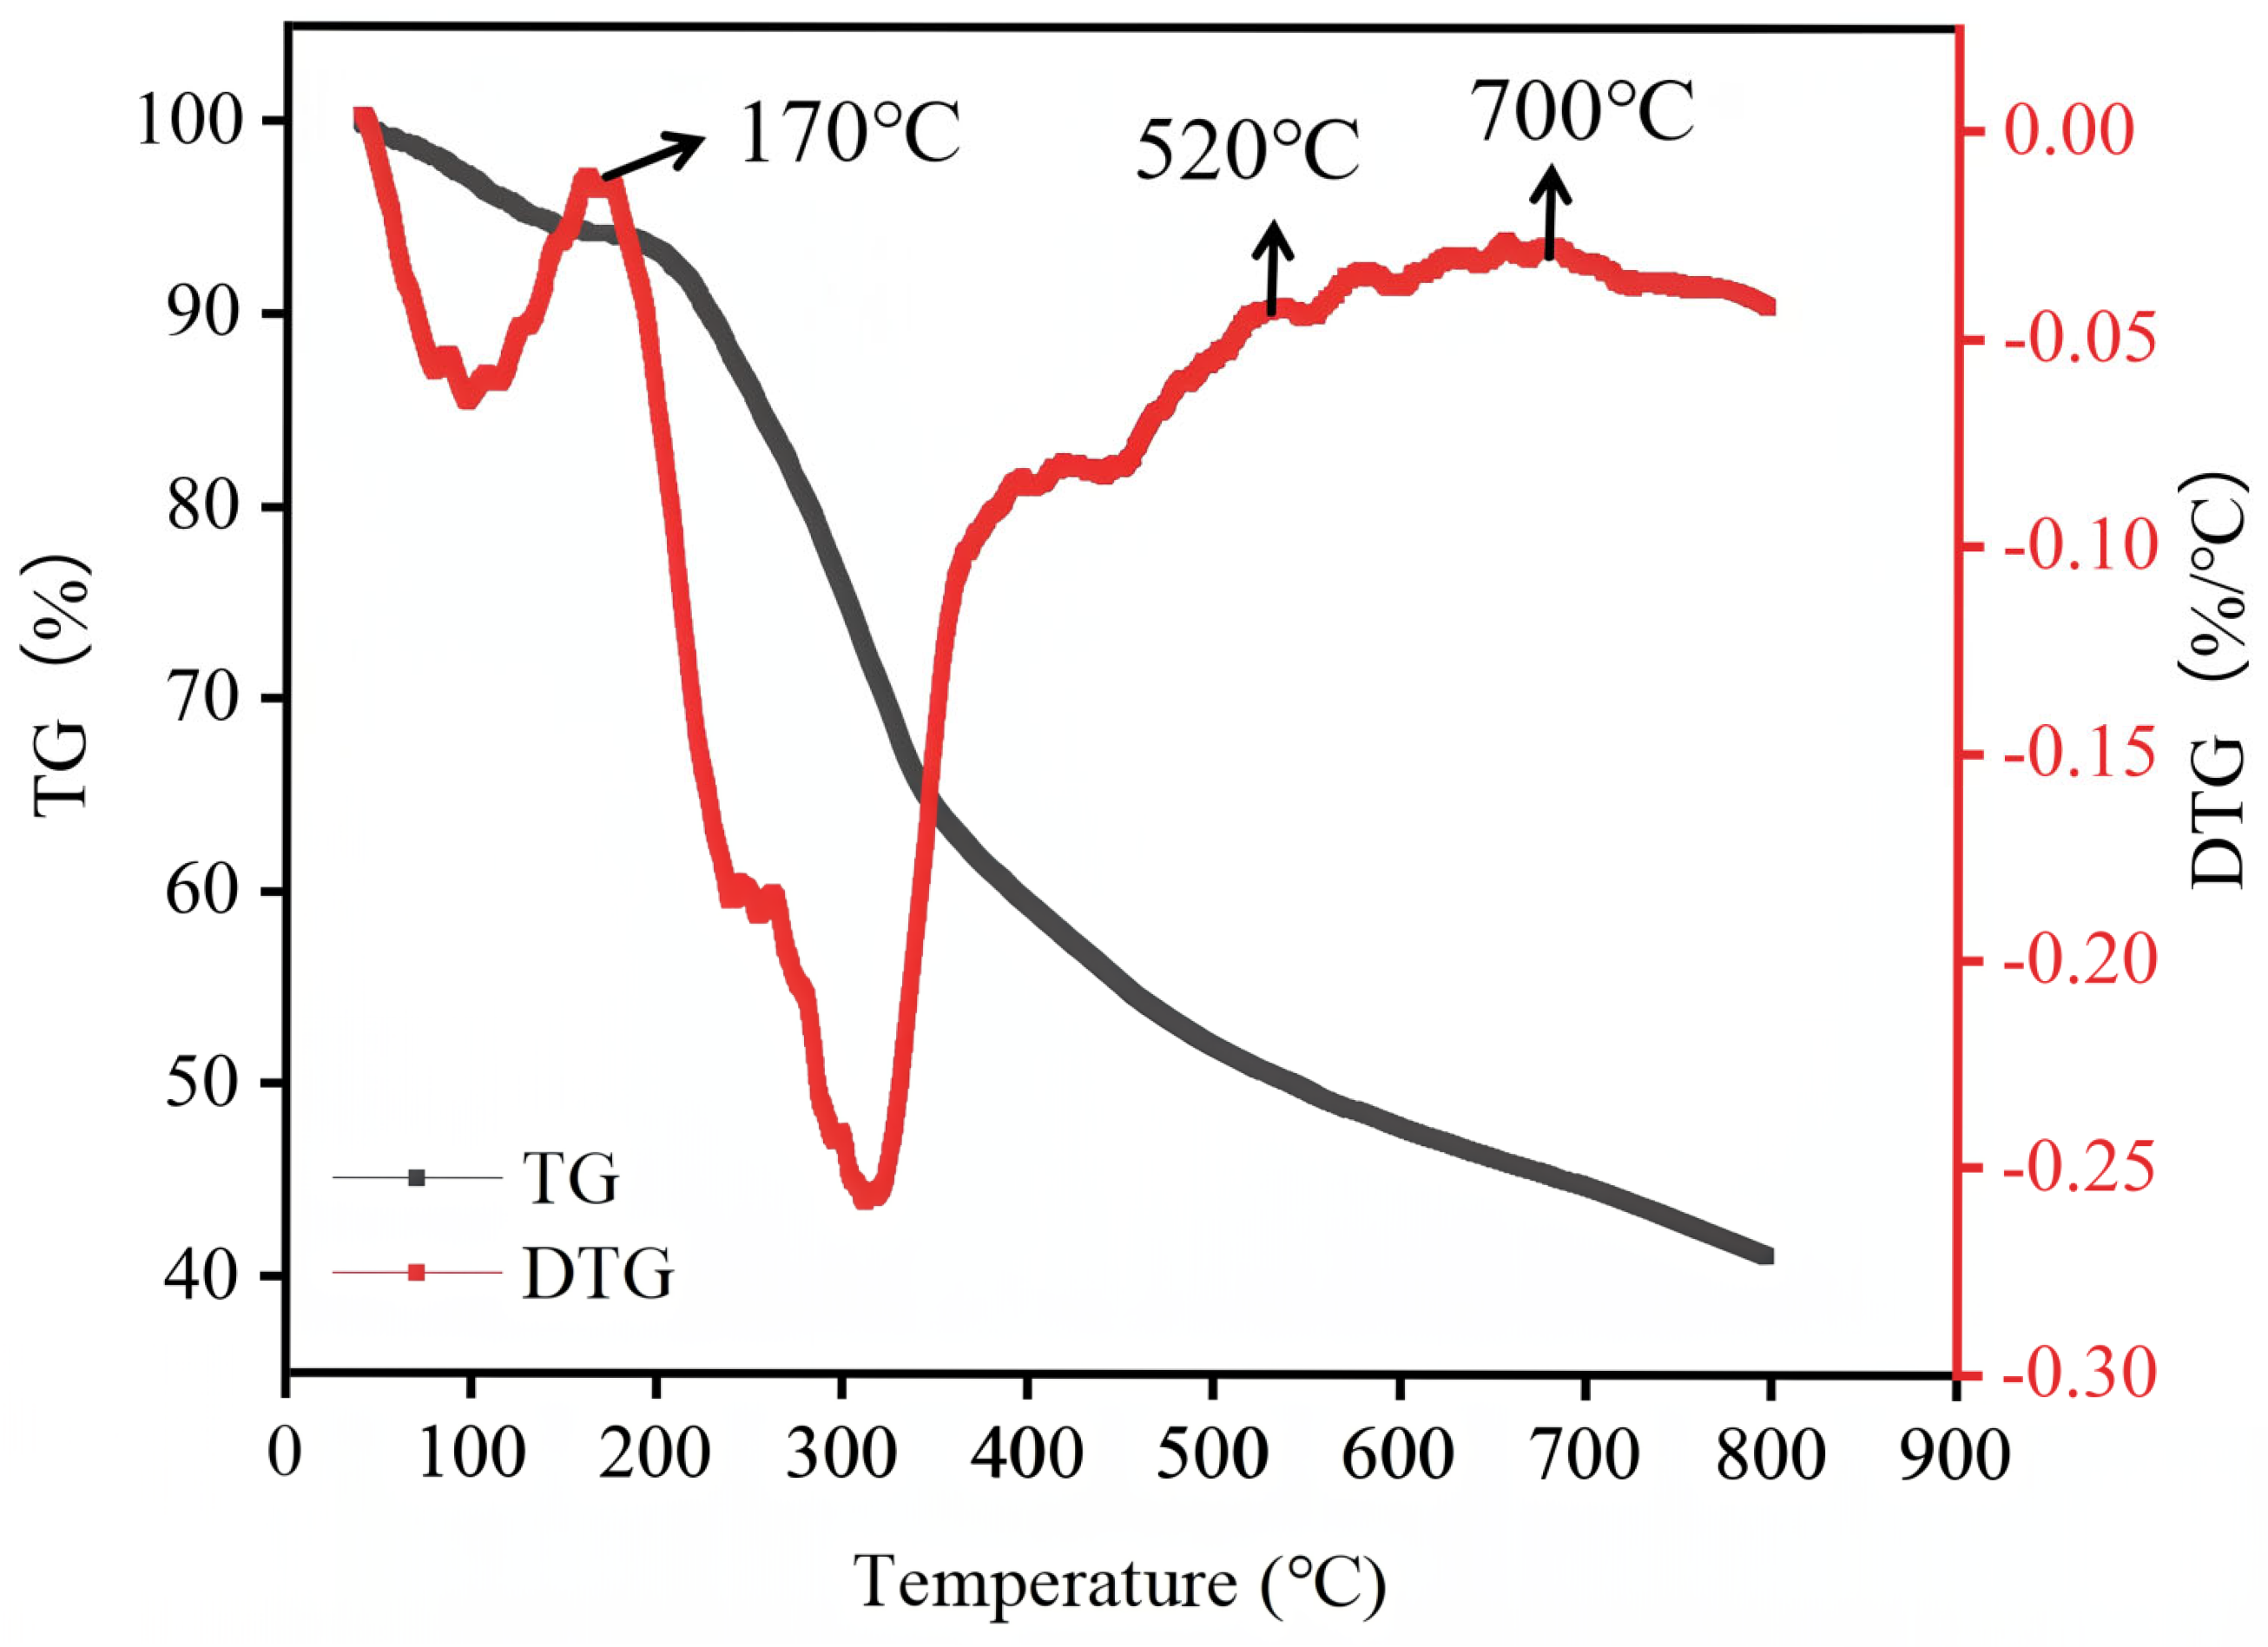
The thermal decomposition behavior of the pretreated tea residue was characterized by thermogravimetric analysis (TGA), as presented in Figure 2. The pyrolysis process of the sample proceeded through three distinct temperature regimes: an initial dehydration phase (0–170 °C), a primary devolatilization stage (170–520 °C), and a high-temperature carbonization region (>520 °C). The first stage (0–170 °C) mainly involves the removal of moisture and weakly bound water, and the weight loss during this stage is relatively small. The most substantial mass loss (~49%) occurred within the 170–520 °C interval. The derivative thermogravimetry (DTG) curve exhibits multiple peaks, indicating the coexistence of several competitive thermal-decomposition pathways. This stage corresponds to the progressive thermal degradation and volatiles evolution from the major biomass constituents. The gradual mass loss observed at temperatures exceeding 520 °C was primarily attributed to the slow carbonization of the residual lignin framework. To achieve more complete decomposition of the biomass organic components, temperatures of 500 °C and above were selected for further exploration of optimal pyrolysis parameters.
Figure 2.
Thermogravimetric analysis of tea residue.
The X-ray fluorescence (XRF) analysis results for the DC and Ni/DC catalysts are presented in Table 1. The DC catalyst primarily consists of CaO (96.70 wt.%), with minor amounts of magnesium and trace quantities of aluminum and iron. In the Ni/DC catalyst, the NiO content was measured at 16.6 wt.%, which exceeds the designed nickel loading of 10 wt.%. This discrepancy likely stems from the inherent limitations of XRF analysis, a surface-sensitive, semi-quantitative technique that can overestimate metal concentrations, as noted in prior studies [22].
Table 1.
XRF analysis of carrier and catalysts.
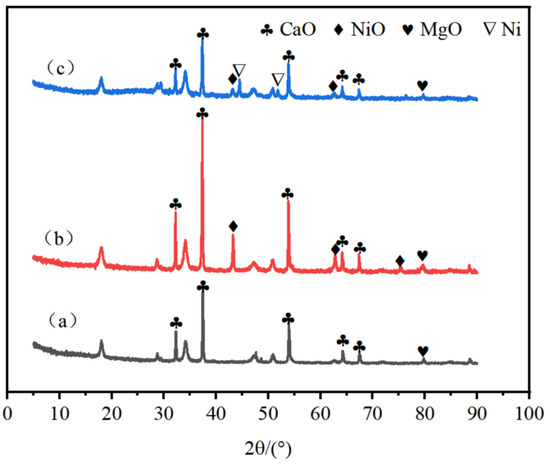
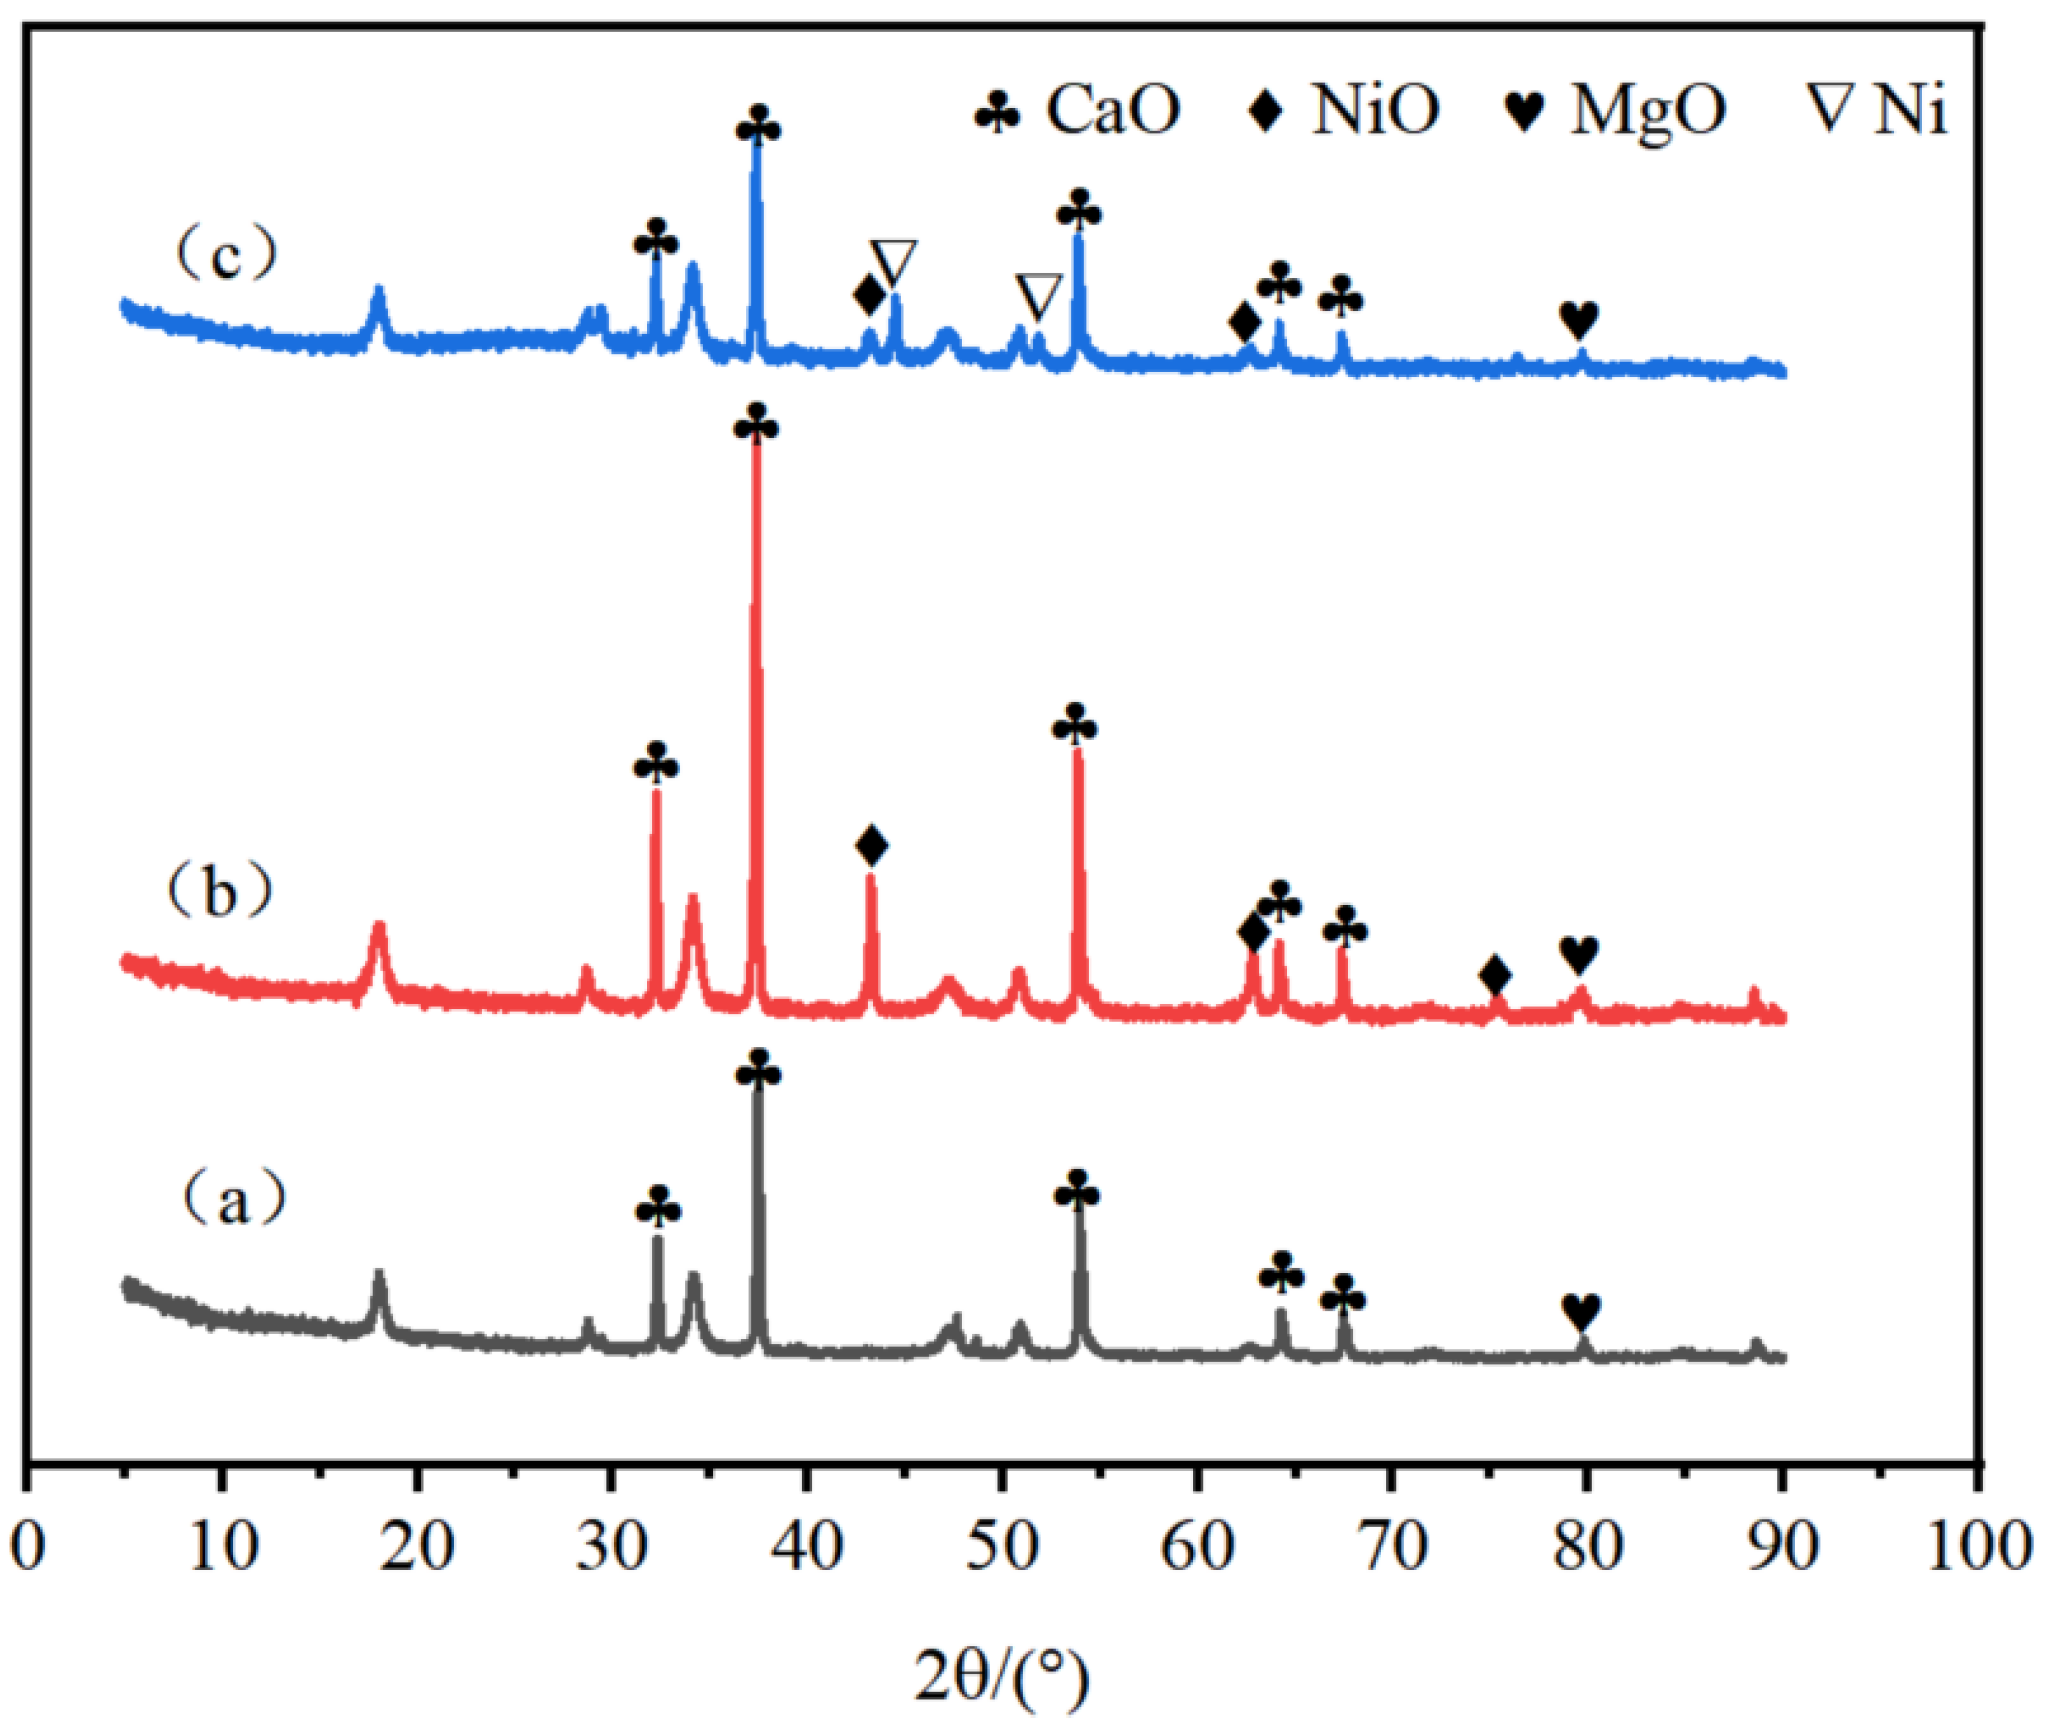
The XRD patterns of DC, Ni/DC catalysts and the mixture of spent Ni/DC catalyst with coke are presented in Figure 3. The results indicate that the primary component of DC is CaO. For the Ni/DC catalyst, characteristic diffraction peaks of NiO are observed at 43.3°, 62.88°, and 75.34°. The spent Ni/DC catalyst, mixed with coke, exhibited new peaks at 44.56° and 51.8°, corresponding to metallic Ni. This indicates the in situ reduction in NiO during pyrolysis, which is critical for enhancing H2 yield, as metallic Ni further catalyzes the decomposition of tar and coke, providing additional syngas for H2 production [23,24].
Figure 3.
XRD patterns of (a) DC, (b) Ni/DC catalyst and (c) Mixture of spent Ni/DC catalyst and coke.
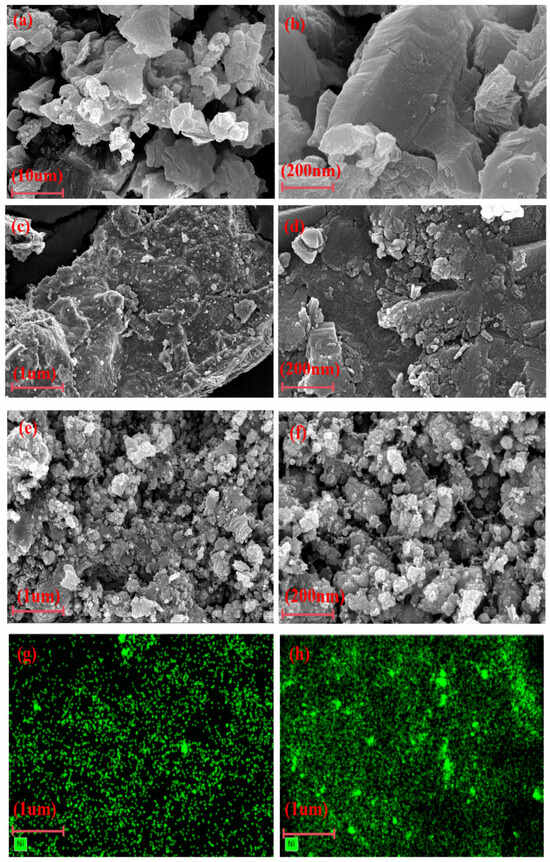
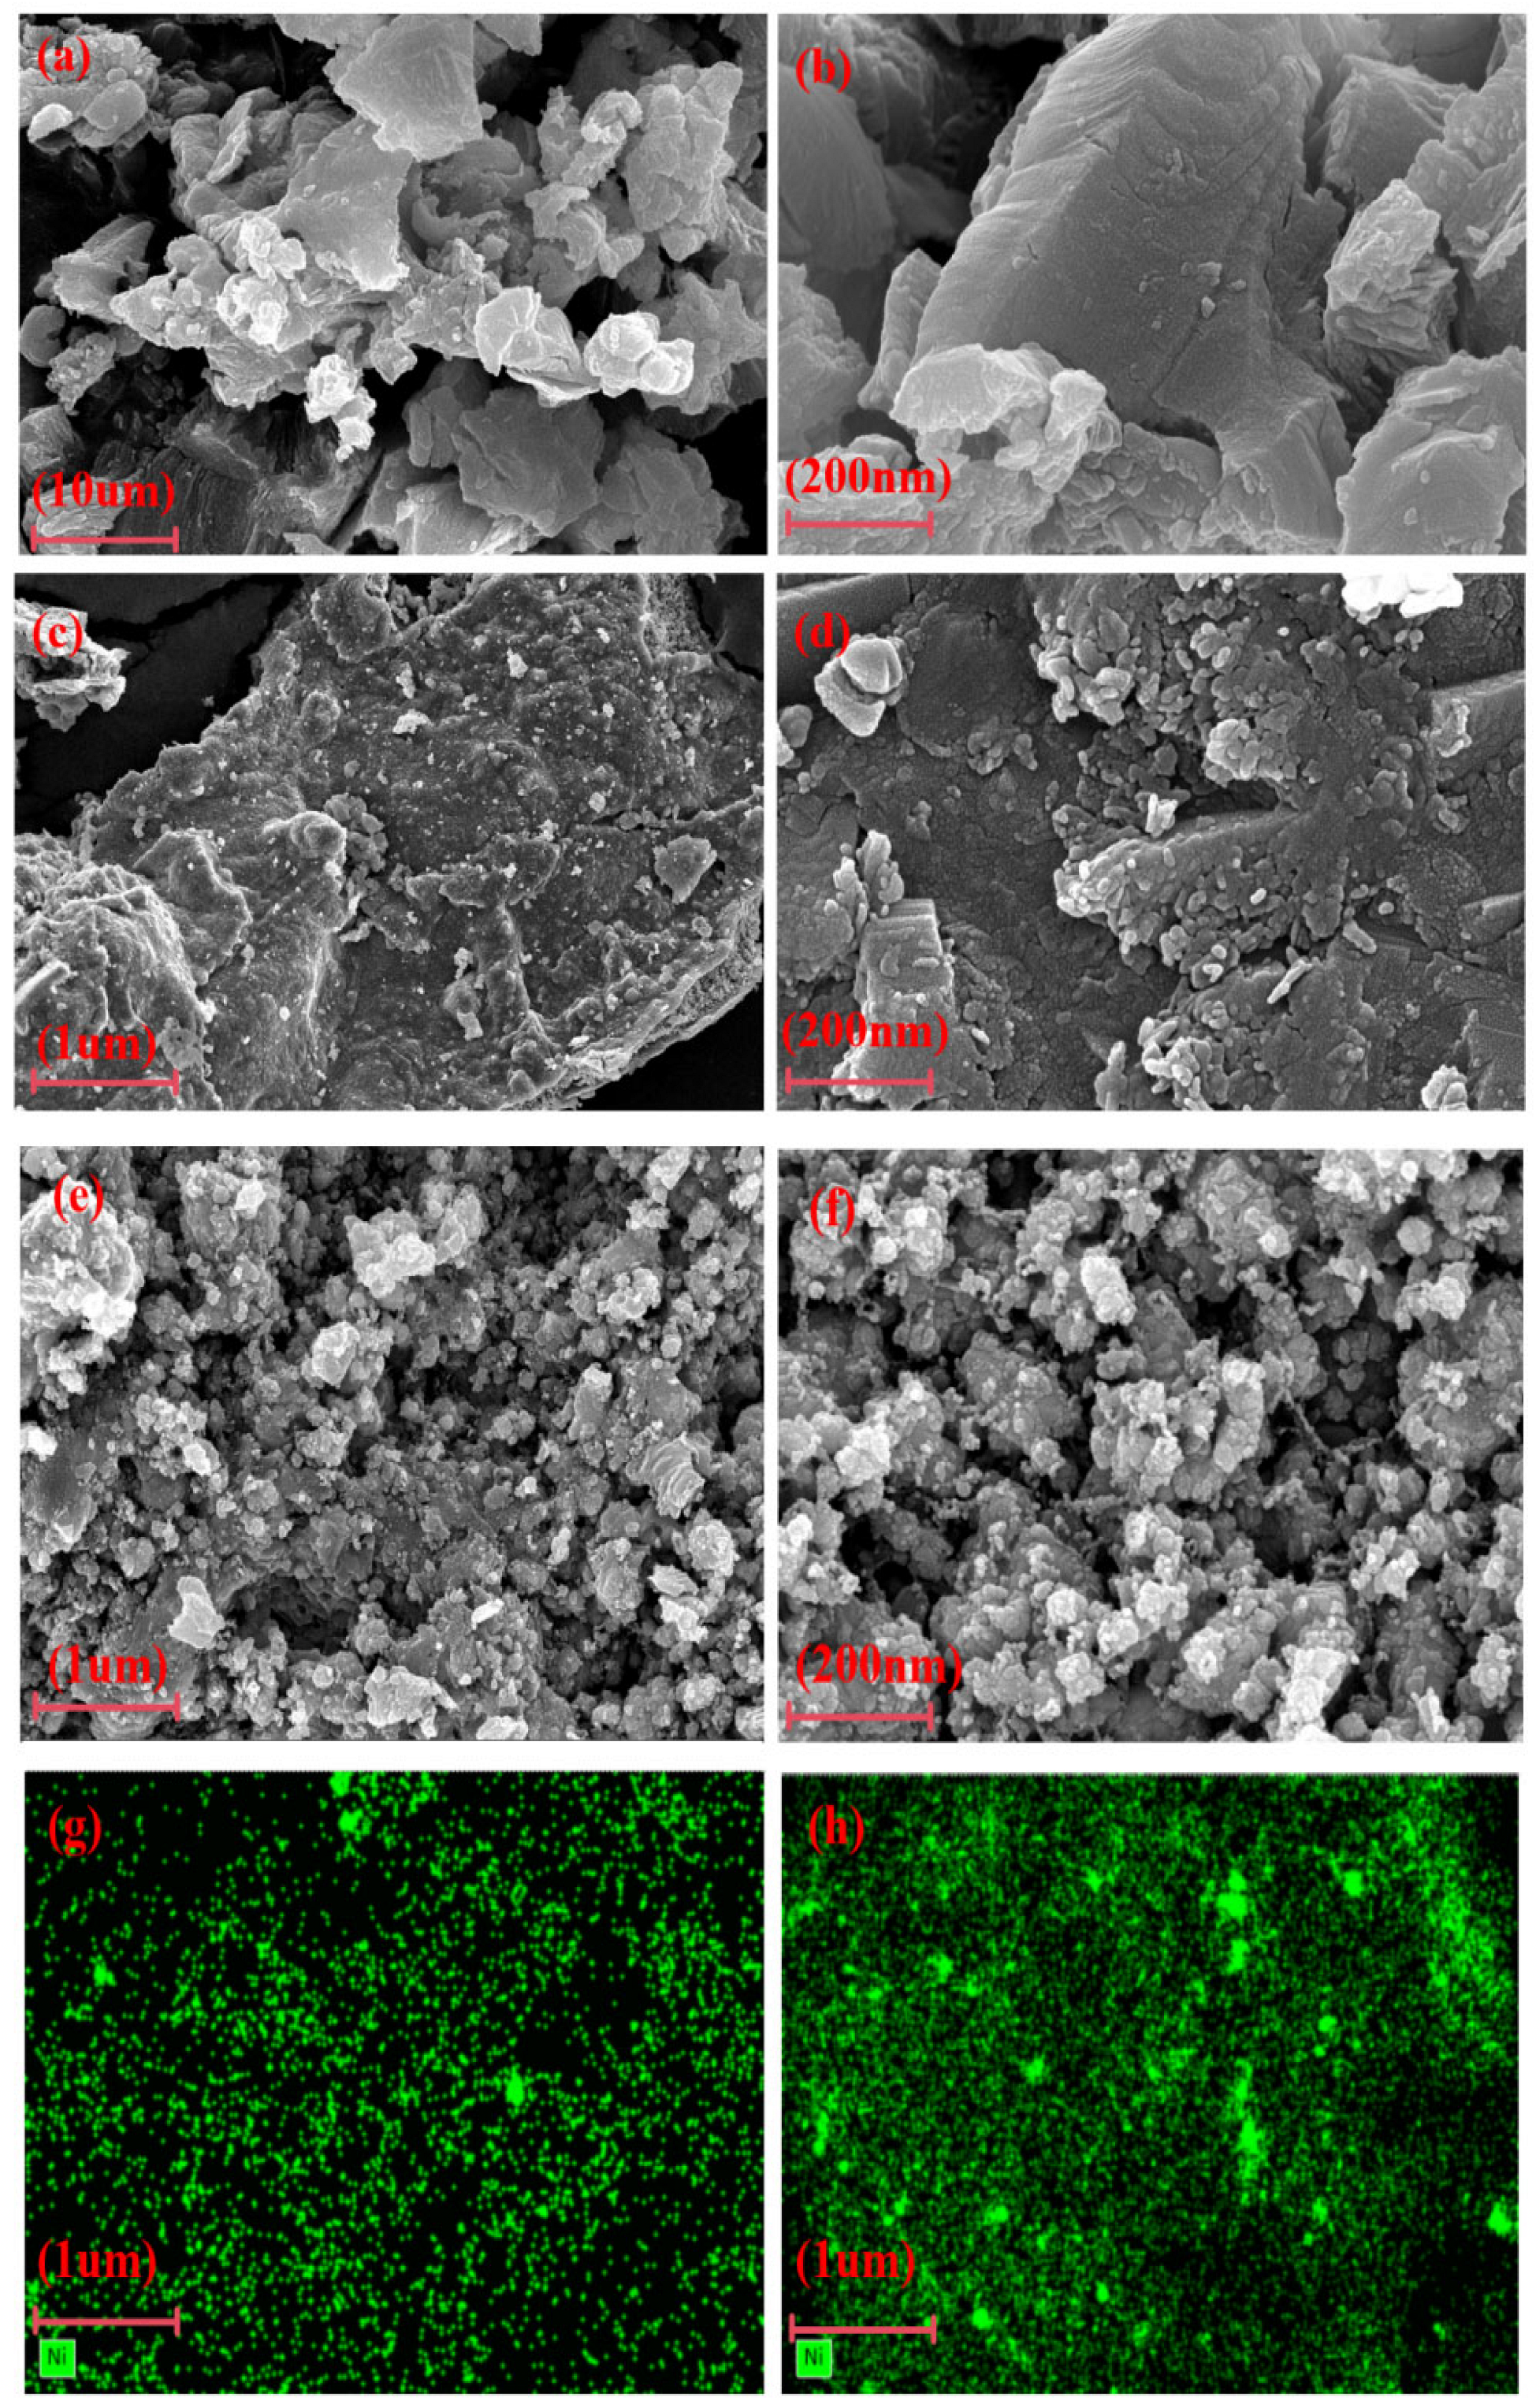
Figure 4 shows the SEM and EDS images of DC, Ni/DC catalyst, and the spent Ni/DC catalyst/coke mixture. It can be seen from Figure 4a,b that the DC primarily exhibit fragmented and angular block-like morphologies. Upon nickel loading, the Ni/DC catalyst surface exhibits a heterogeneous distribution of spherical and flake-like particles of varying dimensions (Figure 4c,d), confirming the successful deposition of nickel species and the formation of a well-defined active phase on the DC support. Notably, this impregnation induces a marked transformation in the catalyst’s surface morphology, characterized by a more intricate pore architecture and enhanced surface roughness. Such structural evolution endows the catalyst with an increased specific surface area and an optimized pore network, which collectively facilitate greater accessibility of nickel active sites and promote the efficient diffusion of reactant molecules toward them. Simultaneously, the refined pore structure accelerates hydrogen product desorption, thereby suppressing undesirable secondary reactions. In contrast, the spent Ni/DC catalyst/coke mixture shows a disordered structure with enhanced granular texture and increased surface fluffiness (Figure 4e,f). These morphological changes are likely attributed to particle agglomeration during the reaction. Furthermore, coke accumulation and enrichment contributed to the non-uniform particle distribution in the mixture. EDS mapping in Figure 4g confirms the uniform dispersion of Ni on the DC surface. In the spent Ni/DC catalyst/coke mixture, however, the Ni distribution shows localized high-concentration regions, indicating Ni particle agglomeration (Figure 4h).
Figure 4.
SEM images of (a,b) DC, (c,d) Ni/DC catalyst, (e,f) Mixture of spent Ni/DC catalyst and coke under different magnification ratios; EDS images of Ni element distribution before and after the use of (g,h) Ni/DC catalyst.
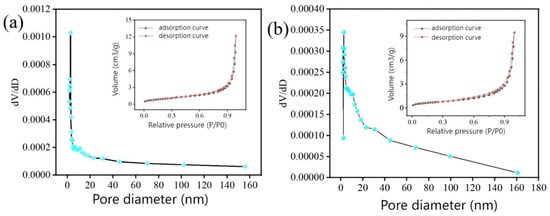
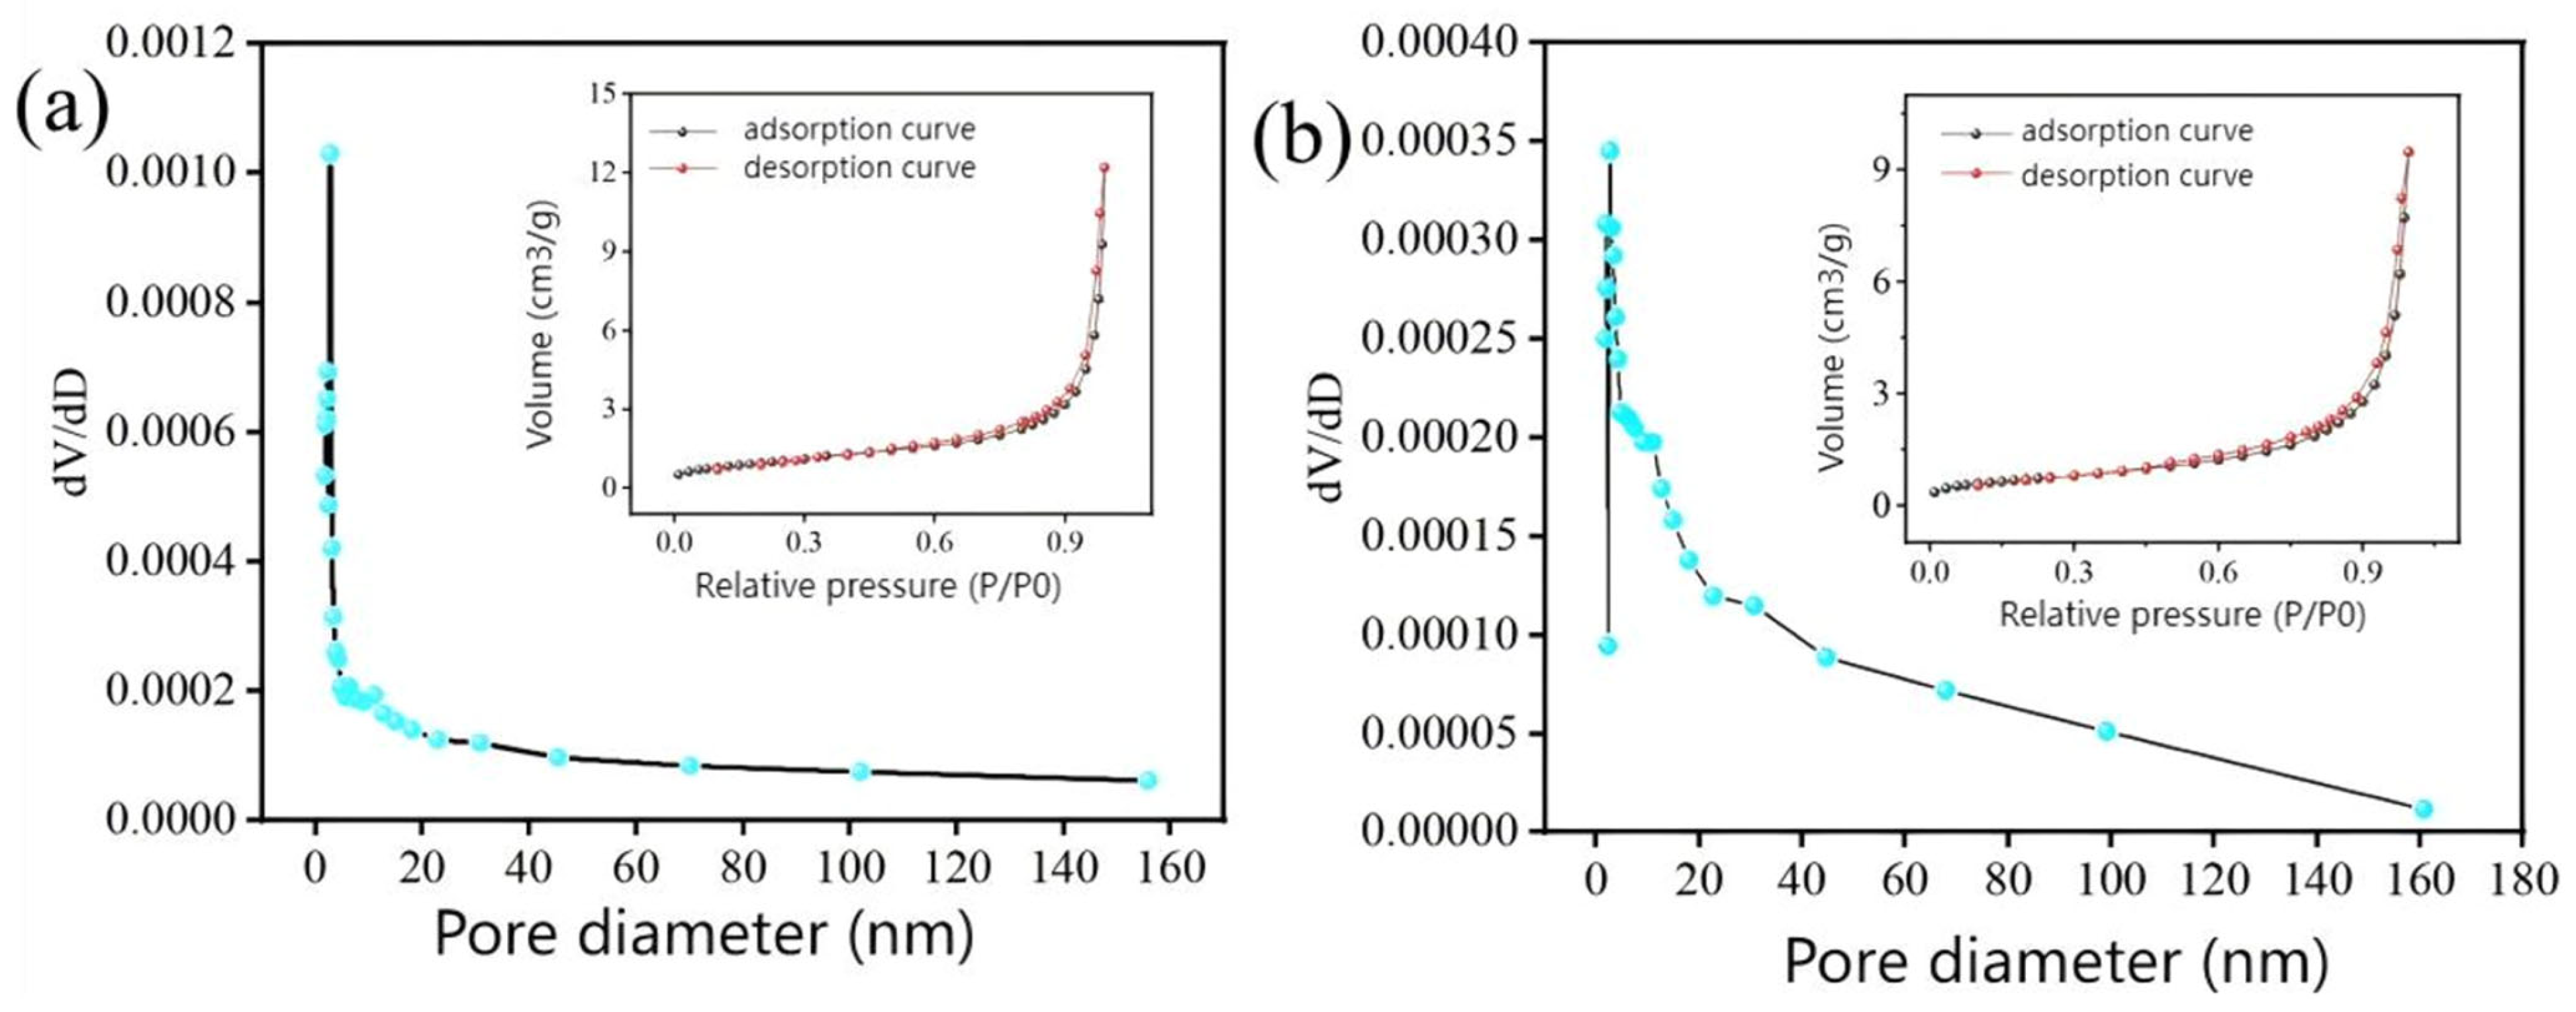
The specific surface area and pore structure of the DC and Ni/DC catalysts were characterized using N2 adsorption–desorption measurements, as shown in Figure 5. The N2 adsorption–desorption isotherms of both the DC and Ni/DC catalysts exhibit hysteresis loops and display typical type IV characteristics, indicating the presence of mesoporous structures. The pore size distributions range from 0 to 160 nm, confirming a combined meso-macroporous architecture. This hierarchical pore structure is favorable for improving contact between biomass and catalyst active sites during pyrolysis, promoting gas diffusion, and offering some resistance to coke deposition [25]. As summarized in Table 2, the BET specific surface area of the Ni/DC catalyst is 3.60 m2 g−1, which is 1.02 m2·g−1 higher than that of the DC carrier (2.58 m2·g−1). This increase suggests that Ni loading effectively increases the specific surface area of the catalyst. Although the BET specific surface area of the Ni/DC catalyst is relatively low, it still demonstrates excellent catalytic activity. The key to this phenomenon lies in the successful construction of highly dispersed active sites, along with a hierarchical pore structure that ensures their efficient utilization during the reaction process.
Figure 5.
N2 adsorption–desorption isotherms and pore size distribution of DC (a) and Ni/DC catalyst (b).
Table 2.
Specific surface area and pore structure parameters of DC and Ni/DC catalysts.
3.2. Pyrolysis of Tea Residues
The primary reactions governing the formation of gaseous products during biomass pyrolysis can be represented by the following equations (Equations (1)–(8)):
Biomass → Carbon + Tar + Gas (H2, CO, CO2, CH4)
Cracking of tar: Tar → Gas (H2, CO, CO2, CH4, others)
Reduction reaction of coke in pyrolysis gas: C + CO2 → 2CO
Water-gas-shift reaction: H2 + CO2 → CO + H2O
Methane steam reforming reaction: CH4 + H2O → CO + 3H2
Dry reforming of methane: CH4 + CO2 → 2CO + 2H2
Water-gas reaction: CO + H2O → CO2 + H2
Methanation reaction: C + 2H2 → CH4
The pyrolysis of tea residue over the 10 wt.% Ni/CaO catalyst involves a synergistic process in which CaO serves as a CO2 sorbent while Ni acts as the active site for reforming reactions. Initially, biomass pyrolysis generates volatile compounds (e.g., CH4, CO) along with CO2. The CaO component chemically adsorbs CO2 via carbonation (CaO + CO2 → CaCO3), shifting the equilibrium toward water-gas (CO + H2O → CO2 + H2) and methane steam reforming (CH4 + H2O → CO + 3H2) reactions. Simultaneously, Ni sites facilitate C–C and C–H bond cleavage in hydrocarbons and oxygenates, promoting dehydrogenation and reforming pathways. The removal of CO2 by CaO reduces its partial pressure, further driving H2 production through Le Chatelier’s principle. The dual function of CO2 capture by CaO and catalytic reforming by Ni explains the significantly higher H2 yield compared to non-sorbent or mono-functional catalysts. Based on the catalyst’s inherent performance, the influence of various factors on H2 yield was investigated.
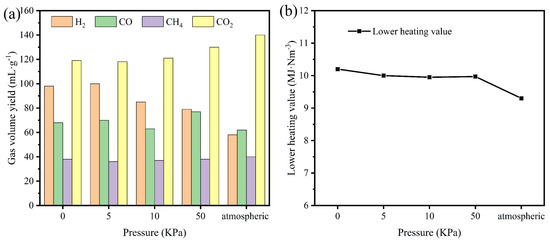
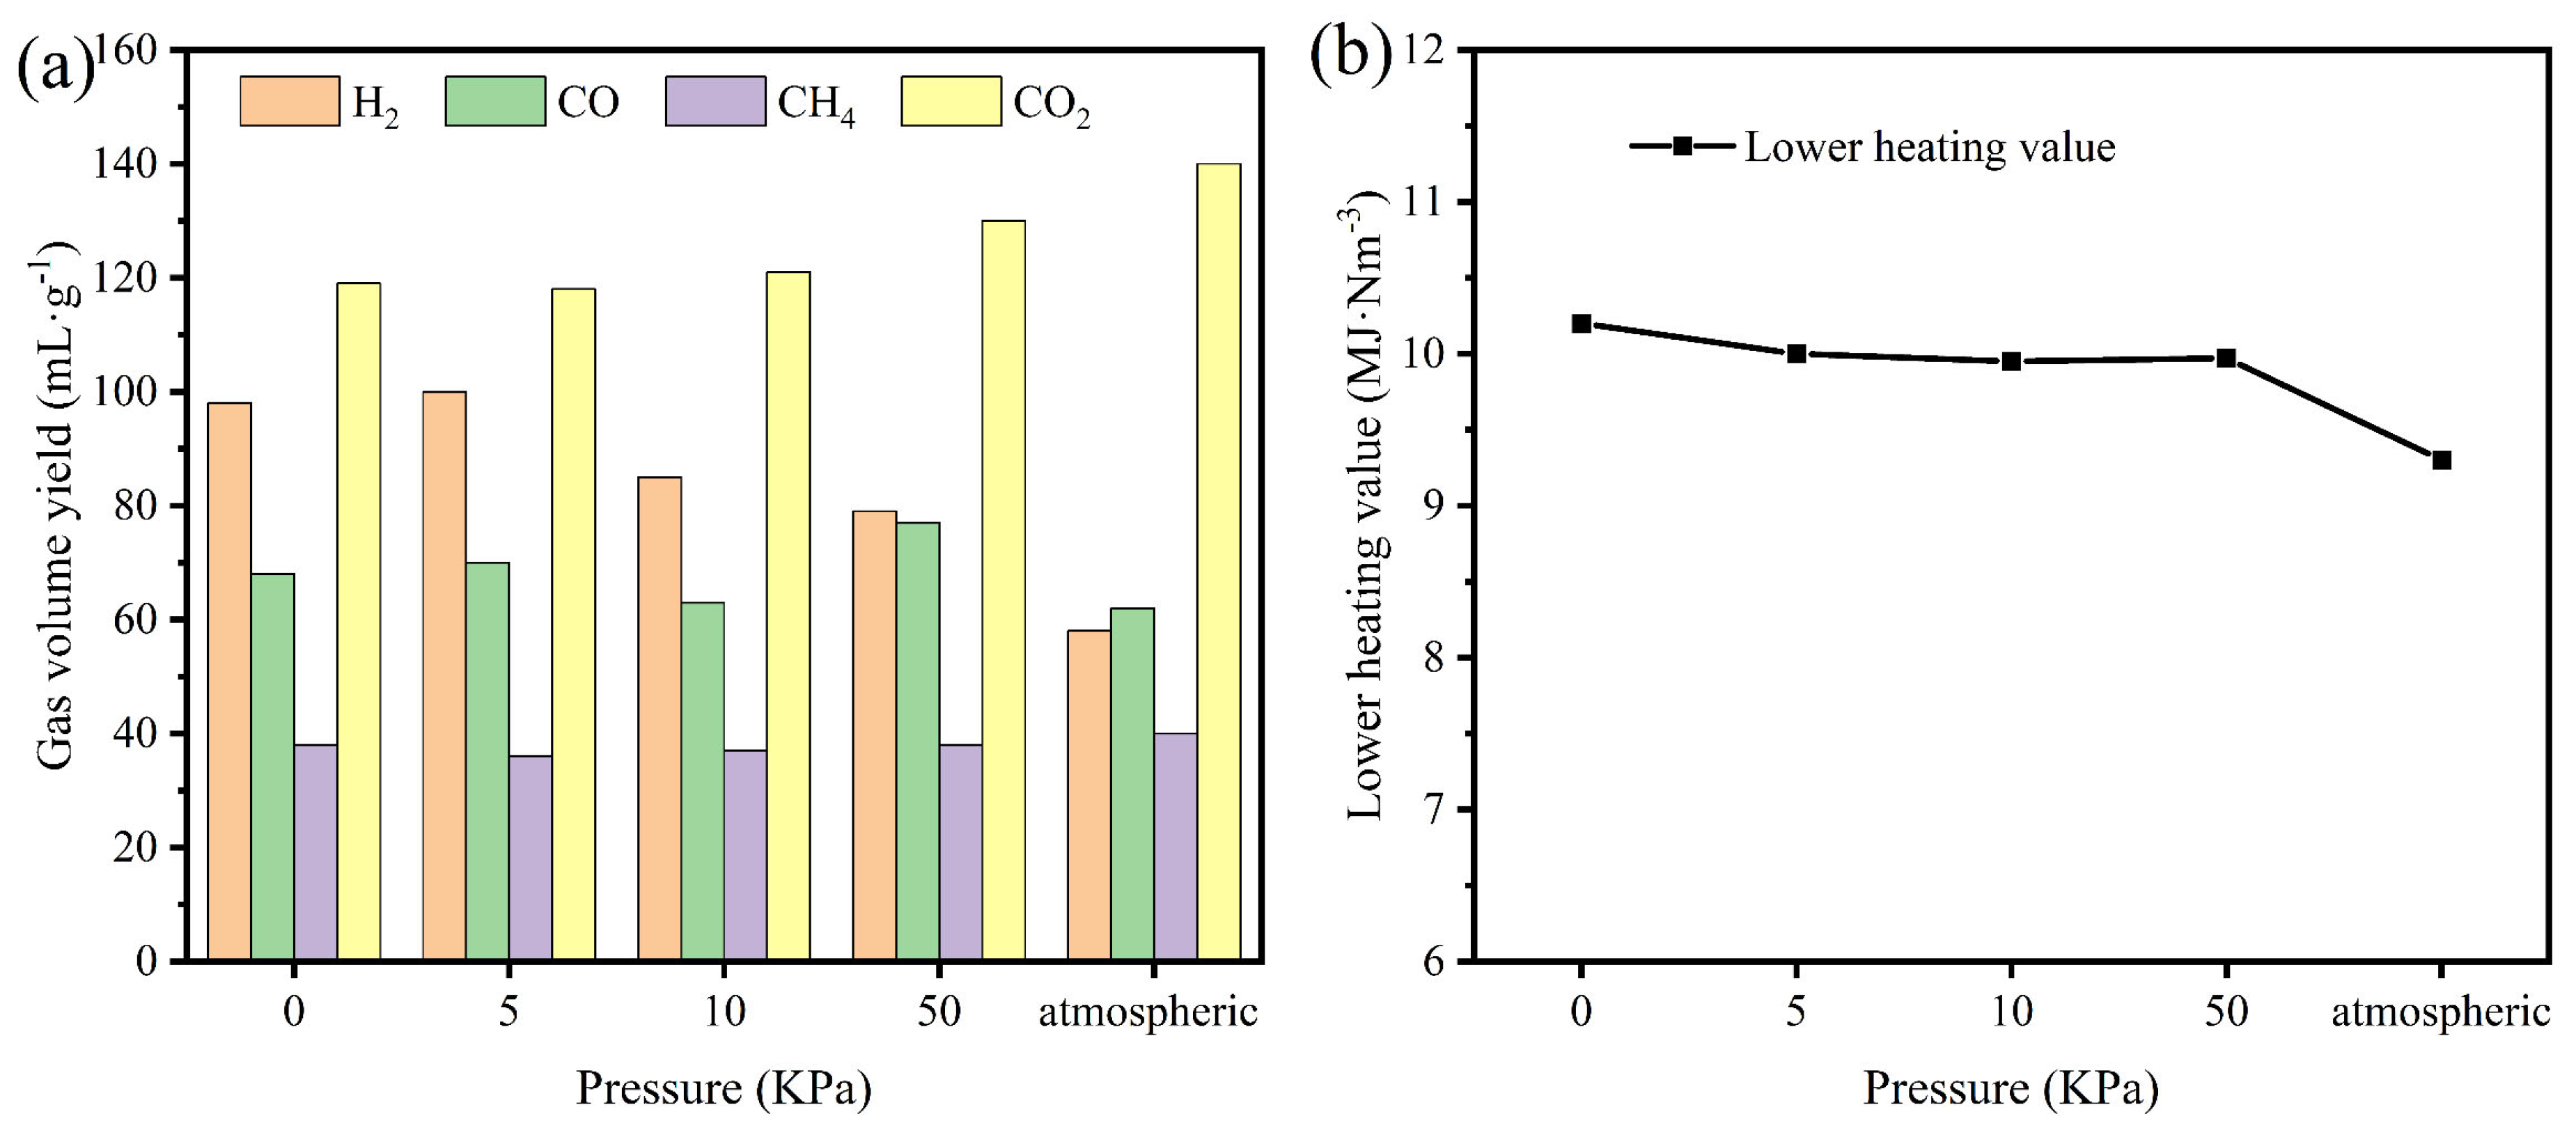
Figure 6 illustrates the influence of initial pressure on the pyrolysis performance of tea residue. The hydrogen yield was markedly higher under vacuum pyrolysis than under atmospheric pressure conditions. As shown in Figure 6a, the yield reached a maximum at 5 kPa, yet no statistically significant difference was observed compared with 0 kPa. The lower heating value (LHV) reflects the heat available during fuel combustion; a higher LHV indicates greater effective energy per unit volume of pyrolysis gas and improved combustion efficiency. In Figure 6b, the LHV (Appendix A) of pyrolysis gas peaked at 0 kPa but did not differ significantly at 5 kPa. It should be noted that pressure control at 0 kPa relied on digital vacuum gauge readings, resulting in unavoidable variations in the actual pressure across experimental replicates. Moreover, maintaining a high vacuum (0 kPa) not only imposes substantial technical challenges but also increases production costs. Therefore, from a thermodynamic point of view, an initial pyrolysis pressure of 5 kPa was selected for subsequent vacuum pyrolysis catalytic experiments.
Figure 6.
Vacuum pyrolysis catalysis of tea residue under different negative gauge pressures: (a) gas volume yields of H2, CO, CH4 and CO2; (b) Low heating value diagram of pyrolysis gas.
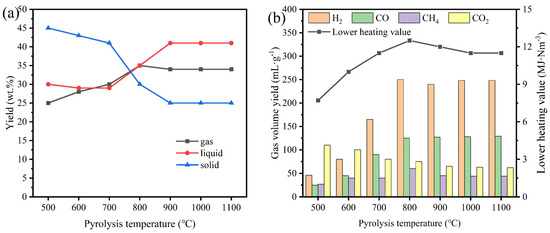
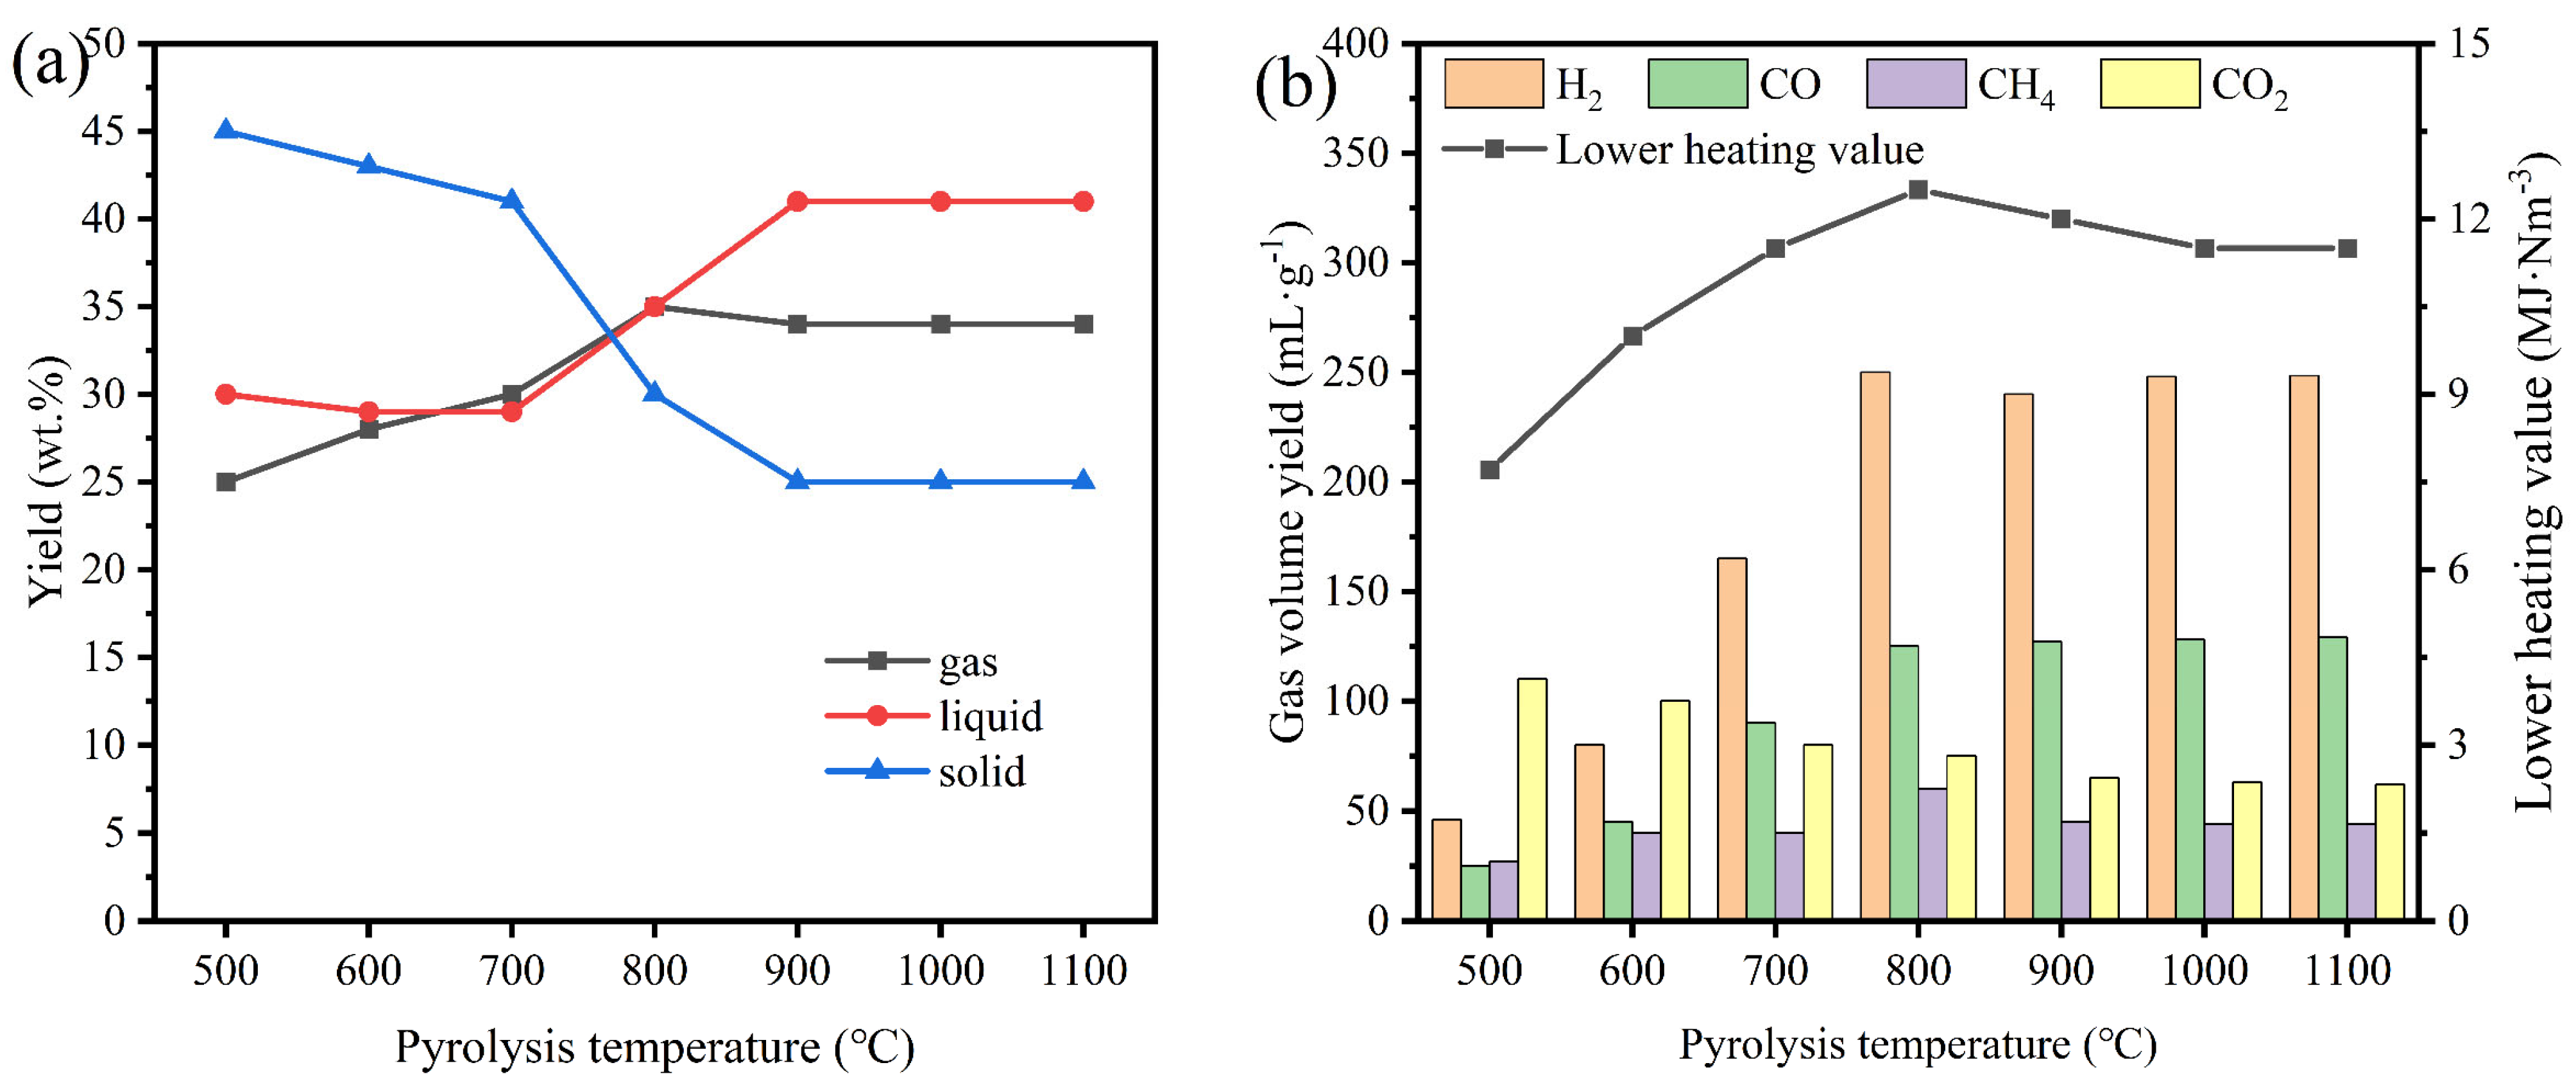
Temperature is a pivotal parameter in the vacuum pyrolysis-catalysis of tea residue biomass, exerting a profound influence on both the distribution of pyrolysis products and the activity of the catalyst [26,27]. Figure 7 presents the influence of pyrolysis temperature on the conversion of tea residue. As depicted in Figure 7a, the yield of solid residue declines consistently as temperature increases. Correspondingly, the gas yield increased from 26.10 wt.% at 500 °C to 36.83 wt.% at 800 °C, attributed to the progressive cracking of heavy components within the biomass at higher temperatures. The yield of liquid products, conversely, follows a characteristic trend: an initial decrease followed by an increase. This behavior aligns with findings by Fan et al. [28], who reported that a vacuum system significantly influences bio-oil production by facilitating the rapid removal of volatiles. Under the high-temperature vacuum conditions employed here, these volatiles primarily form pyrolytic oil and gaseous products. The continuous increase in gas yield across the entire temperature range (500–800 °C) suggests that the catalyst effectively promotes the secondary cracking of tar and the reforming of light hydrocarbons, thereby sustaining gaseous products formation [29,30].
Figure 7.
At different pyrolysis temperatures: (a) three-phase product yields; (b) yields of pyrolysis gas components and their lower heating value.
As shown in Figure 7b, the volumetric yield of H2 rises markedly from 45.18 mL·g−1 at 500 °C to 249.29 mL·g−1 at 800 °C. A further increase in temperature to 900 °C, however, leads to a slight reduction to 241.02 mL·g−1. This decrease is likely due to the intensification of the water-gas shift reaction (Equation (4)) at elevated temperatures, which consumes hydrogen. Meanwhile, the LHV of the total gas product shows a positive correlation with temperature, reaching a maximum of 12.45 MJ·Nm−3 at 800 °C. Consequently, 800 °C was identified as the optimal pyrolysis temperature for subsequent experiments.
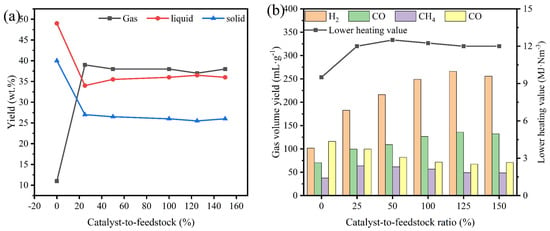
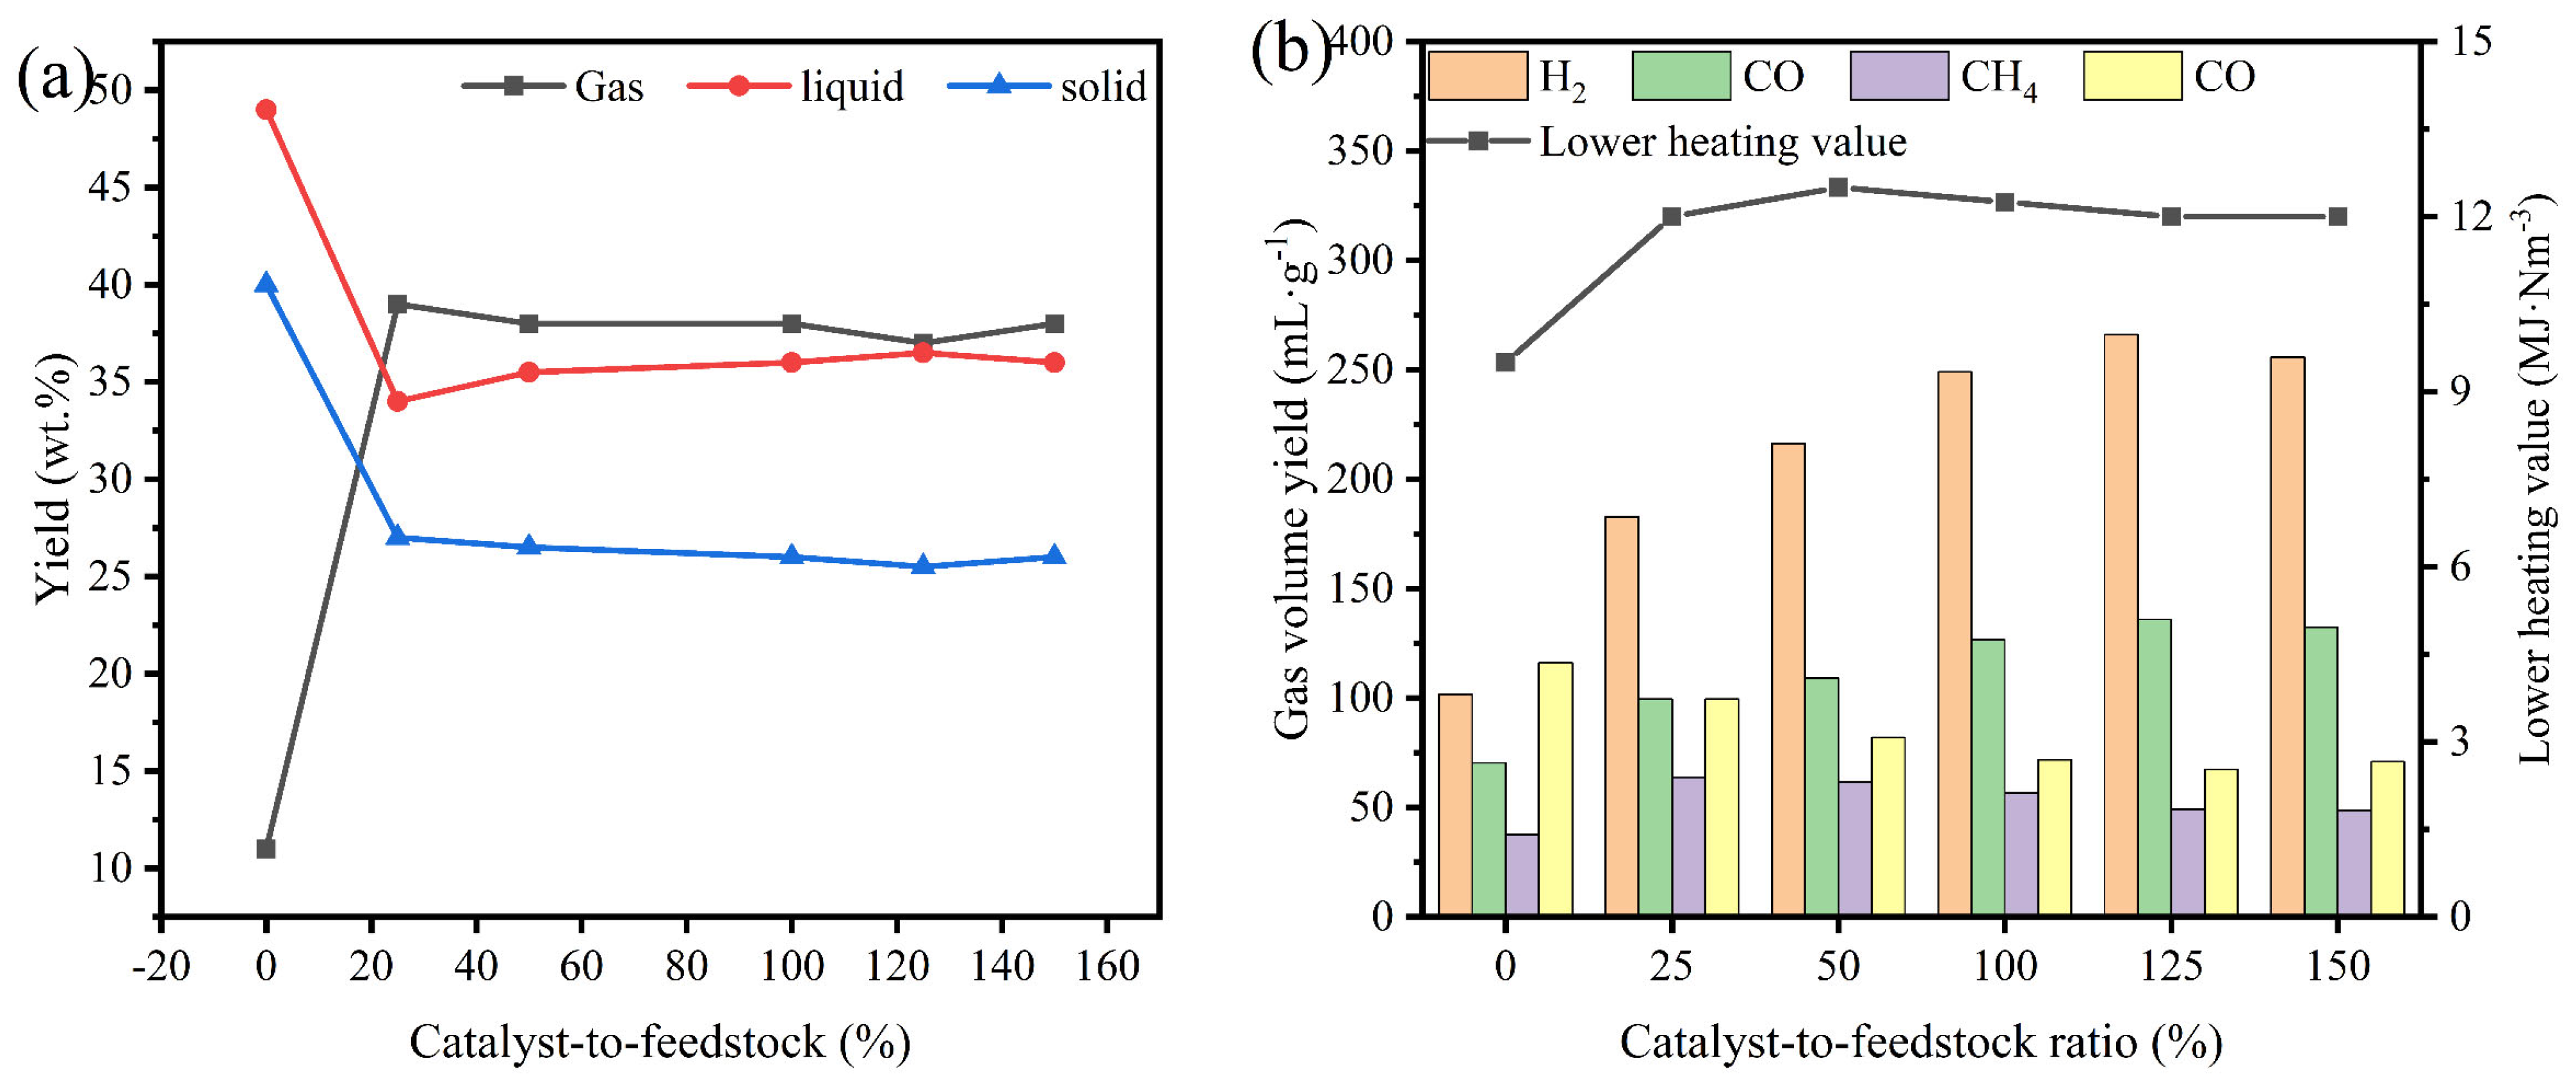
Figure 8 illustrates the effect of the catalyst-to-feedstock ratio on the pyrolysis performance of tea residue. The Ni/DC catalyst notably enhanced both the total gas yield and hydrogen production. As shown in Figure 8a, the catalyst significantly reduced solid and liquid yields while increasing gas yield, indicating its preferential promotion of gaseous product formation during vacuum pyrolysis-catalysis. Figure 8b shows that total gas production increases with catalyst usage over a 0–125% range. Specifically, H2 and CO yields rose substantially, whereas CH4 and CO2 yields generally decreased with higher catalyst usage. This behavior can be attributed to the reactions described in Equations (5)–(7). However, at a catalyst-to-feedstock ratio of 150%, both total gas yield and hydrogen production declined, likely due to catalyst saturation and direct contact between the catalyst and tea residues. During catalytic pyrolysis, tars are deposited on the catalyst surface and within its pores, resulting in pore blockage [31] and consequent degradation of catalytic performance. Based on these observations, a catalyst-to-feedstock ratio of 125% was selected as the optimal condition for subsequent experiments.
Figure 8.
At different catalyst-to-feedstock ratios: (a) three-phase product yields; (b) yields of pyrolysis gas components and their lower heating value.
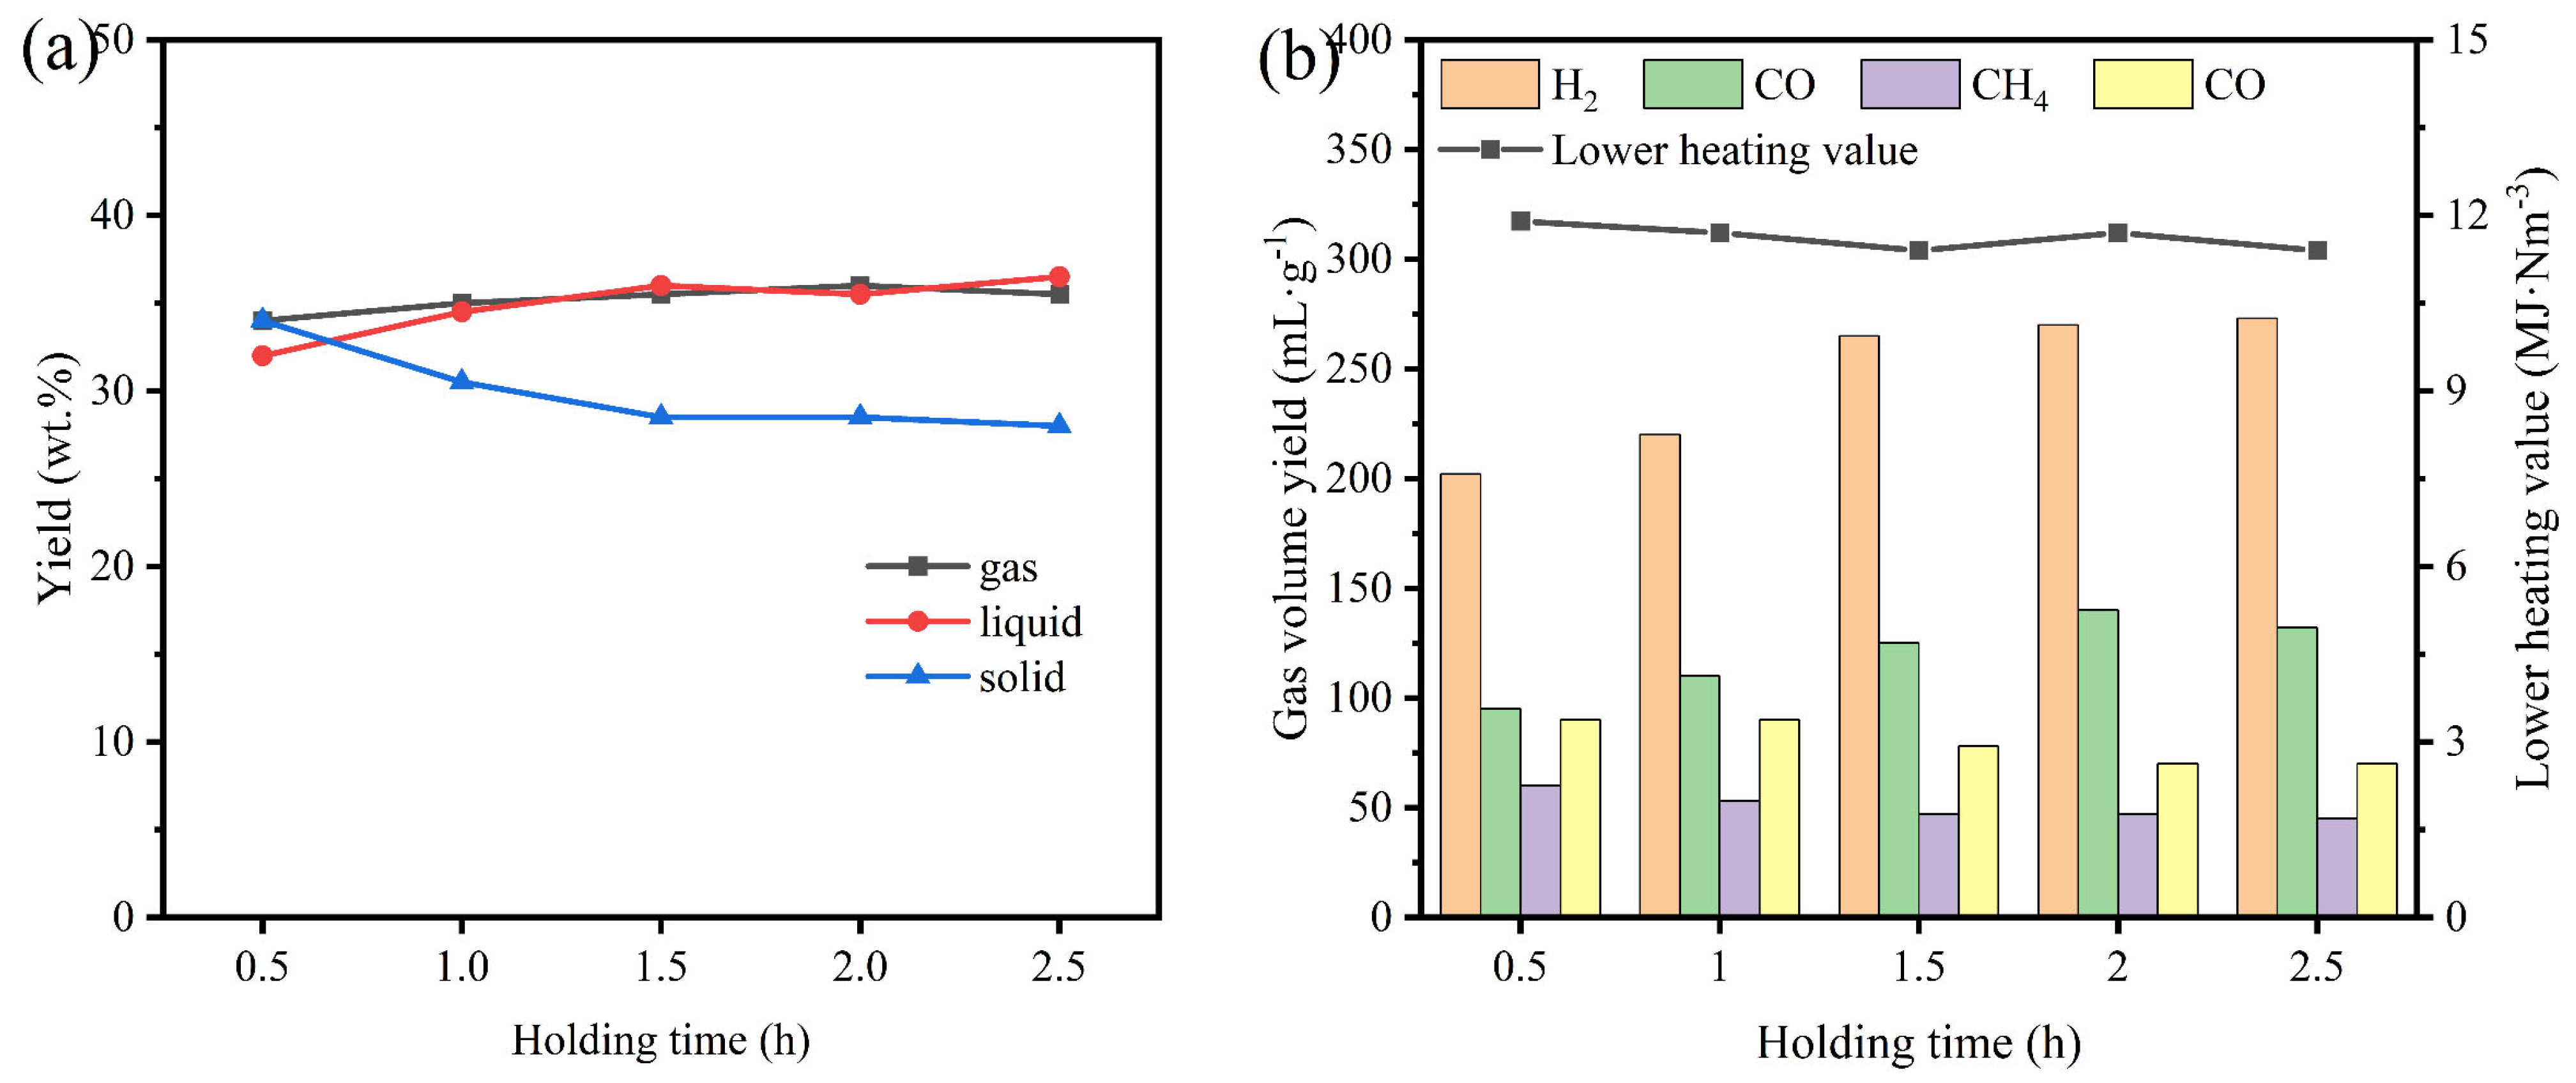
As shown in Figure 9, the yields of three-phase products exhibited limited dependence on holding time. Extending the holding duration from 0.5 h to 2.5 h increased the total gas yield from 437.80 mL·g−1 to 530.70 mL·g−1, primarily due to enhanced H2 and CO production, accompanied by a gradual decrease in CH4 and CO2 yields. This trend can be attributed to the catalytic role of biochar, which promotes reactions (3) and (7) toward CO formation while allowing reactions (5) and (6) to proceed, thereby driving a steady rise in H2 and CO yields. Notably, the increase in gas yield plateaued beyond 2 h, with only marginal gains observed from 2 h to 2.5 h. Meanwhile, the LHV of the gas products remained largely stable across the tested range, indicating that prolonged holding time has a relatively limited influence on the overall pyrolysis product distribution. Considering both process efficiency and energy input, a holding time of 2 h was selected for subsequent experiments, as it represents a balanced point at which gas yield approaches the near-maximum while avoiding unnecessary prolongation of reaction time.
Figure 9.
At different holding times: (a) three-phase product yields; (b) yields of pyrolysis gas components and their lower heating value.
4. Response Surface Methodology
Response surface methodology (RSM) was implemented using Design-Expert 13 software, employing a three-factor, three-level Box–Behnken design [32] (Table 3). The independent variables selected were pyrolysis temperature (A), catalyst-to-feedstock ratio (B), and holding time (C), with the volumetric yield of H2 designated as the response variable (Y). The experimental ranges for these variables are detailed in Table 2. Based on the RSM framework, a total of 17 experimental runs were designed (Table A4), and a well-fitted quadratic polynomial model (9) was adopted.
Y = +26.73 + 37.72*A + 6.96*B + 8.42*C − 0.8475*AB + 2.73*AC − 159*B − 40.52*A2 − 11.26*B2 − 2.85*C2
Table 3.
Independent variables and their levels.
Model (a) demonstrates good statistical significance, while the coefficients of the interaction terms also reflect the physical mechanisms underlying the interactions among variables. The negative coefficient of the interaction term AB (temperature and catalyst-to-feedstock ratio) indicates that at higher temperatures, an excessively high catalyst ratio may lead to rapid deactivation of active sites or coverage by carbon deposits, thereby inhibiting H2 generation. The positive coefficient of the interaction term AC (temperature and holding time) suggests that at appropriate pyrolysis temperatures, extending the holding time appropriately facilitates the secondary cracking of tar and the thorough progression of carbon-steam reactions, thereby enhancing H2 yield. The negative coefficient of the interaction term BC (catalyst-to-feedstock ratio and holding time) implies that at higher catalyst ratios, prolonging the holding time has a limited promoting effect on H2 generation, which may be related to the activity decay of the catalyst during prolonged reactions. These interactions further illustrate that temperature, catalyst ratio, and holding time do not independently influence H2 yield but collectively regulate the reaction pathways and product distribution through synergistic or antagonistic mechanisms.
Significance testing was performed on model (a) (Table A5 and Table A6), confirming its high reliability and accuracy. The strong agreement between the predicted results from the software and the experimental data (Figure A1) further validates the model’s suitability for analyzing the volumetric yield of H2 produced via pyrolysis.
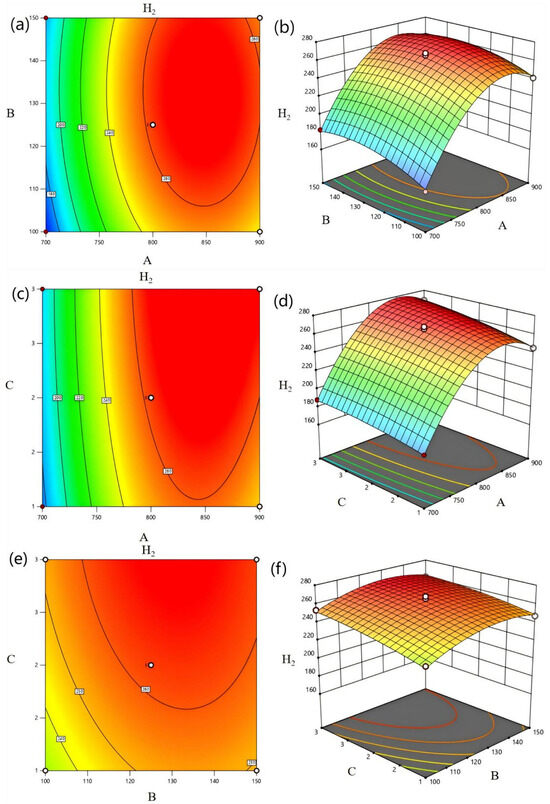
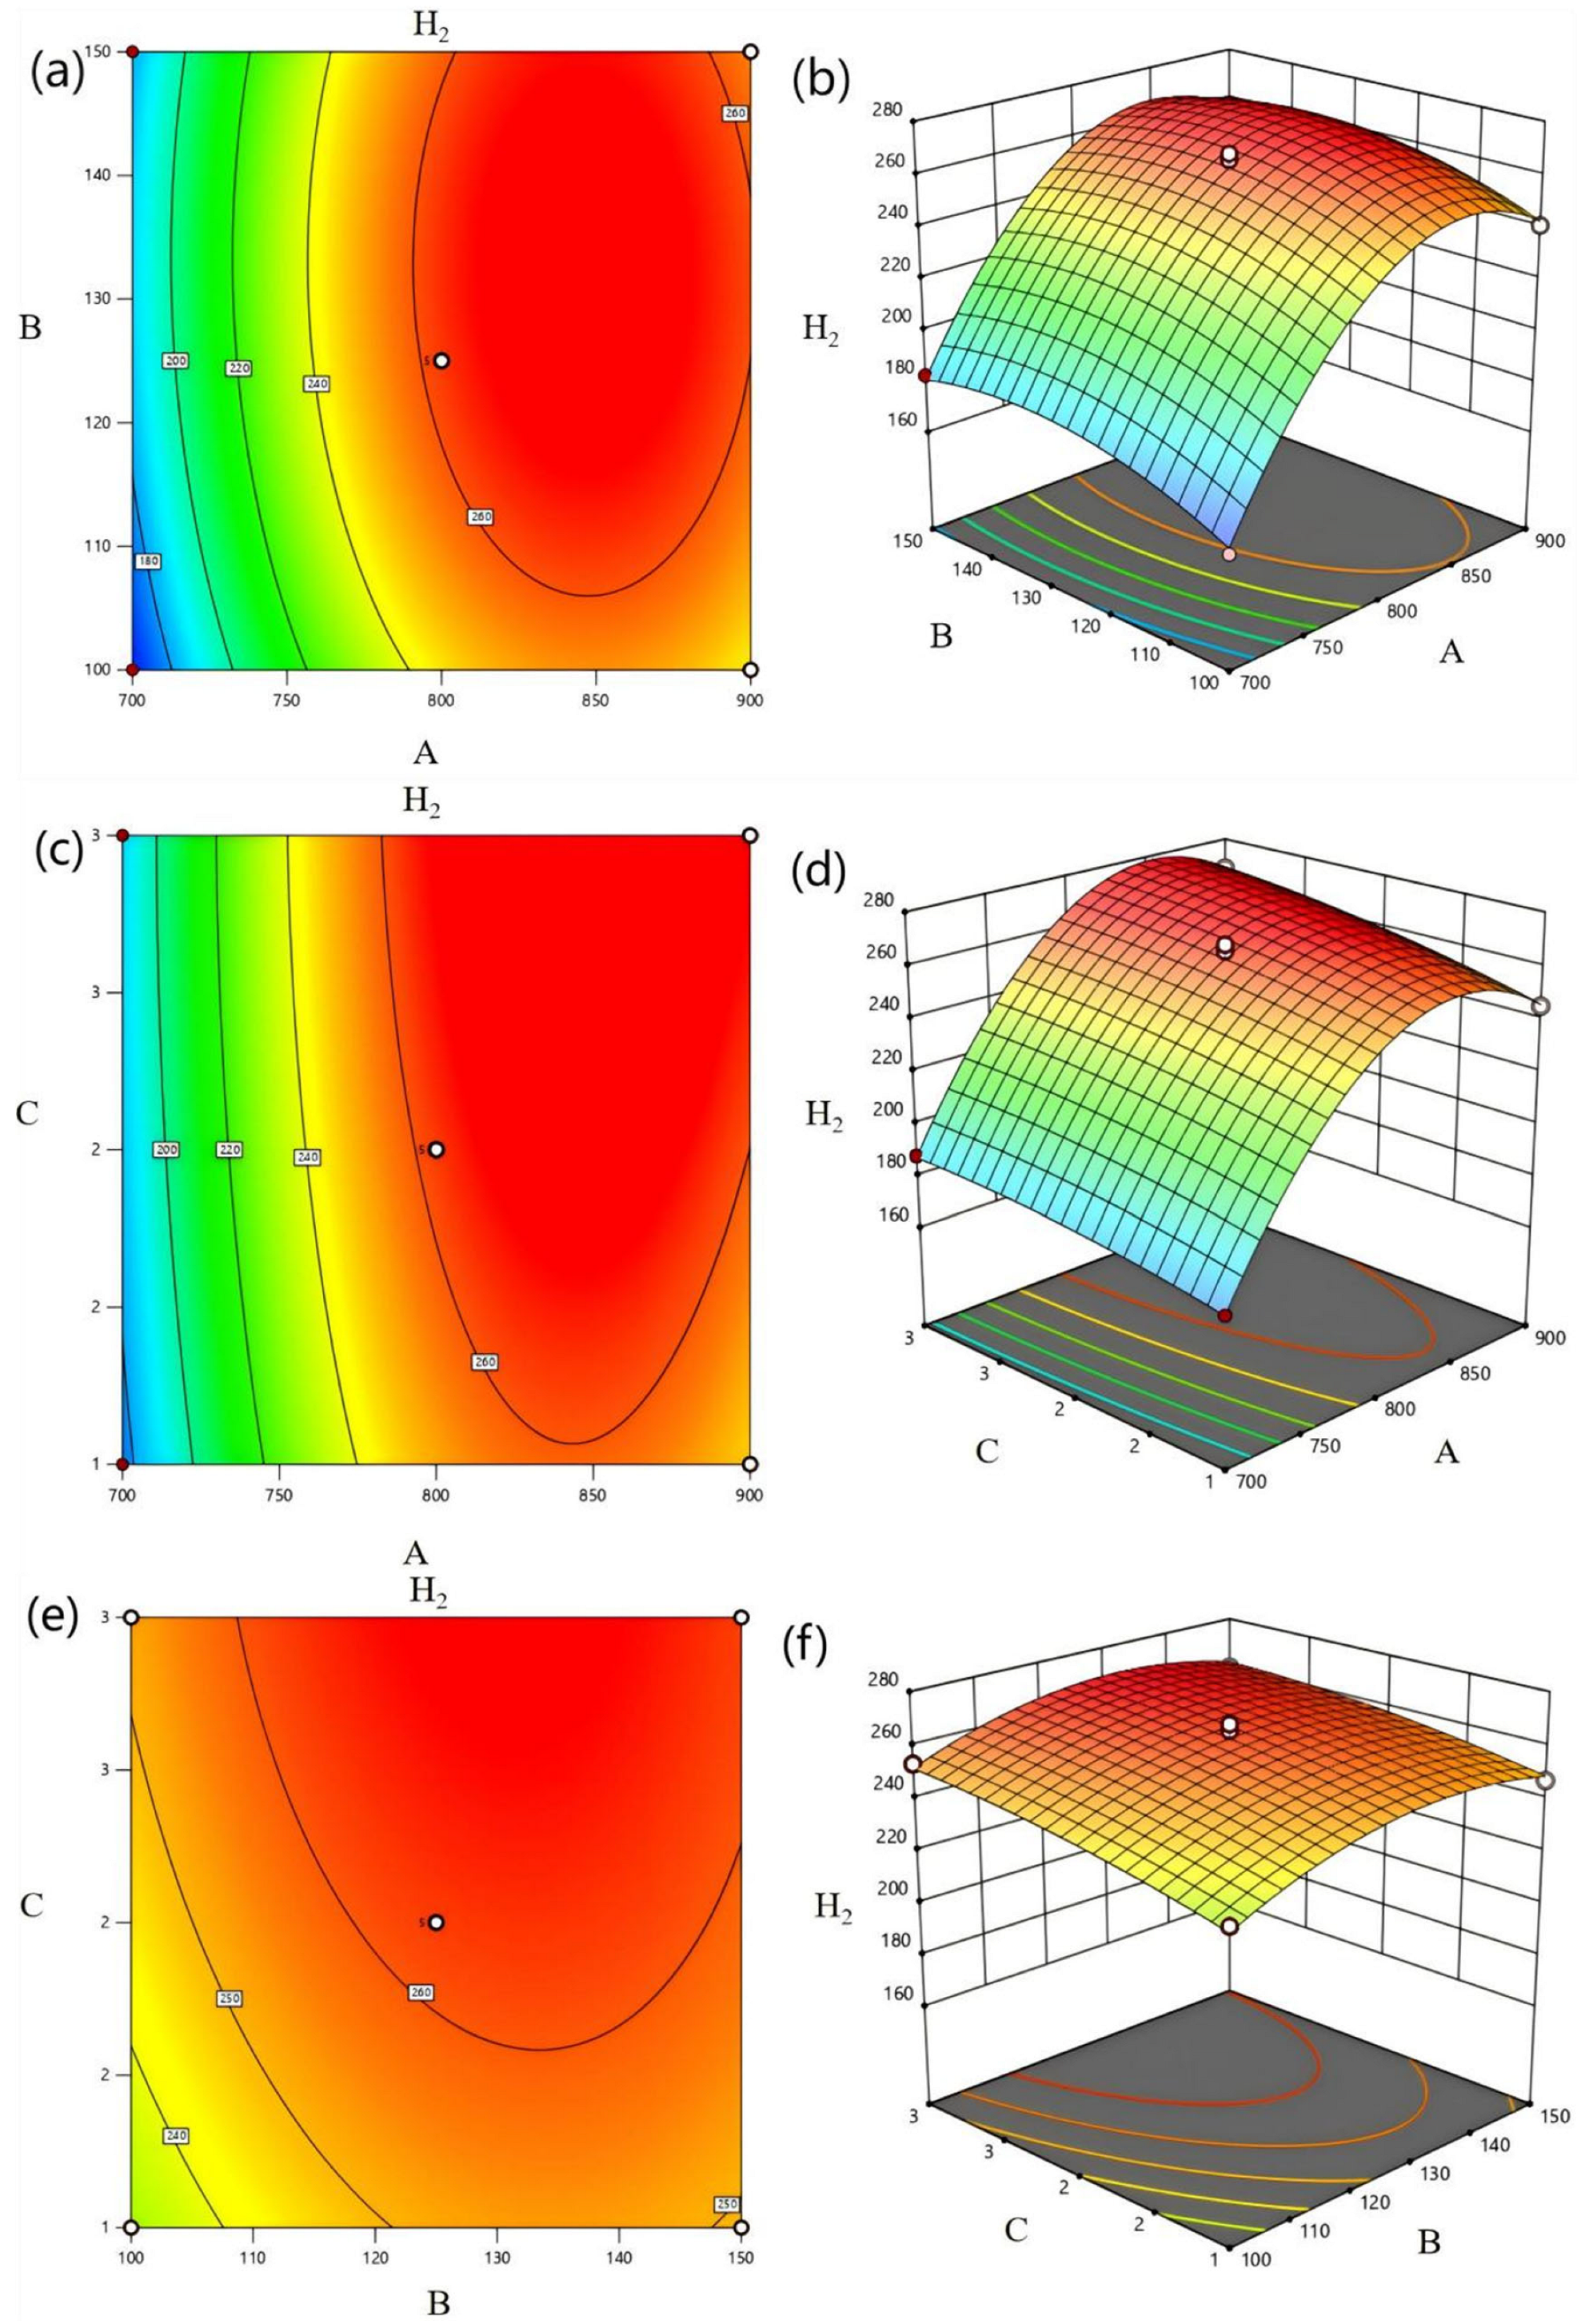
To further investigate the effects of various factors on H2 volumetric yield, two-dimensional contour plots and three-dimensional response surface plots (Figure 10) were generated to visualize the interactions among the three influencing factors. Figure 10a,b illustrate the effects of pyrolysis temperature and catalyst-to-feedstock ratio on H2 volumetric yield at a constant holding time of 2 h. The H2 yield initially increased with rising temperature but subsequently declined. This trend can be attributed to two principal factors: (1) enhanced tar removal at elevated temperatures and (2) improved catalytic cracking of large molecular bonds during pyrolysis, as supported by previous studies [33]. The two-dimensional contours exhibit an approximately elliptical shape, indicating a significant interaction between pyrolysis temperature and catalyst-to-feedstock ratio. Based on the three-dimensional response surface plots, pyrolysis temperature exerts a stronger influence on H2 volumetric yield than the catalyst-to-feedstock ratio. Figure 10c,d illustration the effects of pyrolysis temperature and holding time on H2 volumetric yield at a constant catalyst-to-feedstock ratio of 125%. Within the holding time range of 1.5 h to 2.5 h, hydrogen production from pyrolysis did not change significantly. This may be attributed to partial consumption of H2 through reactions with other species in the confined environment over extended periods, while continuous macromolecular cleavage continued to generate H2, resulting in a stable overall production rate. The results further confirm a notable interaction between pyrolysis temperature and holding time, with temperature having a more pronounced effect on H2 yield than holding duration. Figure 10e,f present the effects of catalyst-to-feedstock ratio and holding time on H2 volumetric yield at a pyrolysis temperature of 800 °C. These results suggest no significant interaction between catalyst loading ratio and residence time.
Figure 10.
(a) contour plot and (b) response surface plot of H2 at different pyrolysis temperatures and different catalyst-to-feedstock ratios; (c) contour plot and (d) response surface plot of H2 at different pyrolysis temperatures and different holding times; (e) contour plot and (f) response surface plot of H2 at different catalyst-to-feedstock ratios and different holding times.
Based on the proposed model, pyrolysis temperature, catalyst-to-feedstock ratio, and holding time were selected as independent variables, with the maximum H2 volumetric yield set as the optimization objective within the experimental range. The optimal conditions were determined as follows: (A) pyrolysis temperature = 835.89 °C, (B) catalyst-to-feedstock ratio = 110.02%, and (C) holding time = 2.35 h. To validate the model-based optimization, triplicate experiments were conducted under these conditions. The predicted H2 yield was 269.01 mL·g−1, while the experimental average reached 256.39 mL·g−1, corresponding to over 95% of the predicted value and indicating excellent agreement between predicted and experimental outcomes. Furthermore, this yield exceeds those reported for commonly studied biomass feedstocks under similar processes, such as sawdust (~217 mL·g−1) [34] and water hyacinth (~117.6 mL·g−1) [35], highlighting the comparative advantage of the present system for biomass-based hydrogen production.
5. Conclusions
In this study, waste calcium oxide desiccant was used as a carrier, and a Ni/DC catalyst was successfully prepared by loading nickel onto it, achieving harmless disposal and resource utilization of the waste material. The effects of pyrolysis conditions on the catalytic pyrolysis of tea waste for hydrogen-rich synthesis gas production were systematically investigated, and an optimized hydrogen production process was established through response surface methodology.
(1) After nickel loading, the specific surface area of the catalyst increased from 2.58 m2·g−1 to 3.60 m2·g−1. The main active component of Ni/DC catalyst was identified as NiO, which was uniformly distributed on the DC surface.
(2) When tea residue biomass was pyrolyzed at an initial pressure of 5 kPa, the highest total gas yield and hydrogen production were achieved. Elevated temperatures facilitated the cracking and conversion of partial tars, resulting in improved gaseous products. Considering both the lower heating value of synthetic gas and energy consumption, 800 °C was determined to be the optimal temperature for hydrogen-rich gas production. The maximum H2 yield of 265.65 mL·g−1 was obtained at a catalyst-to-feed ratio of 125%. Holding time demonstrated minimal influence on the products of in situ catalytic pyrolysis of tea residue biomass.
(3) Using response surface methodology with a Box–Behnken design, the optimal hydrogen production conditions were determined as follows: pyrolysis temperature = 835.89 °C, catalyst-to-feedstock ratio = 110.02%, and holding time = 2.35 h. Under these conditions, the predicted hydrogen yield was 269.01 mL·g−1. Experimental validation gave an actual hydrogen yield of 256.39 mL·g−1, demonstrating excellent model reliability with over 95% agreement between predicted and experimental values.
Compared with studies employing other biomass feedstocks or high-cost catalysts, this system achieves a comparable hydrogen yield while offering the distinct advantage of utilizing two waste materials, thereby enabling a “waste-treats-waste” strategy and effective cost control. However, the long-term stability and anti-coking performance of the catalyst, as well as the energy consumption required to maintain the vacuum system, remain key challenges for practical implementation and require further investigation. Additionally, the observed tar deposition in the reactor highlights the need to optimize reactor design to improve heat and mass transfer, to study tar reforming mechanisms, and to conduct life cycle analysis and techno-economic assessments to advance toward industrialization. Overall, this work presents a viable catalytic pyrolysis approach for converting tea residue and waste desiccants into hydrogen, offering a potential pathway to transform low-value waste into clean energy and supporting future integration into distributed biorefinery systems aimed at waste valorization and low-carbon transition.
Author Contributions
Data curation, writing—original draft preparation, L.L.; methodology, M.P.; formal analysis, Q.H.; writing—review and editing, Y.Y.; supervision, Y.X. Conceptualization, S.L. All authors have read and agreed to the published version of the manuscript.
Funding
This research was financially supported by the National Natural Science Foundation of China (Project No.22266009); Guizhou Provincial Science and Technology Plan Project (Guizhou Science and Technology Support [2024] General 105); Doctoral Research Fund of Guizhou Normal University, China (GZNUD [2019]6).
Data Availability Statement
The original contributions presented in this study are included in the article. Further inquiries can be directed to the corresponding author.
Conflicts of Interest
Author Y.X. was employed by the company Jiangkou County Fantian Hongyun Tea Co., Ltd. The remaining authors declare that the research was conducted in the absence of any commercial or financial relationships that could be construed as a potential conflict of interest.
Appendix A
The volume of gas generated in this experiment was measured using the water displacement method. The specific procedure was as follows: the aluminum foil gas bag containing the collected pyrolysis gas was connected to the gas volume measurement apparatus. Before introducing the gas, the initial liquid level in the glass tube was recorded. The gas bag was then squeezed to release the gas, after which the final liquid level was recorded. The gas volume was calculated as the difference between the final and initial liquid level readings.
Calculation of Product Yields and Lower Heating Value (LHV) of Pyrolysis Gas
(1) The yield of gas components: the volume of each component gas obtained by pyrolysis of biomass per gram, unit is mL·g−1. The calculation formula is:
(2) Total gas yield: The volume of total gas obtained by pyrolysis of per gram of biomass is mL·g−1. The calculation formula is:
(3) The yield of solid product: the quantity of coke obtained by gasification of dry-based biomass per gram of biomass, in units of g·g−1 biomass. The calculation formula is:
(4) Gas lower heating values: The volume yield and gas calorific value of each component of pyrolysis gas at different pyrolysis temperatures have different changes. The gas lower heating value (LHV) is calculated by the following formula:
In these equations, denotes the volume percentage of gas component i; and represent the volume of gas component i and total gas respectively; , and coke correspond to the yield of gas component i, total gas and coke respectively; and represent the quality of biomass raw material and coke respectively. It should be noted that N2 is excluded from the reported results and is expressed as a volume percentage concentration. Because the weight difference in the catalyst before and after pyrolysis is negligible, the coke quantity is calculated by subtracting the mass of the pyrolyzed sample from the catalyst. In Equation (5), CO, H2, and CH4 refer to the concentration of the corresponding gas products.
Figure A1.
(a) Normal plot of model residuals (b) Predicted and actual values of the model.
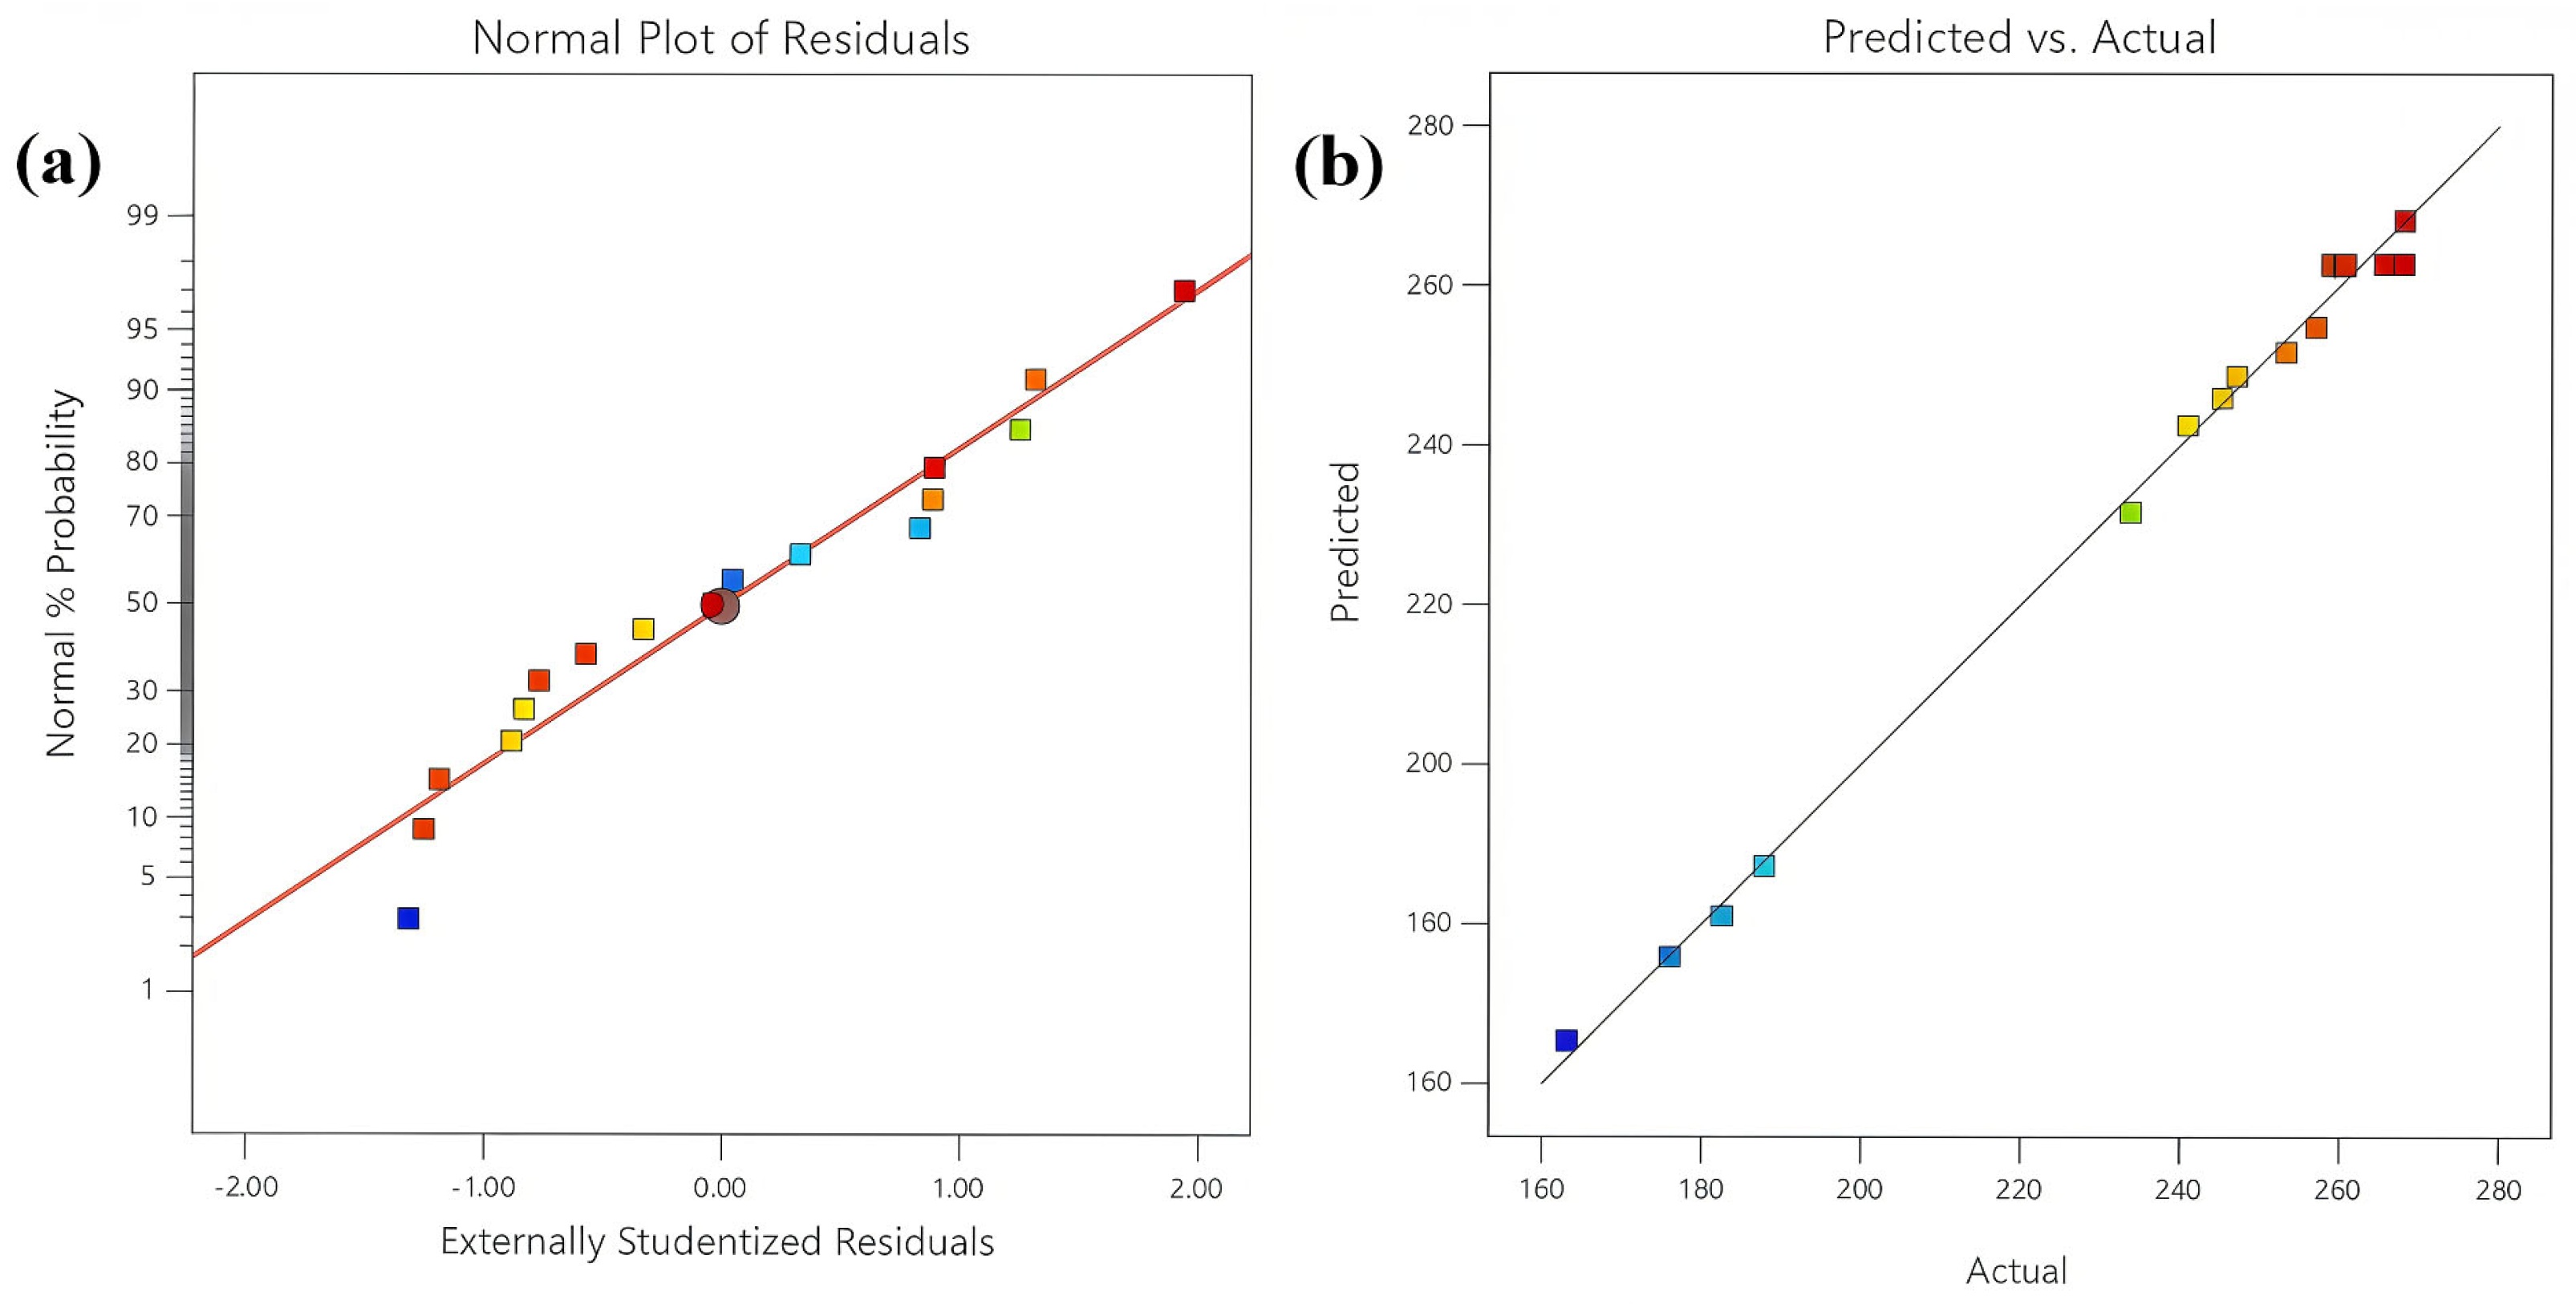
In Figure A1a, the residual values reflect the degree of data variability. The residual points are evenly distributed around the reference line, and the fitted curve shows a predominantly linear trend, indicating that the response surface model is appropriate for diagnostic purposes. As shown in Figure A1b, a strong correlation exists between the experimental values and the predicted values, demonstrating satisfactory fitting accuracy under the experimental conditions. In summary, the software model fitting results show good agreement with actual experimental outcomes, confirming the reliability of the model. This model can be considered feasible for analyzing the volumetric yield of H2 during pyrolysis.
Table A1.
Proximate and ultimate analysis of tea residues.
An organic element analyzer (Elementar: Vario UNICUBE) was used to analyze C, H, O, and N in the tea residue. The tea residue sample showed the highest carbon (C) content at 50.6 wt.%, which is one of the primary elements governing the generation of calorific value during biomass conversion. Oxygen (O) constituted the second most abundant element at 32.9 wt.%, where increased O-content inversely correlates with pyrolysis heating value. Hydrogen (H) accounted for 6.9 wt.% and similarly contributed to energy yield. Notably, nitrogen (N) content reached 5.2 wt.%, requiring special consideration due to its tendency to form nitrogen oxides (NOx), such as NO and NO2, during thermal decomposition. Importantly, sulfur (S) was undetectable (0 wt.%), confirming the suitability of the material as a pyrolysis feedstock since sulfur compounds are recognized as undesirable byproducts in thermochemical processes.
Table A2.
Experimental installation with model and manufacturer information.
The quartz tube of the tubular furnace had an outer diameter of 6 cm, a wall thickness of 0.4 cm, and a length of 100 cm, with an inner diameter of 5.2 cm, yielding a volume of 703.7 cm3.
Table A3.
Characterization instruments with model and manufacturer information.
Thermogravimetric analysis (TGA) was performed under a nitrogen atmosphere (flow rate: 30 mL·min−1) with a heating rate of 10 °C·min−1 from ambient temperature to 900 °C. X-ray fluorescence (XRF) spectroscopy was carried out on 2 g of dried sample under controlled temperature and humidity using an automated quantitative analyzer. X-ray diffraction (XRD) patterns were collected using Cu-Kα radiation, with scans conducted over a 2θ range of 10–80° at a rate of 6°·min−1 under operating conditions of 40.0 kV and 30.0 mA. Surface area and pore characteristics were determined from nitrogen adsorption–desorption isotherms measured at 77.2 K, and the specific surface area and pore volume were derived from the adsorption data using built-in software algorithms. For scanning electron microscopy (SEM), powder specimens were mounted on conductive adhesive, sputter-coated with gold, and imaged at an accelerating voltage of 20.0 kV.
Table A4.
Experimental design and results.
As shown in Table A5, the model F-value of 171.8 has an extremely low p-value (<0.0001), indicating that the model is statistically significant. The lack-of-fit F-value is 10.15 with a p-value of 0.6152, indicating that the lack of fit is not significant and suggesting good overall model fit. Therefore, this model can be reliably used to predict the volumetric yield of H2 from vacuum pyrolysis.
Table A5.
Regression model analysis of variance 1.
As presented in Table A6, the correlation coefficient (R2) of 0.9955 and adjusted coefficient (R2adj) is 0.9897. Values of R2 closer to 1 indicate a better model fit, reflecting satisfactory performance of the experimental model. The R2adj accounts for the effect of sample size; values near 1 indicate lower errors and better fit, further confirming the model’s effectiveness. The coefficient of variation (CV) represents the degree of dispersion in the model, with lower values being preferred. A CV exceeding 4% suggests excessive data dispersion, rendering the model unsuitable for simulations. The present model exhibits a relatively low CV (1.52%), demonstrating its precision and reproducibility in experimental applications.
Table A6.
Regression model analysis of variance 2.
References
- Zhukovskiy, Y.L.; Batueva, D.E.; Buldysko, A.D.; Gil, B.; Starshaia, V.V. Fossil energy in the framework of sustainable development: Analysis of prospects and development of forecast scenarios. Energies 2021, 14, 5268. [Google Scholar] [CrossRef] [Scilit]
- Vieira, L.M.; Santos, D.B.L.; Hori, C.E. Bifunctional Ni-CaO catalysts modified with CeO2 and inert Ca12Al14O33 for sorption-enhanced steam reforming of ethanol. Int. J. Hydrogen Energy 2022, 47, 38556–38570. [Google Scholar] [CrossRef] [Scilit]
- Li, B.; Mbeugang, C.F.M.; Xie, X.; Wei, J.T.; Zhang, S.H.; Zhang, L.; El Samahy, A.A.; Xu, D.L.; Wang, Q.; Zhang, S.; et al. Catalysis/CO2 sorption enhanced pyrolysis-gasification of biomass for H2 rich gas production: Effects of activated carbon, NiO active component and calcined dolomite. Fuel 2023, 334, 126842. [Google Scholar] [CrossRef] [Scilit]
- Wang, C.; Raza, S.A.; Adebayo, T.S.; Yi, S.; Shah, M.I. Corrigendum to “the roles of hydro, nuclear and biomass energy towards carbon neutrality target in China: A policy-based analysis” [Energy (2022) 125303]. Energy 2023, 272, 126994. [Google Scholar] [CrossRef] [Scilit]
- Debnath, B.; Haldar, D.; Purkait, M.K. Environmental remediation by tea waste and its derivative products: A review on present status and technological advancements. Chemosphere 2022, 300, 134480. [Google Scholar] [CrossRef] [Scilit]
- Chen, X.X.; Zhou, X.H.; Li, S.Y.; Zhang, H.D.; Liu, Z.K. Effects of tea residues-fermented feed on production performance, egg quality, antioxidant capacity, caecal microbiota, and ammonia emissions of laying hens. Front. Vet. Sci. 2023, 10, 1195074. [Google Scholar] [CrossRef] [Scilit]
- Guo, S.; Awasthi, M.K.; Wang, Y.; Xu, P. Current understanding in conversion and application of tea waste biomass: A review. Bioresour. Technol. 2021, 338, 125530. [Google Scholar] [CrossRef] [Scilit]
- Debnath, B.; Haldar, D.; Purkait, M.K. Potential and sustainable utilization of tea waste: A review on present status and future trends. J. Environ. Chem. Eng. 2021, 9, 106179. [Google Scholar] [CrossRef] [Scilit]
- Seth, D.; Athparia, M.; Singh, A.; Rathore, D.; Venkatramanan, V.; Channashettar, V.; Prasad, S.; Maddirala, S.; Sevda, S.; Kataki, R. Sustainable environmental practices of tea waste—A comprehensive review. Environ. Sci. Pollut. Res. 2025, 32, 7449–7467. [Google Scholar] [CrossRef] [Scilit]
- Choudhury, N.D.; Bhuyan, N.; Narzari, R.; Saikia, R.; Seth, D.; Saha, N.; Kataki, R. Various conversion techniques for the recovery of value-added products from tea waste. In Valorization of Agri-Food Wastes and By-Products; Bhat, R., Ed.; Elsevier: New York, NY, USA, 2021; pp. 237–265. [Google Scholar]
- Qureshi, F.; Yusuf, M.; Tahir, M.; Haq, M.; Mohamed, M.M.I.; Kamyab, H.; Vo, D.-V.N.; Ibrahim, H. Renewable hydrogen production via biological and thermochemical routes: Nanomaterials, economic analysis and challenges. Process Saf. Environ. Protect 2023, 179, 68–88. [Google Scholar] [CrossRef] [Scilit]
- Vuppaladadiyam, A.K.; Vuppaladadiyam, S.S.V.; Awasthi, A.; Sahoo, A.; Rehman, S.; Pant, K.K.; Murugavelh, S.; Huang, Q.; Anthony, E.; Fennel, P.; et al. Biomass pyrolysis: A review on recent advancements and green hydrogen production. Bioresour. Technol. 2022, 364, 128087. [Google Scholar] [CrossRef] [Scilit]
- Xuan, G.H.; Liu, F.; Zhang, F.; Hu, Y.L.; Miao, J.H.; Yang, L. Mechanism of improving the stability of activated carbon catalyst by trace H2S impurities in natural gas for hydrogen production from methane decomposition. Fuel 2021, 299, 120884. [Google Scholar] [CrossRef] [Scilit]
- Yue, W.C.; Ma, X.Q.; Yu, Z.S.; Liu, H.Y.; Li, W.J.; Li, C.X. CaMoO4-enhanced Ni-CaO bifunctional catalyst for biomass pyrolysis to produce hydrogen-rich gas. Fuel Process Technol. 2023, 250, 107900. [Google Scholar] [CrossRef] [Scilit]
- Xu, A.Z.; Zhou, W.H.; Zhang, X.D.; Zhao, B.F.; Chen, L.; Sun, L.Z.; Ding, W.J.; Yang, S.X.; Guan, H.B.; Bai, B. Gas production by catalytic pyrolysis of herb residues using Ni/CaO catalysts. J. Anal. Appl. Pyrol. 2018, 130, 216–223. [Google Scholar] [CrossRef] [Scilit]
- Chi, J.; Yu, H.M. Water electrolysis based on renewable energy for hydrogen production. Chin. J. Catal. 2018, 39, 390–394. [Google Scholar] [CrossRef] [Scilit]
- Lopez, G.; Garcia, I.; Arregi, A.; Santamaria, L.; Amutio, M.; Artetxe, M.; Bilbao, J.; Olazar, M. Thermodynamic assessment of the oxidative steam reforming of biomass fast pyrolysis volatiles. Energy Conv. Manag. 2020, 214, 112889. [Google Scholar] [CrossRef] [Scilit]
- Biswas, B.; Singh, R.; Kumar, J.; Singh, R.; Gupta, P.; Krishna, B.B.; Bhaskar, T. Pyrolysis behavior of rice straw under carbon dioxide for production of bio-oil. Renew. Energy 2018, 129, 686–694. [Google Scholar] [CrossRef] [Scilit]
- Rathore, N.S.; Pawar, A.; Panwar, N.L. Kinetic analysis and thermal degradation study on wheat straw and its biochar from vacuum pyrolysis under non-isothermal condition. Biomass Convers. Biorefinery 2023, 13, 7547–7559. [Google Scholar] [CrossRef] [Scilit]
- Wang, G.Y.; Dai, Y.J.; Yang, H.P.; Xiong, Q.G.; Wang, K.G.; Zhou, J.S.; Li, Y.C.; Wang, S.R. A Review of Recent Advances in Biomass Pyrolysis. Energy Fuels 2020, 34, 15557–15578. [Google Scholar] [CrossRef] [Scilit]
- Lachos-Perez, D.; Martins-Vieira, J.C.; Missau, J.; Anshu, K.; Siakpebru, O.K.; Thengane, S.K.; Morais, A.R.C.; Tanabe, E.H.; Bertuol, D.A. Review on biomass pyrolysis with a focus on bio-oil upgrading techniques. Analytica 2023, 4, 182–205. [Google Scholar] [CrossRef] [Scilit]
- Arkatova, L.A. The deposition of coke during carbon dioxide reforming of methane over intermetallides. Catal. Today 2010, 157, 170–176. [Google Scholar] [CrossRef] [Scilit]
- Dou, X.Y.; Yue, J.R.; Guan, Y.; Liu, W.J.; Zhang, Y.M.; Chen, Z.H.; Luo, G.Q.; Xu, G.W. Characteristics and kinetics of in-situ catalytic cracking of biomass tar in a micro dual bed reactor. Energy 2024, 306, 132470. [Google Scholar] [CrossRef] [Scilit]
- He, L.; Hui, H.L.; Li, S.G.; Lin, W.G. Production of light aromatic hydrocarbons by catalytic cracking of coal pyrolysis vapors over natural iron ores. Fuel 2018, 216, 227–232. [Google Scholar] [CrossRef] [Scilit]
- Shen, W.H.; Momoi, H.; Komatsubara, K.; Saito, T.; Yoshida, A.; Naito, S.J. Marked role of mesopores for the prevention of sintering and carbon deposition in dry reforming of methane over ordered mesoporous Ni–Mg–Al oxides. Catal. Today 2011, 171, 150–155. [Google Scholar] [CrossRef] [Scilit]
- Li, J.; Tian, Y.Y.; Qiao, Y.Y.; Chang, G.Z.; Wang, C.P.; Gao, Y.; Yang, L.S.; Song, K.; Zhang, J.; Hu, S.G.; et al. Synergistic effect of hydrogen atmosphere and biochar catalyst on tar decomposition and methane-rich gas production during biomass pyrolysis. Fuel 2022, 330, 125680. [Google Scholar] [CrossRef] [Scilit]
- Jia, J.B.; Veksha, A.; Lim, T.T.; Lisak, G. In situ grown metallic nickel from X–Ni (X = La, Mg, Sr) oxides for converting plastics into carbon nanotubes: Influence of metal–support interaction. J. Clean. Prod. 2020, 258, 120633. [Google Scholar] [CrossRef] [Scilit]
- Fan, Y.S. Basic Study on Vacuum Pyrolysis and Catalytic Transformation of Biomass for Preparation of Bio-oi. Ph.D. Thesis, Jiangsu University, Zhenjiang, China, 2016. [Google Scholar]
- Valle, B.; Aramburu, B.; Olazar, M.; Bilbao, J.; Gayubo, A.G. Steam reforming of raw bio-oil over Ni/La2O3-αAl2O3: Influence of temperature on product yields and catalyst deactivation. Fuel 2018, 216, 463–474. [Google Scholar] [CrossRef] [Scilit]
- Veksha, A.; Amrad, M.Z.B.M.; Chen, W.Q.; Mohamed, D.K.B.; Tiwari, S.B.; Lim, T.-T.; Lisak, G. Tailoring Fe2O3-Al2O3 catalyst structure and activity via hydrothermal synthesis for carbon nanotubes and hydrogen production from polyolefin plastics. Chemosphere 2022, 297, 134148. [Google Scholar] [CrossRef] [Scilit]
- Li, Z.S.; Cai, N.S.; Huang, Y.Y.; Han, H.J. Synthesis, experimental studies, and analysis of a new calcium-based carbon dioxide absorbent. Energy Fuels 2005, 19, 1447–1452. [Google Scholar] [CrossRef] [Scilit]
- Sharma, S.; Simsek, H. Sugar beet industry process wastewater treatment using electrochemical methods and optimization of parameters using response surface methodology. Chemosphere 2020, 238, 124669. [Google Scholar] [CrossRef] [Scilit]
- Zhang, J.; Mao, Y.; Zhang, J.S.; Tian, J.F.; Sullivan, M.B.; Cao, X.M.; Zeng, Y.Z.; Li, F.X.; Hu, P. CO2 Reforming of Ethanol: Density Functional Theory Calculations, Microkinetic Modeling, and Experimental Studies. ACS Catal. 2020, 10, 9624–9633. [Google Scholar] [CrossRef]
- Chen, G.; Andries, J.; Spliethoff, H. Catalytic pyrolysis of biomass for hydrogen rich fuel gas production. Energy Convers. Manag. 2003, 44, 2289–2296. [Google Scholar] [CrossRef] [Scilit]
- Tran, T.K.; Kim, N.; Leu, H.J.; Pham, M.P.; Luong, N.A.; Vo, H.K. The production of hydrogen gas from modified water hyacinth (Eichhornia crassipes) biomass through pyrolysis process. Int. J. Hydrogen Energy 2021, 46, 13976–13984. [Google Scholar] [CrossRef] [Scilit]

Disclaimer/Publisher’s Note: The statements, opinions and data contained in all publications are solely those of the individual author(s) and contributor(s) and not of MDPI and/or the editor(s). MDPI and/or the editor(s) disclaim responsibility for any injury to people or property resulting from any ideas, methods, instructions or products referred to in the content. |
© 2026 by the authors. Licensee MDPI, Basel, Switzerland. This article is an open access article distributed under the terms and conditions of the Creative Commons Attribution (CC BY) license.