


Abstract
Insulators in wind-sand flows distort the electric field along their surfaces due to the wind-sand electric field, threatening the safe operation of transmission lines. This paper models the impact of wind and sand flow on electric field distribution along transmission line insulators by integrating an Eulerian two-fluid field with an electrostatic field, incorporating the electrification process of sand particles. The study investigates how different wind speeds, dust concentration, and sand particle sizes affect the electric field distribution on insulators. The results show that the electric field along the insulator’s surface decreases in steps, while the electric field forms a “U”-shape with high ends and a low center. In contrast to the clean environment, wind and sand flow generally increases the electric field. Under the influence of wind-sand flows, each 2 m/s wind speed rise reduces the electric field by about 2–3%. As sand concentration and particle size grow, the electric field decreases near the high-voltage end and increases near the grounded end. Higher concentrations or larger particles significantly boost the maximum electric field intensity, worsening distortion and increasing long-term insulation risks.
1. Introduction
In recent years, land desertification in certain regions of China has intensified, particularly in the Northwest, North China, Northeast, and Inner Mongolia. This has led to frequent sand activities. The presence of transmission lines through these desertified areas has contributed to the formation of severe sandstorms, resulting in numerous insulator flashover incidents that significantly impact the safe and reliable operation of the power system [1,2,3,4]. It is worth noting that the aforementioned regions are not only important energy bases of our country, but also the core sending end of the “West-to-East Power Transmission” strategy. For example, the ultra-high voltage projects like the Gansu Jiuquan–Hunan Xiangtan and Xinjiang Hami–Henan Zhengzhou have to cross extensive deserts and gobi areas. These regions are frequently subject to sandstorms, have high wind speeds, and have strong charged sand particles. Under the combined action of long-term sand erosion and electric fields, the surface charge accumulation, electric field distortion, and pollution flashover risks of composite insulators have significantly increased, becoming one of the key factors restricting the reliability of ultra-high-voltage direct current projects [5,6,7]. Therefore, conducting in-depth research on the evolution law of the surface electric field of composite insulators under sandy wind conditions, and revealing the coupling mechanism between wind sand parameters and electric field distortion, holds significant theoretical value and engineering significance for enhancing the operational reliability of power transmission systems in the northwest region and across regions, and ensuring the large-scale transmission of new energy.
Currently, the body of research concerning the electric field distribution along the surfaces of porcelain and composite insulators is well-developed. Scholars have examined the electric field distribution along the surface of porcelain insulators under conditions of sand, dust, and non-uniform dirt accumulation [8,9,10]. Zheng et al. [11] constructed a simulation model to analyze the electric field of porcelain insulators in transmission lines, resulting in spatial electric field distribution curves for undamaged insulator strings. Furthermore, The surface electric field characteristics of composite insulators under various deterioration modes, including different dirt compositions, water strip patterns, the absence of water droplets, and bird pecking have also been researched [12,13,14,15,16]. Additionally, Li et al. [17] investigated the impact of three types of spherical pollution layers on the electric field distribution on the insulator surface under varying environmental conditions. The existing body of literature demonstrates a substantial number of studies focused on the electric field distribution along the surface of insulators. However, there are relatively few studies of research addressing the influence of wind-sand electric fields on the electric field distribution along the surface of composite insulators when subjected to wind-sand fluid dynamics.
While it is possible to measure the electric field along the surface of an insulator in situ, this approach is often hampered by extended measurement periods, high costs, significant workload, and the inevitable introduction of errors due to external factors. Conversely, numerical simulation methods have emerged as a prevalent approach for investigating high-voltage insulation fields, owing to their high accuracy, minimal error, and cost-effectiveness. For instance, Shi et al. [18] employed the Eulerian two-fluid model to simulate wind-sand flow. In another study, She et al. [19] identified 11 key parameters and their respective value ranges within the Eulerian two-fluid framework. Meanwhile, Hu et al. [20] utilized the Eulerian–Lagrangian model to simulate the wind-sand environment, and Wen et al. [21] applied the smooth particle hydrodynamics (SPH) method to analyze the kinematic characteristics of wind-sand flows. These numerical methods vary in terms of computational domain size and computation time, with each offering distinct advantages in research methodology. The Eulerian two-fluid model is favored for addressing wind-sand interactions in regions of high concentration at an engineering scale. However, research on its coupling under complex geometrical configurations and in the presence of strong electric fields surrounding transmission insulators remains limited.
In light of the aforementioned challenges, this study develops a numerical computational model to address the coupling between Eulerian two-fluid fields and electrostatic fields, with particular consideration given to particle charging. A two-way coupling strategy is employed. The model is applied to analyze the working conditions of insulators in sandy and windy environments, focusing on the distribution of the electric field along the surface and local field distortions under varying wind speeds, sand and dust concentrations, and particle sizes. The model’s reliability is validated through comparison with existing literature, thereby providing a quantitative foundation for understanding the impact of insulators on transmission lines in harsh wind and sand conditions.
2. Eulerian Two-Fluid Field–Electrostatic Field Coupling Model
2.1. Eulerian Two-Fluid Model
Wind-sand flow is a typical gas–solid two-phase flow motion [22] with two-phase characteristics, and the wind-sand motion can be simulated by using the Eulerian two-fluid model, in which both the gas phase and the particulate phase are treated as a continuum for solving the Navier–Stokes equations, which are considered to penetrate through and permeate each other and to move in accordance with their own laws, and the volume fraction is used to characterize the existence of each phase.
When simulating the motion of wind-sand flow with the Eulerian two-fluid model, the gas phase and the sand phase have their own mass and momentum conservation equations. The mass conservation equations for each phase are:
k = g: Gaseous phase.
k = s: Particulate phase.
: Volume fraction (Satisfying + = 1).
: Density of the k-phase.
: Representing the divergence of the mass flux, measuring the net mass flow rate per unit volume.
: Average velocity of the k-phase.
t: Time (measure units of time is seconds).
Gas phase momentum conservation equation:
Sand grain phase momentum conservation equation:
: k-corresponding force tensor.
: Particle-phase solid pressure.
⊗: Tensor product. The multiplication of two vectors results in a second-order tensor (also known as the Dyadic Product), providing a mathematical framework for describing momentum flux.
p: Interphase shared pressure.
g: Gravitational acceleration.
: Momentum exchange coefficient between the gas phase and the sand phase.
: Electrostatic field force acting on the particles.
In the simulation of wind-sand movement, the tracer model has a very important influence on the accurate simulation of momentum exchange between particles and fluid. This paper adopts the Gidaspow model [23], which is derived from empirical formulas and can satisfy most of the computational simulation of the dense fluid and the prediction effect is relatively good. The formula is:
: Coefficient of drag.
: Particle size of sand grains.
: Particle Reynolds number.
: Dynamic viscosity of the fluid.
The turbulence model adopts the standard k- model in the Reynolds-averaged N-S model. The standard k- turbulence model is adopted due to its robust convergence and sufficient accuracy for dilute gas–solid flows in open geometries. The model constants are the default values in numerical software (, , , , ), which have been extensively validated for similar flow regimes.
2.2. Electrostatic Field Model
In order to describe the motion state of charged dirt particles in the electric field around the insulator, an electrostatic field model needs to be established to describe the external electric field of the insulator. At the same time, the electrostatic field needs to be coupled with the Eulerian two-fluid model mentioned above, so as to realize the interactions between the insulator and the charged moving particles. Its control equation is:
: Relative permittivity of the linear medium.
: Permittivity in vacuum ().
E: Electric field intensity.
: Space charge density.
: Sand grain number density.
: Potential scalar.
The above five equations completely constitute the bidirectional coupling mechanism between the wind-sand two-phase flow and the electrostatic field. The two-phase flow model outputs the particle volume fraction (). The particle number density is calculated using Formula (10). Combining the particle charge quantity model, the space charge density () is obtained according to Formula (9). The space charge density is substituted as a source term into the Poisson equation to solve for the distorted electric field. The electric field exerts a Coulomb force () on the particle phase, thereby altering the particle movement and deposition distribution. The updated particle distribution once again affects the space charge density, creating an iterative coupling.
2.3. Charged Sand Model
Previous research on the impact of wind and sand on insulators has not adequately addressed the charging process of sand particles. However, understanding this process is crucial for describing the electric field on the insulator surface, which is influenced by factors such as wind speed, sand particle size, and sand concentration. The movement of sand particles on the insulator, driven by the external electric field, generates charges and affects the distribution of the electric field around the insulator, presenting a highly complex phenomenon.
This paper categorizes the sand particle charging process into three distinct mechanisms:
1. Initial contact between particles followed by separation, where charge transfer occurs due to collision impact.
2. Charge generation through asymmetric friction between particles.
3. Induction charge generation under the influence of the applied electric field. By considering these three modes of electrification, the study comprehensively examines the effect of individual particle charging on the electric field surrounding the insulator.
When sand particles collide in the air, charge transfer occurs between the sand particles due to the electric field, and the amount of transferred charge with respect to the collision time and ambient relative humidity is [24]:
RH: Ambient relative humidity.
: Collision time.
: Resistivity of sand grains at different humidity.
n: Number of water molecule layers.
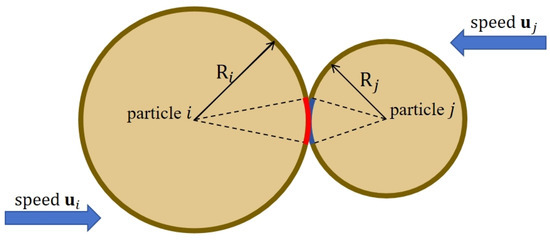
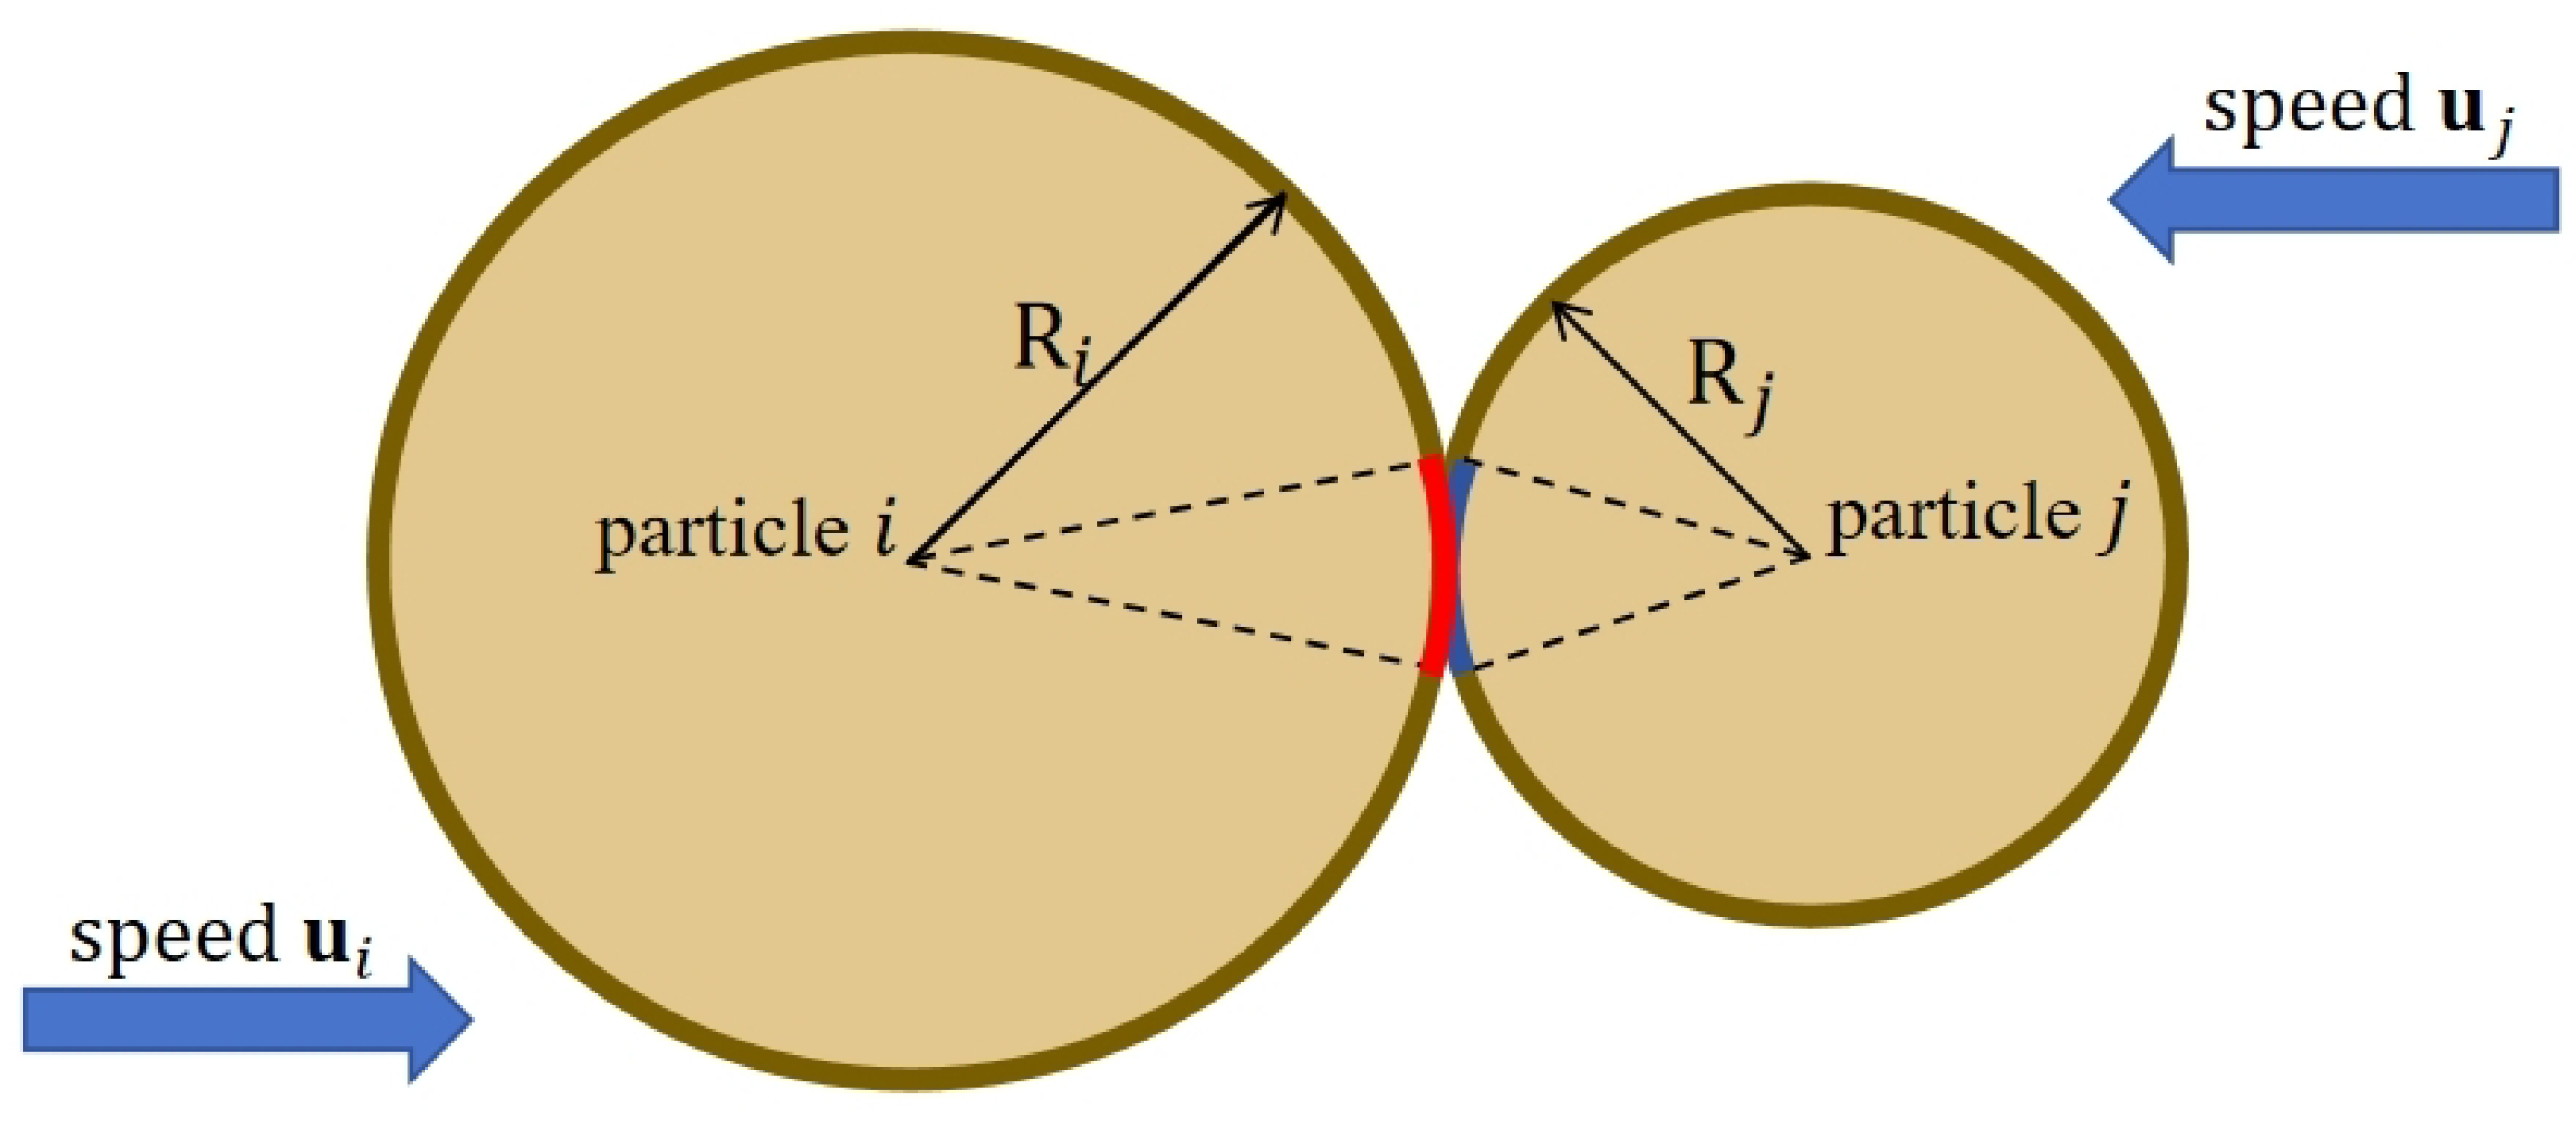
As shown in Figure 1, when sand particles undergo asymmetric friction in the air, the charge generated by asymmetric friction with respect to the particle size and impact velocity is [25]:
Figure 1.
Schematic diagram of sand particle collision.
: Particle charge density.
: Probability of occurrence of charge donor on the particle (0.5 in this paper) [26].
, : Contact areas of particles i and j during particle friction.
, : Denote the radii of particles i and j.
, : Maximum normal phase displacement during friction of grains i and j.
R: Equivalent radius.
, : Masses of particles i, j.
M: Equivalent mass.
, : Elastic moduli of particles i, j.
, : Poisson’s ratios of particles i, j.
For a spherical sand grain in an electric field external to the insulator, the theoretical prediction of the induced charge excited by the electric field is [27]:
The final model of the integrated charge on sand particles considering the three charging modes is available:
2.4. Multi-Physical Field Coupling Approach
The key assumptions: The shape of the sand grains is considered as spherical; the charge distribution of the sand grains is assumed to be uniformly charged; the sand grains are only considered to have fluid trailing force, electric field force, gravity, and the effects of Saffman lifting force, rotating Magnus force, and additional mass force are ignored; the effects of temperature change on fluid viscosity and particle charging are ignored.
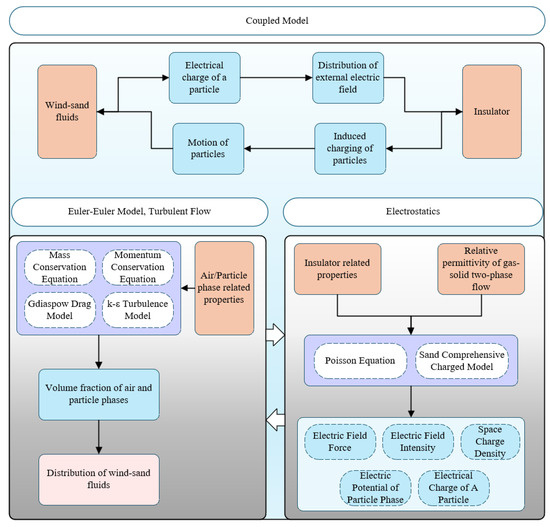
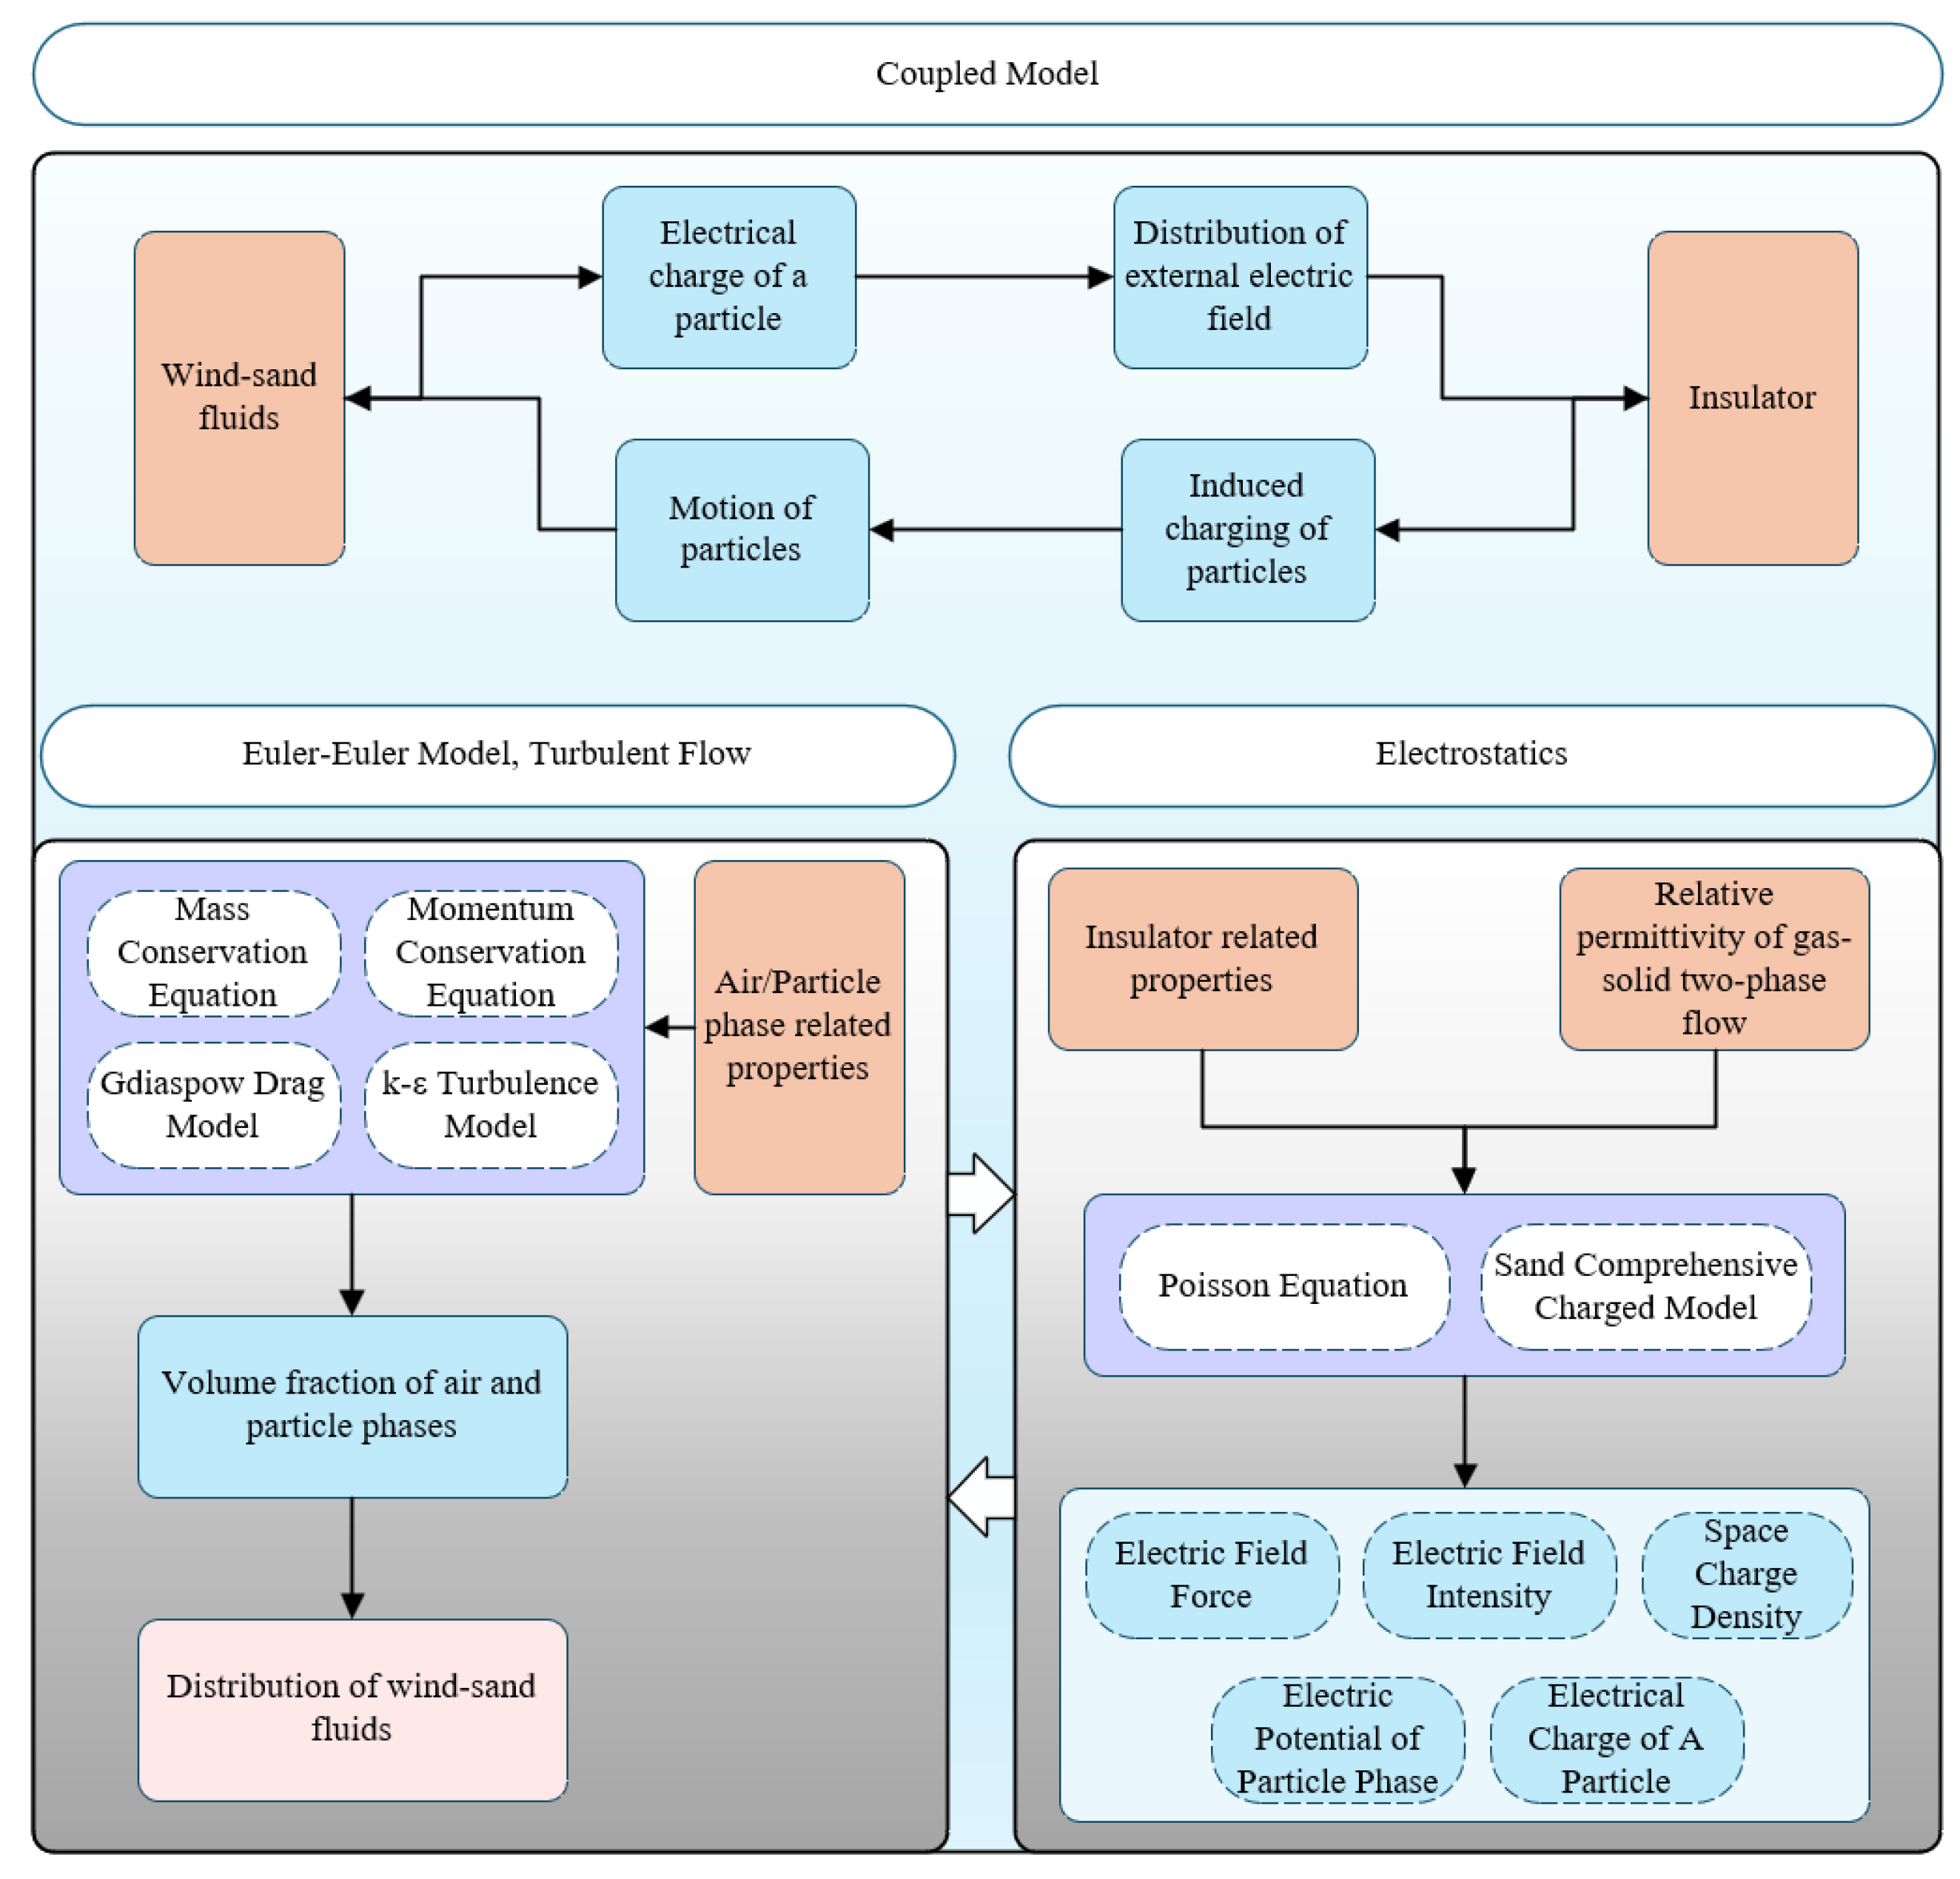
For the Euler two-fluid–electrostatic field coupling model, a bidirectional coupling strategy is adopted. It takes into account the influence of the wind-sand electrostatic field on the electric field around the insulator, as well as the impact of the external electric field of the insulator on the movement and charging of the sand particles. It is applicable to high-voltage insulators and situations with high particle charging. The Multiphysics interface is used, and the specific coupling method flowchart is shown in Figure 2.
Figure 2.
Bidirectional coupling framework of the Eulerian two-fluid model and electrostatic field model: The particle volume fraction () and number density () obtained from the two-fluid model are used to compute the space charge density (), which serves as the source term in Poisson’s equation. The distorted electric field exerts a Coulomb force () on the particle phase, feeding back to the momentum equation. The iteration continues until both flow field and electric field converge.
3. Model Construction
3.1. Model Geometric Parameters
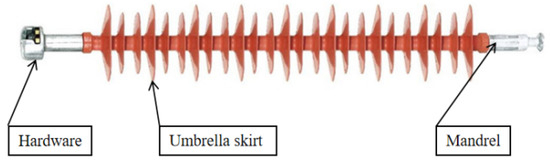
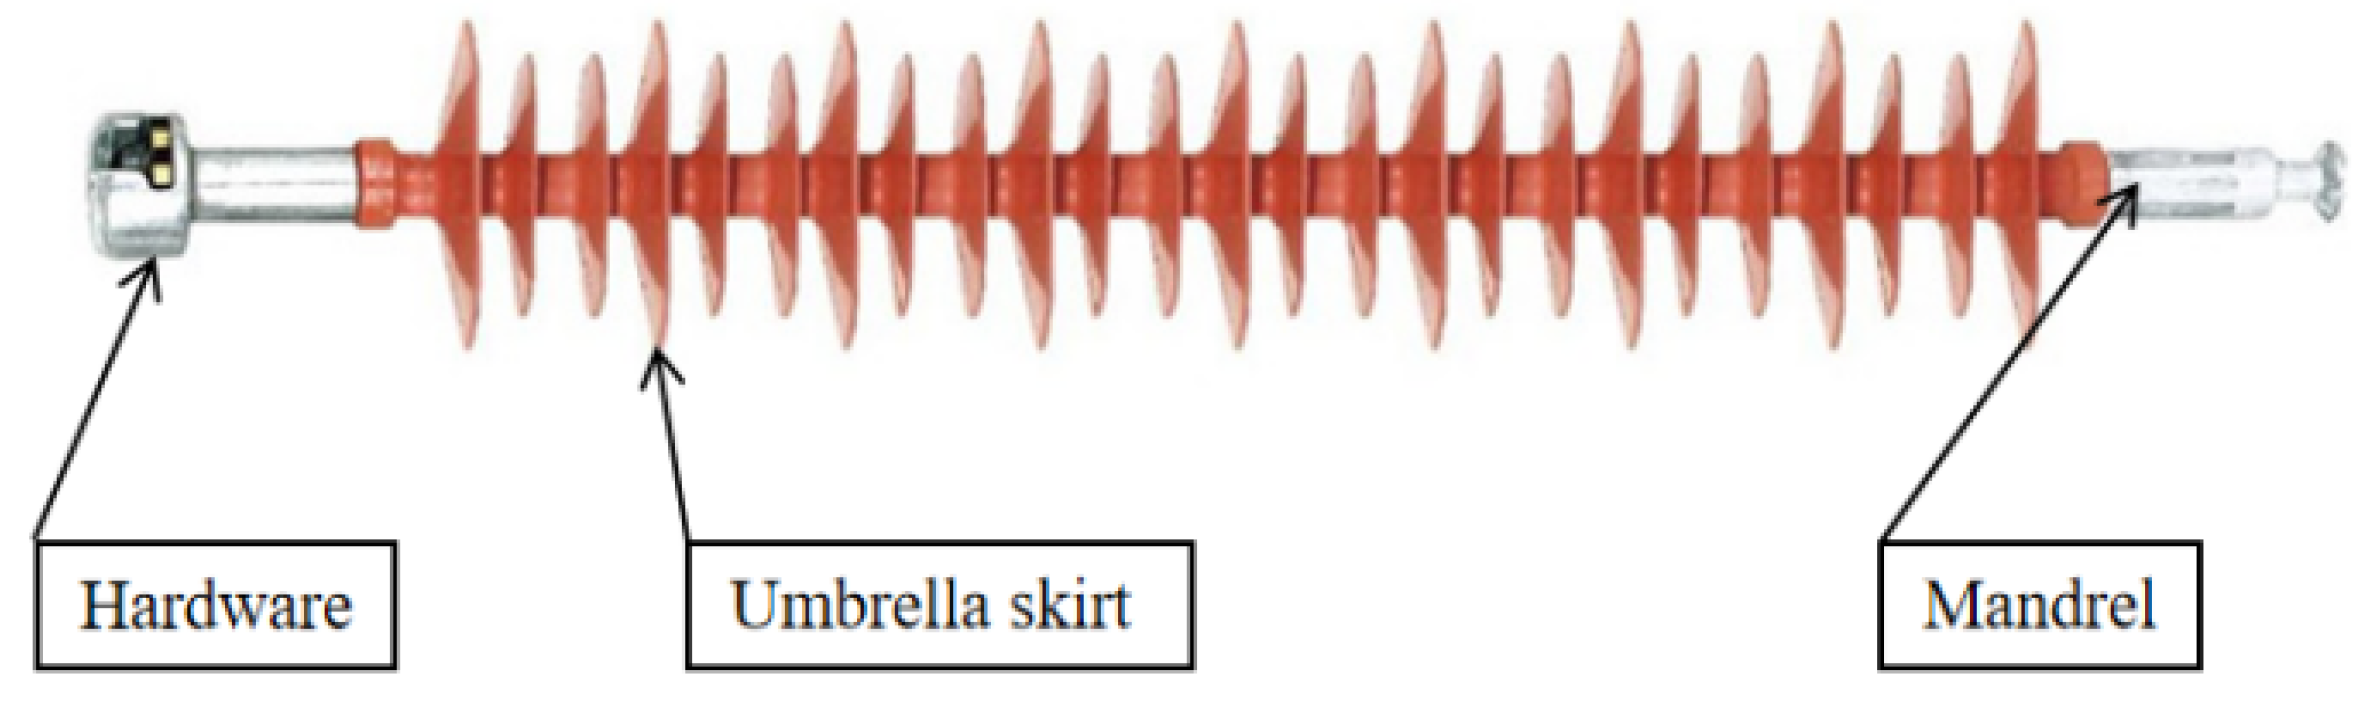
Composite insulators have become a widely used type of insulator in power transmission lines, offering many outstanding features, including excellent resistance to dirt flashover and superior water-repellent properties, as well as more economical processing and transportation costs. In this paper, composite insulators for 110 kV transmission lines in the Xinjiang Aksu area are used as a research example. Local 110 kV transmission lines are widely used FXBW-110/100 series composite insulators to cope with the problem of contamination flashover in arid and sandy areas in order to adapt to the sandy environment. The insulator structure is schematically shown in Figure 3, and the parameters in Table 1 are the specific parameters of the insulator.
Figure 3.
Composite insulator structure diagram.
Table 1.
FXBW-110/100 composite insulator parameter: summarizes the key geometric and electrical specifications of the FXBW-110/100 composite insulator used in this study. The structural height is 1240 ± 15 mm, the minimum arc distance is 1000 mm, and the minimum nominal creepage distance is 3150 mm. These parameters define the computational domain and boundary conditions in the electrostatic field simulation.
The density of sand particles in this area is 2650 kg/m3, the density of air is 1.225 kg/m3, the relative dielectric constants of air, sand particles, mandrels, and umbrella skirts are 1, 3.5, 3, and 5, respectively, the wind speeds at the height of the insulator (about 15 m) are 8–16 m/s, the particle sizes of sand particles are 50–200 μm, the concentrations of sand and dust are 0.1–10 g/m3, and the Ambient relative humidity RH is 10–30%. A three-dimensional Eulerian two-fluid–electrostatic field coupling model is established and the inter-particle and particle-insulator interactions are considered to quantify the electric field distortion and flashover risk along the surface under different working conditions, so as to provide a quantitative basis for the optimization of the insulator structure and the overhaul cycle in this type of harsh environment.
3.2. Setting of Boundary Conditions
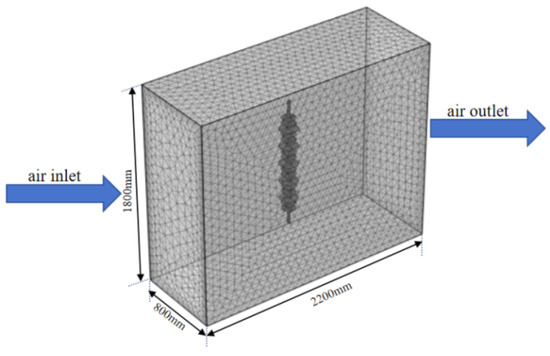
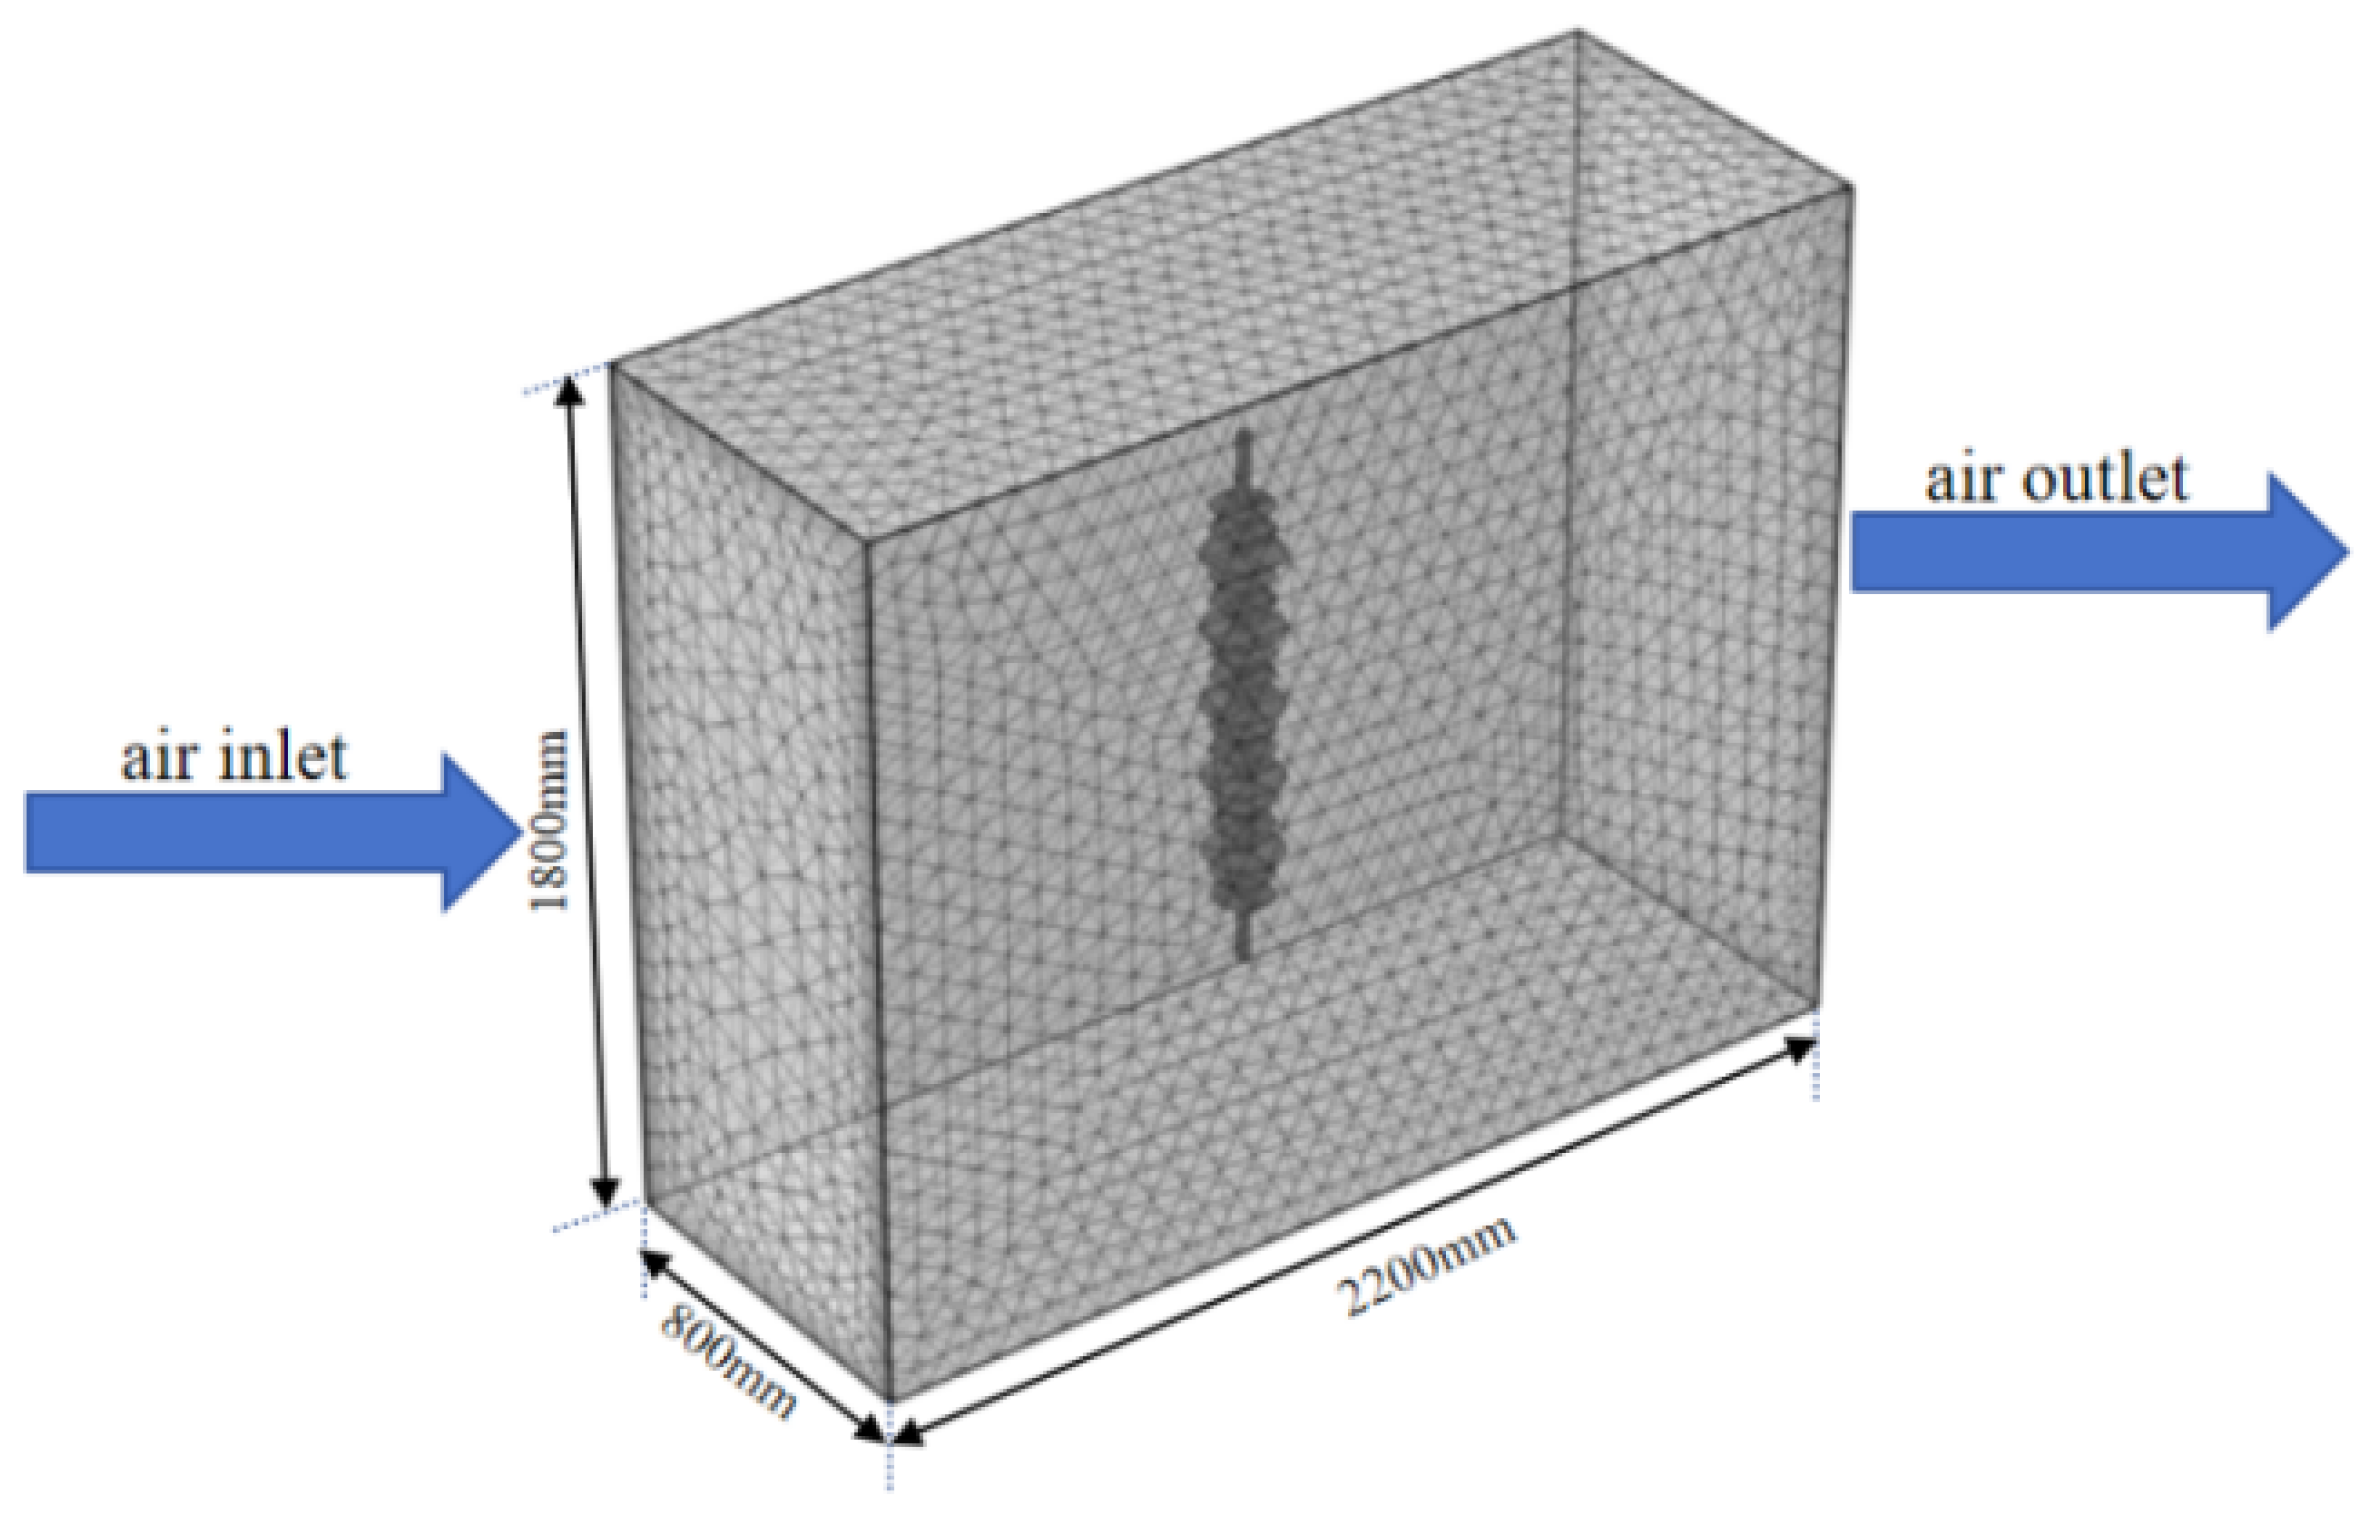
When using finite element software to establish the insulator model, as shown in Figure 4, the wind-sand fluid domain is regarded as an infinite domain, and a truncated boundary is artificially set to limit the scope of the fluid domain, and a rectangular domain is set around the insulator, which is coaxial with the insulator. In order to take into account the accuracy and speed of the calculation, the boundary mesh of composite insulators is refined, and the rest of the part adopts the regular-sized mesh, and the mesh size and quantity are corrected by hydrodynamic method when meshing, thus transforming the original solution problem into a finite domain problem for solving. The hydrodynamic method is used to correct the mesh size and number during meshing, so that the original infinite domain problem is transformed into a finite domain problem for solving.
Figure 4.
Computational domain and mesh discretization of the Eulerian two-fluid and electrostatic field coupling model. The domain extends 1800 mm in the vertical direction and 2200 mm in the horizontal direction, with the insulator positioned at the center. The left boundary is set as the air inlet, the right boundary as the air outlet, and the top and bottom boundaries as symmetry or wall conditions. The complete grid consists of 429,167 domain cells, 20,711 boundary cells and 2892 edge cells. An unstructured tetrahedral mesh with boundary layer refinement is applied to resolve the near-surface flow and electric field gradients.
In the Eulerian two-fluid field module, the left side is the fluid inlet, the inlet boundary condition is set as the velocity condition, and the velocity is set to six gradients of 8 m/s, 10 m/s, 12 m/s, 14 m/s, and 16 m/s. The right side is the fluid outlet, and the outlet boundary condition is set as the pressure condition, and the outlet relative pressure is 0 MPa; the insulator surface is the inner-wall surface condition, and the remaining four surfaces are set as no-slip conditions. Set the granular phase particle size to 50 μm, 100 μm, 150 μm, 200 μm four gradients, and set the dispersed phase volume fraction to 0.1 g/m3, 0.5 g/m3, 1 g/m3, 5 g/m3, 10 g/m3 five gradients. The turbulence model used is the k- turbulence model, the traction model used is the Gidaspow model, and finally endowed with the sand phase insulator under the influence of electric field sand grains integrated charged quantity equation, electrostatic force on sand grains and gravity.
The electrostatic field module sets the insulator’s lower fixture to 110 kV high voltage end and the insulator’s upper fixture to ground; the relative dielectric constant is set according to the material properties of each part of the insulator, and the charge conservation is set.
4. Results and Discussion
4.1. Clean Versus Wind-Sand Environments
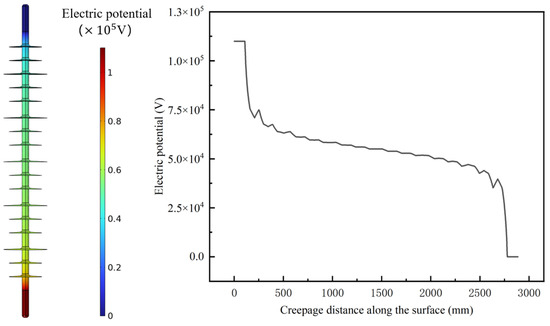
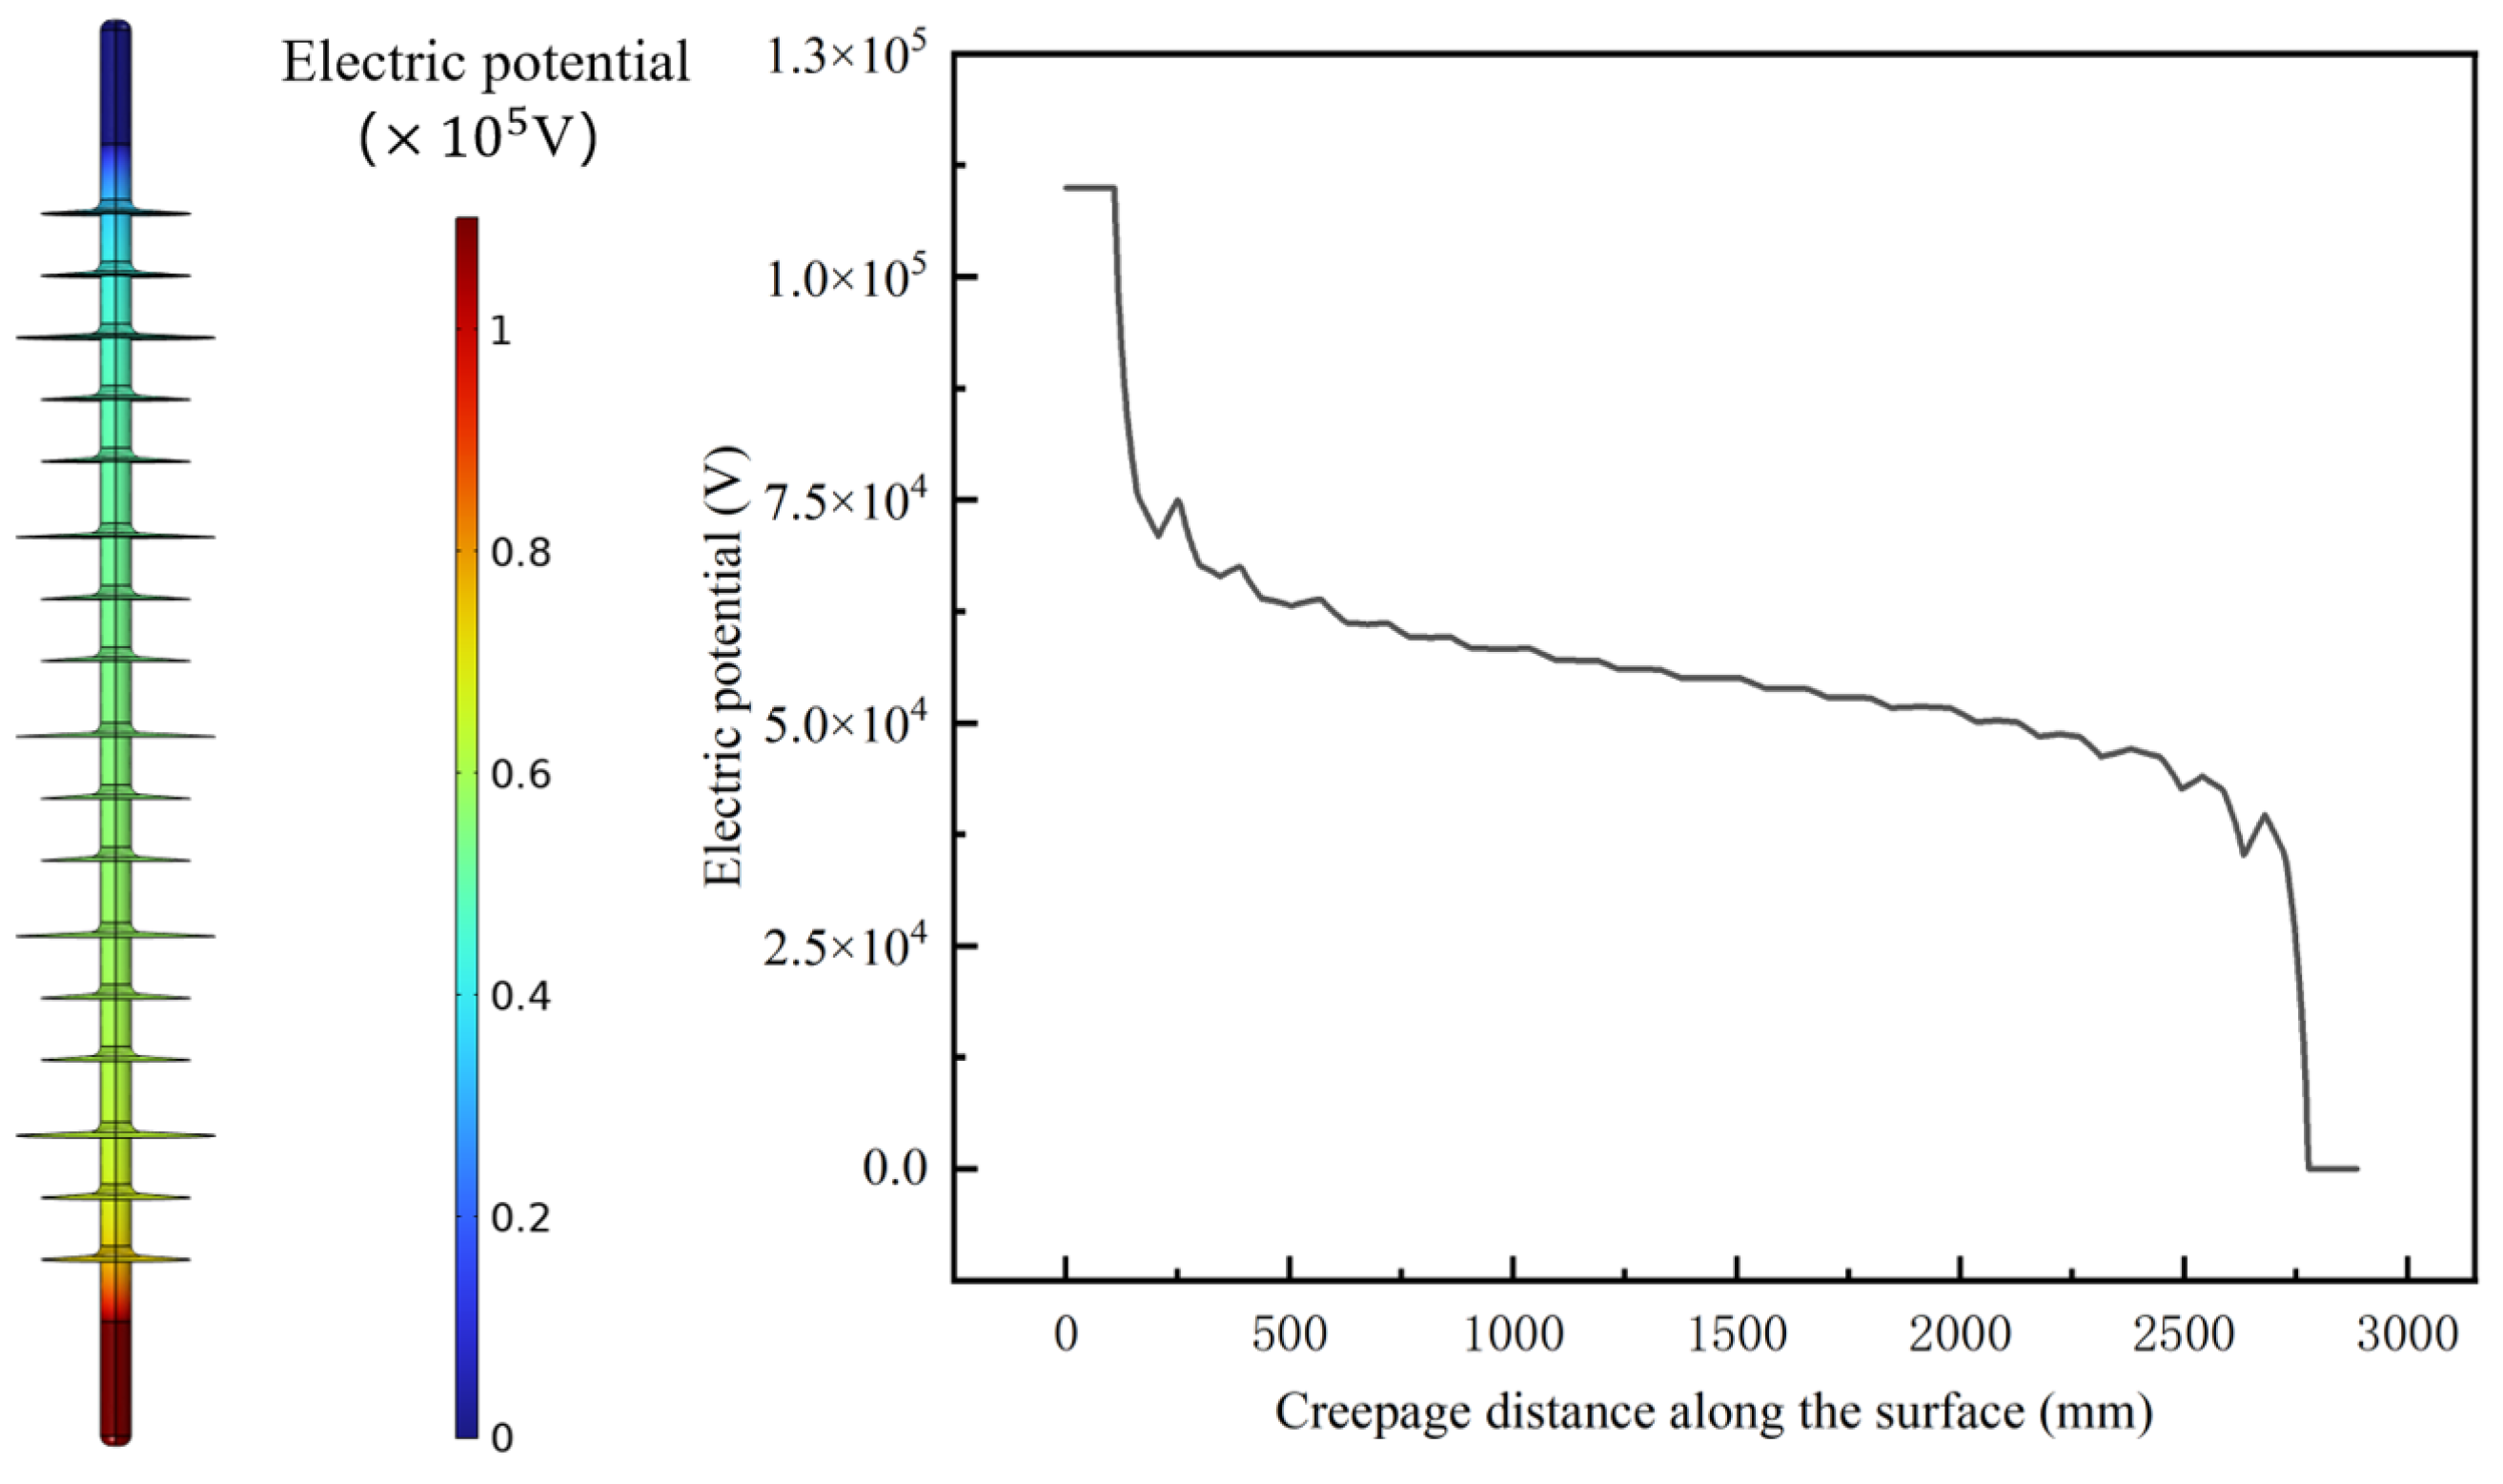
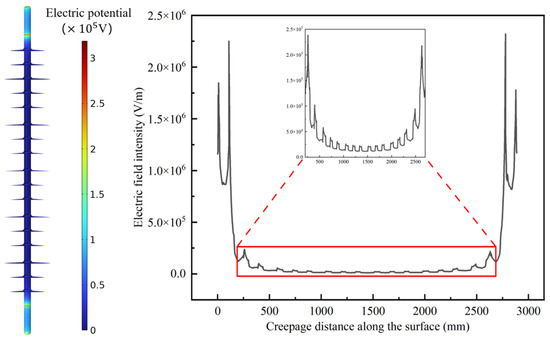
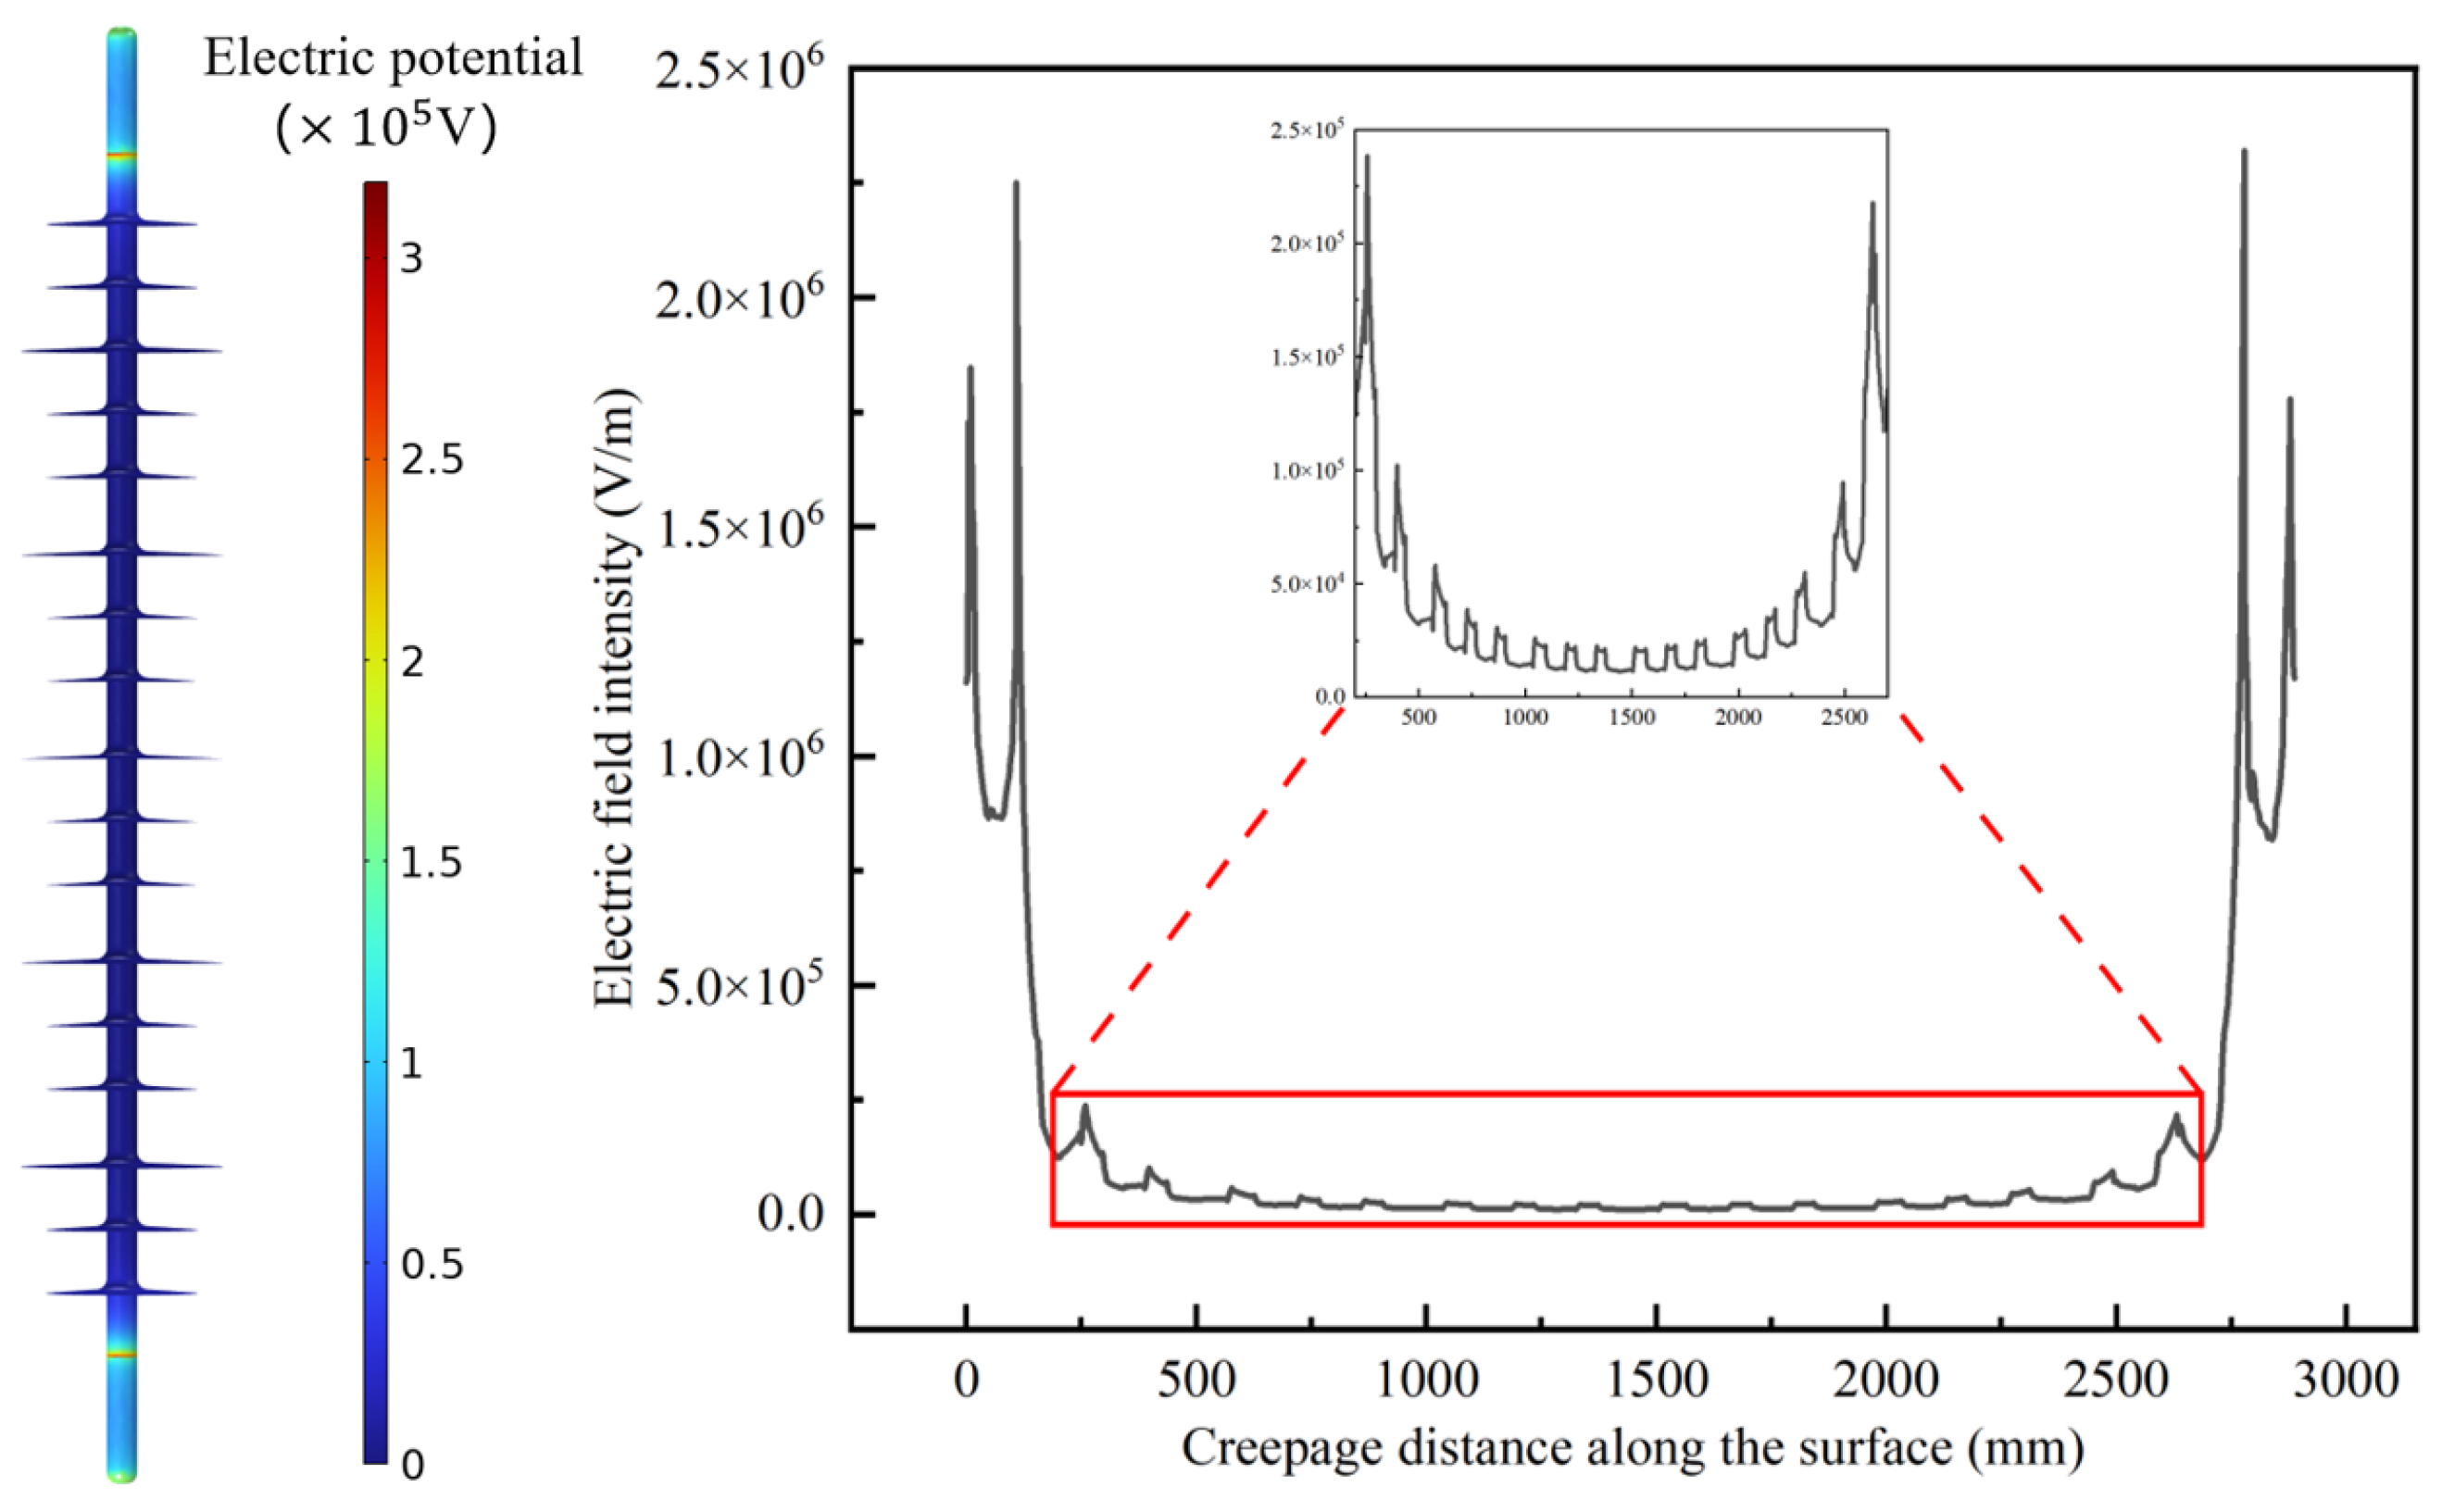
In order to compare with the insulators under the influence of wind and sand flows, the potential and electric field distribution of insulators under a clean environment are first calculated. As shown in Figure 5 and Figure 6 below for the distribution of insulator potential under a clean environment, the distribution of potential is relatively stable, uniformly distributed along the umbrella skirt, the surface potential is decreasing in steps, and the insulator surface isotropic line is more regular, approximate and geometric in shape. As shown in Figure 7 and Figure 8 for the distribution of the electric field under a clean environment, the electric field along the surface of the insulator is in a “U”-shaped distribution, with the field strength distribution for the two sides of the large, and small in the middle. The maximum electric field strength is concentrated in the umbrella skirt and the metal fittings connected to parts of the vicinity, about 2.32 × V/m. This is due to the electric field lines from the high-voltage end of the point to the grounding end of the electric field lines near the two ends of the concentration, resulting in an electric field distribution where the field is stronger at both ends and weaker in the middle. As the potential of the grounding end is zero, the electric potential is largest in the area close to the grounded metal fitting, forming an electric field concentration area.
Figure 5.
Potential distribution along the insulator surface in a clean environment.
Figure 6.
Electric field distribution along the insulator surface in a clean environment.
Figure 7.
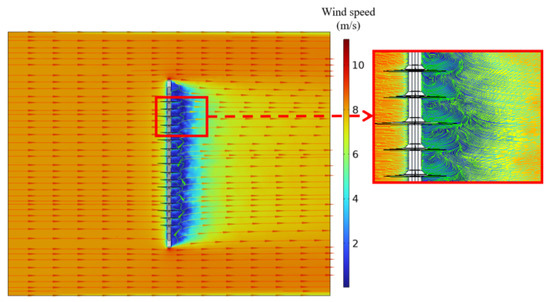
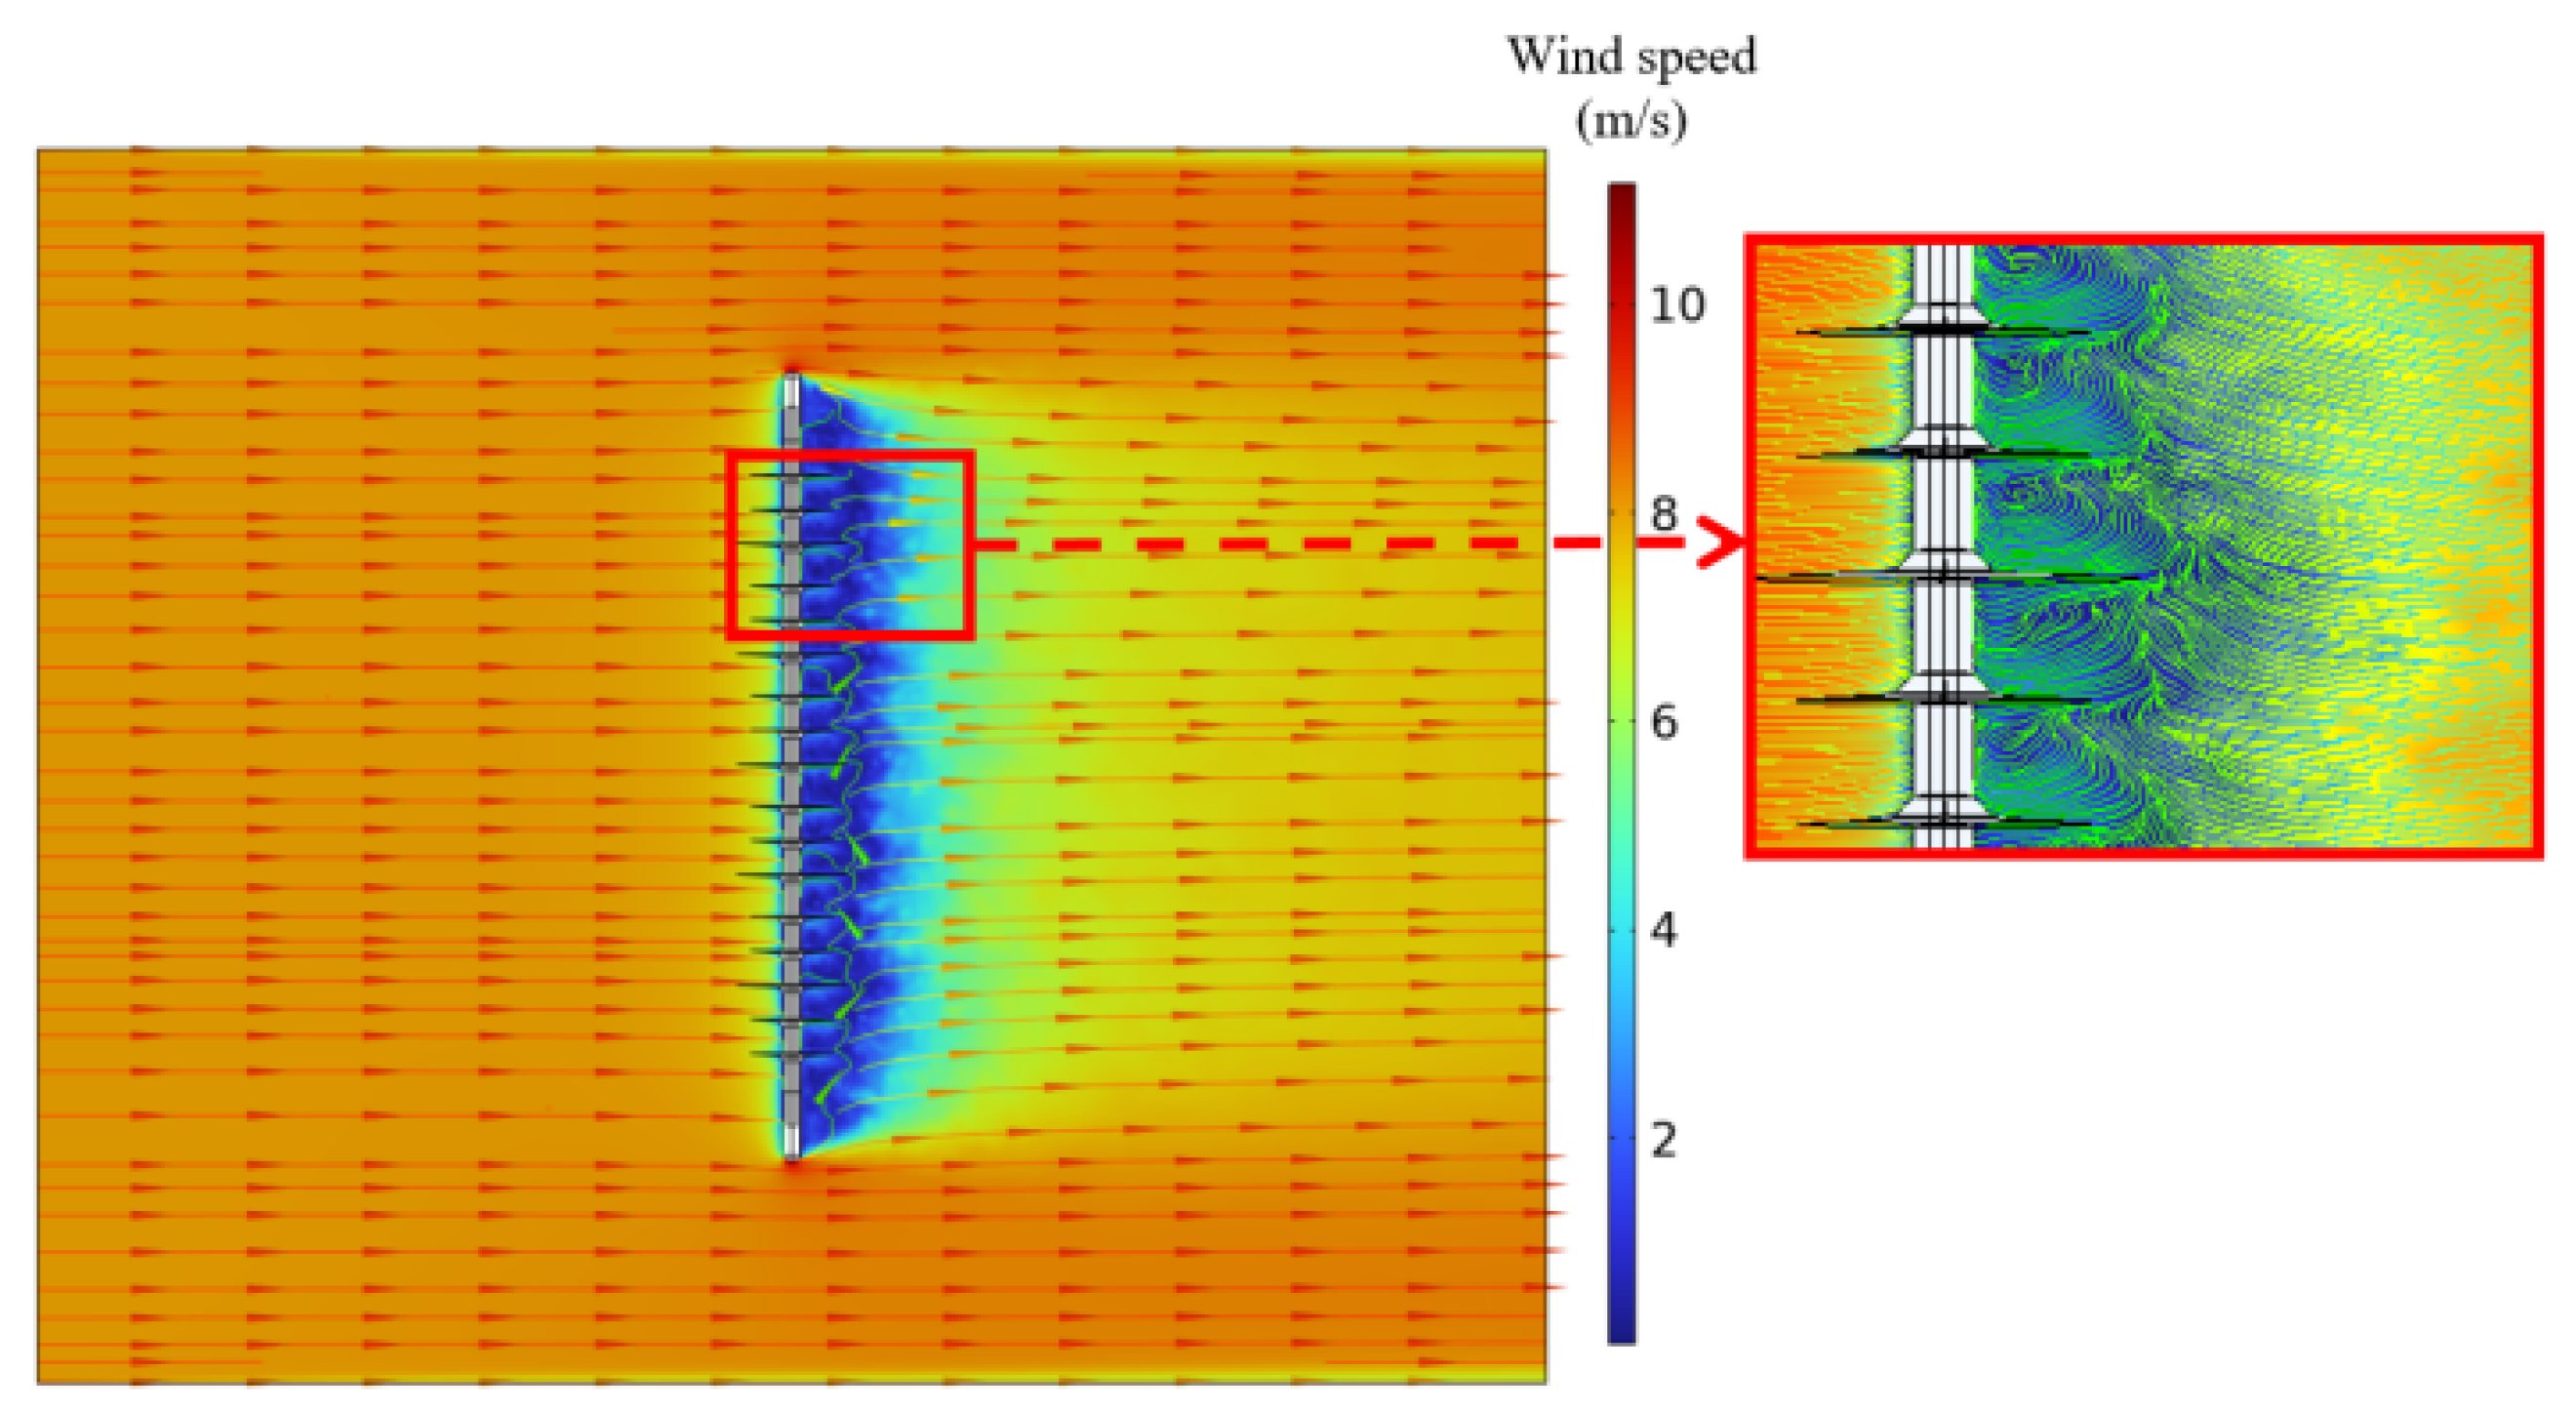
Wind velocity streamlines as sand flows through insulators.
Figure 8.
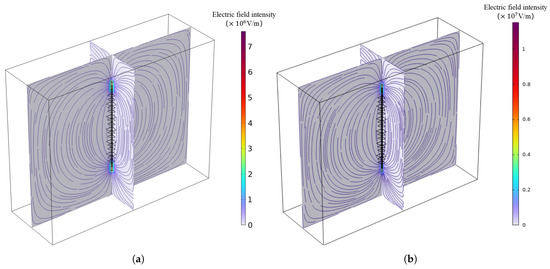
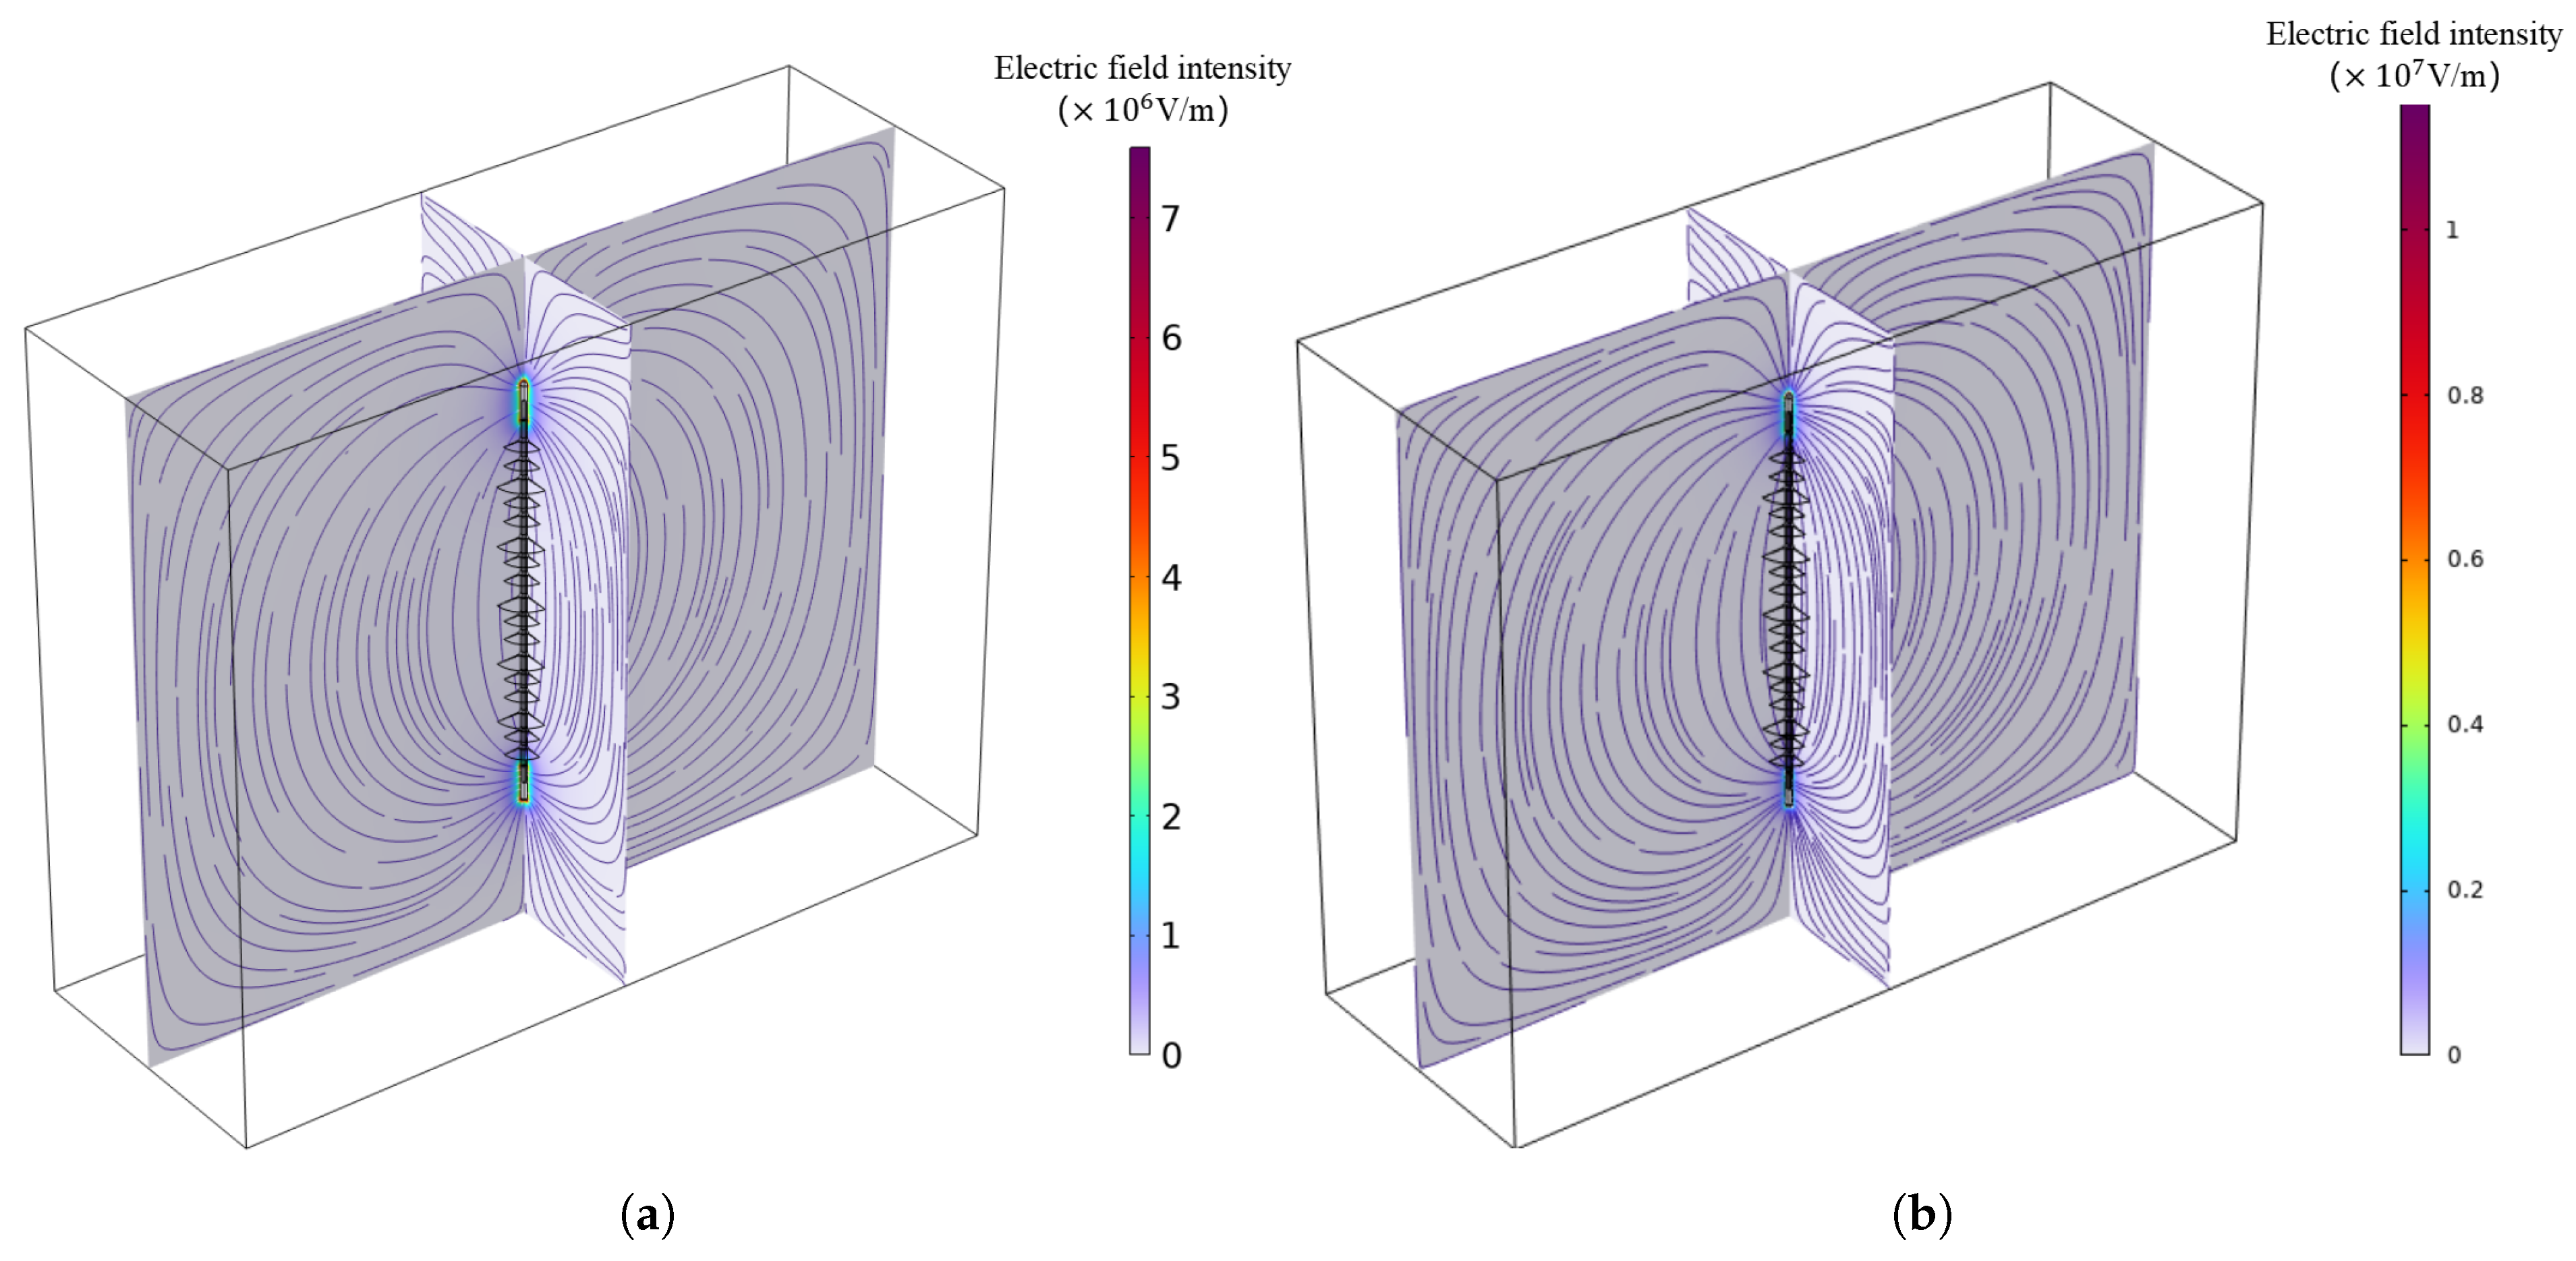
Multi-slice plot of electric field distribution in different environments. The slices are taken at equally spaced positions along the insulator axis, revealing the three-dimensional electric field distortion. Under clean conditions (a), the field is symmetrically distributed and concentrated near the high-voltage end. Under wind-sand flow (b), the field becomes asymmetric: the high-field region shrinks near the HV end but expands and intensifies near the grounded end, visually confirming the charge migration and accumulation mechanisms. (a) Clean environment. (b) Wind and sand environment.
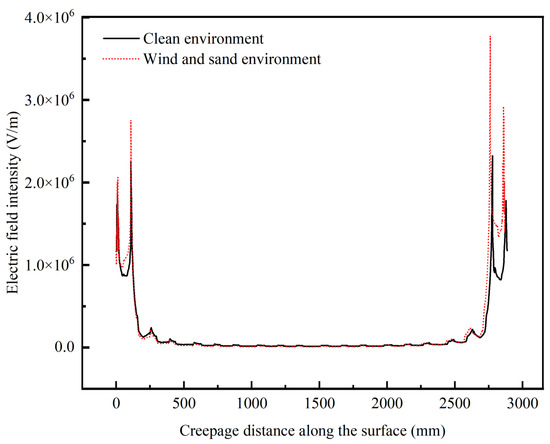
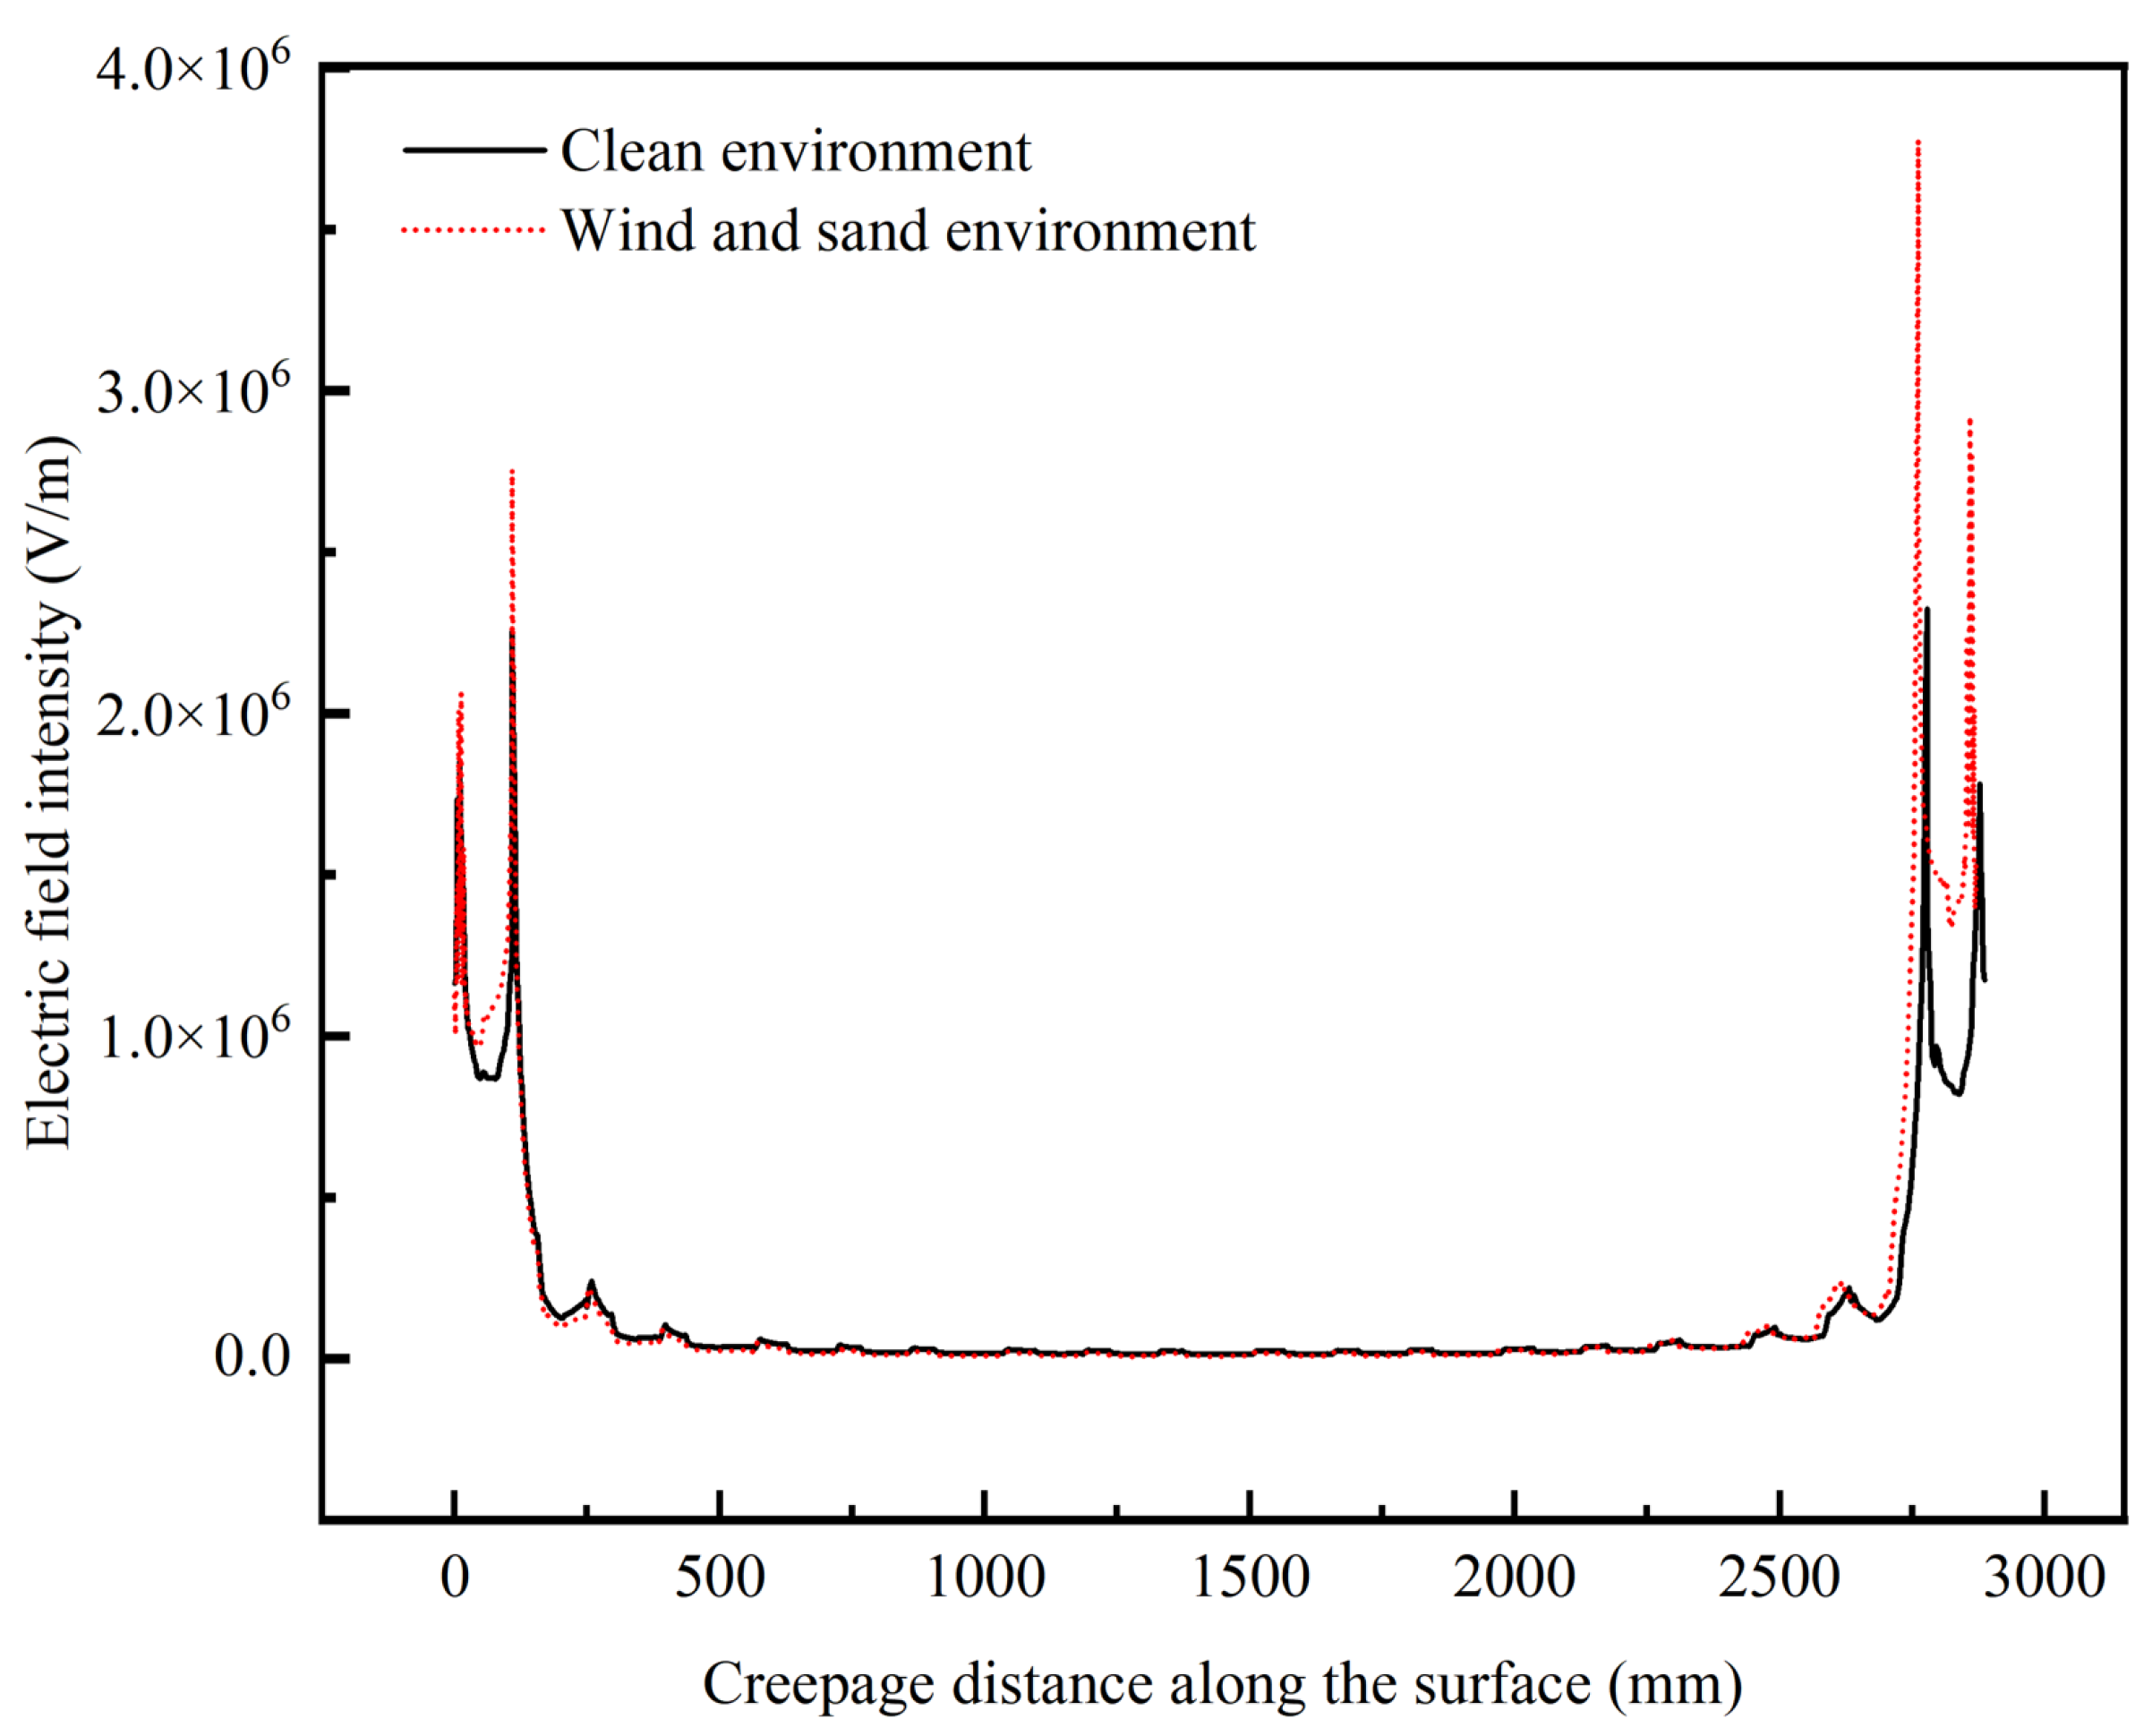
As shown in Figure 7 the wind-sand fluid with a flow rate of 10 m/s, particle size of 100 μm, and sand concentration of 2.65 g/m3 is added to the space around the insulator. Under the influence of the wind-sand flow, the medium around the insulator is changed from a pure air medium to a mixed medium of air and sand, and the insulator surface deposes inhomogeneous sand and dust, and the sand particles in air generate electric charges by collision and friction and by the sand particles in the insulator’s electric field, which affects the electric field distribution around the insulator. The sand particles in the air generate electric charge under the action of friction and sand particles in the electric field of the insulator, forming charged particles, affecting the electric field distribution around the insulator. As shown in Figure 8 and Figure 9, under the influence of the wind and sand environment, the electric field along the surface of the insulator as a whole becomes larger, and the maximum along the surface of the electric field increases by about 62.13%; the wind and sand have a larger aberration of the electric field along the surface of the insulator.
Figure 9.
Comparison of electric field distribution along the surface in clean and sandy environments. Curve diagram: The electric field intensities were compared in a clean environment and a sandy environment. The black curve represents the situation in an environment without sand and dust. The red dotted curve represents the situation in an environment with sand and dust. When there is sand and dust, the surface electric field of the insulator increases overall compared to the situation without sand and dust.
4.2. Effect of Wind Speed on the Electric Field Along the Insulator Surface
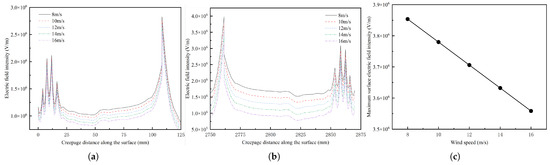
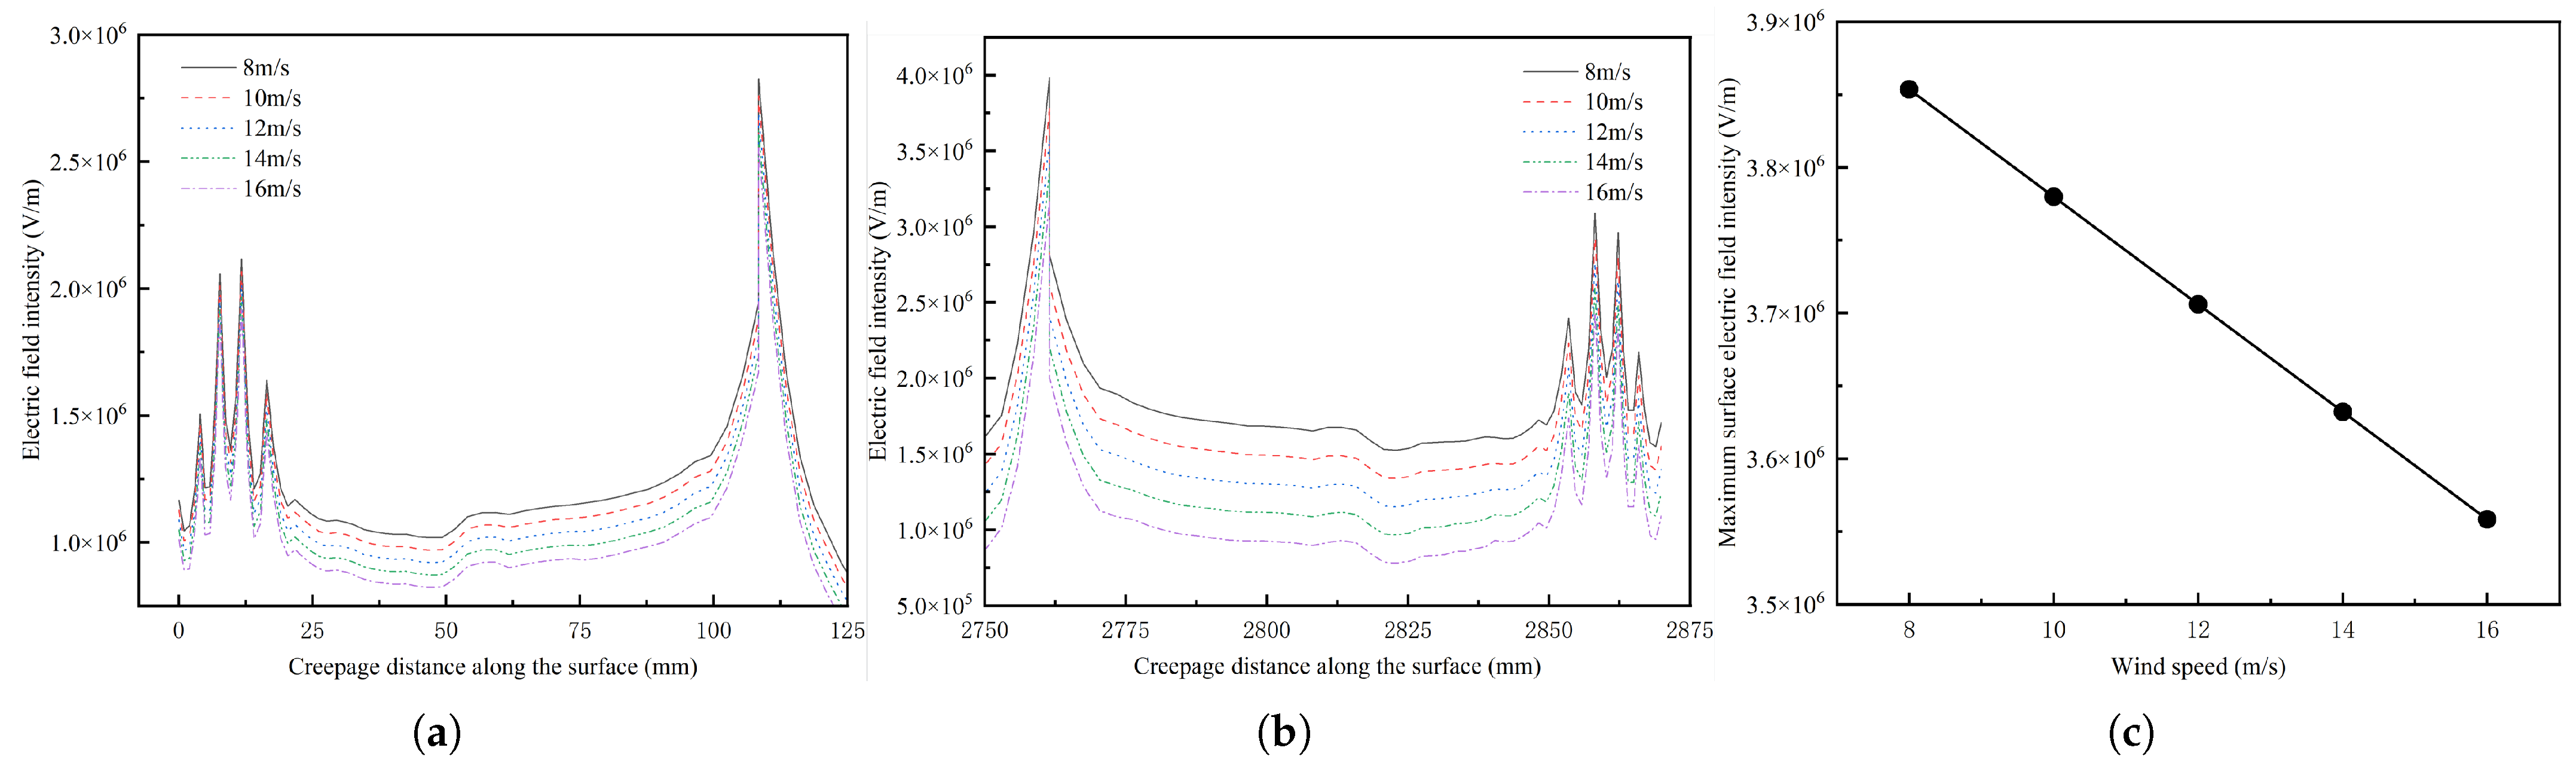
Since wind speed is one of the important parameters to measure the wind-sand flows, this paper investigates the effect of wind speed on the electric field along the insulator surface according to the wind speed range (8–16 m/s) of the transmission line insulator height affected by wind-sand in the actual project. As shown in Figure 10 below, in this wind speed range, the electric field along the insulator surface shows an overall decreasing trend with the increase in wind speed. This agrees with the literature [7] where the flashover voltage decreases due to the air blowing effect when the wind speed increases. At the same time, the maximum electric field strength decreases almost linearly with the wind speed, and for every 2 m/s increase in wind speed, the maximum electric field strength decreases by about 2–3%.
Figure 10.
Diagram showing the variation of surface electric field strength of composite insulators under different wind speeds. (a) Near the high-pressure end. (b) Near the grounding terminal. (c) Maximum electric field intensity.
The observed decrease in the surface electric field with increasing wind speed is governed by two competing mechanisms: particle charging enhancement versus particle deposition suppression.
The higher wind speed promotes triboelectric charging. The increased collision frequency and impact energy between the particles and the insulator surface increase the average charge per particle. In isolation, this effect would intensify space charge density and exacerbate electric field distortion.
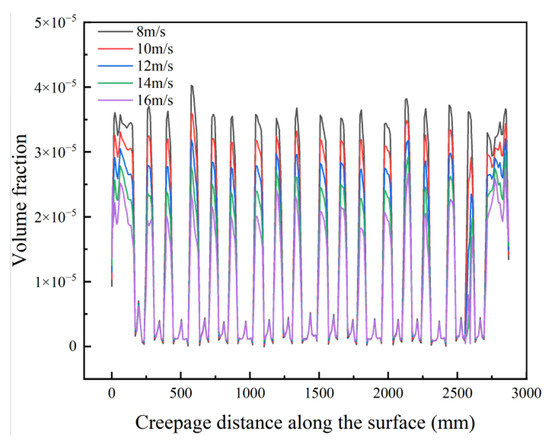
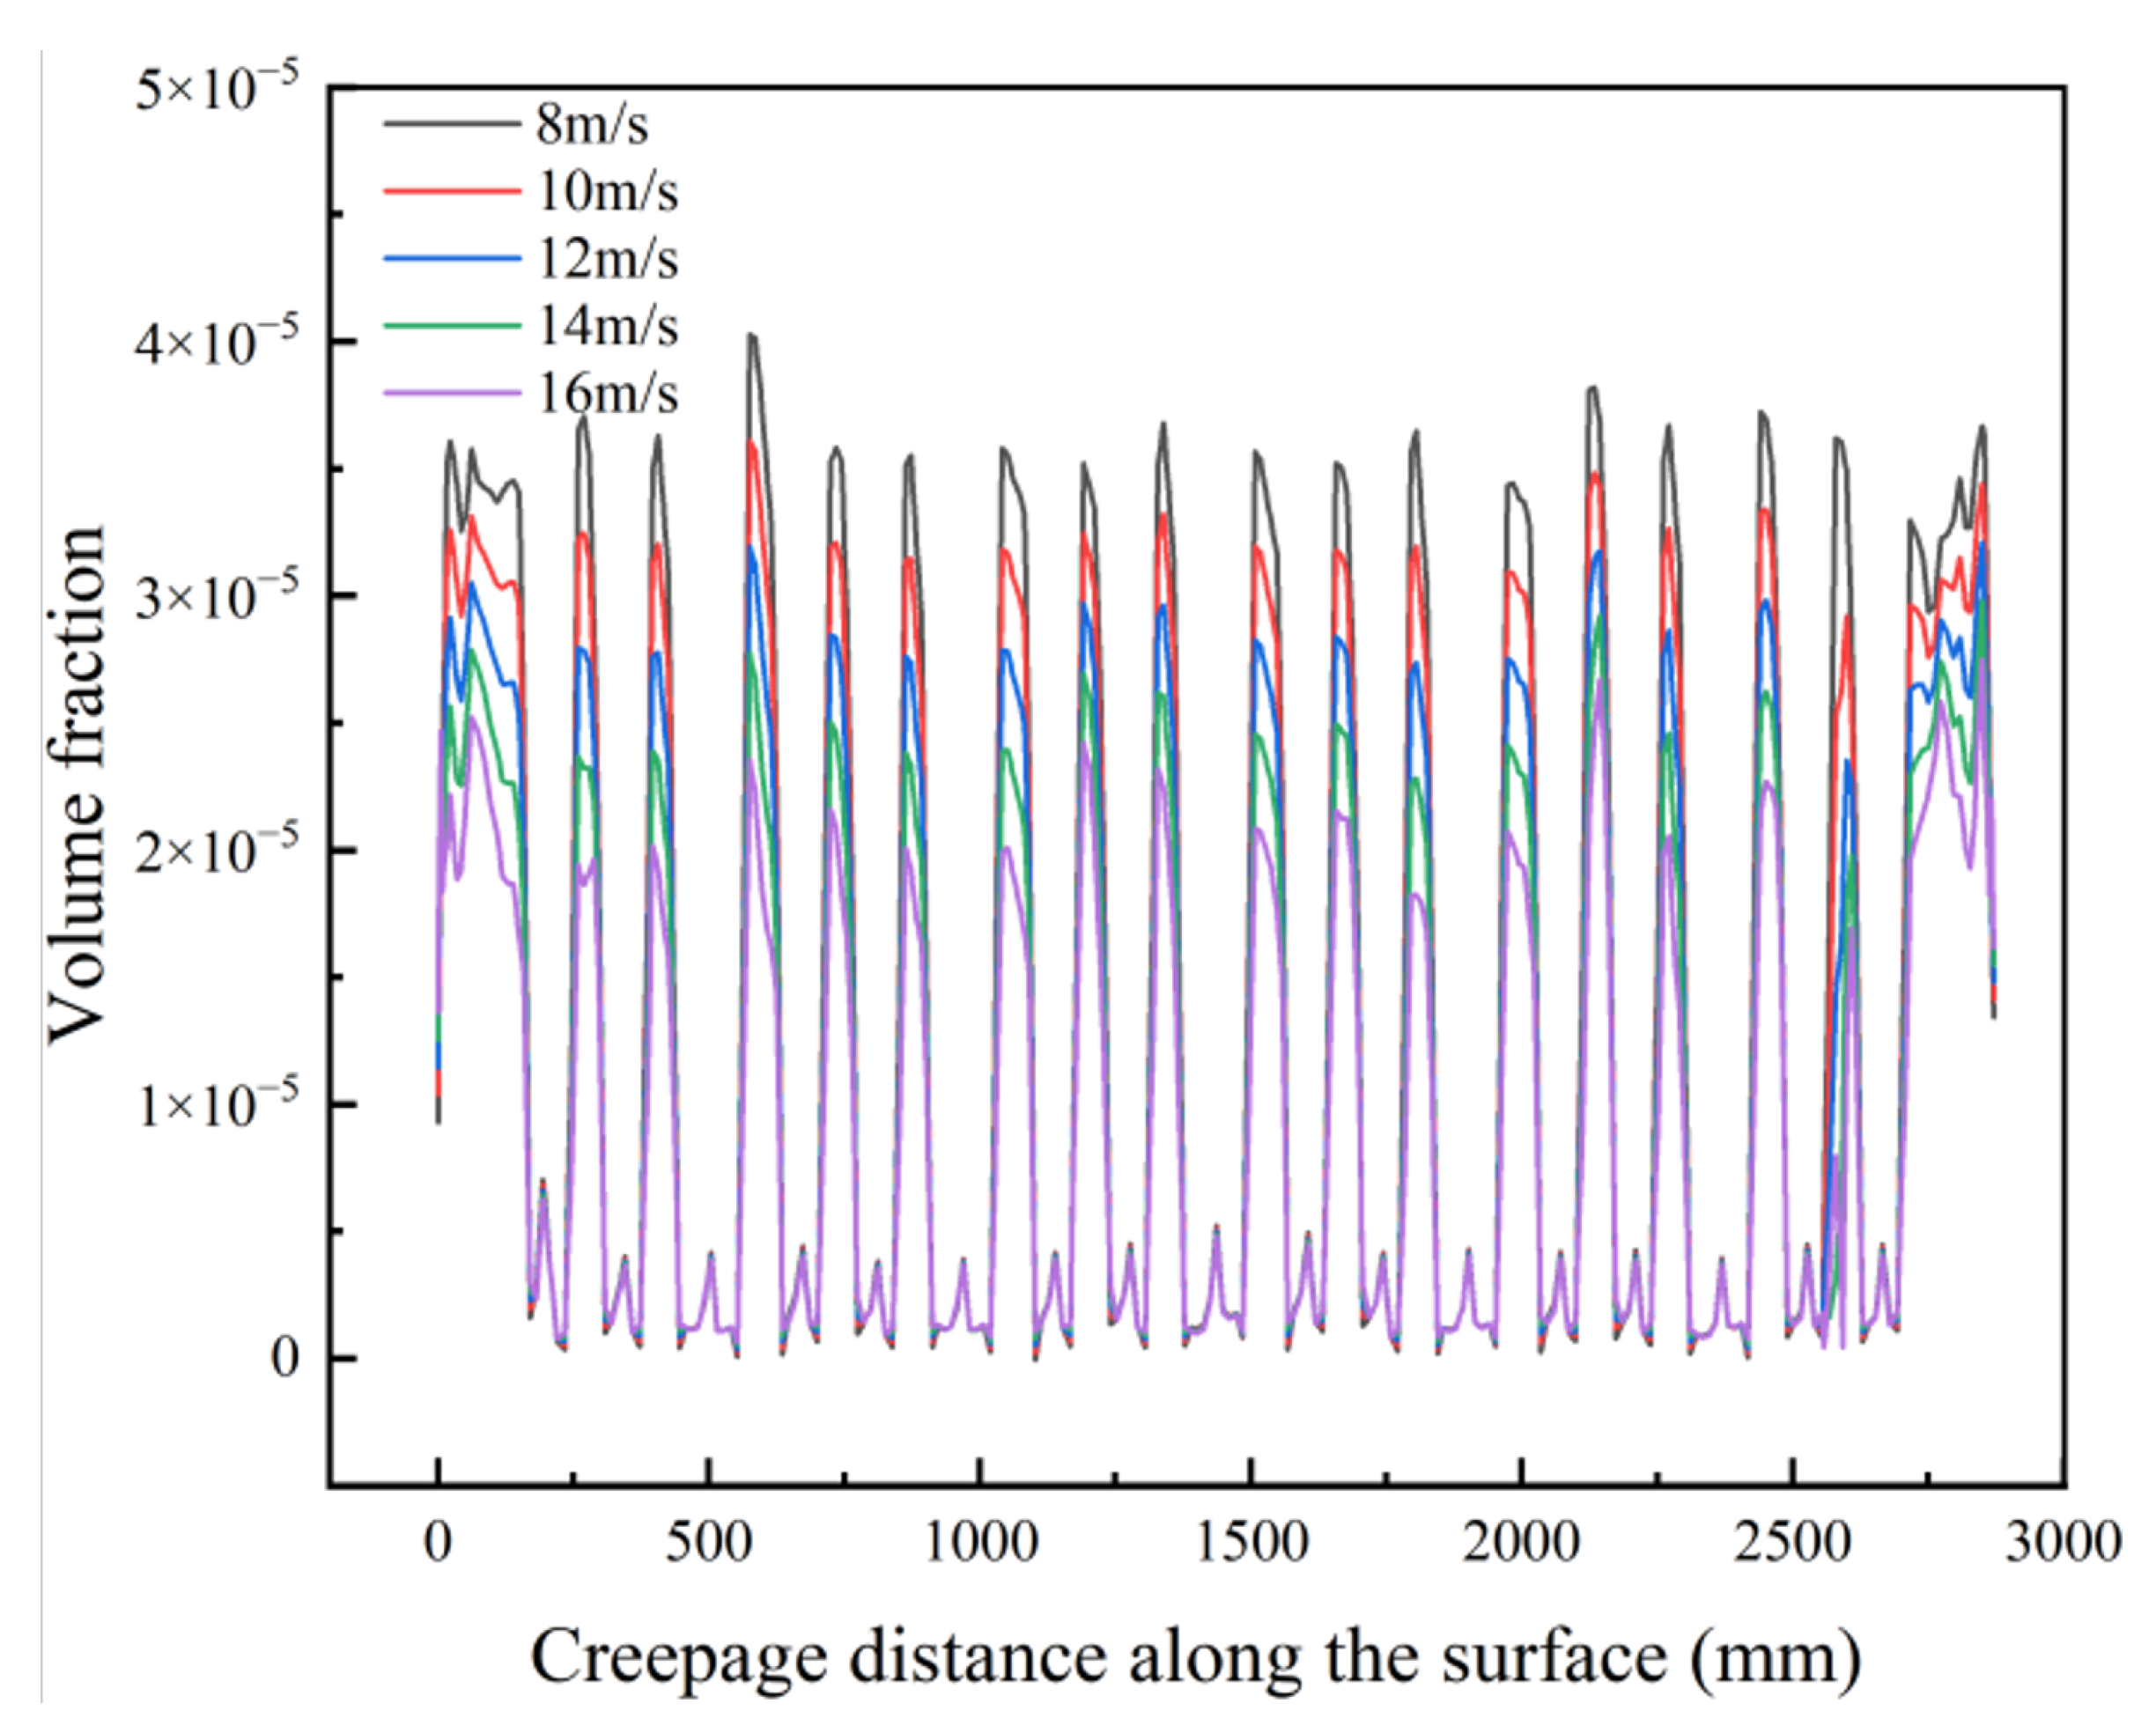
However, higher wind speed also suppresses particle deposition. Enhanced particle inertia and near-wall turbulence reduce the deposition rate and residence time of sand particles on the insulator surface. As quantitatively demonstrated in Figure 11, the particle volume fraction on the windward side decreases monotonically and substantially with increasing wind speed.
Figure 11.
Distribution of sand particle volume fraction along the windward side of the insulator under different wind speeds (8–16 m/s): The volume fraction decreases significantly with increasing wind speed, indicating that higher wind velocities enhance particle inertia and reduce particle accumulation on the insulator surface. The peak volume fraction occurs near the high-voltage end (0–500 mm), where flow stagnation and electric field force jointly promote particle deposition.
Within the investigated wind speed range (8–16 m/s), deposition suppression is the dominant mechanism. The dramatic reduction in the number of deposited particles overwhelmingly outweighs the moderate increase in charge per particle. Consequently, the space charge density decreases, leading to a weaker source term in Poisson’s equation, reducing the overall field distortion, lower surface roughness and fewer protruding charged particles, mitigating the micro-tip enhancement effect.
In summary, under typical sandstorm conditions, the suppression of particle deposition is the rate-controlling mechanism governing the electric field response to wind speed. The secondary effect of enhanced tribocharging is insufficient to offset this primary reduction in deposited particle mass.
4.3. Effect of Sand and Dust Concentration on the Electric Field Along the Insulator Surface
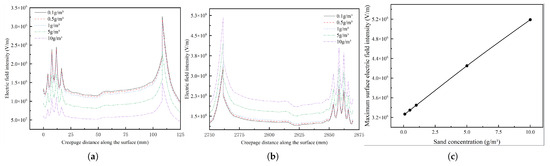
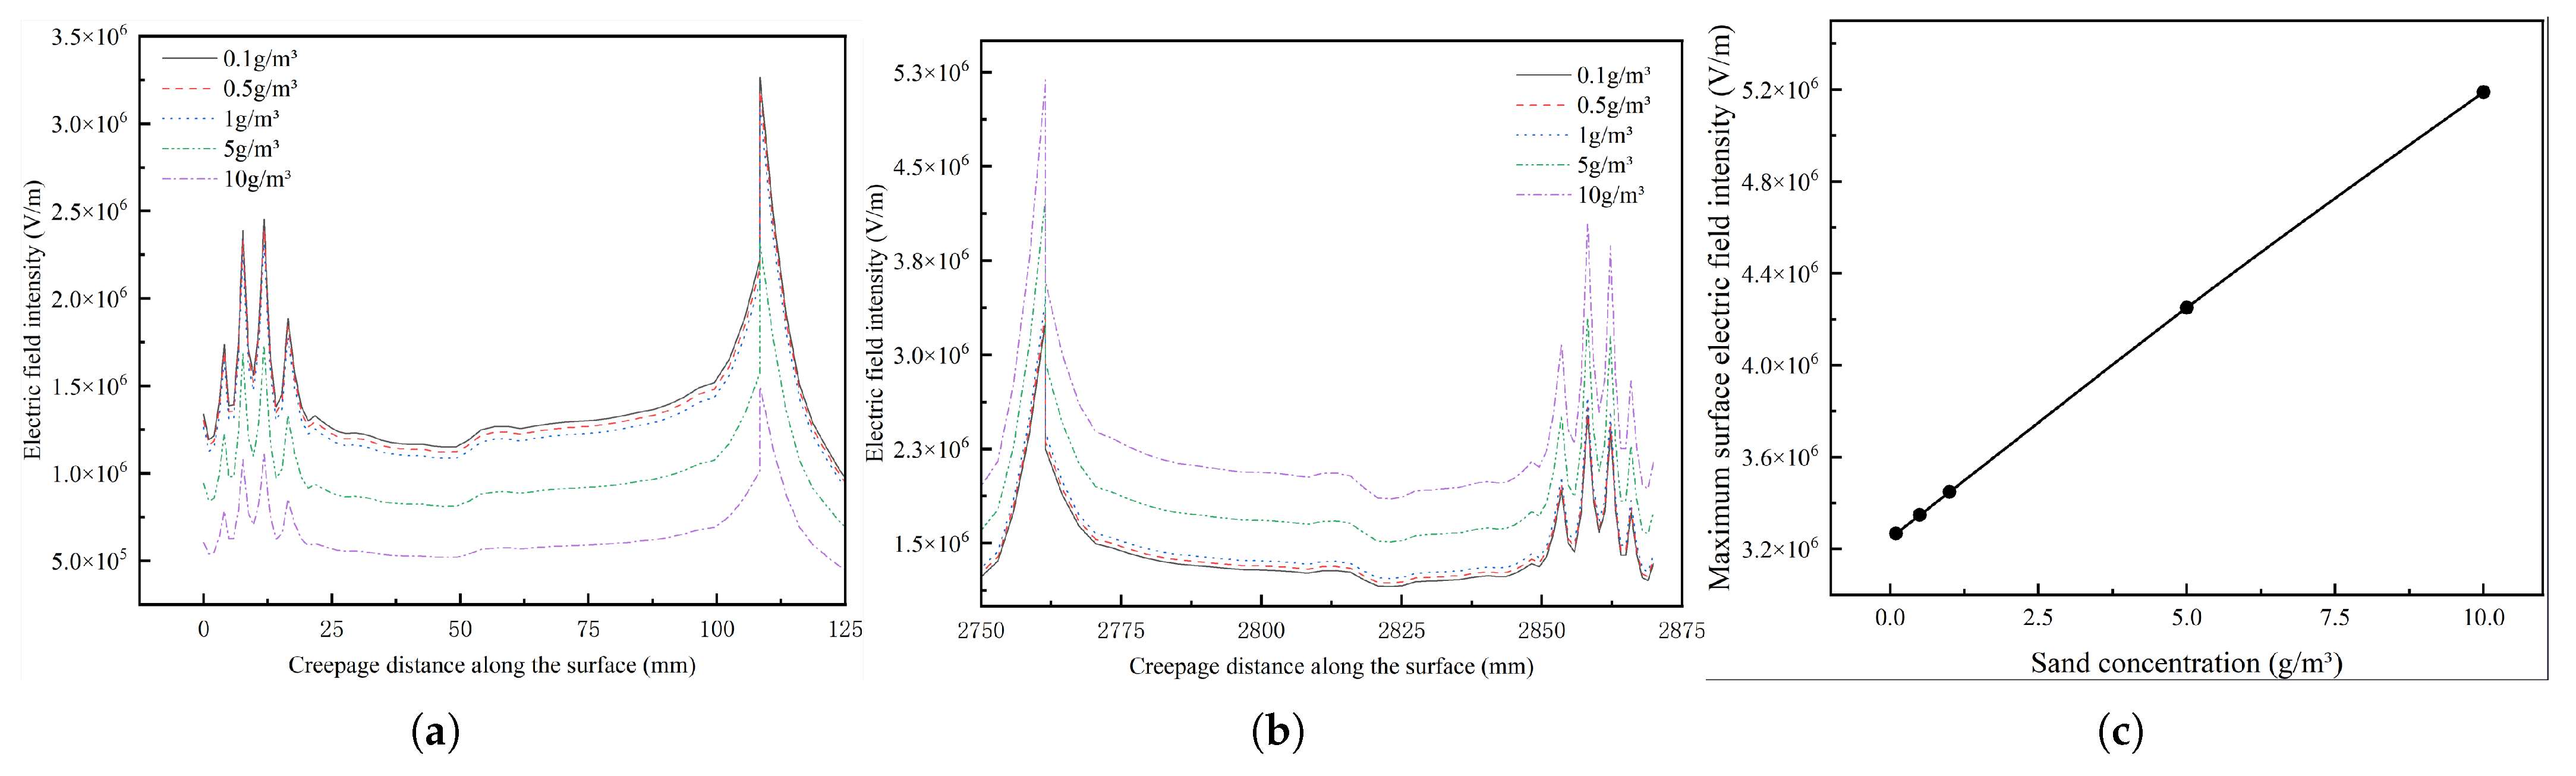
In this study, we change the volume fraction of sand dust in space to realize the density and sparseness of sand dust concentration; the value of sand dust concentration is taken in the range of 0.1–10 g/m3, and the corresponding volume fraction is taken in the range of about 3.774 × –3.774 × . As shown in the following Figure 12, as the sand concentration increases, the electric field strength of the insulator near the high-voltage side rises, and the electric field strength near the low-voltage side decreases, and the larger the insulator concentration rises, the larger the electric field rises. This is consistent with the findings in the literature [8]. In this range, the maximum field strength of the insulator shows an almost linear increase with the sand concentration, at 0.1 g/m3, the maximum electric field strength is about 6.52 × V/m, which is about 40.75% higher than that in the clean environment, and at 10 g/m3, the maximum electric field strength is as high as 1.02225 × V/m, which is 120.68% higher than that in the clean environment. The rise is large, the insulator distortion increases, the flashover voltage decreases, and the safe operation of the insulator is a hidden danger.
Figure 12.
Diagram showing the variation of surface electric field strength of composite insulators under different dust concentrations. (a) Near the high-pressure end. (b) Near the grounding terminal. (c) Maximum electric field intensity.
The influence of sand concentration on the electric field exhibits strong spatial asymmetry: increasing concentration reduces the field at the high-voltage end but enhances it at the grounded end. This bidirectional effect is governed by the electric field-driven migration of positively charged particles and the resulting redistribution of space charge.
Particle charging and polarity: Under wind-sand flow conditions, particles acquire positive charge through triboelectric interactions with each other and with the insulator surface. This polarity is consistent with the triboelectric series of sand (silica) relative to silicone rubber.
Electrophoretic migration: In the insulator’s electric field, a positively charged particle experiences a Coulomb force directed from the high-voltage end toward the grounded end. This force drives a net migration of positive space charge along the field direction.
Consequence at the high-voltage end: Field reduction and shielding. At the high-voltage end, positively charged particles are electrophoretically repelled or swept away. This results in lower space charge density. It is diminished, weakening the source term in Poisson’s equation. Electrostatic shielding: The remaining positively charged particles on or near the surface create a depolarization field opposing the applied field, further attenuating the local electric field intensity. The net effect is a monotonic decrease in the peak field at the high-voltage end with increasing concentration.
Consequence at the grounded end: Accumulation and field intensification. The same electrophoretic force that cleans the high-voltage end transports positively charged particles toward the grounded end. Here they accumulate, leading to a thicker contamination layer. Increased particle deposition raises the surface conductivity and compresses the equipotential lines. Elevated space charge density: Local accumulation of charged particles intensifies the field distortion. Positive feedback: The intensified field attracts more charged particles via electrophoresis, creating a self-amplifying loop. This feedback mechanism explains the accelerating, nonlinear increase in grounded-end field strength with concentration.
In summary, sand concentration acts as an amplifier of the spatial asymmetry inherent to the system. It does not create the asymmetry—that is determined by the polarity of particle charge and the direction of the electric field. Rather, concentration governs the magnitude of the asymmetry by controlling the available charge mass. This distinction is essential for correctly interpreting the seemingly counterintuitive observation that “more sand” can either weaken or strengthen the electric field depending on location.
4.4. Effect of Sand Particle Size on the Electric Field Along the Insulator Surface
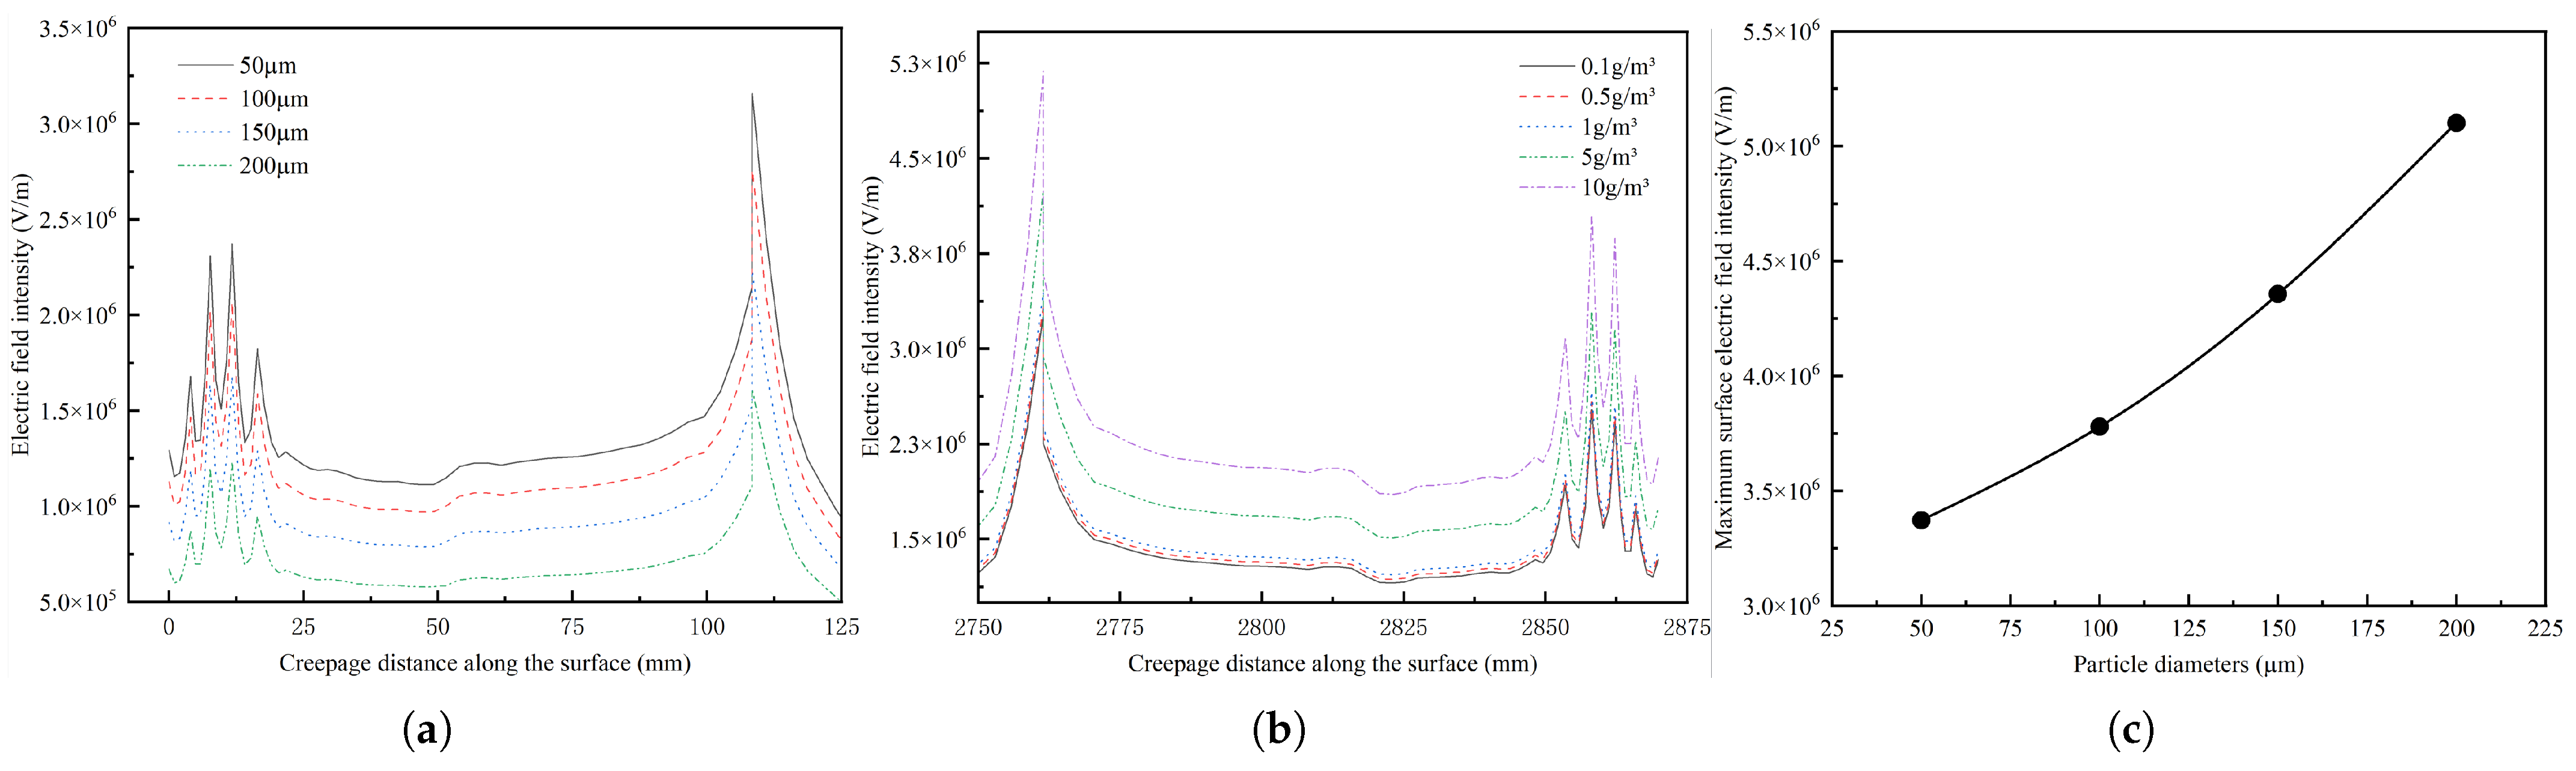
When considering the effect of sand particle size, the volume fraction of the dispersed phase should be increased accordingly when the sand particle size increases, in order to ensure that the number of sand particles in the space remains unchanged when the sand particle size increases. In the range of 50 μm to 200 μm, as shown in Figure 13 below, the field strength along the surface of the insulator near the grounded end increases with the increase in sand particle size, while the field strength along the surface near the high-voltage end decreases. This is consistent with the findings in the literature [8]. The maximum field strength along the surface of the insulator increases nonlinearly with the increase in the grain size, and its increasing trend is stronger and stronger. At 50 μm, the maximum electric field strength is about 6.73 × V/m, which is about 45.25% higher than that in the clean environment, and at 200 μm, the maximum electric field strength is as high as 1.0086 × V/m, which is 117.66% higher than that in the clean environment, and the increase was significant.
Figure 13.
Diagram showing the variation of surface electric field strength of composite insulators under different sand particle sizes. (a) Near the high-pressure end. (b) Near the grounding terminal. (c) Maximum electric field intensity.
The influence of particle diameter on the electric field distribution exhibits pronounced spatial duality: increasing particle size reduces the field at the high-voltage end but enhances it at the grounded end. This bidirectional effect arises from two concurrent but mechanistically distinct processes: electrophoretic migration and polarization-induced shielding.
Electrophoretic migration: Particle size directly governs two pre-deposition properties. Triboelectric charge: the saturated charge limit of a particle scales with surface area. Larger particles carry substantially more charge. Gravitational settling: Larger particles experience stronger gravitational force, increasing their collision probability with the insulator surface. In the insulator’s electric field, a positively charged particle experiences a Coulomb force directed from the high-voltage end toward the grounded end. Because both and the response to E increase with particle size, larger particles are more strongly driven along the field direction. This leads to size-selective electrophoretic sorting. At the high-voltage end: Larger particles are efficiently repelled or swept away. Their deposition is inhibited, resulting in lower local particle concentration and a thinner contamination layer. At the grounded end: Larger particles are preferentially transported to and retained at the low-potential region, where they accumulate and form a thicker, more conductive deposition layer. This migration mechanism directly explains the opposing trends at the two ends: the high-voltage end experiences field reduction due to depletion of large charged particles, while the grounded end experiences field enhancement due to accumulation.
Polarization-induced shielding: Independent of migration, deposited large particles at the high-voltage end produce a local electrostatic shielding effect through dielectric polarization. When large particles are deposited on or near the high-voltage end surface—where the external field is strongest—their strong depolarization fields superimpose to create a macroscopic shielding layer. This layer attenuates the external field before it reaches the insulator surface; reduces the tangential field component along the creepage path; lowers the peak electric field at and immediately downstream of the high-voltage end.
Critically, this shielding effect is unique to large particles. Small particles, even when deposited in large numbers, produce negligible depolarization fields due to their scaling disadvantage.
In summary, particle size influences the electric field through two parallel pathways. Electrophoretic migration causes size-selective spatial redistribution, depleting the high-voltage end and enriching the ground end. Polarization shielding provides additional, localized field attenuation at the high-voltage end that scales strongly with particle diameter. Together, these mechanisms explain both the magnitude and the spatial asymmetry of the size effect.
5. Conclusions
In this paper, by establishing the Eulerian two-fluid field–electrostatic field coupling model of the composite insulator of the transmission line under the influence of wind and sand flow, we simulated and investigated the influence of wind and sand flow on the electric field when passing through the insulator, and obtained the following conclusions:
- (1)
- Composite insulators along the surface of the potential are in a step-like decreasing distribution. Along the surface of the electric field, it is large at both ends, and in the middle of the small "u"-shaped distribution, the maximum electric field strength is concentrated in the umbrella skirt and the metal fixture connection parts of the vicinity; composite insulators along the surface of the potential of the insulator along the surface of the insulator wind and sand flow through the insulator of the transmission line will lead to insulators along the surface of the electric field rising.
- (2)
- For wind speeds in the range of 8–16 m/s, the surface electric field along the insulator decreases as the wind speed increases.
- (3)
- For sand concentrations in the range of 0.1–10 g/m3, as the concentration increases, the surface electric field near the high-voltage end decreases, while it increases near the grounded end. Higher sand concentrations are more detrimental to the insulator’s performance.
- (4)
- For particle sizes in the range of 50 μm–200 μm, an increase in particle size leads to a decrease in the surface electric field near the high-voltage end and an increase near the grounded end.
- (5)
- When the concentration of dust or the particle size of the dust is high, the corresponding level of dust pollution is severe, and it has a significant impact on the surface electric field of the insulator. The distortion of the electric field intensifies, which may lead to corona discharge, local arcs, or even flashover accidents. At this time, measures such as using anti-flashover-type insulators, regular maintenance and cleaning, setting up ventilated sand barriers, increasing insulation redundancy, and formulating emergency plans for flashover can be adopted for prevention.
This study has several limitations that suggest directions for future research:
- (1)
- The current model assumes a constant charge per particle; a dynamic triboelectric charging model incorporating particle size, impact velocity, and material work function will be developed to better represent the physical charging process.
- (2)
- The effect of relative humidity on both particle electrification and surface flashover will be explicitly modeled, enabling the simulation of realistic contamination and wetting conditions.
- (3)
- By introducing extreme conditions, the boundaries of research and its application value are expanded, for instance, the superposition of complex environments and how the attachment of sand particles affects the formation of water films, thereby intensifying the distortion of the electric field.
- (4)
- By using the already studied numerical models, the system conducts a comprehensive study on the anti-interference ability of the surface electric field distribution under different umbrella skirt shapes, umbrella spacing, pole diameters and other structural parameters in a sandy environment. Optimal solutions are proposed from the perspective of structural design for sandy areas.
Author Contributions
Conceptualization, L.H.; Methodology, J.Y.; Software, J.Y.; Validation, J.Y.; Formal analysis, J.Y.; Investigation, J.Y.; Resources, L.H.; Data curation, J.Y.; Writing—original draft, J.Y.; Writing—review & editing, L.H., J.Y. and Y.Z.; Visualization, J.Y.; Supervision, L.H.; Project administration, L.H.; Funding acquisition, L.H. All authors have read and agreed to the published version of the manuscript.
Funding
This research received no external funding.
Data Availability Statement
The raw data supporting the conclusions of this article will be made available by the authors on request.
Conflicts of Interest
The authors declare no conflicts of interest.
References
- Zhang, L.; Song, G.Y.; Fan, F.; Wu, H.; Zou, Y.H.; Zhou, Z.H.; Zhang, X.; Gao, S.B. Diagnosis of sandstorm weather process and analysis of sand pollution transportation in northern China from 14th to 16th, March 2021. Acta Sci. Circumstantiae 2022, 42, 351–363. [Google Scholar]
- Cheng, X.Y.; Xu, Z.W.; Yu, Y.; Zhang, X.X. Changes in frequency and possible causes of dust occurrence in northern China and Mongolia since 2001 revealed by remote sensing. J. Desert Res. 2025, 45, 47–60. [Google Scholar]
- Hanman, D.L. Super dust storm hits northern China. Ecol. Econ. 2021, 37, 9–12. [Google Scholar]
- Liu, J.; Wang, J.; Liang, M.; Liu, Y.P.; Huang, Z.C.; Li, X.C.; Geng, J.H.; Liu, J.X. Experimental Study on Influence of Dust Storm Weather on Power Frequency Breakdown Voltage of Line-board Gap Under High Altitude. Insul. Mater. 2022, 55, 99–106. [Google Scholar]
- Sun, C.M.; Zhang, Z.Q.; Fan, C.; Kang, Y.Q.; Zhang, X.Q.; Guo, Y.J. Study on Flashover Characteristics and Mechanism of Insulator in Wind-sand Environment. High Volt. Appar. 2021, 57, 182–188. [Google Scholar]
- Hu, W.W.; Xie, L.; Zheng, X.J. Simulation of the electrification of wind-blown sand. Eur. Phys. J. E 2012, 35, 22. [Google Scholar] [CrossRef] [Scilit]
- Sima, W.X.; Cheng, H.; Yang, Q.; Yuan, T.; Yang, M.; Ye, X. AC Flashover Performance and Mechanism of Insulator in Wind Sand Environment. High Volt. Eng. 2011, 37, 834–840. [Google Scholar]
- Li, Y.Z.; Yang, G.H.; Wu, H.; Kang, W.J.; Xiang, Z.H.; Liu, S.T.; Zhang, J.H.; Zhao, Y.Q. The variation law of surface potential and electric field of porcelain insulator in suspended sand and dust environment. Insul. Mater. 2023, 56, 87–93. [Google Scholar]
- Tang, Q.M.; Gao, Q. Influence of Wind Sand Flow on Potential and Electric Field Distributions Along High Voltage Insulators. Chin. J. Comput. Phys. 2016, 33, 539–546. [Google Scholar]
- Mao, D.; Tang, Q.M.; Gao, Q. Distribution Characteristics of Electric Potential and Electric Field along HV Insulators under Non-uniform Contamination. Chin. J. Theor. Appl. Mech. 2020, 55, 698–706. [Google Scholar]
- Zheng, W.G.; Ma, Y.L.; Geng, L.A.; Zhang, Z.R.; Tang, H.; Fan, Q.R. Identification of Deteriorated Porcelain Insulators for Transmission Lines Based on Electric Field Distribution Measurement Method. J. Electron. Mater. 2025, 54, 4874–4881. [Google Scholar] [CrossRef] [Scilit]
- Fang, Z.Y.; Hao, J.P.; Wu, H.; Wu, B.; Yang, K. Influence of grading ring type and structure on electric field distribution of 220 kV composite insulator. Insul. Mater. 2023, 56, 51–61. [Google Scholar]
- Wang, S.H.; Wang, J.J.; Zhao, L.; Chen, L. Influence of Pollution Components on Surface Electric Field of Composite Insulators. Electr. Power 2021, 54, 149–157. [Google Scholar]
- Liu, S.L.; Li, W.D.; Li, Z.X.; Pan, L.Y. Influence of Water Band on AC Flashover Characteristics and Electric Field Distribution of Hydrophobic Surface. Trans. China Electrotech. Soc. 2022, 37, 5570–5577. [Google Scholar]
- Lü, Y.K.; Wang, J.W.; Song, Q.Z.; Liu, Y.P. Effect of Water Drop on Electric Field Distortion of Composite Insulator. Power Syst. Technol. 2021, 45, 1201–1207. [Google Scholar]
- Lu, M.; Gao, C.; Yang, Y.C.; Li, L.; Sheng, C.B.; Zhang, S.Y. Effect of bird pecking damage on operation performance of composite insulator. Insul. Mater. 2024, 57, 113–120. [Google Scholar]
- Li, D.; Liu, Y.G.; Wang, J. Influence of surface contamination on electric field distribution of insulators. J. China Railw. Soc. 2025, 47, 367–379. [Google Scholar] [CrossRef] [Scilit]
- Shi, L.; Wang, Y.Z.; Han, F.; Xue, C.X. Numerical Simulation of Effect of Wind Direction on Wind-Sand Flow Field Around Cutting. Chin. Phys. B 2025, 47, 131–137. [Google Scholar]
- She, X.; Ren, X.T.; Yao, Z.Q.; Zhao, J. Analysis on Parameter Sensitivity in Euler-Euler Model for Wind Blow Sand. Meteorol. Disaster Reduct. Res. 2018, 41, 51–56. [Google Scholar]
- Hu, D.; Huang, N.; Pei, B.B.; Pakzad, R.; Zhang, H. Numerical simulation study on the wind pressure characteristics of low-rise buildings in sandstorm environment. J. Desert Res. 2025, 45, 32–43. [Google Scholar]
- Wen, T.T.; Jin, A.F.; Reyihuanguli, M.s. Research on movement characteristics of wind-blown sand flow based on SPH method. J. Arid. Land Resour. Environ. 2021, 35, 109–119. [Google Scholar]
- Wang, P.; Zheng, X.J. Advances in numerical simulation of wind-blown sand. Acta Aeronaut. Astronaut. Sin. 2021, 35, 49–70. [Google Scholar]
- Lu, H.L.; He, Y.R.; Dimitri, G. Hydrodynamic modelling of binary mixture in a gasbubbling fluidized bed using the kinetic theory of granular flow. Chem. Eng. Sci. 2003, 58, 1197–1205. [Google Scholar]
- Liu, Y.K. Study on Charges Carried by Individual Sandparticles in Field Wind-Blown Sand Flux. Ph.D. Thesis, Lanzhou University, Lanzhou, China, 2021. [Google Scholar]
- Xie, L.; Li, G.; Bao, N.; Zhou, J. Contact electrification by collision of homogenous particles. J. Appl. Phys. 2013, 113, 184908. [Google Scholar] [CrossRef] [Scilit]
- Yu, H.X.; Mu, L.A.; Xie, L. Numerical simulation of particle size effects on contact electrification in granular systems. J. Electrost. 2017, 90, 113–122. [Google Scholar] [CrossRef] [Scilit]
- Wu, Y.; Castle, G.S.P.; Inculet, I.I.; Petigny, S.; Swei, G. Induction charge on freely levitating particles. Powder Technol. 2003, 135–136, 59–64. [Google Scholar] [CrossRef] [Scilit]

Disclaimer/Publisher’s Note: The statements, opinions and data contained in all publications are solely those of the individual author(s) and contributor(s) and not of MDPI and/or the editor(s). MDPI and/or the editor(s) disclaim responsibility for any injury to people or property resulting from any ideas, methods, instructions or products referred to in the content. |
© 2026 by the authors. Licensee MDPI, Basel, Switzerland. This article is an open access article distributed under the terms and conditions of the Creative Commons Attribution (CC BY) license.