


Abstract
Carbon dioxide (CO2) emissions represent a core driver of climate change, environmental degradation, and quality of life, closely associated with human-related activities. The European Union (EU) has set ambitious emissions reduction targets and introduced various frameworks to its members, including Greece, to achieve specific objectives that involve establishing robust emissions estimating mechanisms. The present study examines a period of approximately 6 decades (1965–2023) to analyze the impact of key indicators of the CO2 emissions in Greece. To explore the relationships between CO2 emissions, Gross Domestic Product (GDP), urbanization, and Renewable Energy Sources (RES), the research employs Ordinary Least Squares (OLS) regression as the primary analytical tool. The analysis demonstrates a strong explanatory power (R2 = 0.918), highlighting that an increase in real GDP is associated with a substantial rise in CO2 emissions, indicating a strong positive long-run relationship between economic activity and environmental pressure. Similarly, a 1% increase in urbanization is associated with an additional 1.5–2 million tons of annual emissions; conversely, a 1% growth in the share of RES contributes to a reduction of approximately 4.5 million tons of CO2. Overall, the findings and methodological approach underscore the critical role of renewable energy adoption and provide a comprehensive framework for assessing and formulating environmental policies and strategies. The main contribution of this paper is its long-run econometric evaluation of CO2 emissions in Greece. It uses variables related to the economy, society, and the energy transition, yielding results that can inform policymakers’ national decarbonization strategies and broader environmental protection efforts.
1. Introduction
Carbon dioxide (CO2) and its emissions are identified as a critical factor in the extant literature researching the greenhouse effect, given their crucial role in driving climate change and global warming [1,2,3]. The primary sources of anthropogenic CO2 emissions [4] include energy generation for industrial and residential purposes and transport. The European Union (EU), in compliance with International Law and the relevant multilateral conventions endorsed on a global scale, is committed to reducing CO2 emissions, aspiring to make Europe the first climate-neutral continent. The EU’s new growth strategy, designed to achieve the specific objective by 2050, is known as the European Green Deal [5,6].
The objectives of carbon phase-out are integrated within the broader framework of the European Climate Strategy and the European Green Deal [7], setting 2050 as the target year to achieve full climate neutrality. In addition, the European Union, in alignment with the Paris Agreement [8], has committed to reducing greenhouse gas (GHG) emissions by 55% by 2030 (compared to 1990 levels). Overall, the relevant policies and international agreements have already affected the energy models adopted by EU member states and are accelerating the transition towards the use of Renewable Energy Sources (RES) and green technologies [9,10].
Recent studies demonstrate that advancements in digital and artificial intelligence technologies, alongside structural economic innovations, significantly influence carbon-emission trajectories and facilitate the integration of renewable energy into sustainable energy systems. Cross-country empirical analyses suggest that the adoption of artificial intelligence and improvements in energy structure mediate the relationship between economic growth and carbon emissions, promoting more efficient energy utilization while advancing economic development objectives [11,12].
Rapid economic growth in recent decades, coupled with industrialization trends, has posed substantial challenges for CO2 emission reduction strategies, the management of natural resources, and the overall protection of the environment [13]. CO2 emissions are also closely related to environmental degradation impacts, directly affecting public health and social well-being [14,15,16].
Water resources are the natural assets most directly impacted by climate change, both qualitatively and quantitatively, particularly in terms of their availability. This issue is especially critical in regions highly vulnerable to droughts and heatwaves, such as the Mediterranean countries. To illustrate, Greece, despite being considered to possess relatively abundant freshwater reserves compared to other European countries [17], is projected to face substantial water availability challenges in the future [18,19]. Thus, precipitation levels in Greece are expected to decline by approximately 10–40% by 2050 as a consequence of climate change [20]. The country’s vulnerability to water scarcity represents a complex, multifaceted challenge, stemming from the combined effects of recurrent droughts and rising temperatures [21], with climate change as the primary underlying driver.
In this context, CO2 emissions reduction is a critical strategic priority, particularly for safeguarding environmental sustainability and preserving natural resources in regions heavily impacted by climate change [22]. The adverse impacts of rising emissions are projected to affect critical sectors of the Greek economy, particularly tourism [23,24] and agricultural production [25], considered as major national production pillars and directly reliant on water availability and climatic stability.
Accordingly, the interrelation between energy transition and resource management emerges as a critical strategic concern for promoting sustainability and effectively addressing future environmental challenges, which underscores the imperative need to systematically monitor and assess both environmental protection initiatives and emissions trends. Within this scope, the present study aims to establish a quantitative framework for monitoring and forecasting CO2 emissions in Greece, incorporating economic growth and Renewable Energy Sources (RES) indicators, and interpreting the impact of the specific variables on emissions.
In Greece, the objective of achieving full decarbonization by 2028 was introduced in 2019 in the National Plan for Energy and Climate (NPEC) [26] and subsequently in the revised NPEC that followed [27]. The Greek government has undertaken a strategic commitment to the transition towards cleaner energy, emphasizing the expansion of renewable energy sources, such as wind and solar power. National energy and climate policies are aimed at achieving reductions in greenhouse gas emissions while supporting economic growth. Notably, as Greece represents a particularly pertinent case for examining the relationship between economic growth and environmental sustainability [28,29], a comprehensive understanding of the primary determinants influencing CO2 emissions can contribute to evaluating policy effectiveness and identifying areas requiring additional intervention [30,31,32].
The following section provides a review of the extant literature on the relationship between CO2 emissions and the variables investigated in the present research, namely economic indicators, urbanization, and the use of Renewable Energy Sources (RES).
2. Literature Review: Economic Indicators, Urbanization, and RES
In the present research, Gross Domestic Product (GDP) is used as a key variable capturing the overall scale of economic activity and its potential impact on carbon emissions [33,34,35]. Research employing the framework of the Environmental Kuznets Curve (EKC) demonstrates that, even in the absence of a well-defined turning point, economic growth is generally associated with increased emissions during the initial and intermediate stages of development. According to the EKC hypothesis, which has been widely used in the extant literature [36,37], environmental degradation, affected by CO2 emissions, tends to rise with income growth in the early phases of economic expansion, and, subsequently, declines when a specific income threshold is reached, driven by the adoption of cleaner technologies and more sustainable practices. Several studies, however, demonstrated that EKC derives contradictory outcomes, as the expected inverted U-shaped relationship is not consistently observed in empirical data [38].
Urbanization is also considered a critical factor related to environmental impacts. Urban areas typically exhibit higher per capita energy consumption compared to rural areas, on account of the concentration of economic and fossil-fuel-dependent infrastructure. An increase in urban population tends to raise energy demand in the transport, housing, and industrial sectors. As highlighted by a 2016 study [39], urban population growth fundamentally drives increases in industrial output, higher vehicle usage, and energy consumption, thereby contributing to exacerbating CO2 and other greenhouse gas emissions. Numerous empirical studies have incorporated urbanization into the analysis of emissions determinants. For instance, research in emerging economies has found that urbanization generally correlates with higher CO2 emissions and increased energy consumption; however, the extent of the impact varies depending on the country and stage of development [40,41,42,43,44], whereas the relationship depends on urban growth patterns [45].
In Greece, urbanization had a considerable growth during the second half of the 20th century. With over 75% of the population now residing in urban areas [46], the country has experienced high urban growth [47] and expansion of urban regions [48]. In this perspective, urbanization in Greece plays a crucial role and is, thus, included in the present analysis to quantify the demographic changes contributing to national carbon emissions, and complement GDP-based analyses.
The share of Renewable Energy Sources (RES) in the national energy mix is the third determinant investigated in the present research. Reducing reliance on carbon-intensive fuels and increasing the use of renewables (i.e., hydroelectric, wind, solar, and biomass) is critical to mitigating CO2 emissions [49]. Evidence supports the positive impact of RES on reducing emissions in countries such as the E7 countries (Brazil, China, India, Indonesia, Mexico, Turkey, Russia), where renewable energy significantly reduced emissions while supporting economic growth in 2019 [50]. A European survey [51] examining the period 1995–2018 found that regions with greater penetration of renewable energy sources (RES) produced lower CO2 emissions, whereas more urbanized areas featured higher emissions rates, thereby highlighting the contrasting effects of RES use and urbanization. In addition, research in developing countries [52] and OECD nations [53] highlights that renewable energy adoption mitigates emission growth. Finally, recent research findings in 2025 [54] demonstrate the positive impact of RES on CO2 emissions rates even when considering the full life cycle of RES technologies, namely, emissions produced during production, transport, use, and equipment disposal (i.e., solar panels and wind turbine blades).
In this framework, the share of renewable energy in the proposed model is considered a critical variable enabling the description of the progress of decarbonization in Greece. Over the past two decades, Greece’s share of primary energy derived from renewables has had a remarkable increase, driven by supportive policies (i.e., feed-in tariffs) and declining technology costs, coinciding with a reversal in the long-term trend of CO2 emissions. Greek emissions peaked in 2005 and have since declined, partly on account of the increased adoption of renewable energy and reduced fossil fuel demand during the economic recession [55]. Measuring the relationship between renewable energy adoption and CO2 emissions provides a basis for assessing the effectiveness of Greece’s transition to low-carbon energy.
A further review of the literature indicates that relevant variables have been analyzed to some extent in previous research concerning Greece, albeit over shorter time horizons and employing alternative methodological approaches compared to those proposed in the present survey. To illustrate, in 2021 [56], a survey exploring the relationship between CO2 emissions and energy consumption, GDP, trade openness, and urbanization during 2000–2017, revealed long-term bidirectional causality between economic growth and emissions, as well as unidirectional causality from urbanization to CO2 emissions. The specific results indicate that urban population growth has been a significant driver of the rise in emissions in Greece, underscoring the critical role of expanding renewable energy adoption and clean technologies to mitigate environmental impacts. Similarly, another survey in 2017 [57] investigated the correlation between CO2 emissions and economic growth, international trade, and tourism in Greece. In addition, in 2022, research focusing on European countries (including Greece) [51] explored the roles of renewable energy and urbanization, revealing that higher shares of renewable energy reduce emissions, whereas increased urbanization contributes to deteriorating air quality across European countries.
Recent analyses in regions neighboring Greece have also investigated equilibrium relationships among CO2 emissions, GDP, urbanization, and renewable energy production [58]. Such interrelations have been examined across numerous countries with diverse economic and developmental contexts [59,60]. Notably, the variables explored in the present research have been widely recognized as key drivers of CO2 emissions and frequently co-researched in the international literature. The main contribution of the present survey lies in addressing the existing research gap by investigating these relationships in the Greek context across a long historical timeframe, employing a robust econometric framework.
To fill this gap, the present research employed Ordinary Least Squares (OLS) regression on annual data for Greece from 1965 to 2023 to assess the impact of GDP, urbanization, and renewable energy sources on CO2 emissions. By encompassing data from nearly six decades, the analysis captures long-term structural trends, including industrialization, urban transition, and transformations within the national energy system. The following sections provide a comprehensive overview of the data and methodology, discuss the regression results, and examine the implications of the findings for the design of sustainable economic and environmental policies in Greece.
According to prevailing theories, the relationship between CO2 emissions and economic growth is explained by two widely used theories: the Environmental Kuznets Curve and the economies-of-scale theory [36,38]. The first concerns the Environmental Kuznets Curve (EKC) theory, which depicts the relationship between economic growth and environmental burden as an inverted U: environmental pressure initially increases with income before eventually decreasing at more advanced stages of development due to technological progress and structural changes. The economies-of-scale effect states that higher levels of economic activity increase energy demand and, consequently, emissions, especially in economies that remain partially dependent on fossil fuels.
The mitigating role of renewables is grounded in energy substitution and decarbonization frameworks. As the share of renewables increases, low-carbon technologies progressively replace fossil-fuel-based generation, leading to lower emissions intensity and weakening the long-term link between economic growth and emissions [49,50,51].
Finally, urbanization affects CO2 emissions through mechanisms that are accentuated in the urban and regional economy, including agglomeration, increased transport demand, and infrastructure-related energy use. While urban concentration can generate efficiency gains, its net impact on emissions depends on urban structure, energy systems, and design characteristics, and can intensify environmental pressure in the absence of sustainable urban policies [40,41,42,43,44,45].
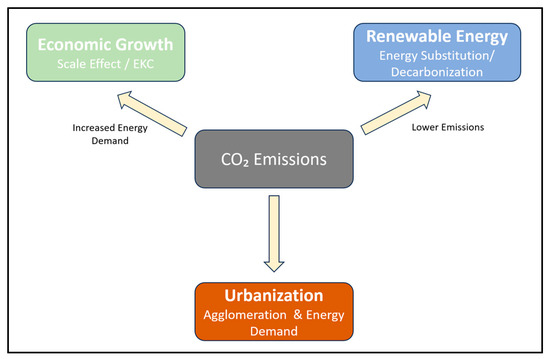
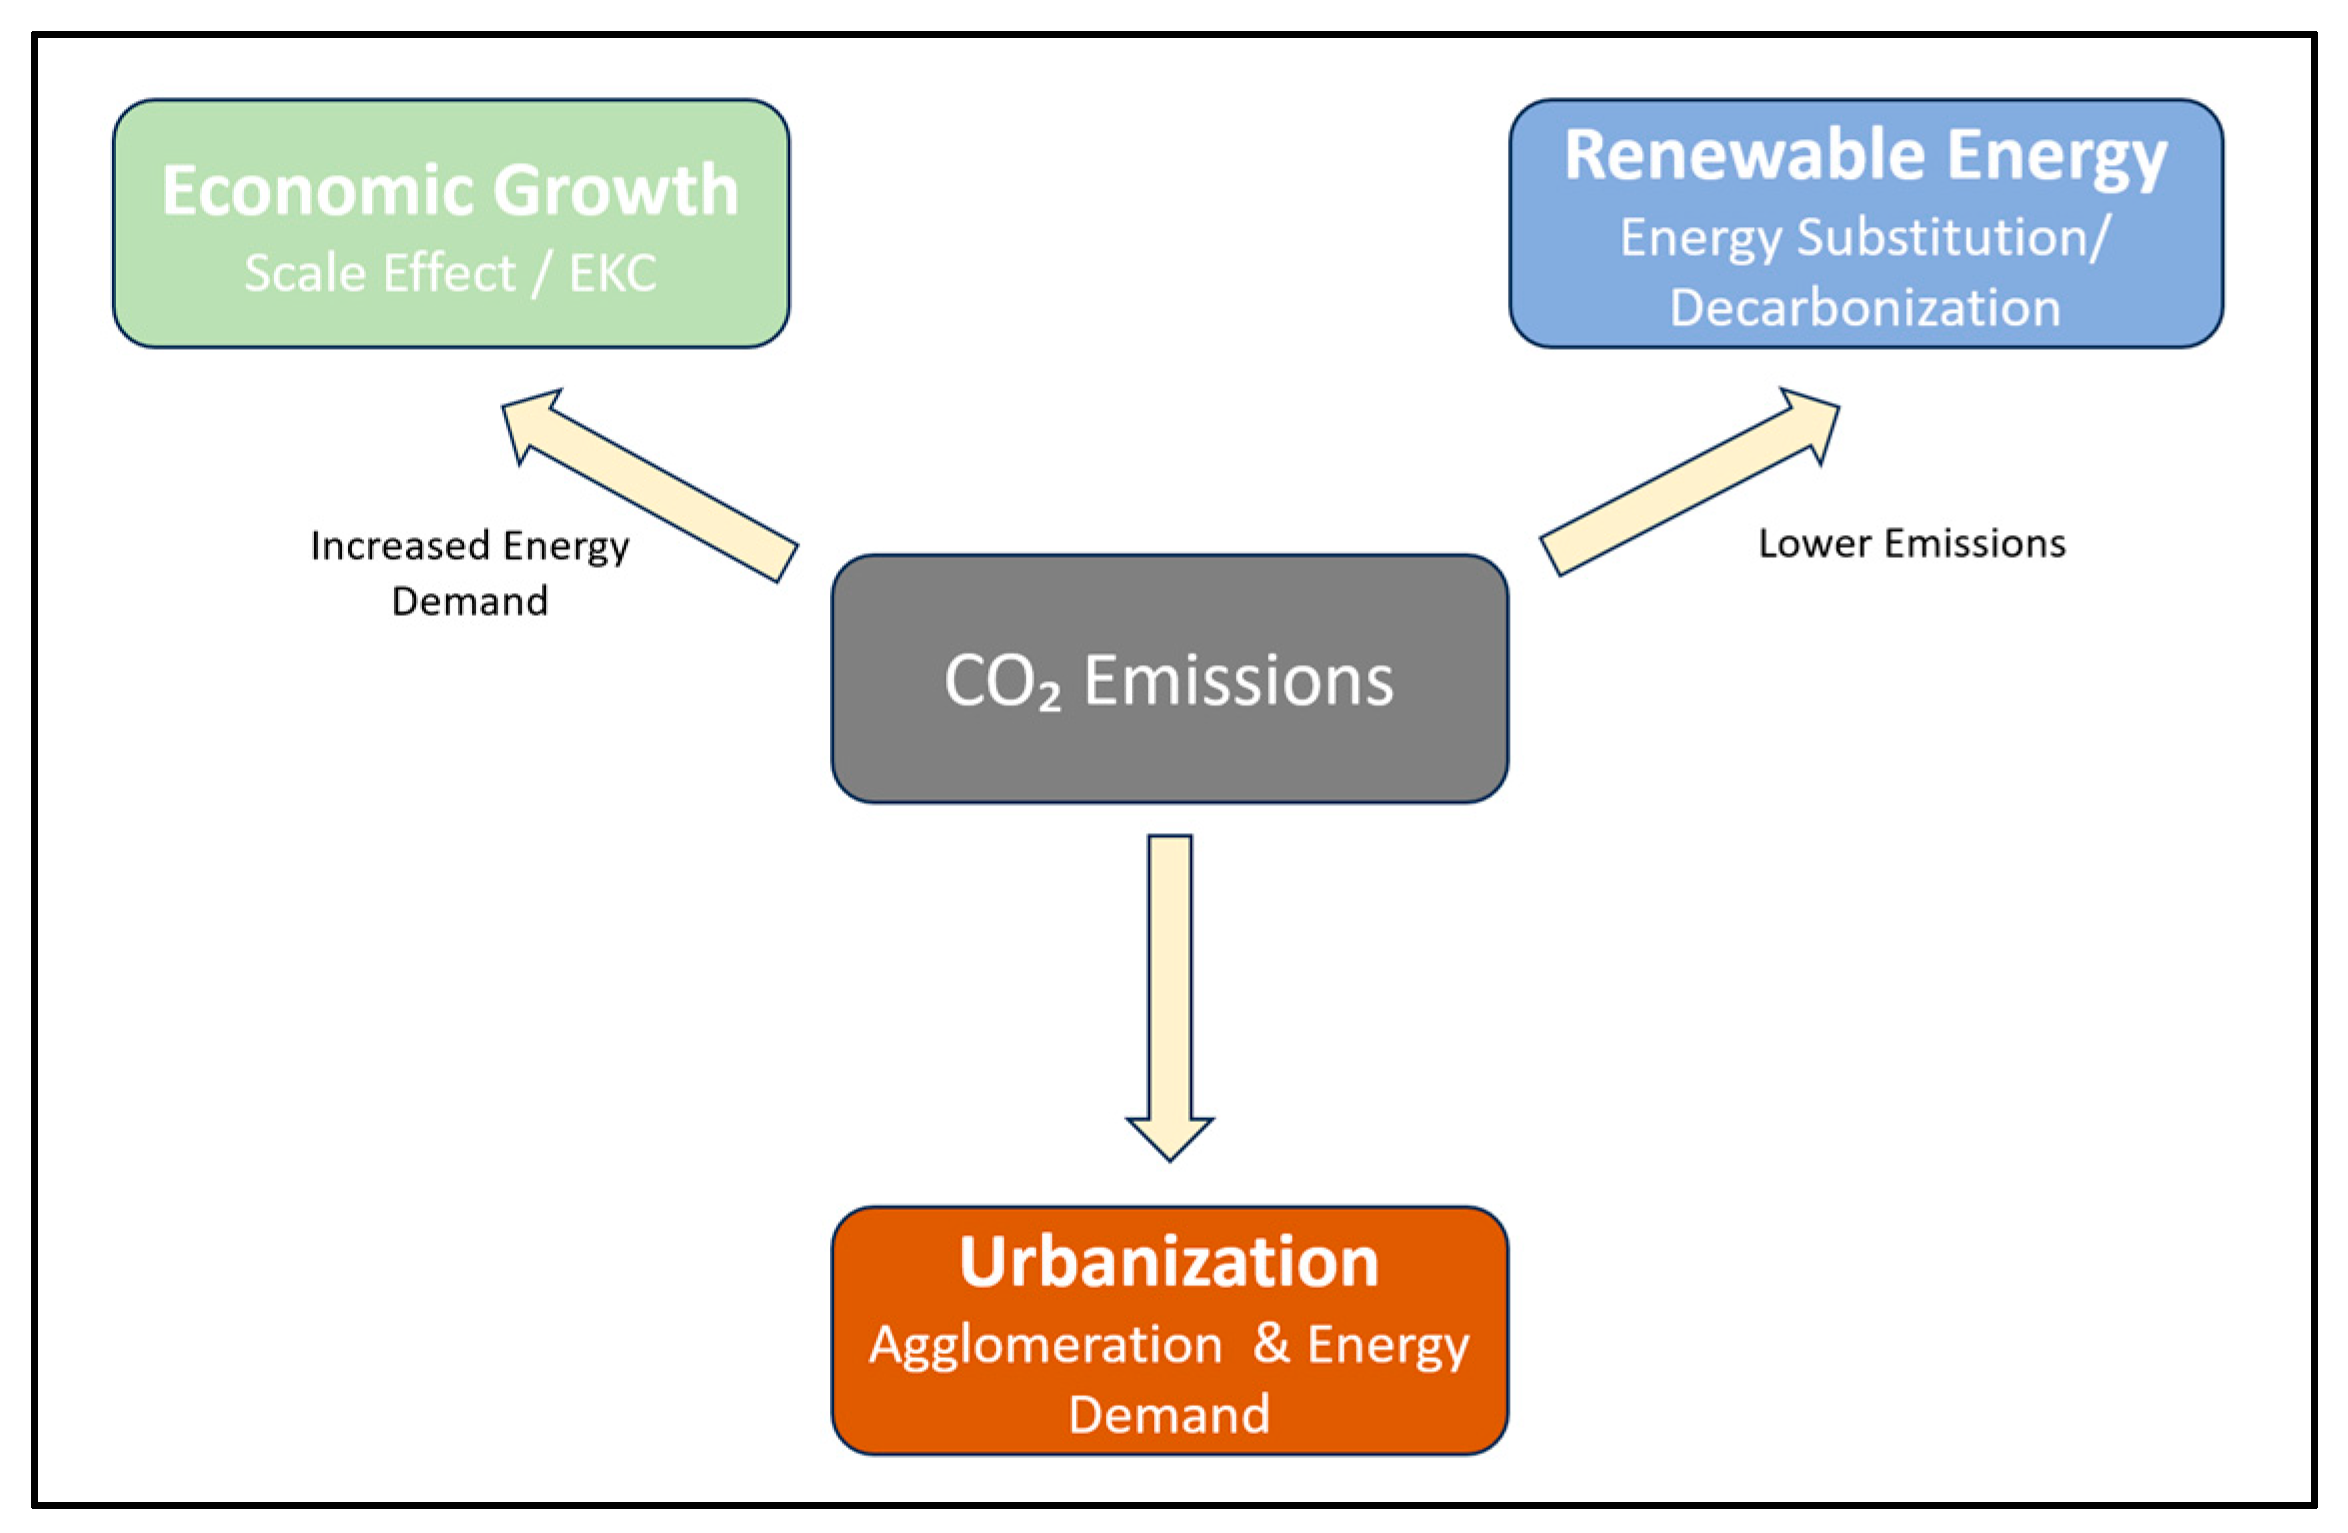
Based on these theoretical approaches, Figure 1 presents the empirical framework that examines how economic growth, urbanization, and renewable energy sources jointly shape long-term CO2 emissions in Greece.
Figure 1.
Conceptual framework illustrating the theoretical linkages between economic growth, urbanization, renewable energy, and CO2 emissions.
In the specific analytical framework for the case of Greece, the choice of specific variables, namely economic growth, urbanization, and renewable energy sources as independent and explanatory variables for carbon dioxide emissions, is based on both theoretical and empirical motivations. Economic growth captures the scale of production and consumption in an economy that has historically relied on fossil fuels, making GDP a key driver of long-term emissions dynamics [61]. Urbanization reflects persistent structural changes in population concentration, infrastructure, and transport demand, which are particularly important given the dominance of large metropolitan areas [62]. The inclusion of renewable energy sources reflects Greece’s long-term energy transition toward a more environmentally friendly energy regime, marked by large-scale development of wind and solar power over the last decade [63]. From a theoretical perspective, renewable energy captures the substitution of carbon-intensive technologies and represents the main means by which economic growth can be decoupled from CO2 emissions. Together, these variables form a coherent framework that captures the scale effects, structural changes, and transformation of the energy system in the Greek economy.
3. Data and Methodology
The literature review facilitated the selection of three key variables—Gross Domestic Product (GDP) [33,34,35], urbanization [39,40,41,42,43,44,45], and the share of Renewable Energy Sources (RES) [52,53,54], which are employed to investigate carbon dioxide (CO2) emissions in Greece. Notably, the specific variables represent the most direct and established drivers of emissions, while also enabling a long-term, consistent, and data-reliable analysis using the available data.
3.1. Data Description
Within the research scope, annual data for Greece were collected for the period from 1965 to 2023. Sources include open-access repositories, such as Our World in Data (OWID) [64], as well as OECD databases [65], World Bank [66], which compile statistics from multiple official sources. All variables employed in the present study are measured on an annual basis and are defined as follows. Table 1 summarizes the variables used in the empirical analysis, their measurement units, data sources, and corresponding web links.
Table 1.
Description of variables and data sources.
CO2 emissions (MtCO2): It represents total annual carbon dioxide emissions generated in Greece, measured in CO2 million tonnes (Million tonnes-Mt), and includes emissions from fossil fuel combustion as well as other sources, such as cement production and steel manufacturing, within the geographical borders of Greece (territorial emissions); emissions embedded in imported goods are excluded from the analysis. In Greece, CO2 emissions increased steadily for most of the latter half of the 20th century, peaking in the mid-2000s, and have since exhibited a declining trend. In the regression analysis, CO2 emissions are employed as the dependent variable. The corresponding time-series data were sourced from OWID [67] in tabular form.
GDP (constant USD): Gross Domestic Product involves the total value of goods and services produced by the Greek economy in a given year. The analysis, complying with the World Bank’s constant-price series reported by OWID, employs real GDP (in constant USD) to adjust for inflation, as this reflects long-term economic growth over time. Notably, in Greece, real GDP had a rapid increase from the 1960s until 2008, followed by a period of contraction and a moderate recovery in subsequent years. GDP is expected to correlate positively with CO2 emissions, as higher economic activity typically entails higher energy consumption, which accounts for emissions. The time-series data were obtained from OWID [68] and are available in tabular format.
Urbanization (%): Urbanization, defined as the population rate in Greece living in urban areas (according to national statistics definitions), has grown steadily, according to World Bank data, rising from roughly 57% in the 1960s to about 79% by 2020. Incorporating the urban population share enables the analysis of the impact of demographic and spatial changes on energy demand and CO2 emissions. Higher urbanization levels are associated with increased per capita energy consumption due to urban infrastructure requirements and lifestyle patterns. The time-series data were sourced from the World Bank [66] in tabular format.
Share of Renewable Energy Sources (% of primary energy): It involves the rate of Greece’s total primary energy supply derived from renewable sources. It is measured as a percentage of total primary energy consumption, using a ‘substitution approach’ to account for the equivalent primary energy from non-combustible sources, such as hydro, wind, and solar power. The variable reflects the proportion of Greece’s energy mix supplied by renewable sources (i.e., solar, wind, hydro, geothermal, and modern biofuels), as opposed to fossil fuels and nuclear energy. Data were sourced from the 2025 edition of the Energy Institute’s Statistical Review and processed by Our World in Data [69]. Greece’s renewable energy share increased from near 0% in the 1960s to approximately 16% in 2020, driven by the expansion of wind and photovoltaic farms, and the increased use of biomass and hydroelectric power in recent years. In the present research, the results are expected to demonstrate a negative correlation between renewable energy share and CO2 emissions, as higher reliance on renewables should theoretically reduce emissions by decreasing fossil fuel consumption.
Prior to the main analysis, each variable time series was examined in terms of consistency and underlying trends. Both CO2 emissions and GDP exhibit upward trends throughout most of the sample period, with a marked decline in emissions after 2008 (reflecting the impact of the financial crisis in Greece and the adoption of renewable energy sources). Urbanization had a steady increase, whereas the share of renewable energy remained low until approximately 2005 and subsequently rose sharply. Descriptive statistics for all variables are presented in Table 2.
Table 2.
Descriptive data statistics.
3.2. Methodology Description
The relationship between the independent variables and CO2 emissions is estimated using Ordinary Least Squares (OLS) regression, which is a fundamental statistical approach extensively employed across a wide range of applications [70,71,72] to quantify the impact of independent variables. It operates by assigning weights to the independent variables through linear combinations, and is typically represented as follows:
where is the dependent variable, the independent variables, the intercept term, the coefficients associated with each independent variable, and the error term. In the present research, the dependent variable corresponds to the annual CO2 emissions in Greece, whereas the independent variables include: (1) GDP, (2) the degree of urbanization, and (3) the share of renewable energy.
OLS estimates the coefficients that best fit the historical data by minimizing the sum of squared residuals, where the residual for observation is described as:
where denotes the actual value of the dependent variable for a given set of observations of the independent variables. The squared term is subsequently defined as The objective is to determine the optimal values of which minimize across the entire dataset:
All calculations were performed using the commercial statistical software EViews 7 [73]. The regression was estimated employing the Newey-West (HAC) method [74,75] to correct for heteroskedasticity and first-order autocorrelation, which were identified through the Breusch-Pagan [76] and Durbin-Watson [77] diagnostic tests, respectively. The presence of heteroskedasticity violates the classical linear model assumptions, affecting the accuracy of standard errors and, consequently, the validity of statistical tests. The use of Newey-West robust standard errors ensures reliable coefficient estimates, supporting the validity of p-values and significance tests even when the assumptions of homoskedasticity and no autocorrelation are not fully met. Thus, the reliability of the estimates is maintained without modifications to the basic model specification.
The estimates of CO2 emissions are, therefore, based on OLS, which can now be specified as follows:
where denotes the year, represents the marginal effect of economic growth on CO2 emissions (holding other factors constant); describes the effect of population urbanization, and measures the impact of the share of renewable energy. Given the relatively small number of independent variables and the long time series (59 years), the degrees of freedom are considered sufficient for reliable estimation.
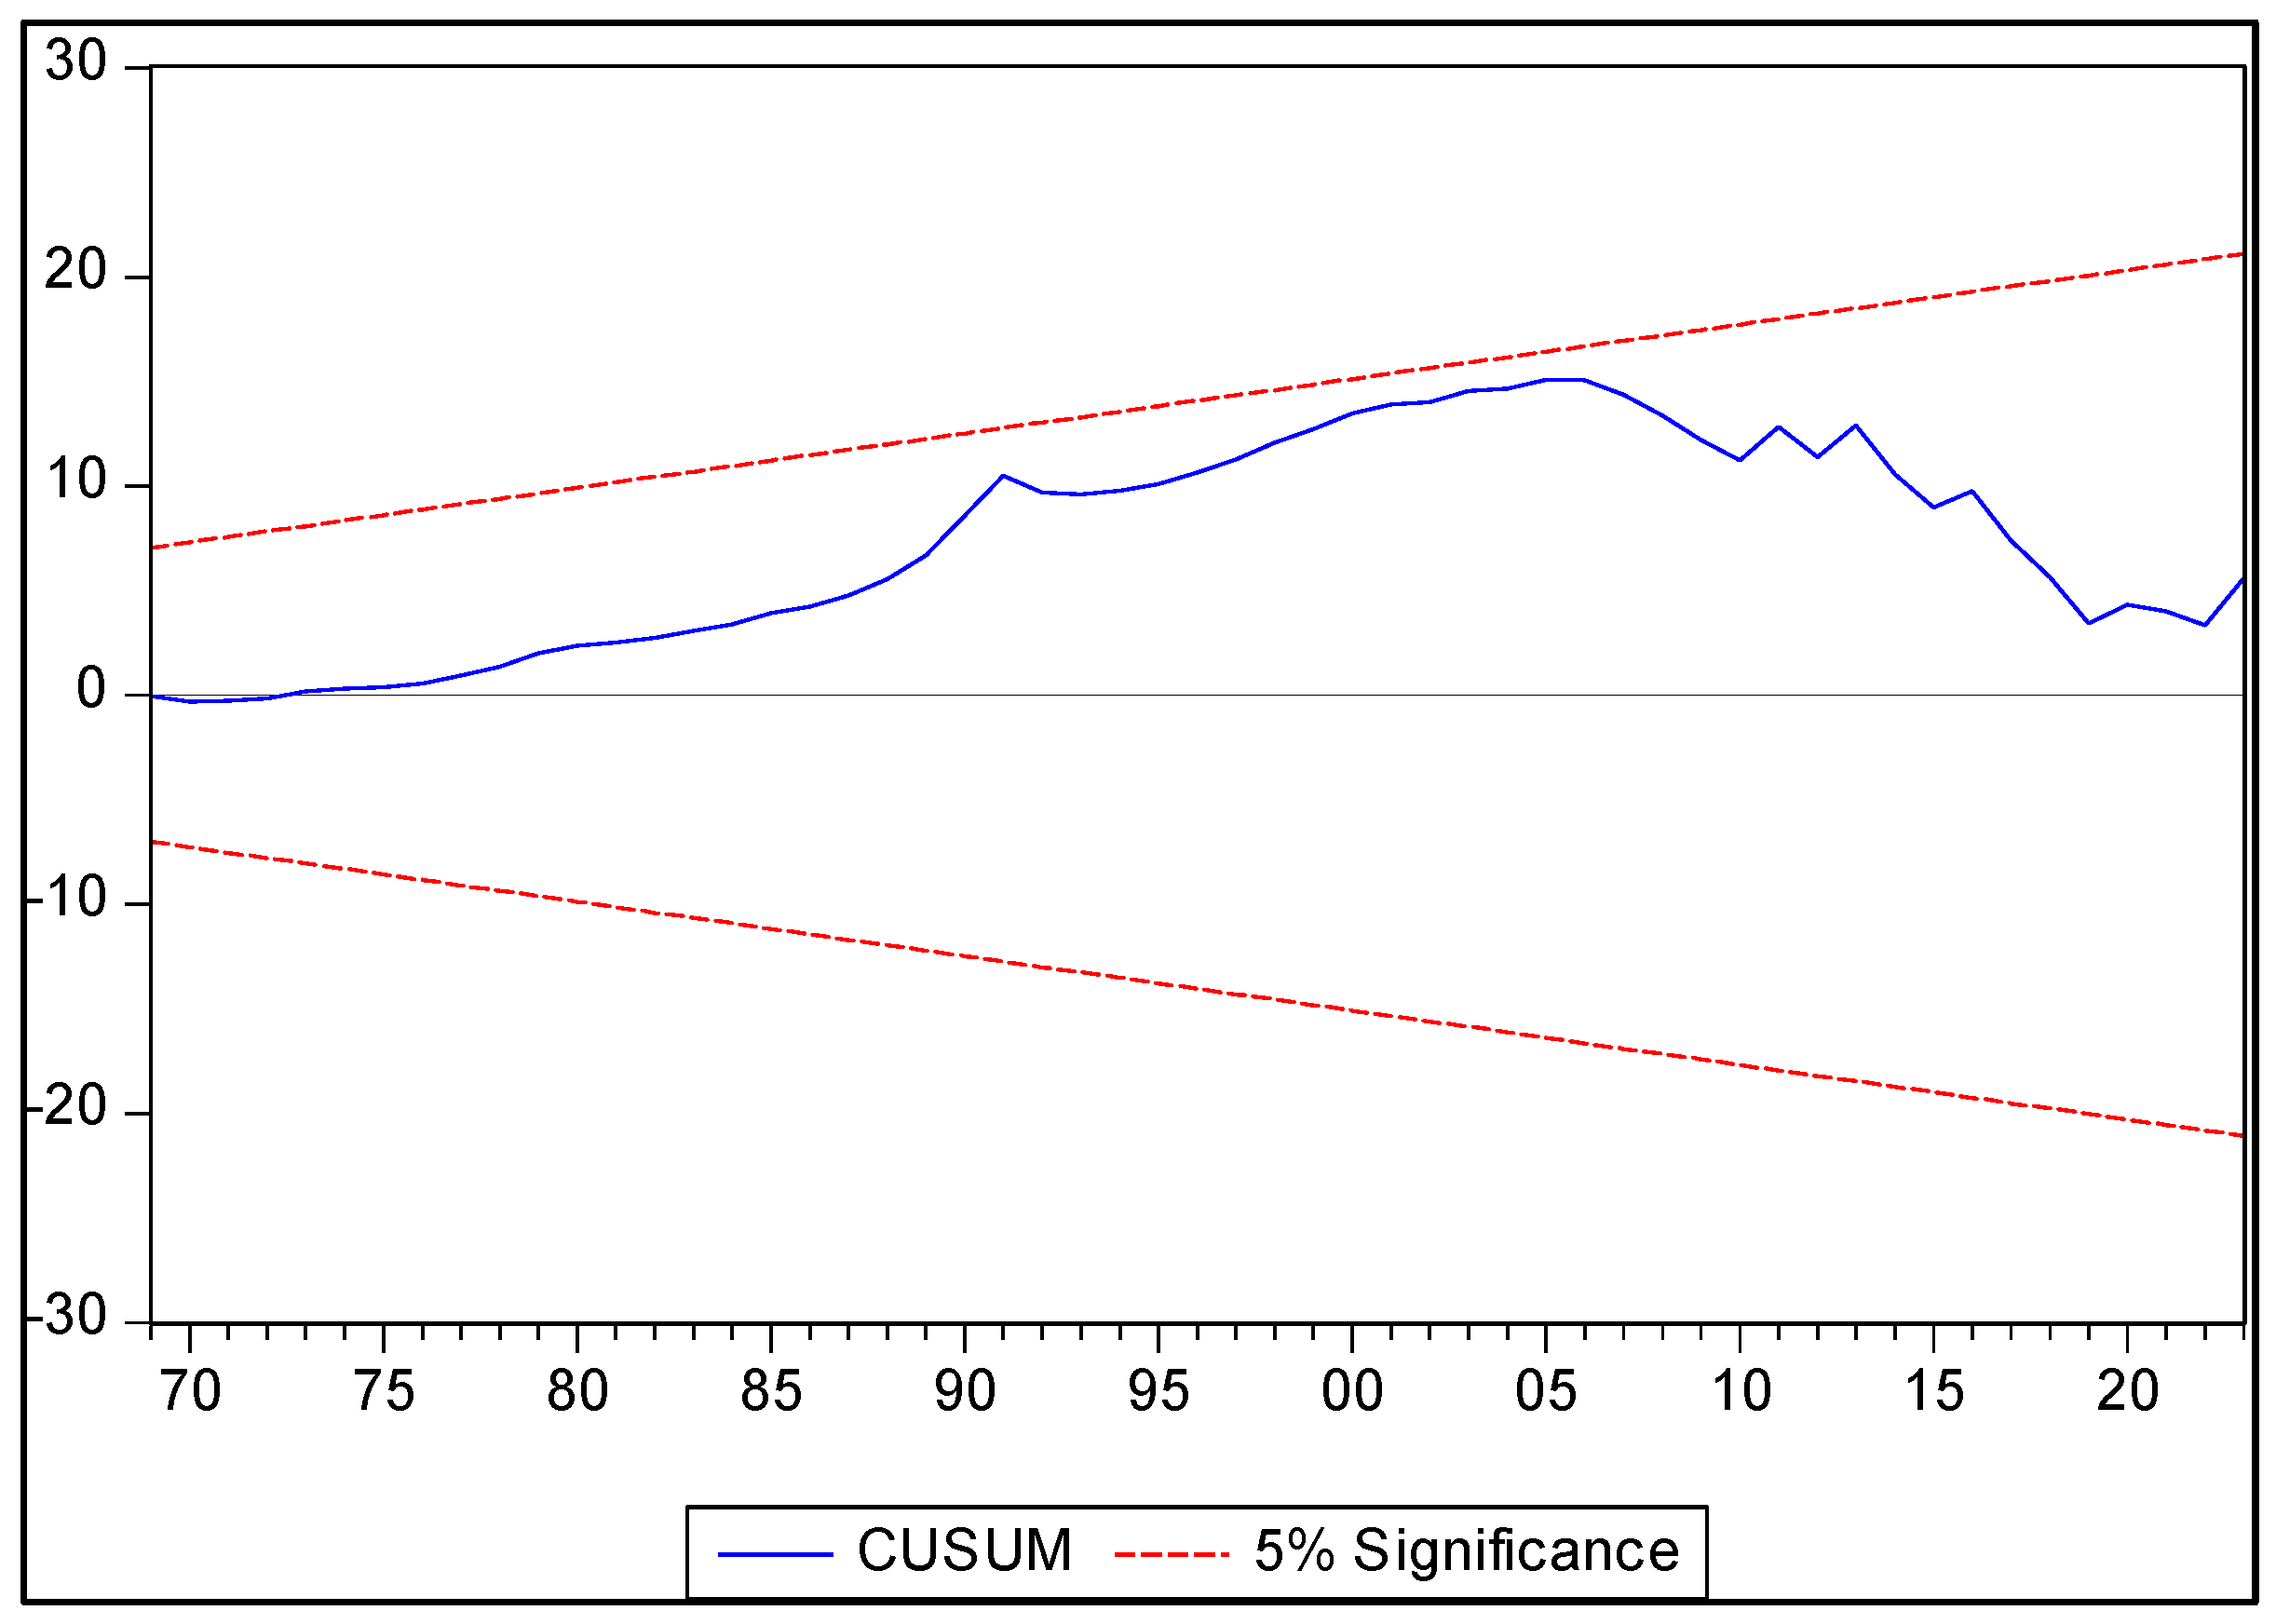
It is also noted that the sample period includes significant structural breaks or exceptional years. For instance, CO2 emissions declined markedly in 1983 (due to economic downturn), during 2009–2013 (the debt crisis), and in 2020 (COVID-19 pandemic). However, the OLS results reflect the average relationships across the entire research time. Any isolated effects would be reflected in the residual analysis. While such events may cause short-term deviations, the empirical strategy aims to identify long-term average relationships throughout the entire sample. Parameter stability is evaluated using CUSUM tests, which reveal no evidence of structural instability in the estimated coefficients. In addition, no supplementary control variables (i.e., trade openness or energy prices) are included to enable focus on the three key determinants and avoid overfitting [78,79]. Remarkably, however, the exclusion of such factors implies that the estimated coefficients capture their effects only indirectly (changes in trade policy may influence CO2 emissions through their impact on GDP or urbanization).
To assess the existence of a long-run equilibrium relationship among the variables, the Engle–Granger residual-based cointegration approach was employed. The residuals obtained from the long-run OLS regression were tested for stationarity using the Augmented Dickey–Fuller (ADF) test without deterministic components. The results strongly reject the null hypothesis of a unit root (ADF statistic = −7.28, ), indicating that the residuals are stationary.
All variables are found to be integrated of order one and cointegrated, indicating the existence of a stable long-run relationship among CO2 emissions, economic activity, urbanization, and renewable energy. Taking these elements into account, the estimation was carried out using the OLS specification in levels, which is appropriate for long-run inference under cointegration. The main focus of our analysis is on capturing average long-term relationships rather than short-term dynamics or adjustment processes. Although other estimators, such as FMOLS, DOLS, or ARDL-based error-correction models, are widely used to explore dynamic behavior, their use is not required for the specific long-run focus of the present study and is therefore left for future extensions.
These findings confirm the presence of cointegration among CO2 emissions, GDP, urbanization, and renewable energy share. Under cointegration, the OLS estimator is super-consistent and provides reliable estimates of the long-run coefficients, thereby justifying the estimation in levels for long-run inference.
4. Results
This section discusses the OLS estimation results for CO2 emissions based on the examined variables. Table 3 outlines the numerical indicators of the OLS regression results and highlights key aspects of the underlying problem.
Table 3.
OLS Regression Results.
The estimation results demonstrate that all coefficients are highly statistically significant (p < 0.01), confirming the importance of GDP, urbanization, and the share of renewable energy as key determinants of CO2 emissions in Greece. The model demonstrates a strong explanatory power, with an R2 of 0.923 and an adjusted R2 of 0.918, suggesting that these variables account for most of the observed variation in emissions over the period 1965–2023. Overall model significance is further confirmed by the F-statistic (218.83, p < 0.001), demonstrating the robustness and explanatory capability of the regression.
The regression equation can now be described using the estimated coefficients as follows:
where the intercept is , GDP coefficient , urbanization coefficient , and the RES coefficient .
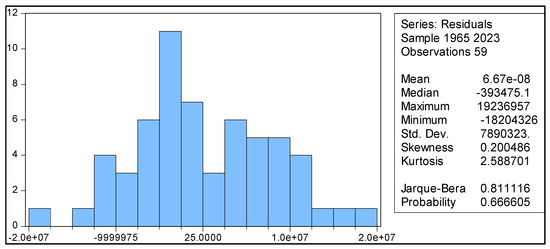
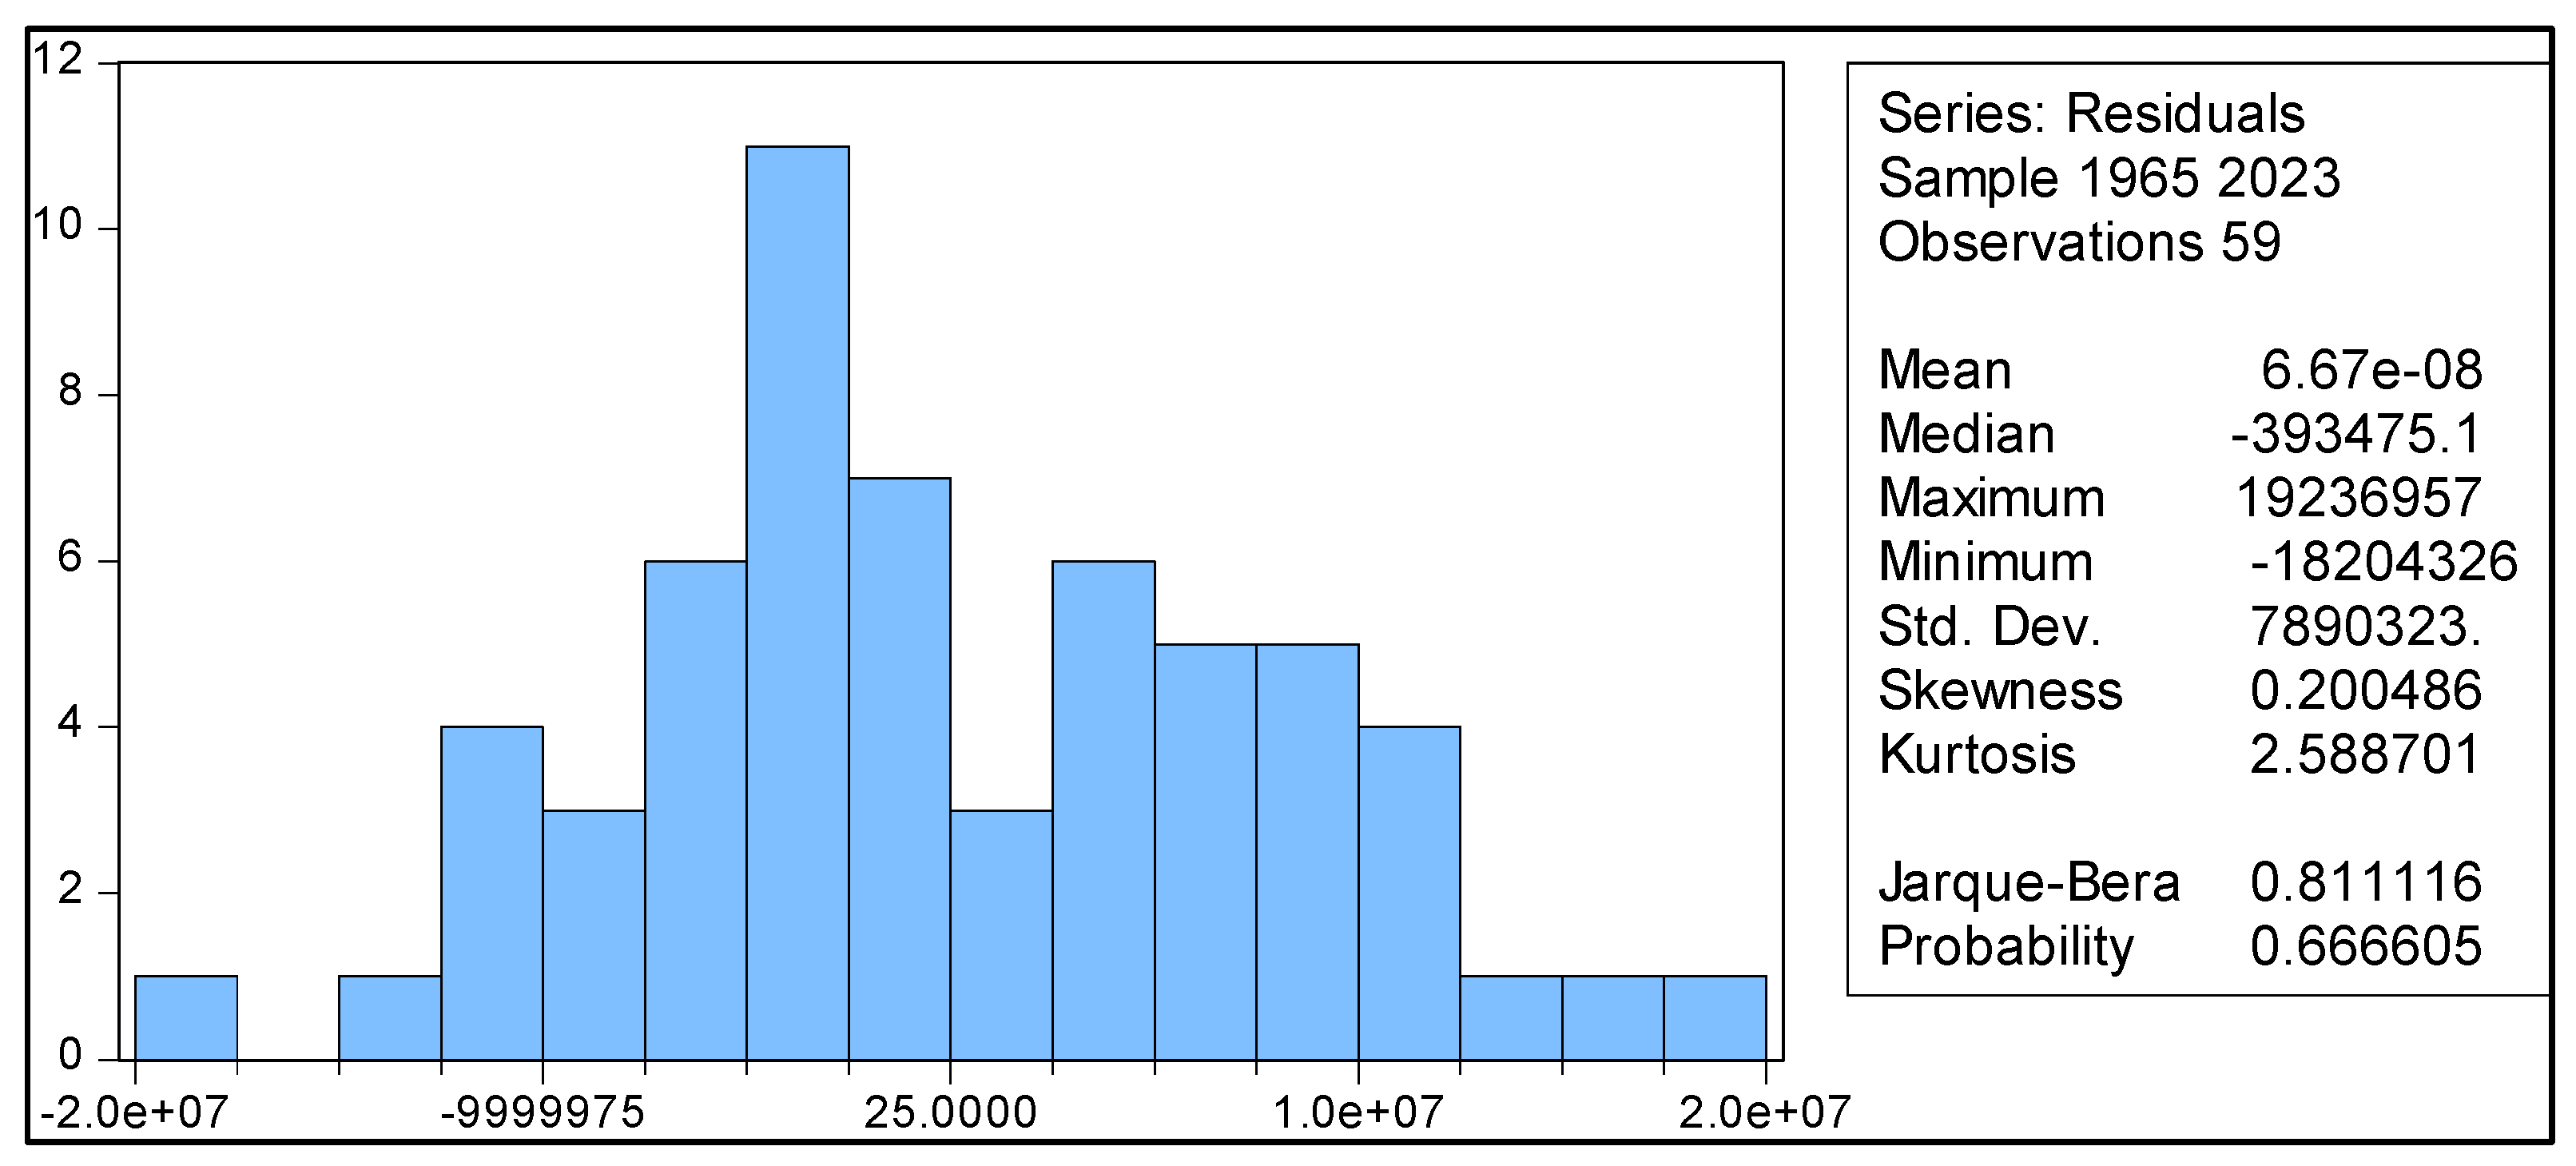
Subsequently, various diagnostic tests were applied to assess model adequacy. To assess residual normality, the Jarque–Bera test [80] was employed, yielding a p-value of 0.6666, which indicates that the null hypothesis of normally distributed errors cannot be rejected. Figure 2 illustrates that the residuals follow a normal distribution, as the Jarque–Bera (JB) test satisfies the normality criterion, given that the corresponding significance level exceeds 5%. Skewness (0.20) and kurtosis (2.59) are very close to the theoretical benchmarks for a normal distribution (0 and 3, respectively), whereas the residual histogram reveals no signs of outliers or heavy tails. Thus, residuals are deemed to follow a normal distribution, thereby enhancing model credibility and validity.
Figure 2.
Jarque–Bera Test for Residual Normality.
The White test for heteroskedasticity [81] (Table 4), a general test which does not assume a specific functional form between the error variance and the independent variables, demonstrated that there is no statistically significant evidence of heteroskedasticity in the model (p = 0.0859). The Breusch–Pagan test [76] (Table 5), however, indicated the presence of statistically significant heteroskedasticity (p = 0.0107), revealing a slight inconsistency between the two diagnostic tests. To ensure precautionary reliability, the model was re-estimated using Newey–West robust standard errors, ensuring the validity of the results even in the presence of heteroskedasticity and/or autocorrelation.
Table 4.
White Test Results for Heteroskedasticity.
Table 5.
Breusch–Pagan Test for Heteroskedasticity.
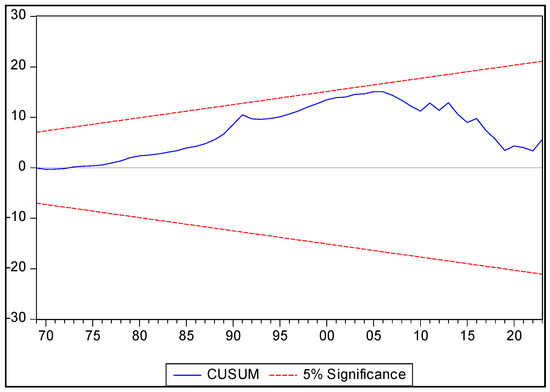
To assess the stability of the estimated coefficients, the Brown–Durbin–Evans CUSUM test [82] was applied (Figure 3). The cumulative sum of recursive residuals remained within the 5% significance bounds, indicating that the null hypothesis of parameter stability cannot be rejected. This suggests that the model coefficients are consistent over time, with no detectable structural breaks or parameter shifts.
Figure 3.
Brown–Durbin–Evans CUSUM Test for Parameter Stability.
In addition, the Breusch–Godfrey test [83] identified autocorrelation up to the second order, with results summarized in Table 6. This was addressed using the Newey–West (HAC) estimator [74,75], which produces robust standard errors that remain valid in the presence of both autocorrelation and heteroskedasticity. Thus, the reported statistics and p-values can be considered robust and reliable despite the presence of autocorrelation.
Table 6.
Breusch–Godfrey Test Results for Autocorrelation.
While autocorrelation is detected in the residuals, the primary objective of the analysis is to estimate long-run average relationships rather than short-term dynamics. For this reason, HAC corrections were preferred over autoregressive model re-specifications, as they preserve the long-run interpretation of coefficients while ensuring robust inference.
Finally, additional diagnostic tests were applied to examine potential multicollinearity and variable stationarity. Multicollinearity among the independent variables was assessed using the Variance Inflation Factor (VIF) [84]. The findings indicated no multicollinearity, with all VIF values falling below 3, thus implying the absence of strong linear relationships or redundancy among the predictors. Stationarity was assessed via the Augmented Dickey–Fuller (ADF) test [85] (Table 7). The table values indicate that all variables (CO2 emissions, GDP, RES, and urbanization) are non-stationary in levels but become stationary after first differencing. Thus, all time series are integrated of order one (I(1)), which justifies the use of cointegration techniques.
The finding that stationarity is achieved only after differencing is consistent with well-documented patterns in macroeconomic and energy data. Nelson and Plosser [86] maintain that most macroeconomic series exhibit unit roots and become stationary only after differencing. More recent research, including Stock and Watson (2016) [87], corroborates that modeling key macroeconomic indicators as I(1) processes remains a widely accepted and methodologically sound approach in applied econometrics.
Table 7.
Unit Root Test Results for Stationarity Using the Augmented Dickey–Fuller (ADF) Method.
After completing the diagnostic tests, the focus shifts to interpreting the influence of the independent variables on CO2 emissions.
Impact of GDP—Economic Growth: The estimated GDP coefficient (0.781) is positive and statistically significant at the 1% level, demonstrating that increased economic activity correlates with higher CO2 emissions in Greece. Because there may be endogeneity between economic activity and CO2 emissions, the estimated coefficients should be seen as long-run associations, not as evidence of causality. An increase in GDP corresponds to a rise in CO2 emissions in absolute terms, illustrating the scale effect of economic growth on environmental pressure.
This strong positive association is consistent with theoretical expectations and previous empirical studies [33,34,35]. Historically, periods of economic growth in Greece have been accompanied by higher energy consumption (particularly from fossil fuels) and expanded industrial activity, which contribute to increased carbon emissions. To illustrate, the decades of economic growth from the 1970s through the 2000s were accompanied by parallel increases in both GDP and emissions, whereas the recession following 2008 coincided with a sharp decline in emissions. The findings are consistent with the initial phase of the Environmental Kuznets Curve (EKC) hypothesis, which suggests that during the early stages of economic growth, environmental degradation (emissions) rises alongside income. Within the examined period, no GDP turning point is evident; the relationship between economic growth and emissions remains approximately linear and positive, suggesting that by 2023, Greece had not attained an income level at which growth alone would lead to a natural decline in emissions without targeted policy measures.
Overall, economic growth has emerged as a primary driver of carbon emissions in Greece, highlighting the constant challenge of decoupling GDP expansion from CO2 output.
Impact of Urbanization: The estimated coefficient for urbanization (5,123,380) is positive and statistically significant, demonstrating that higher proportions of the population residing in urban areas are associated with increased CO2 emissions. More specifically, a one-percentage-point rise in urbanization corresponds to an approximate increase of 1.5–2 million metric tons in annual CO2 emissions. In quantitative terms, increases in urbanization are associated with substantial increases in annual emissions, highlighting the environmental pressure associated with urban concentration. This finding underscores that urbanization, by concentrating energy consumption and economic activity, increases environmental pressures. In Greece, the migration from rural areas to urban centers, particularly to major cities such as Athens and Thessaloniki, has driven higher demand for electricity, housing, transportation, and other energy-intensive services, historically reliant mostly on oil and coal. The specific findings, as discussed in the Introduction, are consistent with previous research in other countries [40,41,42,43,44,45], which implies that urban population growth typically leads to higher emissions unless counteracting policies are implemented. They also corroborate a 2021 survey [56], which identified unidirectional causality from urbanization to CO2 emissions in Greece, demonstrating that shifts in urban population precede and drive changes in emissions. Overall, it is emphasized that urban expansion has been a significant driver of the country’s increasing carbon emissions.
Impact of Renewable Energy Sources (RES): The RES coefficient, estimated at −4,511,693, is the only variable among the other examined variables associated with a reduction in CO2 emissions in Greece. In detail, an increase in the share of renewable energy in the national energy mix is associated with a substantial reduction in CO2 emissions in absolute terms, confirming the mitigating role of renewable energy adoption. The long-term growth of RES in Greece, particularly after 2005, is concurrent with a reversal of the previous upward trend in emissions, underscoring the effectiveness of the transition to cleaner energy sources. Thus, the increased adoption of RES is critical to reducing emissions and achieving national and European climate neutrality targets. The observed effect of RES on CO2 emissions is consistent with research findings about other countries [49,50,51].
5. Discussion
The OLS regression analysis effectively meets the objectives of this study, namely, to clarify the key determinants of CO2 emissions in Greece and quantify their respective impacts. The overall model is statistically significant (F-test p-value < 0.01), highlighting that the approach explains a substantial portion of the variation in CO2 emissions over time. The adjusted R2 exceeds 0.90, suggesting that more than 90% of emissions variability can be attributed to changes in GDP, urbanization, and the share of renewable energy. Such a high explanatory power is consistent with the view that these three variables encapsulate the main long-term determinants of emissions: economic scale, urban and spatial structure, and the energy technology mix.
The results hold significant implications for policymakers and stakeholders steering Greece towards sustainable development. Firstly, the strong positive correlation between GDP and emissions demonstrates that, comparable to other countries, Greece encounters a trade-off between economic expansion and environmental targets unless proactive strategies are adopted. Historically, in Greece, economic growth had been heavily reliant on fossil fuels, thereby contributing to higher emissions. Notably, however, partial decoupling since the late 2000s has been promising, with emissions peaking and then declining despite variations in economic activity, which implies that effective policy measures can moderate and ultimately decouple GDP growth from carbon emissions. In addition, the strong negative impact of the renewable energy share on CO2 emissions is particularly significant, indicating that Greece’s initiatives to expand renewable energy capacity have effectively contributed to emissions reductions. Recent evidence further suggests that renewable energy expansion is increasingly shaped not only by conventional policy instruments but also by technological capabilities and external strategic factors, such as advances in artificial intelligence, semiconductor technologies, and exposure to geopolitical risk, which can significantly influence renewable energy production dynamics and investment decisions in technologically advanced economies [90]. In terms of policy implications, sustained and enhanced investment in renewables should be highly emphasized in the framework of the national climate strategy. By further increasing the share of wind, solar, hydro, and other clean energy sources in the energy mix, Greece can achieve reductions in CO2 emissions even during continuous economic growth. The specific findings are consistent with broader empirical evidence, which identifies renewable energy use as a key driver of low emissions. In addition, the co-benefits of the transition to renewables include improved air quality, long-term reductions in energy costs, and higher energy security.
Furthermore, the observed effect of urbanization on CO2 emissions underscores a critical area for policy intervention, namely, urban and regional planning. Given that increased urbanization has contributed to higher emissions, Greece can enhance sustainability in urban areas to mitigate this effect by applying measures for the expansion and modernization of public transport systems, the implementation of advanced energy efficiency standards in the building sector, the creation and preservation of green infrastructure, and the promotion of compact and transit-oriented urban development. Such interventions are expected to reduce per capita energy demand within urban areas, thereby reducing the emissions associated with concentrated urban populations. Athens and Thessaloniki, which host a significant share of the national population, with traffic congestion and recurrent air pollution, emphasize the fundamental significance of sustainable urban mobility strategies, such as incentives for electric and low-emission vehicle use, investments in resilient and efficient transport infrastructure, and enforcement of stringent energy performance standards for buildings. Previous research [91,92,93,94] demonstrates that integrating sustainable urban planning and clean technology can yield substantial environmental benefits. In this context, the results suggest that urbanization, although not intrinsically harmful to the environment, requires strategic management through informed policy and innovative planning to mitigate its potential contribution to increased CO2 emissions.
In conjunction with the present research outcomes, Greece’s commitment to international climate objectives is also worth discussing. Greece, as a member of the European Union, has aligned with emissions-reducing targets (including the 2030 goals and the target of net-zero emissions by 2050). Achieving these objectives will likely require further reinforcing the trends discussed in the present analysis: reducing emissions associated with economic activity and urbanization while simultaneously accelerating the use of renewable energy. The progress achieved in Greece—a roughly 30% decline in emissions in 2020 compared with 2005—illustrates that a combination of structural economic shifts, policy measures, and technological adoption can produce significant emissions reduction. However, the analysis suggests that, in the absence of further interventions, a robust rebound in GDP could trigger a renewed increase in emissions, underscoring the critical importance of ‘green growth’ strategies, which emphasize renewable energy expansion, circular economy practices, and, if appropriate, carbon pricing mechanisms to motivate low-emission investments.
Apart from CO2 emissions, the results have broader environmental implications. As highlighted in the Introduction, a critical issue for Greece in the context of climate change is water scarcity and droughts. Reducing CO2 emissions is crucial to reducing global warming and mitigating changes in the hydrological cycle, which affect water availability. Anticipated reductions in precipitation, combined with higher heatwave frequency, threaten freshwater reserves and agricultural production. Enhancing renewable energy use and energy efficiency to reduce emissions requires that Greece support global climate mitigation efforts and protect water resources and ecosystems. Renewable energy technologies, particularly solar and wind, require substantially less water than thermal power plants [95], providing an additional advantage under conditions of water stress. Thus, combining mitigation and adaptation measures is clearly demonstrated: adopting low-emission processes in Greece yields multiple co-benefits for water resources and environmental quality (i.e., fresh air in urban areas, healthier forest ecosystems, etc.). Notably, Greece’s abundant solar and wind potential makes extensive renewable energy use a sustainable and economically advantageous strategy.
In conclusion, to discuss the potential limitations of the present research, it is worth noting that excluding additional relevant drivers, such as energy prices, trade openness, technological change, or policy-related factors, may introduce omitted-variable bias. The association between urbanization and CO2 emissions may exhibit non-linear characteristics [96]. While higher-order terms were not incorporated into the baseline specification, given that the linear model adequately explained the majority of observations, future research could rigorously test hypotheses such as the Environmental Kuznets Curve (EKC) in the Greek context. A further limitation involves potential endogeneity. CO2 emissions may exert feedback effects on economic growth (e.g., via regulatory interventions that affect development), which the OLS approach does not address. More advanced methodologies, such as instrumental variable techniques or simultaneous equation models, could provide more robust identification of causal effects [97,98]. Integrating additional variables, such as fossil fuel price indices or environmental policy stringency metrics, could enhance model specification and better capture exogenous shocks. The omission of these variables, however, reflects the limited availability of consistent annual data since the 1960s, which justifies the focus on the three principal explanatory variables. The analytical framework could be further enhanced by employing cointegration techniques or dynamic error-correction models [99,100,101], which enable distinguishing between short-term and long-term effects while addressing potential non-stationarity. Future research may extend the present framework by employing dynamic error-correction models (e.g., ARDL, FMOLS, or DOLS) to explicitly model short-run adjustments and speed-of-adjustment dynamics. In addition, expanding the analysis to panel data by including comparable European Union countries [102] could provide a broader perspective, which requires the application of fixed- or random-effects models.
6. Conclusions
The present research explores the drivers of CO2 emissions in Greece, employing annual historical data for the period 1965–2023. By applying the Ordinary Least Squares (OLS) approach, with CO2 emissions as the dependent variable and GDP, urbanization, and the share of renewable energy in the national energy mix as the independent variables, the research aimed at investigating the impact of the examined determinants on emissions.
The empirical evidence substantiates the hypothesized relationships: (1) economic growth has historically exerted an upward pressure on CO2 emissions in Greece; (2) urbanization has further contributed to increased emissions; and (3) the increased use of renewable energy sources has effectively mitigated emissions. In detail, increases in economic activity are associated with higher CO2 emissions in the long run. A one-percentage-point increase in the urban population share is associated with an additional 1.5–2 million tonnes of annual CO2 emissions, whereas a one-percentage-point increase in the share of renewables in the energy mix implies a reduction of approximately 4.5 million tonnes of CO2.
Despite any limitations, the present research introduces innovations, employing an estimation model with long historical time series and updated data for the first time in the Greek context. It further corroborates that the relationships observed in other countries between GDP, urbanization, and the share of renewable energy are similarly observed in Greece. The methodology and findings discussed can offer a valuable framework for assessing and improving environmental policies in Greece. Thus, the country can ensure that green growth, sustainable and low-emission urban areas, and abundant natural resources (including solar and water potential) are promoted and preserved for future generations.
Author Contributions
Conceptualization, A.T.; methodology, A.T.; software, A.T.; validation, A.T.; investigation, A.T.; resources, A.T.; data curation, A.T.; writing—original draft, P.F.; writing—review & editing, P.F.; visualization, A.T.; supervision, P.F.; project administration, P.F.; funding acquisition, P.F. All authors have read and agreed to the published version of the manuscript.
Funding
This research received no external funding. The APC was funded by the authors.
Data Availability Statement
All publicly available data used for this work has been referenced accordingly. The processed outcome results can be made available from the author upon reasonable request.
Acknowledgments
The author acknowledges the University of Western Macedonia.
Conflicts of Interest
The authors declare no conflicts of interest.
References
- Shakun, J.D.; Clark, P.U.; He, F.; Marcott, S.A.; Mix, A.C.; Liu, Z.; Otto-Bliesner, B.; Schmittner, A.; Bard, E. Global warming preceded by increasing carbon dioxide concentrations during the last deglaciation. Nature 2012, 484, 49–54. [Google Scholar] [CrossRef] [Scilit]
- Hertzberg, M.; Schreuder, H. Role of atmospheric carbon dioxide in climate change. Energy Environ. 2016, 27, 785–797. [Google Scholar] [CrossRef] [Scilit]
- Anderson, T.R.; Hawkins, E.; Jones, P.D. CO2, the greenhouse effect and global warming: From the pioneering work of Arrhenius and Callendar to today’s Earth System Models. Endeavour 2016, 40, 178–187. [Google Scholar] [CrossRef] [Scilit] [PubMed]
- Yoro, K.O.; Daramola, M.O. CO2 emission sources, greenhouse gases, and the global warming effect. In Advances in Carbon Capture: Methods, Technologies and Applications; Woodhead Publishing: Cambridge, UK, 2020; pp. 3–28. [Google Scholar] [CrossRef] [Scilit]
- Bäckstrand, K. Towards a Climate-Neutral Union by 2050? The European Green Deal, Climate Law, and Green Recovery. In Routes to a Resilient European Union: Interdisciplinary European Studies; Springer: Berlin/Heidelberg, Germany, 2022. [Google Scholar] [CrossRef] [Scilit]
- Wolf, S.; Teitge, J.; Mielke, J.; Schütze, F.; Jaeger, C. The European Green Deal—More Than Climate Neutrality. Intereconomics 2021, 56, 99–107. [Google Scholar] [CrossRef] [Scilit]
- European Commission The European Green Deal. 2019. Available online: https://eur-lex.europa.eu/legal-content/EN/TXT/?uri=COM:2019:640:FIN (accessed on 8 January 2026).
- United Nations Framework Convention on Climate Change Paris Agreement. 2015. Available online: https://unfccc.int/sites/default/files/english_paris_agreement.pdf (accessed on 8 January 2026).
- Tranoulidis, A.; Sotiropoulou, R.E.P.; Bithas, K.; Tagaris, E. Decarbonization and Transition to the Post-Lignite Era: Analysis for a Sustainable Transition in the Region of Western Macedonia. Sustainability 2022, 14, 10173. [Google Scholar] [CrossRef] [Scilit]
- Panwar, N.L.; Kaushik, S.C.; Kothari, S. Role of renewable energy sources in environmental protection: A review. Renew. Sustain. Energy Rev. 2011, 15, 1513–1524. [Google Scholar] [CrossRef] [Scilit]
- Wang, Q.; Zhang, S.; Li, R. Artificial Intelligence in the Renewable Energy Transition: The Critical Role of Financial Development. Renew. Sustain. Energy Rev. 2026, 226, 116280. [Google Scholar] [CrossRef] [Scilit]
- Liu, J.; Shen, H.; Chen, J.; Jiang, X.; Siyal, A.W. Artificial Intelligence and Carbon Emissions: Mediating Role of Energy Efficiency, Factor Market Allocation and Industrial Structure. Energies 2025, 18, 1102. [Google Scholar] [CrossRef] [Scilit]
- He, Y.; Li, X.; Huang, P.; Wang, J. Exploring the Road toward Environmental Sustainability: Natural Resources, Renewable Energy Consumption, Economic Growth, and Greenhouse Gas Emissions. Sustainability 2022, 14, 1579. [Google Scholar] [CrossRef] [Scilit]
- Romanello, M.; Di Napoli, C.; Drummond, P.; Green, C.; Kennard, H.; Lampard, P.; Scamman, D.; Arnell, N.; Ayeb-Karlsson, S.; Ford, L.B.; et al. The 2022 report of the Lancet Countdown on health and climate change: Health at the mercy of fossil fuels. Lancet 2022, 400, 1619–1654. [Google Scholar] [CrossRef] [Scilit]
- Choudhry, T.; Kayani, U.N.; Gul, A.; Haider, S.A.; Ahmad, S. Carbon emissions, environmental distortions, and impact on growth. Energy Econ. 2023, 126, 107040. [Google Scholar] [CrossRef] [Scilit]
- Amer, E.A.A.A.; Meyad, E.M.A.; Meyad, A.M.; Mohsin, A.K.M. The impact of natural resources on environmental degradation: A review of ecological footprint and CO2 emissions as indicators. Front. Environ. Sci. 2024, 12, 1368125. [Google Scholar] [CrossRef] [Scilit]
- OECD. Biodiversity, Water and Ecosystems: Freshwater-Abstractions; OECD Environment Statistics (Data-Base): Paris, France, 2025. [Google Scholar] [CrossRef] [Scilit]
- Kourgialas, N.N.; Anyfanti, I.; Karatzas, G.P.; Dokou, Z. An integrated method for assessing drought prone areas-Water efficiency practices for a climate resilient Mediterranean agriculture. Sci. Total Environ. 2018, 625, 1290–1300. [Google Scholar] [CrossRef] [Scilit]
- Vasilakou, C.; Tsesmelis, D.E.; Kalogeropoulos, K.; Barouchas, P.E.; Machairas, I.; Feloni, E.G.; Tsatsaris, A.; Karavitis, C.A. Assessing Drought Severity in Greece Using Geospatial Data and Environmental Indices. Geomatics 2025, 5, 10. [Google Scholar] [CrossRef] [Scilit]
- Todaro, V.; D’Oria, M.; Secci, D.; Zanini, A.; Tanda, M.G. Climate Change over the Mediterranean Region: Local Temperature and Precipitation Variations at Five Pilot Sites. Water 2022, 14, 2499. [Google Scholar] [CrossRef] [Scilit]
- Dimitriou, I.C.; Trachanas, G.P.; Arsenopoulos, A.; Sarmas, E. Future Heat Risk Index: The Case of Attica Regions, Greece. In Proceedings of the 15th International Conference on Information, Intelligence, Systems and Applications, IISA 2024, Chania, Greece, 17–19 July 2024; Springer: Berlin/Heidelberg, Germany, 2024. [Google Scholar] [CrossRef] [Scilit]
- ClimateChangePost. Fresh Water Resources—Greece. Available online: https://www.climatechangepost.com/countries/greece/fresh-water-resources/ (accessed on 8 January 2026).
- Ricart, S.; Villar-Navascués, R.; Reyes, M.; Rico-Amorós, A.M.; Hernández-Hernández, M.; Toth, E.; Bragalli, C.; Neri, M.; Amelung, B. Water—tourism nexus research in the Mediterranean in the past two decades: A systematic literature review. Int. J. Water Resour. Dev. 2024, 40, 57–83. [Google Scholar] [CrossRef] [Scilit]
- Gabarda-Mallorquí, A.; Deyá, B.; Tirado, D. Exploring research on water-saving measures applied to the hotel sector. A critical systematic review. Int. J. Hosp. Manag. 2024, 120, 103747. [Google Scholar] [CrossRef] [Scilit]
- Symeonidou, S.; Vagiona, D. Water footprint of crops on Rhodes Island. Water 2019, 11, 1084. [Google Scholar] [CrossRef] [Scilit]
- European Commission. National Energy and Climate Plan. 2019. Available online: https://energy.ec.europa.eu/system/files/2020-03/el_final_necp_main_en_0.pdf (accessed on 8 January 2026).
- European Commission. National Energy and Climate Plan. 2025. Available online: https://commission.europa.eu/publications/greece-final-updated-necp-2021-2030-submitted-2025_en (accessed on 8 January 2026).
- Pegkas, P. Interrelationships between tourism, energy, environment and economic growth in Greece. Anatolia 2020, 31, 565–576. [Google Scholar] [CrossRef] [Scilit]
- Dritsaki, M.; Dritsaki, C.; Argyriou, V.; Sarigiannidis, P. Impact of renewable and non-renewable generation on economic growth in Greece. Electr. J. 2024, 37, 107421. [Google Scholar] [CrossRef] [Scilit]
- Usubiaga-Liaño, A.; Ekins, P. Monitoring the environmental sustainability of countries through the strong environmental sustainability index. Ecol. Indic. 2021, 132, 108281. [Google Scholar] [CrossRef] [Scilit]
- Al Amosh, H.; Khatib, S.F.A. Environmental innovation and carbon emissions reduction in European healthcare: The moderating role of environmental monitoring practices. Clean. Responsible Consum. 2025, 16, 100255. [Google Scholar] [CrossRef] [Scilit]
- Ibrahim, M.; Krishna, B.K.; Fraser, E.D.G. Bridging the gap in sustainability measurement and reporting for agroecosystems: Overview and development of an adaptive sustainability assessment and monitoring framework. Ecol. Indic. 2025, 170, 113091. [Google Scholar] [CrossRef] [Scilit]
- Bella, G.; Massidda, C.; Mattana, P. The relationship among CO2 emissions, electricity power consumption and GDP in OECD countries. J. Policy Model. 2014, 36, 970–985. [Google Scholar] [CrossRef] [Scilit]
- Ramanathan, R. A multi-factor efficiency perspective to the relationships among world GDP, energy consumption and carbon dioxide emissions. Technol. Forecast. Soc. Change 2006, 73, 483–494. [Google Scholar] [CrossRef] [Scilit]
- Magazzino, C. The relationship between real GDP, CO2 emissions, and energy use in the GCC countries: A time series approach. Cogent Econ. Financ. 2016, 4, 1152729. [Google Scholar] [CrossRef] [Scilit]
- Özokcu, S.; Özdemir, Ö. Economic growth, energy, and environmental Kuznets curve. Renew. Sustain. Energy Rev. 2017, 72, 639–647. [Google Scholar] [CrossRef] [Scilit]
- Sarkodie, S.A.; Strezov, V. A review on Environmental Kuznets Curve hypothesis using bibliometric and meta-analysis. Sci. Total Environ. 2019, 649, 128–145. [Google Scholar] [CrossRef] [Scilit]
- Stern, D.I. The Rise and Fall of the Environmental Kuznets Curve. World Dev. 2004, 32, 1419–1439. [Google Scholar] [CrossRef] [Scilit]
- Dogan, E.; Turkekul, B. CO2 emissions, real output, energy consumption, trade, urbanization and financial development: Testing the EKC hypothesis for the USA. Environ. Sci. Pollut. Res. 2016, 23, 1203–1213. [Google Scholar] [CrossRef] [Scilit]
- Song, S.; Tan, H.; Zhang, Y.; Ma, Y. A multiscale analysis of the relationship between urbanization and CO2 emissions using geo-weighted regression model. Discov. Sustain. 2024, 5, 113. [Google Scholar] [CrossRef] [Scilit]
- Wang, Q.; Wu, S.D.; Zeng, Y.E.; Wu, B.W. Exploring the relationship between urbanization, energy consumption, and CO2 emissions in different provinces of China. Renew. Sustain. Energy Rev. 2016, 54, 1563–1579. [Google Scholar] [CrossRef] [Scilit]
- Ma, B.; Ogata, S. Impact of Urbanization on Carbon Dioxide Emissions—Evidence from 136 Countries and Regions. Sustainability 2024, 16, 7878. [Google Scholar] [CrossRef] [Scilit]
- Shabani, E.; Hayati, B.; Pishbahar, E.; Ghorbani, M.A.; Ghahremanzadeh, M. The relationship between CO2 emission, economic growth, energy consumption, and urbanization in the ECO member countries. Int. J. Environ. Sci. Technol. 2022, 19, 1861–1876. [Google Scholar] [CrossRef] [Scilit]
- Gierałtowska, U.; Asyngier, R.; Nakonieczny, J.; Salahodjaev, R. Renewable Energy, Urbanization, and CO2 Emissions: A Global Test. Energies 2022, 15, 3390. [Google Scholar] [CrossRef] [Scilit]
- Zhou, Y.; Jin, H.; Li, C.; Ding, L. Spatio-temporal patterns and impact mechanisms of CO2 emissions from China’s construction industry under urbanization. Sustain. Cities Soc. 2024, 106, 105353. [Google Scholar] [CrossRef] [Scilit]
- Gkentzi, D.; Tsagri, C.; Kostopoulou, E.; Fouzas, S.; Vantarakis, A.; Dimitriou, G.; Varvarigou, A. Attitudes and beliefs of parents about routine childhood vaccination in Greece. Hum. Vaccines Immunother. 2021, 17, 3066–3072. [Google Scholar] [CrossRef] [Scilit]
- Lemonakis, C.; Alexopoulos, G.; Garefalakis, A.; Garefalakis, S. Trends and new elements in urban hierarchy research: The Greek paradigm. Ann. Reg. Sci. 2024, 72, 335–354. [Google Scholar] [CrossRef] [Scilit]
- Stathakis, D.; Baltas, P. The Greek model of urbanization. Land Use Policy 2024, 140, 107113. [Google Scholar] [CrossRef] [Scilit]
- Dilanchiev, A.; Nuta, F.; Khan, I.; Khan, H. Urbanization, renewable energy production, and carbon dioxide emission in BSEC member states: Implications for climate change mitigation and energy markets. Environ. Sci. Pollut. Res. 2023, 30, 67338–67350. [Google Scholar] [CrossRef] [Scilit]
- Aydoğan, B.; Vardar, G. Evaluating the role of renewable energy, economic growth and agriculture on CO2 emission in E7 countries. Int. J. Sustain. Energy 2020, 39, 335–348. [Google Scholar] [CrossRef] [Scilit]
- Grodzicki, T.; Jankiewicz, M. The impact of renewable energy and urbanization on CO2 emissions in Europe–Spatio-temporal approach. Environ. Dev. 2022, 44, 100755. [Google Scholar] [CrossRef] [Scilit]
- Emir, F.; Bekun, F.V. Energy intensity, carbon emissions, renewable energy, and economic growth nexus: New insights from Romania. Energy Environ. 2019, 30, 427–443. [Google Scholar] [CrossRef] [Scilit]
- Lorente-de-Las-Casas, A.; Marrero, G.A. Impact of renewable energies on CO2 emissions in the OECD. Energy Sources Part B Econ. Plan. Policy 2025, 20, 2517325. [Google Scholar] [CrossRef] [Scilit]
- Sobczuk, S.; Jaroń, A.; Mazur, M.; Borucka, A. Renewable Energy and CO2 Emissions: Analysis of the Life Cycle and Impact on the Ecosystem in the Context of Energy Mix Changes. Energies 2025, 18, 3332. [Google Scholar] [CrossRef] [Scilit]
- Hellenic Republic Ministry of Environment and Energy. National Inventory Report of Greece for Greenhouse Gases (1990–2023). 2025. Available online: https://ypen.gov.gr/wp-content/uploads/2025/04/2025_NIR_Greece.pdf (accessed on 8 January 2026).
- Stamatiou, P.; Dritsaki, C.; Niklis, D. CO2 Emissions, Energy Consumption, Economic Growth, Trade, and Urbanization in Greece. In Springer Proceedings in Business and Economics; Springer: Berlin/Heidelberg, Germany, 2021. [Google Scholar] [CrossRef] [Scilit]
- Işik, C.; Kasımatı, E.; Ongan, S. Analyzing the causalities between economic growth, financial development, international trade, tourism expenditure and/on the CO2 emissions in Greece. Energy Sources Part B Econ. Plan. Policy 2017, 12, 665–673. [Google Scholar] [CrossRef] [Scilit]
- Singh, S.; Rawandale, C.J.; Kaul, M. Impact of renewable and non-renewable energy, trade openness, GDP, and urbanization on CO2 emissions: A panel study of CEE countries. Int. J. Energy Sect. Manag. 2025, 20, 156–172. [Google Scholar] [CrossRef] [Scilit]
- Agama, O.; Onum, F.O.; Omachi, A.; Okoh, O.F. The Effect of CO2 Carbon Emission on Sustainable Economic Growth in Some Selected Countries of Ecowas: Panel Data Approach. Econ. Growth Environ. Sustain. 2025, 4, 40–45. [Google Scholar]
- Biyase, M.; Kirsten, F.; Zwane, T.; Bila, S. Tracing environmental Kuznets curves: Unveiling the interplay of inequality, urbanization, GDP and emissions in BRICS nations. BRICS J. Econ. 2024, 5, 83–104. [Google Scholar] [CrossRef] [Scilit]
- Lojanica, N.; Pantović, D.; Dimitrijević, M.; Obradović, S.; Nancu, D. The Effects of Renewable Energy, Economic Growth, and Trade on CO2 Emissions in the EU-15. Energies 2025, 18, 4363. [Google Scholar] [CrossRef] [Scilit]
- de Oliveira, H.V.E.; Brasão, A.C.; Moutinho, V.; Marques, L. Socio-Economic Drivers of Renewable Energy Consumption: A Dynamic Panel Analysis of Rural and Urban Contexts in Europe. Energies 2025, 18, 6475. [Google Scholar] [CrossRef] [Scilit]
- Koukouzas, N.; Maraslidis, G.S.; Stergiou, C.L.; Zarogiannis, T.; Manoukian, E.; Haske, J.; Möllerherm, S.; Rogosz, B. Energy Transition in Greece: A Regional and National Media Analysis. Energies 2025, 18, 4595. [Google Scholar] [CrossRef] [Scilit]
- Ritchie, H.; Rosado, P.; Roser, M. CO2 and Greenhouse Gas Emissions, Published Online at OurWorldinData.org. Available online: https://ourworldindata.org/co2-and-greenhouse-gas-emissions (accessed on 10 January 2026).
- OECD Greece. Available online: https://www.oecd.org/en/countries/greece.html (accessed on 8 January 2026).
- World Bank Urban Population (% of Total): Greece. Available online: https://data.worldbank.org/ (accessed on 8 January 2026).
- Our World in Data Global Carbon Budget (2025)—With Major Processing by Our World in Data. Available online: https://archive.ourworldindata.org/20251204-133459/grapher/annual-co2-emissions-per-country.html (accessed on 8 January 2026).
- Our World in Data. National Statistical Organizations and Central Banks, OECD National Accounts, and World Bank Staff Estimates (2025)—With Minor Processing by Our World in Data. Available online: https://archive.ourworldindata.org/20251220-152415/grapher/gdp-worldbank-constant-usd.html (accessed on 8 January 2026).
- Our World in Data Energy Institute-Statistical Review of World Energy (2025)—With Major Processing by Our World in Data. Available online: https://ourworldindata.org/profile/energy/greece (accessed on 8 January 2026).
- Wooditch, A.; Johnson, N.J.; Solymosi, R.; Ariza, J.M.; Langton, S. A Beginner’s Guide to Statistics for Criminology and Criminal Justice Using R; Springer Nature: Durham, NC, USA, 2021. [Google Scholar] [CrossRef] [Scilit]
- Acito, F. Ordinary Least Squares Regression. In Predictive Analytics with KNIME; Springer: Berlin/Heidelberg, Germany, 2023. [Google Scholar] [CrossRef] [Scilit]
- Wang, Z.; Yin, F.; Zhang, Y.; Zhang, X. An empirical research on the influencing factors of regional CO2 emissions: Evidence from Beijing city, China. Appl. Energy 2012, 100, 277–284. [Google Scholar] [CrossRef] [Scilit]
- IHS Global Inc. EViews 7; Statistical Software; IHS Global Inc.: Irvine, CA, USA, 2010; Available online: https://www.eviews.com (accessed on 2 January 2026).
- Kaaro, H. Investment Decision and Dividend Policy as Determinants of Financing Decision: A New Empirical Evidence. J. Account. Manag. Econ. Res. 2002, 2, 41–55. [Google Scholar]
- Kwiatkowski, D.; Phillips, P.C.B.; Schmidt, P.; Shin, Y. Testing the null hypothesis of stationarity against the alternative of a unit root. How sure are we that economic time series have a unit root? J. Econom. 1992, 54, 159–178. [Google Scholar] [CrossRef] [Scilit]
- Breusch, T.S.; Pagan, A.R. A Simple Test for Heteroscedasticity and Random Coefficient Variation. Econometrica 1979, 47, 1287. [Google Scholar] [CrossRef] [Scilit]
- Durbin, J.; Watson, G.S. Testing for Serial Correlation in Least Squares Regression: I. Biometrika 1950, 37, 409. [Google Scholar] [CrossRef] [Scilit] [PubMed]
- Pacifico, A. Robust open Bayesian analysis: Overfitting, model uncertainty, and endogeneity issues in multiple regression models. Econ. Rev. 2021, 40, 148–176. [Google Scholar] [CrossRef] [Scilit]
- Rohlfs, C. Forbidden Knowledge and Specialized Training: A Versatile Solution for the Two Main Sources of Overfitting in Linear Regression. Am. Stat. 2023, 77, 160–168. [Google Scholar] [CrossRef] [Scilit]
- Thadewald, T.; Büning, H. Jarque-Bera test and its competitors for testing normality-A power comparison. J. Appl. Stat. 2007, 34, 87–105. [Google Scholar] [CrossRef] [Scilit]
- Bildirici, M.; Ersin, Ö.Ö.; Ibrahim, B. Chaos, Fractionality, Nonlinear Contagion, and Causality Dynamics of the Metaverse, Energy Consumption, and Environmental Pollution: Markov-Switching Generalized Autoregressive Conditional Heteroskedasticity Copula and Causality Methods. Fractal Fract. 2024, 8, 114. [Google Scholar] [CrossRef] [Scilit]
- Bondarenko, J. Outbreaks detection at the beginning of monitoring process: The CUSUM test modification. In Informatics in Control, Automation and Robotics; Lecture Notes in Electrical Engineering; Springer: Berlin/Heidelberg, Germany, 2009. [Google Scholar] [CrossRef] [Scilit]
- Drăgan, C.O.; Mihai, L.S.; Popescu, A.M.C.; Buligiu, I.; Mirescu, L.; Militaru, D. Statistical Analysis and Forecasts of Performance Indicators in the Romanian Healthcare System. Healthcare 2025, 13, 102. [Google Scholar] [CrossRef] [Scilit] [PubMed]
- Daoud, J.I. Multicollinearity and Regression Analysis. J. Phys. Conf. Ser. 2018, 949, 012009. [Google Scholar] [CrossRef] [Scilit]
- Wang, J.; Ji, T.; Li, M. A combined short-term forecast model of wind power based on empirical mode decomposition and augmented dickey-fuller test. J. Phys. Conf. Ser. 2021, 2022, 012017. [Google Scholar] [CrossRef] [Scilit]
- Nelson, C.R.; Plosser, C.R. Trends and random walks in macroeconmic time series. Some evidence and implications. J. Monet. Econ. 1982, 10, 139–162. [Google Scholar] [CrossRef] [Scilit]
- Stock, J.H.; Watson, M.W. Dynamic Factor Models, Factor-Augmented Vector Autoregressions, and Structural Vector Autoregressions in Macroeconomics. In Handbook of Macroeconomics; Elsevier: Amsterdam, The Netherlands, 2016; Volume 2. [Google Scholar] [CrossRef] [Scilit]
- Neath, A.A.; Cavanaugh, J.E. Regression and time series model selection using variants of the Schwarz information criterion. Commun. Stat. Theory Methods 1997, 26, 559–580. [Google Scholar] [CrossRef] [Scilit]
- Mackinnon, J.G. Numerical distribution functions for unit root and cointegration tests. J. Appl. Econom. 1996, 11, 601–618. [Google Scholar] [CrossRef] [Scilit]
- Rasheed, M.Q.; Yuhuan, Z.; Nazir, M.; Ahmed, Z.; Yu, X. How do semiconductors, artificial intelligence; geopolitical risk, and their moderating effects shape renewable energy production in leading semiconductor manufacturing countries? Technol. Soc. 2025, 80, 102761. [Google Scholar] [CrossRef] [Scilit]
- Baghi, E.S.M.S.; Ranjbar, E. Seeking low carbon urban design through modelling of carbon emission from different sources in urban neighbourhoods, case study: Semnan. Int. J. Urban Sustain. Dev. 2021, 13, 546–568. [Google Scholar] [CrossRef] [Scilit]
- Winkler, L.; Pearce, D.; Nelson, J.; Babacan, O. The effect of sustainable mobility transition policies on cumulative urban transport emissions and energy demand. Nat. Commun. 2023, 14, 2357. [Google Scholar] [CrossRef] [Scilit]
- Mensah, S.; Ameyaw, C.; Yeboah, W.A. Localizing urban buildings carbon emissions reduction: Causes and strategies. Int. J. Build. Pathol. Adapt. 2025, 43, 787–803. [Google Scholar] [CrossRef] [Scilit]
- Hong, S.; Hui, E.C.M.; Lin, Y. Relationship between urban spatial structure and carbon emissions: A literature review. Ecol. Indic. 2022, 144, 109456. [Google Scholar] [CrossRef] [Scilit]
- Jin, Y.; Behrens, P.; Tukker, A.; Scherer, L. Water use of electricity technologies: A global meta-analysis. Renew. Sustain. Energy Rev. 2019, 115, 109391. [Google Scholar] [CrossRef] [Scilit]
- Hashmi, S.H.; Fan, H.; Habib, Y.; Riaz, A. Non-linear relationship between urbanization paths and CO2 emissions: A case of South, South-East and East Asian economies. Urban Clim. 2021, 37, 100814. [Google Scholar] [CrossRef] [Scilit]
- Fukuda, K. Introducing new endogeneity into a simultaneous equation model: An application to corporate finance. Appl. Econ. 2023, 55, 369–379. [Google Scholar] [CrossRef] [Scilit]
- Ikpere, C.O.; Aronu, C.O. Improved Two Stage Least Square Estimation with Permutation Methods for Solving Endogeneity Problems. Earthline J. Math. Sci. 2024, 14, 1213–1228. [Google Scholar] [CrossRef] [Scilit]
- Munkhdalai, L.; Munkhdalai, T.; Pham, V.H.; Li, M.; Ryu, K.H.; Theera-Umpon, N. Recurrent Neural Network-Augmented Locally Adaptive Interpretable Regression for Multivariate Time-Series Forecasting. IEEE Access 2022, 10, 11871–11885. [Google Scholar] [CrossRef] [Scilit]
- Chen, L.; Chen, D.; Shang, Z.; Wu, B.; Zheng, C.; Wen, B.; Zhang, W. Multi-Scale Adaptive Graph Neural Network for Multivariate Time Series Forecasting. IEEE Trans. Knowl. Data Eng. 2023, 35, 10748–10761. [Google Scholar] [CrossRef] [Scilit]
- Jiang, S.; Yu, Z.G.; Anh, V.V.; Zhou, Y. Long- and short-term time series forecasting of air quality by a multi-scale framework. Environ. Pollut. 2021, 271, 116381. [Google Scholar] [CrossRef] [Scilit]
- Busu, M.; Nedelcu, A.C. Analyzing the renewable energy and co2 emission levels nexus at an eu level: A panel data regression approach. Processes 2021, 9, 130. [Google Scholar] [CrossRef] [Scilit]

Disclaimer/Publisher’s Note: The statements, opinions and data contained in all publications are solely those of the individual author(s) and contributor(s) and not of MDPI and/or the editor(s). MDPI and/or the editor(s) disclaim responsibility for any injury to people or property resulting from any ideas, methods, instructions or products referred to in the content. |
© 2026 by the authors. Licensee MDPI, Basel, Switzerland. This article is an open access article distributed under the terms and conditions of the Creative Commons Attribution (CC BY) license.