


Abstract
This study investigates direction-dependent roof speed-up factors for both isolated and interacting building configurations and evaluates their influence on the energy-yield potential of small wind turbines (SWTs) in urban environments. A combined approach was adopted: A theoretical framework and wind-tunnel experiments were developed to establish a general understanding of the meteorological, aerodynamic, and energetic parameters governing rooftop wind energy conversion and to derive characteristic roof speed-up factors for standardized flat-roof configurations. Wind-tunnel experiments were conducted for four distinct building scenarios, differing in layout and surrounding interaction, under three representative wind directions. High-resolution velocity measurements were acquired at multiple rooftop positions and elevations to capture detailed flow-acceleration and turbulence patterns. The resulting data were then applied in a case study for a representative urban site in Aachen, Germany. The measured directional speed-up factors were combined with a Weibull wind-speed distribution and a representative SWT power curve to estimate annual energy yields. The results reveal pronounced spatial and directional variability in wind acceleration, with localized increases of up to 25%. These variations translate into substantial differences in expected turbine performance depending on mounting height, placement, and prevailing wind direction. To facilitate further research and practical use, the complete dataset is published openly as a benchmark for computational fluid dynamics (CFD) validation and as a planning resource for rooftop turbine siting. The study underscores the importance of local aerodynamic effects in urban wind-energy design and provides a methodological framework that links controlled wind-tunnel data with real-world wind statistics.
1. Introduction
The global transition toward renewable energy sources has intensified interest in decentralized and site-integrated generation systems. Particularly in urban areas, innovative solutions for the local production of environmentally friendly electrical energy are required. Rooftop SWTs offer a promising yet underexplored opportunity for urban environments [1,2]. However, the complex and highly turbulent nature of urban wind flow poses significant challenges to robust quantification of the potential for wind energy in these settings [3,4,5].
Assessing the technical potential of wind energy requires comprehensive consideration of the building context and its surrounding environment. Key influencing factors include prevailing wind conditions at the site, local aerodynamic effects from the building geometry, and the performance characteristics of the specific turbine type and installation. Beyond technical parameters, the economic feasibility, aesthetic integration, and societal acceptance of rooftop wind systems are essential aspects for successful implementation in urban areas.
A key phenomenon in this context is the roof speed-up effect, where wind accelerates over building edges and roof surfaces due to geometric and aerodynamic interactions [6,7]. This effect is highly sensitive to building geometry, surrounding obstructions, wind direction, and turbine placement [8,9]. Given these sensitivities, previous studies have explored these dependencies using both wind-tunnel and computational approaches. Rafailidis [10] and Abohela et al. [8] demonstrated that roof shape has a major influence on mean flow and turbulence intensity at roof level, with flat roofs generally providing more favorable wind conditions and higher power density potential above the surface [11]. Clobes [12] further observed that wind acceleration near roof edges can increase local wind loads by up to 30% compared to free-stream conditions.
While previous studies have provided valuable insights into rooftop wind acceleration, their scope and resolution remain limited with respect to systematic data availability and energy-oriented evaluation. Rafailidis [10] investigated mean flow and turbulence characteristics above idealized urban canopies and demonstrated the dominant influence of roof shape over plan-area density, but did not resolve spatially varying rooftop speed-up patterns. Abohela et al. [8] and Kono et al. [13] analyzed the influence of roof geometry, building aspect ratio, and wind direction using CFD, focusing on selected roof types or representative rooftop locations, rather than providing full-roof, height-resolved datasets. More recent work, such as Peng et al. [5], addressed urban wind effects primarily in the context of transient wind phenomena and structural loading, rather than controlled rooftop acceleration relevant to turbine siting.
The present study extends this body of work by providing a comprehensive, wind-tunnel-based dataset of rooftop wind characteristics with three key advancements. First, it delivers spatially continuous, full-roof fields of mean velocity and turbulence intensity, resolved with respect to both wind direction and height above the roof surface. Second, isolated and interacting building configurations are investigated within a unified, controlled experimental framework, enabling systematic quantification of shielding and interaction effects that are difficult to isolate in field measurements or in heterogeneous urban layouts. Third, the aerodynamic measurements are directly coupled with directional Weibull wind statistics and a representative small wind turbine power curve, establishing a quantitative link between local rooftop flow modification and realistic annual energy yield. As a result, the dataset significantly extends existing rooftop speed-up studies by moving beyond qualitative or point-based analyses toward reproducible, energy-relevant benchmarking data suitable for both CFD validation and urban wind-energy planning. The novelty of the present study does not lie in reproducing a specific real-world urban layout, but in the systematic and controlled quantification of rooftop speed-up and turbulence patterns for standardized flat-roof configurations. By deliberately employing a symmetric reference geometry, geometric and directional effects can be isolated, enabling reproducible, direction-resolved comparisons between isolated and interacting building cases that are difficult to obtain under field conditions.
This paper presents a set of measured speed-up factors for standardized flat-roof scenarios. The directional roof speed-up factors were analyzed for different building arrangements (isolated and interacting scenarios). Wind-tunnel tests with high spatial resolution captured flow velocities and turbulence intensity at multiple rooftop positions and vertical elevations. Furthermore, the energy-related effects of small wind turbines (SWTs) are examined for a case study in an urban environment, using the city of Aachen, Germany, as the example. The experimental data were combined with directional wind statistics based on a Weibull distribution and a representative turbine power curve to estimate realistic annual energy yields.
By providing both quantitative insights and an openly accessible dataset, this work addresses the urgent need for empirical validation of urban wind energy models and supports the development of planning tools for the installation of rooftop wind turbines [11]. The results contribute to a deeper understanding of urban aerodynamics and highlight the potential of integrating small-scale wind systems into the urban renewable energy mix.
Building upon this background, the following section describes the experimental methodology used to determine rooftop speed-up factors and to evaluate the corresponding wind energy potential.
2. Methodology
The general objective of this study is to assess the potential of wind energy on building rooftops. As with wind effects in general, this potential depends on the local wind conditions at a specific site and on flow modifications caused by the atmospheric boundary layer, wake flows, and bluff-body aerodynamics. To accurately determine this potential, the specifications and performance characteristics of the small wind turbine (SWT) must also be considered.
In addition to the theoretical framework and the experimental analyses of generic building configurations, a case study is presented to demonstrate the practical application of the developed methodology using site-specific data and measured aerodynamic parameters.
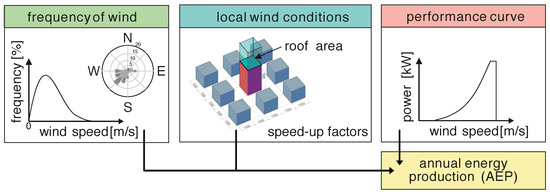
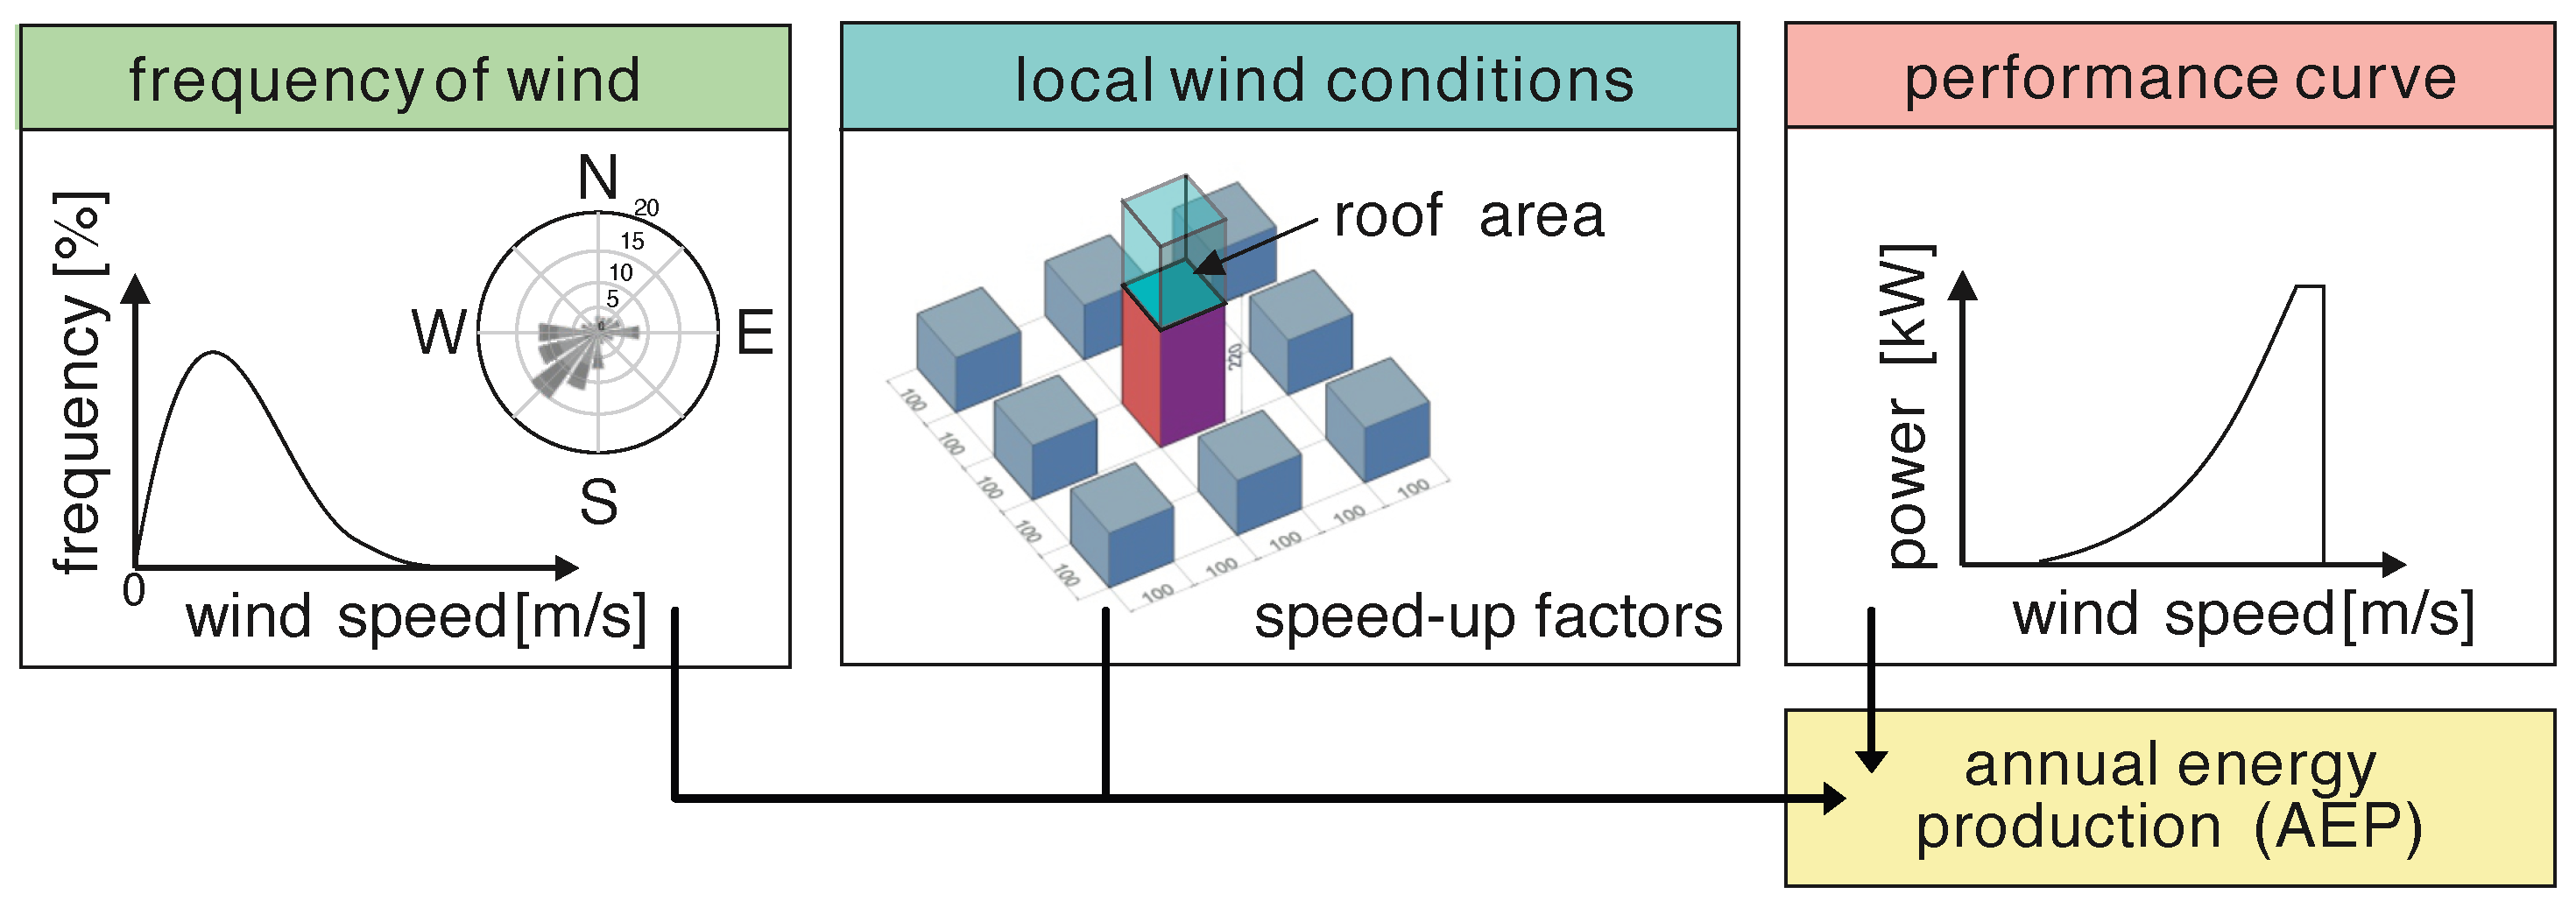
The paper addresses these aspects for both the general and case-specific investigations, as illustrated in Figure 1 and summarized as follows:
Figure 1.
Framework for the determination of urban wind energy production.
Site-specific wind conditions: Suitable wind conditions in the area under consideration are a basic prerequisite for the successful operation of wind turbines. For each site, the probability distributions of wind speed and direction must be analyzed. The analysis should account for topographic effects, evaluate available wind potential maps, and incorporate site-specific wind characteristics obtained from in situ measurements under free-flow conditions outside the urban area (e.g., provided by meteorological services). Section 3 provides general information on this procedure and presents an exemplary investigation for a specific site in the city of Aachen, Germany, as a case study.
Aerodynamic roof speed-up factors: Section 4 describes the investigations performed to determine the relevant aerodynamic parameters. Wind-tunnel experiments were conducted to quantify local flow behavior above the building rooftop for four distinct building scenarios, differing in layout and the presence of adjacent buildings, and were tested under three representative wind directions. High-resolution measurements were taken at multiple rooftop positions and heights above the surface to capture time series of flow velocity and turbulence intensity. As a result, roof speed-up factors (for mean velocity and turbulence intensity) were determined.
Wind-energy potential: Section 5 builds on the exemplary site conditions for the case study (Aachen) and extends the analysis toward an energy-potential assessment. A representative building was selected, and the roof speed-up factors derived from the general study were combined with a realistic SWT power curve. The wind-energy potential was obtained by coupling directional, site-specific annual probabilities of wind conditions with the aerodynamic properties to determine local wind characteristics. These were then combined with the power curve to estimate the corresponding power output. Integrating the instantaneous wind power over time yielded the expected annual energy production. Since the aerodynamic parameters are available for the complete roof area at multiple heights, optimal turbine positions can be identified.
The three described aspects reflect the classical Davenport Wind-Load Chain [14], which conceptually links the atmospheric wind field, aerodynamic loading, structural response, and resulting effects on buildings and other structures.
3. Site Specific Wind Conditions
3.1. General Framework
Urban wind climate is commonly characterized in probabilistic terms, separating (i) the long-term distribution of wind speed at a reference height and (ii) the directional frequency of occurrence. This representation naturally links to energy-yield estimation because turbine power is a nonlinear function of wind speed and depends on the site’s directional exposure. In what follows, we introduce the basic quantities and notation used throughout the paper.
The key quantities to describe the wind climatic conditions on a specific site can be summarized as follows:
- Mean wind speed: at a specified reference height above ground.
- Wind-speed random variable: with probability density function .
- Wind direction: (or binned into sectors ) with directional frequency .
- Long-term speed model: Weibull distribution with scale and shape .
These values are typically obtained from national meteorological services (synoptic or mesoscale stations), local in-situ measurements, reanalysis products, and published wind-potential maps.
The influence of terrain or topography effects might be relevant. When transferring or comparing datasets, roughness, exposure, and orography effects should be accounted for (e.g., via roughness classification, exposure correction, or site-specific calibration to the reference height).
The wind-speed probability density function (pdf) is modeled by the two-parameter Weibull distribution
with the cumulative distribution function (cdf):
The corresponding mean wind speed is
where denotes the Gamma function.
For directionally resolved analyses, the joint probability of speed and direction can be written as
where is obtained from the wind rose (sector frequencies), and is the conditional speed distribution in sector . In practice, is discretized into sectors and is either estimated empirically from measurements or modeled with sector-specific Weibull parameters .
The Weibull parameters A and k (optionally per direction) can be estimated from long-term datasets using maximum-likelihood or method-of-moments estimators. Directional weighting provides the natural interface to aerodynamic speed-up factors in Section 4, enabling translation from free-flow wind statistics to rooftop conditions for subsequent energy-yield assessment.
3.2. Case Study: Wind Frequency in Aachen (Germany)
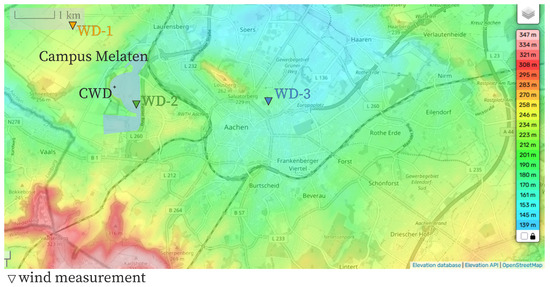
To demonstrate the application of the general framework, the wind climate of Aachen, Germany, was analyzed as a representative example of a medium-sized Central European city. The urban center of Aachen lies approximately 170 m above sea level, in a slightly lower basin relative to the surrounding terrain. The “Campus Melaten” area, located west of the city center (Figure 2), was selected as the reference site for this study. Owing to its relatively elevated position and the open terrain toward the west and north, the site experiences comparatively favorable wind conditions. The surrounding land use is predominantly agricultural in these directions, whereas urban districts border the site to the east.
Figure 2.
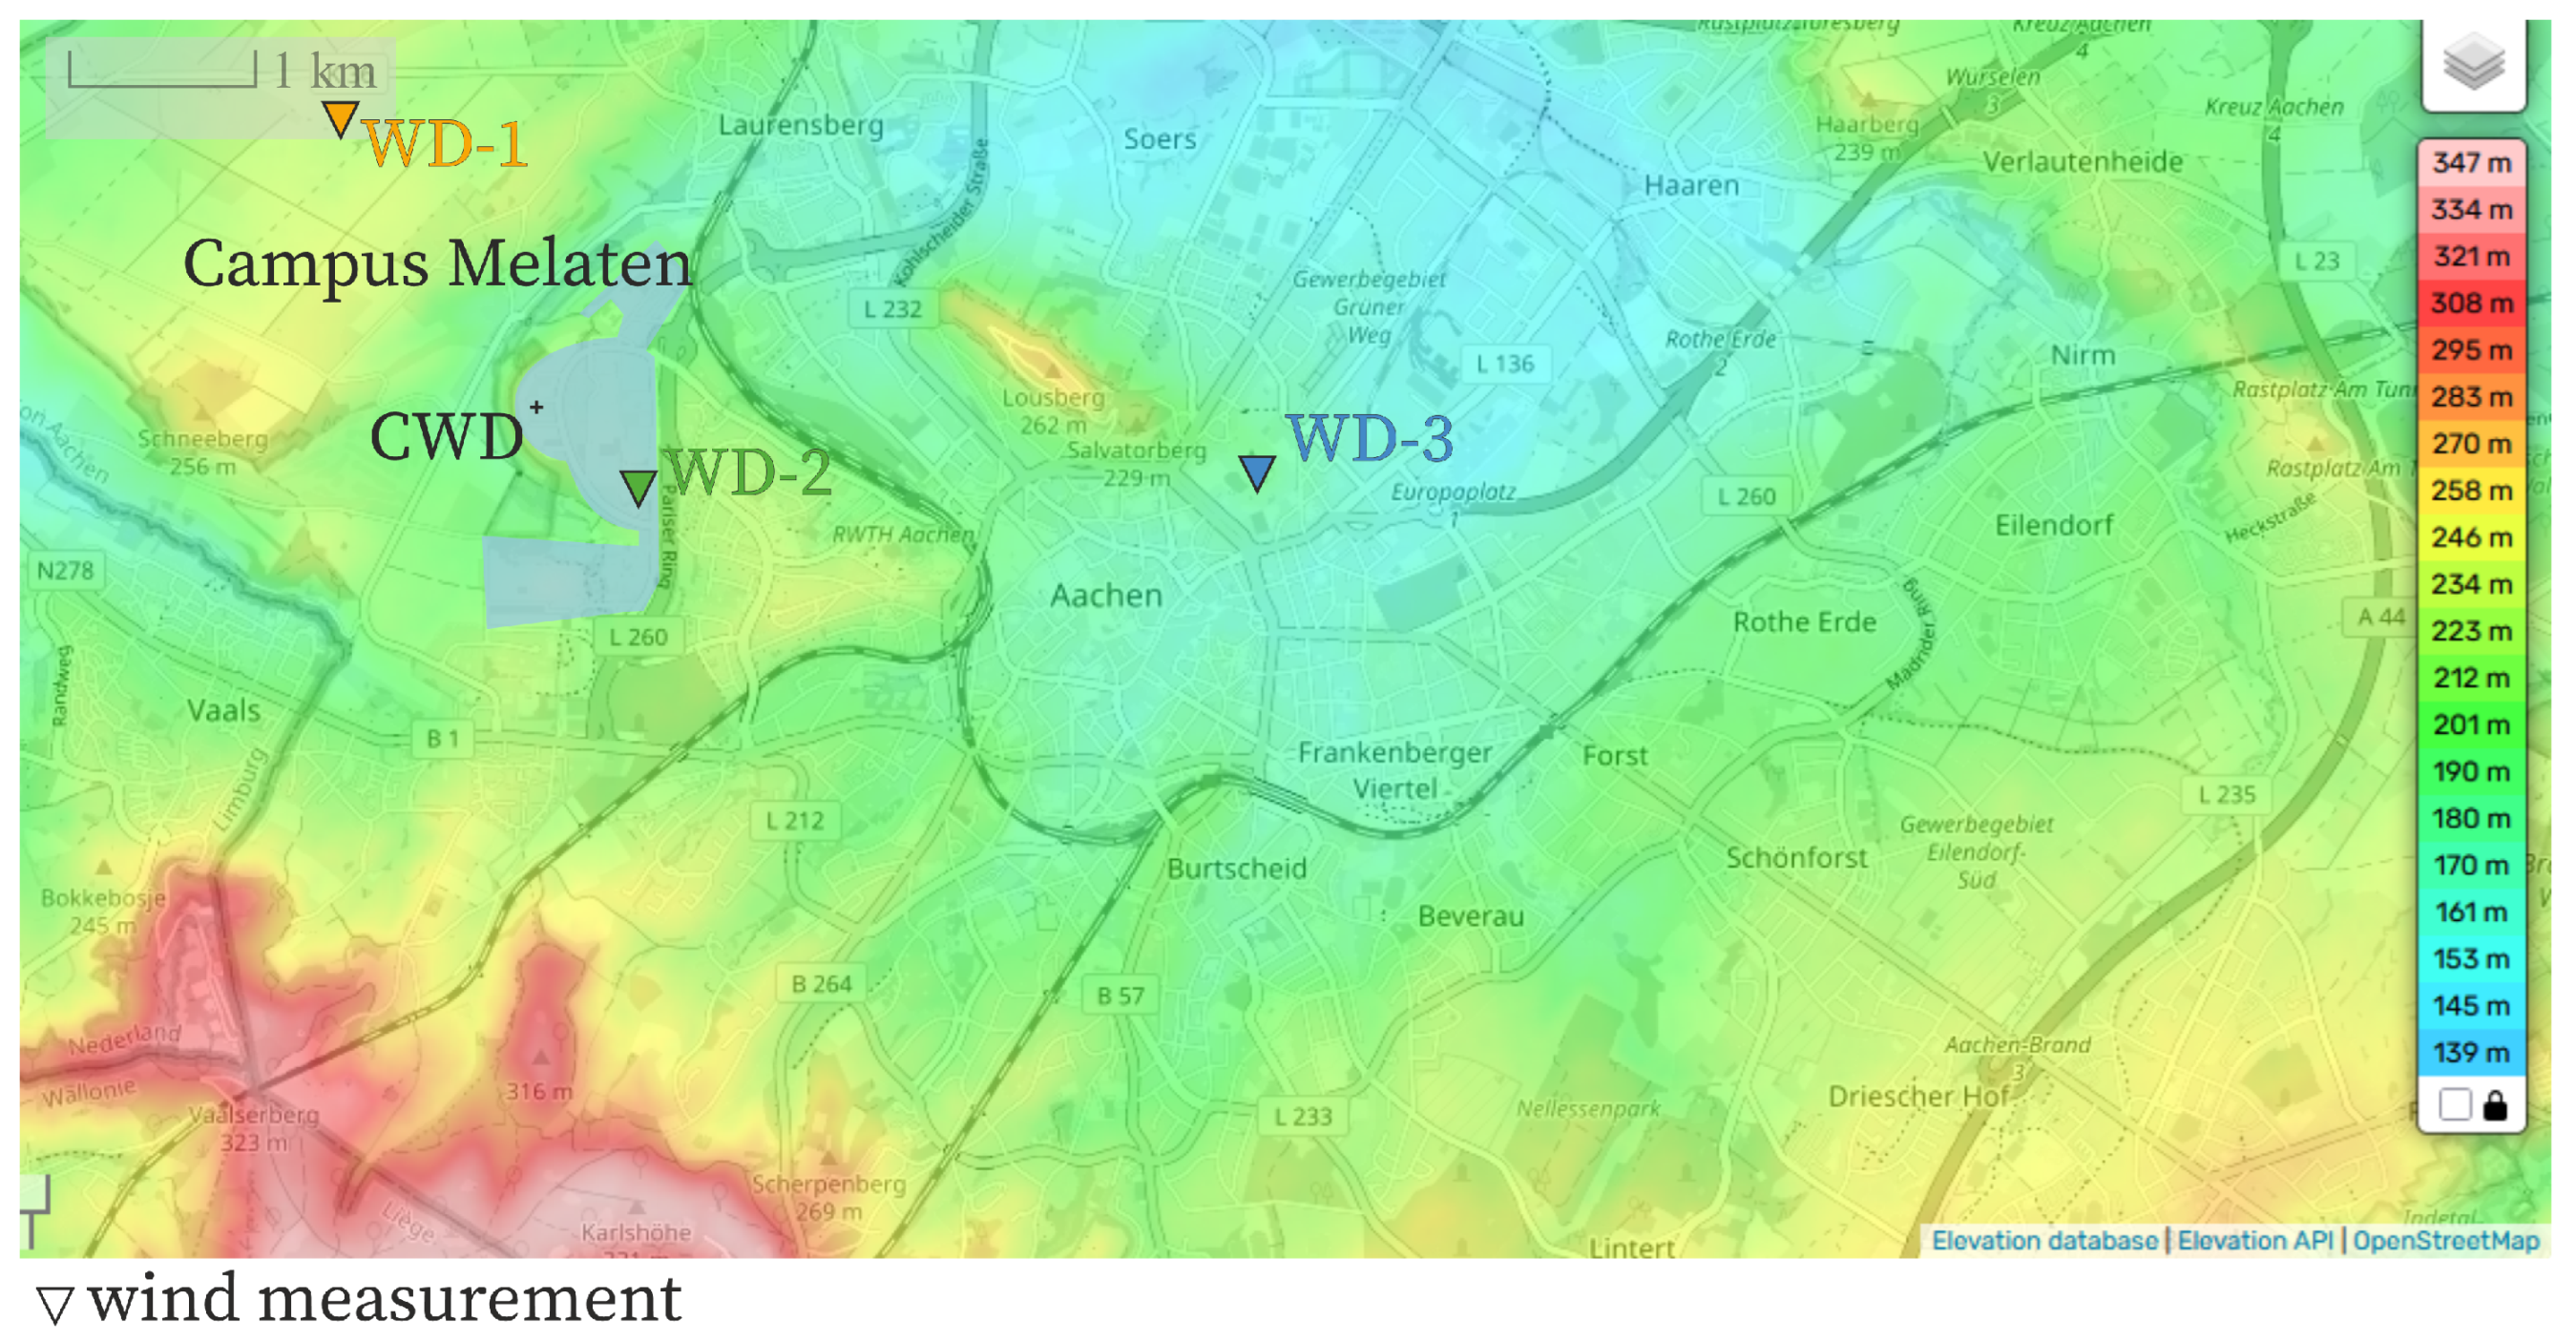
Topography of [15] and locations of weather stations (WD) and the site of the case study (CWD).
With the exception of three high-rise buildings in the eastern part of the city and the Aachen University Hospital (located approximately 800 m south of the campus), the surrounding structures are mostly single- or multi-story buildings. Building heights in the vicinity rarely exceed 30 m [16].
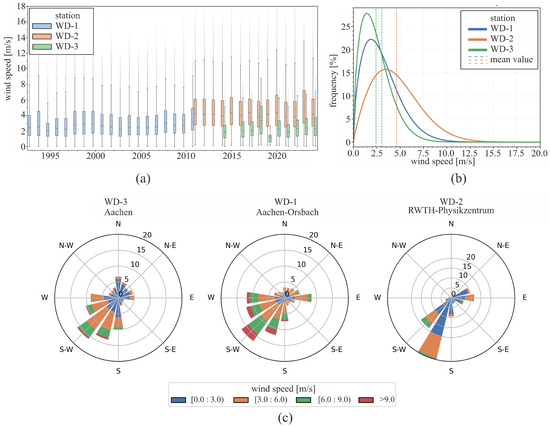
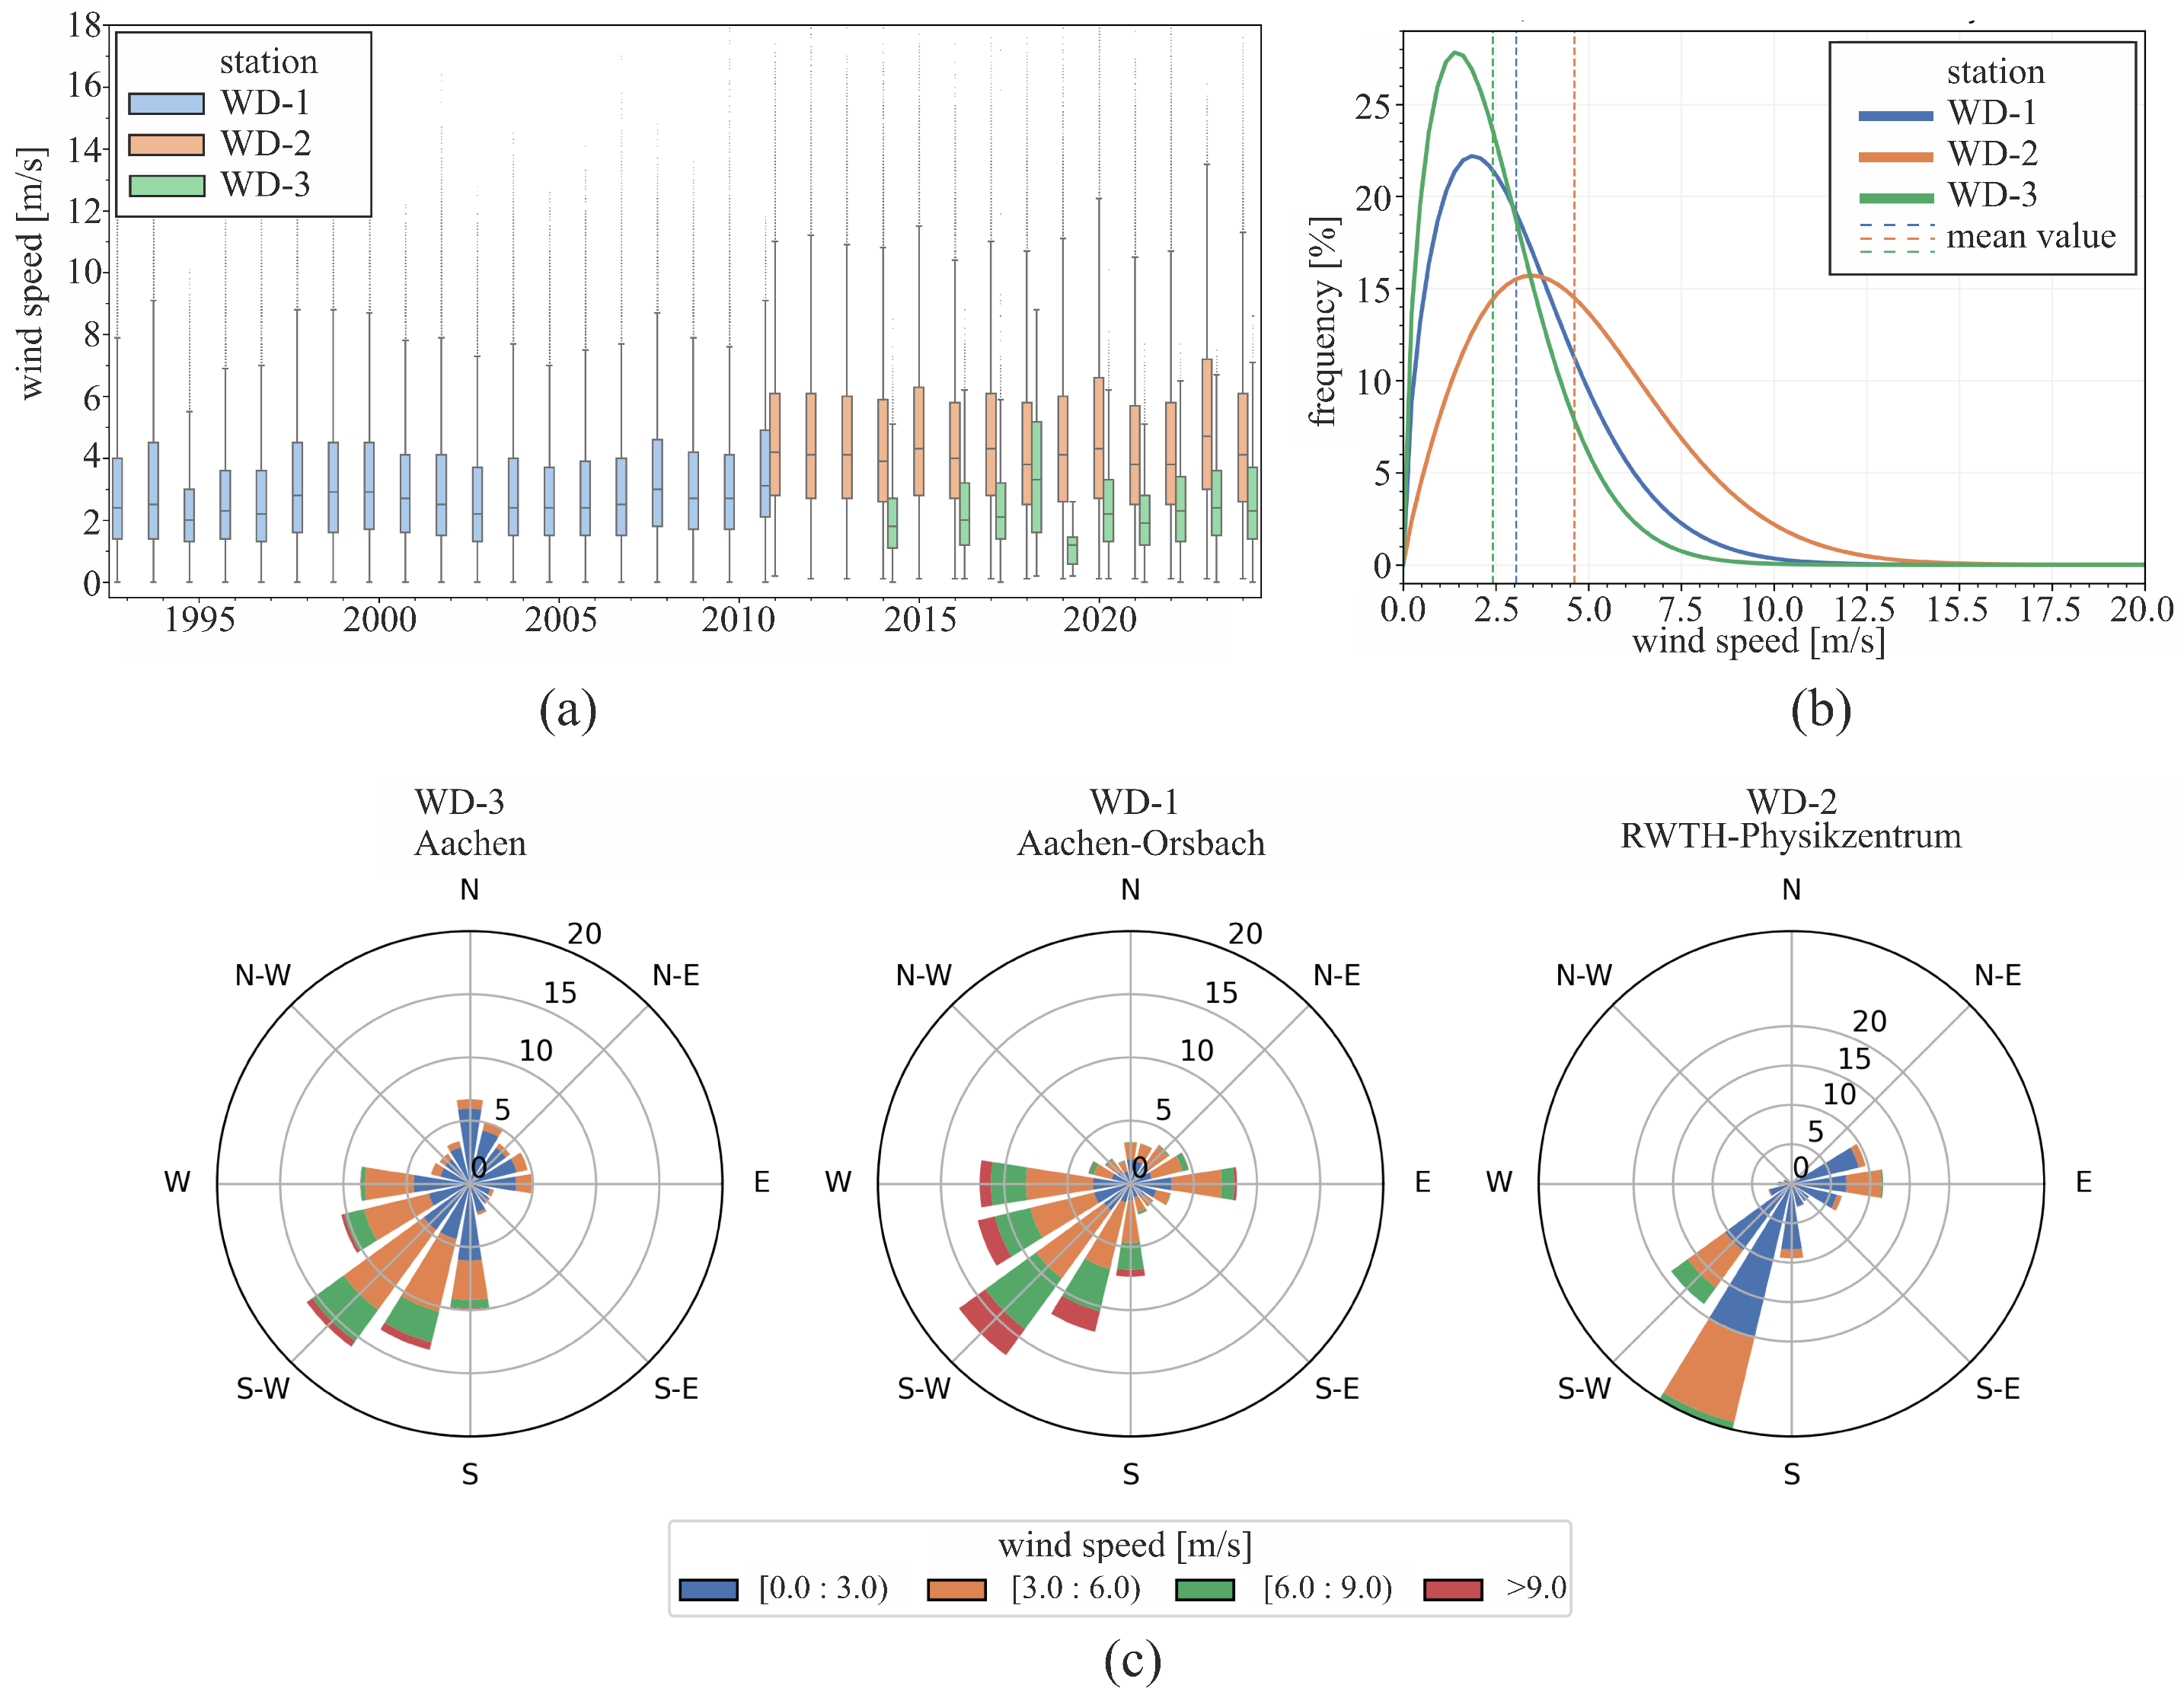
For an initial estimate of the local wind potential, datasets from the German Weather Service (DWD) and regional weather stations were evaluated to obtain the long-term distributions of wind speed and direction. Three stations were considered, covering both urban and suburban conditions (Figure 3). The analysis included annual box plots of wind speed, sector-wise Weibull fits, and wind roses summarizing directional frequencies.
Figure 3.
Statistical wind data for Aachen: (a) box plot of the annual wind speed at weather stations; (b) Weibull distribution of measured wind speeds; (c) wind roses of measured wind speeds and wind directions at different locations.
The following key characteristics were observed:
- Wind speeds vary notably between the three measurement locations, reflecting differences in surface roughness and local exposure.
- Southwesterly winds are dominant throughout the year, with seasonal variations in both direction and intensity. The dominance of the southwest sector is more pronounced in the winter months.
- All fitted Weibull distributions show a left-skewed shape typical for temperate climates. The mean and median wind speeds measured at urban stations (WD-2: 2.42 m/s; WD-3: 3.05 m/s) are roughly half of those at the open-terrain reference (WD-1: 4.62 m/s), consistent with expected urban roughness effects.
These results confirm that, even within a compact urban area, topographic exposure and built-environment roughness significantly influence the local wind climate. The derived Weibull parameters and directional frequencies provide the statistical basis for coupling with aerodynamic speed-up factors in Section 4, enabling site-specific estimation of rooftop wind-energy potential.
4. Aerodynamic Roof Speed-Up Factors
4.1. General Principles
The flow of air around buildings is governed by the interaction of the approaching atmospheric boundary layer with the building geometry and its surroundings. Pressure gradients, stagnation effects, and flow separation at roof edges cause local acceleration or deceleration of the wind field above the roof. These effects are collectively referred to as the roof speed-up effect. Understanding and quantifying this effect is essential for predicting the performance of rooftop-mounted small wind turbines (SWTs).
The roof speed-up factor is defined as the ratio between the local mean wind speed and the reference free-flow wind speed :
where y and z denote the horizontal and vertical coordinates above the roof, respectively. Values of indicate flow acceleration (beneficial for energy harvesting), while corresponds to deceleration or recirculation.
In addition to the mean velocity, the local turbulence intensity I used in the investigations refers to the streamwise component, defined as the standard deviation of the longitudinal velocity normalized by its mean value:
where is the standard deviation of the instantaneous velocity fluctuations, and is the mean wind speed. High turbulence intensities can reduce turbine efficiency and increase structural loads.
Both parameters are affected by the following:
- Building geometry (height, aspect ratio, roof shape);
- Wind direction relative to the façade;
- Surrounding structures and obstacles;
- Atmospheric boundary-layer characteristics.
These aerodynamic quantities can be determined experimentally in boundary-layer wind tunnels or numerically using computational fluid dynamics (CFD). In this study, controlled wind-tunnel experiments were used to obtain high-resolution speed-up and turbulence fields for standardized flat-roof configurations.
4.2. Wind-Tunnel Investigation
Wind-tunnel experiments were conducted at the Center for Wind and Earthquake Engineering (RWTH Aachen University) to quantify the local flow behavior over flat-roof building models. The objectives were as follows:
- 1.
- To determine the spatial distribution of the roof speed-up factor S and local absolute value of turbulence intensity I;
- 2.
- To assess the influence of surrounding buildings and wind direction on rooftop flow conditions.
The tests were performed with a geometric scale of 1:200. The simulated mean wind-speed profile reproduced terrain category II (open terrain with low roughness) according to Eurocode 1 [17], represented by
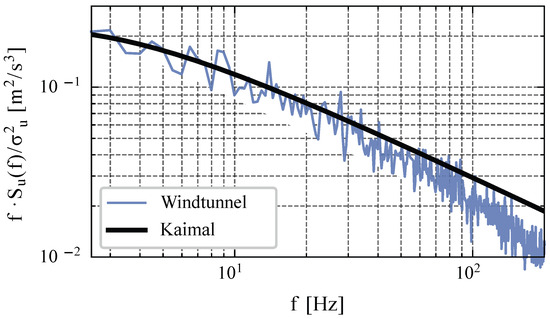
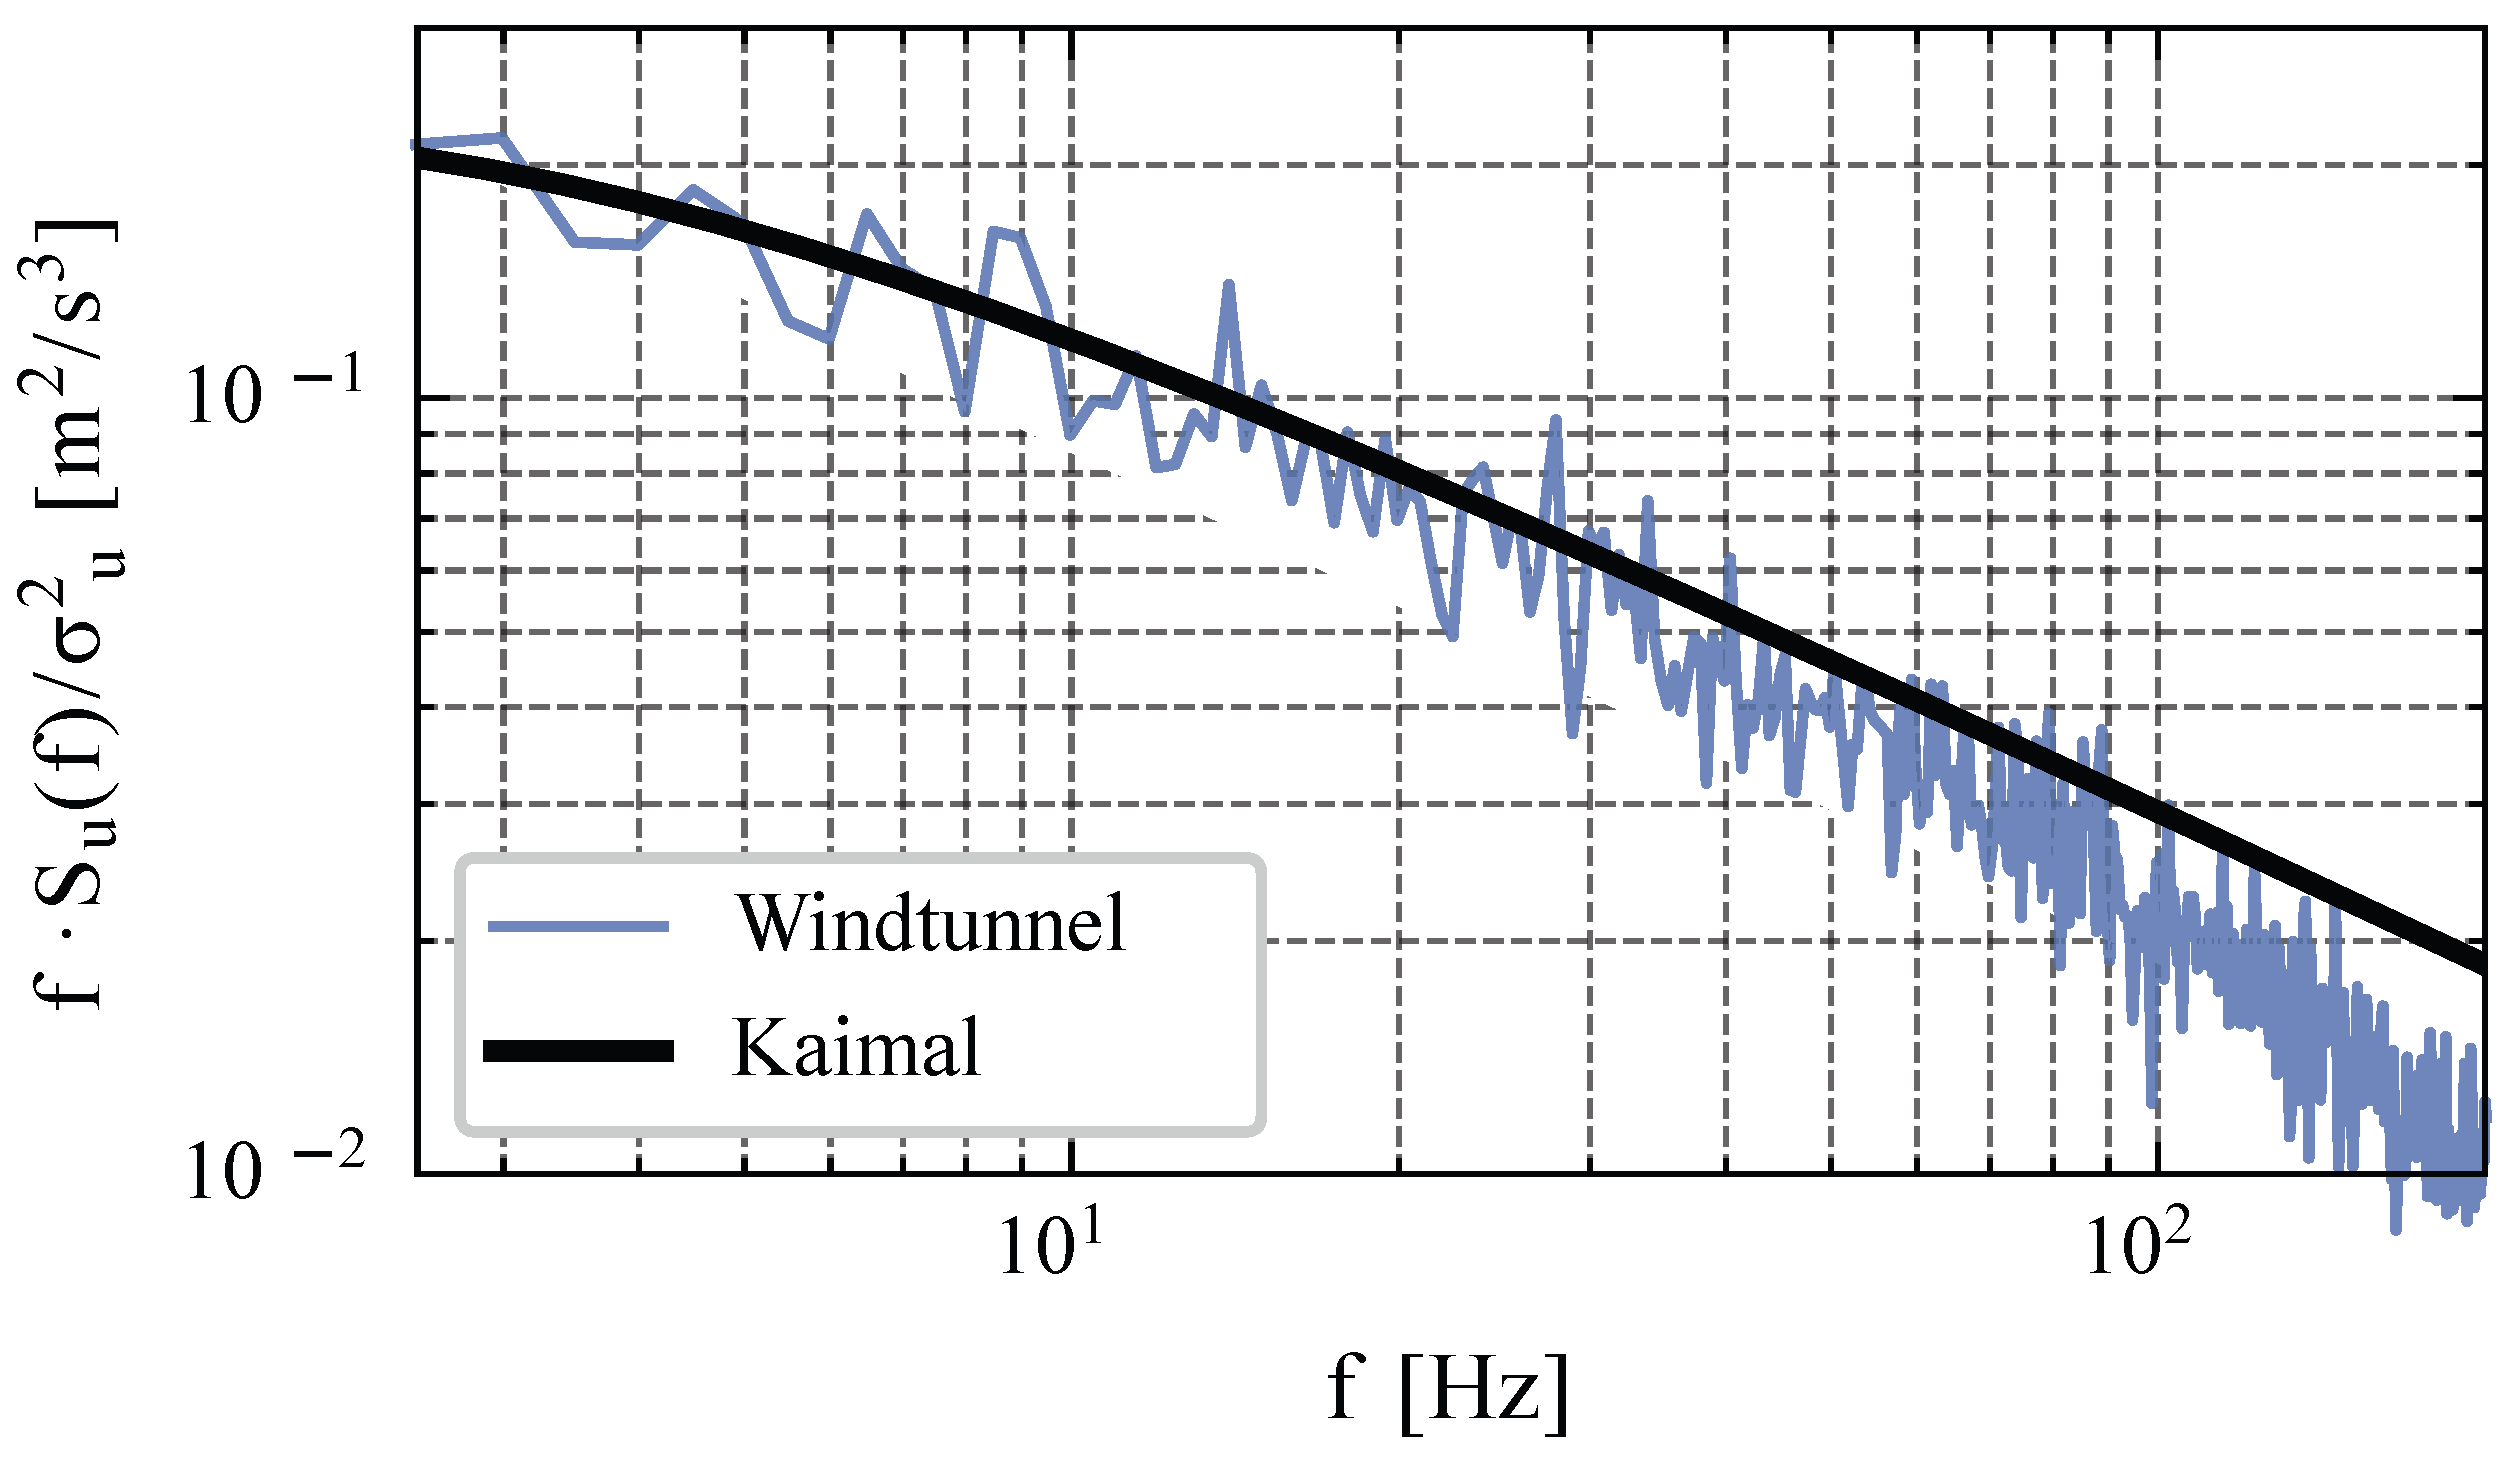
where is the mean wind speed at 10 m reference height, and z is the height above the model floor within the simulated boundary layer. Appropriate roughness elements were placed upstream to generate the desired boundary-layer profile. The turbulence spectrum in Figure 4 demonstrates that the main characteristics of atmospheric boundary-layer turbulence in terms of frequency content are reasonably reproduced under stationary inflow conditions, matching the target Kaimal spectrum according to [17]. However, non-stationary meteorological phenomena such as evolving gust fronts, directional meandering, and transient shear are not explicitly simulated in the wind-tunnel setup.
Figure 4.
Comparison of measured flow spectrum at the wind tunnel outlet to the reference Kaimal spectrum according to EN 1991-1-4 [17].
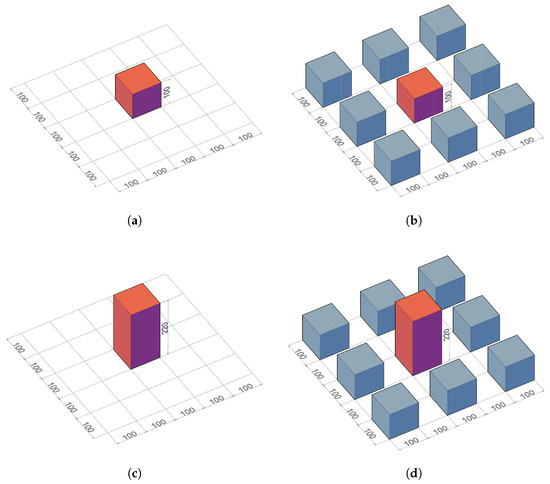
The basic building model was a cuboid with length and width . Four configurations were investigated (see Figure 5):
Figure 5.
Configurations of wind-tunnel tests. Model heights (H) and building setup: (a) H = 100 mm, isolated. (b) H = 100 mm, surrounded. (c) H = 220 mm, isolated. (d) H = 220 mm, surrounded.
- Two model heights: and ;
- Two building arrangements: isolated and surrounded (eight neighboring cubes placed at equal spacing).
The surrounding-building configuration is not intended to replicate a specific real building arrangement at the university campus. Instead, the eight neighboring cubes form an idealized and symmetric reference geometry representing a generic urban shielding scenario. The number and symmetric arrangement of surrounding buildings were deliberately chosen to ensure uniform shielding from all principal wind directions. This symmetry allows directional effects to be attributed to wind incidence rather than to layout irregularities, reducing confounding variables and enabling consistent comparisons across wind directions while still capturing first-order interaction effects. The model was mounted on a turntable to test three wind directions: 0°, 22.5°, and 45°. The wind-tunnel test section has a width of 2.5 m (diameter of the turntable) and a height of 1.7 m. Flow velocities were measured point-by-point with a Cobra Probe Series 100 (Turbulent Flow) using an automated 3D traversing system. A horizontal grid spacing of 10 mm and multiple vertical levels up to were used as measurement points. Each measurement recorded time-series data of all three velocity components with a sampling frequency f = 2000 Hz and a total sampling duration of T = 6 s for each measurement point.
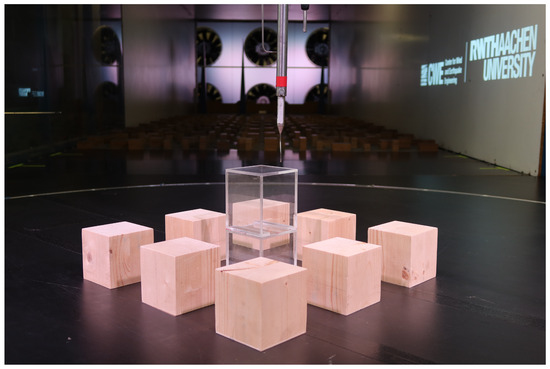
Mean velocities and turbulence intensities were derived from the time-series data according to the procedures in DIN EN 61400-12-1 [18]. 6-s mean intervals were used to ensure statistical convergence. The resulting speed-up and turbulence fields were normalized by the free-stream velocity measured at roof height in the absence of the model. A reference velocity of about 8 m/s was selected to ensure stable boundary-layer generation and reliable probe operation. Because the results are reported as normalized speed-up ratios, the absolute inflow velocity does not affect the reported speed-up factors; nevertheless, spot checks at higher reference speeds confirmed that there is no systematic change in the normalized distributions. Figure 6 shows the configuration of Figure 5d installed in the boundary layer wind-tunnel.
Figure 6.
Wind-tunnel setup and model arrangement for rooftop flow measurements.
The horizontal grid spacing of 10 mm (≈2 m at full scale) represents a compromise between spatial resolution and measurement effort. While this resolution captures the dominant roof-scale acceleration patterns, it may under-resolve steep velocity gradients close to roof edges and corners. Consequently, local peak speed-up values in the immediate vicinity of these positions may be underestimated. Future studies focusing explicitly on edge-scale phenomena could benefit from locally refined measurement grids.
4.3. Experimental Results and Discussion
The analysis focused on the horizontal velocity component, which is most relevant for wind-energy applications, in accordance with the recommendations of DIN EN 61400-12-1 [18]. For consistency with energy-yield assessment, ten-minute mean values were used to compute representative wind-speed and turbulence statistics at each measurement location. To examine the influence of roof position, three representative points were selected:
- P1—central roof position, minimally affected by wind direction;
- P2—intermediate position toward the roof edge;
- P3—corner position, representative of edge acceleration.
4.3.1. Horizontal Speed-Up
The horizontal mean wind speed above the roof for different environmental configurations and building heights increases with height above the roof due to the recovery of the boundary layer.
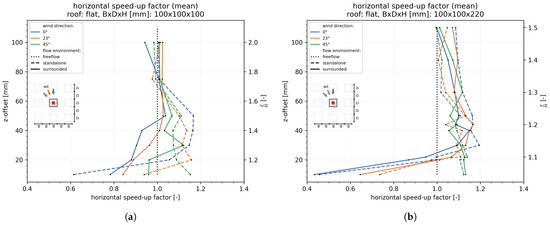
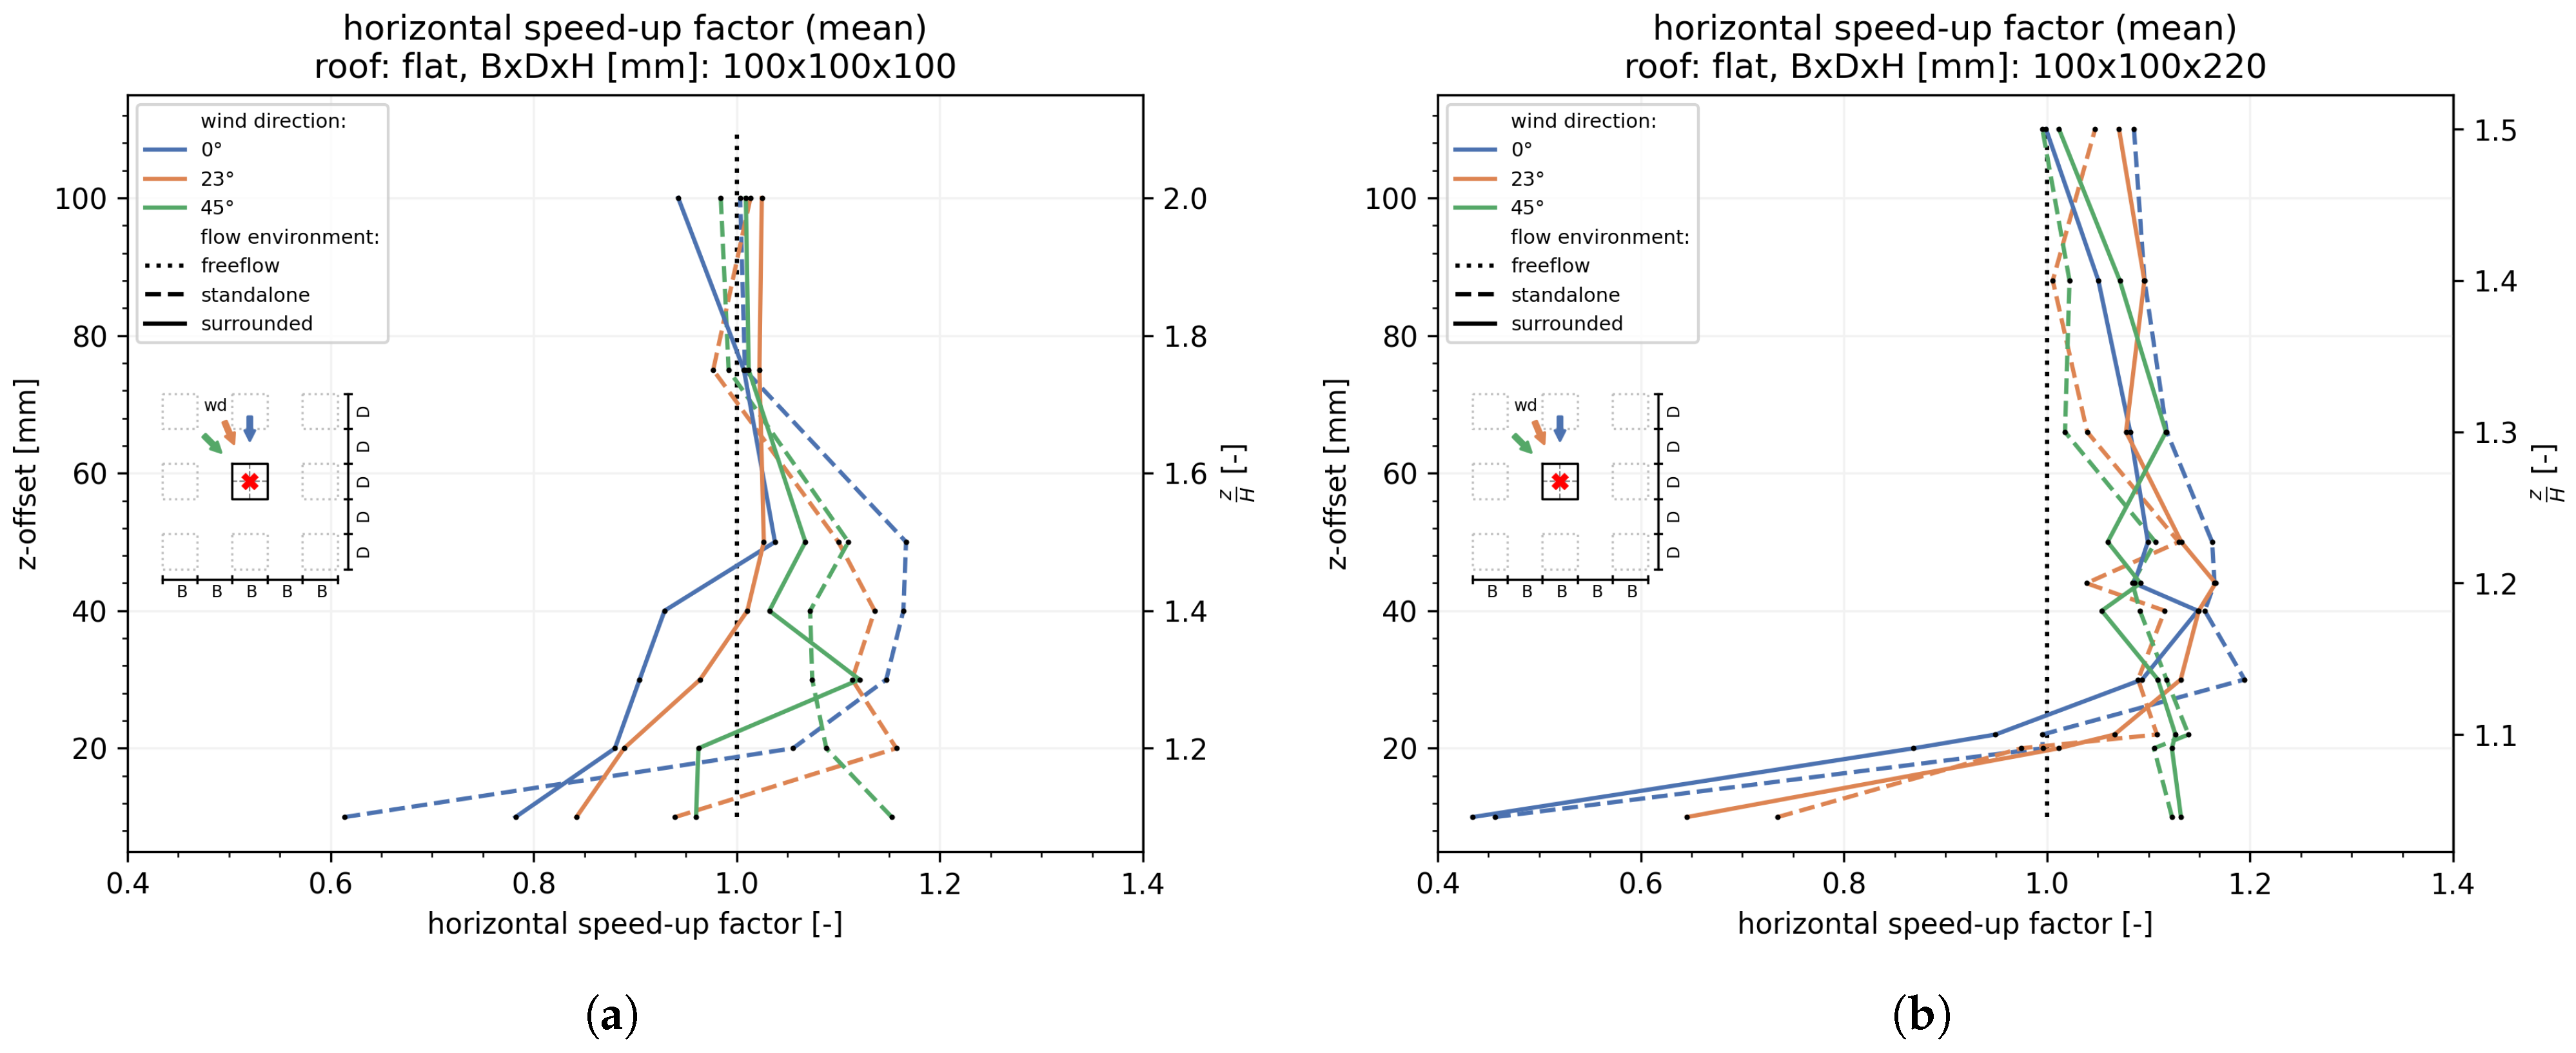
The resulting horizontal speed-up factors for varying wind directions and environmental configurations are presented in Figure 7. The wind direction angle is defined relative to the building orientation, where 0° corresponds to wind normal to the windward façade. Positive angles denote counter-clockwise flow directions when viewed from top, see definition in Figure 7. For the isolated configuration, maximum acceleration above the roof center (P1) reached approximately 16% for the low-rise model and 20% for the taller building. At wind directions of 22.5° and 45°, the peak speed-up shifted closer to the roof surface, consistent with flow reattachment after separation. In surrounded environments, acceleration effects were attenuated and occurred primarily above , where shear-layer interactions dominate.
Figure 7.
Horizontal speed-up factor for three wind directions and environmental conditions: (a) (full scale: ); (b) (full scale: ).
For the lower building (), surrounding structures led to a noticeable reduction in rooftop wind speeds, whereas for the taller building (), the effect of the neighboring blocks became negligible.
4.3.2. Inclination in the Vertical Plane
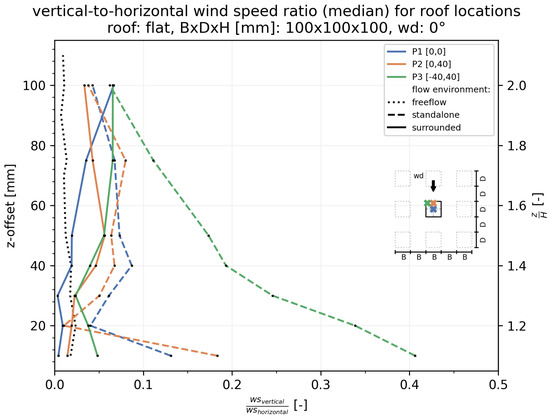
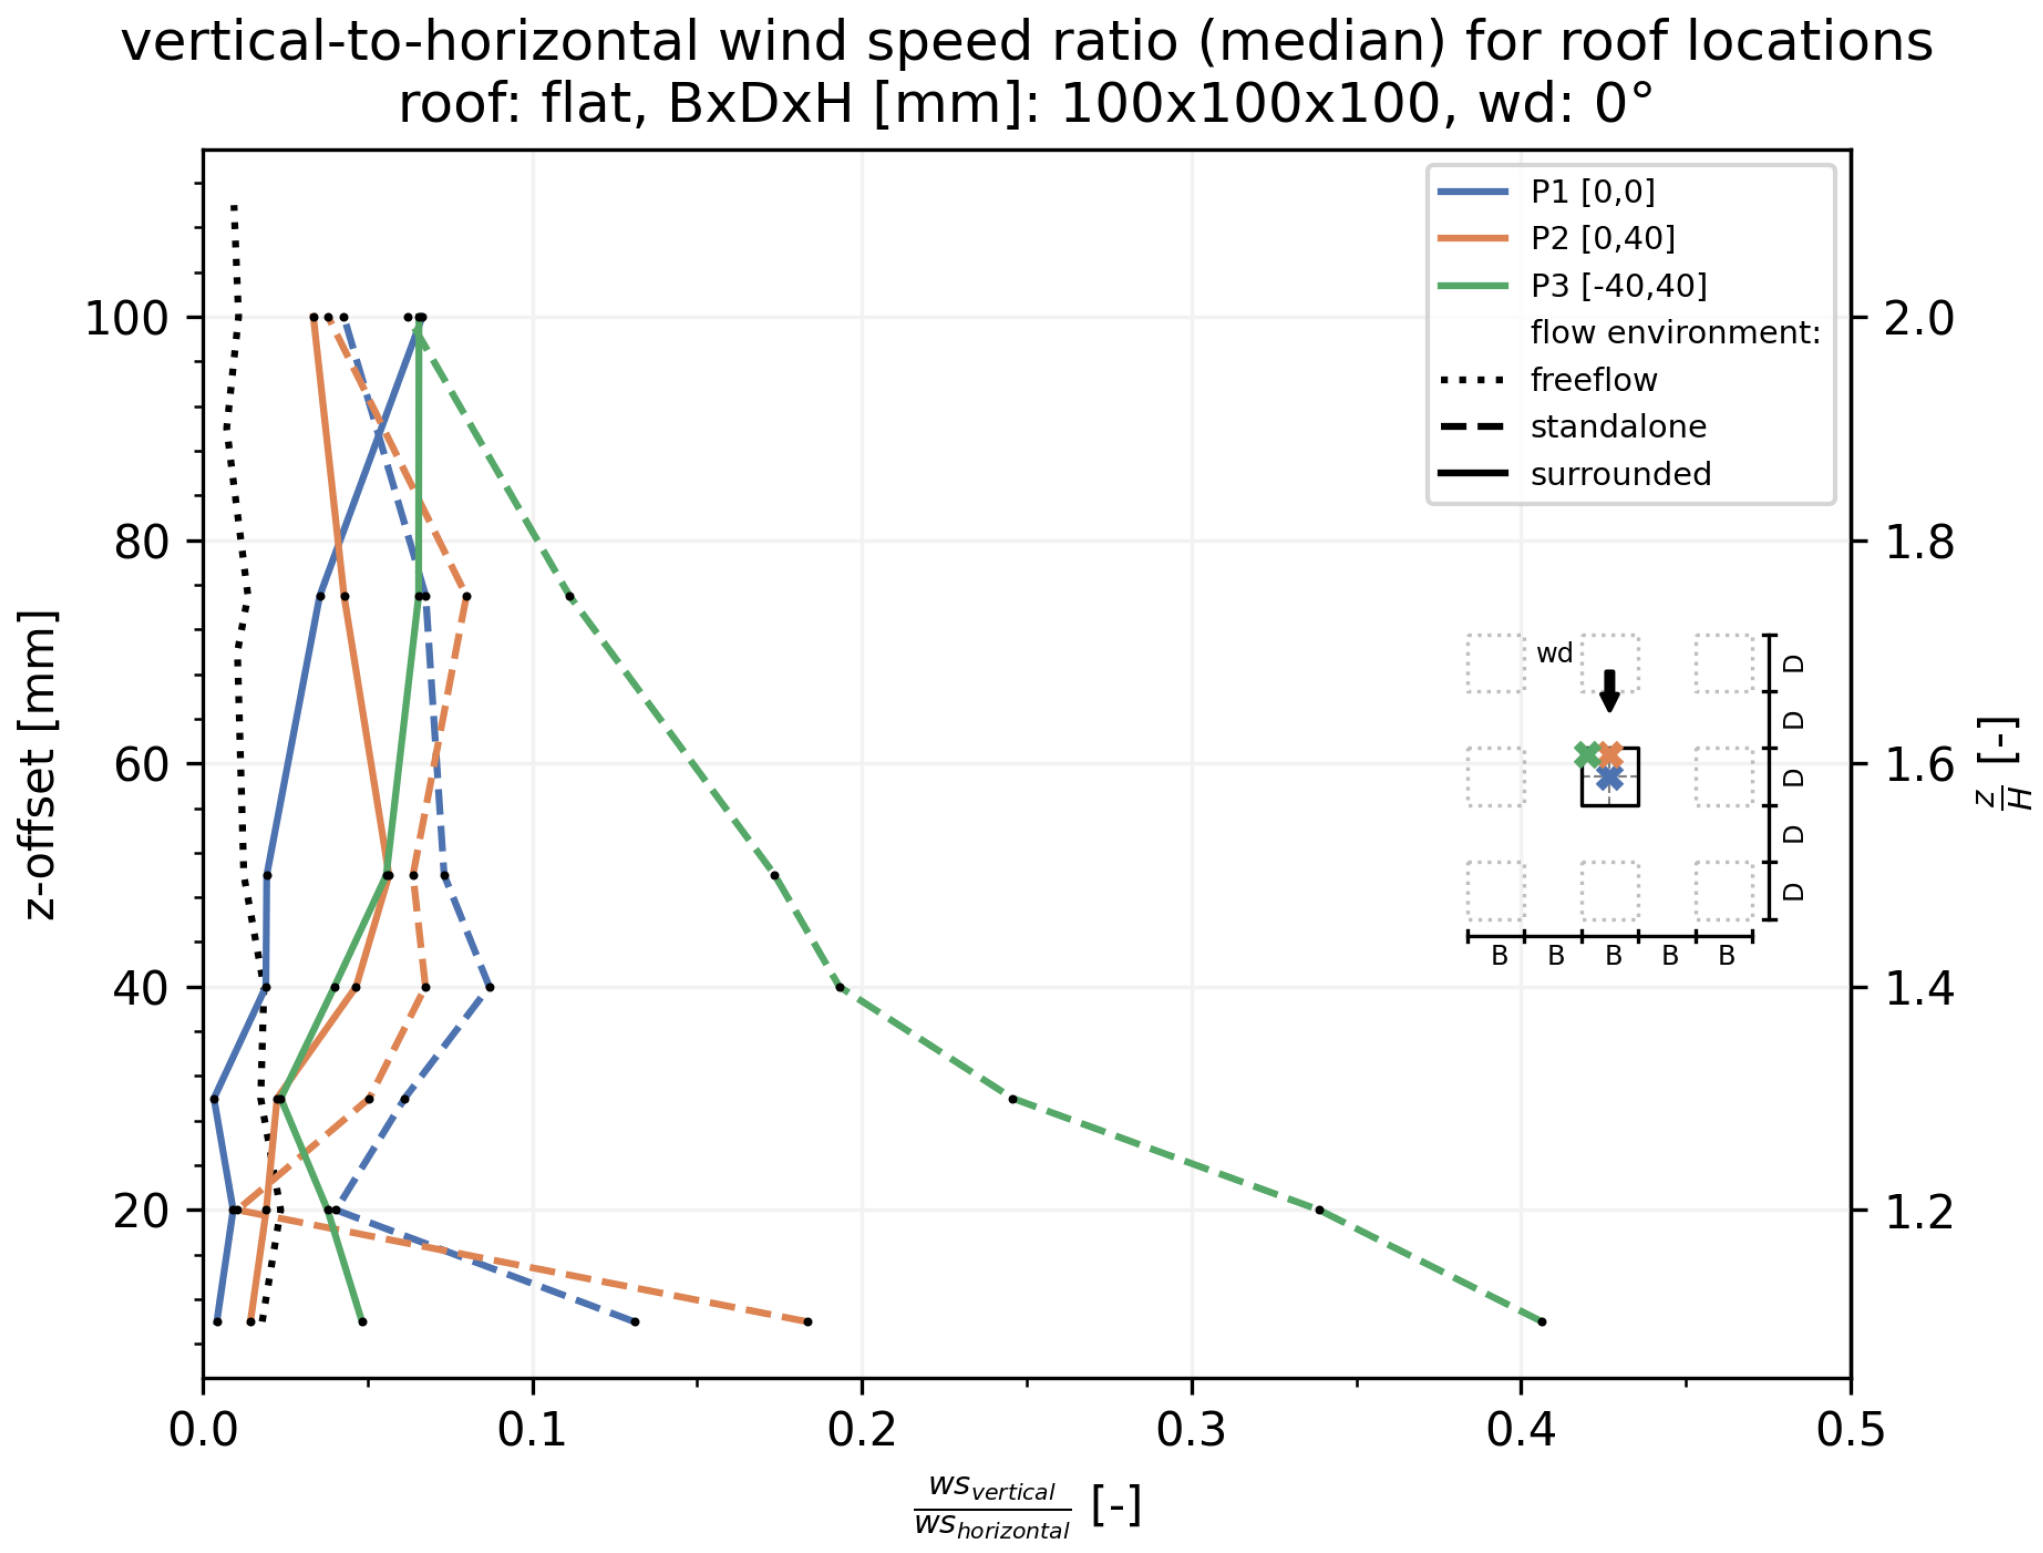
The ratio of vertical to horizontal velocity components, shown in Figure 8, highlights the strong influence of roof-edge separation. At P3, vertical motion reached up to 41% of the horizontal component near the roof surface, decreasing to below 10% at twice the building height. Under free-flow conditions, this ratio remained below 2%, indicating that vertical exchange is primarily a result of separation and recirculation effects induced by the building geometry. At the central roof positions (P1 and P2), the separation bubble is clearly reflected in a rapid drop of the vertical velocity component near the surface, followed by recovery at higher elevations.
Figure 8.
Ratio of vertical to horizontal wind speeds at selected rooftop positions.
4.3.3. Spatial and Directional Visualization
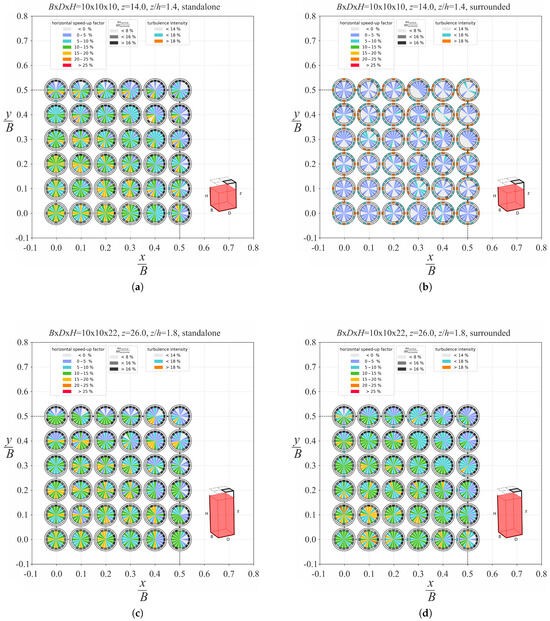
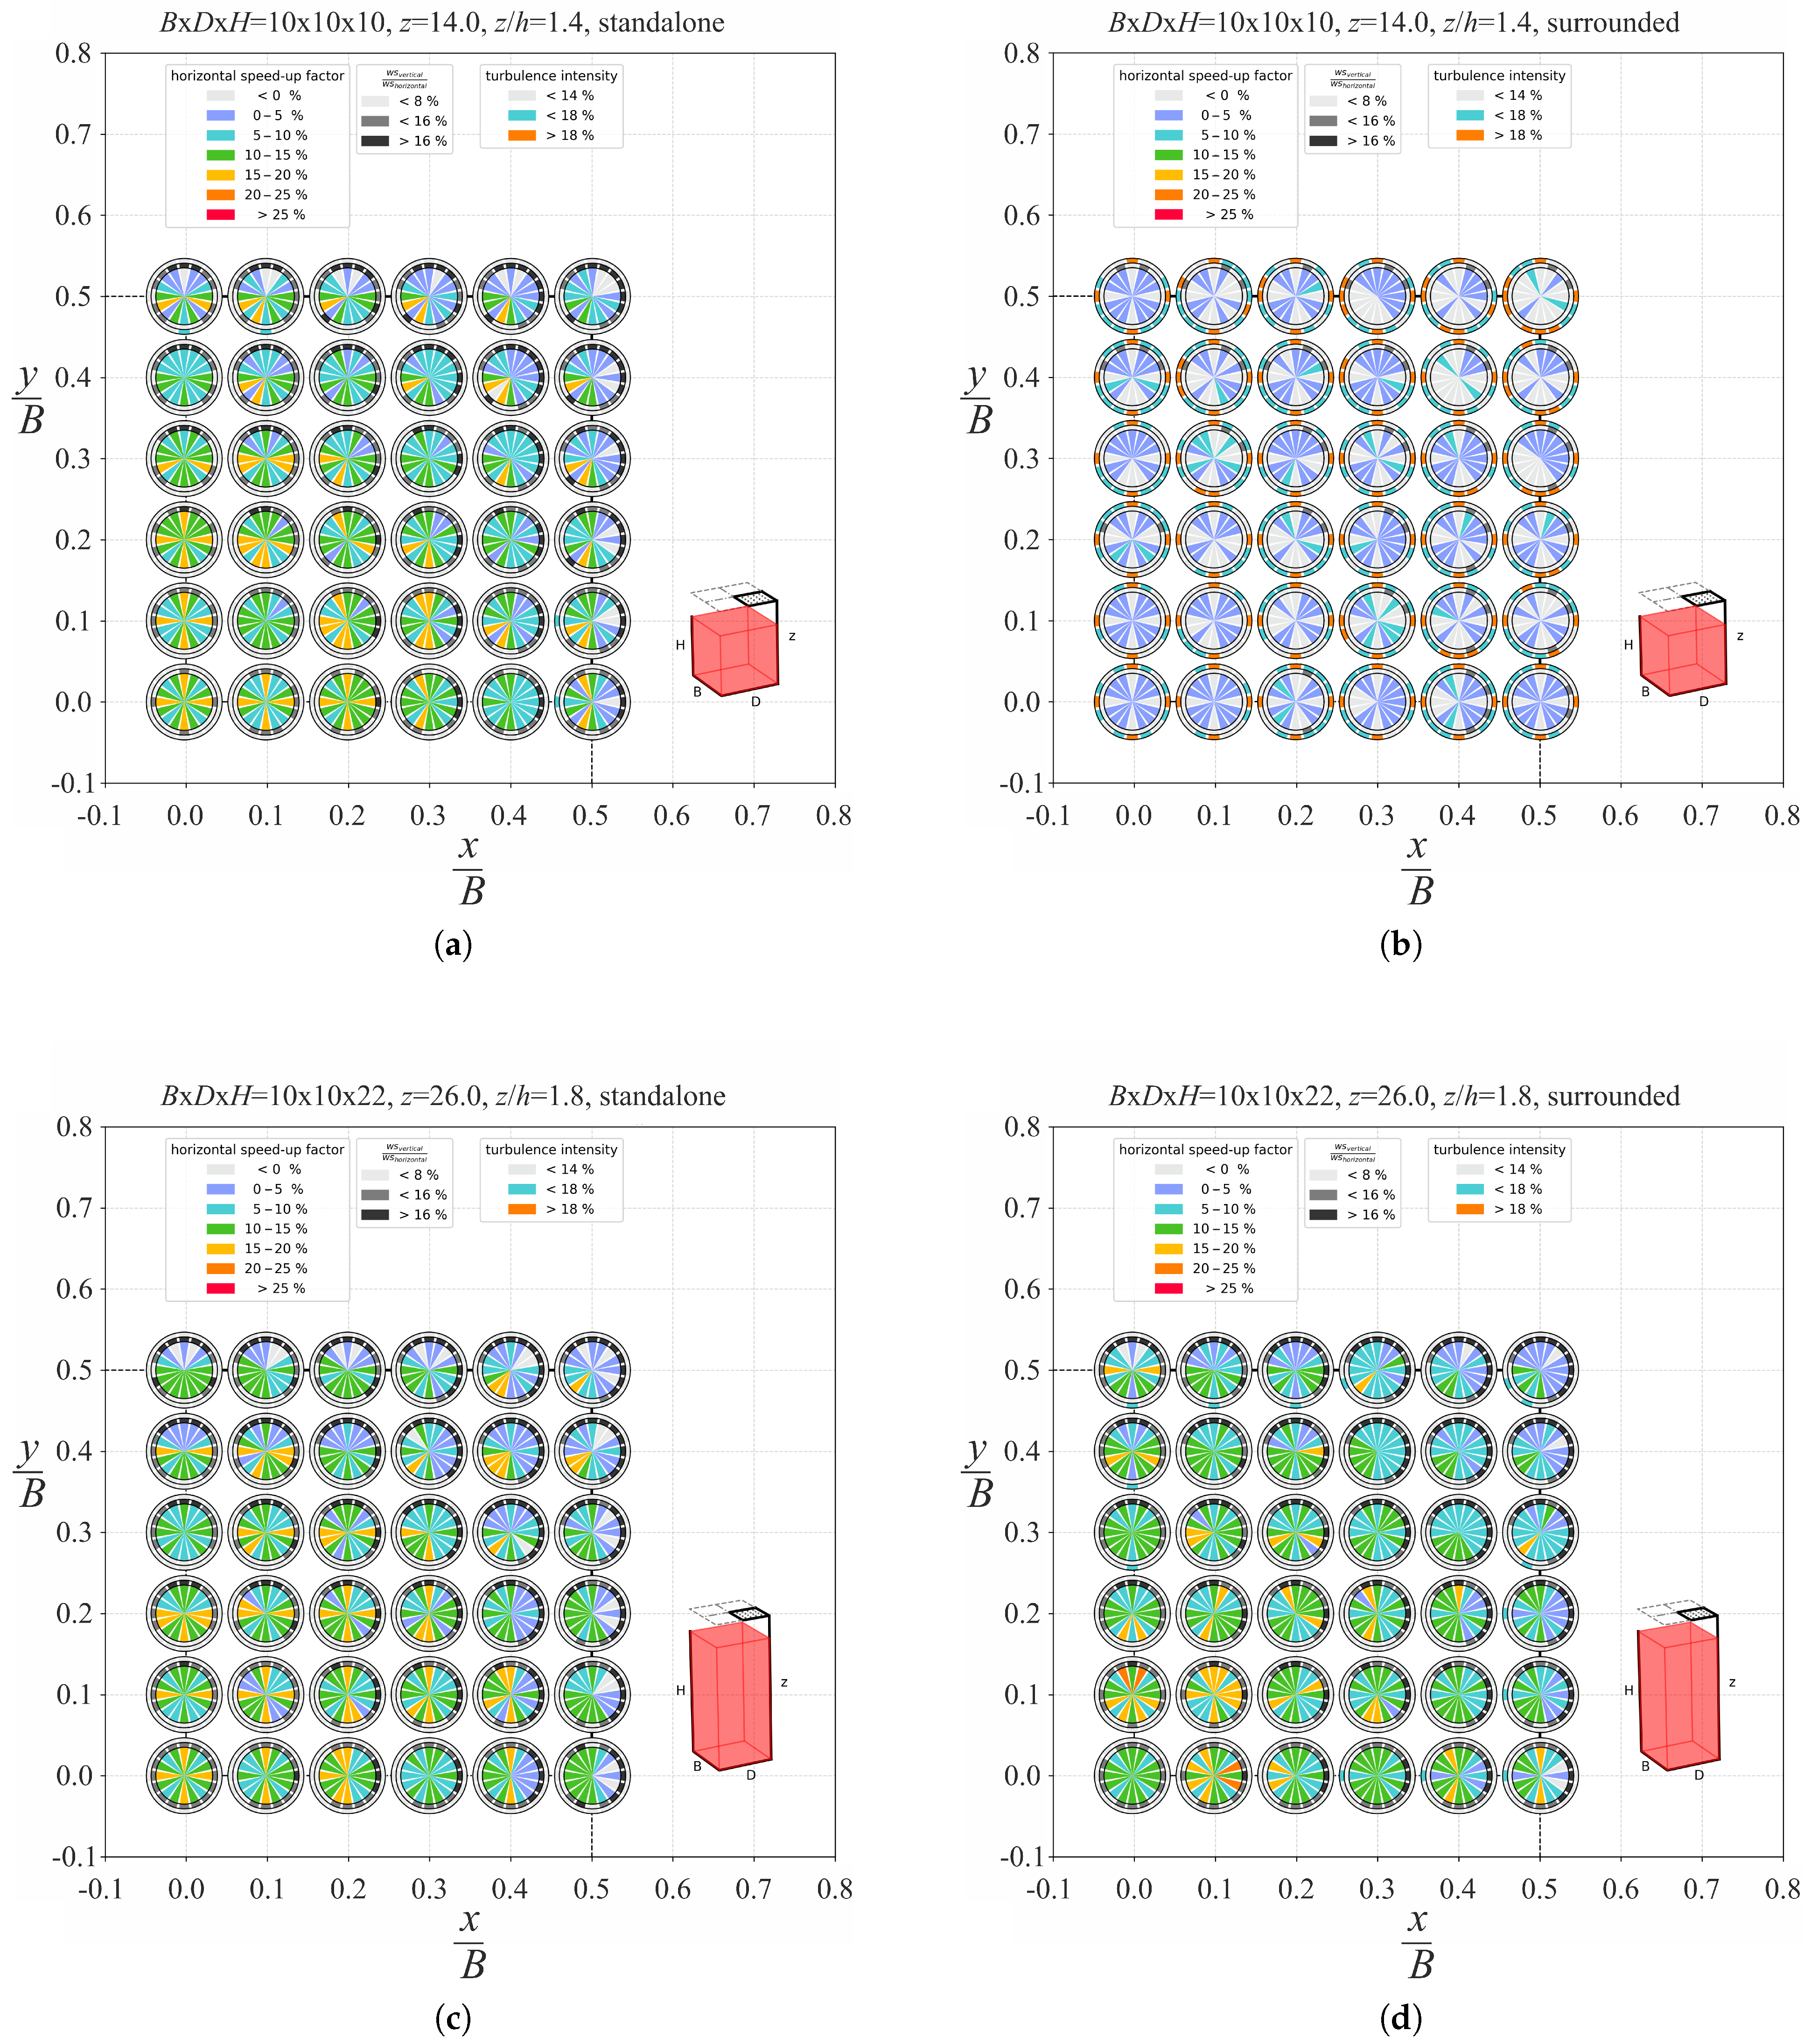
Figure 9 compares the directional flow patterns at a representative height of 8 m above the full-scale roof. In almost all configurations, the highest speed-up values occurred near the windward roof edges and decreased toward the roof center, while turbulence intensity remained below 14% at higher elevations. In the surrounding scenario, overall acceleration decreased due to shielding from neighboring structures. The vertical-to-horizontal velocity ratio increased near the edges, confirming enhanced flow separation and recirculation in these zones.
Figure 9.
Directional visualization of speed-up and turbulence fields at 8 m above roof level for different model heights and building setups: (a) , isolated; (b) , surrounded; (c) , isolated; (d) , surrounded.
4.3.4. Summary of Findings
- Under favorable conditions, roof-edge acceleration reached up to 25%, with typical values between 15% and 20%.
- At heights above 8 m, predominantly positive acceleration values were observed across the entire roof.
- The lowest acceleration occurred within the separation bubble near the roof center, often leading to reverse flow and local suction effects.
- The influence of surrounding buildings is pronounced for low-rise models but diminishes with increasing building height.
- The highest speed-up typically occurs near roof edges; however, increased turbulence and directional sensitivity in these zones can reduce SWT performance.
- Turbulence intensity decreased below free-flow values at heights exceeding approximately 6 m.
These findings provide the aerodynamic foundation for assessing rooftop wind-energy potential. The resulting speed-up and turbulence factors were combined with directional wind statistics and a representative turbine power curve in Section 5 to estimate realistic annual energy yields.
4.4. Case Study: Chosen Speed-Up Factors
For the case-study building—located in a surrounded context with buildings of similar height—we used the speed-up factors from Figure 5a,b. Specifically, the isolated dataset was used when the upwind sector was unobstructed, and the surrounding dataset when the upwind sector was obstructed, based on wind direction. See Section 5.2 for details.
5. Wind-Energy Potential
5.1. General Framework
The local wind-energy potential above a building depends on the interaction of the free-flow wind climate (Section 3.1) with the rooftop flow modifications (Section 4). The effective wind speed experienced by a small wind turbine (SWT) at position and for wind direction can be expressed as
where is the direction-dependent roof speed-up factor obtained from the wind-tunnel tests, and is the free-flow wind speed at reference height.
The instantaneous power output of a turbine with rotor area and power coefficient is given by
where is the air density. In practice, the power curve provided by the manufacturer is used instead of the theoretical expression in (9).
To estimate the long-term energy yield, the power curve is integrated over the wind-speed probability distribution. For directionally resolved data, the mean power output is
where is the frequency of occurrence of direction , and is the sector-wise Weibull distribution (see Section 3.1).
The corresponding annual energy production (AEP) follows as
assuming continuous operation throughout the year (8760 h). This formulation naturally accounts for both the local aerodynamic amplification and the statistical occurrence of wind conditions.
The overall methodology can thus be summarized in three computational steps:
5.2. Case Study: Application of Findings
The general procedure described in Section 5 was applied to a representative case study on the Melaten Campus (see Figure 3). The aim was to quantify the expected annual energy production (AEP) of a small wind turbine (SWT) installed on a flat-roof building under realistic urban conditions.
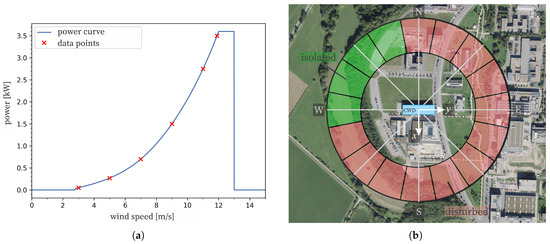
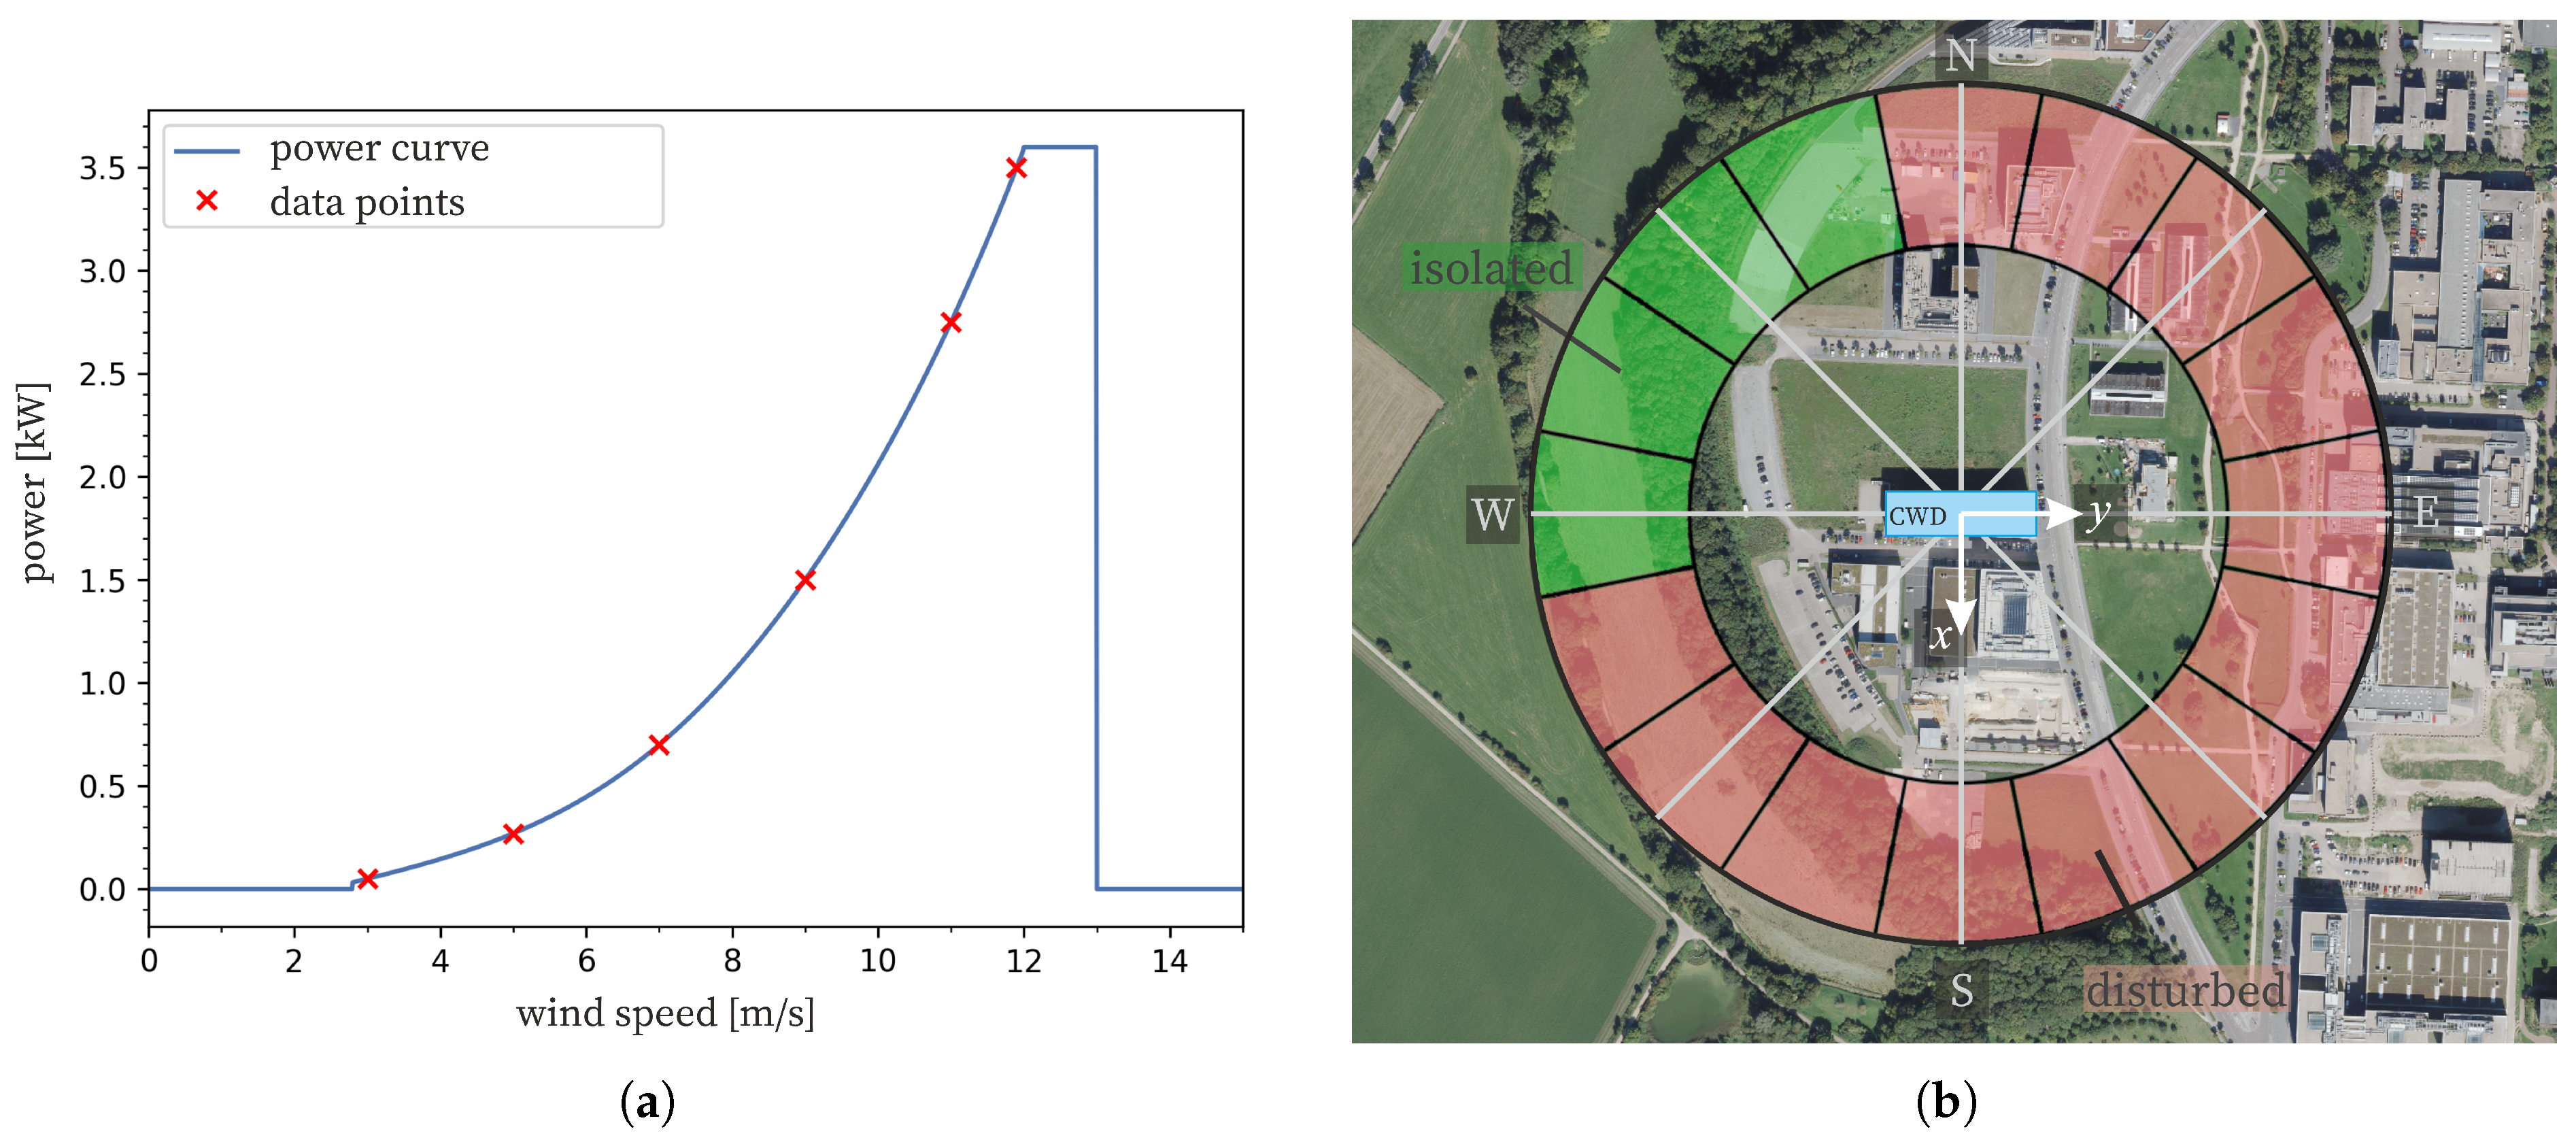
The AEP estimation follows the methodology specified in DIN EN 61400-12-1 [18], combining (i) the site-specific wind climate, (ii) the aerodynamic speed-up factors determined in Section 4, and (iii) the performance characteristics of a selected turbine type. For the present case, the ANTARIS 2.5 kW turbine (BRAUN Windturbinen GmbH, 7583 Nauroth, Germany) was used as an example. The corresponding manufacturer’s power curve is shown in Figure 10a.
Figure 10.
(a) Power curve of the ANTARIS 2.5 kW turbine. (b) Satellite photograph and exposure conditions of the building for the case study on the RWTH Campus in Aachen.
In Figure 10b, a satellite image shows the case-study building (highlighted in blue), along with the surrounding structures and the upwind exposure. The building has a rectangular plan of approximately , , .
The input parameters were combined as follows:
- Wind statistics: Directional Weibull parameters derived from local measurements at weather station WD-3 (Aachen), representing the free-flow reference conditions (see Figure 3).
- Aerodynamic modifiers: Roof speed-up factors and turbulence intensities obtained from the wind-tunnel measurements (Section 4.3), evaluated for multiple rooftop positions and heights. Because the case-study building and its immediate surroundings are at comparable heights, the speed-up factors from Figure 5a,b were used. Specifically, the isolated configuration (Figure 5a) was applied for upwind sectors with unobstructed exposure, whereas the surrounded configuration (Figure 5b) was used for sectors with significant upwind obstruction. The corresponding sector assignments for isolated and obstructed (disturbed) conditions are illustrated in Figure 10a, shown in red and green, respectively. Deviating from the tested model geometries, the case-study building is rectangular (/ = = 4.6) rather than square ( = 1). Nevertheless, the experimental speed-up factors were applied by normalizing positions with respect to y/D and x/B. The transfer of experimentally derived speed-up factors to the full-scale case study is based on linear height normalization. While this approach preserves relative trends with elevation, it does not fully capture the nonlinear nature of roof-edge acceleration. The linear scaling was adopted as a pragmatic approximation given the available experimental data. Future studies that combine matched-aspect-ratio experiments or high-resolution CFD could improve vertical scaling. This simplification represents a modeling assumption; speed-up factors derived from experiments with matching aspect ratios would further improve accuracy. This simplification represents a modeling assumption; speed-up factors derived from experiments with matching aspect ratios would further improve accuracy.
- Turbine data: Power curve of the ANTARIS 2.5 kW turbine, assuming continuous operation and no downtime (see Figure 10a).
To comply with building regulations in Germany, which limit rooftop installations to heights below 10 m, only experimental data corresponding to were considered in the analysis. For each combination of position, height, and direction, the effective velocity was calculated according to (8), and the AEP was integrated using (10) and (11). In total, 13,100 individual evaluations were performed, representing all combinations of wind conditions, directions, and rooftop locations.
Table 1 summarizes the results for representative positions on the rooftop. For each measurement point, the AEP was computed both for free-flow reference conditions () and for the locally modified wind field (), with the relative increase (or decrease) indicating the aerodynamic influence.
Table 1.
Annual energy production (AEP) for selected rooftop positions for the case study in descending order with respect to AEP per location on the rooftop.
The highest AEP values occur at elevated rooftop positions near windward edges, where flow acceleration produces speed-up factors of approximately 15–20%. Conversely, areas within the separation bubble near the roof center exhibit reduced performance due to lower mean wind speeds and increased turbulence. For the example building, the theoretical maximum annual energy production is approximately 1.9 MWh per turbine under continuous operation. In practice, further reductions must be expected due to downtime, maintenance, and control-related losses.
Interpretation of Results
- The maximum AEP depends primarily on local wind quality, installation height, and surrounding building configuration.
- For all configurations, certain rooftop positions yield AEP values exceeding those under free-flow conditions (), demonstrating the positive effect of roof speed-up.
- In surrounded environments, shielding and turbulence reduce the achievable yield compared to isolated buildings.
- At lower heights (within the interaction bubble), central rooftop positions exhibit reduced AEP, while edge and corner zones generally provide the most favorable turbine sites.
Overall, the analysis highlights the strong spatial variability of rooftop wind potential and emphasizes the importance of combining directionally resolved aerodynamic data with site-specific wind statistics for reliable energy-yield assessment.
6. Discussion
The experimental investigations provided detailed insights into the aerodynamic behavior of rooftop flows and their implications for small wind turbines in urban areas. The measured directional speed-up and turbulence factors confirm that local flow characteristics are highly sensitive to building geometry, wind direction, and the surrounding environment.
Consistent with previous studies [8,9,10], a pronounced roof-acceleration effect was observed near the leading roof edges, with local wind-speed increases of up to 25% under favorable conditions. This acceleration can be attributed to streamline compression and flow deflection at the windward roof edge, which locally increases the velocity prior to separation and reattachment on the roof surface. For low-rise buildings embedded within dense surroundings, the speed-up effect was strongly attenuated, reflecting the shielding influence of adjacent structures. Upstream buildings reduce the effective approach velocity and enhance turbulence within the urban canopy layer, thereby suppressing coherent acceleration over the roof. This observation agrees with findings by Kono et al. [13], who reported a reduction in velocity variance over roofs with decreasing width-to-length ratios. In contrast, for taller buildings, the influence of neighboring obstacles becomes less relevant, and the flow field is primarily governed by the building geometry and the approaching boundary-layer profile.
Changes in inflow direction produced significant variations in acceleration and turbulence patterns, underscoring the need to account for multi-directional exposure in turbine micrositing studies. Turbulence intensities remained below 14% in most regions above the roof, which generally supports favorable operating conditions for small wind turbines. However, zones near the roof edges exhibited stronger fluctuations and flow separation, which may induce additional structural loads and reduce long-term performance. These elevated turbulence levels are associated with shear-layer development and vortex shedding induced by sharp geometric discontinuities at the roof edges, particularly under oblique inflow conditions. Changes in wind direction modify the locations and strengths of separation and reattachment regions, leading to pronounced directional dependence in both speed-up and turbulence intensity.
The obtained datasets agree in trend and magnitude with numerical and experimental studies in literature, but they also extend prior work by providing full-roof, direction-resolved fields of speed-up and turbulence intensity. Such spatially resolved datasets allow flow features such as acceleration zones, separation regions, and wake recovery to be directly linked to underlying aerodynamic mechanisms in numerical models. This enables direct comparison with future computational fluid dynamics (CFD) studies employing identical geometries and inflow conditions, thereby supporting the development and assessment of numerical models for rooftop flow applications.
The interacting-building configuration investigated here represents a deliberately simplified and idealized urban morphology with uniform neighboring building heights and regular spacing. This setup enables a controlled comparison between isolated and sheltered rooftop flows and allows interaction effects to be isolated systematically. However, real urban environments exhibit substantial variability in street widths, staggered arrangements, and heterogeneous building heights, which can significantly modify rooftop acceleration patterns, turbulence levels, and separation behavior. The presented interacting-building results should therefore be interpreted as representative reference cases rather than universally applicable. Extending the dataset to additional urban morphologies constitutes an important direction for future work.
While the present study focuses on the characterization of rooftop flow acceleration and turbulence patterns, the implications for turbine operation must be interpreted in the context of turbine-specific aerodynamic behavior. Recent CFD studies on advanced vertical-axis wind turbine blade concepts have demonstrated that aerodynamic blade design can significantly improve turbine performance under low-wind and highly turbulent conditions typical of urban environments. In particular, J-shaped trailing-edge modifications have been shown to substantially enhance self-starting capability, smooth torque fluctuations, and reduce wake turbulence intensity [19]. Such findings underline the importance of coupling detailed rooftop flow characterization with turbine-specific aerodynamic considerations when assessing rooftop wind energy potential.
Limitations of the present work include a simplified wind-tunnel setup that does not fully reproduce the spatial complexity and temporal variability of real atmospheric flows. Future studies should combine the present results with field measurements or high-fidelity CFD simulations, incorporating transient inflow conditions, diverse urban roughness, and seasonal wind statistics.
Overall, the findings confirm that rooftop wind-energy potential in urban environments is highly site-specific. Integrating controlled aerodynamic data with realistic wind-climate statistics represents a robust pathway to improve the planning and performance prediction of small wind turbines in cities.
7. Conclusions
This study combined theoretical analysis, wind-tunnel experiments, and a site-specific case study to quantify rooftop wind acceleration and evaluate its impact on small wind-turbine performance. The main conclusions can be summarized as follows:
- Direction-dependent roof speed-up factors were experimentally determined for isolated and interacting building arrangements under controlled boundary-layer conditions.
- Local flow acceleration of up to 25% was observed near roof edges, while turbulence intensity remained below 14% in most elevated regions.
- Surrounding buildings significantly attenuate acceleration effects for low-rise structures, but this influence diminishes with increasing building height.
- The combination of aerodynamic speed-up data with directional Weibull wind statistics and turbine power curves enables realistic estimates of annual energy yield.
- The openly available dataset provides a benchmark for CFD validation and supports urban wind-energy planning and micrositing.
Future research should extend this framework toward field validation and unsteady simulation of complex urban settings, including different roof geometries, terrain categories, and seasonal wind climates. The developed methodology establishes a reproducible link between controlled experimental data and real-world energy potential, contributing to a more reliable integration of small wind systems into the urban renewable energy mix.
Author Contributions
Methodology, F.K.; Investigation, M.F., O.G. and V.W.; Writing—original draft, V.W.; Writing—review editing, M.F., F.K. and V.W.; Visualization, V.W. and O.G.; Supervision, F.K. All authors have read and agreed to the published version of the manuscript.
Funding
The project “Profilbildung Built and Lived Environment” is receiving funding from the program “Profilbildung 2022", an initiative of the Ministry of Culture and Science of the State of North Rhine-Westphalia. The sole responsibility for the content of this publication lies with the authors.
Data Availability Statement
The complete experimental dataset, including measured velocity time series, processed speed-up and turbulence-intensity fields, and reference free-flow conditions, is upon request. The dataset is intended to serve as (i) a reference dataset for future CFD studies investigating rooftop flow acceleration and turbulence under controlled conditions and (ii) a planning resource for assessing turbine siting and wind-energy potential in urban environments.
Acknowledgments
This study was conducted within the “Built and Lived Environment (BLE)” profile area at RWTH Aachen University, an interdisciplinary initiative on sustainable urban transformation, with a focus here on integrating renewable-energy systems in the built environment [20,21].
Conflicts of Interest
The authors declare no conflict of interest.
Abbreviations
The following abbreviations are used in this manuscript:
| AEP | Annual Energy Production |
| BLE | Built and Lived Environmental |
| CFD | Computational Fluid Dynamics |
| DWD | Deutscher Wetterdienst (German Weather Service) |
| SWT | Small Wind Turbine |
| WD | Weather Station |
References
- Lubitz, W.D. Impact of ambient turbulence on performance of a small wind turbine. Renew. Energy 2014, 61, 69–73. [Google Scholar] [CrossRef] [Scilit]
- Stathopoulos, T.; Alrawashdeh, H.; Al-Quraan, A.; Blocken, B.; Dilimulati, A.; Paraschivoiu, M.; Pilay, P. Urban wind energy: Some views on potential and challenges. J. Wind Eng. Ind. Aerodyn. 2018, 179, 146–157. [Google Scholar] [CrossRef] [Scilit]
- Gough, M. Turbine Wind Resource Assessment: A Case Study on Cape Town. Energies 2019, 12, 1479. [Google Scholar] [CrossRef] [Scilit]
- Blocken, B. Pedestrian-level wind conditions around buildings: Review of wind-tunnel and CFD techniques and their accuracy for wind comfort assessment. Build. Environ. 2016, 100, 50–81. [Google Scholar] [CrossRef] [Scilit]
- Peng, L.; Xie, Y.H.; Liu, Y.; Li, Q.S. Experimental investigation of wind characteristics and wind energy potential over flat rooftops of tall buildings. J. Wind Eng. Ind. Aerodyn. 2020, 201, 104142. [Google Scholar] [CrossRef] [Scilit]
- Franke, J. Introduction to the Prediction of Wind Loads on Buildings by Computational Wind Engineering (CWE). In Wind Effects on Buildings and Design of Wind-Sensitive Structures; Stathopoulos, T., Baniotopoulos, C.C., Eds.; CISM International Centre for Mechanical Sciences; Springer: Vienna, Austria, 2007; Volume 491, pp. 219–245. [Google Scholar] [CrossRef] [Scilit]
- Blocken, B. Computational Fluid Dynamics for urban physics: Importance, scales, possibilities, limitations and ten tips and tricks towards accurate and reliable simulations. Build. Environ. 2015, 91, 219–245. [Google Scholar] [CrossRef] [Scilit]
- Abohela, I.; Hamza, N.; Dudek, S. Effect of roof shape, wind direction, building height and urban configuration on the energy yield and positioning of roof mounted wind turbines. Renew. Energy 2013, 50, 1106–1118. [Google Scholar] [CrossRef] [Scilit]
- Toja-Silva, F.; Lopez-Garcia, O.; Peralta, C.; Navarro, J.; Cruz, I. An empirical–heuristic optimization of the building-roof geometry for urban wind energy exploitation on high-rise buildings. Appl. Energy 2016, 164, 769–794. [Google Scholar] [CrossRef] [Scilit]
- Rafailidis, S. Influence of building areal density and roof shape on the wind characteristics above a town. Bound.-Layer Meteorol. 1997, 85, 255–271. [Google Scholar] [CrossRef] [Scilit]
- Ledo, L.; Kosasih, P.B.; Cooper, P. Roof mounting site analysis for micro-wind turbines. Renew. Energy 2011, 36, 1379–1391. [Google Scholar] [CrossRef] [Scilit]
- Clobes, M. Buffeting Wind Load on Antennas with Rooftop Site. Civ. Environ. Eng. 2015, 5, 190. [Google Scholar] [CrossRef]
- Kono, T.; Kogaki, T.; Kiwata, T. Numerical Investigation of Wind Conditions for Roof-Mounted Wind Turbines: Effects of Wind Direction and Horizontal Aspect Ratio of a High-Rise Cuboid Building. Energies 2016, 9, 907. [Google Scholar] [CrossRef] [Scilit]
- Davenport, A.G. Gust Loading Factors. In Proceedings of the International Research Seminar on Wind Effects on Buildings and Structures, Ottawa, ON, Canada, 11–15 September 1967; pp. 35–104. [Google Scholar]
- Topographic Map. 2025. Available online: https://www.topographic-map.com/ (accessed on 26 September 2025).
- Ministerium des Innern des Landes Nordrhein-Westfalen. GEOportal.NRW. 2025. Available online: https://www.geoportal.nrw/?activetab=map (accessed on 16 April 2025).
- DIN EN 1991-1-4; Eurocode 1: Actions on Structures—Part 1–4: General Actions–Wind Actions; German Version EN 1991-1-4:2005 + A1:2010 + AC:2010. Beuth Verlag GmbH: Berlin, Germany, 2010.
- DIN EN IEC 61400-12-1; Wind Energy Generation Systems—Part 12-1: Power Performance Measurements of Electricity Producing Wind Turbines (IEC 61400-12-1:2022); German Version EN IEC 61400-12-1:2022. Beuth Verlag GmbH: Berlin, Germany, 2022.
- Abdallah, A.; William, M.A.; Moharram, N.A.; Zidane, I.F. Boosting H-Darrieus vertical axis wind turbine performance: A CFD investigation of J-Blade aerodynamics. Results Eng. 2025, 27, 106358. [Google Scholar] [CrossRef] [Scilit]
- Profile Area Built and Lived Environment (BLE). Profile Area Built and Lived Environment (BLE). 2025. Available online: https://www.ble.rwth-aachen.de/cms/ (accessed on 26 September 2025).
- Kemper, F.; Lohrberg, F. Transformation of the Built and Lived Environment. In Transformation Towards Sustainability: A Novel Interdisciplinary Framework from RWTH Aachen University; Letmathe, P., Roll, C., Balleer, A., Böschen, S., Breuer, W., Förster, A., Gramelsberger, G., Greiff, K., Häußling, R., Lemme, M., et al., Eds.; Springer: Cham, Switzerland, 2024; pp. 363–378. [Google Scholar] [CrossRef] [Scilit]

Disclaimer/Publisher’s Note: The statements, opinions and data contained in all publications are solely those of the individual author(s) and contributor(s) and not of MDPI and/or the editor(s). MDPI and/or the editor(s) disclaim responsibility for any injury to people or property resulting from any ideas, methods, instructions or products referred to in the content. |
© 2026 by the authors. Licensee MDPI, Basel, Switzerland. This article is an open access article distributed under the terms and conditions of the Creative Commons Attribution (CC BY) license.