


Abstract
The invasive aquatic plant Myriophyllum aquaticum represents both an ecological threat and a wet biomass disposal challenge. This study investigates hydrothermal carbonization (HTC) as a strategy for its valorisation into energy-dense hydrochar. A Design of Experiments–Response Surface Methodology (DoE-RSM) approach was applied to elucidate the combined influence of temperature (200–260 °C), residence time (30–210 min), and solid load (5–25 wt%) on hydrochar yield and properties. Hydrochar yields ranged from 48.8% to 65.6%, with the highest yields achieved at 200 °C, 30 min, and 25 wt% solids. Higher heating values of hydrochars spanned from 12.14 to 14.53 MJ/kg, corresponding up to +19% energy densification at higher process severity. Carbon and energy yields reached 69.7% and 68.6%, respectively, with maximum values attained under low-severity, high-solid-load conditions. The predictive models exhibited strong agreement with experimental data, enabling optimisation of HTC parameters for targeted hydrochar applications. Two hydrochars, “peat-like” and “lignite-like”, were further characterised for their potential use as soil amendments. The lignite-like hydrochar complied with EU contaminant limits and showed no phytotoxicity, confirming its suitability for agronomic use. Overall, HTC of M. aquaticum provides an effective waste-to-resource pathway, transforming wet invasive biomass into value-added carbon materials.
1. Introduction
The proliferation of invasive alien plant species is a growing environmental concern, disrupting ecosystems and causing significant ecological and economic challenges. Myriophyllum aquaticum (Vell.) Verdc., commonly known as parrot’s feather, is one of such invasive species. It is an amphibious aquatic macrophyte native to South America that has become a globally distributed invasive species, including extensive regions of central and northern Italy since the 1990s. Introduced for ornamental purposes, it has rapidly colonised stationary or slow-moving aquatic habitats such as ponds, lakes, and canals. Since 2004, the presence of M. aquaticum has been reported in the drainage basin of Lake Massaciuccoli (north-western Tuscany, Italy), where a large part of the drainage canal network has been colonised by the plant which is capable of obstructing the normal outflow of water. As shown in Figure 1, the Barra-Barretta canal, the largest in the reclamation district of Lake Massaciuccoli, has been completely invaded by the development of M. aquaticum, heavily penalising hydraulic functionality. Its rapid growth, high biomass production and huge reproductive capacity disrupt local biodiversity, and hinder the functionality of hydraulic networks, necessitating frequent and costly removal operations. The resulting wet biomass is often treated as biological waste, posing additional disposal challenges. Therefore, the development of sustainable management strategies for M. aquaticum is essential, ideally transforming this invasive biomass into a valuable resource.
Figure 1.
Development achieved by Myriophyllum aquaticum in the Barra-Barretta canal (Lake Massaciuccoli catchment area, Tuscany, Italy).
A promising strategy for the sustainable management of wet waste biomass involves hydrothermal carbonization (HTC), a thermochemical process conducted at moderate temperatures (generally between 180 and 260 °C) in subcritical water [1,2]. Unlike other biomass conversion processes, HTC is especially suitable for high-moisture materials, like aquatic plants, because it bypasses the need for energy-intensive pre-drying, thereby reducing overall energy demand [3]. During HTC, biomass is converted into hydrochar, a carbon-rich, coal-like solid with different potential applications. The process not only reduces waste volume but also generates a stable material with enhanced and tailorable properties.
Hydrochar exhibits a wide range of applications owing to its enhanced physicochemical properties. It can be utilised as a renewable biofuel, benefiting from its high energy density comparable to lignite, providing a sustainable energy source [2,4]. Moreover, hydrochar may be used as a soil amendment, improving soil fertility, water retention, and nutrient availability [5,6,7]. Combining HTC with templating methods or with physical or chemical activation yields porous carbon structures characterised by high specific surface area and pore volume, which make activated hydrochar a suitable adsorbent for water treatment, gas purification, and removal of contaminants in environmental applications [7,8,9]. Its high surface area and functionalized structure make it suitable for use in catalytic and electrocatalytic processes [7,8]. In energy storage applications, it can be employed as electrode material in energy devices, including lithium-ion batteries and supercapacitors [8]. Furthermore, hydrochar is currently being investigated as a renewable substitute for fossil carbon in the iron and steel industry, e.g., as an injected reducing agent in blast furnaces or as a recarburising material in electric steelmaking processes, with experimental and life-cycle assessment studies reporting its potential contribution to greenhouse gas emission reduction when appropriately upgraded or blended with conventional carbon sources [10,11,12]. These features highlight the role of HTC in advancing sustainable materials and circular-economy principles.
The valorisation of M. aquaticum through HTC could thus transform an environmental challenge into an opportunity for circular resource utilisation.
Several studies have explored HTC applicability to other invasive aquatic species, such as Egeria densa and Lemna minor [13], Elodea nuttallii [14,15], Ceratophyllum demersum [16], Salvinia molesta (Giant Salvinia) [17], Typha australis [18], Typha latifolia (cattail) [19], water hyacinth (Eichhornia crassipes) [19,20,21,22,23,24], Canna indica, Hydrocotyle verticillata, and Myriophyllum spicatum [25].
A summary of relevant studies on HTC application to invasive aquatic weeds is presented in Table 1, including the process conditions explored in each study, i.e., temperature (T), time (t), and solid load (SL), defined as the mass fraction of biomass in the reaction feed. For consistency, biomass-to-water and water-to-biomass ratios reported in the literature were converted to SL.
Table 1.
Summary of relevant studies on HTC application to invasive aquatic species.
HTC proved to be a promising approach for transforming wetland plants into value-added hydrochar. HTC process parameters, in addition to feedstock type, were shown to exert a marked influence on both hydrochar properties and yields.
To date, HTC applied to M. aquaticum has been only marginally investigated. The few available studies by Lang et al. [26,27] offer insights into the potential applications of M. aquaticum-derived hydrochar in soil systems. Lang et al. [26] explored the feasibility of using hydrochar derived from M. aquaticum at 200 °C for the remediation of antibiotic-contaminated soil. A short-term pot experiment proved the efficacy of hydrochar amendment in reducing antibiotic concentration in soil and limiting its uptake. In a further research, Lang et al. [27] evaluated the characteristics and phytotoxicity of dissolved organic matter released from hydrochar produced at different temperatures (180–220 °C).
While these contributions provided useful insights into the potential application of M. aquaticum-derived hydrochar in soil systems, they did not systematically investigate the influence of operating parameters on process performance and hydrochar properties. Previous studies mainly focused on soil remediation and on the characteristics and phytotoxicity of hydrochar-derived dissolved organic matter, without performing an optimisation of the HTC process. Therefore, the combined effects of temperature, residence time, and solid load on hydrochar yield, carbon retention, energy recovery, and material properties remain unexplored for M. aquaticum.
To overcome these limitations, a Design of Experiments—Response Surface Methodology (DoE-RSM) approach was adopted to analyse, predict, and optimise the process. The Design of Experiments (DoE) is a statistical methodology that uses randomised experimental planning to evaluate effects of process variables on outputs, reducing the number of experiments required. Combined with Response Surface Methodology (RSM), it allows the development of non-linear parametric models capable of predicting outputs and identifying optimal conditions for desired outcomes. The DoE-RSM approach is especially well-suited to investigating HTC due to the complexity of the reactions involved in the process, and it has been effectively applied across a range of feedstocks, e.g., Typha australis [18], water hyacinth [21], Albizia saman bark [28], chilli seeds [29], coconut shell [30], corn straw [31], liquorice root pulp [32], olive stone [33], oat husk [34], palm shell [35], coffee husk [36], spent coffee grounds [37,38], Agave Salmiana bagasse [39], tomato peel [40], chicken feather [41], microalgae [42], sewage sludge [43,44,45,46], paper sludge [47], dairy manure digestate [48], food waste [49,50,51], mixed agri-food waste [52], organic fraction of municipal solid waste [53], and compost from municipal solid waste [54].
However, despite the successful application of DoE–RSM to numerous biomass feedstocks, no comprehensive and statistically supported optimisation study has yet been reported for the HTC of M. aquaticum. The absence of a systematic parametric framework limits the possibility of identifying operating conditions tailored to specific valorisation targets.
The present study therefore provides the first systematic and statistically supported DoE–RSM-based optimisation of HTC applied to M. aquaticum. A broader range of solid-to-liquid ratios and process severities compared to previous studies [26,27] was explored, and the combined effects of temperature, residence time, and solid load were quantitatively assessed.
Specifically, this research focuses on the following:
- (i)
- Systematically quantifying the combined effects of operating conditions on hydrochar properties and process yields through a DoE-RSM framework, and developing statistically validated predictive models;
- (ii)
- Performing optimisation of HTC operating conditions to maximise selected performance indicators; and
- (iii)
- Assessing the agronomic suitability of selected M. aquaticum-derived hydrochars through comprehensive physicochemical characterisation and phytotoxicity testing in compliance with Italian and European Union (EU) regulations.
By integrating systematic process optimisation with end-use assessment, this work provides a comprehensive framework for the valorisation of M. aquaticum, supporting the development of sustainable waste-to-resource pathways for invasive aquatic biomass.
2. Materials and Methods
2.1. Feedstock
The Myriophyllum aquaticum biomass was harvested from the Barra canal within the Lake Massaciuccoli catchment area (Tuscany, Italy). Sampling was conducted at two distinct locations within the canal, as indicated in Figure S1. The first sampling point corresponds to biomass collected in March 2023, used for the HTC experimental campaign (sample #1). The second point refers to biomass harvested in September 2023, employed in the production of hydrochar for soil amendment potential assessment (sample #2).
The raw biomass underwent pretreatment to remove foreign materials (mainly soil) and to ensure a homogeneous and representative sample suitable for laboratory-scale experiments and analyses. Pretreatment involved washing with tap water, drying at 105 °C for 24 h, and grinding using a cutting mill (SM 100, Retsch GmbH, Haan, Germany) equipped with a 1 mm sieve. The biomass was stored in a refrigerator until use.
The M. aquaticum samples were characterised through proximate analysis (volatile matter (VM), fixed carbon (FC), and ash content), ultimate analysis (carbon, hydrogen, nitrogen, and oxygen contents), and determination of the higher heating value (HHV). Proximate, ultimate, and HHV analyses were performed according to the relevant standards (see Section 2.4 for details). The results of the characterisation are summarised in Table 2. The lower ash content of sample #2 is likely due to differences in sampling locations and harvesting methods.
Table 2.
Results of feedstock characterisation (dry basis).
2.2. Design of Experiments
The HTC experiments were planned according to the DoE methodology. Temperature (A), time (B), and solid load (C) were selected as independent variables (factors). The specific levels for each factor are detailed in Table 3.
Table 3.
Independent variable levels in HTC tests.
An RSM approach employing a face-centred Central Composite Design was adopted to investigate potential non-linear interactions among the factors. The experimental matrix consisted of 20 runs, including eight (2n) factorial runs, six (2n) axial runs, and six replicates at the central point (n represents the number of factors). To reduce the influence of uncontrolled variables, the experiments were performed in a randomised sequence.
Process performance was evaluated by analysing the following responses: hydrochar yield (Y), hydrochar volatile matter, fixed carbon and ash contents, hydrochar carbon content, carbon yield, hydrochar H/C and O/C atomic ratios, hydrochar higher heating value (HHV), energy densification (ED), and energy yield (EY). Hydrochar yield, carbon yield, ED, and EY were calculated as detailed in Equations (1)–(4), following standard definitions reported in the HTC literature [2]. All calculations were performed on a dry biomass basis.
Analysis of variance (ANOVA) was carried out to identify suitable parametric models for each response. The experimental design and regression analyses were performed using the Design Expert software (version 13, Stat-Ease, Minneapolis, MN, USA).
2.3. Hydrothermal Carbonization Experiments
The HTC experiments were conducted in a 300 mL volume stainless-steel reactor (model 4566, Parr Instrument Company, Moline, IL, USA). The reactor was equipped with a mechanical stirrer, a heating system, and temperature and pressure sensors. Operational control was managed through a Process Controller (model 4848, Parr Instrument Company, Moline, IL, USA), which provided real-time monitoring and regulation of process parameters, including stirring rate and temperature setpoints.
Tests were conducted at different reaction temperatures (200–260 °C), residence times (30–210 min), and solid loads (5–25 wt%), according to the experimental design matrix. At the beginning of each test, the reaction vessel was loaded with M. aquaticum biomass and deionised water to achieve the required SL. Subsequently, the heating started, with stirring maintained at 200 rpm. The heating phase required 40–75 min, and the reaction time was recorded once the target temperature was reached. After the reaction period, the reactor was cooled to room temperature before opening the outlet valve to release the gases. The resulting slurry was recovered from the reactor, and the solid fraction (hydrochar) was isolated through vacuum filtration and rinsed thoroughly with water. Finally, the hydrochar was dried at 105 °C for 12 h, weighed, and stored at 4 °C.
2.4. Feedstock and Hydrochar Characterisation
Proximate analysis was conducted by thermogravimetric (TG) analysis. Volatile matter and ashes were quantified according to EN ISO 22167 [55] and EN ISO 21656 [56] test methods, respectively.
TG analyses were performed with a Q-500 analyser (TA Instruments, New Castle, DE, USA), using approximately 15 mg of sample placed in alumina crucibles. An initial drying step was carried out by heating the sample to 105 °C under a nitrogen atmosphere (100 mL/min) and holding it isothermally for 10 min to remove residual moisture. The sample was then heated under nitrogen at a constant heating rate of 20 °C/min up to 900 °C, followed by a 10 min isothermal stage for VM determination and devolatilisation assessment. After completion of the inert heating stage, the system was cooled to 800 °C and the purge gas was switched to air. A further 10 min isothermal stage under oxidising conditions allowed combustion of the remaining carbonaceous residue, and ash content was determined from the final residual mass.
Ultimate analysis was carried out using a TruSpec CHN Elemental Analyzer (LECO, St. Joseph, MI, USA) in accordance with the EN ISO 16948 standard method [57], with oxygen content determined by difference. Higher heating values were measured using an AC-500 Calorimeter (LECO, St. Joseph, MI, USA) following the EN ISO 18125 standard method [58].
Electrical conductivity, pH, humic and fulvic acid contents, and ammoniacal nitrogen were determined using Italian standard methods for compost analysis. Total organic carbon (TOC) was measured according to EN 15936 test method [59]. Organic nitrogen and exchangeable potassium determinations followed Italian soil analysis standard methods. Water soluble anions (Cl−, SO42−, NO3−, PO43−) and cations (NH4+, Na+, Ca2+) were quantified by ion chromatography, and cation exchange capacity was assessed according to a published method [60].
Elemental concentrations (As, B, Ca, Cd, Cr, Cu, Fe, Hg, K, Mg, Mn, Mo, Na, Ni, P, Pb, Zn) were determined according to EPA 3051A + EPA 6010D standard methods [61,62]. The Cr VI content was measured spectrophotometrically after diphenylcarbazide complexation.
Polycyclic aromatic hydrocarbons (PAHs) and polychlorobiphenyls (PCBs) were quantified by gas chromatography—mass spectrometry (GC-MS) according to EPA 3545A + EPA 3620C + EPA 8270E methods [63,64,65]. Polychlorinated dibenzo-p-dioxins and dibenzofurans (PCDD/Fs) were quantified by GC-MS following EPA 3550C + EPA 3620C + EPA 8280B protocols [64,66,67].
2.5. Phytotoxicity Tests
Hydrochar phytotoxicity was evaluated through bioassays using cress (Lepidium sativum L.), as a model species, according to microbiological methods of compost analysis reported by APAT [68].
2.5.1. Germination Test
Hydrochar water extracts for germination assays were prepared according to the following procedure. The hydrochar sample (20 g) was brought to 85% humidity with Milli-Q water and agitated at maximum speed for 2 h using an MR-12 Rocker-Shaker (Biosan SIA, Riga, Latvia). The suspension was centrifuged at 5000 rpm for 15 min (MPW Med. Instruments, Warsaw, Poland), and the supernatant was vacuum filtered (Delchimica Scientific Glassware Srl, Naples, Italy). The filtrate was then diluted to 30% (v/v) with Milli-Q water before use in germination tests.
For the germination assay, 1.5 mL of the aqueous hydrochar extract was pipetted into 9 cm diameter Petri dishes (n = 3) lined with filter paper and containing ten L. sativum seeds (pre-soaked in water for 1 h). Control dishes received 1.5 mL of Milli-Q water. All dishes were incubated in the dark for 48 h at 25 °C.
Following incubation, the Germination Index (Ig) was calculated as the following:
where Gt and Gc are the average number of germinated seeds in the treated and the control dishes, respectively, and Lt and Lc are the average root lengths of the treated and control samples [68].
After checking the normality of distribution (Shapiro–Wilk test, 95% confidence interval), differences between the treatment and the control were evaluated by an unpaired t-test.
2.5.2. Growth Test
A growth test was carried out in 0.55 L pots (n = 5) filled with a layer of expanded clay at the bottom, followed by a substrate consisting of sand and peat 1:1 (v/v) with the addition of 75 g/L of hydrochar and a layer of sand on the top. Control pots contained only the sand and peat substrate to the same volume. Twenty seeds were sown in each pot and covered with a perlite layer.
After 21 days, aboveground biomass was harvested and fresh weight was recorded. Samples were then dried at 105 °C (KG Universal Oven UN30, Memmert GmbH Co., Schwabach, Germany) to constant mass for dry weight determination.
The Growth Index (Gm) was calculated as follows:
where Gt and Gc are the average dry weights of plants in treated and control pots, respectively [68].
The results were analysed by a non-parametric Kruskal–Wallis test, and significant differences among treatments were determined by Dunn’s multiple comparisons post hoc test (p ≤ 0.05).
3. Results and Discussion
3.1. Hydrothermal Carbonization of Myriophyllum Aquaticum: Overview of HTC Results and RSM Analysis
The results of the HTC experimental runs, including key physicochemical properties of M. aquaticum-derived hydrochars as well as the process yields, are summarised in Table 4. Table 4 details the hydrochar yield, proximate and elemental analyses, carbon yield, heating value, energy densification and energy yield.
Table 4.
Experimental matrix of HTC tests and results obtained for process yields and hydrochar properties (dry basis).
In addition to hydrochar formation, the HTC process also generates liquid and gaseous phases. HTC studies report that the gas fraction is typically composed predominantly of carbon dioxide, formed mainly through decarboxylation reactions [69]. The liquid phase consists primarily of water containing a complex mixture of dissolved organic compounds, including low-molecular-weight organic acids (e.g., acetic and formic acid), furans, phenolic derivatives, ketones, aldehydes, and other soluble intermediates originating from biomass hydrolysis and dehydration reactions [1,2,3,70,71].
Product mass balance and carbon balance were performed and are reported in Figure S2 (Supplementary Materials) for all runs. The product distribution was evaluated on a dry feedstock basis and expressed as solid (hydrochar), liquid, and gas fractions. The gas fraction was estimated based on the residual pressure in the reactor at the end of the experimental run and, consistently with literature reports, was assumed to be mainly carbon dioxide. The liquid fraction was calculated by difference from the experimentally measured solid and gas yields. Overall, the HTC of M. aquaticum resulted in approximately 48.8–65.6% of solid, 29.9–44.0% of liquid, and 2.0–11.0% of gas, depending on process conditions. The corresponding carbon distribution indicates that 48.7–69.7% of the initial carbon was retained in the hydrochar, whereas 26.5–45.5% was transferred to the aqueous phase and 1.7–9.4% was released to the gas phase.
The HTC process converted the M. aquaticum biomass into a carbon-rich solid product, characterised by an increased total and fixed carbon content and reduced atomic H/C and O/C ratios compared to the raw feedstock. The carbonization degree may be assessed using a Van Krevelen diagram (Figure 2), which plots the atomic H/C ratio vs. the O/C ratio, placing the hydrochars in relation to other carbonaceous materials as peat, lignite, and coal [72]. The results in Figure 2 clearly highlight that hydrochars produced under varying HTC conditions exhibit elemental compositions akin to peat and lignite. Increasing process severity (higher temperature, or longer residence time) results in a greater carbonisation degree.
Figure 2.
Van Krevelen diagram obtained for Myriophyllum aquaticum- and M. aquaticum-derived hydrochars (yellow symbols: 200 °C temperature; orange symbols: 230 °C temperature; brown symbols: 260 °C temperature; empty symbols: 30 min time; dashed symbols: 120 min time; solid symbols: 210 min time; triangles: 5 wt% solid load; circles: 15 wt% solid load; rhombuses: 25 wt% solid load).
To assess the effects of operational parameters on hydrochar characteristics and process yields, RSM was applied. Polynomial models were fitted to the experimental data, and the significance of each regression term was evaluated via ANOVA. For each response, the selected model was statistically significant (p-value < 0.05) and attained high adjusted and predicted R2 values. Diagnostic plots confirmed the close correspondence between observed and predicted values, demonstrating the reliability of the models. Detailed ANOVA results for each response are provided in Tables S1–S11 of the Supplementary Materials. The HTC results and the models obtained are discussed in the next section.
3.2. Effect of Process Variables on Hydrochar Properties and Process Yields
3.2.1. Hydrochar Yield
The experimental results for hydrochar yield (Y) exhibited values ranging from 48.80% to 65.56% by weight (Table 4). The lowest yield was recorded in the test conducted at 260 °C for 210 min with 5 wt% SL; conversely, the highest yield was achieved at 200 °C for 30 min with 25 wt% SL.
A reduced cubic model was identified as the best fit for the experimental data, as indicated by high determination coefficients (R2 = 0.9978, adjusted R2 = 0.9958, predicted R2 = 0.9932) and an insignificant lack of fit (Table S1). The equations, expressed in terms of coded and actual factors, are presented as Equations (7) and (8), respectively:
The coded equation is useful for the identification of the relative impact of the factors by comparing their coefficients. Both equations enable response predictions for the given levels of each factor.
ANOVA results (Table S1) revealed that several factors are significant for Y modelling. Specifically, factors A (temperature), B (time), C (solid load), A2, C2, A2B, and A2C were identified as significant for hydrochar yield. The significance of the interactions A2B and A2C indicates a combined effect of temperature and residence time, as well as temperature and SL, respectively. Although the interaction terms AB and AC were not individually significant, they were retained in the model to preserve hierarchy, as higher-order interaction terms involving these factors (A2B and A2C) were statistically significant.
The effect of operational conditions on hydrochar yield can be visualised through three-dimensional response surface plots (Figure 3). These plots highlight the relationships between yield and process parameters. In Figure 3, the effects of two variables were illustrated while holding the third constant at three different levels within each row: temperature and time at fixed SL (a–c), temperature and SL at fixed residence time (d–f), and time and SL at fixed temperature (g–i).
Figure 3.
Response surface plots for hydrochar yield as a function of process variables: (a–c) temperature and time; (d–f) temperature and solid load; (g–i) time and solid load.
The model coefficients (Equation (7)) indicate that temperature is the most influential factor affecting yield. Hydrochar yield decreased with increasing temperature, consistent with the findings of Lang et al. for M. aquaticum [27] and other studies on various biomass feedstocks [14,15,19,21,24,25,73]. This trend can be attributed to the degradation of biomass polymers, primarily hemicellulose and cellulose, by hydrolysis and subsequent reactions like dehydration and decarboxylation. The products originating from the lignocellulosic feedstock are thus transferred in the liquid or gas phase, leading to a significant solid mass decrease. Elevated temperatures promote hydrolysis and further breakdown of hydrolysis products, resulting in greater mass loss.
A quantitative comparison with other invasive aquatic macrophytes is presented in Table 5. Despite differences in specific operating conditions among studies, a consistent temperature-dependent trend emerges across species: increasing HTC temperature results in decreasing hydrochar yield. This behaviour is observed for M. aquaticum as well as for Myriophyllum spicatum, Hydrocotyle verticillata, Canna indica, water hyacinth, Typha latifolia, and Salvinia molesta.
Table 5.
Comparative hydrochar yield and properties from HTC of selected invasive aquatic plant species under representative operating conditions.
In addition to the similar trend, the hydrochar yields obtained for M. aquaticum (≈49–66%) fall within the range commonly reported for other aquatic macrophytes processed under comparable temperature intervals, which typically exhibit yields between approximately 30% and 60%, depending on process severity. This confirms that M. aquaticum behaves consistently with other invasive aquatic species in terms of solid-phase recovery during HTC.
The model equation (Equation (7)) and the response surfaces in Figure 3 highlight that increasing both the temperature and the residence time leads to decreased hydrochar yield. Indeed, elevating temperature and reaction time causes enhanced decomposition of the biomass feed. However, residence time had a less pronounced impact on yield compared to temperature. This is likely due to the slow heating rate of the reaction vessel during the heating phase allowing sufficient time for reactions to occur. Once the target temperature was achieved, prolonged residence time had limited additional effects.
The experimental results also evidenced that SL represents a significant parameter for biomass hydrothermal carbonization, positively influencing hydrochar yield (see Equation (7) and Figure 3). This outcome parallels observations documented in the literature and may be explained as suggested by Funke and Ziegler [69] and Volpe and Fiori [74]. Higher biomass loading leads to greater monomer concentration in the liquid phase from hydrolysis, dehydration and decarboxylation reactions. This higher concentration promotes condensation and polymerisation reactions of these highly reactive intermediates, leading to the precipitation of insoluble solids (secondary char), and thus an increase in the solid mass yield.
The model adequacy was confirmed through diagnostic plots (Figure 4).
Figure 4.
Diagnostic plots of predicted model values vs. experimental data for hydrochar yield (a), carbon yield (b), hydrochar HHV (c), and energy yield (d).
The agreement between observed and predicted values was demonstrated by the close alignment of points along the diagonal in the predicted versus actual value plot in Figure 4a. These results underline the robustness of the model in predicting hydrochar yield under varying process conditions.
3.2.2. Hydrochar Properties
The hydrochar’s physicochemical properties were strongly influenced by the HTC operating parameters which govern the transformation of the biomass’s principal constituents. Under hydrothermal conditions, hemicellulose and cellulose degradation typically requires temperatures of at least 200 °C: subcritical water cleaves glycosidic linkages, yielding oligomeric and monomeric fragments that subsequently undergo dehydration, decarboxylation, condensation and polymerisation reactions to form the solid hydrochar matrix [2,69]. On the other hand, lignin undergoes limited degradation between 200 and 260 °C.
TG analysis provided further insight into these compositional changes. Figure 5 presents the derivative thermogravimetric (DTG) profiles (nitrogen atmosphere, 20 °C/min) of M. aquaticum and of hydrochars produced under varying conditions, while Table 4 summarises the results of proximate analyses. The raw biomass exhibits two distinct DTG peaks—a shoulder at 256 °C, ascribable to hemicellulose decomposition, and a major peak at 316 °C, reflecting cellulose degradation—whereas lignin decomposition occurs over a broader, higher temperature range.
Figure 5.
Weight loss rate curves obtained from TG analysis (20 °C/min constant heating rate, 100% nitrogen flow) for Myriophyllum aquaticum- and M. aquaticum-derived hydrochars produced in different operating conditions: (a) different temperatures; (b) different reaction times; (c) different solid loads; (d) different severity conditions.
Following hydrothermal treatment, both low-temperature peaks vanish, denoting the near-complete degradation of hemicellulose and cellulose. A sharp DTG peak emerges at higher temperatures, indicative of a more thermally stable carbonaceous structure. Moreover, this peak progressively shifts to higher temperatures—and the maximum weight loss rate diminishes—as HTC reaction temperature increases (Figure 5a). For instance, at 15 wt% SL and a 120 min residence time, the DTG maxima occur at 362 °C, 368 °C and 380 °C for HTC temperatures of 200 °C, 230 °C and 260 °C, respectively. Harsher HTC operating conditions yield hydrochar with greater thermal stability. Under the most severe conditions (260 °C, 210 min, 25 wt% SL), the peak is entirely replaced by a broad peak above 400 °C, signalling the formation of a highly condensed carbonaceous structure (Figure 5d). Comparable, albeit less pronounced, shifts in DTG peak temperature were observed with increasing residence time (Figure 4b; peak maxima 366–370 °C) and SL (Figure 5c; peak maxima 368–371 °C).
Such observations concur with previous reports on the HTC of other biomass residues, such as olive waste [74] and mixed agri-food waste [52], underscoring the general tendency of HTC process severity to enhance hydrochar thermal stability.
A decline in volatile matter (VM) content for M. aquaticum-derived hydrochars was observed with increasing HTC temperatures and residence times, as confirmed by the ANOVA results (Table S2). The reduced linear models, expressed in coded and actual factors, are provided in Equations (9) and (10), respectively.
Conversely, fixed carbon (FC) content increased with higher temperatures. ANOVA results (Table S3) identified SL as a significant factor positively influencing FC, while residence time showed no significant effect. The reduced linear models for coded and actual values are given in Equations (11) and (12). The trends in VM and FC content are visualised as response surfaces in Figure S3.
The analyses indicate a marked rise in ash content for M. aquaticum following HTC. While the ash content of the feedstock was 33.07 wt%, the hydrochars exhibited values ranging between 40 and 53 wt%. This high ash content reflects the M. aquaticum’s remarkable ability to accumulate metals. An increase in ash content with rising temperature aligns with results reported for other wetland biomass wastes [14,17,25], which is also evident from the comparative analysis reported in Table 5. The linear models for ash content, in coded and actual values, are presented in Equations (13) and (14) (ANOVA results in Table S4), with corresponding response surface plots depicted in Figure S4. Notably, ash content increased with temperature and residence time but decreased with higher SL.
The elemental composition of M. aquaticum-derived hydrochars is summarised in Table 4. Carbon content exhibited limited variation, remaining close to feedstock levels. Such stability may stem from the hydrochar higher ash fraction, which increases with process severity (see Equations (13) and (14) and Figure S4). Although the dry, ash-free carbon content of hydrochar increased due to carbonization, total carbon concentration showed limited variation (31–36 wt%). A reduced cubic model for hydrochar carbon content, accounting for significant factor interactions, was identified based on ANOVA results (Table S5) and is reported in Equations (15) and (16) (coded and actual factors, respectively). The relationship between process parameters and carbon content is illustrated in Figure 6, indicating that higher SL enhances carbon content.
Figure 6.
Response surface plots for hydrochar carbon content as a function of process variables: (a–c) temperature and time; (d–f) temperature and solid load; (g–i) time and solid load.
Substantial reductions in hydrogen and oxygen contents were observed in hydrochar compared to M. aquaticum. Correspondingly, lower H/C and O/C atomic ratios were recorded, as shown in the Van Krevelen plot (Figure 2). These reductions result primarily from dehydration and decarboxylation reactions, with the ratios decreasing further at higher temperatures and longer residence times. A reduced cubic model for the H/C ratio was identified based on the ANOVA results (Table S6) and is expressed in Equations 17 and 18, whereas a reduced linear model was obtained for the O/C ratio (Table S7) and is reported in Equations (19) and (20). Response surface plots are provided in Figure 7.
Figure 7.
Response surface plots for hydrochar O/C atomic ratio (a) and H/C atomic ratio (b–d) as a function of process variables.
As detailed in Table 4, the hydrochar HHV surpassed that of the biomass feedstock, achieving ED values greater than unity. The increase in HHV with HTC severity is consistent with literature findings [16,17,19,20,21,24,25,73,74]. The increase in HHV with increasing process severity is consistent with trends reported for other invasive aquatic macrophytes (Table 5). Across species such as Myriophyllum spicatum, Hydrocotyle verticillata, Canna indica, water hyacinth, Typha latifolia, and Salvinia molesta, higher temperatures generally lead to progressive deoxygenation and enrichment in fixed carbon, resulting in increased HHV. However, while some species reach HHV exceeding 20 MJ/kg under more severe conditions, M. aquaticum-derived hydrochar exhibits comparatively moderate HHV (≈12–15 MJ/kg in the present study). This difference can be largely attributed to its relatively high ash content, which reduces the combustible organic fraction of the hydrochar.
Temperature, residence time, SL, and their interactions significantly influenced HHV, as indicated by the ANOVA results (Table S8). The corresponding regression model is expressed in Equations (21) and (22) (coded and actual forms, respectively).
Model equations (Equations (21) and (22)) and response surface plots (Figure 8) demonstrate that elevating reaction temperature, extending residence time, and increasing SL each exert a positive influence on HHV.
Figure 8.
Response surface plots for hydrochar higher heating value (HHV) as a function of process variables: (a–c) temperature and time; (d–f) temperature and solid load; (g–i) time and solid load.
The enhancement in hydrochar energy content is consistent with the progressive removal of oxygenated functionalities and enrichment in fixed carbon as process severity increases. This predominantly stems from the degradation of cellulose and hemicellulose as HTC progresses, which also leads to a hydrochar matrix richer in lignin, a biopolymer possessing higher thermal stability and superior energetic properties, with an HHV of approximately 26 MJ/kg compared to 16.5 MJ/kg for cellulose and 13.9 MJ/kg for hemicellulose [24]. As reported as well by Volpe and Fiori [74], higher SL proved to be advantageous for hydrochar HHV. High SL promotes the generation of secondary char, abundant in carbon, thus enhancing the energy properties of hydrochar. Accordingly, the highest HHV of 14.53 MJ/kg was attained at 260 °C, 210 min and 25 wt% SL, representing an increase of nearly 19% relative to the untreated biomass.
Similar trends were observed for energy densification; parametric models for ED are presented in Equations (23) and (24).
3.2.3. Energy Yield and Carbon Yield
Process conditions influence both hydrochar mass yield and key properties, such as HHV and carbon content. Process performance was evaluated in terms of energy yield (EY, Equation (4)) and carbon yield (CY, Equation (2)). Energy yields ranged from 50.7% to 68.6%. While higher temperatures and longer residence times improved hydrochar fuel properties, such conditions negatively impacted yield and energy recovery efficiency. Solid load positively influenced both HHV and energy yield. Increased HTC severity led to reduced hydrochar yield, thereby diminishing energy recovery efficiency. A reduced cubic model best described energy yield (Equations (25) and (26)). The ANOVA results supporting the selected model are provided in Table S10. Significant factors included temperature (A), time (B), solid load (C), and their interactions (e.g., AB, AC, A2, and C2). The response surface analysis (Figure 9) indicates the maximum energy yield at lower temperatures, shorter residence times, and higher SL.
Figure 9.
Response surface plots for energy yield as a function of process variables: (a–c) temperature and time; (d–f) temperature and solid load; (g–i) time and solid load.
Carbon yield, reflecting the amount of biomass carbon retained in hydrochar, ranged from 48.7% to 69.7% (Table 4). This metric, influenced by both carbon content and solid yield, is crucial for evaluating reaction efficiency. A reduced cubic model, expressed in coded and actual values (Equations (27) and (28)), highlights the complex influence of HTC parameters, including mutual interactions. Response surface plots (Figure 10) indicate optimal carbon yield at lower temperatures, shorter residence times, and higher SL. ANOVA results and model statistics are provided in Table S11, with diagnostic plots (Figure 4b) confirming strong experimental-to-prediction agreement.
Figure 10.
Response surface plots for carbon yield as a function of process variables: (a–c) temperature and time; (d–f) temperature and solid load; (g–i) time and solid load.
3.3. Process Optimisation
The optimisation of HTC parameters is crucial to enhance process efficiency and facilitate scale-up. Given that diverse end-uses demand hydrochars with tailored characteristics, various optimisation studies were conducted. To evaluate hydrochar’s potential as a solid biofuel, the HTC conditions were optimised to maximise the following: (a) hydrochar HHV, and (b) overall energy yield. Additionally, to explore the use of hydrochar as a precursor for carbonaceous materials, the optimisation goal was set to maximise carbon yield. RSM-derived models were employed for these optimisation studies.
For hydrochar HHV optimisation, the following optimal operating conditions were identified: a reaction temperature of 260 °C, a reaction time of 210 min, and an SL of 25 wt%, corresponding to high-severity process conditions. In contrast, the conditions delivering the maximum energy yield were identified as 200 °C, 30 min, and a 25 wt% SL. The maximum energy yield was thus achieved under low-severity conditions. It is noteworthy that this condition also reduces the overall energy demand of the process. Similarly, carbon yield maximisation yielded the same optimal conditions, indicating that low-severity process parameters are preferable in this case as well.
While the RSM analysis highlights the influence of temperature, residence time, and SL on hydrochar yield, ED, and EY, it is also relevant to consider the qualitative implications for the overall energy balance of the HTC process. In the present study, low-severity conditions were associated with higher hydrochar yield and competitive energy yield, whereas high-severity conditions enhanced carbonization and slightly improved HHV and ED, but at the expense of reduced solid yield.
From a process-energy perspective, the dominant energy demand in HTC is generally associated with heating the biomass–water slurry to the target temperature. Therefore, operating under excessively high severity does not necessarily translate into improved net energy performance, particularly when gains in HHV are offset by reduced mass yield. In contrast, moderate severity combined with higher SL may enhance overall energy recovery in the solid phase while reducing the specific thermal load per unit of dry biomass processed.
These qualitative considerations are consistent with techno-economic and life-cycle analyses reported in the literature, which identify process severity, solid loading, and heat integration strategies as key determinants of the overall energy efficiency of HTC systems [75,76,77].
To validate the predictive capability of the models, validation experiments were conducted. Two sets of operating conditions were chosen: (i) conditions optimised for maximising carbon and energy yields, and (ii) conditions optimised for maximising hydrochar HHV. Predicted and measured values for each output response from these validation experiments are summarised in Table 6. The results confirmed the models’ reliability, as almost all observed results lie within the model predicted intervals (Table 6).
Table 6.
Validation results with predicted and experimental response values.
The hydrochar produced under the two scenarios was characterised as “peat-like” hydrochar in the case of maximised energy and carbon yields, and “lignite-like” hydrochar in the case of maximised HHV.
3.4. Hydrochar’s Potential as a Soil Amendment
To assess the agronomic suitability of M. aquaticum-derived hydrochar, two distinct hydrochar types—denoted HC peat and HC lignite—were produced under different HTC conditions. HC peat was a material with “peat-like” characteristics obtained by optimising parameters to maximise carbon and energy yields, whereas HC lignite, resulting in a “lignite-like” product, was generated under conditions designed to maximise higher heating value. Both hydrochars were produced from the M. aquaticum biomass harvested in September 2023 (sample #2; see Materials and Methods). Both HC peat and HC lignite underwent comprehensive chemical characterisation, focusing on parameters critical for soil amendment applications according to Italian [78,79] and EU regulations [80,81], as well as Ecolabel criteria [82]. The results of these analyses are summarised in Table 7, which includes additional relevant chemical indicators.
Table 7.
Regulated and additional parameters of hydrochar for use as soil amendment.
Results of the present experiments unveil that both the products obtained by the HTC process respect the limits imposed by the Italian and EU regulation as well as the criteria of Ecolabel for all the parameters contemplated therein (summarised in Table 7). Notably, the concentration of xenobiotic metals, as well as PAHs, PCBs, PCDD/Fs, is significantly lower than those reported in Table 7.
In accordance with the previous findings obtained by HTC with M. aquaticum in China [26,27], the pH value of both hydrochars were found to be sub-acid (5.3 for HC peat and 5.8 for HC lignite) and therefore higher than most of the hydrochars produced [5], thus reducing the risk of soil acidification that could limit the availability of most nutrients (macro- and micronutrients) [83] essential for plants.
The contribution of hydrochar to plant mineral nutrition depends both on their aptitude for mineralisation and on their capability to indirectly improve the availability and recycling of nutrients by increasing the efficiency of use of traditional fertilisers [84]. The first point can be evaluated considering some chemical parameters such as TOC/TN and the ratio between total ammonia nitrogen (TAN) and total nitrogen (TN). The value of TOC/TN, close to 20 for both hydrochars, highlighted a substantially balanced ratio of the two elements, excluding the risk of determining a N deficiency in the soil in which it is applied. The TOC/TN of our hydrochars showed a moderate aptitude for mineralisation and consequently a tendency towards greater stability of organic compounds capable of reducing carbon and nitrogen losses from the system [85]. Even the low value of TAN/TN (<5% wt/wt for both hydrochars) confirmed the limited degree of mineralisation of the two hydrochars. The indirect effects are instead driven by the stability of hydrochar which allows for the long-lasting action of increasing net nitrification rates and NH3 adsorption, improving mineralisation and immobilisation of N [86]. In addition, hydrochar-adsorbed N can be remobilised and slowly released, possibly favouring a gradual uptake of N by the crop. At the same time, the soil/media enrichment by organic carbon favours the activity and abundance of the rhizosphere microorganisms, thereby further promoting plant growth and development [87]. Based on the content of the ashes as well as the TOC value, both the hydrochars fall in the quality class 2 (CI 2 in Table 7).
Beside C and N levels, both the hydrochars are extremely interesting sources of other essential nutrients for plants (Table 7), including macro- (Ca, Mg, P, K) and micronutrients (Fe). Trying to compare the quality of the two products, it is worth mentioning that the HC lignite retains higher level of nutrients compared to HC peat and accounts for lower level of Na and Cl, which could have a deleterious effect for plant metabolism once used as amendments. HC lignite also has a higher TOC content (57.6%), which is close to a that of CI 1 product (>60%, Table 6). Therefore, HC lignite appears as the most promising to be proposed as a soil amendment. On the other hand, the higher Cation Exchange Capacity of HC peat (78.9%) compared to that of HC lignite (29.9%), which is likely the reason for the higher concentration of Na and Cl, at the same time enables the higher availability of other positive ions (e.g., dissolved phosphate and sulphates, exchangeable K).
In addition to the chemical and nutritional parameters discussed above, the potential long-term implications of hydrochar application on soil systems should also be considered. Hydrochar application may influence longer-term soil carbon dynamics and physicochemical properties. Due to its relatively high proportion of stable carbon fractions, hydrochar can contribute to the stabilisation of soil organic carbon pools and enhanced carbon retention, although its persistence and reactivity depend strongly on feedstock characteristics and hydrothermal processing conditions [75,88]. Furthermore, hydrochar amendments may modify soil pH and promote the immobilisation of potentially toxic metals through sorption and complexation mechanisms, thereby affecting nutrient dynamics, contaminant bioavailability, and microbial activity in soil systems [75,88,89,90].
In addition to the analyses imposed by Italian and EU regulation, hydrochar might contain some other (non-contemplated) potentially phytotoxic compounds, which are typically water soluble and associated with the dissolved organic carbon fraction, possibly posing a risk to seed germination and plant development [26,91]. Below, we detail the results related to the germination test and the growth test on L. sativum seedlings, as a tool to evaluate the acute (germination test; 48 h) and chronic (growth test; 21 days) effect of some other phytotoxic compounds, not included in the Italian and EU regulation, which could affect the plant’s performance.
In the present experiment, it was not possible to evaluate HC peat for the germination test due to its high water retention that did not allow us to obtain a water extract. The use of the HC lignite did not disclose any significant phytotoxicity effect on the Germination Index nor in the Growth Index after 21 days (Figure 11a,b), thus suggesting that this HTC product did not accumulate other potentially phytotoxic compounds that could affect the plant performance at either the acute or chronic level. Although Germination Index data on HC peat were unavailable, the Growth Index indicated a possible phytotoxic effect following chronic seedling exposure (Figure 11b).
Figure 11.
(a) Gemination Index of Lepidium sativum in control (CTRL) and after treatment with a water extract of lignite-like hydrochar (HC lignite) (ns, non-significative difference). (b) Growth Index of Lepidium sativum in control (CTRL) and after treatment with lignite-like (HC lignite) and peat-like (HC peat) hydrochars (significant differences among treatments are indicated with different letters).
In conclusion, our findings highlight that HTC from M. aquaticum leading to the production of lignite-like HC is the most suitable process for obtaining a hydrochar that can be safely used as a soil amendment as it contains a low level of contaminants, as well as the best physicochemical properties for plant growth.
4. Conclusions
This study systematically investigated the HTC of Myriophyllum aquaticum using a DoE–RSM framework to assess the influence of temperature, residence time, and solid load on hydrochar properties and process performance.
The results demonstrated that increasing process severity (higher temperature and longer residence time) enhanced carbonization, as evidenced by decreasing H/C and O/C ratios and increasing HHV and energy densification. However, these improvements were accompanied by a reduction in hydrochar yield, which consequently affected overall energy recovery. In contrast, moderate severity combined with higher SL promoted greater solid yield while maintaining competitive HHV, resulting in more favourable overall process performance. These findings underline the importance of jointly optimising severity and solid load.
The produced hydrochars exhibited physicochemical characteristics comparable to peat- or lignite-like materials. In particular, the lignite-like hydrochar complied with relevant regulatory thresholds and showed promising performance in germination and growth tests, supporting its potential application as a soil amendment.
From a process-engineering perspective, scaling up HTC systems requires careful consideration of thermal energy demand, heat recovery, and reactor design. The literature studies indicate that heat integration strategies (e.g., internal heat recovery from hot effluents) and optimisation of solid load are critical to improving net energy performance and reducing the specific thermal demand per unit of treated biomass. In addition, process-water management and potential recirculation strategies may significantly influence both overall energy efficiency and environmental footprint. These aspects should be considered when transitioning from laboratory-scale systems to pilot or industrial implementation.
A full techno-economic and life-cycle assessment was beyond the scope of this study. Future research should therefore integrate detailed energy balance calculations, techno-economic analysis, and pilot-scale validation to quantify process feasibility under realistic operating conditions. Furthermore, long-term field evaluation of M. aquaticum-derived hydrochar will be essential to confirm agronomic performance and environmental safety.
By combining statistically supported process optimisation with application-oriented evaluation, this study contributes to the development of scalable and sustainable strategies for transforming invasive aquatic biomass from an environmental liability into a valuable carbon-based resource within circular bioeconomy frameworks.
Supplementary Materials
The following supporting information can be downloaded at https://www.mdpi.com/article/10.3390/en19041108/s1; Figure S1: Sampling points of Myriophyllum aquaticum (Lake Massaciuccoli catchment area, Italy); Figure S2: Product mass balance (a) and carbon balance (b) for all HTC runs of Myriophyllum aquaticum (dry feed basis); Table S1: ANOVA results and modelling statistics for hydrochar yield; Table S2: ANOVA results and modelling statistics for hydrochar volatile matter content; Table S3: ANOVA results and modelling statistics for hydrochar fixed carbon content; Table S4: ANOVA results and modelling statistics for hydrochar ash content; Table S5: ANOVA results and modelling statistics for hydrochar carbon content; Table S6: ANOVA results and modelling statistics for hydrochar H/C atomic ratio; Table S7: ANOVA results and modelling statistics for hydrochar O/C atomic ratio; Table S8: ANOVA results and modelling statistics for hydrochar higher heating value; Table S9: ANOVA results and modelling statistics for energy densification; Table S10: ANOVA results and modelling statistics for energy yield; Table S11: ANOVA results and modelling statistics for carbon yield; Figure S3: Response surface plots for hydrochar volatile matter content (a) and fixed carbon content (b) as a function of process variables; Figure S4: Response surface plots for hydrochar ash content as a function of process variables: (a) temperature and time; (b) temperature and solid load; (c) time and solid load.
Author Contributions
Conceptualization, F.B., M.L., N.S. and M.P.; methodology, F.B., M.L., N.S., S.V. and M.P.; software, F.B. and M.L.; validation, F.B., S.V. and M.P.; formal analysis, F.B.; investigation, F.B., M.L. and N.S.; resources, M.L., N.S. and M.P.; data curation, M.P.; writing—original draft preparation, F.B., M.L. and N.S.; writing—review and editing, F.B., M.L., N.S., S.V. and M.P.; visualisation, F.B.; supervision, F.B. and M.P.; project administration, M.P.; funding acquisition, M.P. All authors have read and agreed to the published version of the manuscript.
Funding
The study has been funded under the National Recovery and Resilience Plan (NRRP), Mission 4 Component 2 Investment 1.3—Call for tender No. 1561 of 11.10.2022 of Ministero dell’Università e della Ricerca (MUR); funded by the European Union—NextGenerationEU; Project code PE0000021, Concession Decree No. 1561 of 11.10.2022 adopted by Ministero dell’Università e della Ricerca (MUR), CUP I53C22001450006, Project title “Network 4 Energy Sustainable Transition—NEST”.
Data Availability Statement
The original contributions presented in this study are included in the article/Supplementary Material. Further inquiries can be directed to the corresponding author.
Conflicts of Interest
The authors declare no conflicts of interest.
Abbreviations
The following abbreviations are used in this manuscript:
| ANOVA | Analysis of variance |
| DoE | Design of Experiments |
| DTG | Derivative thermogravimetric |
| ED | Energy densification |
| EU | European Union |
| EY | Energy yield |
| FC | Fixed carbon |
| GC | Gas chromatography |
| HHV | Higher heating value |
| HTC | Hydrothermal carbonization |
| MS | Mass spectrometry |
| PAHs | Polycyclic aromatic hydrocarbons |
| PCBs | Polychlorobiphenyls |
| PCDD/Fs | Polychlorinated dibenzo-p-dioxins and dibenzofurans |
| RSM | Response Surface Methodology |
| SL | Solid load |
| t | Time |
| T | Temperature |
| TAN | Total ammonia nitrogen |
| TG | Thermogravimetric |
| TOC | Total organic carbon |
| TN | Total nitrogen |
| VM | Volatile matter |
| Y | Hydrochar yield |
References
- Wang, T.; Zhai, Y.; Zhu, Y.; Li, C.; Zeng, G. A Review of the Hydrothermal Carbonization of Biomass Waste for Hydrochar Formation: Process Conditions, Fundamentals, and Physicochemical Properties. Renew. Sustain. Energy Rev. 2018, 90, 223–247. [Google Scholar] [CrossRef] [Scilit]
- Sharma, H.B.; Sarmah, A.K.; Dubey, B. Hydrothermal Carbonization of Renewable Waste Biomass for Solid Biofuel Production: A Discussion on Process Mechanism, the Influence of Process Parameters, Environmental Performance and Fuel Properties of Hydrochar. Renew. Sustain. Energy Rev. 2020, 123, 109761. [Google Scholar] [CrossRef] [Scilit]
- Singh, A.; Bin Abu Sofian, A.D.A.; Chan, Y.J.; Chakrabarty, A.; Selvarajoo, A.; Abakr, Y.A.; Show, P.L. Hydrothermal Carbonization: Sustainable Pathways for Waste-to-Energy Conversion and Biocoal Production. GCB Bioenergy 2024, 16, 13150. [Google Scholar] [CrossRef] [Scilit]
- Basso, D.; Patuzzi, F.; Castello, D.; Baratieri, M.; Rada, E.C.; Weiss-Hortala, E.; Fiori, L. Agro-Industrial Waste to Solid Biofuel through Hydrothermal Carbonization. Waste Manag. 2016, 47, 114–121. [Google Scholar] [CrossRef] [Scilit]
- Islam, M.A.; Sharif, M.; Limon, H.; Romić, M.; Islam, A. Hydrochar-Based Soil Amendments for Agriculture: A Review of Recent Progress. Arab. J. Geosci. 2021, 14, 102. [Google Scholar] [CrossRef] [Scilit]
- Khosravi, A.; Zheng, H.; Liu, Q.; Hashemi, M.; Tang, Y.; Xing, B. Production and Characterization of Hydrochars and Their Application in Soil Improvement and Environmental Remediation. Chem. Eng. J. 2022, 430, 133142. [Google Scholar] [CrossRef] [Scilit]
- Mahmood Al-Nuaimy, M.N.; Azizi, N.; Nural, Y.; Yabalak, E. Recent Advances in Environmental and Agricultural Applications of Hydrochars: A Review. Environ. Res. 2024, 250, 117923. [Google Scholar] [CrossRef] [Scilit]
- Nicolae, S.A.; Au, H.; Modugno, P.; Luo, H.; Szego, A.E.; Qiao, M.; Li, L.; Yin, W.; Heeres, H.J.; Berge, N.; et al. Recent Advances in Hydrothermal Carbonisation: From Tailored Carbon Materials and Biochemicals to Applications and Bioenergy. Green Chem. 2020, 22, 4747–4800. [Google Scholar] [CrossRef] [Scilit]
- Jalilian, M.; Bissessur, R.; Ahmed, M.; Hsiao, A.; He, Q.S.; Hu, Y. A Review: Hydrochar as Potential Adsorbents for Wastewater Treatment and CO2 Adsorption. Sci. Total Environ. 2024, 914, 169823. [Google Scholar] [CrossRef] [Scilit]
- Cardarelli, A.; Barbanera, M. Substitution of Fossil Coal with Hydrochar from Agricultural Waste in the Electric Arc Furnace Steel Industry: A Comprehensive Life Cycle Analysis. Energies 2023, 16, 5686. [Google Scholar] [CrossRef] [Scilit]
- Lu, Y.-C.; Brabie, L.; Karasev, A.V.; Wang, C. Applications of Hydrochar and Charcoal in the Iron and Steelmaking Industry—Part 2: Carburization of Liquid Iron by Addition of Iron–Carbon Briquettes. Sustainability 2022, 14, 5383. [Google Scholar] [CrossRef] [Scilit]
- Deb, A.T.; MacDermid-Watts, K.; Brown, R.C.; Bai, Y.; McClelland, J.F.; Smith, R.W. Challenges and Opportunities of Agricultural Biomass as a Replacement for Pulverized Coal Injection in the Ironmaking Blast Furnace: A Review. J. Sustain. Metall. 2023, 9, 230–252. [Google Scholar] [CrossRef] [Scilit]
- Álvarez, X.; Cancela, Á.; Freitas, V.; Valero, E.; Sánchez, Á.; Acuña-Alonso, C. Hydrothermal Carbonization and Pellet Production from Egeria Densa and Lemna Minor. Plants 2020, 9, 425. [Google Scholar] [CrossRef] [Scilit] [PubMed]
- Muñoz Escobar, M.; Voyevoda, M.; Fühner, C.; Zehnsdorf, A. Potential Uses of Elodea Nuttallii-Harvested Biomass. Energy Sustain. Soc. 2011, 1, 4. [Google Scholar] [CrossRef] [Scilit]
- Poerschmann, J.; Weiner, B.; Wedwitschka, H.; Zehnsdorf, A.; Koehler, R.; Kopinke, F.D. Characterization of Biochars and Dissolved Organic Matter Phases Obtained upon Hydrothermal Carbonization of Elodea Nuttallii. Bioresour. Technol. 2015, 189, 145–153. [Google Scholar] [CrossRef] [Scilit]
- Rather, M.A.; Khan, N.S.; Gupta, R. Catalytic Hydrothermal Carbonization of Invasive Macrophyte Hornwort (Ceratophyllum Demersum) for Production of Hydrochar: A Potential Biofuel. Int. J. Environ. Sci. Technol. 2017, 14, 1243–1252. [Google Scholar] [CrossRef] [Scilit]
- Phuthongkhao, P.; Khunphonoi, R.; Khemthong, P.; Suwannaruang, T.; Wantala, K. Bio-Coal Synthesis via Hydrothermal Carbonization of Giant Salvinia for a High-Quality Solid Biofuel. Bioenergy Res. 2024, 17, 2328–2344. [Google Scholar] [CrossRef] [Scilit]
- Abdeldayem, O.M.; Al Noman, M.A.; Dupont, C.; Ferras, D.; Grand Ndiaye, L.; Kennedy, M. Hydrothermal Carbonization of Typha Australis: Influence of Stirring Rate. Environ. Res. 2023, 236, 116777. [Google Scholar] [CrossRef] [Scilit]
- Poomsawat, S.; Poomsawat, W. Analysis of Hydrochar Fuel Characterization and Combustion Behavior Derived from Aquatic Biomass via Hydrothermal Carbonization Process. Case Stud. Therm. Eng. 2021, 27, 101255. [Google Scholar] [CrossRef] [Scilit]
- Gao, Y.; Wang, X.; Wang, J.; Li, X.; Cheng, J.; Yang, H.; Chen, H. Effect of Residence Time on Chemical and Structural Properties of Hydrochar Obtained by Hydrothermal Carbonization of Water Hyacinth. Energy 2013, 58, 376–383. [Google Scholar] [CrossRef] [Scilit]
- Román, S.; Ledesma, B.; Álvarez, A.; Coronella, C.; Qaramaleki, S.V. Suitability of Hydrothermal Carbonization to Convert Water Hyacinth to Added-Value Products. Renew. Energy 2020, 146, 1649–1658. [Google Scholar] [CrossRef] [Scilit]
- Yang, L.; Shuang, E.; Liu, J.; Sheng, K.; Zhang, X. Endogenous Calcium Enriched Hydrochar Catalyst Derived from Water Hyacinth for Glucose Isomerization. Sci. Total Environ. 2022, 807, 150660. [Google Scholar] [CrossRef] [Scilit] [PubMed]
- Zhang, C.; Ma, X.; Huang, T.; Zhou, Y.; Tian, Y. Co-Hydrothermal Carbonization of Water Hyacinth and Polyvinyl Chloride: Optimization of Process Parameters and Characterization of Hydrochar. Bioresour. Technol. 2020, 314, 123676. [Google Scholar] [CrossRef] [Scilit] [PubMed]
- Zhang, C.; Ma, X.; Chen, X.; Tian, Y.; Zhou, Y.; Lu, X.; Huang, T. Conversion of Water Hyacinth to Value-Added Fuel via Hydrothermal Carbonization. Energy 2020, 197, 123676. [Google Scholar] [CrossRef] [Scilit]
- Cui, X.; Lu, M.; Khan, M.B.; Lai, C.; Yang, X.; He, Z.; Chen, G.; Yan, B. Hydrothermal Carbonization of Different Wetland Biomass Wastes: Phosphorus Reclamation and Hydrochar Production. Waste Manag. 2020, 102, 106–113. [Google Scholar] [CrossRef] [Scilit]
- Lang, Q.; Guo, X.; Zou, G.; Wang, C.; Li, Y.; Xu, J.; Zhao, X.; Li, J.; Liu, B.; Sun, Q. Hydrochar Reduces Oxytetracycline in Soil and Chinese Cabbage by Altering Soil Properties, Shifting Microbial Community Structure and Promoting Microbial Metabolism. Chemosphere 2023, 338, 139578. [Google Scholar] [CrossRef] [Scilit]
- Lang, Q.; Guo, X.; Wang, C.; Li, L.; Li, Y.; Xu, J.; Zhao, X.; Li, J.; Liu, B.; Sun, Q.; et al. Characteristics and Phytotoxicity of Hydrochar-Derived Dissolved Organic Matter: Effects of Feedstock Type and Hydrothermal Temperature. J. Environ. Sci. 2025, 149, 139–148. [Google Scholar] [CrossRef] [Scilit]
- Sultana, A.; Novera, T.M.; Islam, A.; Limon, S.H.; Islam, M.A. Multi-Response Optimization for the Production of Albizia Saman Bark Hydrochar through Hydrothermal Carbonization: Characterization and Pyrolysis Kinetic Study. Biomass Conv. Bioref. 2022, 12, 5783–5797. [Google Scholar] [CrossRef] [Scilit]
- Parra-Marfíl, A.; Ocampo-Pérez, R.; Collins-Martínez, V.H.; Flores-Vélez, L.M.; Gonzalez-Garcia, R.; Medellín-Castillo, N.A.; Labrada-Delgado, G.J. Synthesis and Characterization of Hydrochar from Industrial Capsicum Annuum Seeds and Its Application for the Adsorptive Removal of Methylene Blue from Water. Environ. Res. 2020, 184, 109334. [Google Scholar] [CrossRef] [Scilit]
- Cheng, C.; Guo, Q.; Ding, L.; Raheem, A.; He, Q.; Shiung Lam, S.; Yu, G. Upgradation of Coconut Waste Shell to Value-Added Hydrochar via Hydrothermal Carbonization: Parametric Optimization Using Response Surface Methodology. Appl. Energy 2022, 327, 120136. [Google Scholar] [CrossRef] [Scilit]
- Raheem, A.; Ding, L.; He, Q.; Hussain Mangi, F.; Hussain Khand, Z.; Sajid, M.; Ryzhkov, A.; Yu, G. Effective Pretreatment of Corn Straw Biomass Using Hydrothermal Carbonization for Co-Gasification with Coal: Response Surface Methodology–Box Behnken Design. Fuel 2022, 324, 124544. [Google Scholar] [CrossRef] [Scilit]
- Akbari, A.; Peighambardoust, S.J.; Lotfi, M. Hydrochar Derived from Liquorice Root Pulp Utilizing Catalytic/Non-Catalytic Hydrothermal Carbonization: RSM Optimization and Cationic Dye Adsorption Assessment. J. Water Process Eng. 2023, 55, 104099. [Google Scholar] [CrossRef] [Scilit]
- Álvarez-Murillo, A.; Román, S.; Ledesma, B.; Sabio, E. Study of Variables in Energy Densification of Olive Stone by Hydrothermal Carbonization. J. Anal. Appl. Pyrolysis 2015, 113, 307–314. [Google Scholar] [CrossRef] [Scilit]
- Murillo, H.A.; Pagés-Díaz, J.; Díaz-Robles, L.A.; Vallejo, F.; Huiliñir, C. Valorization of Oat Husk by Hydrothermal Carbonization: Optimization of Process Parameters and Anaerobic Digestion of Spent Liquors. Bioresour. Technol. 2022, 343, 126112. [Google Scholar] [CrossRef] [Scilit]
- Nizamuddin, S.; Mubarak, N.M.; Tiripathi, M.; Jayakumar, N.S.; Sahu, J.N.; Ganesan, P. Chemical, Dielectric and Structural Characterization of Optimized Hydrochar Produced from Hydrothermal Carbonization of Palm Shell. Fuel 2016, 163, 88–97. [Google Scholar] [CrossRef] [Scilit]
- Ronix, A.; Pezoti, O.; Souza, L.S.; Souza, I.P.A.F.; Bedin, K.C.; Souza, P.S.C.; Silva, T.L.; Melo, S.A.R.; Cazetta, A.L.; Almeida, V.C. Hydrothermal Carbonization of Coffee Husk: Optimization of Experimental Parameters and Adsorption of Methylene Blue Dye. J. Environ. Chem. Eng. 2017, 5, 4841–4849. [Google Scholar] [CrossRef] [Scilit]
- Afolabi, O.O.D.; Sohail, M.; Cheng, Y.L. Optimisation and Characterisation of Hydrochar Production from Spent Coffee Grounds by Hydrothermal Carbonisation. Renew. Energy 2020, 147, 1380–1391. [Google Scholar] [CrossRef] [Scilit]
- Venkatesan, S.; Baloch, H.A.; Jamro, I.A.; Rafique, N. Evaluation of the Production of Hydrochar from Spent Coffee Grounds under Different Operating Conditions. J. Water Process Eng. 2022, 49, 103037. [Google Scholar] [CrossRef] [Scilit]
- Sangare, D.; Missaoui, A.; Bostyn, S.; Belandria, V.; Moscosa-Santillan, M.; Gokalp, I. Modeling Of Agave Salmiana Bagasse Conversion By Hydrothermal Carbonization (Htc) For Solid Fuel Combustion Using Surface Response Methodology. AIMS Energy 2020, 8, 538–562. [Google Scholar] [CrossRef] [Scilit]
- Sabio, E.; Álvarez-Murillo, A.; Román, S.; Ledesma, B. Conversion of Tomato-Peel Waste into Solid Fuel by Hydrothermal Carbonization: Influence of the Processing Variables. Waste Manag. 2016, 47, 122–132. [Google Scholar] [CrossRef] [Scilit]
- Islam, M.A.; Paul, J.; Akter, J.; Islam, M.A.; Limon, S.H. Conversion of Chicken Feather Waste via Hydrothermal Carbonization: Process Optimization and the Effect of Hydrochar on Seed Germination of Acacia Auriculiformis. J. Mater. Cycles Waste Manag. 2021, 23, 1177–1188. [Google Scholar] [CrossRef] [Scilit]
- Ye, S.; Hao, S.; Yan, C.; Zhang, X.; Di, Y.; Zhou, X.; Zhang, H.; Jiang, Z.; Zhang, X. Optimization of Microalgal Hydrothermal Carbonization Parameters Using the Response Surface Method for Biochar Applications in Blast Furnaces to Reduce Carbon Emissions. Fuel 2025, 381, 133671. [Google Scholar] [CrossRef] [Scilit]
- Akbari, H.; Akbari, H.; Fanaei, F.; Adibzadeh, A. Optimization of Parameters Affecting the Hydrothermal Carbonization of Wastewater Treatment Plant Sewage Sludge. Biomass Convers. Biorefinery 2022, 14, 27335–27346. [Google Scholar] [CrossRef] [Scilit]
- Blach, T.; Engelhart, M. Optimizing the Hydrothermal Carbonization of Sewage Sludge—Response Surface Methodology and the Effect of Volatile Solids. Water 2021, 13, 1225. [Google Scholar] [CrossRef] [Scilit]
- Guo, S.; Xu, D.D.; Guo, X.; Li, X.; Zhao, C. Multi-Response Optimization of Sewage Sludge-Derived Hydrochar Production and Its CO2-Assisted Gasification Performance. J. Environ. Chem. Eng. 2022, 10, 107036. [Google Scholar] [CrossRef] [Scilit]
- Malhotra, M.; Garg, A. Hydrothermal Carbonization of Sewage Sludge: Optimization of Operating Conditions Using Design of Experiment Approach and Evaluation of Resource Recovery Potential. J. Environ. Chem. Eng. 2023, 11, 109507. [Google Scholar] [CrossRef] [Scilit]
- Assis, E.I.N.C.; Gidudu, B.; Chirwa, E.M.N. Hydrothermal Carbonisation of Paper Sludge: Effect of Process Conditions on Hydrochar Fuel Characteristics and Energy Recycling Efficiency. J. Clean. Prod. 2022, 373, 133775. [Google Scholar] [CrossRef] [Scilit]
- Cui, Z.; Shah, A. Energy and Element Fate of Hydrochar from Hydrothermal Carbonization of Dairy Manure Digestate. Bioenergy Res. 2022, 17, 1167–1178. [Google Scholar] [CrossRef] [Scilit]
- Borbolla-Gaxiola, J.E.; Ross, A.B.; Dupont, V. Multi-Variate and Multi-Response Analysis of Hydrothermal Carbonization of Food Waste: Hydrochar Composition and Solid Fuel Characteristics. Energies 2022, 15, 5342. [Google Scholar] [CrossRef] [Scilit]
- Fallah, S.; Alavi, N.; Tavakoli, O.; Shahsavani, A.; Sadani, M. Optimization of Hydrothermal Carbonization of Food Waste as Sustainable Energy Conversion Approach: Enhancing the Properties of Hydrochar by Landfill Leachate Substitution as Reaction Medium and Acetic Acid Catalyst Addition. Energy Convers. Manag. 2023, 297, 117647. [Google Scholar] [CrossRef] [Scilit]
- Periyavaram, S.R.; Bella, K.; Uppala, L.; Reddy, P.H.P. Hydrothermal Carbonization of Food Waste: Process Parameters Optimization and Biomethane Potential Evaluation of Process Water. J. Environ. Manag. 2023, 347, 119132. [Google Scholar] [CrossRef] [Scilit]
- Kassim, F.O.; Sohail, M.; Taylor, B.; Afolabi, O.O.D. Hydrothermal Carbonisation of Mixed Agri-Food Waste: Process Optimisation and Mechanistic Evaluation of Hydrochar Inorganic Chemistry. Biomass Bioenergy 2024, 180, 107027. [Google Scholar] [CrossRef] [Scilit]
- Abdoli, M.A.; Ghasemzadeh, R. Evaluation and Optimization of Hydrothermal Carbonization Condition for Hydrochar and Methane Yield from Anaerobic Digestion of Organic Fraction of Municipal Solid Waste (OFMSW). Fuel 2024, 355, 129531. [Google Scholar] [CrossRef] [Scilit]
- Roman, F.F.; Diaz De Tuesta, J.L.; Praça, P.; Silva, A.M.T.; Faria, J.L.; Gomes, H.T. Hydrochars from Compost Derived from Municipal Solid Waste: Production Process Optimization and Catalytic Applications. J. Environ. Chem. Eng. 2021, 9, 104888. [Google Scholar] [CrossRef] [Scilit]
- EN ISO 22167:2021; Solid Recovered Fuels—Determination of Content of Volatile Matter. International Organization for Standardization: Geneva, Switzerland, 2021.
- EN ISO 21656:2021; Solid Recovered Fuels—Determination of Ash Content. International Organization for Standardization: Geneva, Switzerland, 2021.
- EN ISO 16948:2015; Solid Biofuels—Determination of Total Content of Carbon, Hydrogen and Nitrogen. International Organization for Standardization: Geneva, Switzerland, 2015.
- EN ISO 18125:2017; Solid Biofuels—Determination of Calorific Value. International Organization for Standardization: Geneva, Switzerland, 2017.
- EN 15936:2012; Sludge, Treated Biowaste, Soil and Waste—Determination of Total Organic Carbon (TOC) by Dry Combustion. European Committee for Standardization: Brussels, Belgium, 2012.
- Harada, Y.; Inoko, A. The Measurement of the Cation-Exchange Capacity of Composts for the Estimation of the Degree of Maturity. Soil Sci. Plant Nutr. 1980, 26, 127–134. [Google Scholar] [CrossRef] [Scilit]
- EPA Method 3051A (SW-846); Microwave Assisted Acid Digestion of Sediments, Sludges, Soils, and Oils. U.S. Environmental Protection Agency: Washington, DC, USA, 2007.
- EPA Method 6010D (SW-846); Inductively Coupled Plasma-Atomic Emission Spectrometry. U.S. Environmental Protection Agency: Washington, DC, USA, 2014.
- EPA Method 3545A (SW-846); Pressurized Fluid Extraction (PFE). U.S. Environmental Protection Agency: Washington, DC, USA, 2007.
- EPA Method 3620C (SW-846); Florisil Cleanup. U.S. Environmental Protection Agency: Washington, DC, USA, 2014.
- EPA Method 8270E (SW-846); Semivolatile Organic Compounds by Gas Chromatography/Mass Spectrometry (GC-MS). U.S. Environmental Protection Agency: Washington, DC, USA, 2014.
- EPA Method 3550C (SW-846); Ultrasonic Extraction. U.S. Environmental Protection Agency: Washington, DC, USA, 2007.
- EPA Method 8280B (SW-846); Polychlorinated Dibenzo-p-Dioxins (PCDDs) and Polychlorinated Dibenzofurans (PCDFs) by High-Resolution Gas Chromatography/Low-Resolution Mass Spectrometry (HRGC/LRMS). U.S. Environmental Protection Agency: Washington, DC, USA, 2007.
- APAT (Agenzia per la protezione dell’ambiente e per i servizi tecnici). Metodi microbiologici di analisi del compost. In Manuali e Linee Guida 20/2003; APAT: Roma, Italy, 2003; ISBN 88-448-0090-X. [Google Scholar]
- Funke, A.; Ziegler, F. Hydrothermal Carbonization of Biomass: A Summary and Discussion of Chemical Mechanisms for Process Engineering. Biofuels Bioprod. Biorefining 2010, 4, 160–177. [Google Scholar] [CrossRef] [Scilit]
- González-Arias, J.; Sánchez, M.E.; Cara-Jiménez, J.; Baena-Moreno, F.M.; Zhang, Z. Hydrothermal carbonization of biomass and waste: A review. Environ. Chem. Lett. 2022, 20, 211–221. [Google Scholar] [CrossRef] [Scilit]
- Boamah, N.N.; Salaudeen, S.A. Process water from the hydrothermal carbonization of biomass: A review on the characterization, applications, and potential for future work. J. Water Process Eng. 2025, 77, 108531. [Google Scholar] [CrossRef] [Scilit]
- Reza, M.T.; Andert, J.; Wirth, B.; Busch, D.; Pielert, J.; Lynam, J.G.; Mumme, J. Hydrothermal Carbonization of Biomass for Energy and Crop Production. Appl. Bioenergy 2014, 1, 11–29. [Google Scholar] [CrossRef] [Scilit]
- Reza, M.T.; Yang, X.; Coronella, C.J.; Lin, H.; Hathwaik, U.; Shintani, D.; Neupane, B.P.; Miller, G.C. Hydrothermal Carbonization (HTC) and Pelletization of Two Arid Land Plants Bagasse for Energy Densification. ACS Sustain. Chem. Eng. 2016, 4, 1106–1114. [Google Scholar] [CrossRef] [Scilit]
- Volpe, M.; Fiori, L. From Olive Waste to Solid Biofuel through Hydrothermal Carbonisation: The Role of Temperature and Solid Load on Secondary Char Formation and Hydrochar Energy Properties. J. Anal. Appl. Pyrolysis 2017, 124, 63–72. [Google Scholar] [CrossRef] [Scilit]
- Libra, J.A.; Ro, K.S.; Kammann, C.; Funke, A.; Berge, N.D.; Neubauer, Y.; Titirici, M.-M.; Fühner, C.; Bens, O.; Kern, J.; et al. Hydrothermal Carbonization of Biomass Residuals: A Comparative Review of the Chemistry, Processes and Applications of Wet and Dry Pyrolysis. Biofuels 2011, 2, 71–106. [Google Scholar] [CrossRef] [Scilit]
- Lucian, M.; Fiori, L. Hydrothermal Carbonization of Waste Biomass: Process Design, Modeling, Energy Efficiency and Cost Analysis. Energies 2017, 10, 211. [Google Scholar] [CrossRef] [Scilit]
- Stemann, J.; Putschew, A.; Ziegler, F. Hydrothermal Carbonization: Process Water Characterization and Effects of Water Reuse. Bioresour. Technol. 2013, 143, 139–146. [Google Scholar] [CrossRef] [Scilit]
- Istituto Poligrafico e Zecca dello Stato (IPZS). Decreto Legislativo 29 Aprile 2010, n. 75, 2010. Riordino e revisione della disciplina in materia di fertilizzanti, a norma dell’articolo 13 della legge 7 luglio 2009, n. 88. In Supplemento Ordinario n. 106/L alla Gazzetta Ufficiale della Repubblica Italiana; Serie Generale n. 121; Istituto Poligrafico e Zecca dello Stato (IPZS): Roma, Italy, 2010. [Google Scholar]
- Istituto Poligrafico e Zecca dello Stato (IPZS). Decreto 22 giugno 2015. Aggiornamento degli allegati 2, 6 e 7 al decreto legislativo n. 75 del 29 aprile 2010 «Riordino e revisione della disciplina in materia di fertilizzanti, a norma dell’articolo 13 della legge 7 luglio 2009, n. 88». In Gazzetta Ufficiale Della Repubblica Italiana; Serie Generale n. 186; Istituto Poligrafico e Zecca dello Stato (IPZS): Roma, Italy, 2015. [Google Scholar]
- Commission Decision (EU). Regulation (EU) 2019/1009 of the European Parliament and of the Council of 5 June 2019 laying down rules on the making available on the market of EU fertilising products and amending Regulations (EC) No 1069/2009 and (EC) No 1107/2009 and repealing Regulation (EC) No 2003/2003. In Official Journal of the European Union; L 170/1-114; Commission Decision (EU): Brussel, Belgium, 2019. [Google Scholar]
- Commission Decision (EU). Commission Delegated Regulation (EU) 2021/2088 of 7 July 2021 amending Annexes II, III and IV to Regulation (EU) 2019/1009 of the European Parliament and of the Council for the purpose of adding pyrolysis and gasification materials as a component material category in EU fertilising products. In Official Journal of the European Union; L 427/140-148; Commission Decision (EU): Brussel, Belgium, 2021. [Google Scholar]
- Commission Decision (EU). Commission Decision (EU) 2022/1244 of 13 July 2022 establishing the EU Ecolabel criteria for growing media and soil improvers. In Official Journal of the European Union; L 190/141-165; Commission Decision (EU): Brussel, Belgium, 2022. [Google Scholar]
- Rengel, Z.; Cakmak, I.; White, P.J. (Eds.) Marschner’s Mineral Nutrition of Plants, 4th ed.; Academic Press: Cambridge, MA, USA, 2023. [Google Scholar]
- Semida, W.M.; Beheiry, H.R.; Sétamou, M.; Simpson, C.R.; Abd El-Mageed, T.A.; Rady, M.M.; Nelson, S.D. Biochar Implications for Sustainable Agriculture and Environment: A Review. S. Afr. J. Bot. 2019, 127, 333–347. [Google Scholar] [CrossRef] [Scilit]
- Bona, D.; Bertoldi, D.; Borgonovo, G.; Mazzini, S.; Ravasi, S.; Silvestri, S.; Zaccone, C.; Giannetta, B.; Tambone, F. Evaluating the Potential of Hydrochar as a Soil Amendment. Waste Manag. 2023, 159, 75–83. [Google Scholar] [CrossRef] [Scilit]
- Huang, R.; Li, B.; Chen, Y.; Tao, Q.; Xu, Q.; Wen, D.; Gao, X.; Li, Q.; Tang, X.; Wang, C. Biochar Application Increases Labile Carbon and Inorganic Nitrogen Supply in a Continuous Monocropping Soil. Land 2022, 11, 473. [Google Scholar] [CrossRef] [Scilit]
- Kallenbach, C.; Grandy, A.S. Controls over Soil Microbial Biomass Responses to Carbon Amendments in Agricultural Systems: A Meta-Analysis. Agric. Ecosyst. Environ. 2011, 144, 241–252. [Google Scholar] [CrossRef] [Scilit]
- Wang, X.; Zhang, Y.; Liu, J.; Li, C.; Zhao, X. Effects of Hydrothermal Carbonization Conditions on the Characteristics of Hydrochar and Its Application as a Soil Amendment: A Review. Agronomy 2025, 15, 327. [Google Scholar] [CrossRef] [Scilit]
- Bargmann, I.; Rillig, M.C.; Buss, W.; Kruse, A.; Kuecke, M. Hydrochar Amendment Promotes Microbial Immobilization of Nutrients and Affects Soil Fertility. Soil Biol. Biochem. 2013, 57, 59–66. [Google Scholar] [CrossRef] [Scilit]
- Yan, T.; Zhang, Z.; Zhang, Z.; Wang, W.; Li, D.; Zhang, T.; Zhu, Z. Applying Hydrochar Affects Soil Carbon Dynamics by Altering the Characteristics of Soil Aggregates and Microbes. Agronomy 2024, 14, 1015. [Google Scholar] [CrossRef] [Scilit]
- Bargmann, I.; Rillig, M.C.; Buss, W.; Kruse, A.; Kuecke, M. Hydrochar and Biochar Effects on Germination of Spring Barley. J. Agron. Crop Sci. 2013, 199, 360–373. [Google Scholar] [CrossRef] [Scilit]
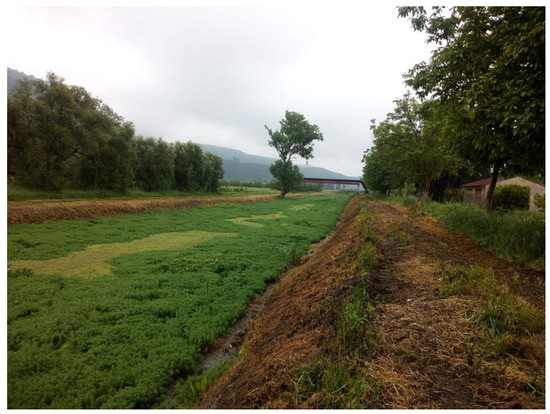
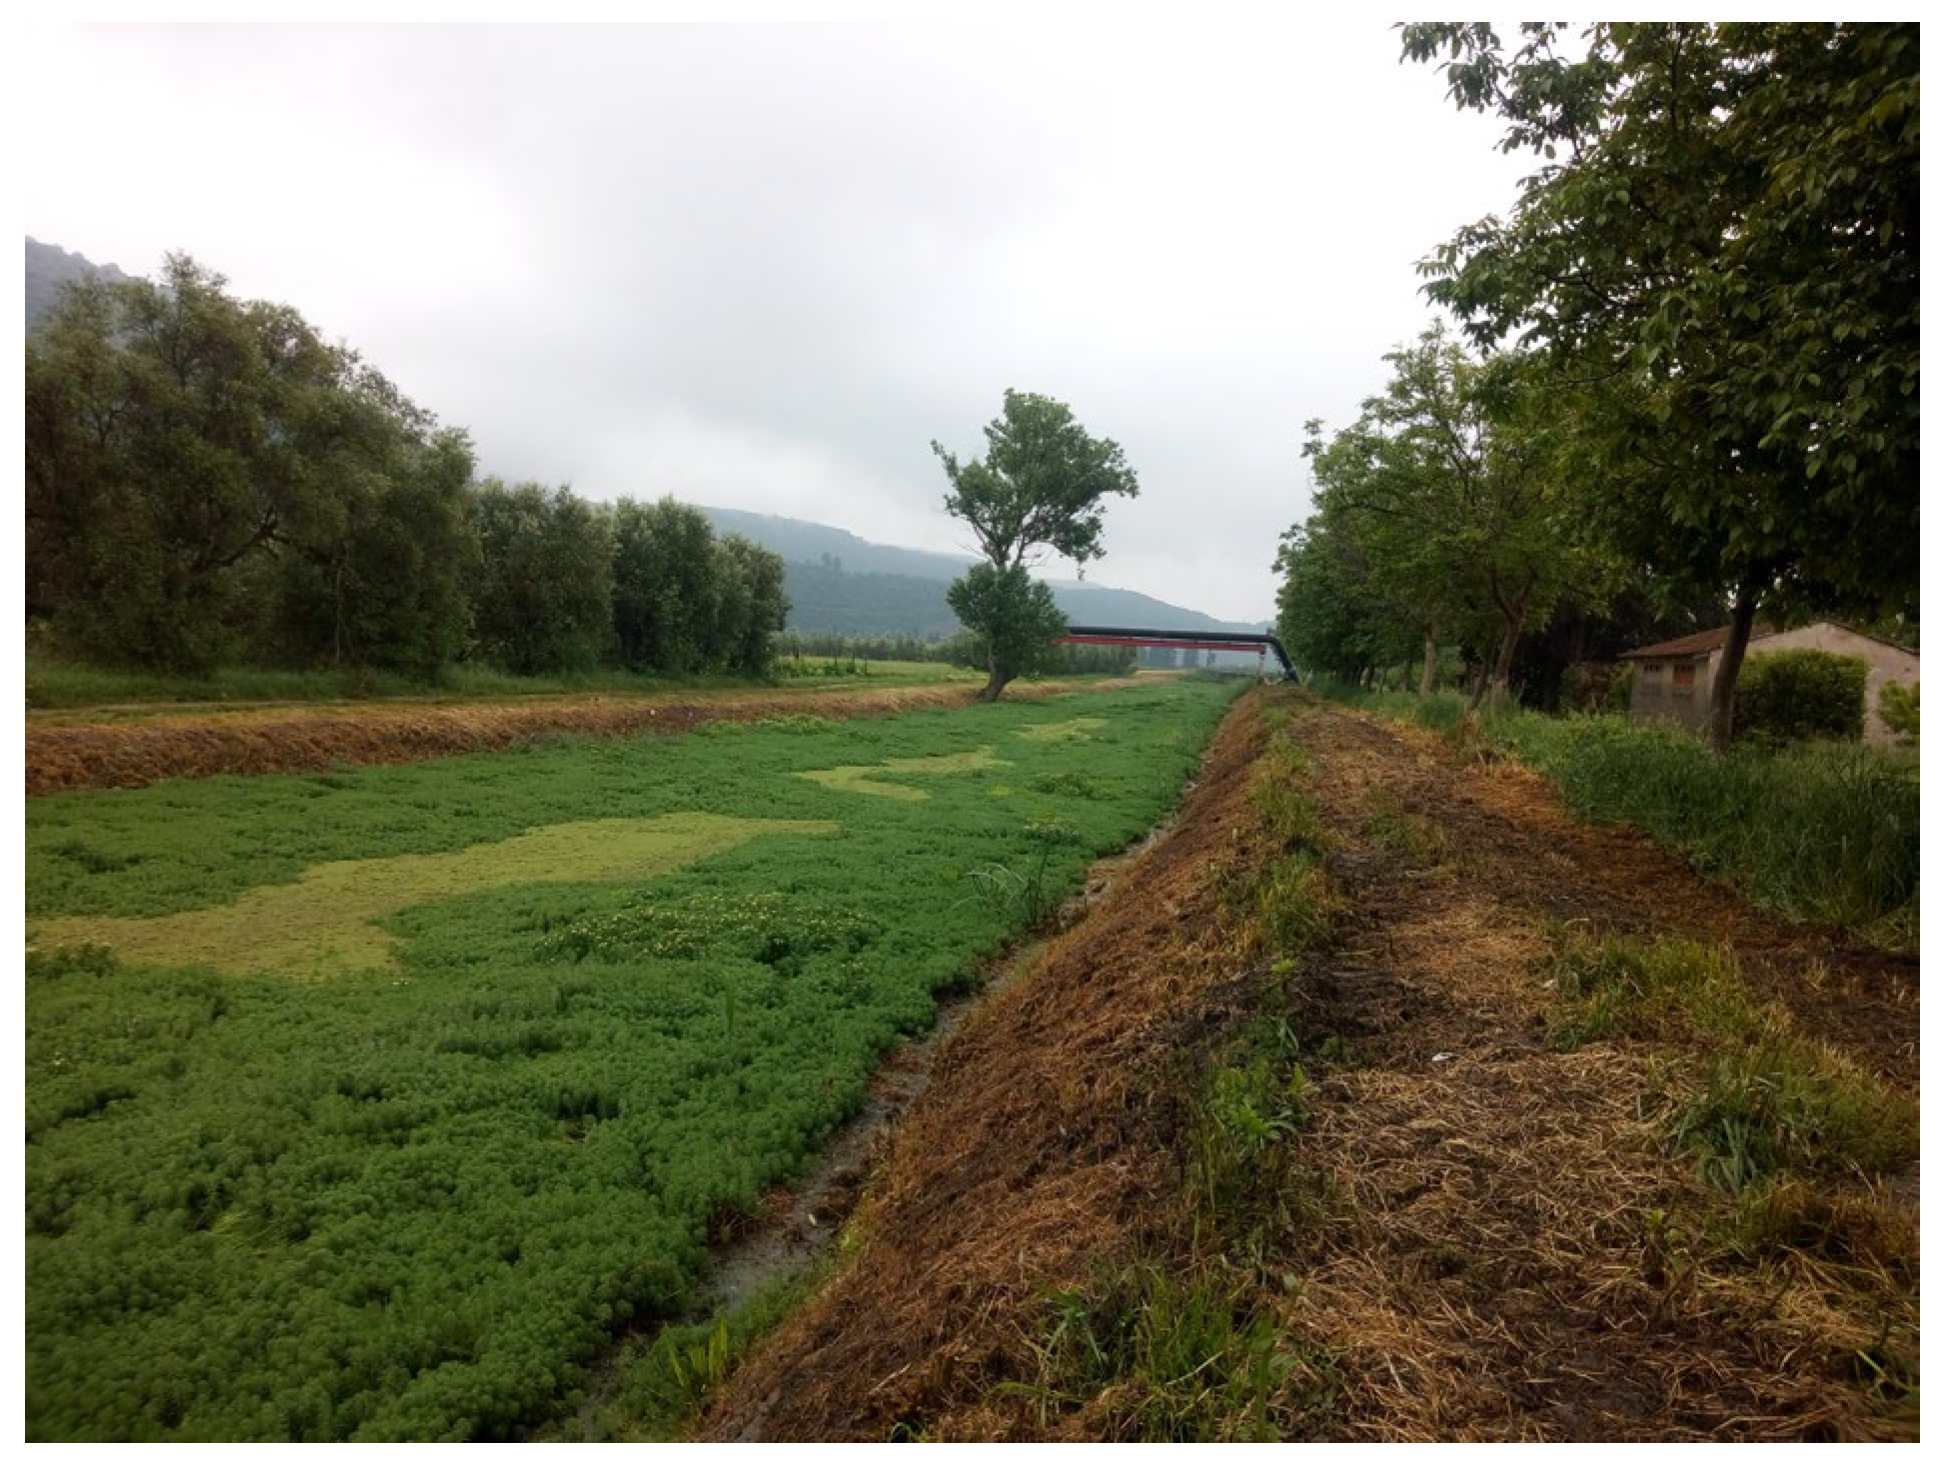
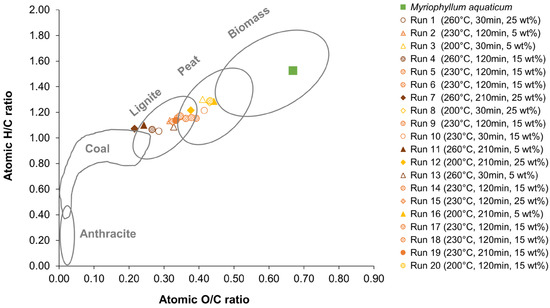
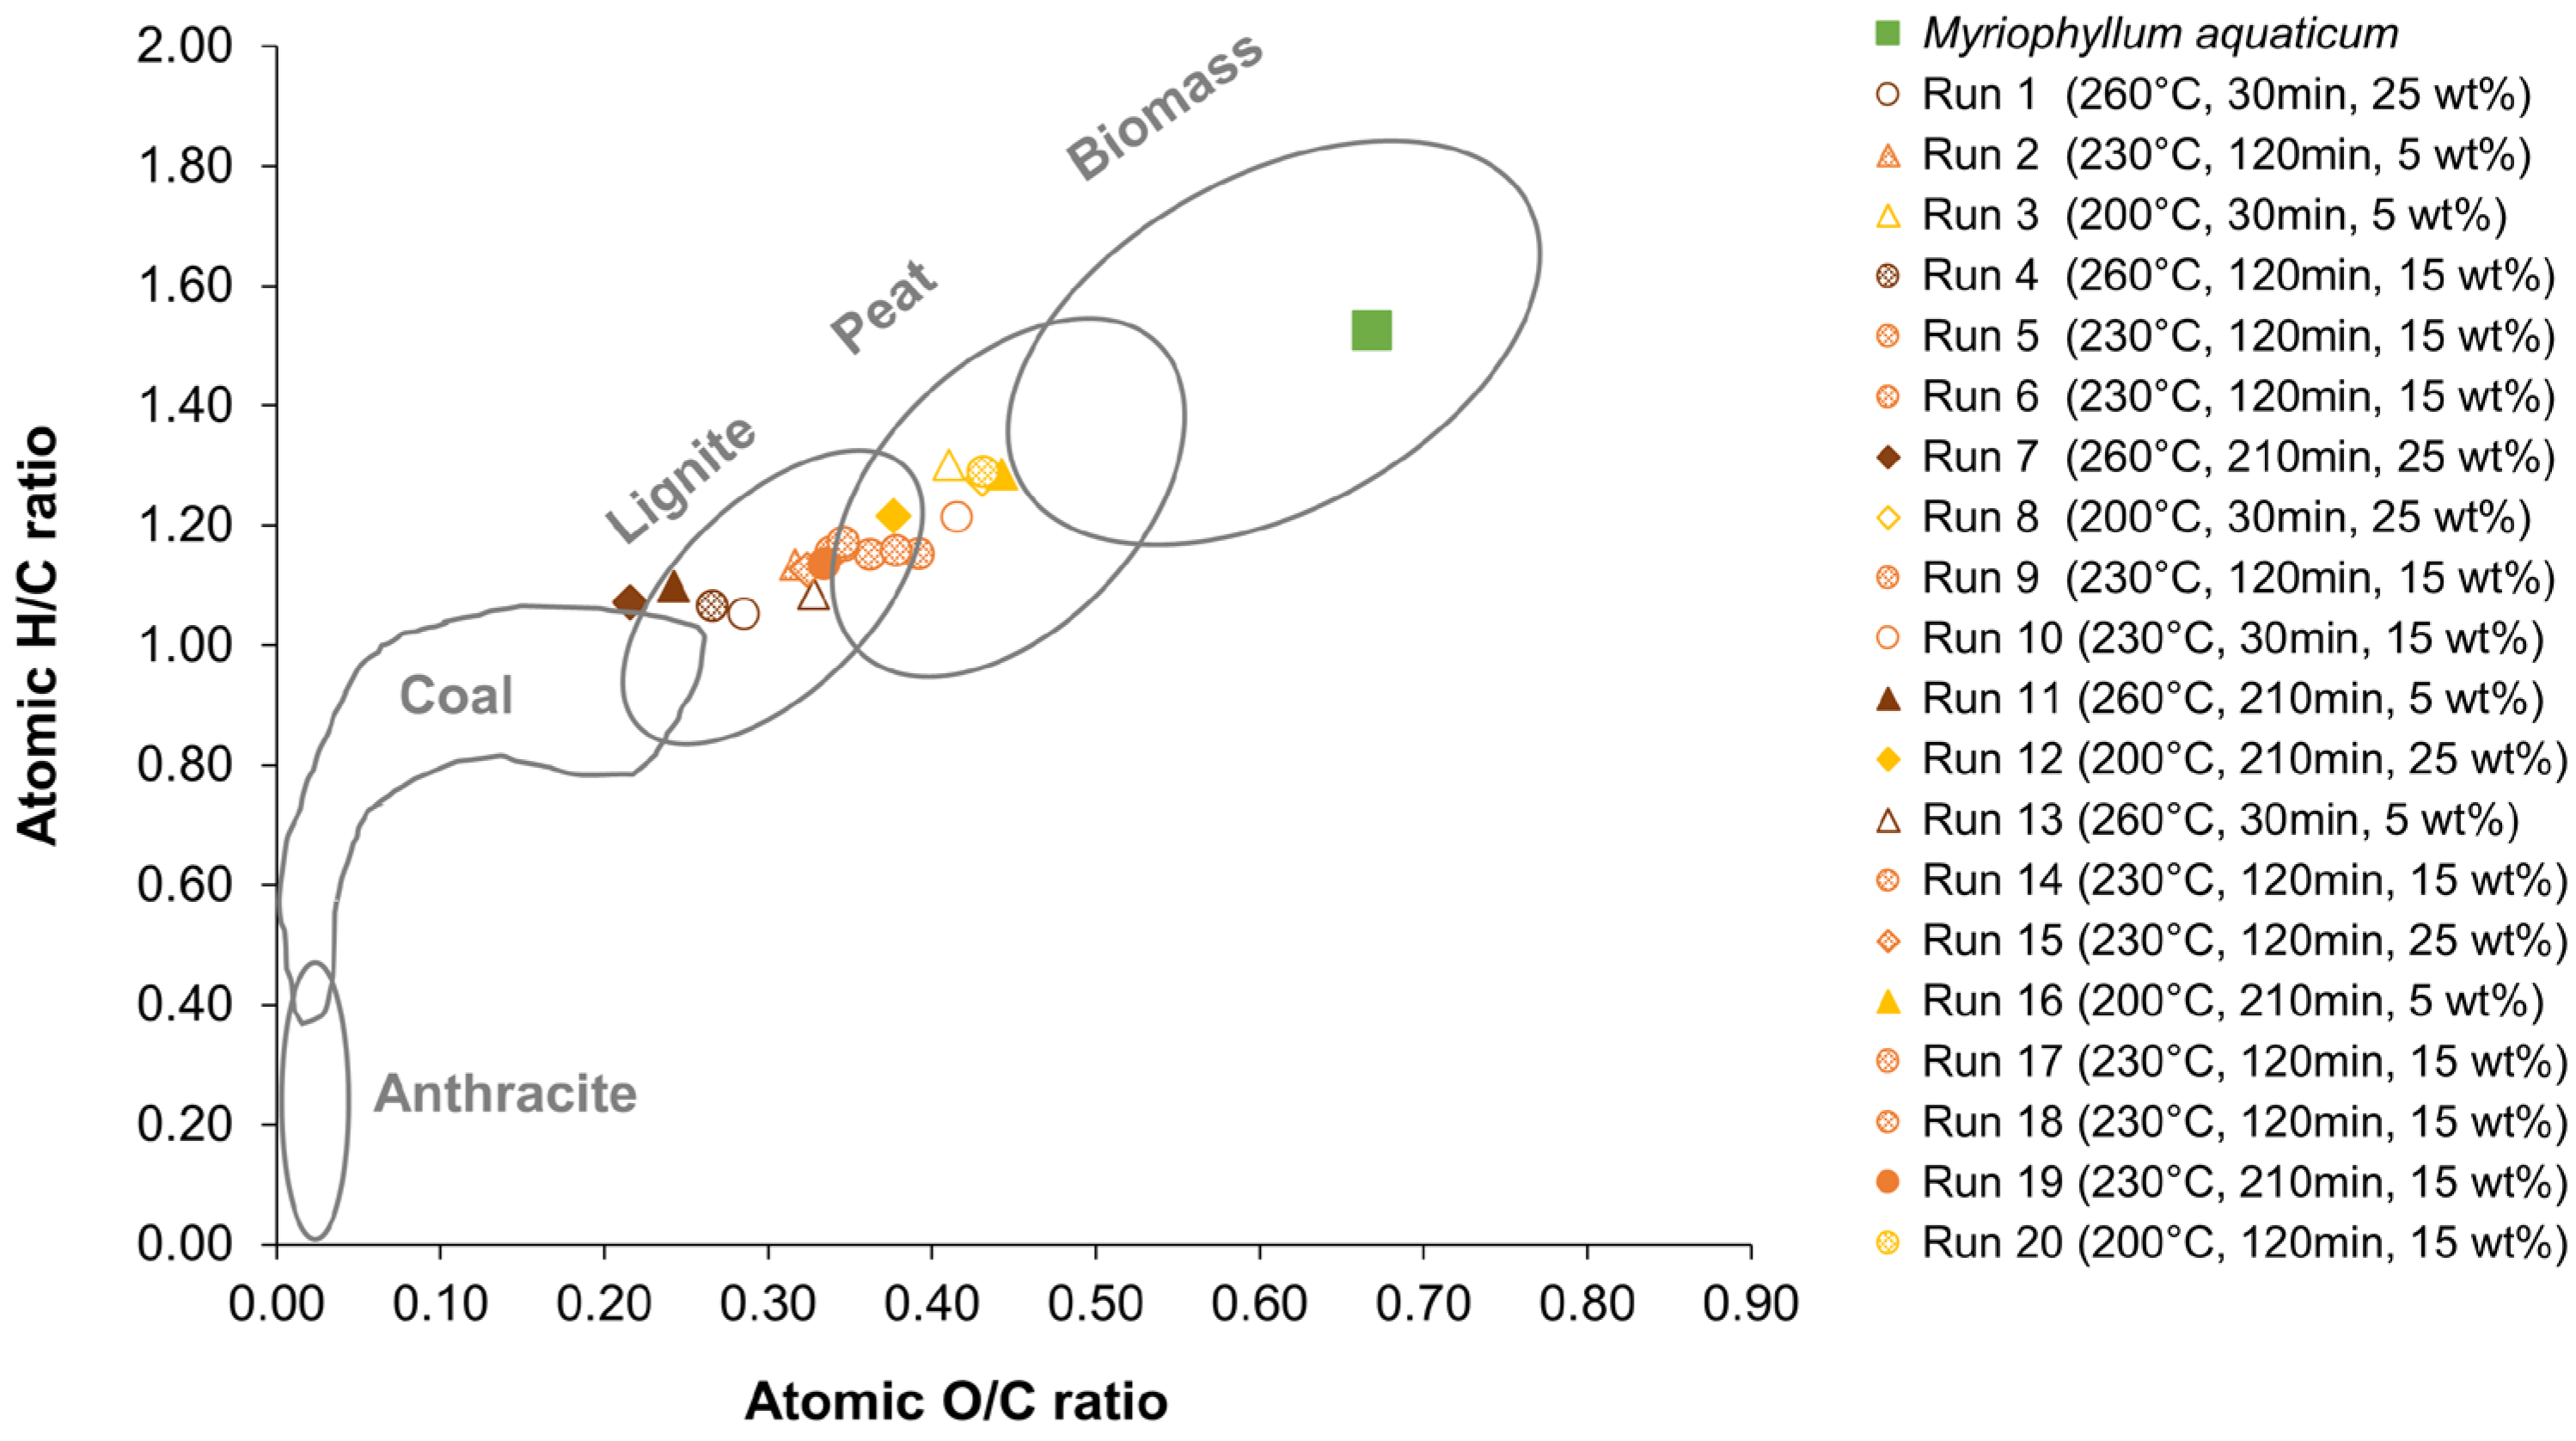
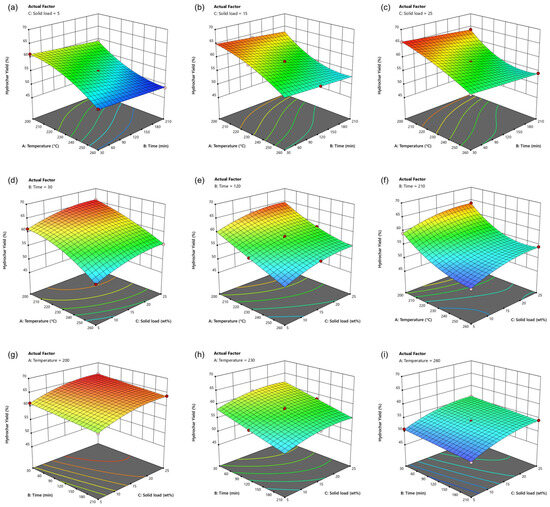
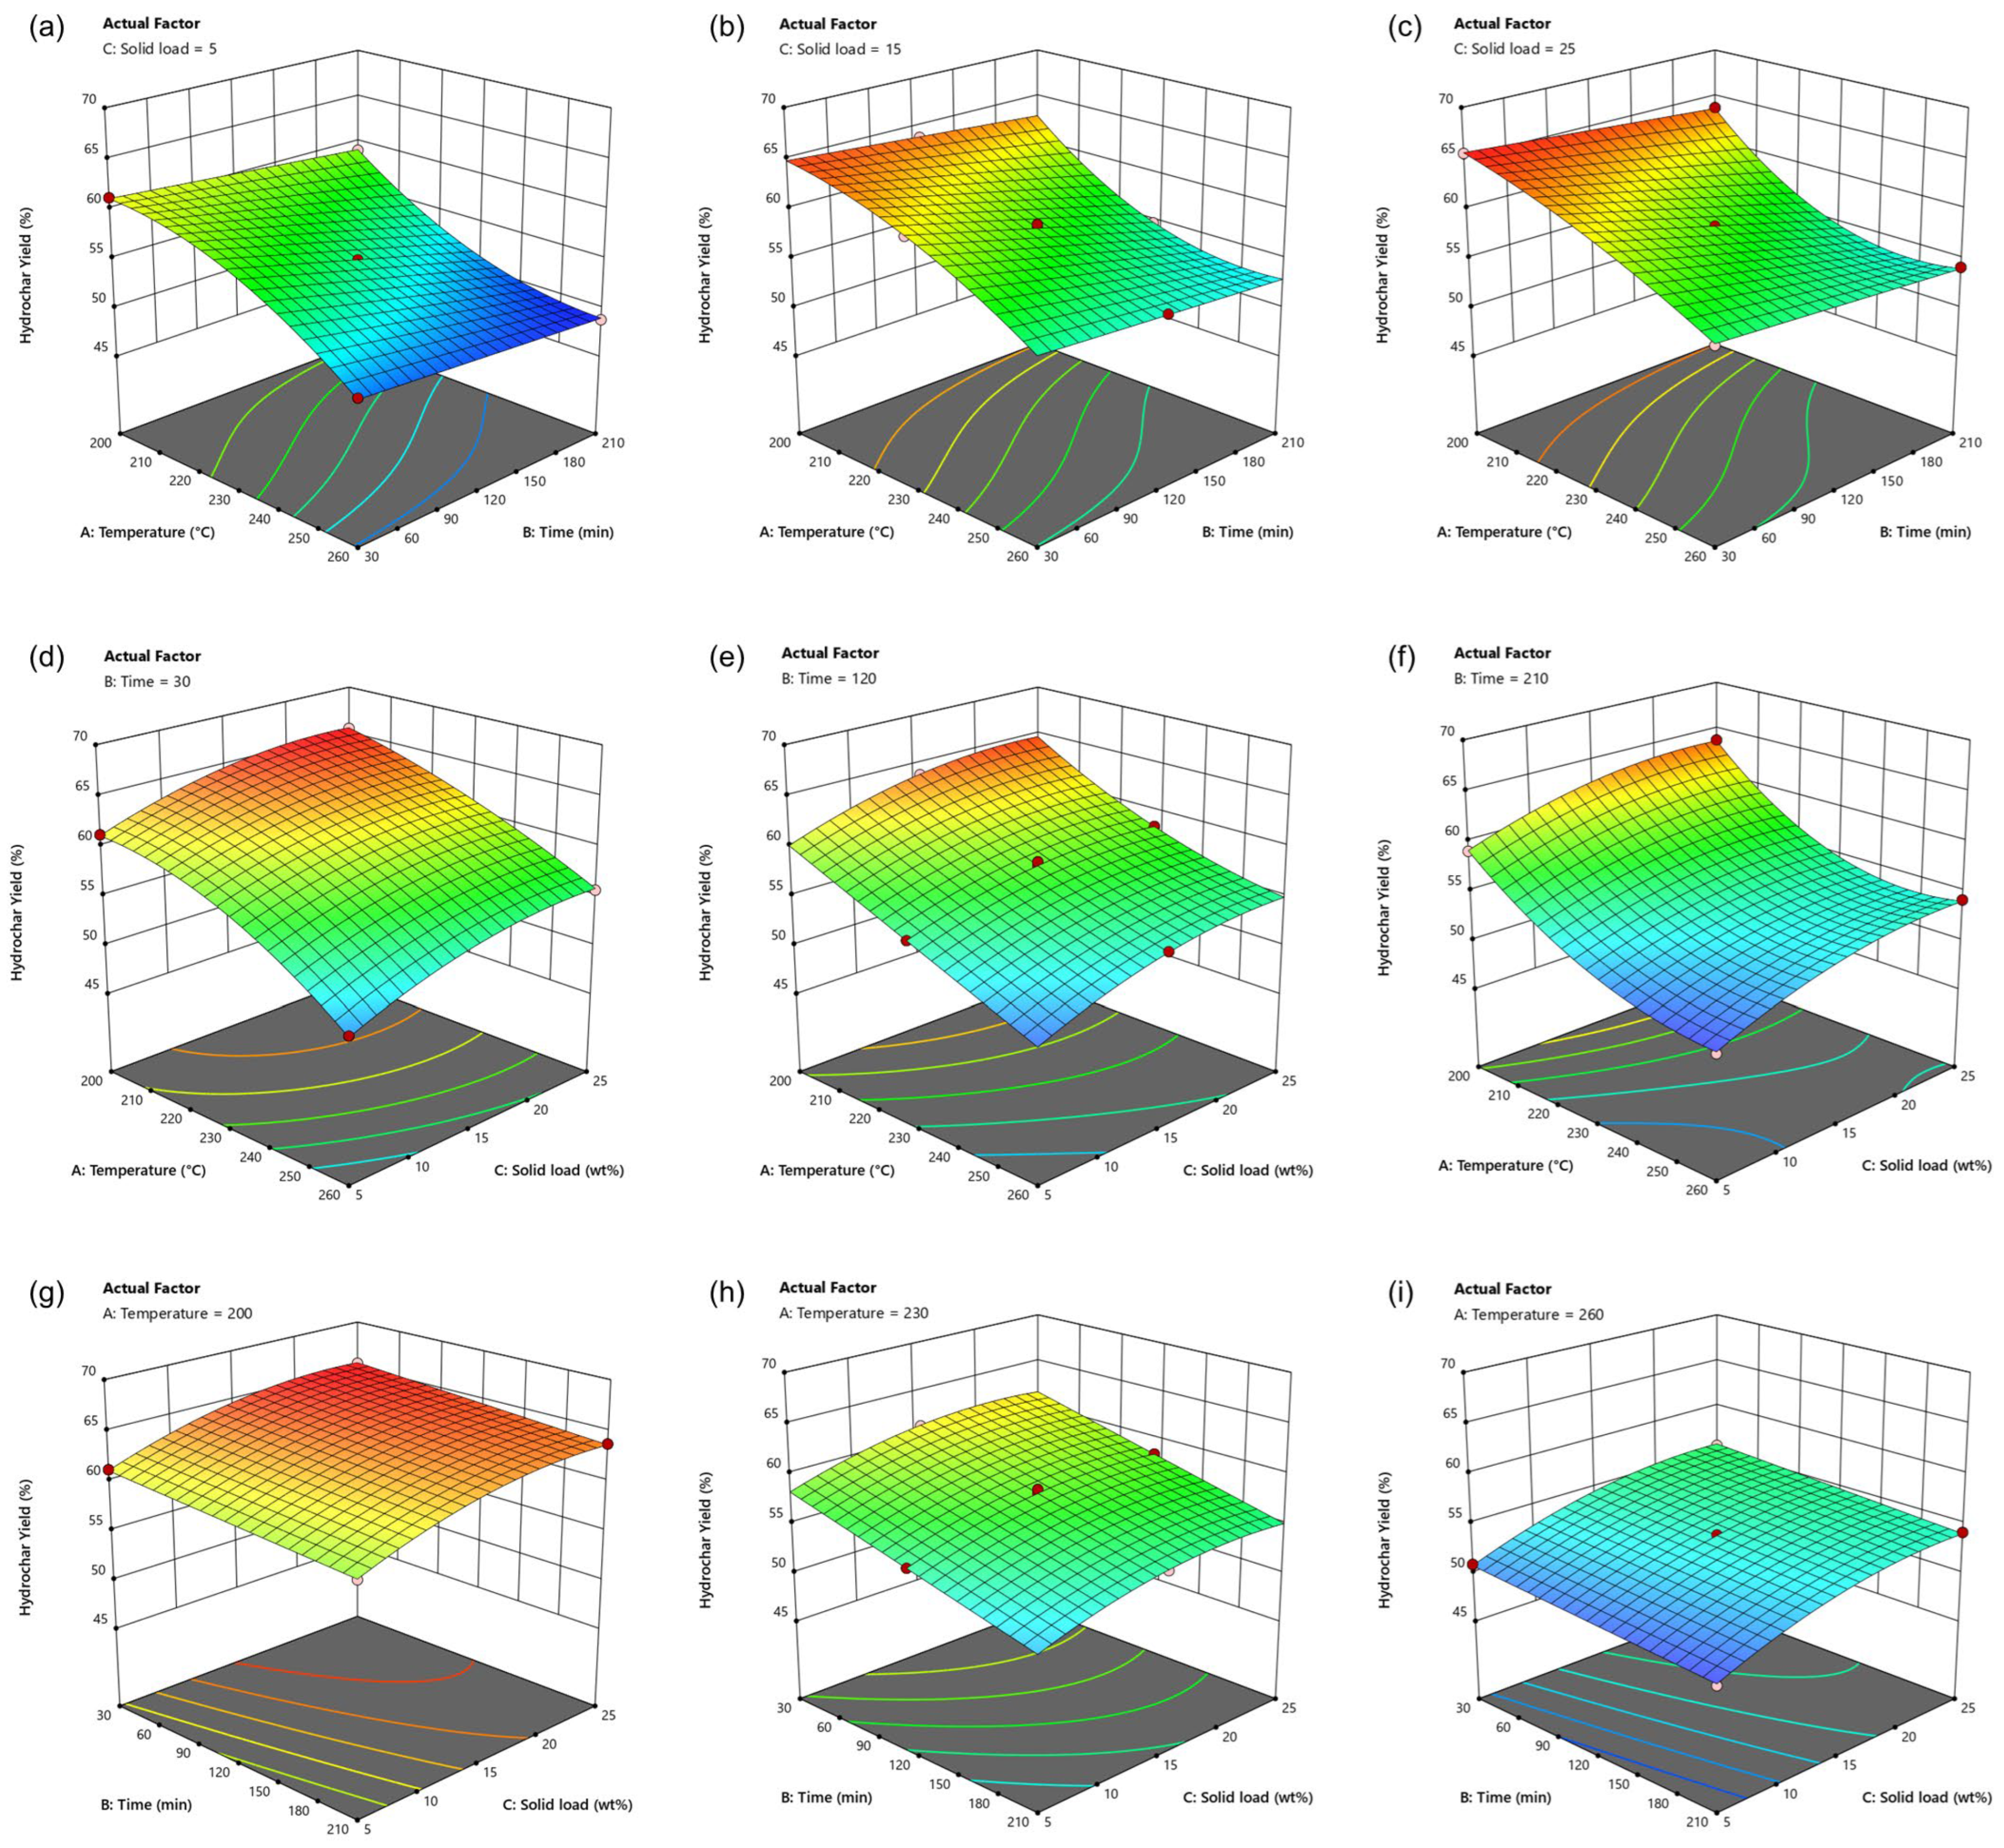
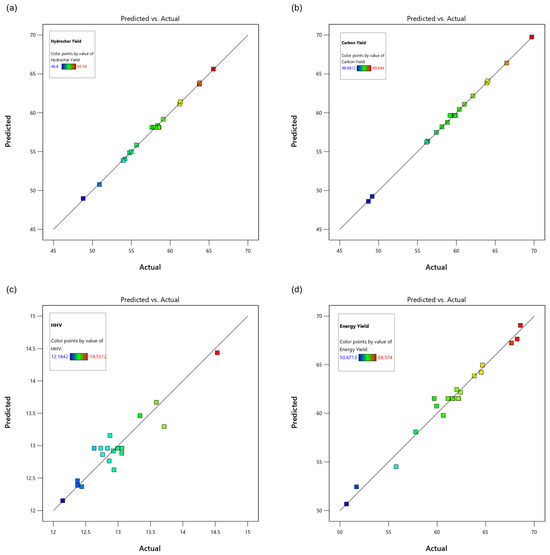
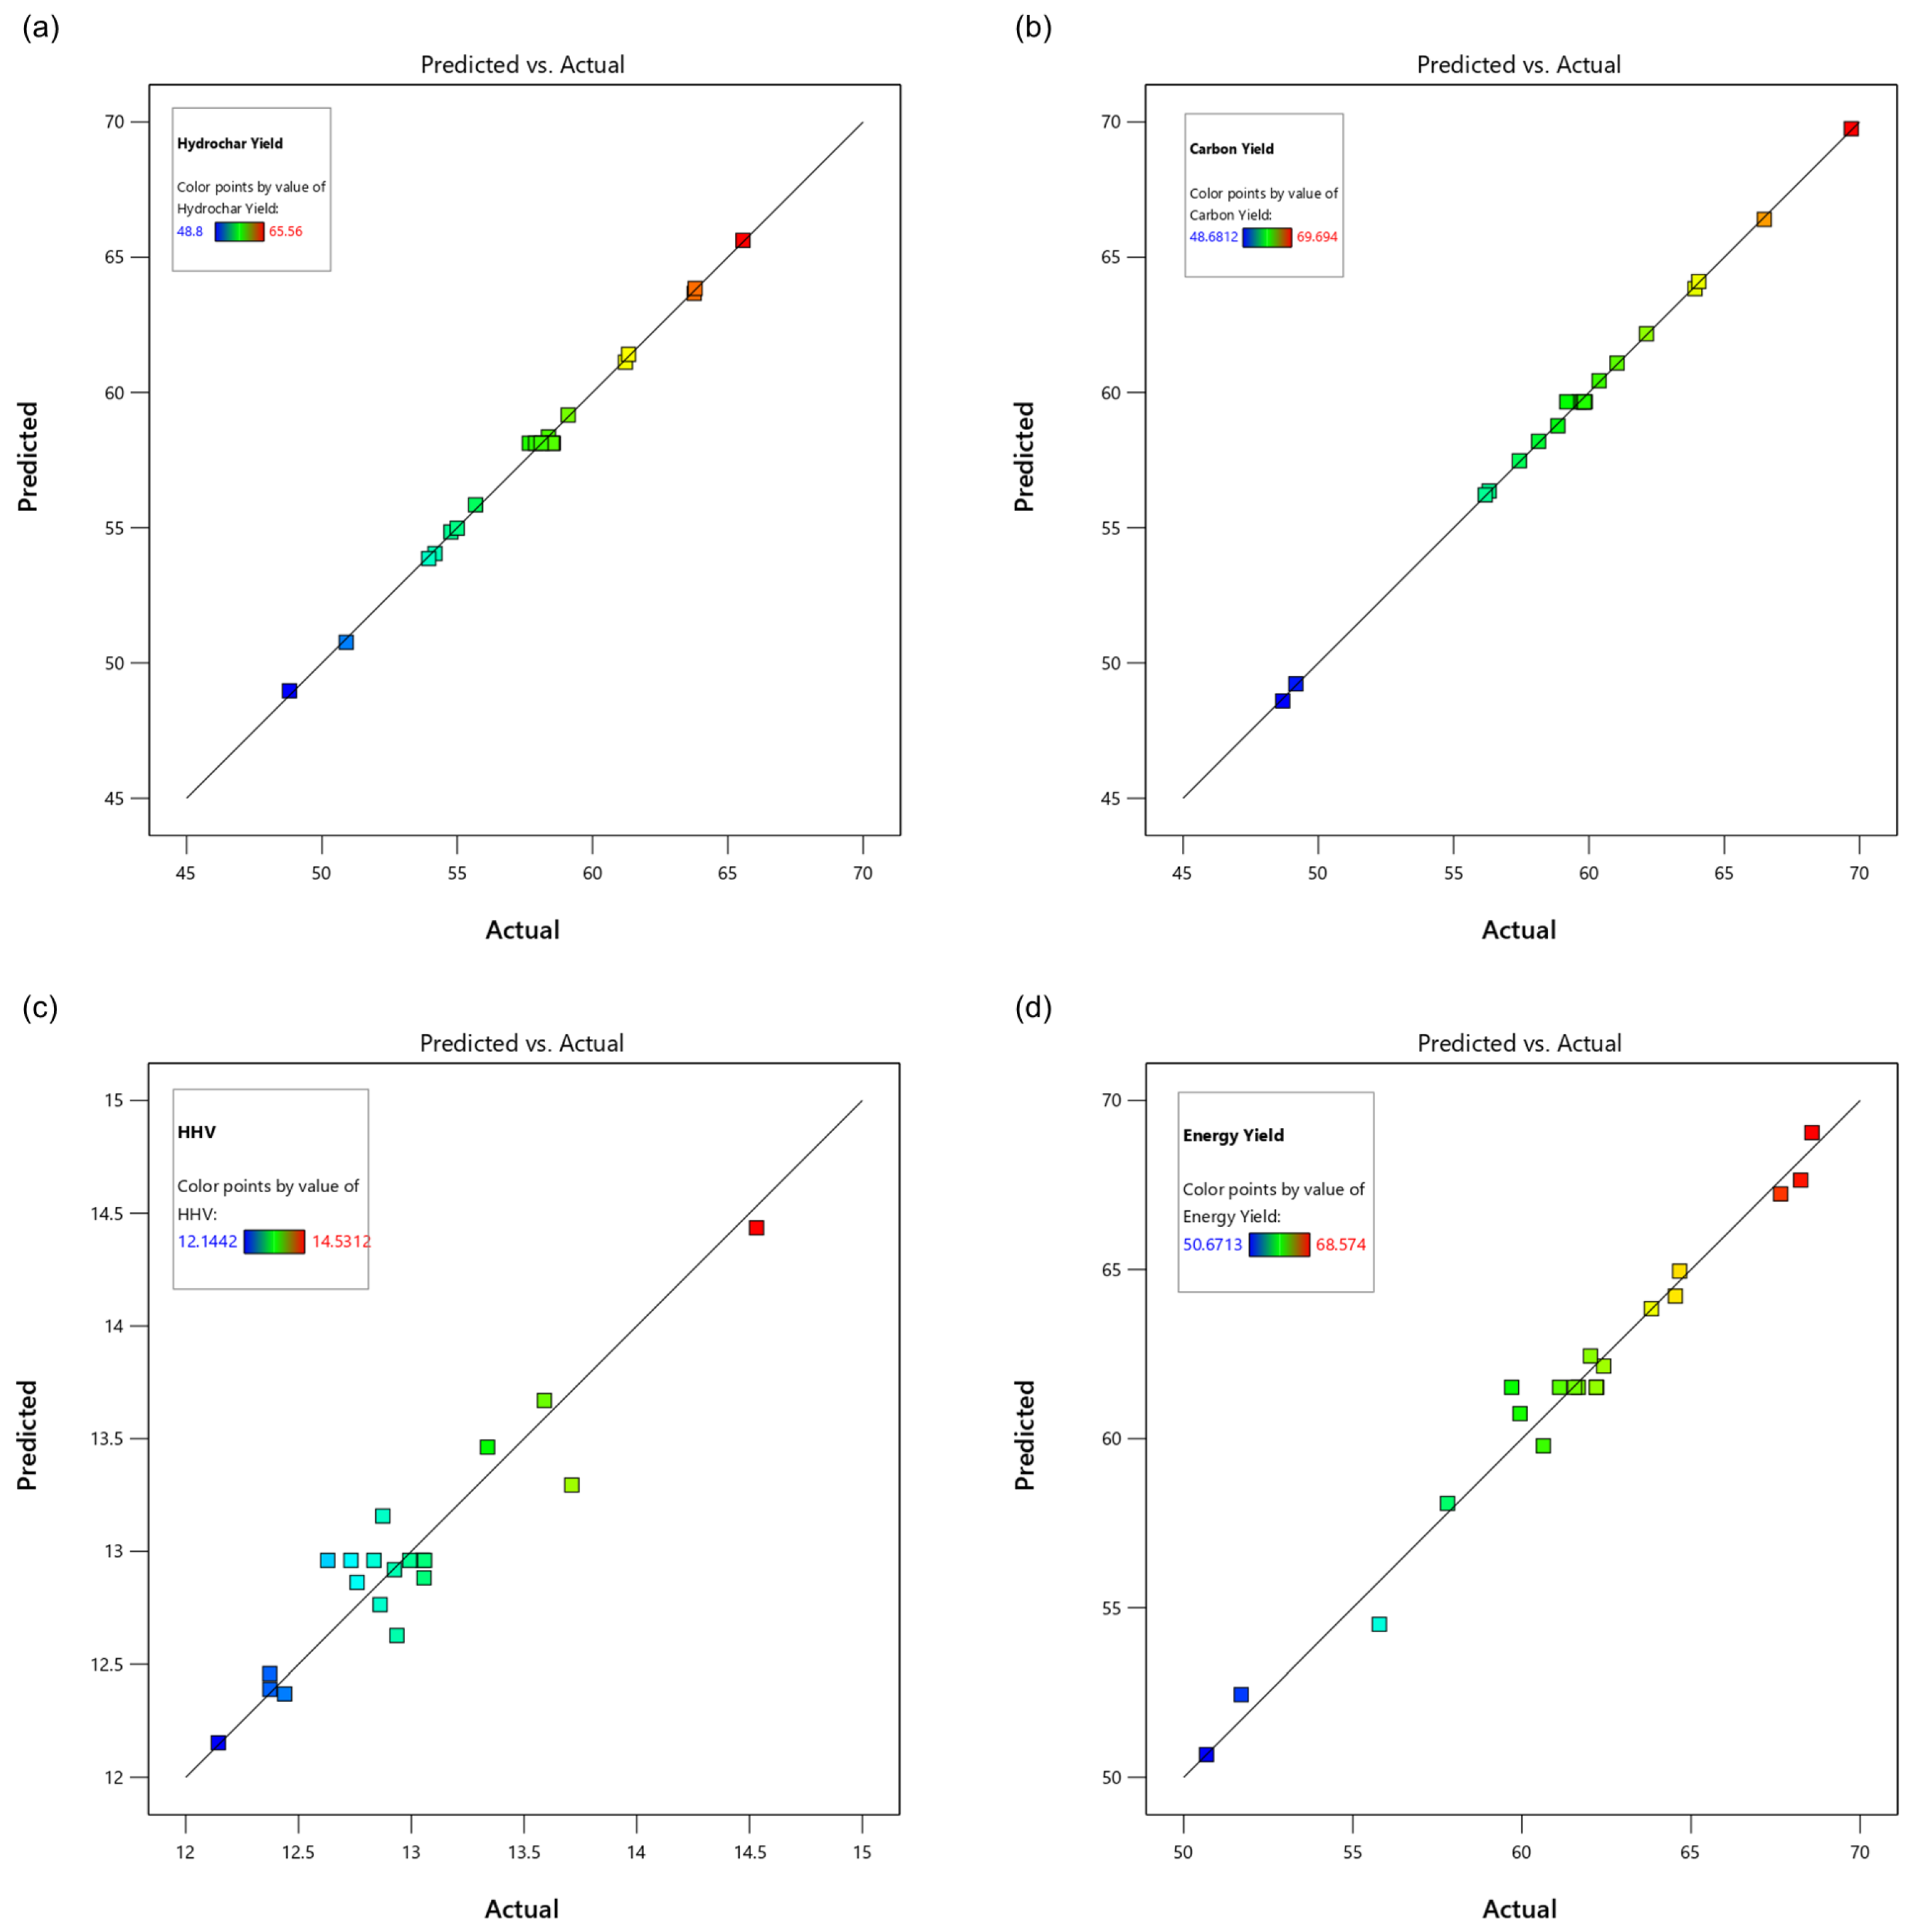
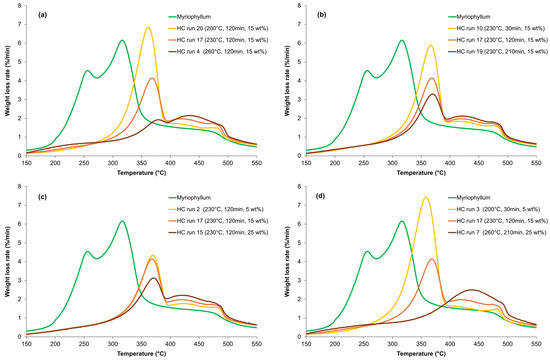
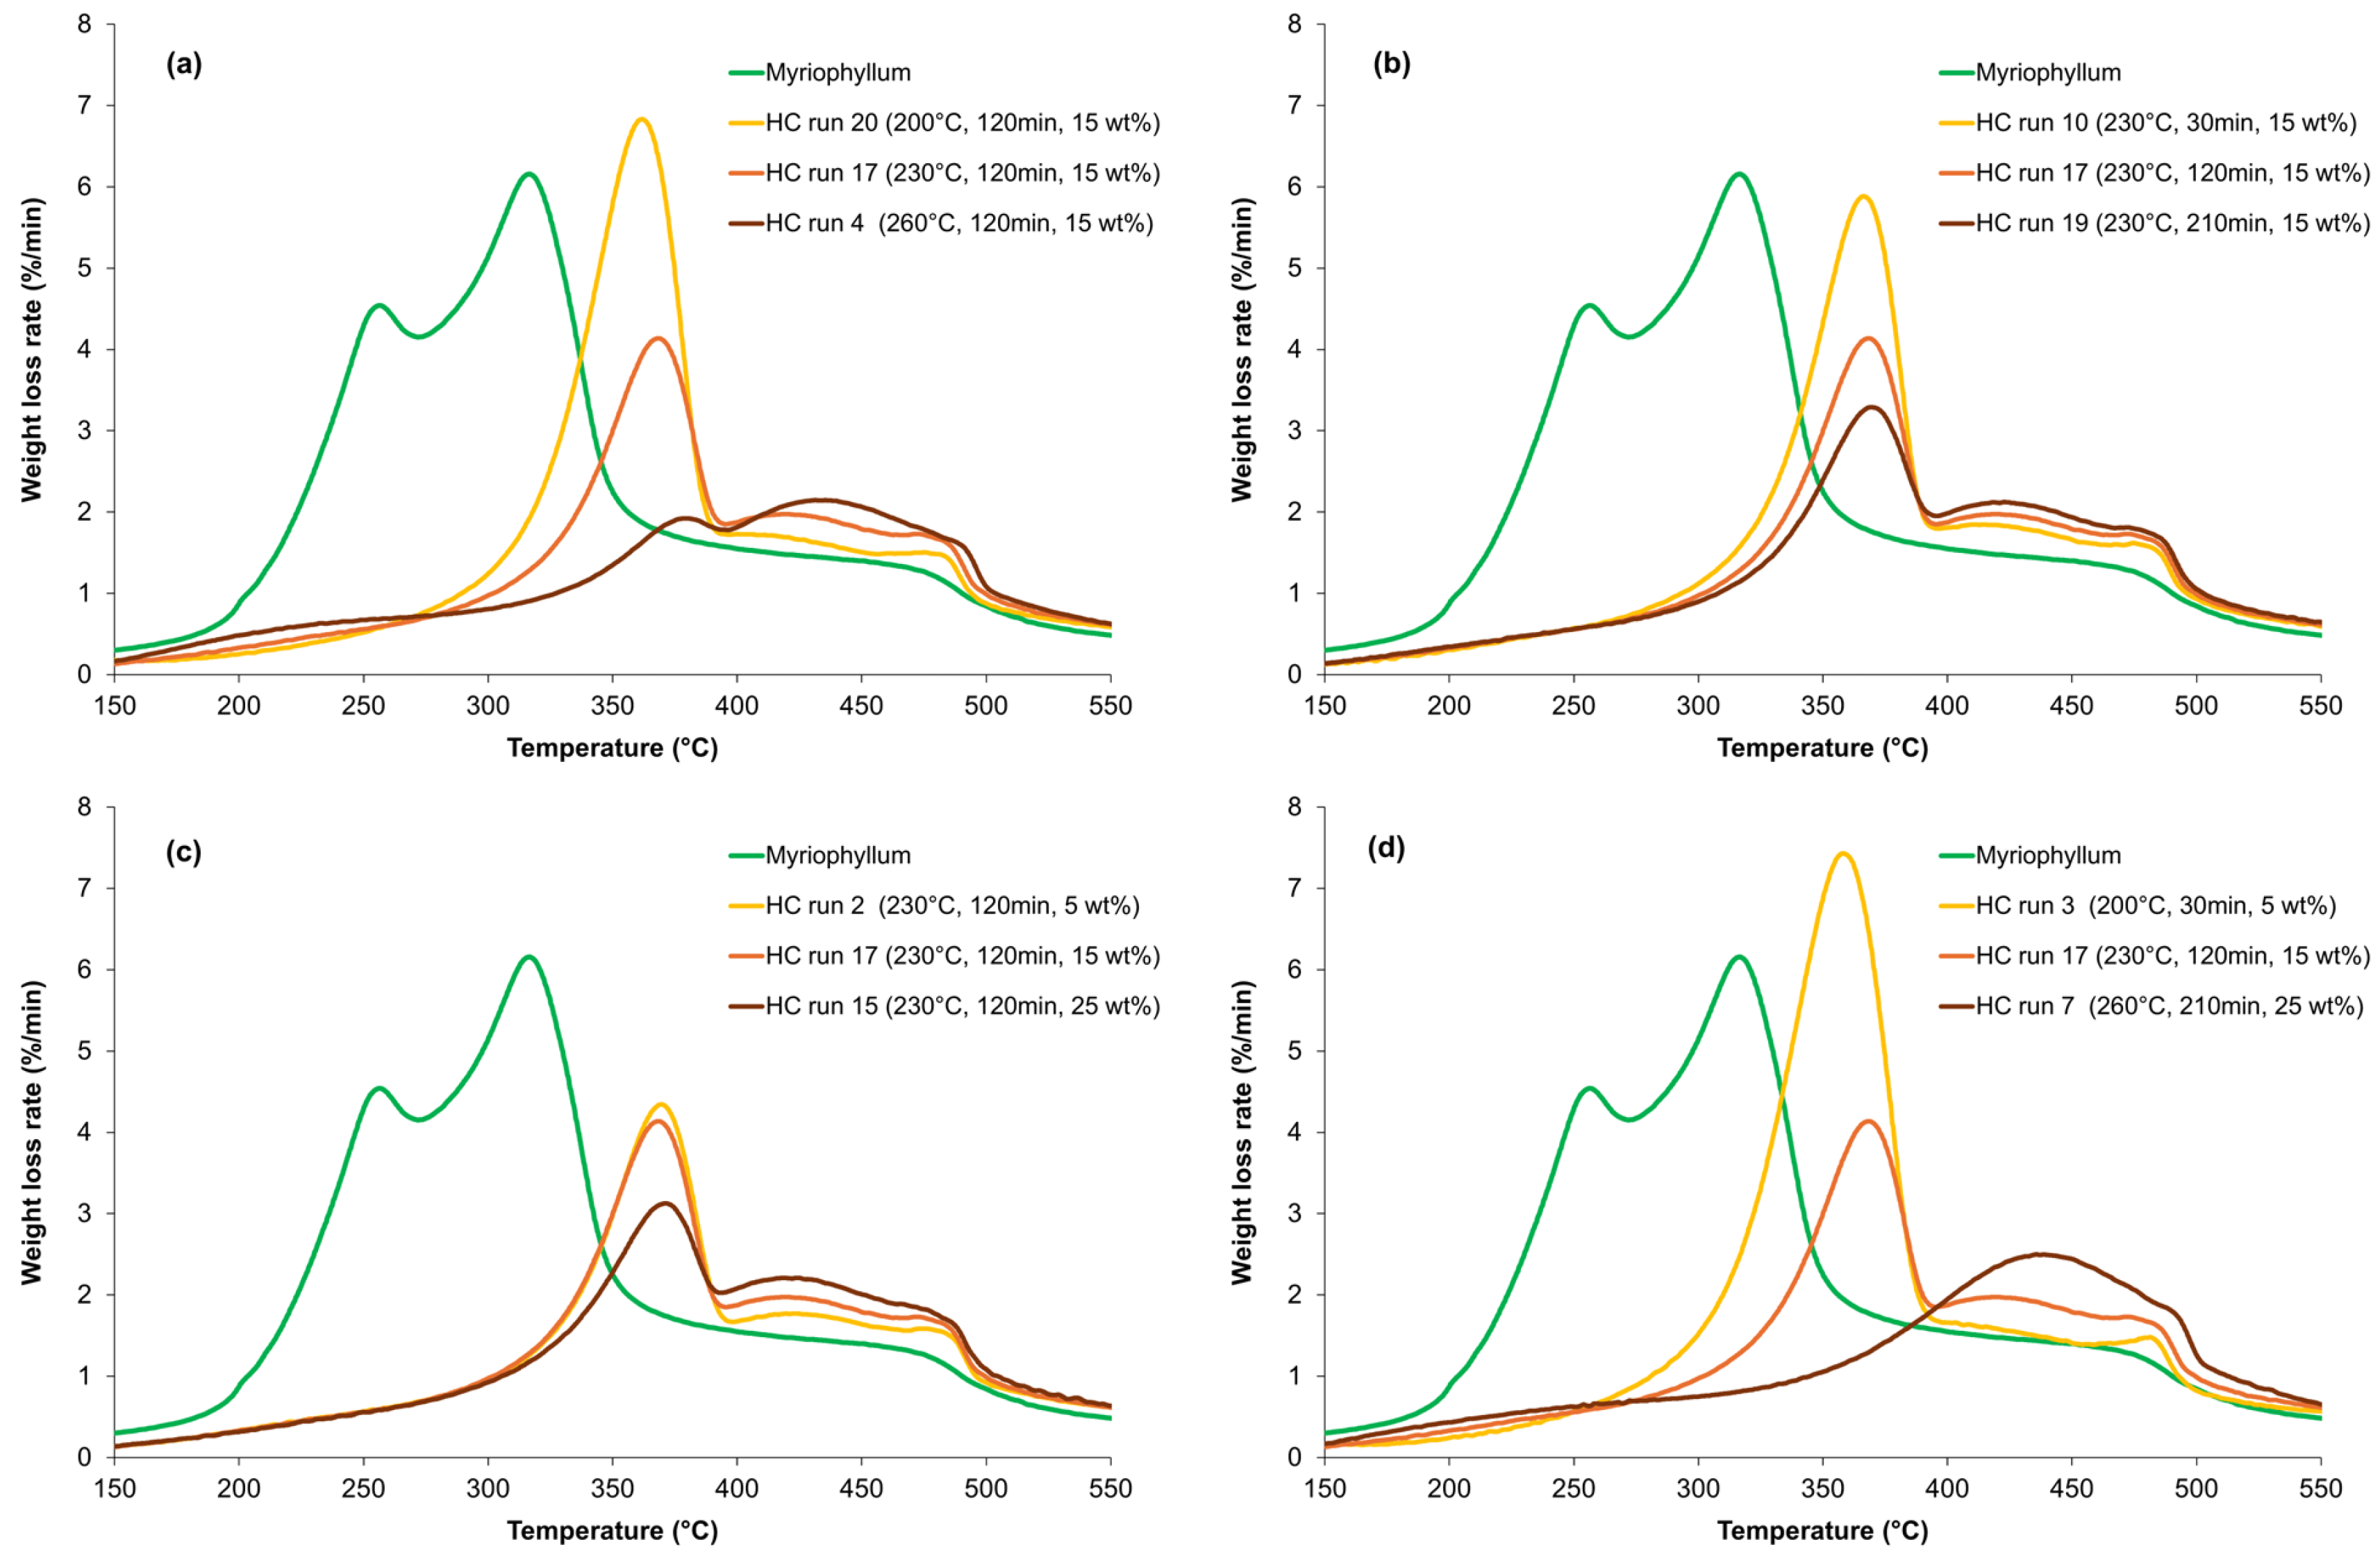
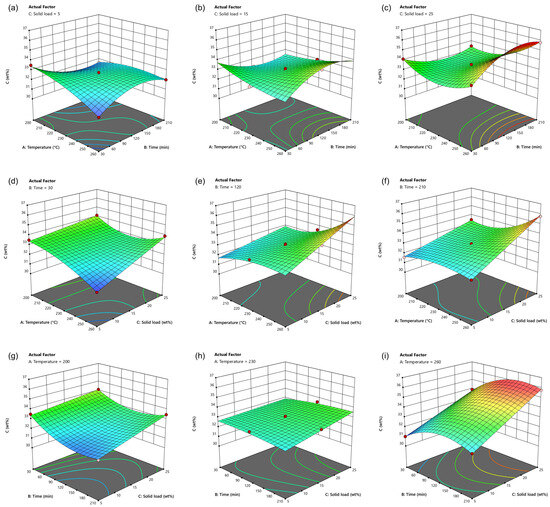
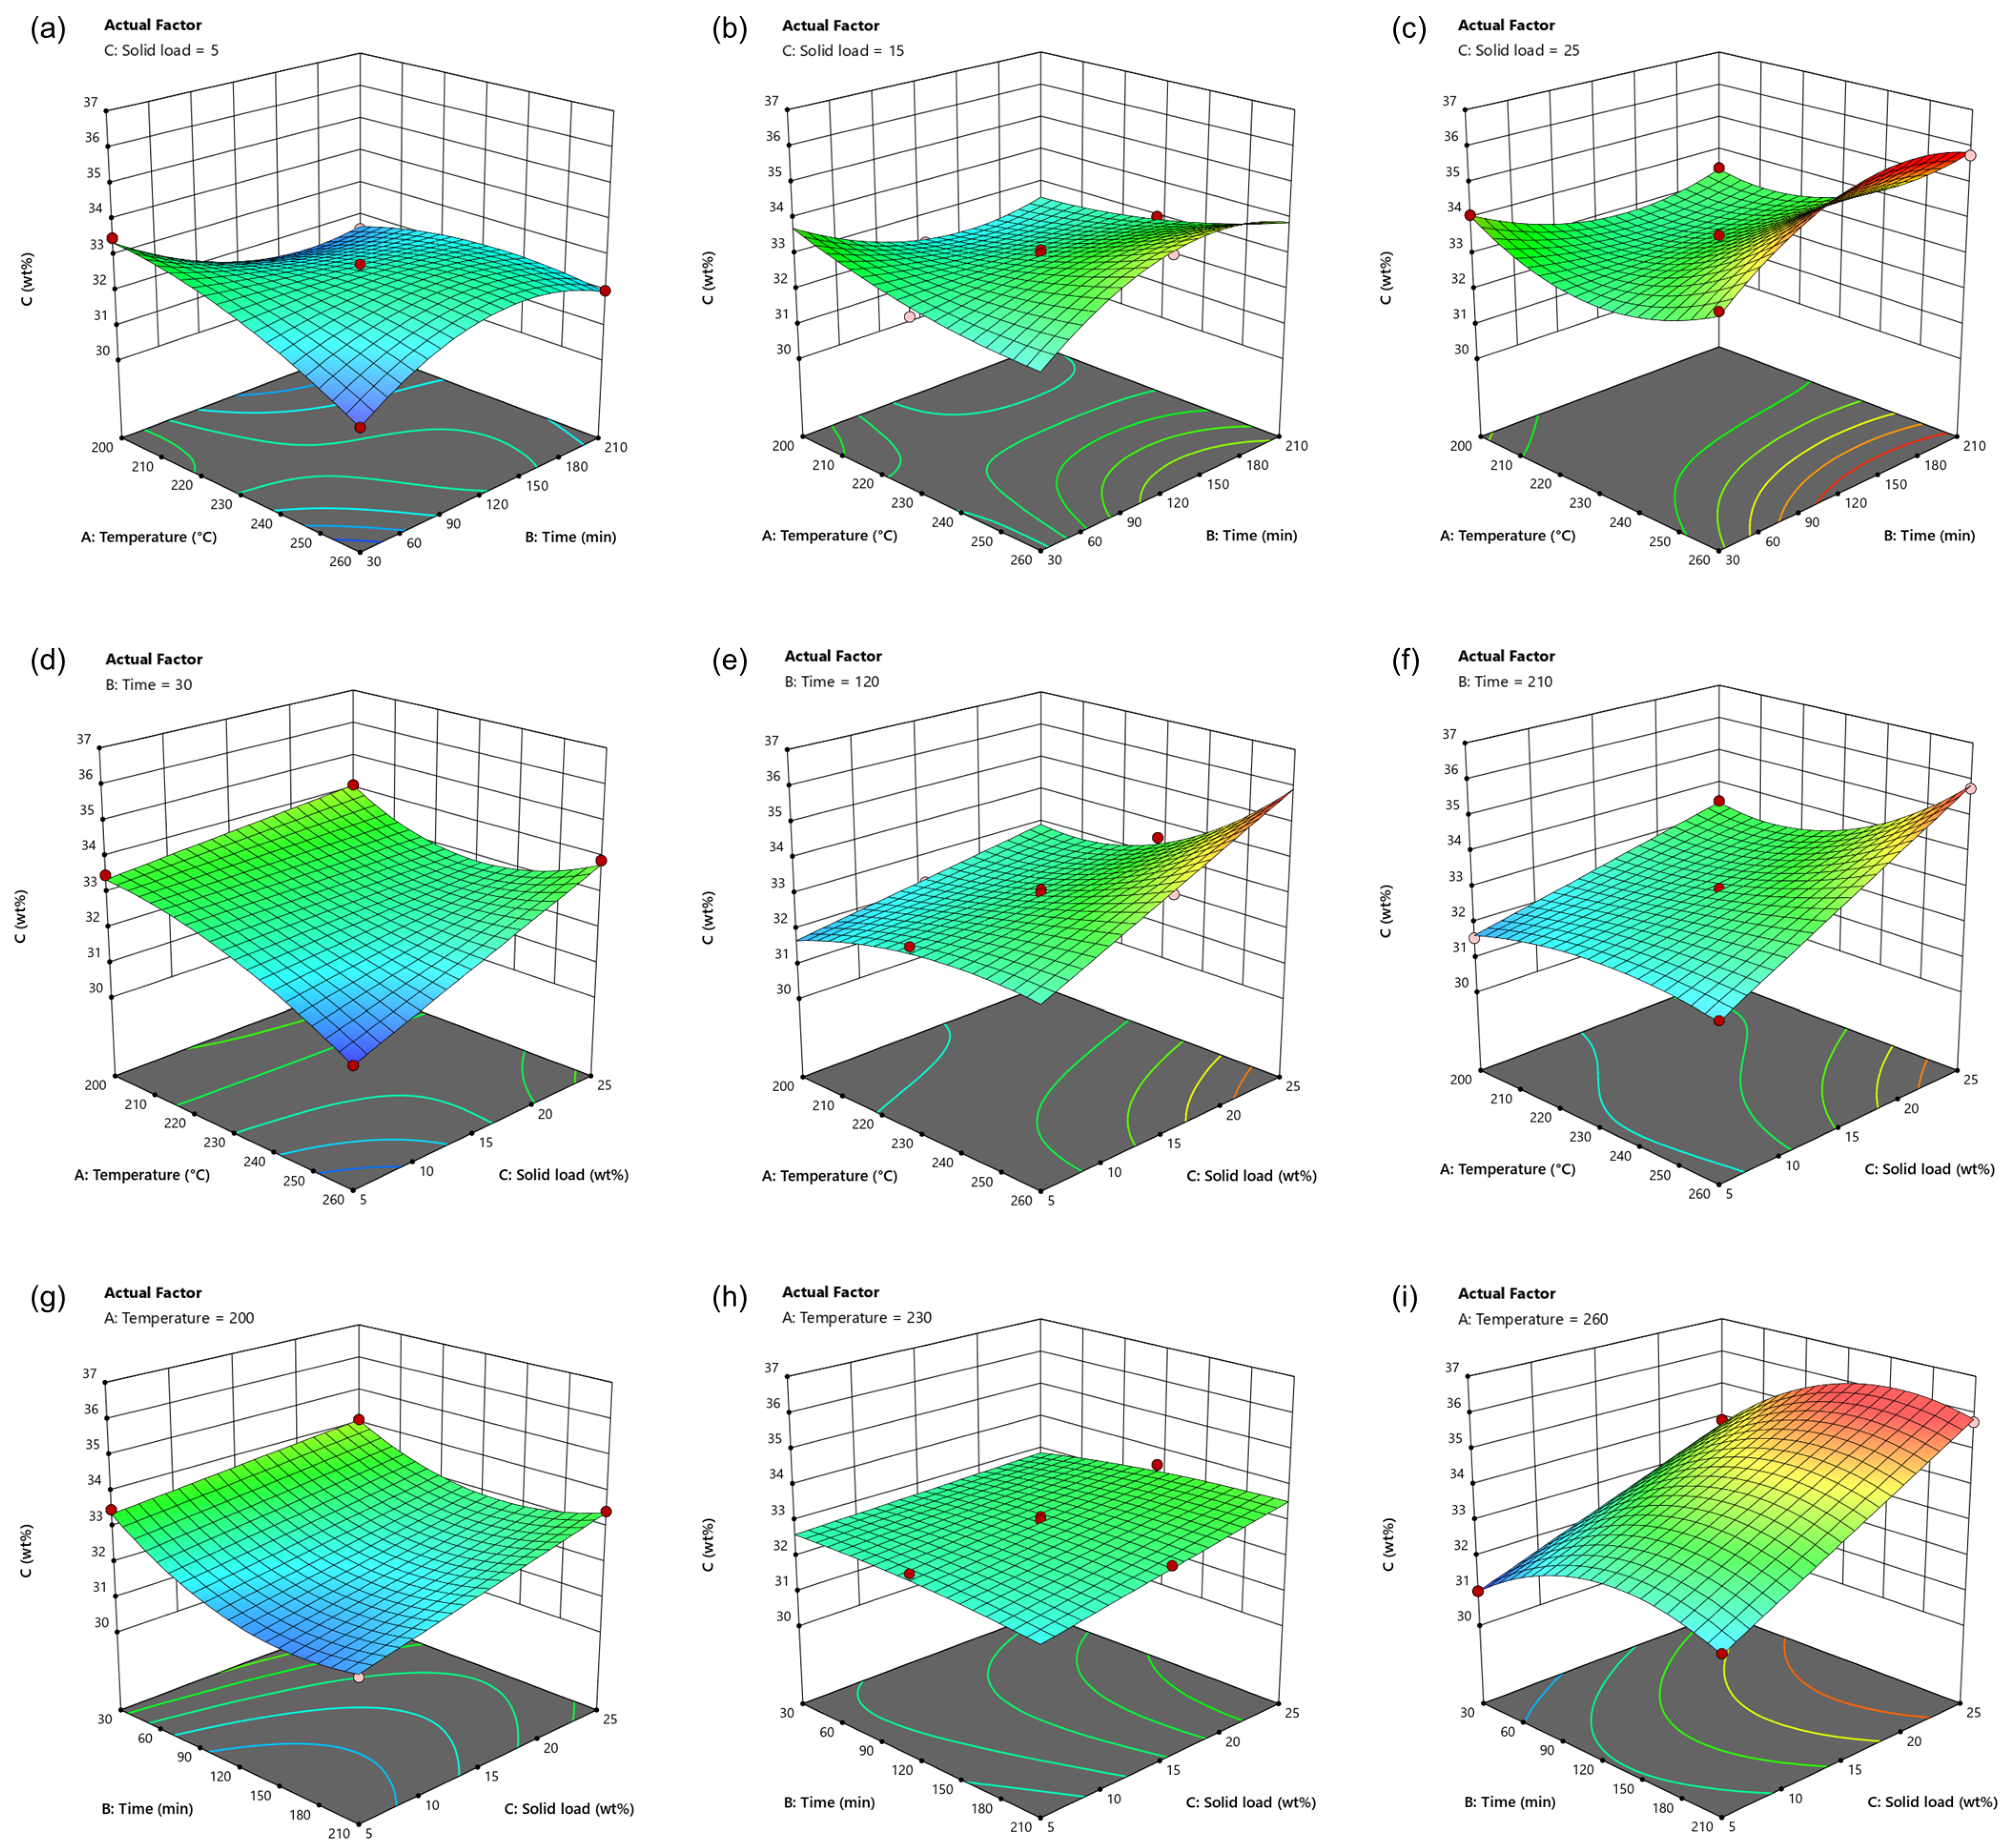
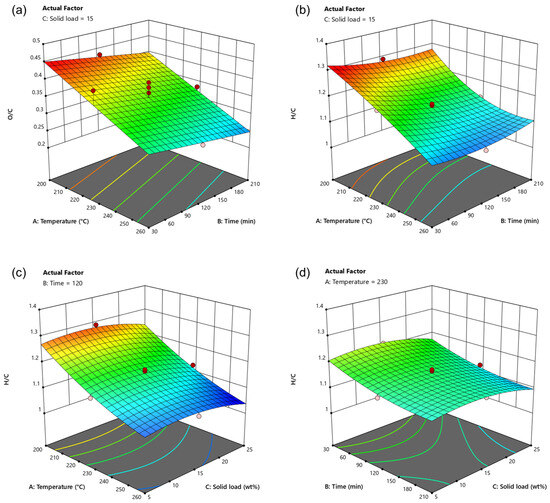
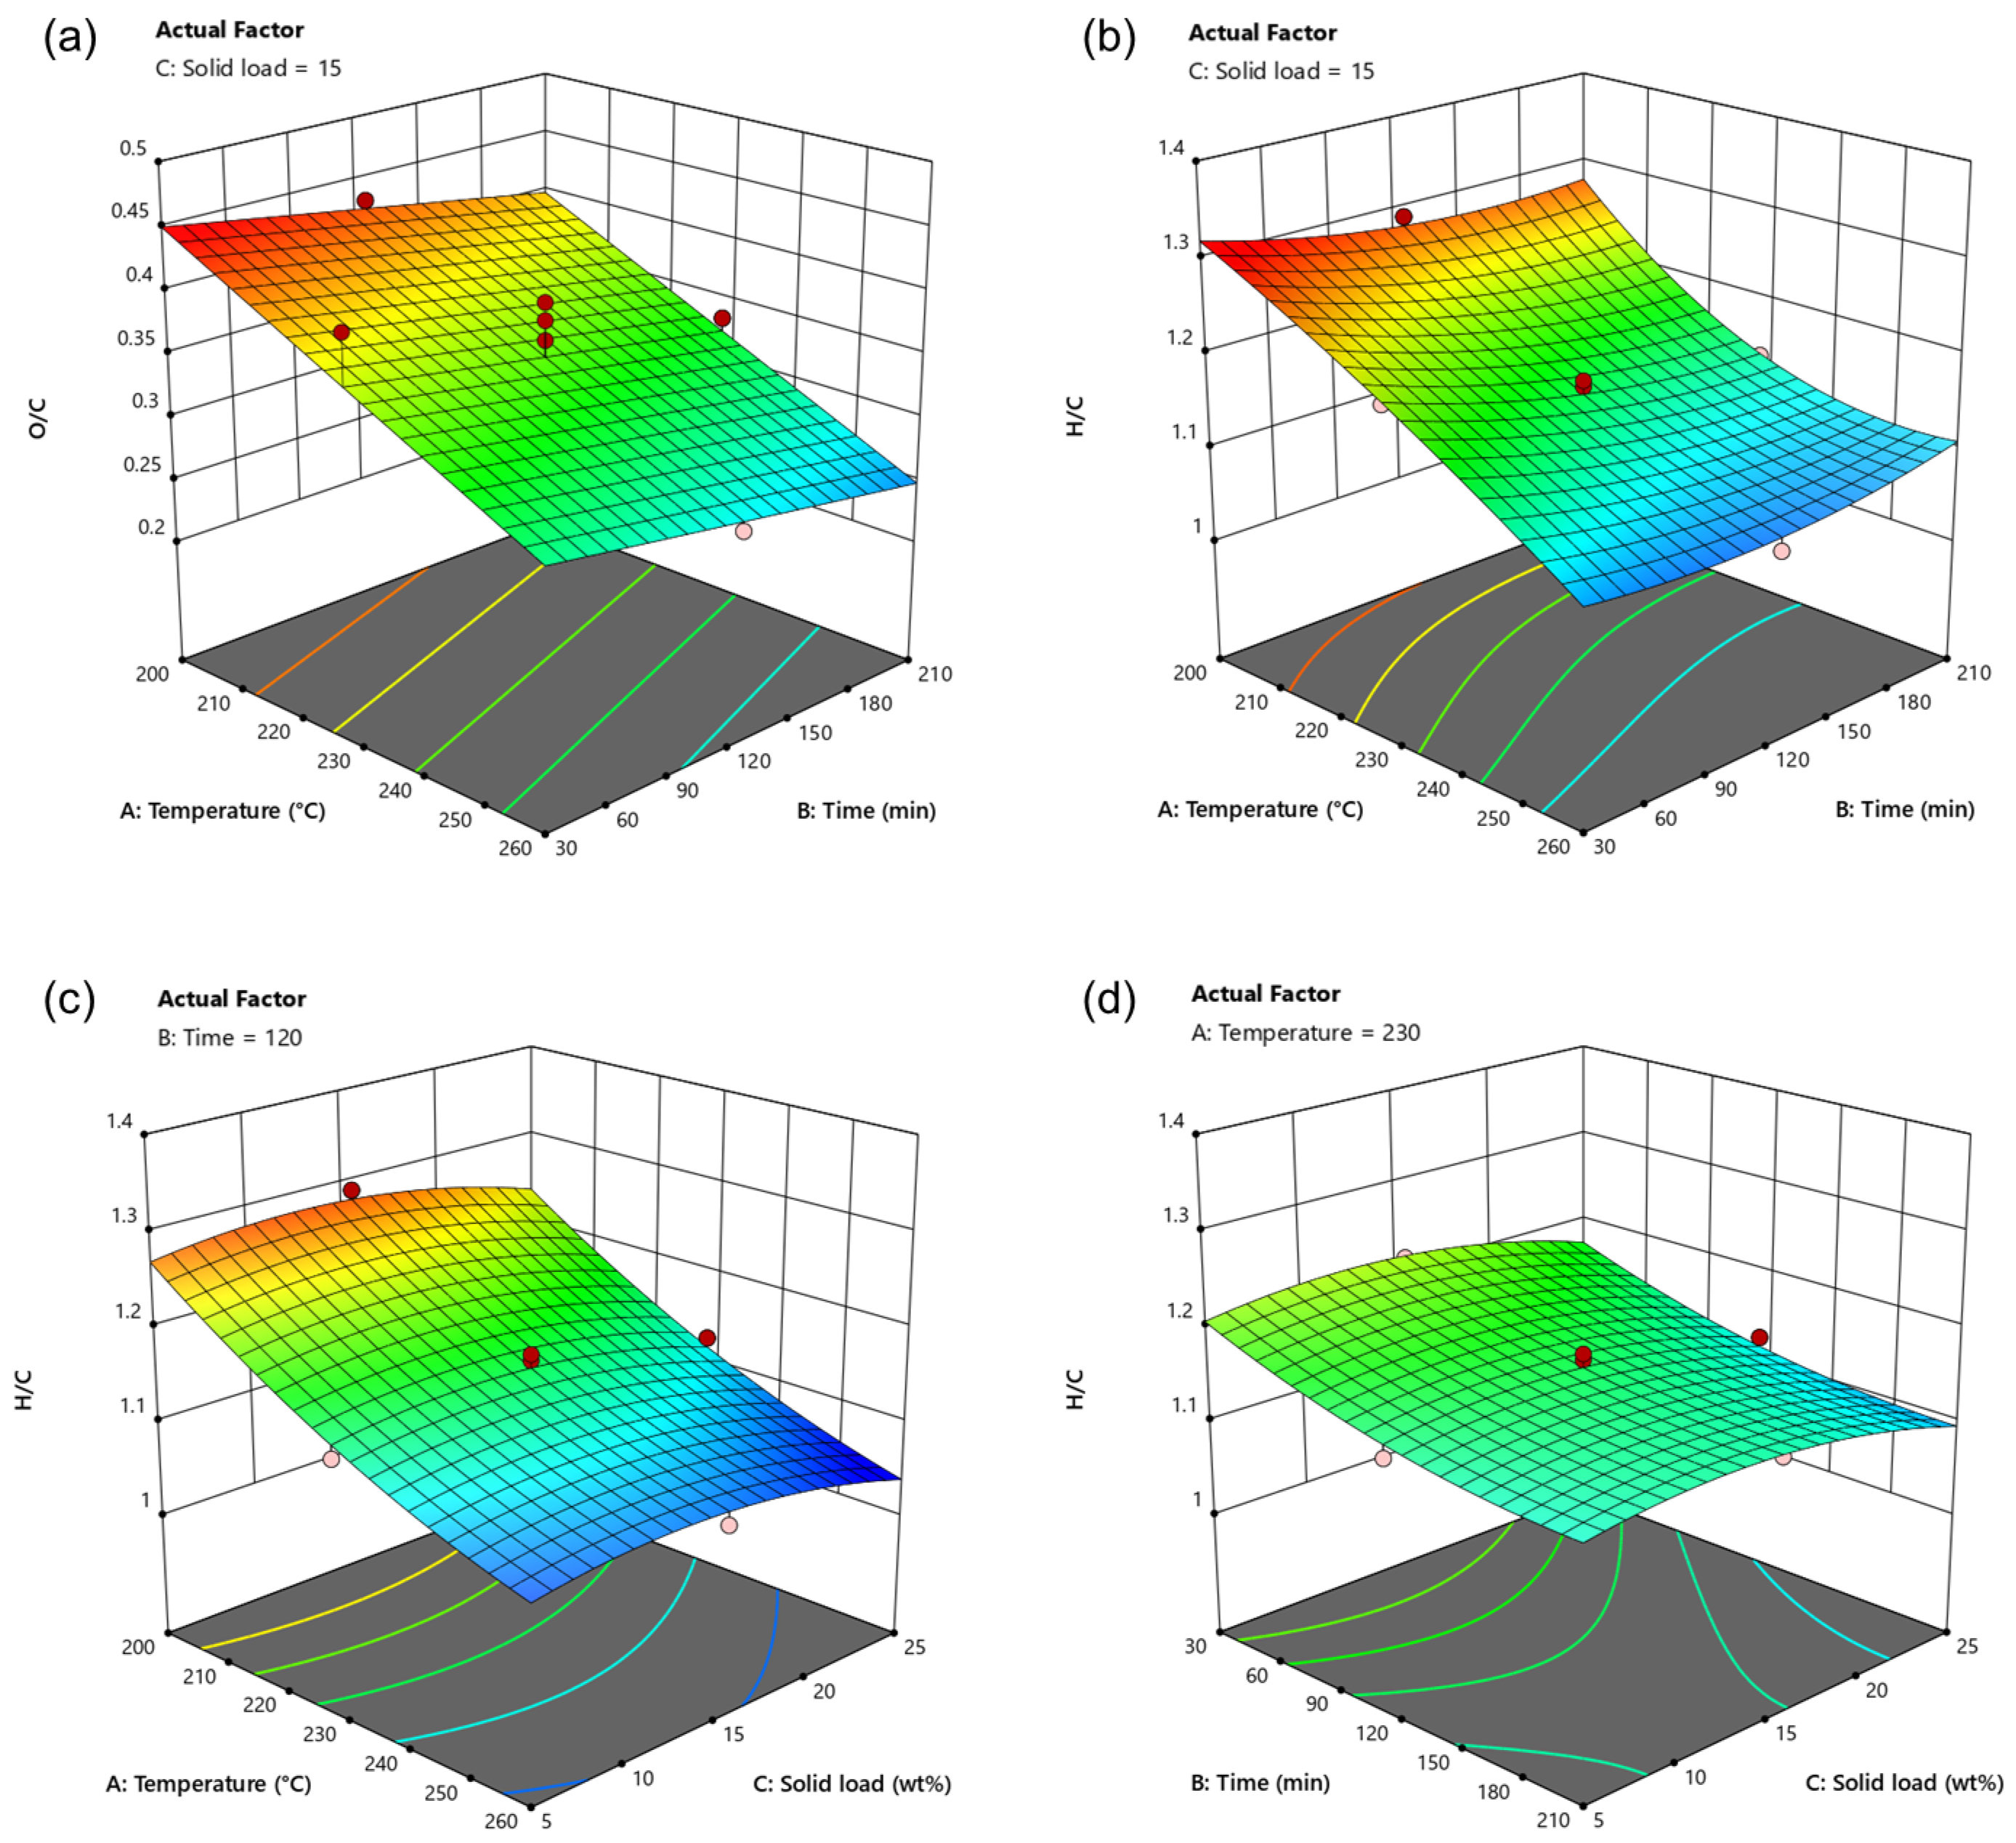
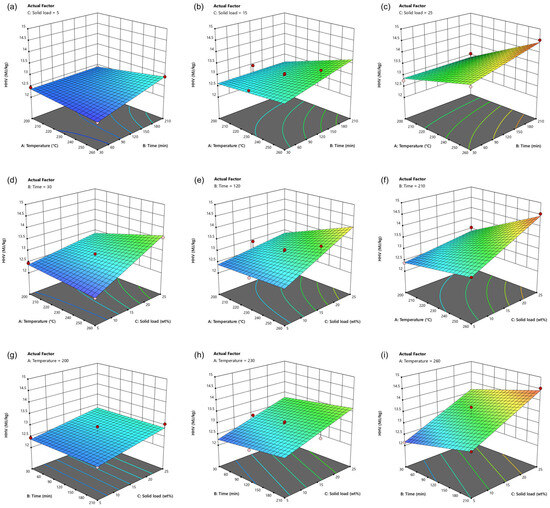
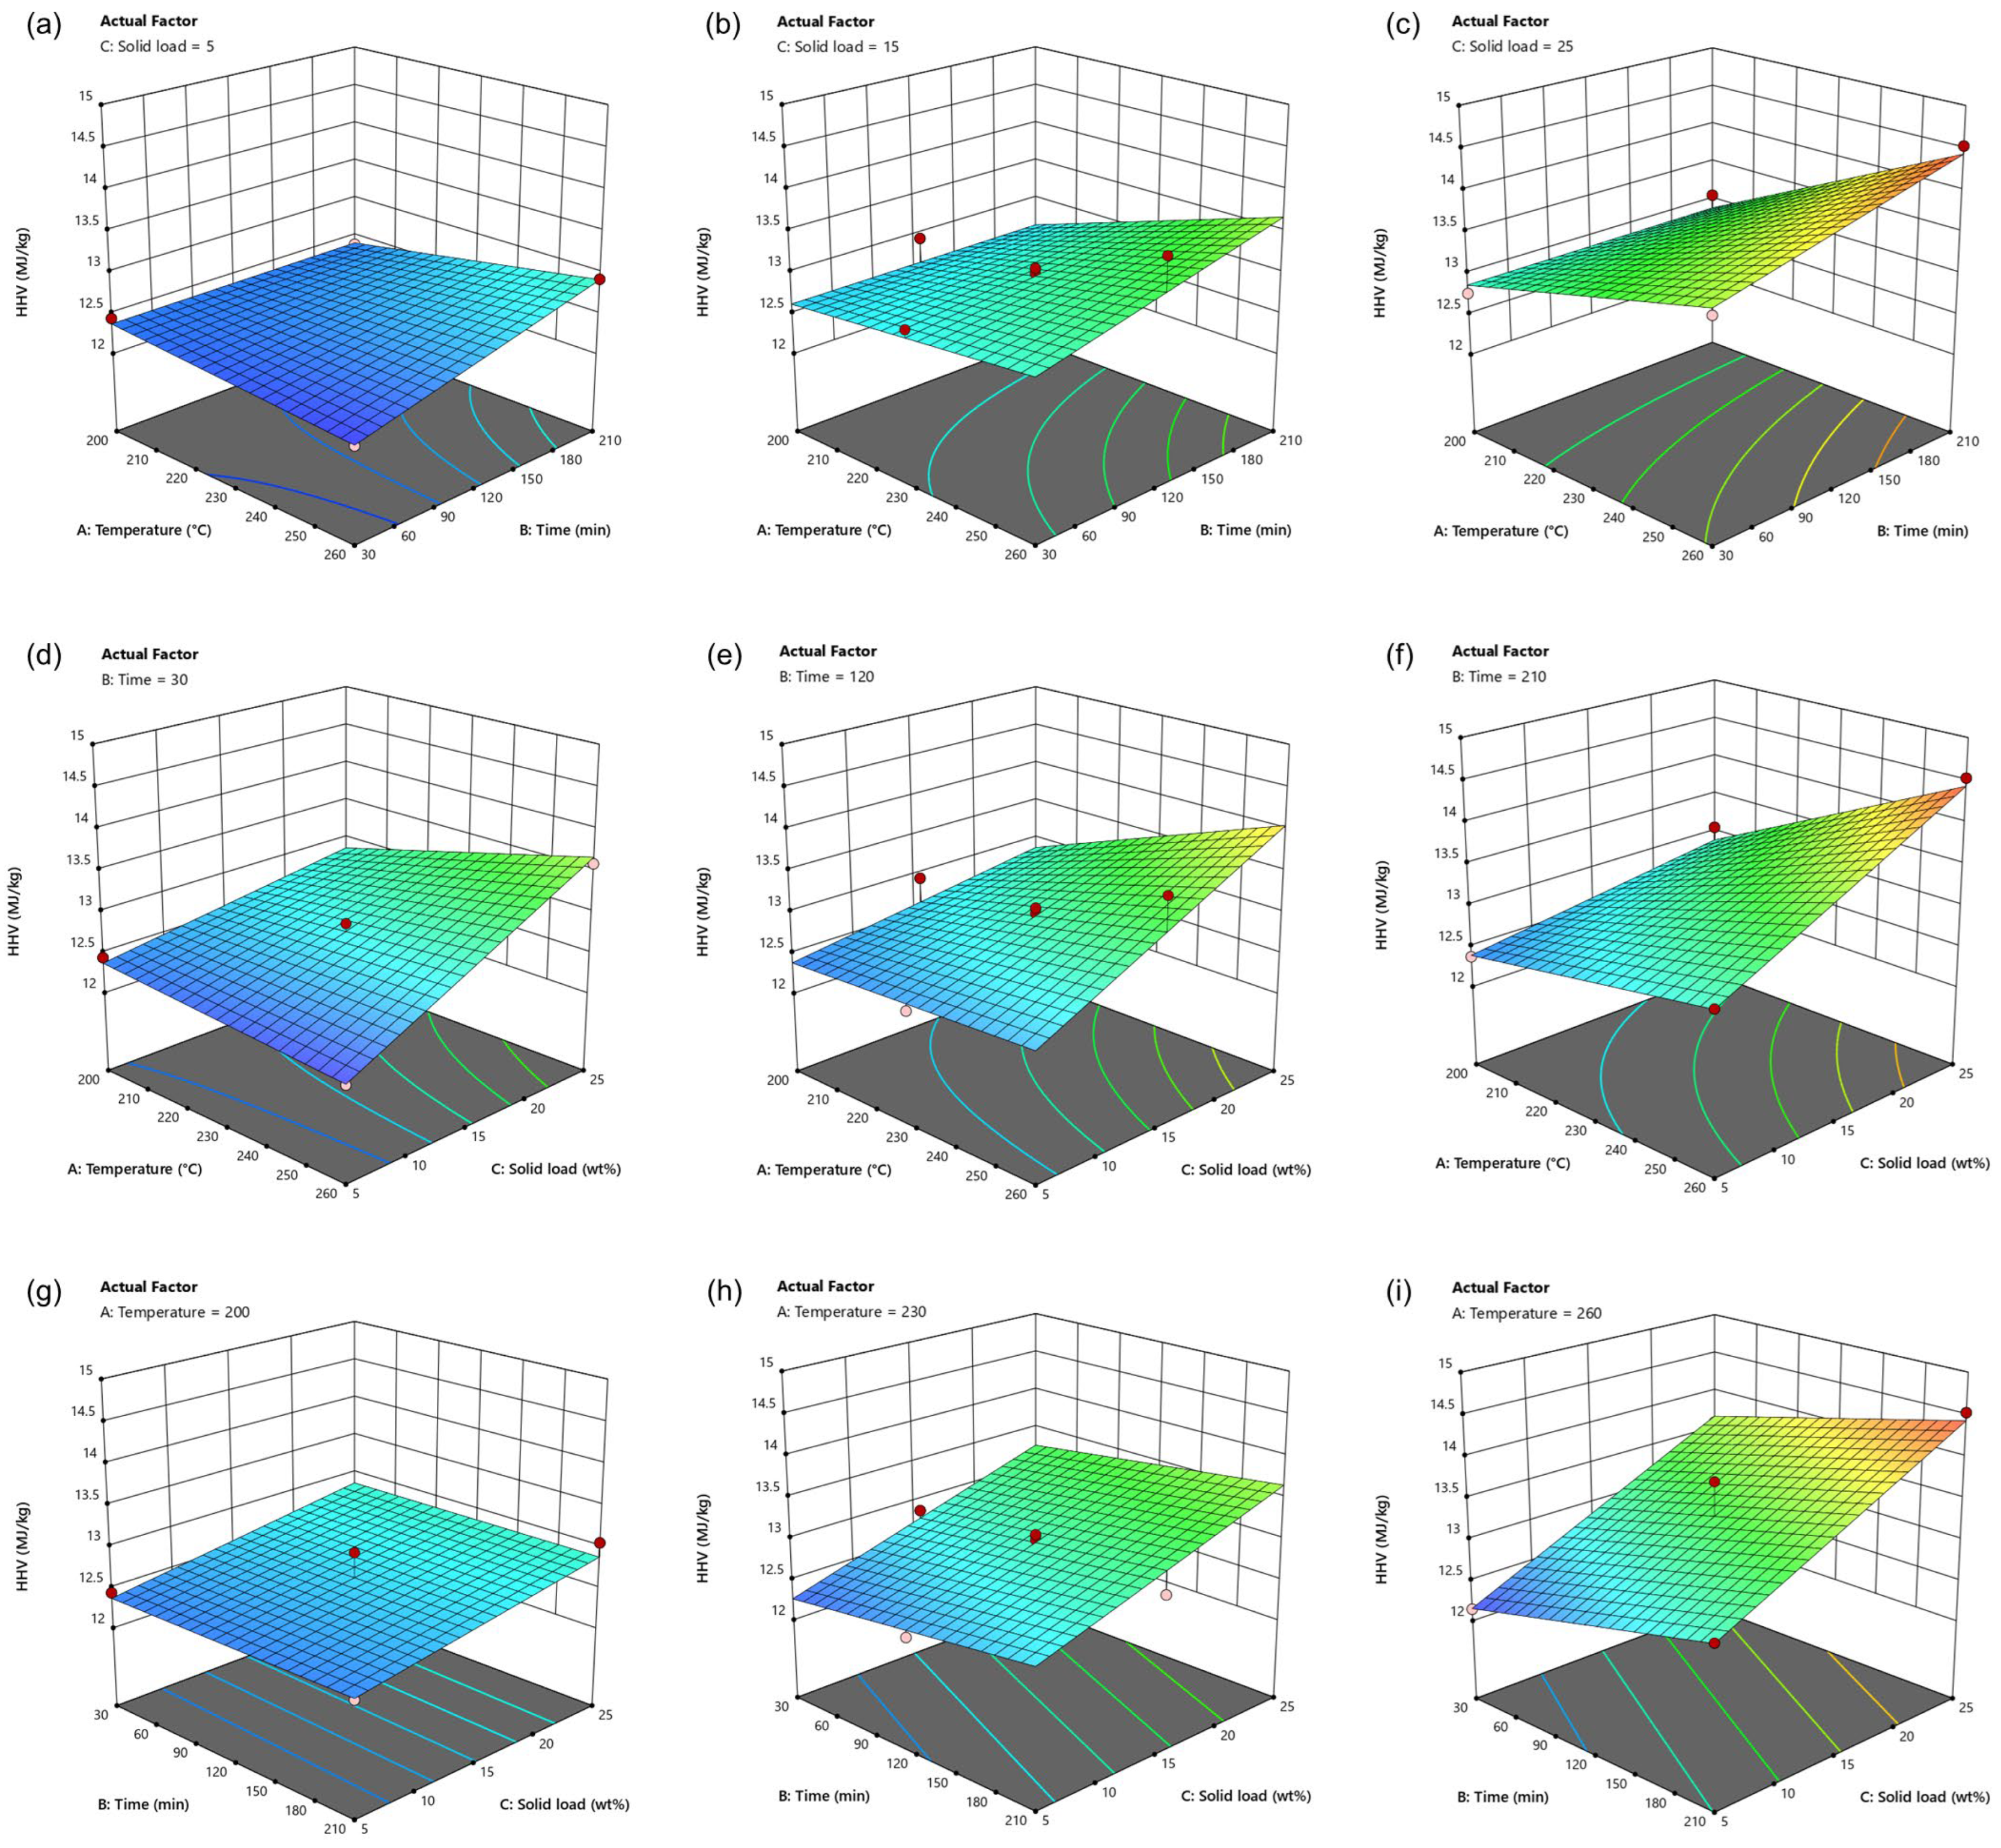
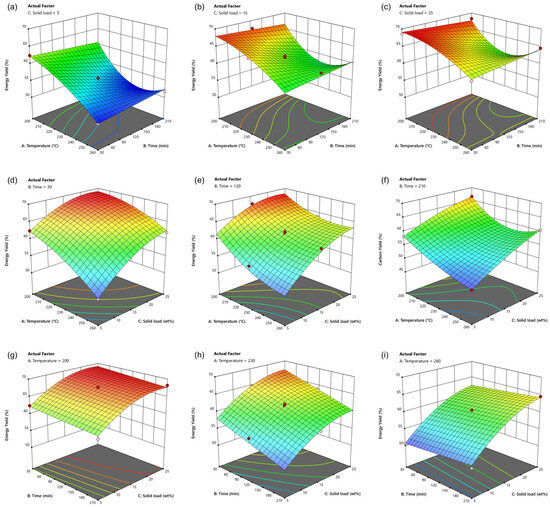
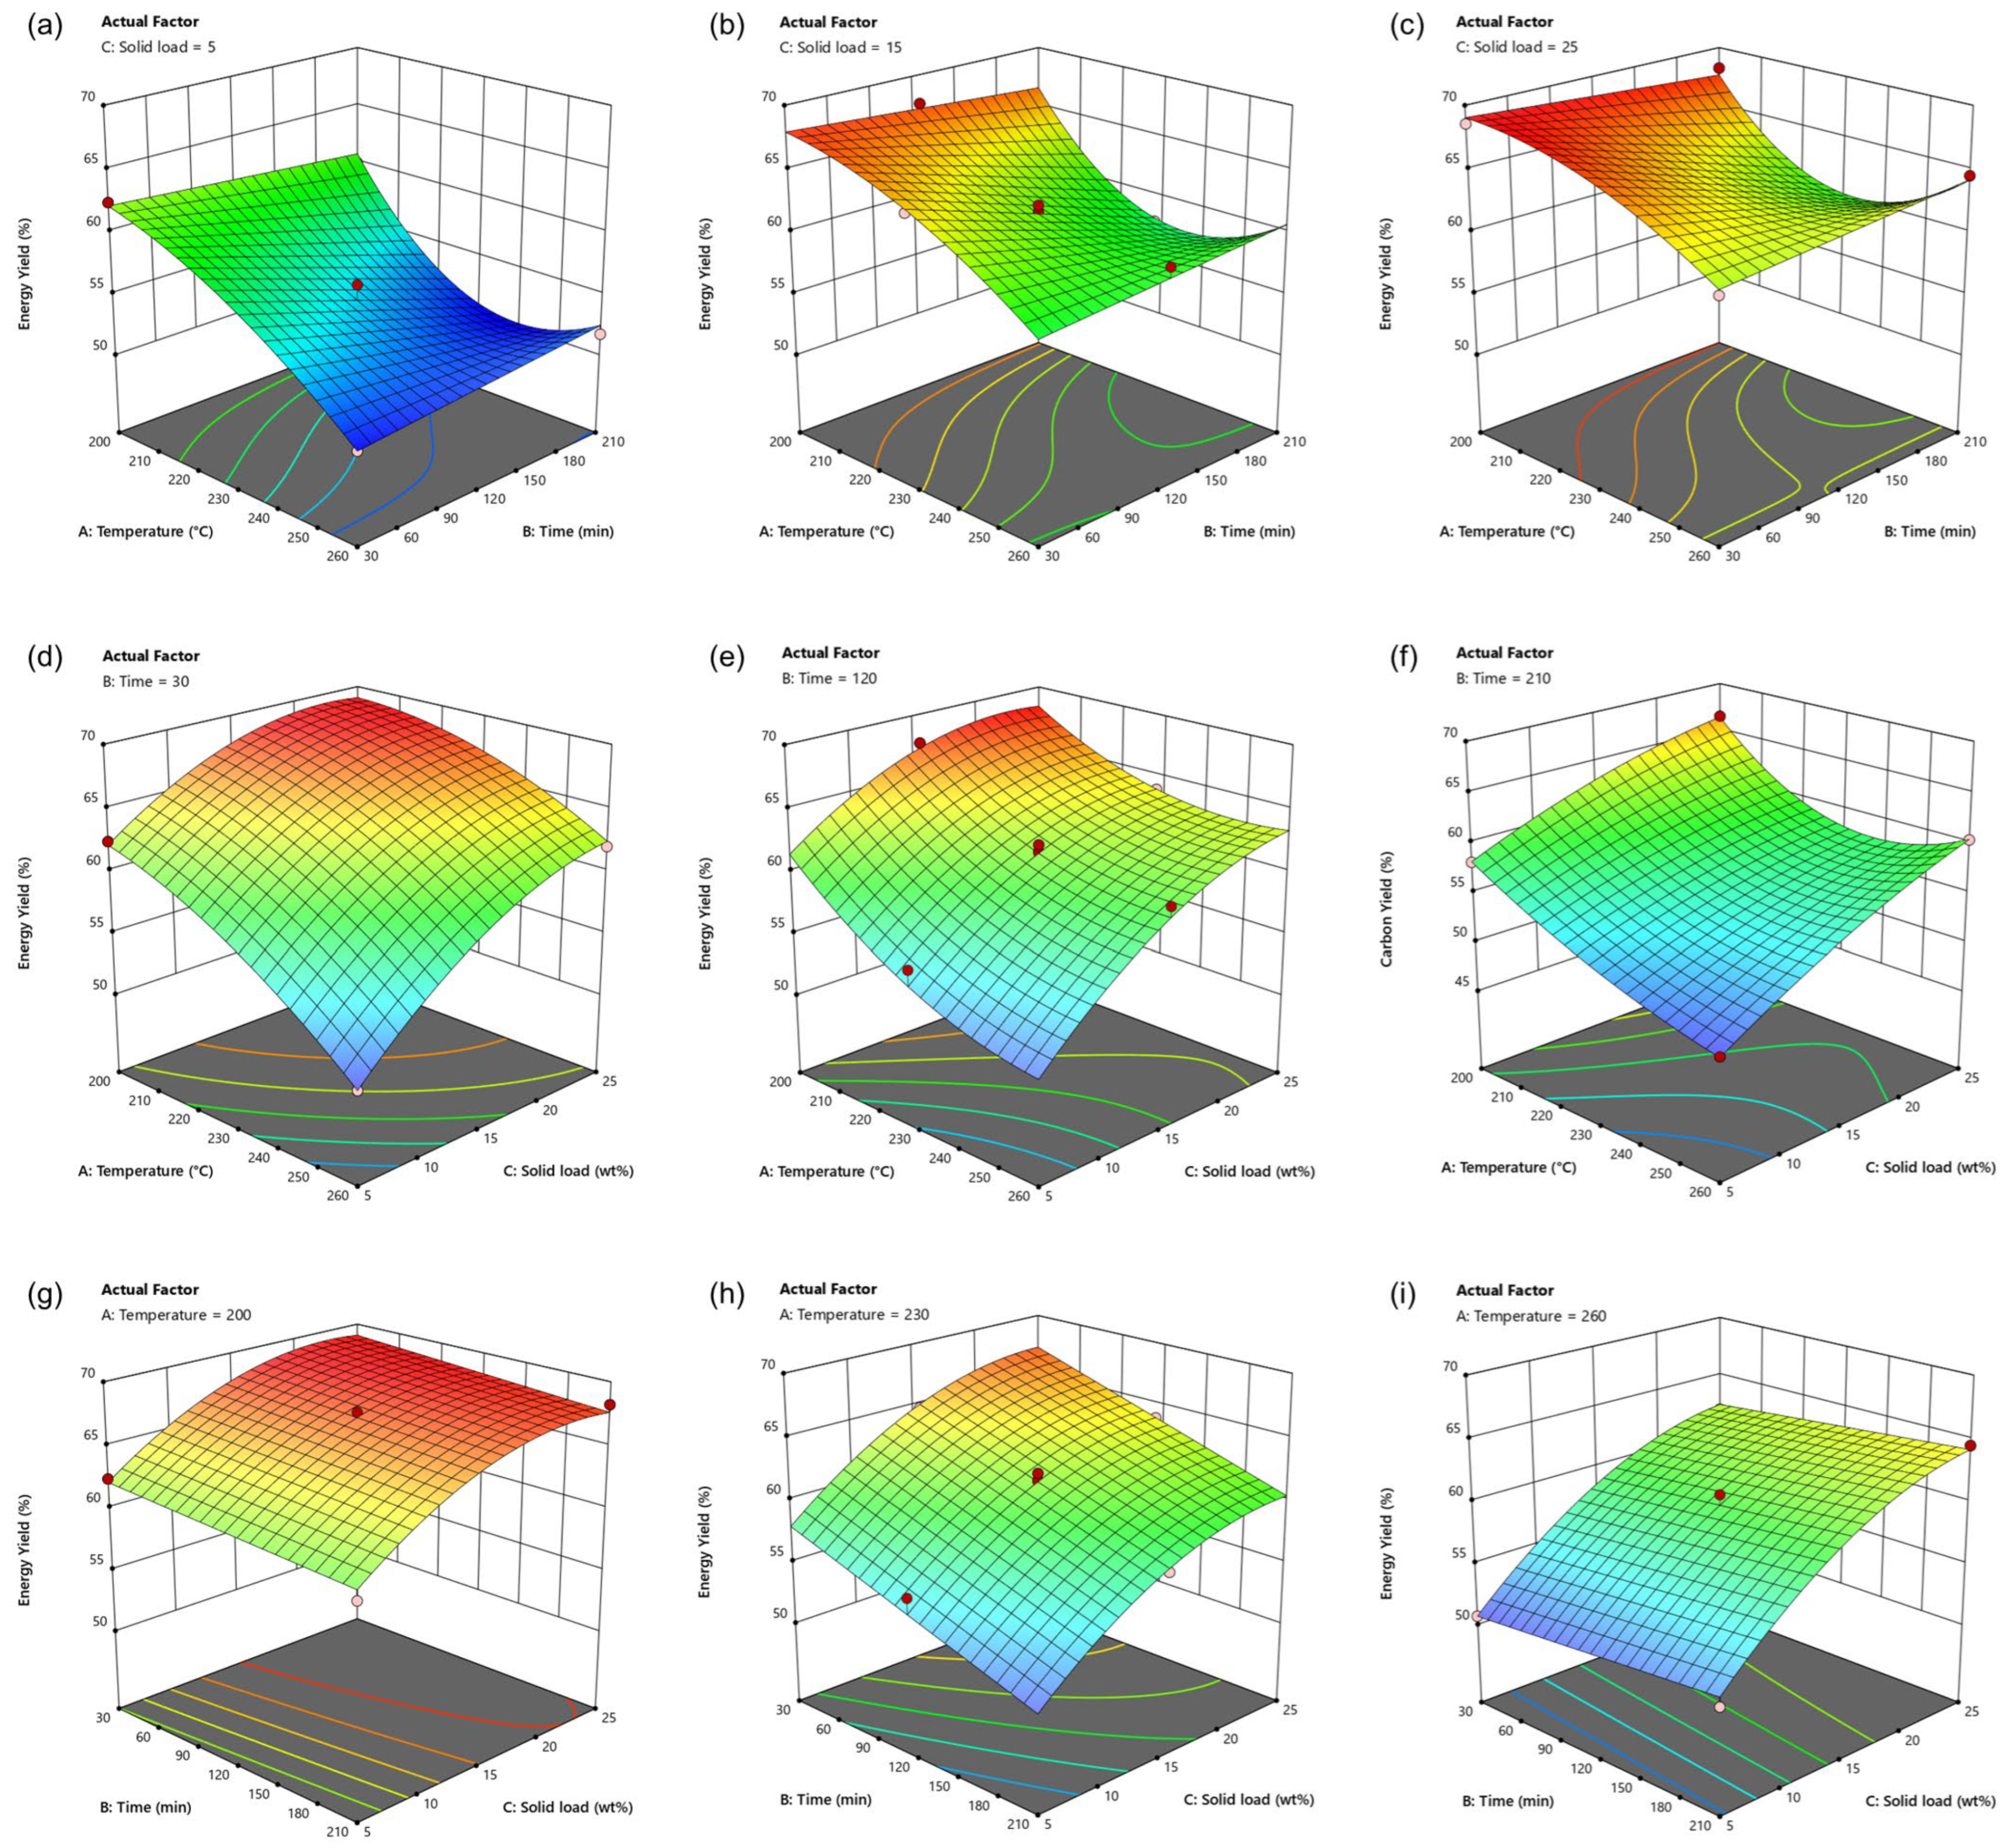
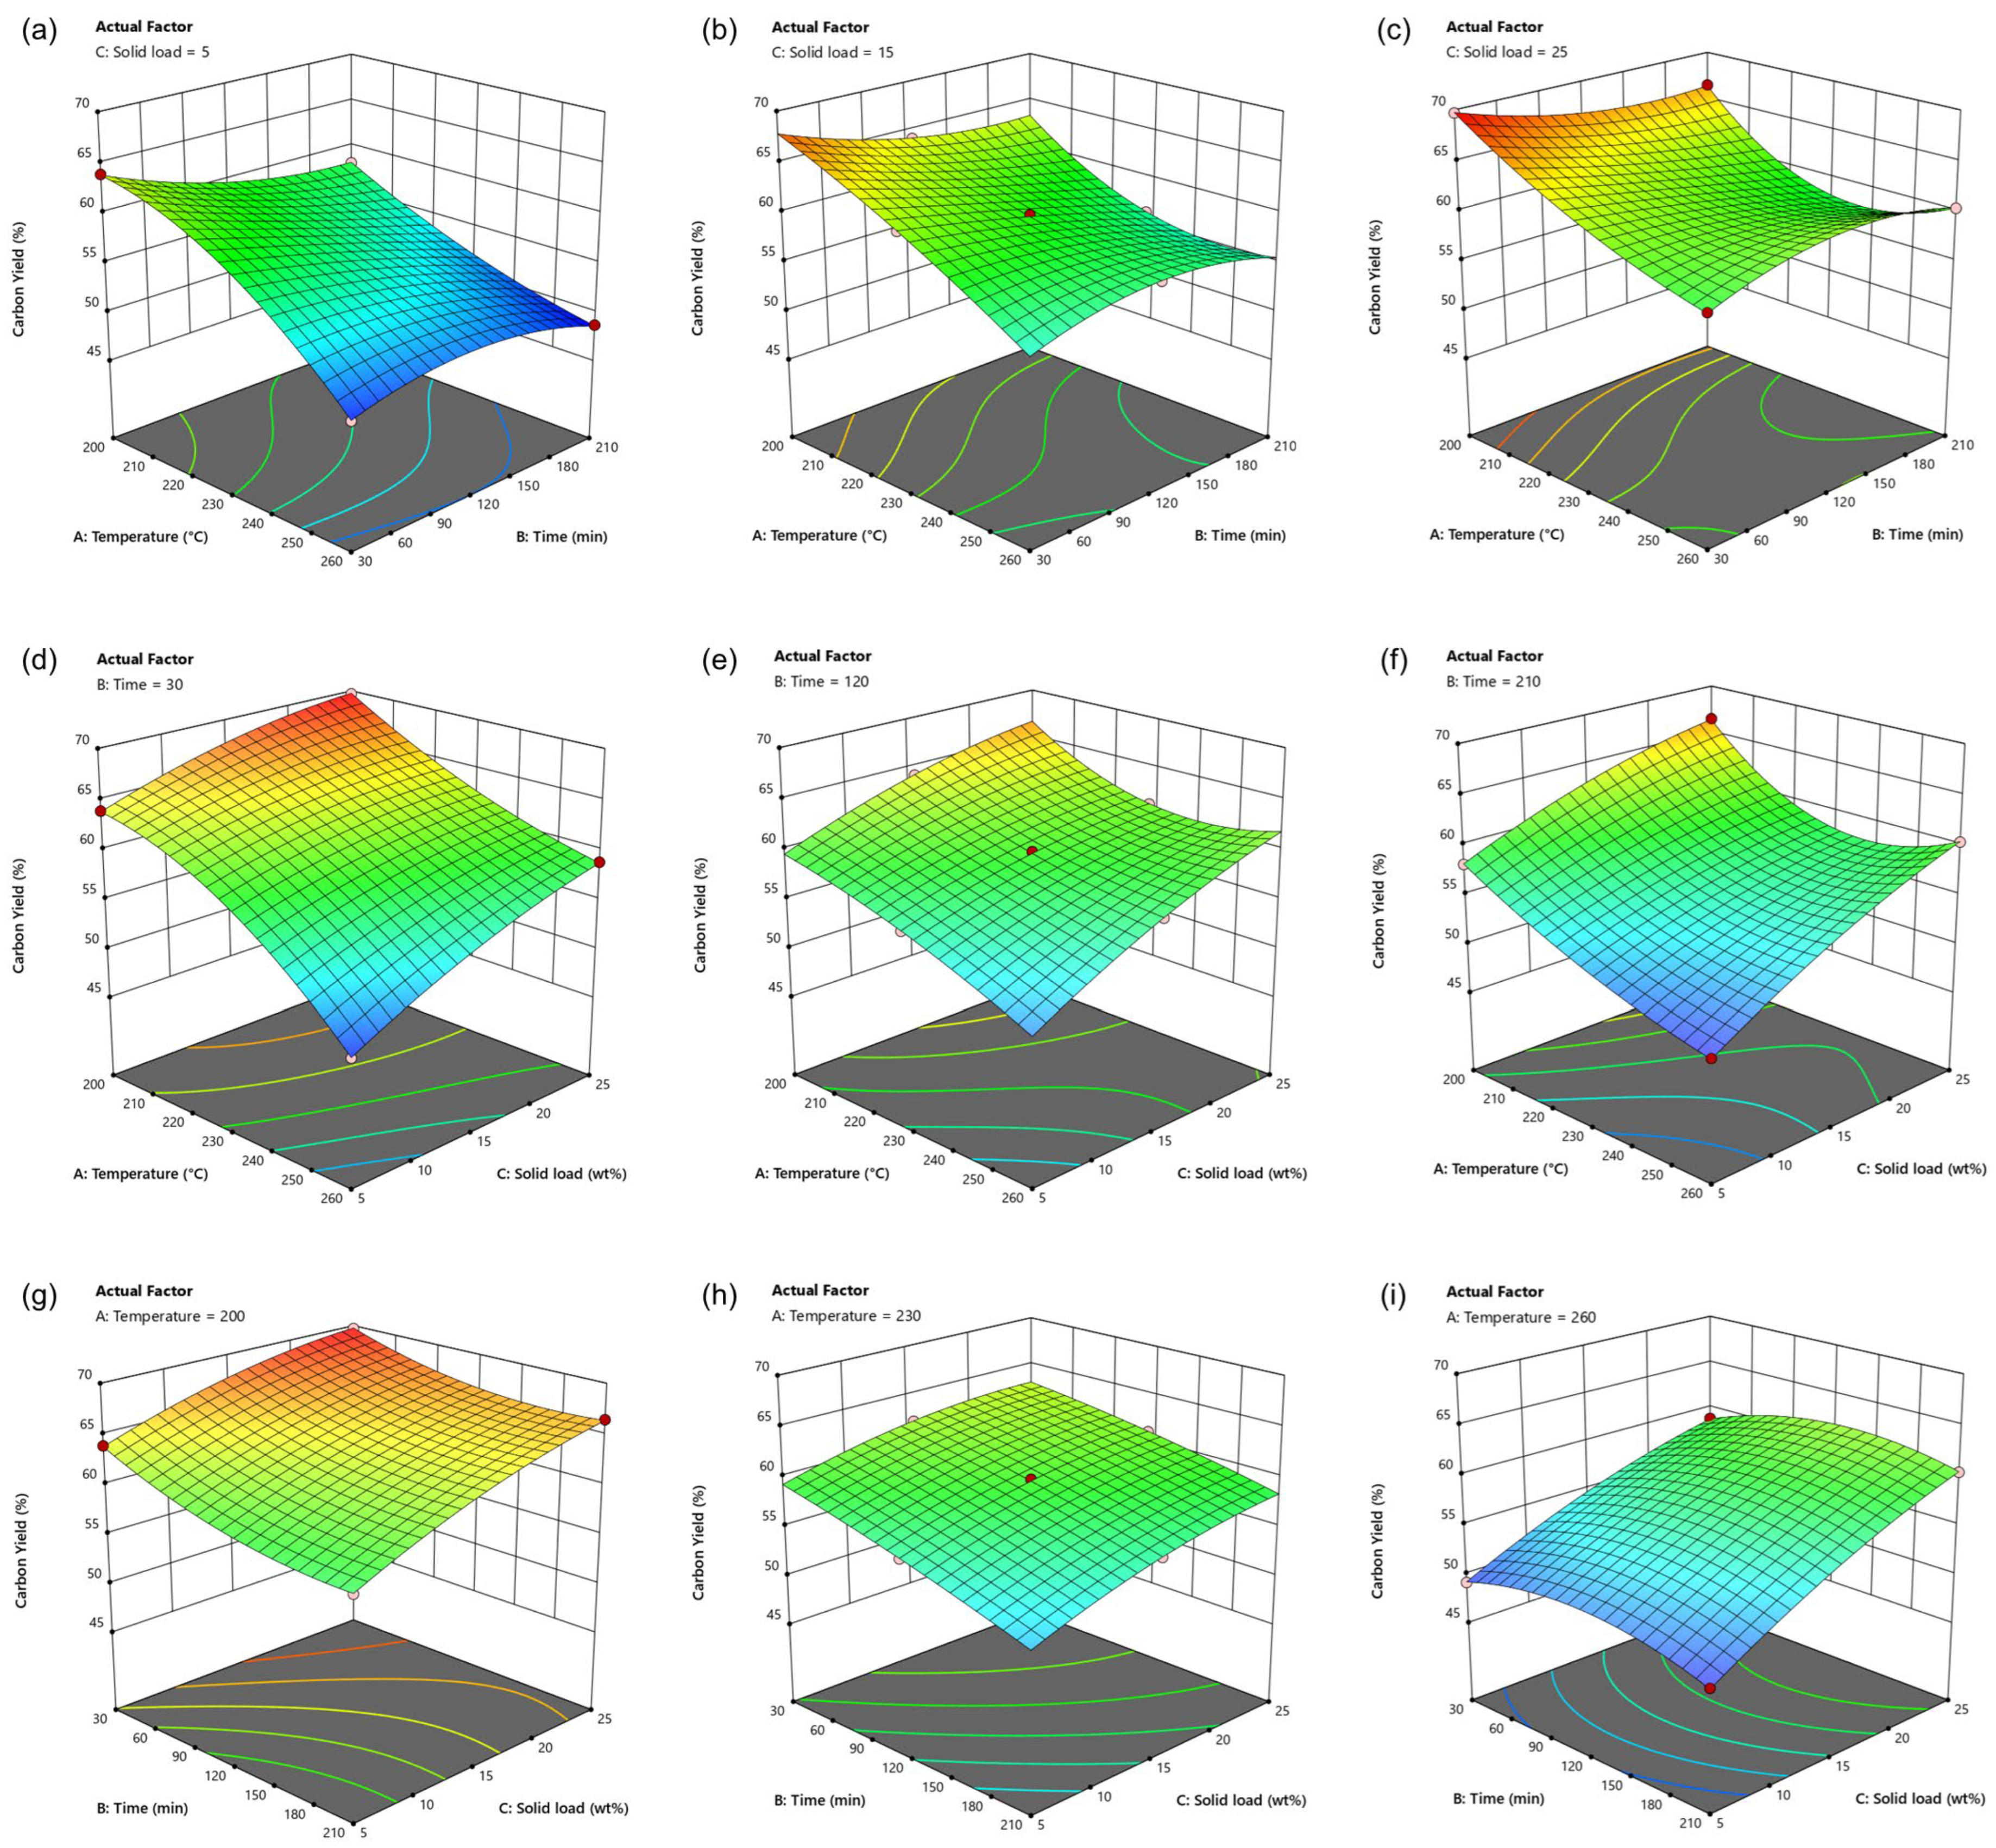
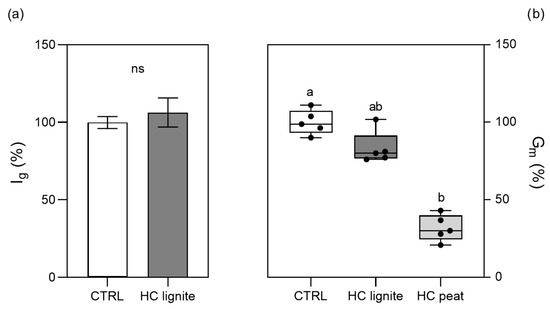
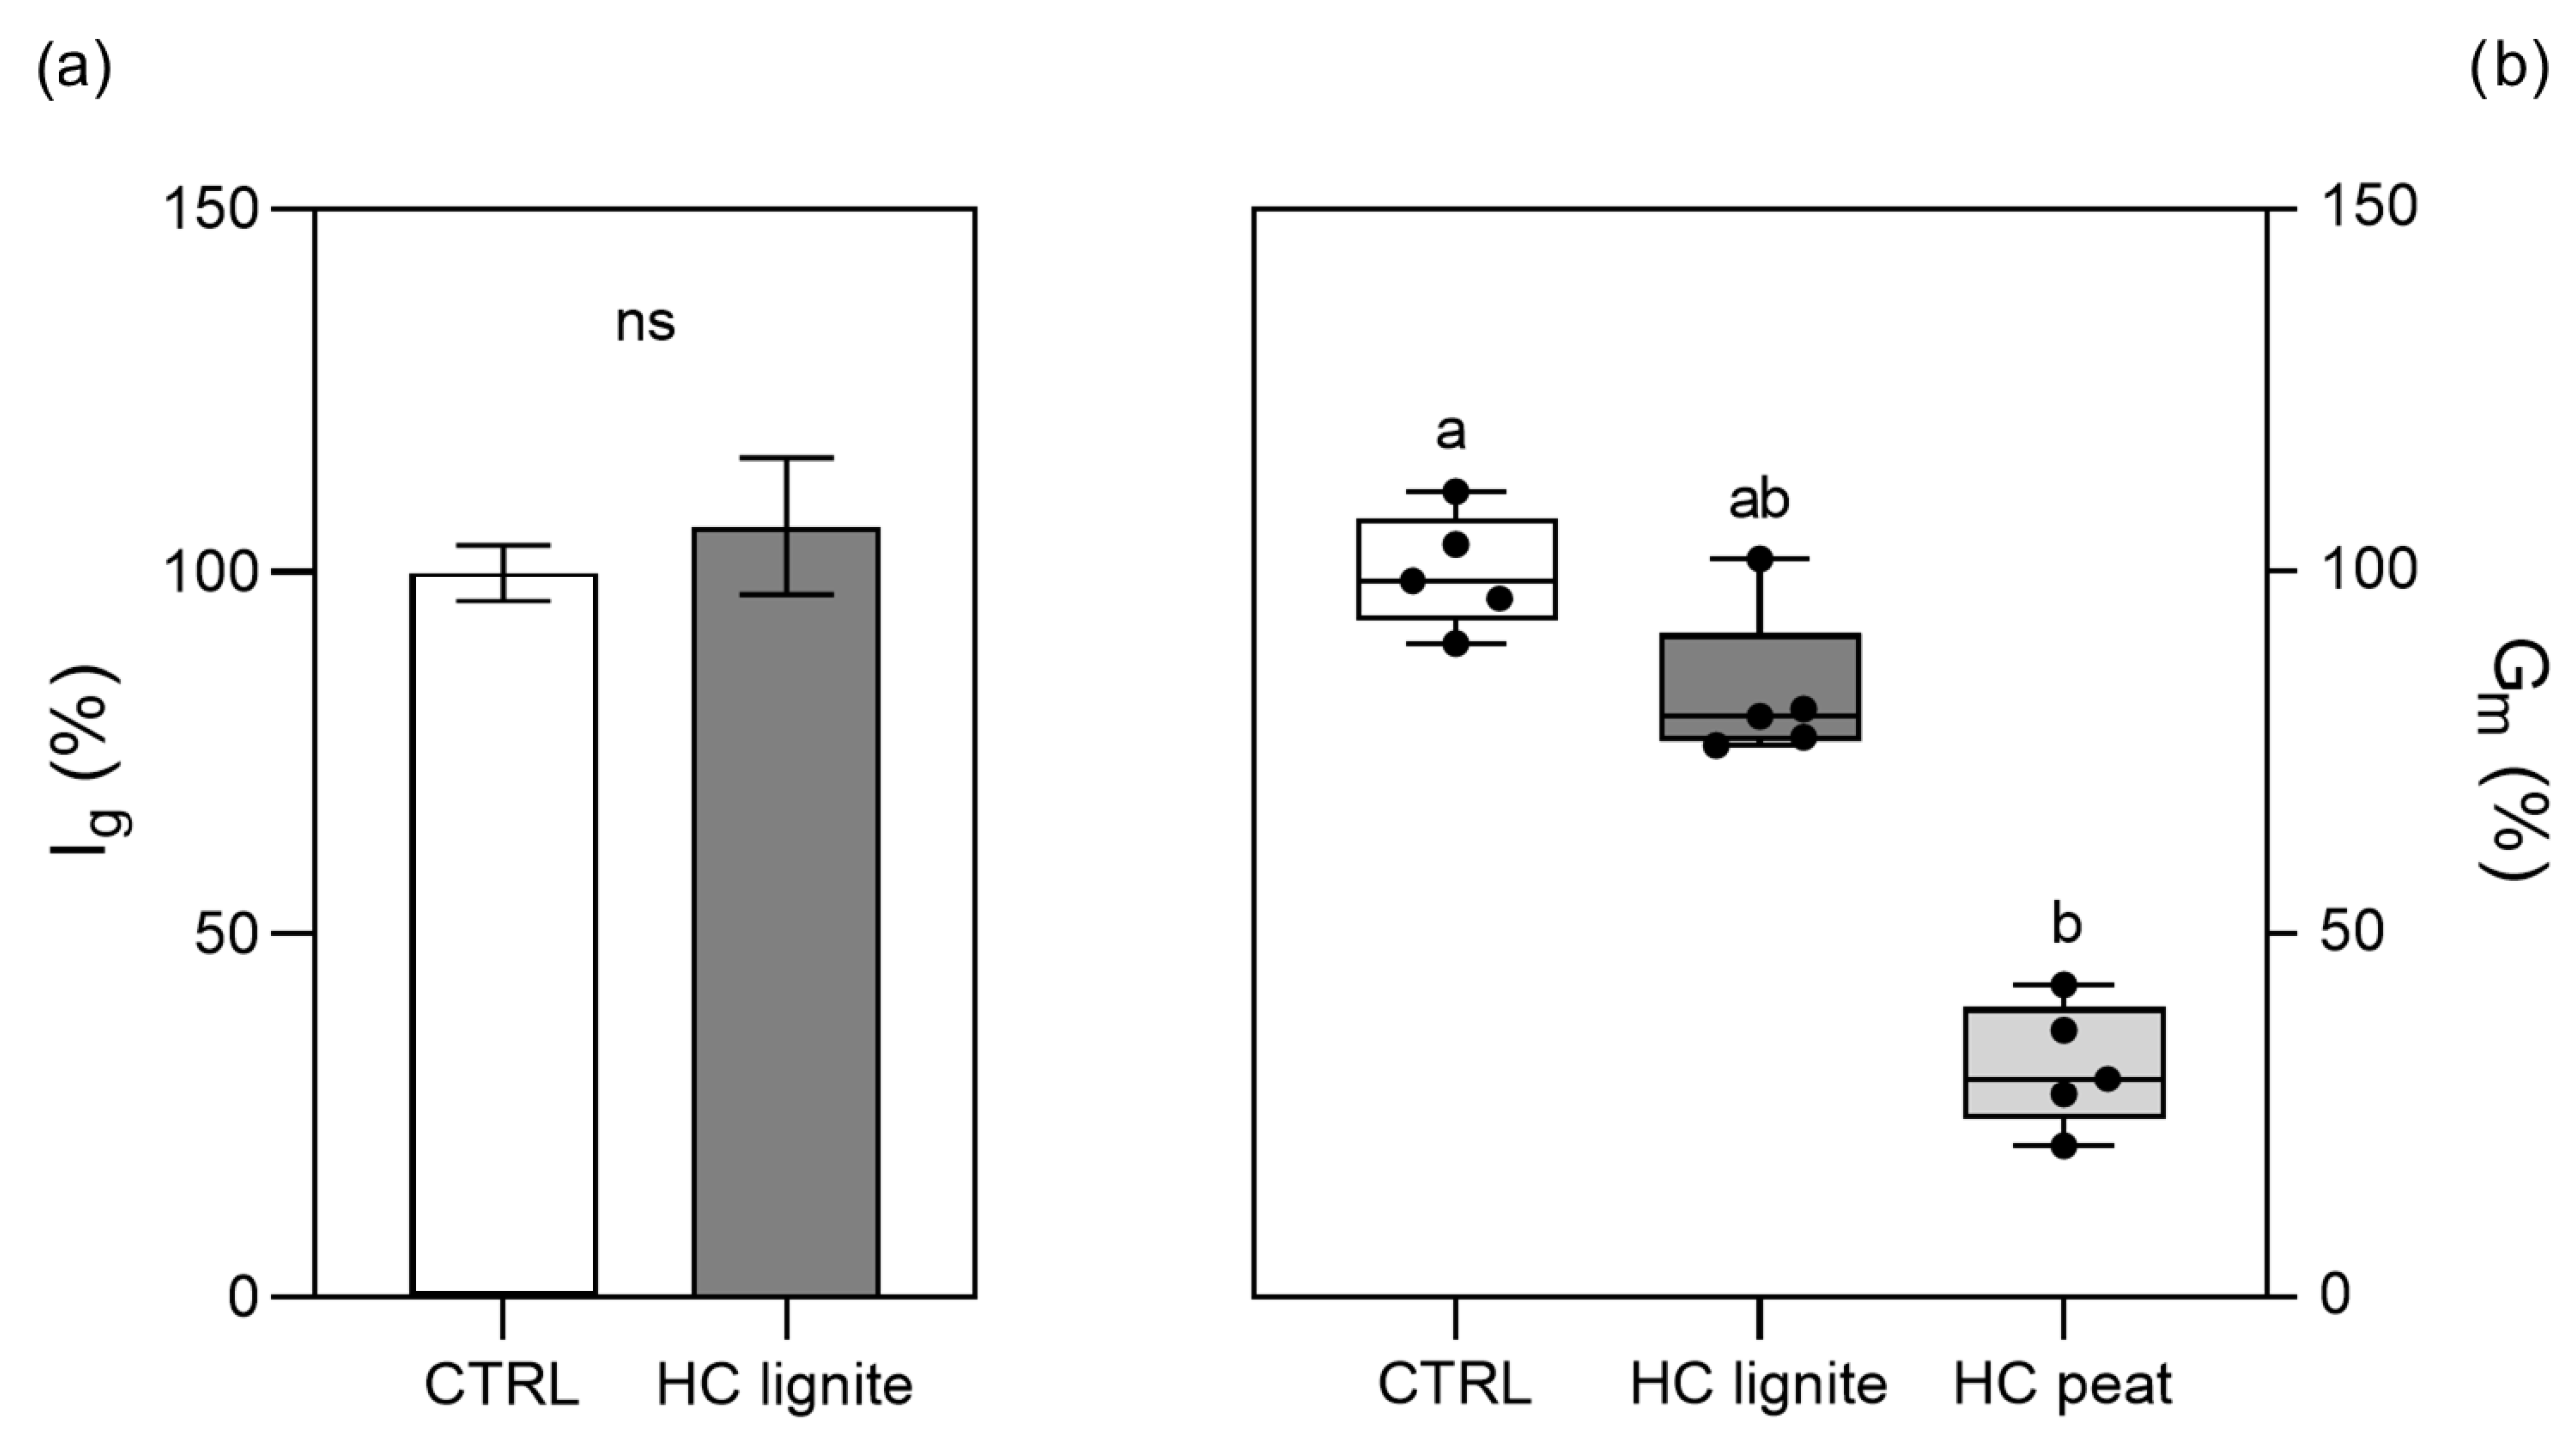

Disclaimer/Publisher’s Note: The statements, opinions and data contained in all publications are solely those of the individual author(s) and contributor(s) and not of MDPI and/or the editor(s). MDPI and/or the editor(s) disclaim responsibility for any injury to people or property resulting from any ideas, methods, instructions or products referred to in the content. |
© 2026 by the authors. Licensee MDPI, Basel, Switzerland. This article is an open access article distributed under the terms and conditions of the Creative Commons Attribution (CC BY) license.