Article

Time-Resolved Analysis of Photovoltaic–Building Energy Matching Using Dynamic Time Warping

by
Arkadiusz Małek
1,*,
Katarzyna Piotrowska
2,
Michalina Gryniewicz-Jaworska
1 and
Andrzej Marciniak
1
1
Department of Transportation and Informatics, WSEI University, Projektowa 4, 20-209 Lublin, Poland
2
Department of Information Technology and Robotics in Production, Faculty of Mechanical Engineering, Lublin University of Technology, 20-618 Lublin, Poland
*
Author to whom correspondence should be addressed.
Energies 2026, 19(4), 1107; https://doi.org/10.3390/en19041107
Submission received: 28 January 2026 / Revised: 13 February 2026 / Accepted: 19 February 2026 / Published: 22 February 2026
(This article belongs to the Special Issue Solar Energy Conversion and Storage Technologies)

Abstract

The increasing share of photovoltaic (PV) generation in building energy systems highlights the importance of understanding not only the magnitude but also the temporal structure of energy mismatch between PV production and building demand. This study proposes a Dynamic Time Warping (DTW)-based framework for the analysis of daily temporal mismatch patterns in a building-integrated photovoltaic system using high-resolution measurement data. Daily temporal signatures are constructed from normalized PV generation and building load profiles, allowing the analysis to focus exclusively on temporal deformation rather than absolute energy values. Pairwise DTW distances are used to construct a distance matrix that captures similarities between daily mismatch structures over an entire month. The resulting DTW distance matrix enables not only pairwise comparison of daily mismatch patterns, but also the identification of representative, transitional, and extreme days through ranking and hierarchical organization of temporal signatures. Hierarchical clustering with average linkage reveals distinct families of days characterized by similar types of temporal deformation, while a ranking based on average DTW distance provides a compact diagnostic summary of monthly variability. The findings demonstrate that PV–building energy matching is inherently time-structured, forming recurrent temporal families of days that cannot be identified using aggregate energy metrics alone. The proposed framework provides a robust diagnostic layer for time-aware energy analysis and supports the development of advanced control and management strategies that explicitly address temporal mismatch in building-integrated photovoltaic systems.

1. Introduction

The dynamic interaction between photovoltaic generation and building electricity demand is inherently governed by temporal relationships that extend beyond instantaneous power balance [1]. While numerous studies have focused on aggregated energy indicators or state-based representations of production and consumption, such approaches often obscure the internal temporal structure of daily operation [2,3]. In particular, days characterized by similar energy states may exhibit fundamentally different temporal arrangements of generation and demand, leading to distinct operational outcomes [4]. Understanding this temporal structure is therefore essential for a comprehensive assessment of photovoltaic–building energy matching [5].
Recent research on photovoltaic (PV) systems and electricity demand analysis clearly indicates that the core challenge in building-integrated PV applications is not solely the amount of energy generated, but the temporal mismatch between PV production and load demand. This mismatch arises from the fundamentally different diurnal and seasonal patterns of solar generation and electricity consumption, which has been repeatedly demonstrated using high-resolution time-series data. Studies focusing on stand-alone and residential PV systems emphasize that PV output typically peaks around midday, while residential and commercial demand often reaches its maximum during evening hours, leading to structural simultaneity issues that cannot be adequately captured using aggregated or average indicators [6]. Consequently, the use of high temporal resolution data (hourly or sub-hourly) has been recognized as a prerequisite for any meaningful assessment of PV–load interactions [7].
Several recent works have addressed PV–load mismatch through system design, sizing, and operational optimization approaches. For example, optimization-based studies have investigated the adjustment of PV panel orientation, tilt angles, and operational strategies to increase self-consumption and self-sufficiency in complex building clusters, such as logistics parks and multi-building facilities [8]. These approaches typically rely on multi-criteria optimization frameworks and performance indicators such as self-consumption ratio, self-sufficiency, and economic cost. While such metrics provide valuable insights into system-level performance, they inherently reduce the underlying time series to scalar indicators, thereby obscuring the temporal structure of the mismatch between generation and demand. Similar limitations are observed in techno-economic and reliability-oriented studies of PV systems, where energy balance equations or probabilistic simulations are used to assess system feasibility, often without explicit analysis of time-series shape similarity or regime structure.
In parallel, a substantial body of literature has focused on short-term load forecasting (STLF) as a means to improve energy management in modern power systems and smart grids. Recent comprehensive reviews highlight a strong shift toward machine learning and hybrid time-series models, including artificial neural networks, recurrent neural networks, long short-term memory (LSTM) architectures, convolutional neural networks, and combinations of statistical decomposition with learning-based predictors [9]. These methods are predominantly designed to minimize forecasting errors, such as RMSE, MAE, or MAPE, and to enhance predictive accuracy over short time horizons. While forecasting-based approaches are essential for operational planning and grid control, they address a fundamentally different research question than that considered in PV–load matching studies. Specifically, forecasting methods aim to predict future values, whereas PV–load matching requires diagnostic analysis of temporal alignment, shape similarity, and recurring operational regimes between two measured time series.
Recent studies on residential and sector-specific electricity demand further underline the importance of preserving temporal variability and intra-day structure. Analyses based on realistic load profiles demonstrate that aggregation or averaging can significantly distort peak timing, load ramps, and variability, leading to biased assessments of PV integration potential [10]. Research on temporal clustering and representative profiles has shown that the way time series are grouped or reduced has a direct impact on conclusions regarding system performance and flexibility [11]. These findings collectively suggest that methods capable of comparing time-series shapes while respecting temporal distortions are particularly well suited for exploring PV–load interactions beyond conventional energy-based metrics.
Against this background, the present study complements existing machine learning, forecasting, and optimization-based approaches by focusing on a model-free, time-alignment-based analysis of PV generation and building load time series. Unlike forecasting-oriented methods or optimization frameworks relying on aggregated indicators, the adopted dynamic time warping (DTW) approach explicitly preserves the temporal structure of both signals and enables the identification of recurrent operating regimes characterized by similar temporal patterns. This perspective is consistent with recent methodological discussions emphasizing the need for time-aware similarity measures in energy data analysis, especially when the objective is to diagnose system behavior rather than predict future demand [12].
Overall, the revised literature context demonstrates that the proposed approach does not compete with machine learning or hybrid forecasting models, but rather addresses a complementary and currently underexplored dimension of PV–load interaction analysis. By situating the study within the broader landscape of PV system optimization, high-resolution demand modeling, temporal clustering [13], and machine learning-based forecasting [14], the contribution of the work is more clearly positioned as a time-series-driven diagnostic framework that enhances interpretability and structural understanding of PV–building energy matching.
Existing approaches to photovoltaic–building energy matching can be broadly grouped into the following methodological categories:
  • Energy-aggregated indicators, such as self-consumption and self-sufficiency ratios, which quantify overall energy balance but ignore temporal ordering.
  • Time-of-use and coincidence metrics, which partially incorporate timing by measuring overlap within predefined windows but do not preserve profile structure.
  • State-based and clustering methods, which identify typical operating regimes from instantaneous power relationships while neglecting sequential dynamics.
  • Conventional time-series similarity measures (e.g., Euclidean distance, correlation), which require strict temporal alignment and are sensitive to time shifts.
  • Feature-based and transform-domain methods, which compare global shape characteristics but often lose direct time-domain interpretability.
  • Elastic alignment techniques such as Dynamic Time Warping, which allow nonlinear temporal alignment of daily profiles but are commonly reduced to scalar distance measures.
Despite this methodological diversity, existing studies rarely exploit the internal structure of time-series alignment to analyze when and how temporal mismatch between photovoltaic generation and building demand arises. In particular, DTW cost accumulation and warping paths remain underutilized as diagnostic tools for time-resolved energy analysis [15]. A detailed discussion of methodological choices and their relation to existing approaches is provided in Section 2, where relevant literature is reviewed in the context of data representation and time-series analysis.
Recent work has demonstrated that Dynamic Time Warping provides a robust framework for comparing daily photovoltaic and load profiles by explicitly accounting for nonlinear time shifts [16]. By aligning entire time series rather than individual operating points, DTW enables the identification of temporal similarity and mismatch that remain invisible to conventional clustering-based analyses [17]. However, most existing applications of DTW in the energy domain have focused on pairwise comparisons or global similarity measures without investigating the internal structure that emerges when DTW is applied systematically across multiple days [18].
In particular, the interpretation of DTW distance values is often limited to their magnitude, while the underlying cost accumulation and optimal warping paths remain unexplored [19]. These elements carry valuable information regarding when and how temporal mismatch arises within a day [20]. Similarly, the organization of daily profiles into natural groups based on DTW similarity has received limited attention, despite its potential to reveal recurring temporal patterns and families of operational behavior [21].
This study addresses these gaps by examining the temporal structure of photovoltaic–building energy matching at the monthly scale using Dynamic Time Warping. Focusing on a single month of high-resolution measurement data, the analysis goes beyond similarity ranking to investigate DTW cost matrices, optimal warping paths, and hierarchical relationships between daily profiles. By treating days as structured temporal objects rather than collections of independent states, the proposed approach reveals patterns of temporal organization that cannot be inferred from state-based analyses alone.
The contribution of this work lies in the methodological deepening of DTW-based energy analysis, emphasizing interpretability and structural insight rather than algorithmic novelty. The results demonstrate how temporal families of days emerge from DTW similarity relationships and how these structures relate to dynamic energy matching in photovoltaic–building systems. The findings provide a foundation for extending time-aware analysis to longer periods and support the development of advanced energy management strategies that explicitly account for temporal dynamics.

2. Materials and Methods

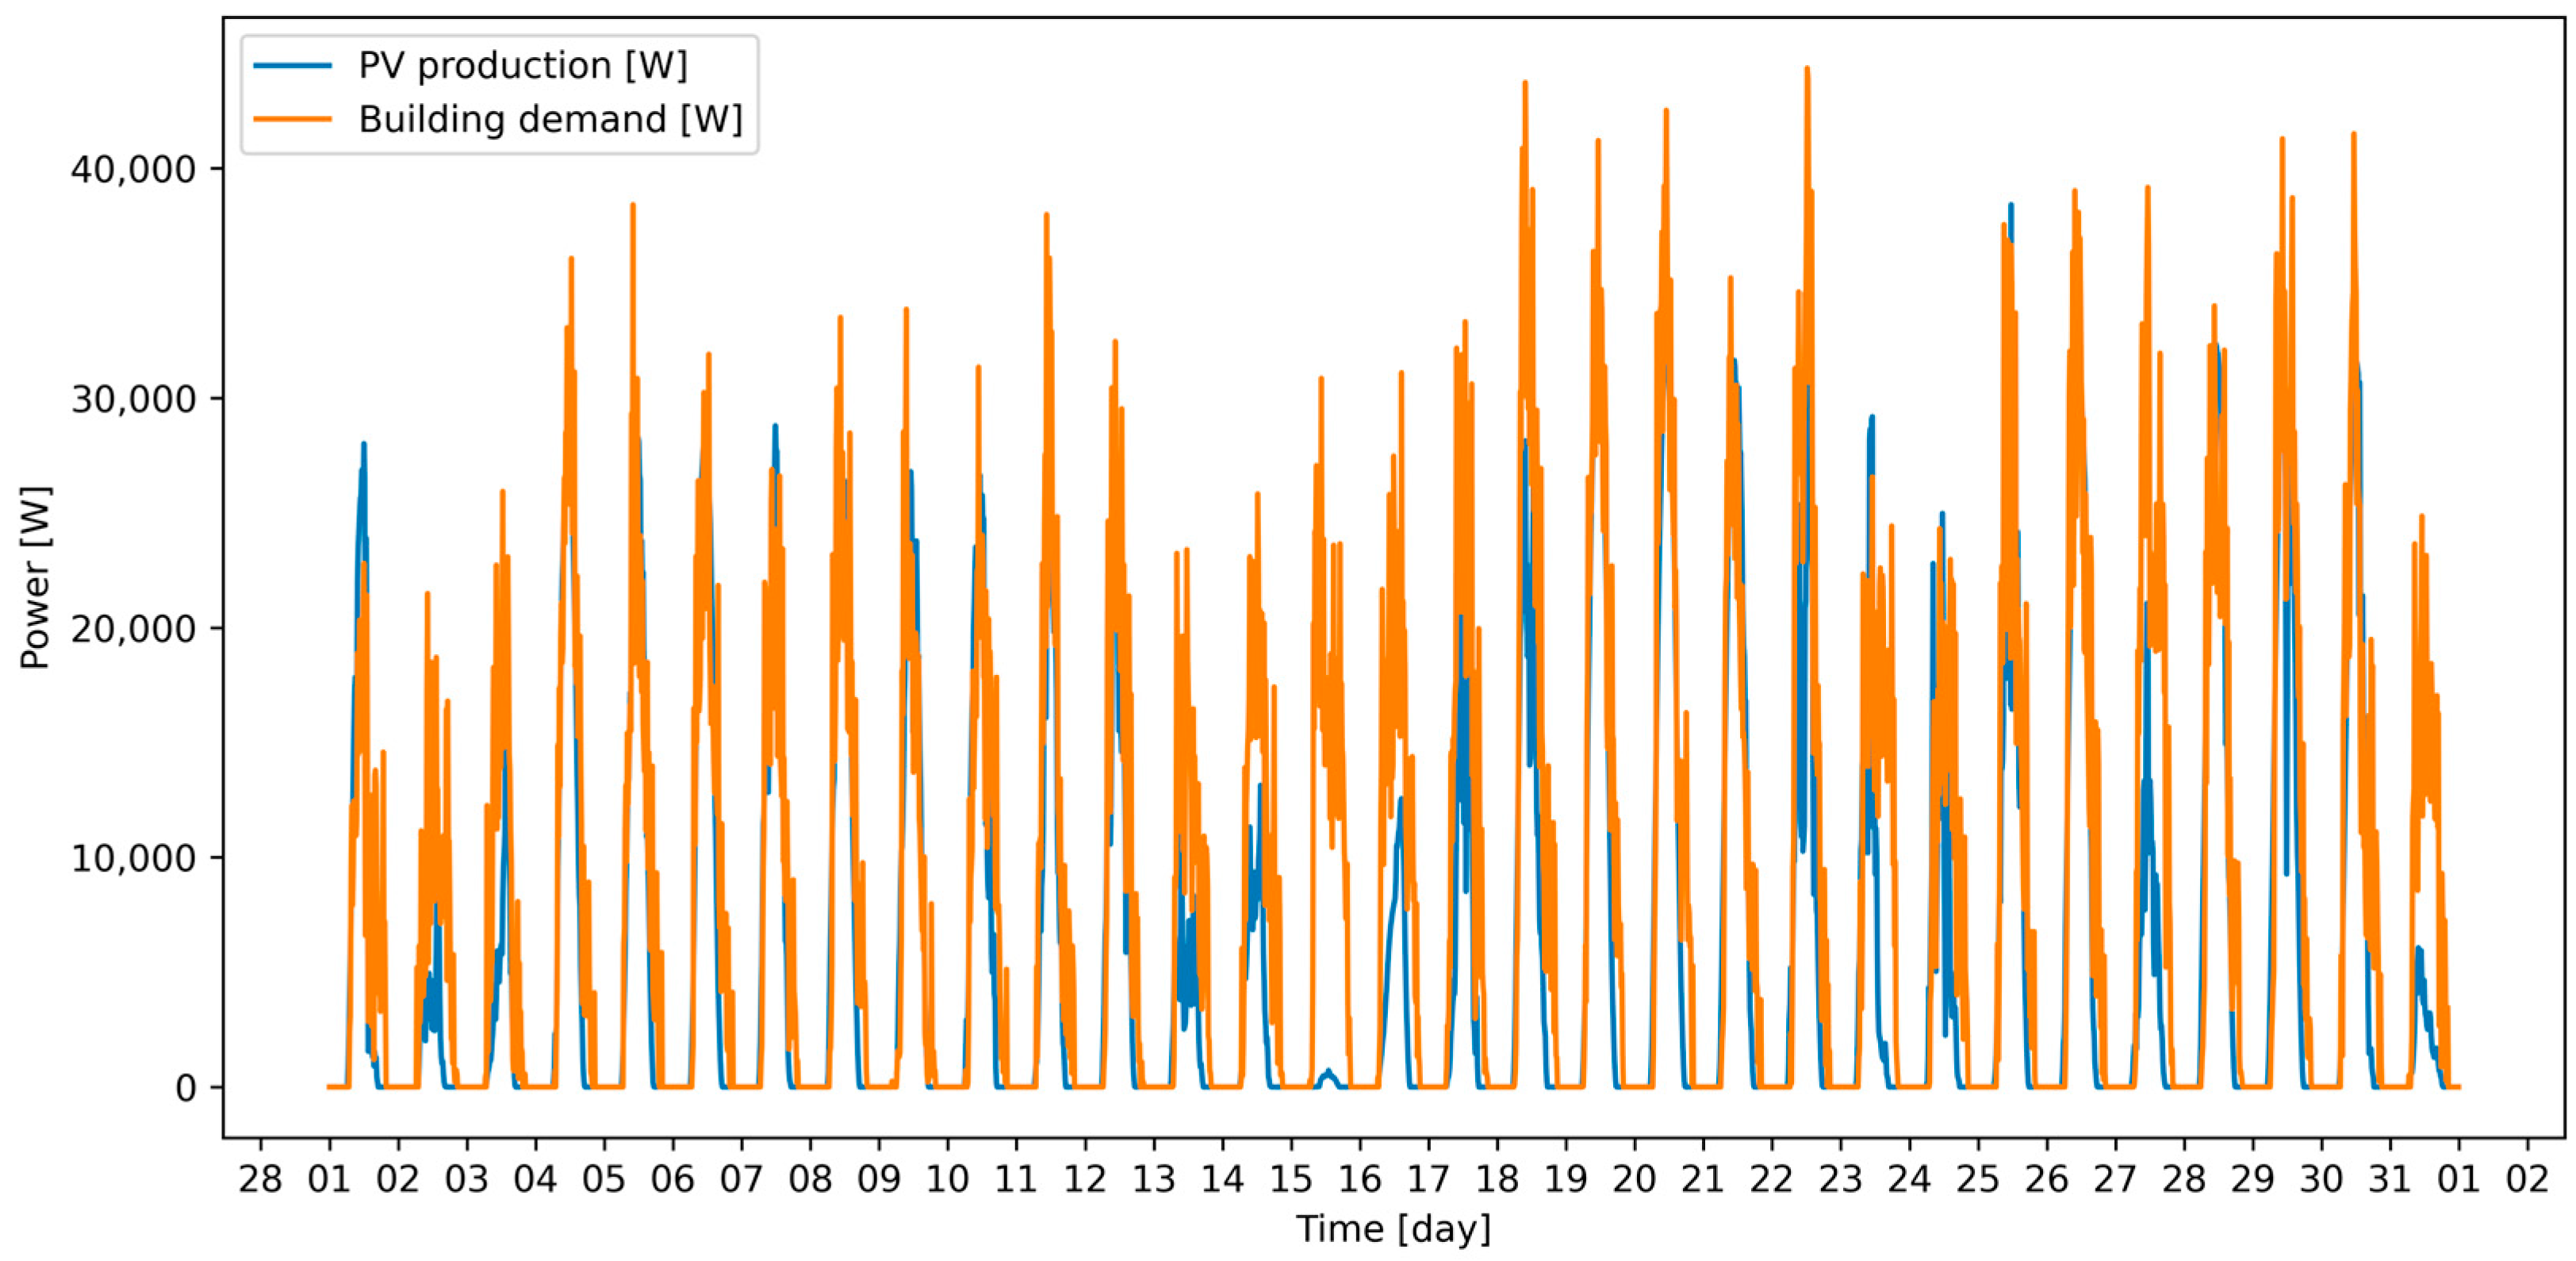
The analysis is based on high-resolution measurement data acquired from a building-integrated photovoltaic installation supplying an administrative building. The dataset covers the entire month of March 2025 and consists of synchronized time series of photovoltaic power generation and total building electricity demand. Measurements were recorded at a constant 15 min resolution, resulting in 96 samples per day. This temporal granularity allows for a detailed representation of daily operational dynamics while remaining suitable for computationally intensive similarity analysis. Figure 1 presents the complete March time series of photovoltaic production and building demand. The visual comparison clearly shows periods of strong temporal alignment as well as intervals of pronounced mismatch, which can be qualitatively assessed without any numerical processing. This direct, time-resolved perspective allows the reader to immediately grasp the degree of temporal synchronization between PV generation and building load and motivates the subsequent DTW-based analysis that quantifies these visually observable patterns.
The photovoltaic system and the university’s administrative building were thoroughly described as the objects of investigation in an earlier article published by the authors. That work provides a detailed characterization of the power generation and consumption profiles, as well as a comprehensive description of the measurement data acquisition and processing procedures [22]. The analyzed photovoltaic system is a rooftop installation with a nominal peak power of 50 kWp, installed on the roof of an administrative university building in Lublin, Poland, and commissioned in early 2023. The system consists of 108 monocrystalline photovoltaic panels mounted on a flat roof at a tilt angle of 15°, arranged in two azimuthal orientations (east–south-east and south–south-west) to broaden the daily generation profile. Electricity production is monitored at 15 min intervals using a three-phase inverter equipped with IoT functionality and individual power optimizers, while building electricity demand is recorded simultaneously by a smart metering system. The building represents a typical daytime-operated administrative facility with pronounced diurnal load variability, characterized by negligible nighttime consumption and demand peaks during working hours, which makes it suitable for high-resolution analysis of PV–load temporal mismatch.
March 2025 was selected as a focused case study due to its pronounced temporal variability [23]. During this period, the length of the daylight window increases significantly, and photovoltaic generation exhibits substantial day-to-day variation driven by changing meteorological conditions. At the same time, the operational schedule of the building remains relatively stable, providing a controlled setting for investigating temporal alignment and mismatch [24]. This combination makes the month particularly well suited for revealing internal temporal structure using DTW.
For each day, photovoltaic generation and building demand were represented as paired time series spanning a 24 h period [25]. Days with incomplete measurements were excluded to ensure consistent sequence length across the dataset. Prior to DTW computation, each daily profile was independently normalized to remove the influence of absolute power levels and emphasize temporal structure. This preprocessing step ensures that the similarity analysis focuses on the timing and shape of daily profiles rather than their magnitude.
Dynamic Time Warping was applied to pairs of daily profiles using a standard cumulative cost formulation with absolute pointwise distance as the local cost measure. No temporal aggregation or feature extraction was performed, and the original sampling resolution was preserved. This choice allows the DTW cost matrix and optimal warping paths to directly reflect the temporal evolution of generation and demand within each day [26]. The DTW algorithm was implemented using the classical dynamic programming formulation. For two discrete time series, A = (a1, a2,…, an) and B = (b1, b2,…, bm), the local distance matrix d(i,j) = |aibj| was computed using the Euclidean metric. The optimal warping path W = (w1, w2,…, wk) minimizing the cumulative cost D(A,B) was determined recursively as
D(i,j) = d(i,j) + min{D(i − 1,j), D(i,j − 1), D(i − 1,j − 1)}
Prior to DTW computation, both PV generation and load time series were normalized to unit maximum to ensure scale invariance and to focus the analysis on temporal shape rather than absolute magnitude. No global warping window constraint (e.g., Sakoe–Chiba band) was imposed, allowing flexible temporal alignment and enabling the identification of intra-day phase shifts between generation and demand. This configuration was selected intentionally to support diagnostic analysis of temporal mismatch rather than predictive modeling or classification. The absence of a warping window increases alignment flexibility but does not affect the physical interpretability of the results, as the warping paths remain constrained by the diurnal structure of both time series.
The resulting dataset consists of a complete set of daily temporal objects suitable for DTW-based similarity analysis, cost accumulation inspection, and hierarchical organization. This representation forms the basis for the subsequent investigation of DTW cost matrices, optimal warping paths, and the emergence of temporal families of daily energy profiles [27].
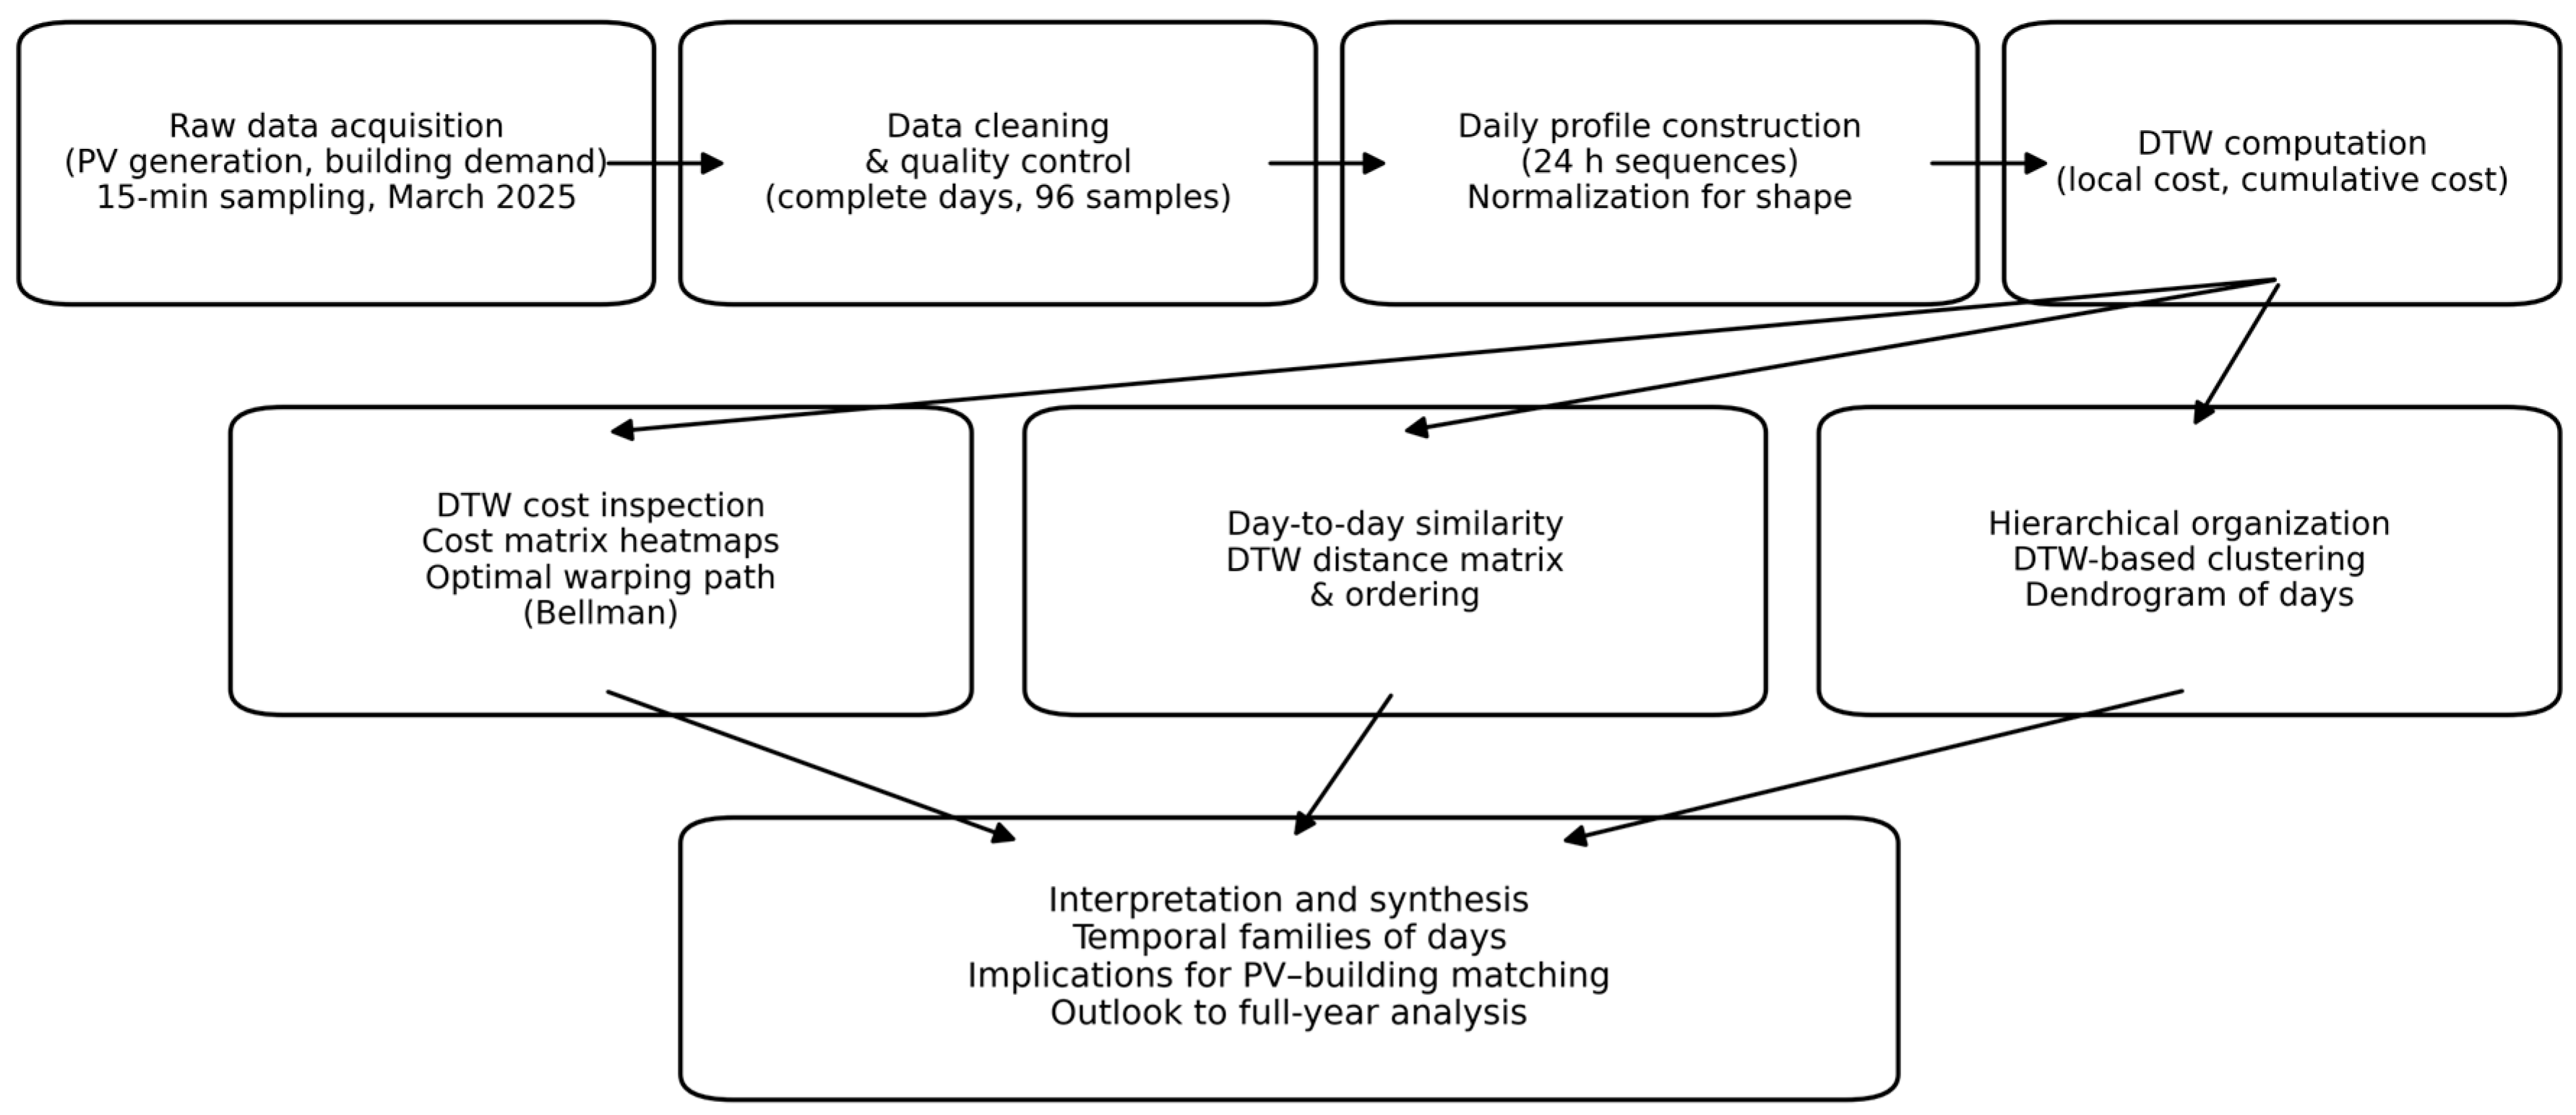
A data flow diagram containing DTW-based analysis of temporal PV-Building energy matching is shown in Figure 2.
All calculations and visualizations were performed in Python 3.11 using the pandas, numpy, matplotlib, and scipy libraries, ensuring high precision of numerical calculations and reproducibility of results. The resulting time series, graphs, and DTW distance matrices formed the basis for further comparative analysis and interpretation of the complementarity. For clarity and reproducibility, the complete DTW-based analysis workflow (computational algorithm) is summarized in the form of step-by-step pseudocode provided in Appendix A.

3. Results

3.1. DTW Cost Matrix and Optimal Warping Paths

Dynamic Time Warping compares two daily profiles by constructing a cumulative cost surface that quantifies the mismatch between all pairs of time indices and then extracting the minimum-cost alignment path through this surface [28]. In the present context, each day is represented as a 24 h sequence at 15 min resolution, and the DTW formulation enables nonlinear temporal alignment between PV generation and building demand when characteristic features occur at different times. The local cost is computed pointwise between the two sequences, and the cumulative cost matrix is obtained through dynamic programming recursion, in which the optimal accumulated cost at each cell is the local mismatch plus the minimum of the three admissible predecessor states [29]. This recursion corresponds to the Bellman optimality principle and guarantees that the final DTW distance results from a globally optimal path that respects monotonicity and continuity constraints [30].
The resulting cumulative cost matrix provides more information than the final DTW distance alone [31]. Its spatial structure reveals where mismatches are concentrated and how the algorithm compensates for local time shifts. In regions where the profiles evolve similarly, the cumulative cost increases slowly and the optimal path remains close to the diagonal, corresponding to near-synchronous alignment of the two sequences [32]. Conversely, when the timing of key events differs—such as a delayed demand peak relative to PV production—the cost surface develops elongated low-cost corridors away from the diagonal, and the optimal path deviates accordingly. Vertical or horizontal segments of the warping path indicate local stretching, where multiple samples of one sequence are aligned to a single sample of the other, reflecting compression or dilation of time required to achieve the best match [33].
To enhance interpretability, the DTW mechanism can be illustrated for a representative day exhibiting pronounced temporal mismatch [34]. For such a day, the cost matrix heatmap highlights the regions of dominant mismatch and the emergence of an optimal alignment corridor, while the overlaid warping path explicitly shows how the profiles are matched under nonlinear time shifts [35]. Importantly, this visualization makes it possible to identify which parts of the day contribute most to the overall DTW distance [36], thereby linking the numerical similarity measure to physically meaningful temporal phenomena in PV–building interaction. In addition, the same formulation applied across all day pairs yields a day-to-day DTW distance matrix that supports higher-level structural analyses, including the identification of temporally similar day families and outliers.
The DTW cost matrix and optimal warping paths provide a mechanistic and interpretable view of temporal energy matching. They move the analysis beyond ranking days by similarity by revealing where temporal mismatch originates and how it is resolved by the optimal alignment. This constitutes a key methodological advantage over state-based approaches, which can describe instantaneous operating regimes but cannot expose the internal temporal structure that governs PV–building energy interactions within a day.

3.2. Daily Analysis

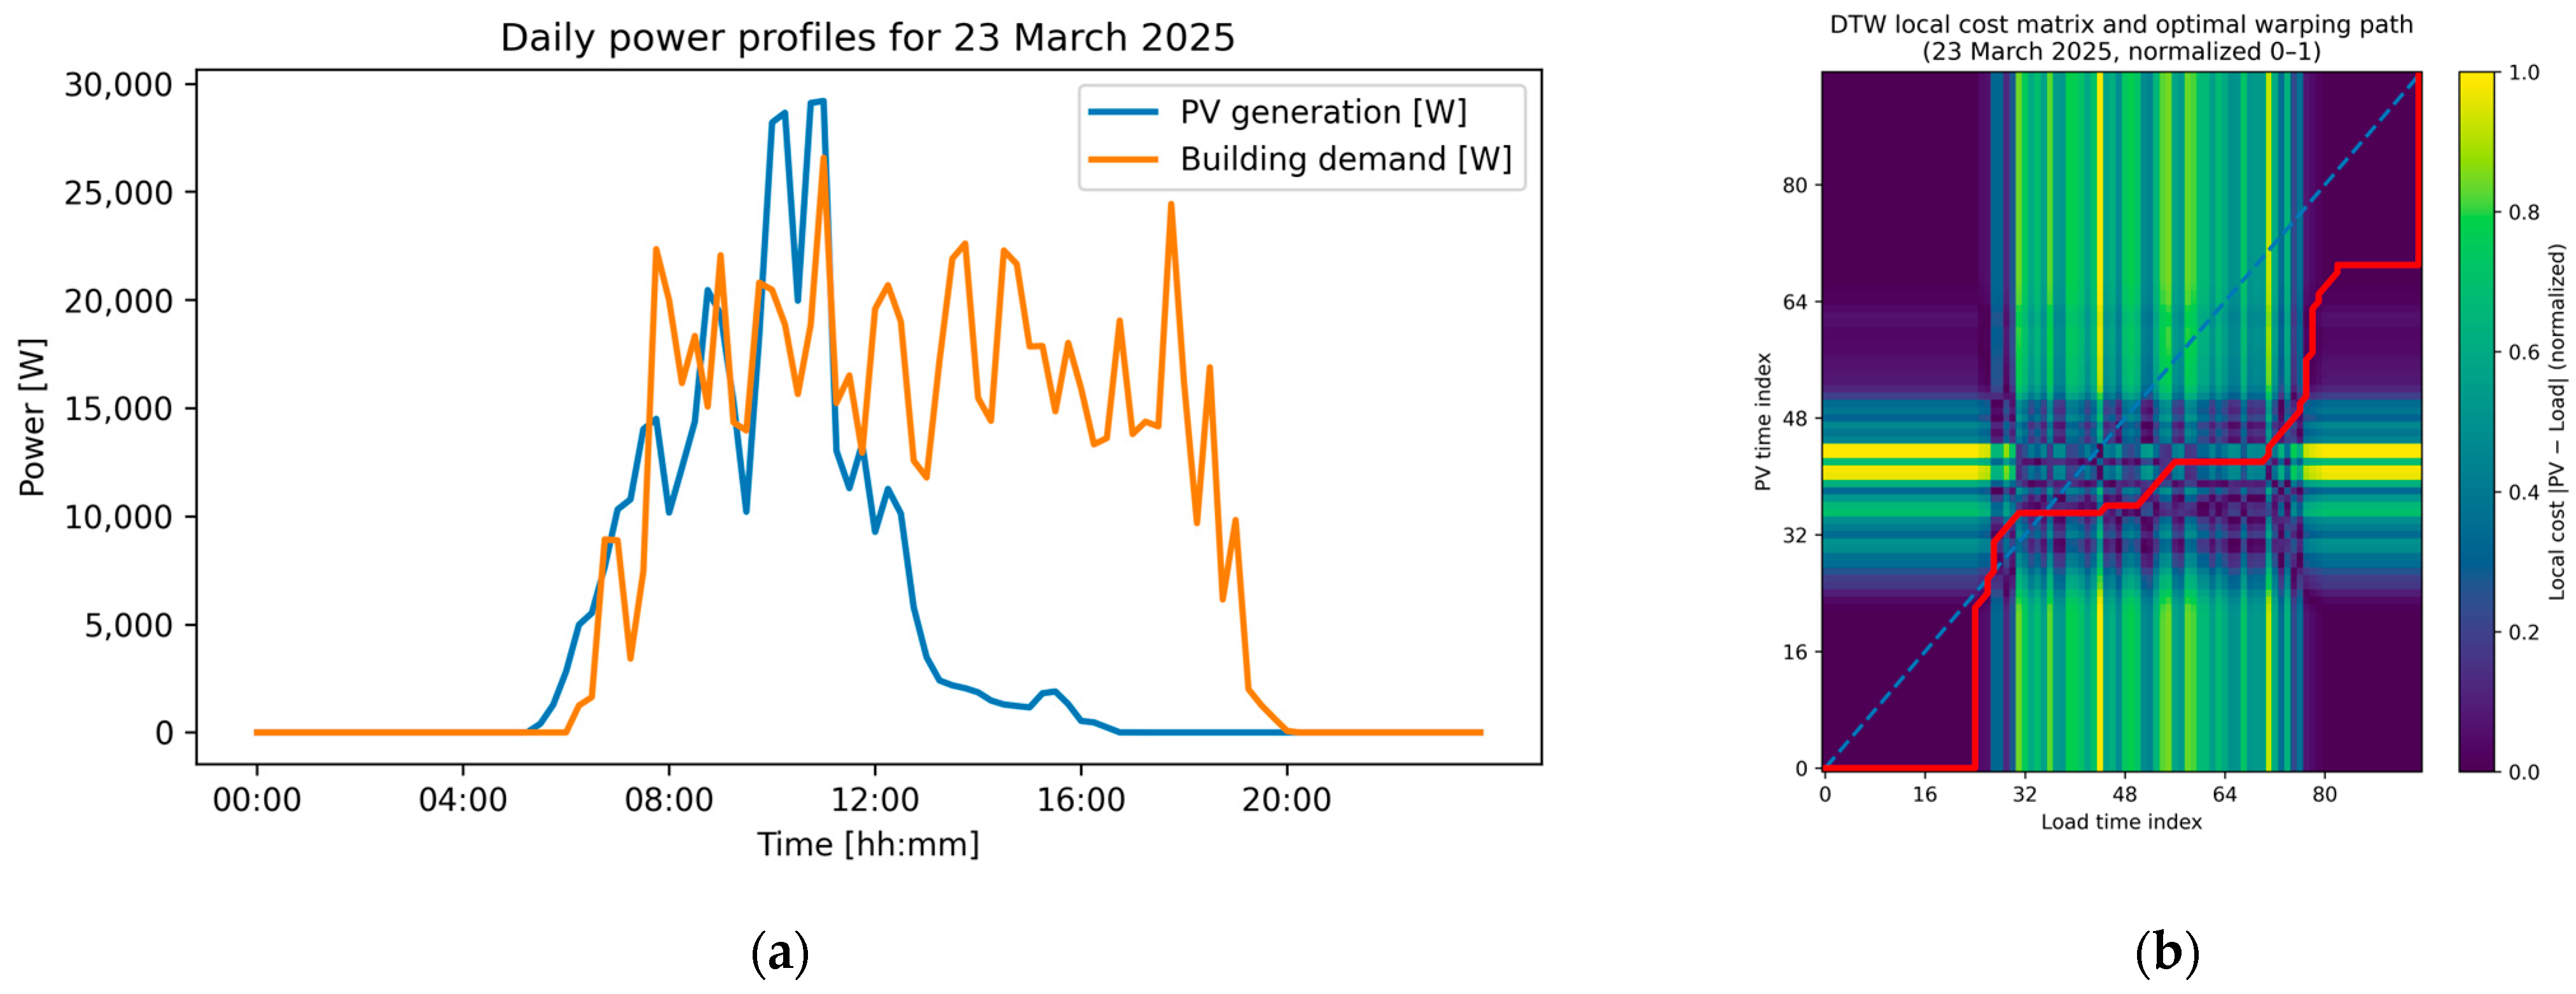
Figure 3 presents the Dynamic Time Warping local cost matrix computed for photovoltaic generation and building electricity demand on 23 March 2025. Each cell of the heatmap represents the absolute pointwise mismatch between the normalized PV and load profiles at corresponding time indices. The overlaid curve indicates the optimal warping path obtained from the cumulative cost matrix using the Bellman optimality principle [37]. Regions where the path follows the main diagonal correspond to near-synchronous evolution of generation and demand [38]. Pronounced deviations from the diagonal reveal temporal mismatch, where time stretching or compression is required to align characteristic features of the profiles. Vertical and horizontal segments of the path indicate local accumulation of mismatch driven by shifts in peak timing. The figure illustrates how DTW captures the internal temporal structure of PV–building energy matching beyond a single scalar distance value.
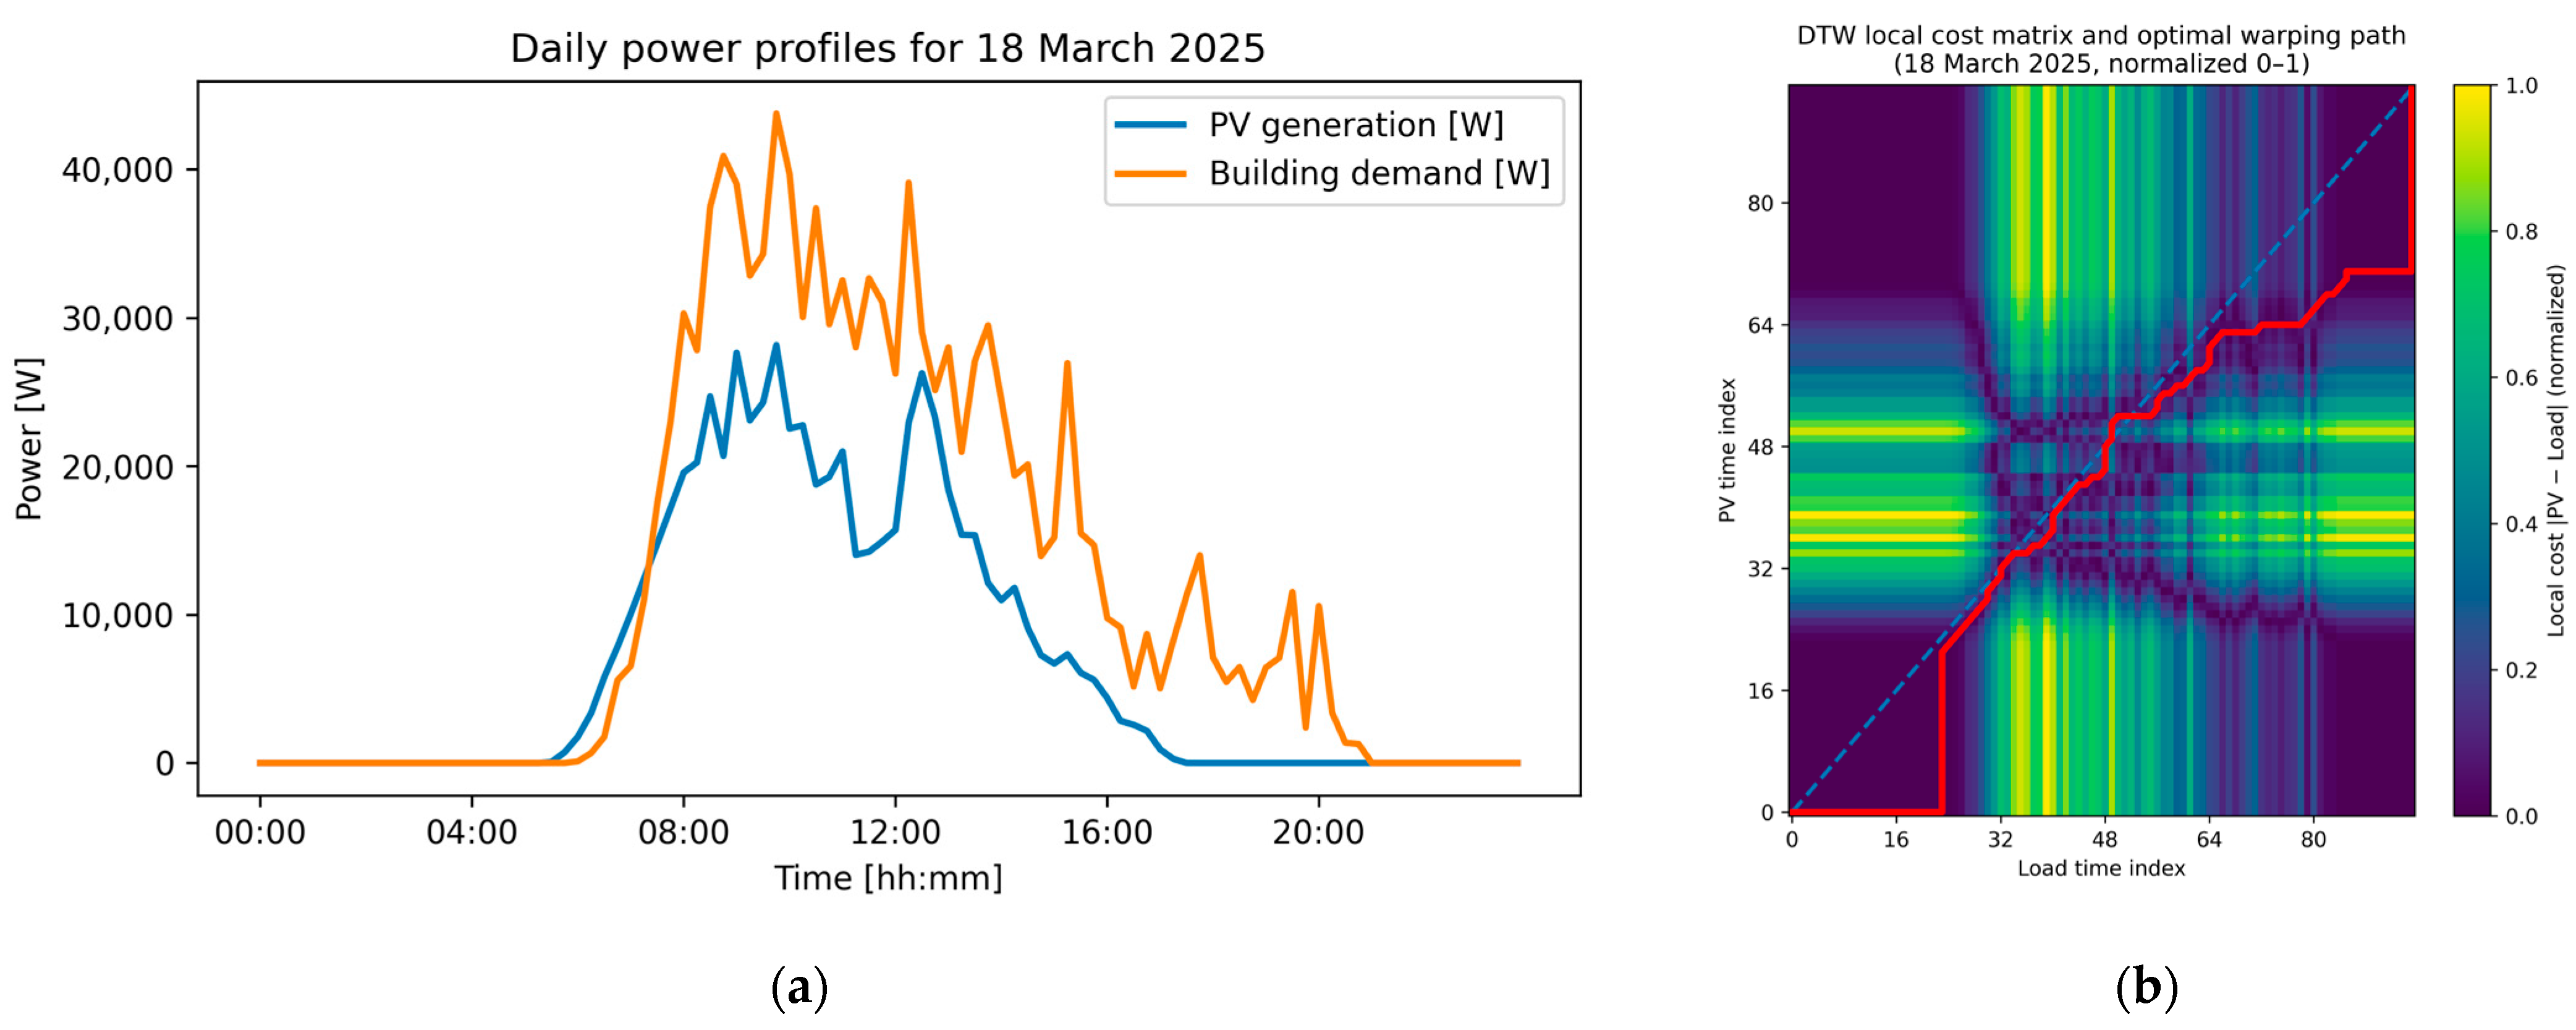
A direct comparison of 18 March (see Figure 4) and 23 March further illustrates how temporal alignment influences DTW-based similarity assessment. Although both days exhibit comparable ranges of photovoltaic generation and building demand, their temporal organization differs markedly. For 18 March, the daily time series show a closer alignment between the main phases of PV production and variations in building demand, particularly during the ramp-up and mid-day periods. This temporal coherence is reflected in a lower DTW distance, indicating that only limited nonlinear time adjustment is required to align the two profiles. The corresponding DTW path remains relatively close to the main diagonal of the cost matrix, suggesting near-synchronous evolution of the two sequences with moderate local stretching. In contrast, the profiles recorded on 23 March display pronounced shifts in the timing of key features, leading to extended deviations of the optimal warping path from the diagonal. These deviations correspond to longer vertical and horizontal segments in the path, indicating stronger temporal compression and dilation. As a result, the cumulative DTW cost for 23 March is significantly higher, demonstrating a weaker temporal match despite apparent similarity in instantaneous operating states.
The days shown in Figure 3 and Figure 4 are representative examples selected based on their position in the monthly DTW distance ranking. It should be noted that the DTW alignment shown in Figure 3b and Figure 4b is used only for illustrative within-day comparison between PV production and building demand. The DTW-based monthly analysis presented in the following sections is performed between daily mismatch signatures, not directly between PV and load profiles.
This case study contrasts two representative days, 18 March and 23 March, in order to illustrate how different degrees of temporal mismatch are reflected in both time-domain behavior and DTW-based metrics. The daily power profiles for 18 March exhibit a moderate level of temporal misalignment, with the main phases of photovoltaic generation and building demand occurring in broadly similar time windows. This partial synchrony results in a relatively low DTW distance and a warping path that remains close to the main diagonal of the cost matrix, indicating limited temporal stretching. In contrast, the profiles recorded on 23 March display a strong temporal mismatch, with key features such as ramps and peak periods shifted more substantially in time. This behavior leads to a higher DTW distance and pronounced deviations of the optimal warping path from the diagonal. The extended vertical and horizontal segments observed for 23 March indicate stronger local compression and dilation of time required to align the two sequences. Although both days may appear comparable in a state-based representation, their temporal organization differs fundamentally. The comparison demonstrates how DTW reveals degrees of temporal mismatch that are not accessible through instantaneous operating states alone. These two cases together provide a clear and interpretable illustration of the mechanisms underlying DTW-based assessment of photovoltaic–building energy matching.

3.3. Monthly Analysis

In the monthly analysis, each day was represented by a normalized temporal signature defined as the difference between photovoltaic generation and building electricity demand profiles. This representation emphasizes the internal temporal structure of PV–building matching within a day rather than the absolute magnitude of production or consumption. Dynamic Time Warping was then applied to these daily signatures to compute pairwise day-to-day distances, yielding a DTW distance matrix that reflects similarity in the temporal organization of mismatch patterns. As a result, the subsequent ranking and hierarchical clustering capture relationships between days based on how PV generation and demand evolve relative to each other in time, rather than on similarity of individual PV or load profiles. This formulation allows structurally similar days with different absolute energy levels to be grouped together, while days with comparable energy balances but distinct temporal arrangements remain separated.
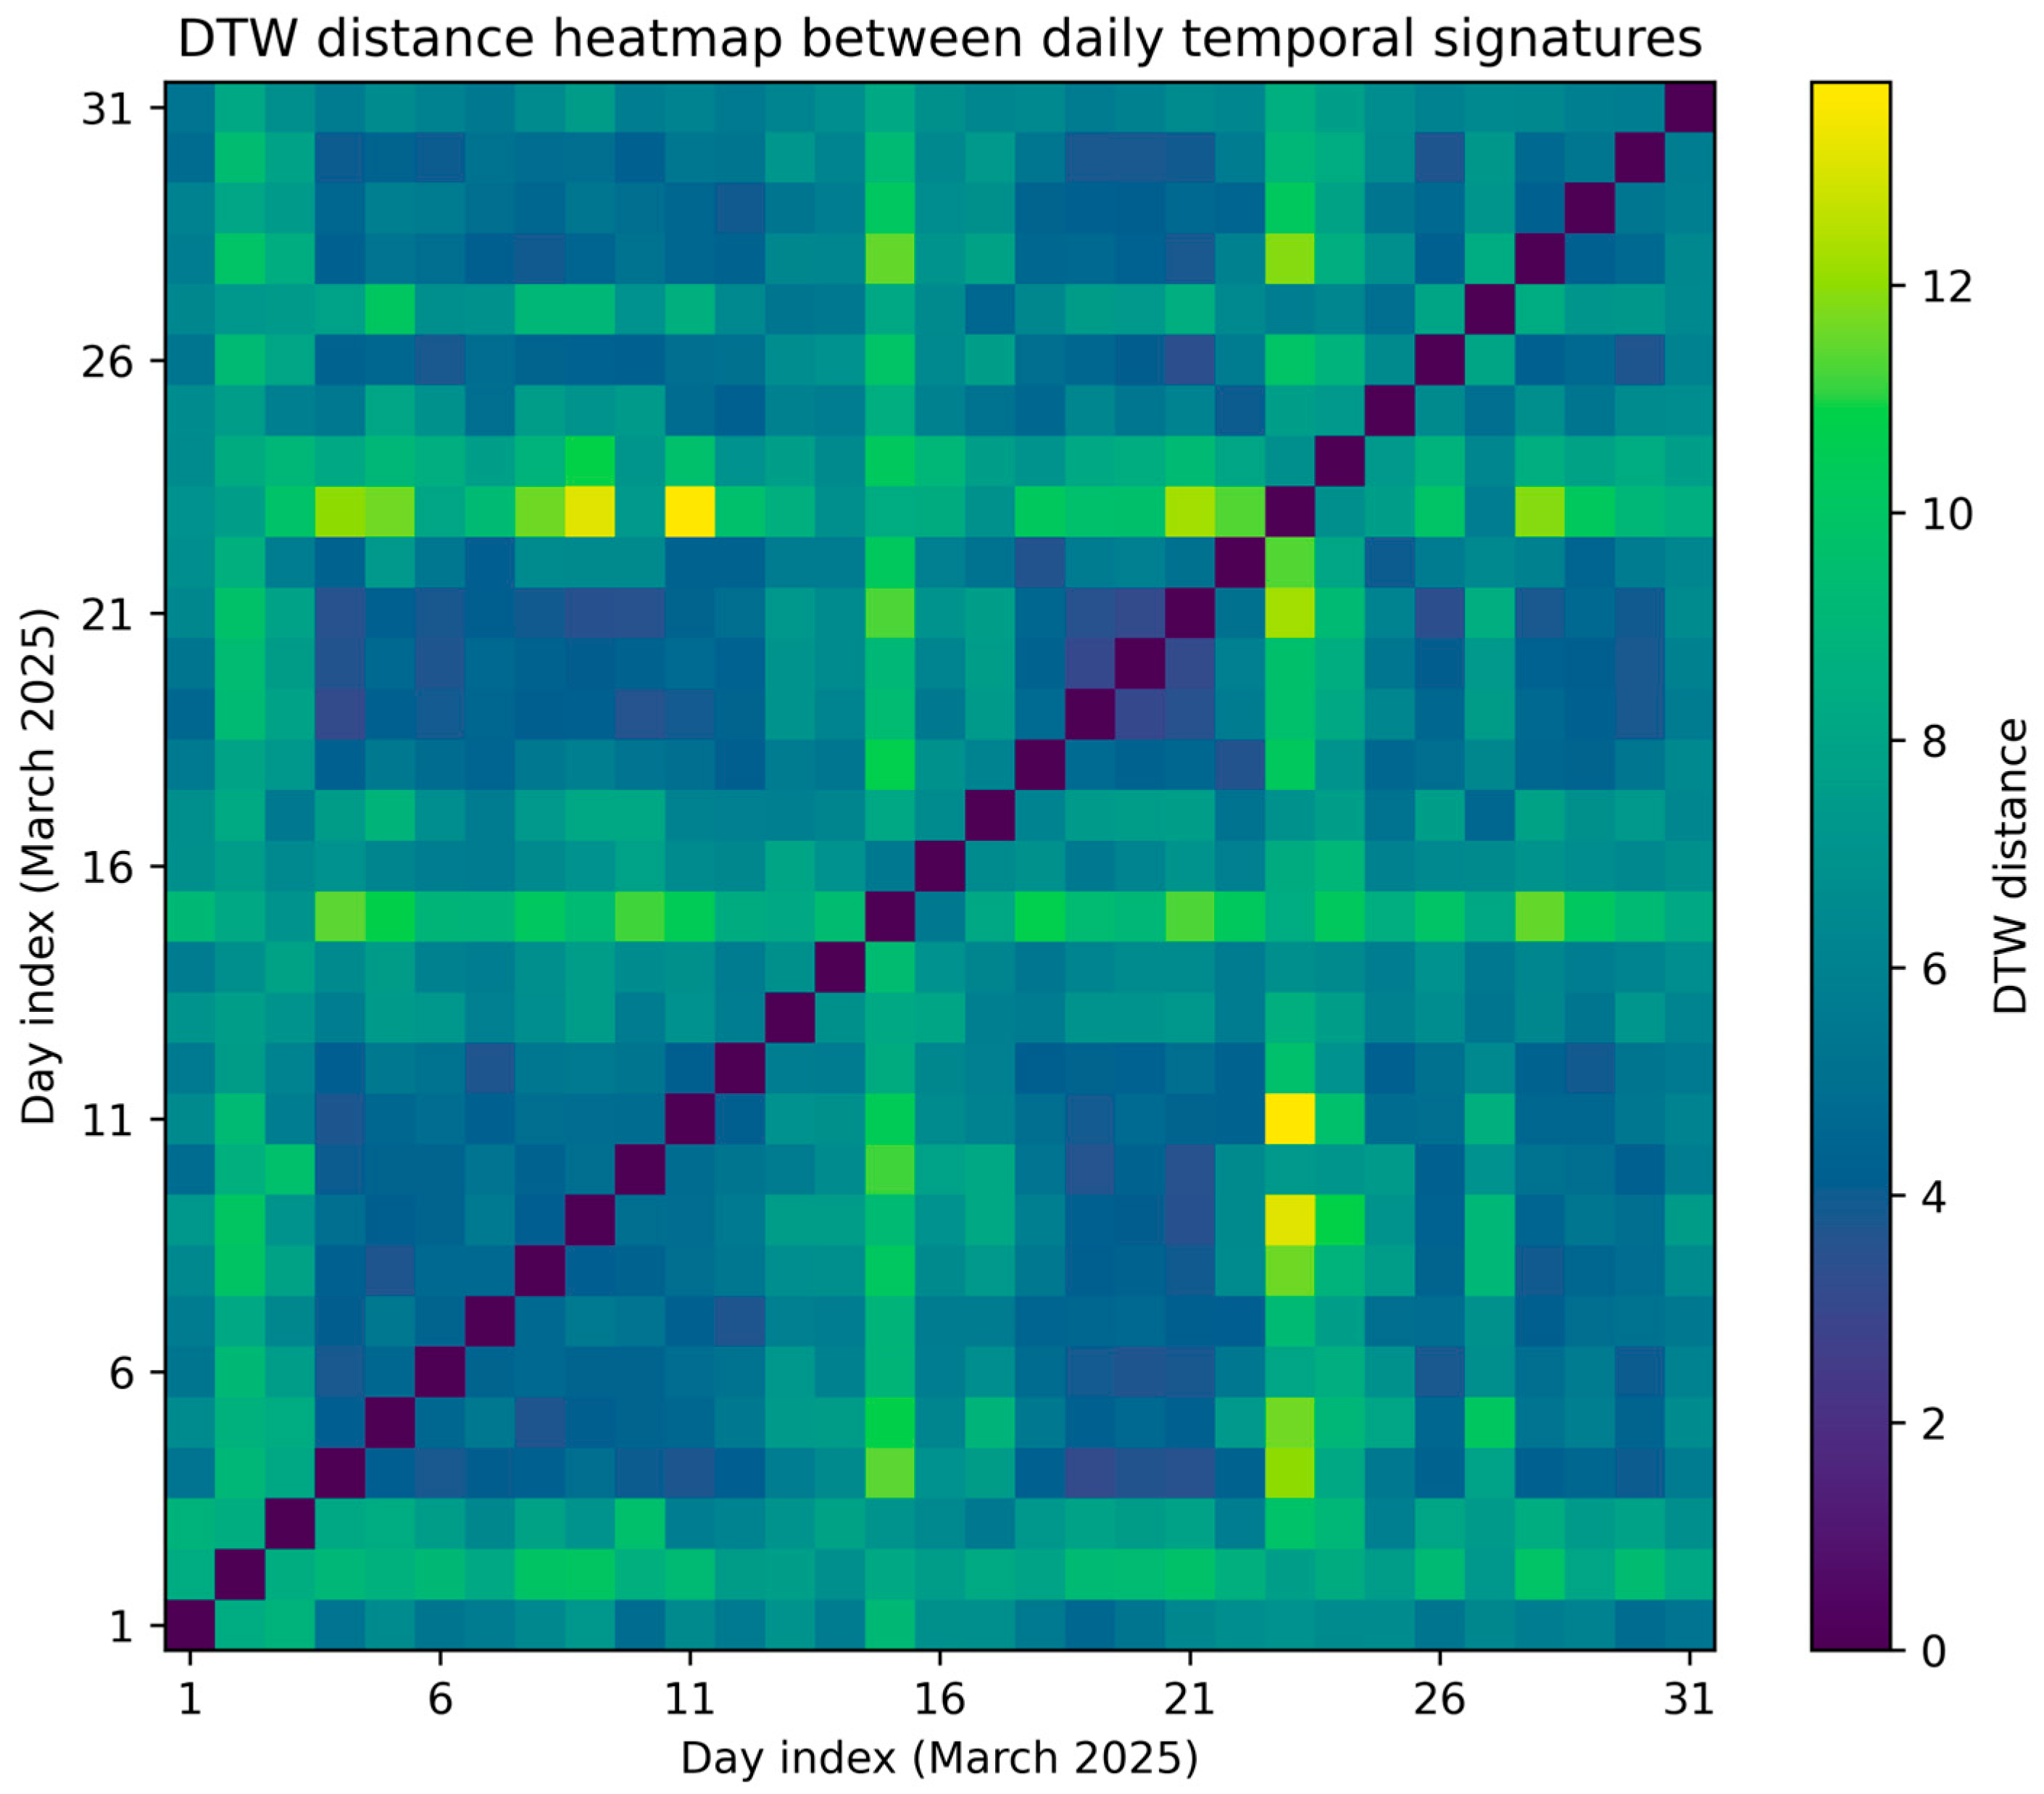
Figure 5 presents the Dynamic Time Warping distance matrix computed for all days of March 2025 based on normalized PV–load difference profiles. Each matrix element represents the DTW distance between two days, quantifying the similarity of their temporal mismatch structures. It should be emphasized that DTW is not applied directly between PV and load profiles within a single day; instead, each day is first transformed into a normalized mismatch signature, and the DTW distance is then computed between these daily signatures across different days. Lower distance values indicate days with comparable temporal organization of photovoltaic generation relative to building demand, while higher values correspond to structurally different mismatch patterns. The matrix reveals a heterogeneous structure, with visible blocks of lower distances suggesting the presence of natural groups of temporally similar days. These groupings are not strictly ordered by calendar date, indicating that temporal matching patterns are driven by operational and environmental factors rather than simple chronological proximity. The symmetry of the matrix confirms the consistency of the distance definition. Overall, the heatmap provides a compact overview of the temporal diversity of PV–building energy matching throughout the month.
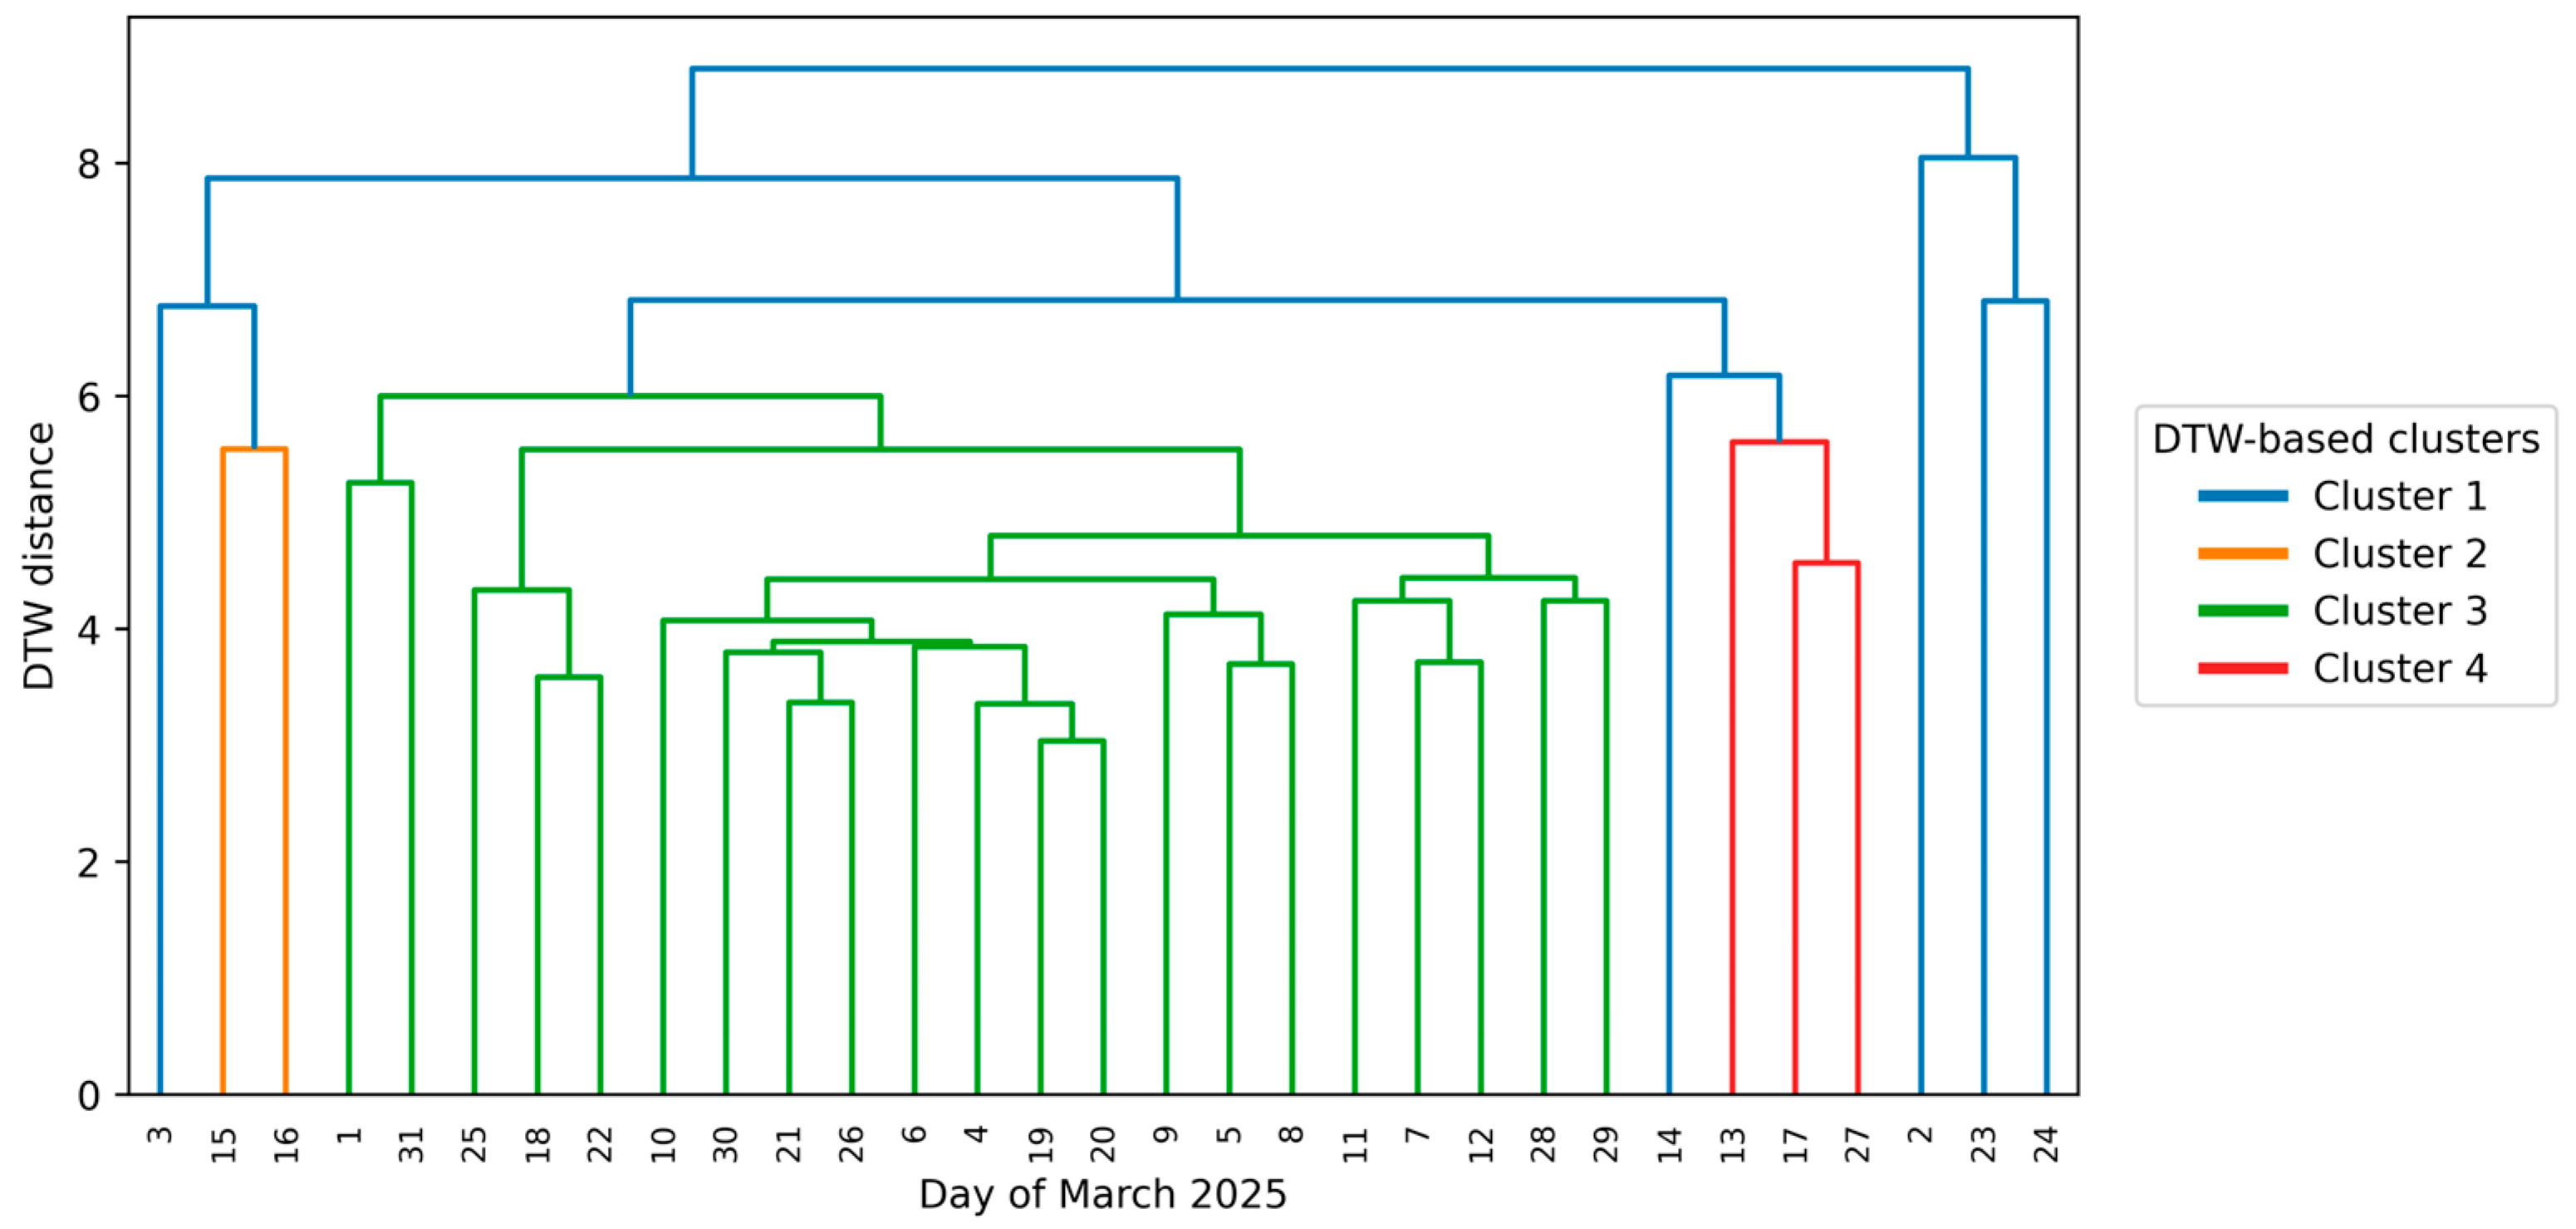
Figure 6 illustrates the hierarchical clustering of daily temporal signatures derived from the DTW distance matrix using average linkage. Each leaf of the dendrogram corresponds to a single day of March 2025, while branch heights represent the DTW distance at which clusters are merged. The dendrogram reveals several coherent branches that can be interpreted as families of days sharing similar temporal mismatch characteristics [39]. These families emerge naturally from the data without imposing any assumptions regarding the number or type of clusters. Days that merge at low linkage distances exhibit highly similar temporal structures, whereas late-merging branches indicate strong temporal dissimilarity. The hierarchical representation further highlights transitional days that connect different branches, suggesting gradual changes in temporal matching behavior across the month. This structure provides a foundation for higher-level interpretation of recurring temporal patterns and their evolution [40].
The interpretation of the identified clusters requires a more detailed explanation, as the grouping is not based on simple energy metrics or predefined temporal categories, but emerges from the geometry of the Dynamic Time Warping distance applied to daily temporal signatures. In this context, clustering does not reflect differences in total energy production or consumption, but rather similarities in the structure of temporal deformation between photovoltaic generation and building demand. Consequently, days assigned to the same cluster may differ significantly in absolute power levels while exhibiting comparable patterns of phase shifts, asymmetric ramps, or localized temporal misalignment. A proper physical interpretation of the clusters therefore necessitates an explicit discussion of the underlying temporal mechanisms captured by the DTW-based similarity measure.
Cluster 1 (blue) comprises days characterized by a distinctly different yet internally consistent structure of temporal mismatch between photovoltaic production and building energy demand. These days exhibit pronounced local shifts between the peaks of PV generation and load, indicating weak temporal synchronization between production and consumption profiles. From a physical perspective, such behavior may be associated with non-standard building usage patterns (e.g., altered operating hours) or meteorological conditions that modify the shape of PV generation without necessarily changing its overall magnitude. This cluster represents an alternative but recurring operational regime of the PV–building system.
Cluster 2 (orange) groups a small number of transitional days that are neither fully representative of the dominant monthly regime nor clearly extreme. These days are characterized by moderate DTW distances and partial similarity to both typical and more atypical days. Physically, this corresponds to situations in which the temporal structure of PV generation and building demand is generally aligned with the majority of days, but short-term disturbances or temporal shifts occur, such as episodic changes in demand or transient weather effects. This cluster can be interpreted as a boundary region between the main operational regimes of the system.
Cluster 3 (green) constitutes the largest group and includes days that are most representative of the analyzed month. It is characterized by low average DTW distances and minor warping-path deformations, indicating a high degree of temporal alignment between PV generation and building demand. Physically, these are stable operating days in which both generation and consumption follow predictable and repeatable daily patterns. This cluster represents the dominant operational regime and can be treated as a baseline for further analysis.
Cluster 4 (red) consists of extreme days with the highest average DTW distances, clearly separated from the remaining observations. These days exhibit strong temporal mismatches between PV generation and building demand, manifested as substantial deviations of the DTW path from the diagonal of the cost matrix. From a physical standpoint, they correspond to atypical conditions, potentially associated with extreme weather events, very low or highly irregular PV production, or exceptional demand-side events within the building. This cluster identifies boundary cases of high diagnostic relevance that should not be averaged together with typical days.
Importantly, the identified clusters do not correspond to predefined calendar categories or energy thresholds but emerge solely from the temporal geometry of PV–load interaction, highlighting the intrinsic time-structured nature of building-integrated photovoltaic systems.
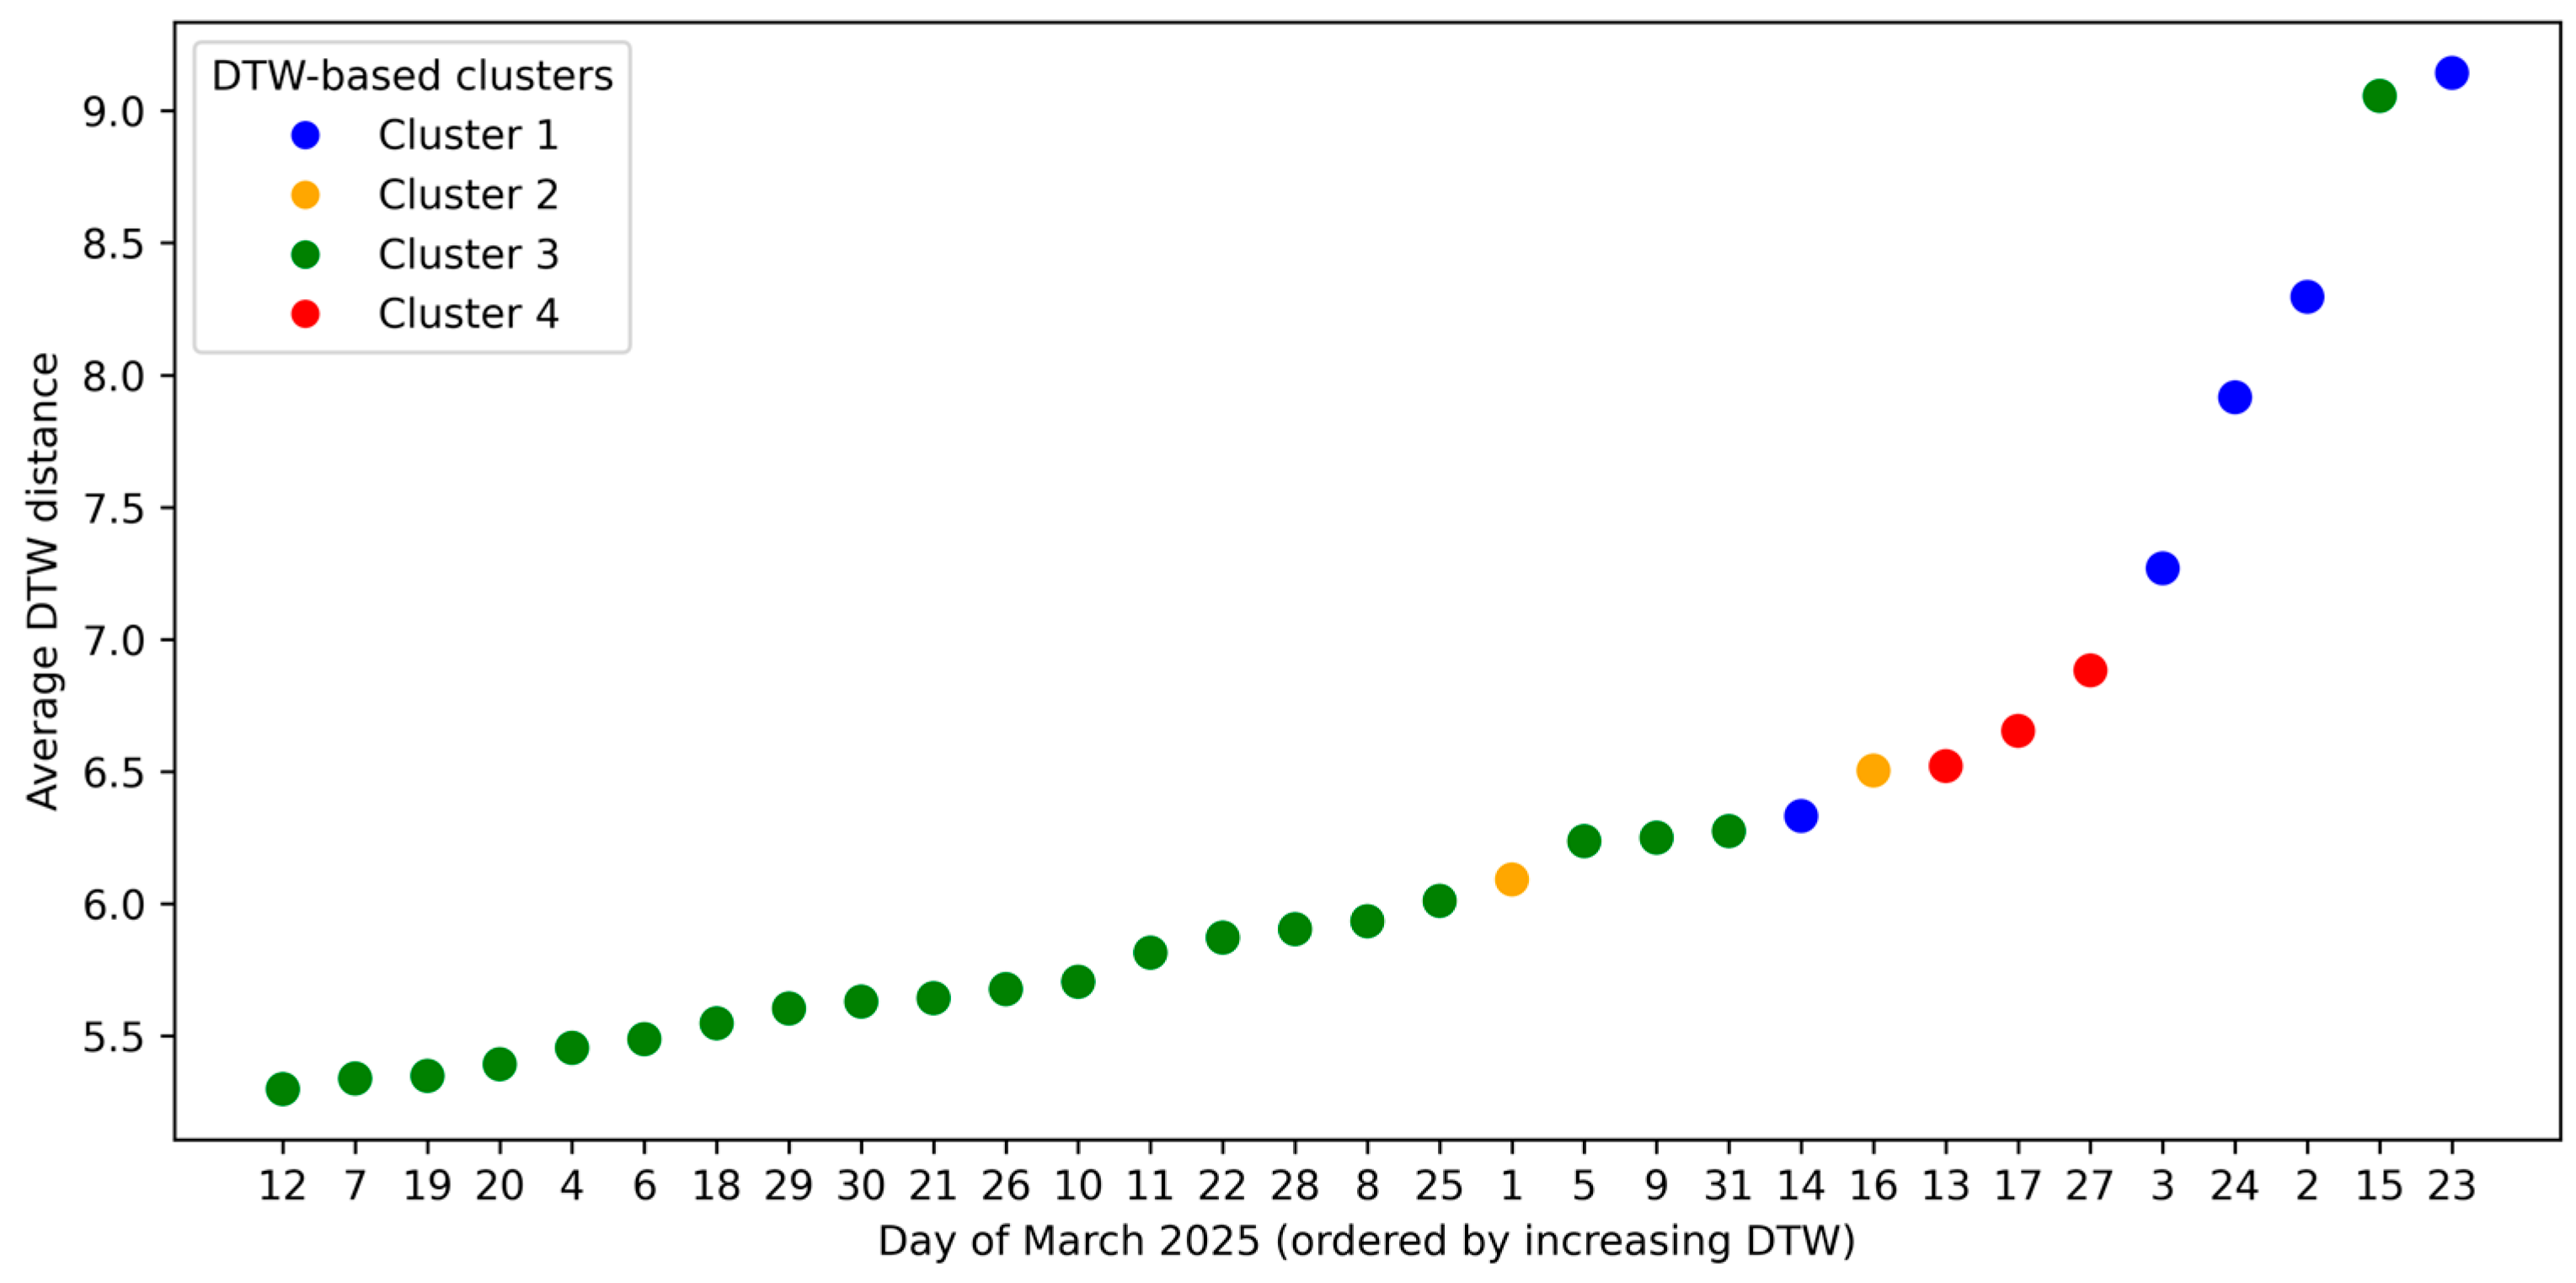
Figure 7 shows the ranking of all March days according to their average DTW distance to all other days in the dataset. Days positioned on the left-hand side of the ranking exhibit lower average distances, indicating temporal mismatch structures that are more representative of the month as a whole. Conversely, days with higher average DTW distances are more temporally distinct and can be interpreted as atypical in terms of PV–building matching dynamics. This ranking enables the identification of both prototypical and outlier days without relying on predefined categories or thresholds. Importantly, the ordering does not necessarily correlate with total energy production or consumption levels, highlighting the independence of temporal structure from aggregate metrics. The ranking thus provides a complementary perspective to the distance matrix by summarizing day-to-day relationships into a single interpretable indicator.
Figure 6 and Figure 7 jointly provide a compact diagnostic representation of the entire analyzed month, allowing rapid assessment of the range, structure, and variability of PV–load temporal mismatch without reducing the information content to aggregated statistics. While the DTW distance matrix provides a global view of day-to-day temporal similarity, the ranking by average DTW distance and the hierarchical clustering offer complementary perspectives on the same structure. The ranking identifies representative and extreme days in a linear ordering, whereas clustering reveals families of days characterized by similar temporal deformation patterns.
Figure 5 and Figure 6 collectively reveal the internal temporal structure of photovoltaic–building energy matching over the month of March 2025. The DTW distance matrix demonstrates that daily mismatch patterns are highly heterogeneous and form natural groupings that are not strictly tied to calendar order. The ranking of days by average DTW distance complements this view by identifying both representative days with typical temporal structures and atypical days that deviate from the dominant patterns. Hierarchical clustering further organizes these relationships into coherent families of days, highlighting both stable temporal regimes and transitional behavior. Taken together, these results show that temporal matching between PV generation and building demand exhibits structured variability at the monthly scale. This structure cannot be inferred from aggregate energy indicators alone and underscores the value of DTW-based analysis for uncovering recurring temporal patterns in PV–building interactions.
The DTW-based analysis conducted for March 2025 reveals substantial quantitative variability in the temporal structure of PV–building energy matching. The pairwise DTW distances between daily temporal signatures span a broad range, from approximately 2.8 for the most similar day pairs to values exceeding 6.0 for strongly dissimilar days. This range indicates that temporal mismatch patterns vary by more than a factor of two within a single month, despite relatively stable building operation.
The distribution of average DTW distances across days is clearly non-uniform. Several days exhibit low mean distances to all other days, identifying them as temporally representative for the month, while a smaller subset of days shows markedly higher average distances and can be classified as temporal outliers. Importantly, these outliers are not extreme in terms of total energy production or consumption, confirming that temporal structure and aggregate energy metrics are only weakly coupled.
Hierarchical clustering based on the DTW distance matrix further supports this observation by revealing multiple branches that merge at distinct distance levels. Early cluster mergers occur at DTW distances below approximately 3.5, indicating tightly related temporal structures, whereas later mergers above 5.0 reflect fundamentally different mismatch dynamics. The presence of intermediate linkage heights suggests gradual transitions rather than abrupt regime changes within the month.
The obtained results indicate that daily differences in PV–building energy matching are not limited to the magnitude of mismatch but are primarily driven by distinct types of temporal deformation, including phase shifts, asymmetric ramping, and localized time compression or dilation.
The quantitative results demonstrate that March 2025 cannot be characterized by a single dominant temporal matching pattern. Instead, the PV–building system operates across a spectrum of temporal regimes, with measurable differences in DTW distance that reflect underlying shifts in the timing relationship between generation and demand.

4. Discussion

4.1. Interpretation of Temporal Structures in PV–Building Matching

The results demonstrate that photovoltaic–building energy matching is governed by structured temporal relationships rather than by a single, uniform daily pattern. Even within a single month characterized by relatively stable building operation, the timing relationship between PV generation and electricity demand exhibits pronounced variability. This variability manifests as distinct families of days with similar temporal mismatch structures, as well as transitional and atypical days that deviate from dominant patterns.
A sensitivity check using a Sakoe–Chiba constraint (±4 time steps, i.e., ±1 h) showed high agreement with the unconstrained case (Pearson r = 0.980 for the distance matrices; Spearman ρ = 0.939 for the average-distance ranking). The hierarchical clustering remained largely consistent (87.1% of days retained the same cluster after label alignment), with only a few boundary days (13, 14, 18, and 22 March) shifting between neighboring clusters.
The identification of these temporal structures indicates that mismatch is not solely driven by absolute energy imbalance, but primarily by the relative timing of key daily events such as ramp-up periods, peak generation, and load fluctuations. Days that appear similar in terms of aggregated energy metrics may therefore differ substantially in their temporal organization, leading to different operational implications. Dynamic Time Warping captures these differences by aligning entire daily sequences and revealing where temporal shifts accumulate mismatch.
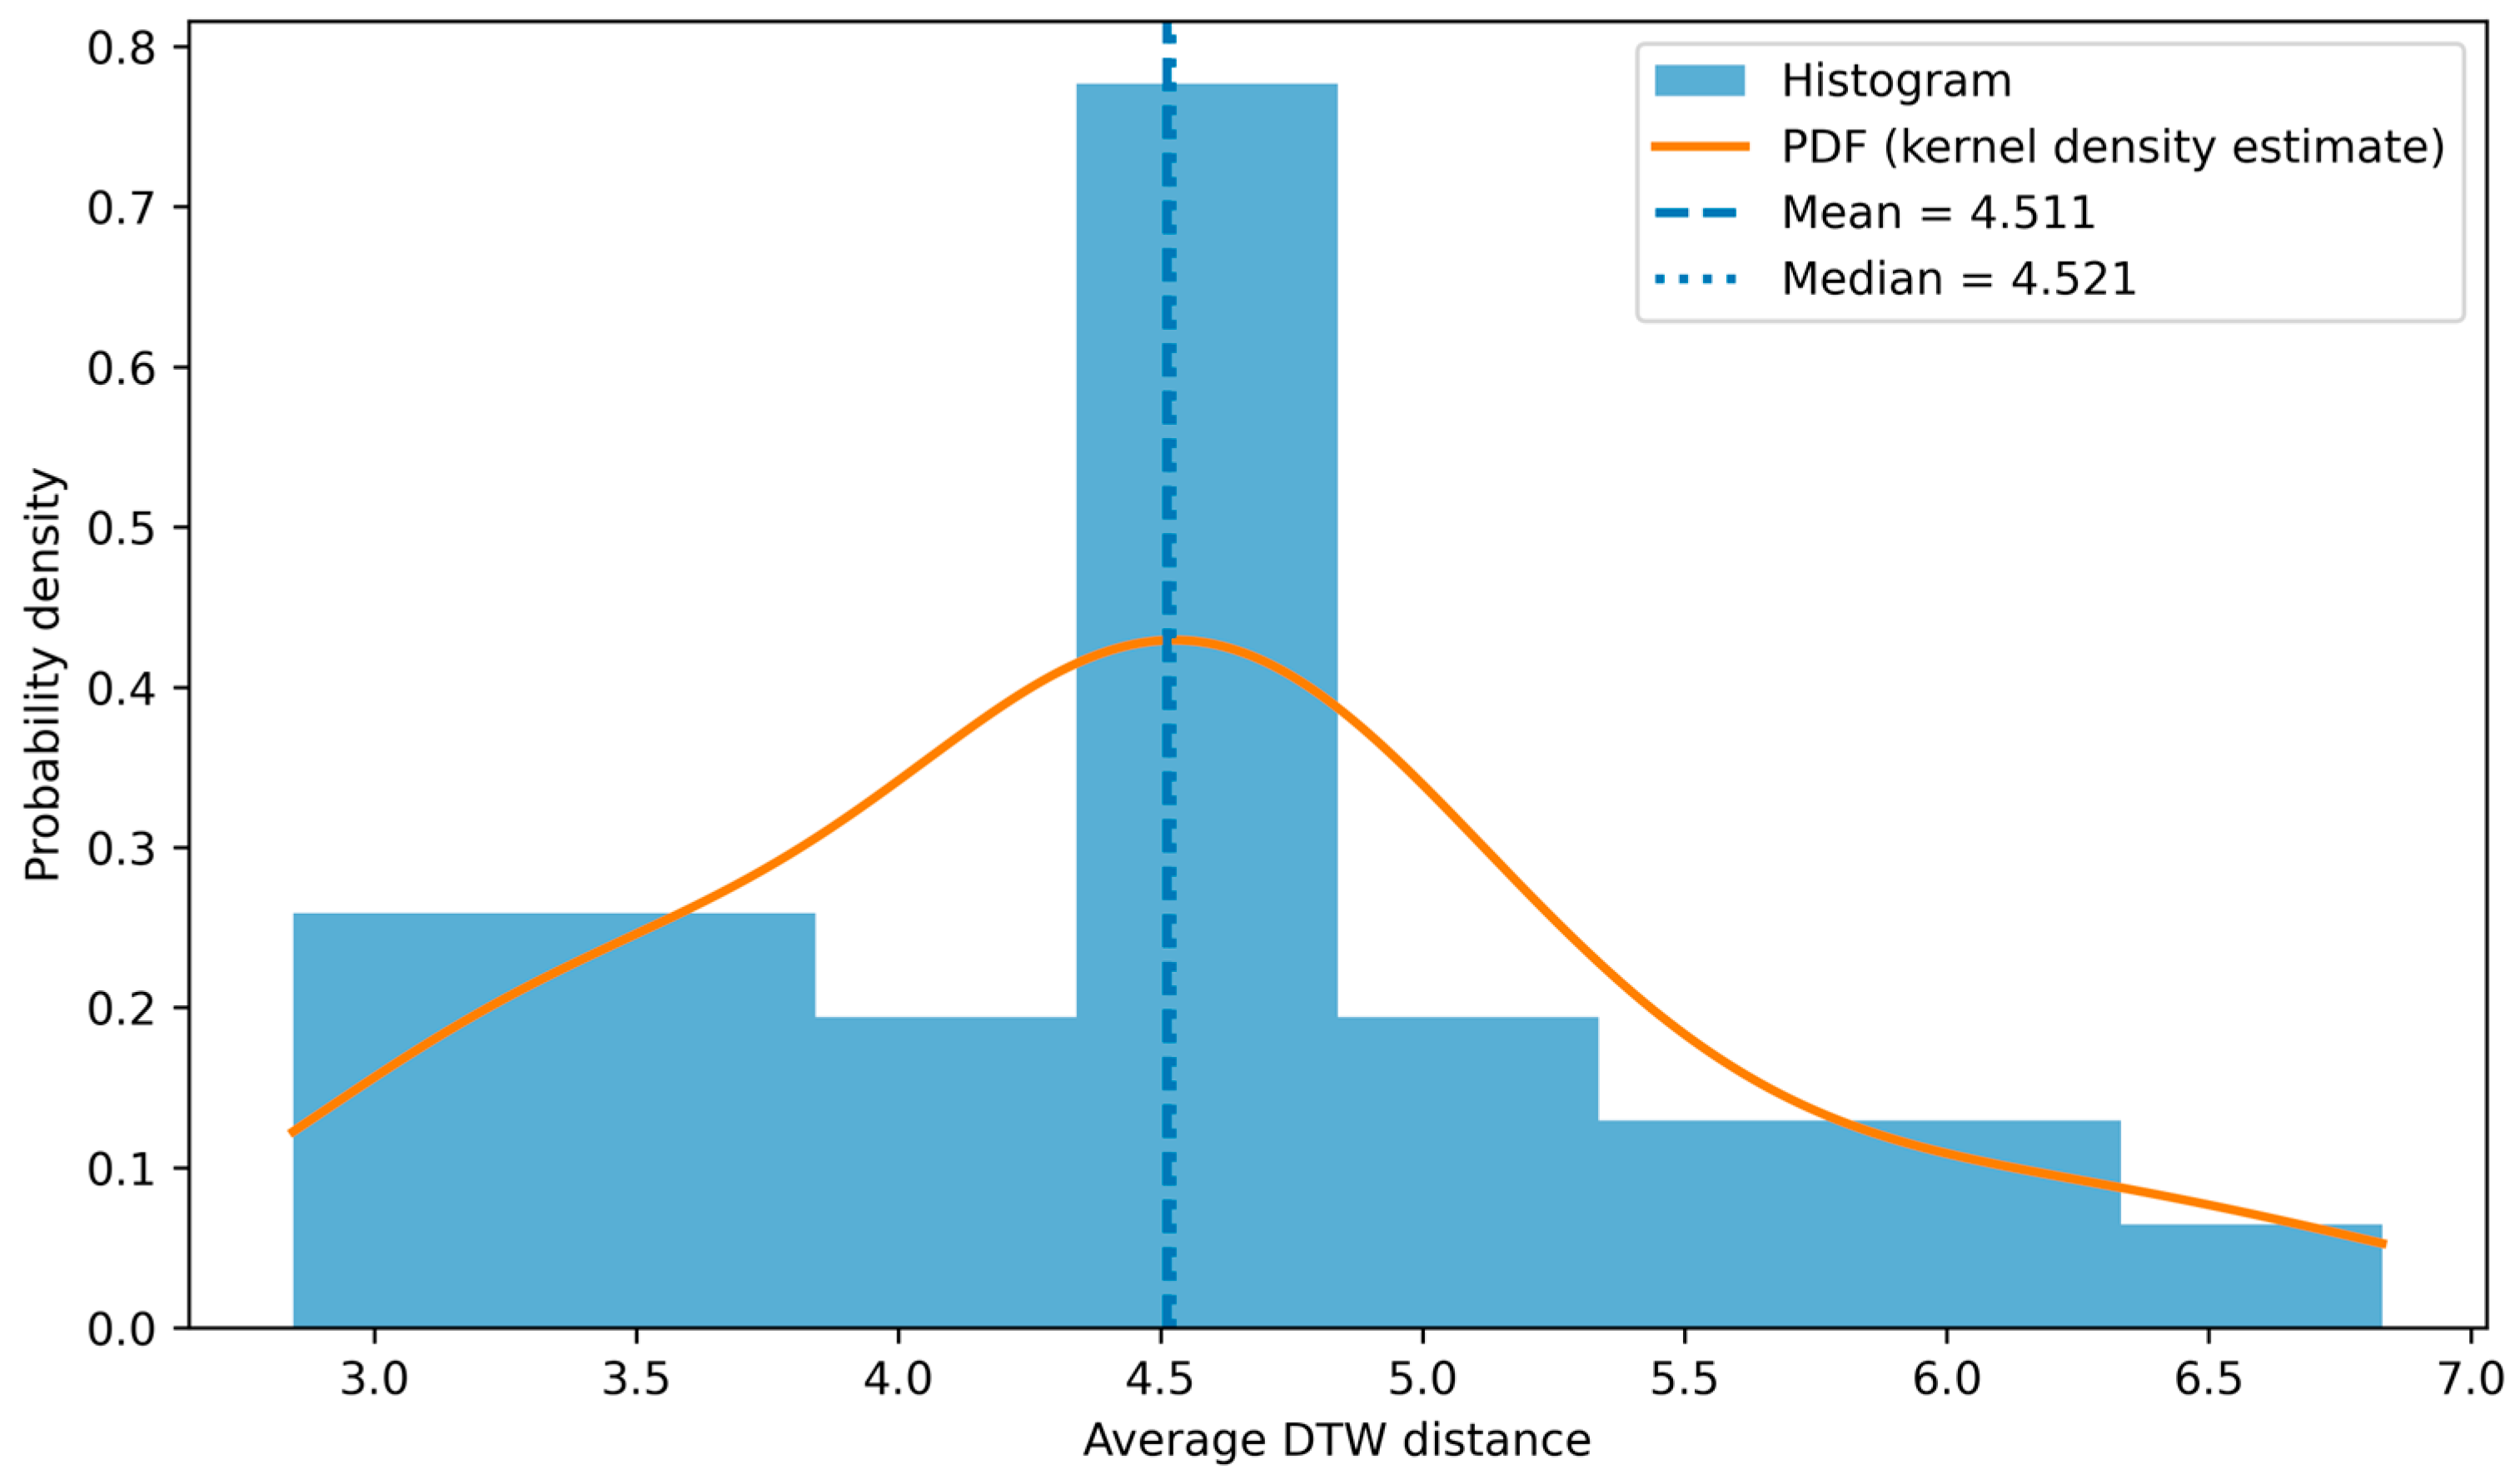
Across March 2025, the average DTW distance between daily temporal signatures exhibits a wide range of values, indicating substantial variability in the temporal structure of PV–building energy mismatch. The minimum average DTW distance equals 2.845, corresponding to the most representative day of the month, while the maximum value reaches 6.831, identifying a temporally extreme operating condition. The mean average DTW distance amounts to 4.511, with a median of 4.521, indicating a nearly symmetric central tendency of the distribution. The dispersion of DTW values is moderate, with a standard deviation of 0.940, while the interquartile range spans from 3.907 (25th percentile) to 4.953 (75th percentile), confirming the presence of a compact core of typical days accompanied by a limited number of outliers.
To further illustrate the statistical distribution of temporal mismatch across the month, a histogram of average DTW distances is presented in Figure 8. This visualization provides an intuitive representation of the concentration of typical days and the emergence of an upper tail associated with temporally atypical operating conditions, complementing the DTW-based ranking and hierarchical clustering results. The histogram is complemented by a Probability Density Function (PDF), providing a smooth representation of the underlying distribution of average DTW distances.
The histogram reveals a clear concentration of days around moderate DTW values, indicating that most days share a similar temporal structure of PV–building energy mismatch. At the same time, the presence of an upper tail in the distribution confirms the occurrence of a limited number of temporally extreme days, consistent with the DTW-based ranking and clustering results. It is worth noting that the statistical distribution of DTW distances fundamentally differs from the distributions of daily PV production and building energy consumption. While energy-based histograms characterize the magnitude of the process, the DTW histogram captures its temporal dynamics and structural variability. This distinction highlights that temporal mismatch constitutes an independent dimension of system behavior that cannot be inferred from aggregated energy statistics alone.
For example, 18 and 23 March exhibit comparable daily energy balances, yet their DTW distance indicates markedly different temporal mismatch structures between PV generation and building demand, confirming that scalar indicators can obscure relevant time-dependent dynamics.
From a physical perspective, the detected structures reflect the interplay between externally driven PV dynamics and internally driven building demand patterns. Moderate mismatch corresponds to days where the overall daily rhythm remains aligned despite local deviations, whereas strong mismatch emerges when characteristic features are systematically displaced in time. These findings underline the importance of treating PV–building interaction as a time-structured process in which temporal alignment plays a central role alongside energy magnitude.

4.2. DTW Versus State-Based and Aggregated Approaches

State-based and aggregated approaches are commonly used to analyze photovoltaic–building energy interactions by grouping operating points or summarizing energy flows over fixed time intervals. While such methods are effective in describing instantaneous operating regimes or overall energy balances, they inherently neglect the sequential nature of daily operation. As a result, days characterized by similar distributions of operating states may exhibit fundamentally different temporal arrangements that remain undetected.
Dynamic Time Warping overcomes this limitation by explicitly preserving the order and timing of events within the daily profiles. By aligning entire time series, DTW distinguishes between profiles that share similar states but differ in their temporal progression. This capability is particularly important for identifying temporal mismatch driven by shifts in peak timing or asymmetric ramping behavior. Consequently, DTW provides complementary information to state-based clustering and aggregated metrics, revealing temporal structures that are critical for understanding and managing photovoltaic–building energy matching.

4.3. Role of Warping Paths and Cost Accumulation

Beyond the scalar DTW distance, the geometry of the optimal warping path and the associated cost accumulation provide essential insight into the nature of temporal mismatch. The warping path explicitly shows how individual time segments of photovoltaic generation and building demand are aligned, revealing whether similarity is achieved through near-synchronous matching or through significant temporal stretching and compression. Deviations of the path from the diagonal directly indicate periods where the timing of key features differs, such as delayed load response or shifted PV peaks.
The cumulative cost along the warping path localizes where mismatch is generated within the day, rather than attributing it to a single aggregated indicator. This localization enables the identification of specific time windows that dominate the overall mismatch, which is not possible with state-based or aggregated analyses. As a result, warping paths transform DTW from a purely comparative metric into an interpretable diagnostic tool for analyzing temporal dynamics in PV–building energy systems.

4.4. Implications for Energy Management and System Design

The identification of structured temporal mismatch patterns has direct implications for energy management and system design in photovoltaic–building systems. By distinguishing between days with moderate and strong temporal mismatch, DTW-based analysis enables a more nuanced assessment of when and why energy self-consumption is limited by timing rather than by insufficient generation. This information can support targeted operational strategies, such as time-specific load shifting or adaptive control of energy storage systems. The proposed analysis is intended as a diagnostic and interpretative layer that complements, rather than replaces, control- or optimization-oriented approaches. The proposed DTW-based analysis should be interpreted as a diagnostic layer that precedes control and optimization, providing structural insight into temporal mismatch rather than directly prescribing operational actions.
From a design perspective, recognizing recurring temporal families of days provides guidance for sizing and configuring storage or demand-side flexibility. Systems optimized solely on aggregated energy balances may underperform if dominant mismatch arises from systematic timing offsets. Incorporating temporal structure into planning and control therefore improves the alignment between PV generation and building demand, leading to more effective and resilient energy system operation.

4.5. Methodological Considerations and Limitations

The proposed analysis is subject to several methodological considerations that should be acknowledged. First, the normalization of daily profiles emphasizes temporal structure at the expense of absolute power magnitude, which is appropriate for studying timing relationships but may underrepresent the influence of extreme load or generation levels. Second, the analysis is based on data from a single building and photovoltaic installation, limiting the generalizability of the quantitative results. However, the methodological framework itself is independent of system scale and can be applied to other contexts.
Additionally, the study focuses on a single month, capturing short-term temporal variability but not seasonal effects. External factors such as weather conditions or occupancy patterns were not explicitly included, although their influence is implicitly reflected in the measured profiles. These limitations suggest that the results should be interpreted as a structural case study rather than a comprehensive characterization, motivating further investigation over longer time horizons and across multiple sites.

4.6. Relation to Existing Literature and Novelty

Existing studies on photovoltaic–building energy interactions predominantly rely on aggregated energy indicators, time-of-use metrics, or state-based clustering of operating points. While these approaches provide valuable insights into energy balance and typical operating regimes, they rarely address the internal temporal organization of daily profiles. Applications of Dynamic Time Warping in the energy domain have been limited and are most often used as a similarity measure without deeper interpretation of alignment structure.
The present work advances the literature by treating daily PV–building interaction as a structured temporal object rather than a collection of independent states. By combining DTW distance analysis with inspection of warping paths and hierarchical organization of days, the study reveals temporal structures that are not accessible through conventional methods. This emphasis on interpretability and temporal structure constitutes the main novelty of the approach and provides a complementary perspective to established analysis frameworks.

4.7. Outlook: From Monthly to Annual Temporal Structures

The temporal structures identified at the monthly scale provide a foundation for extending the analysis to longer time horizons. Applying DTW-based methods across an entire year would enable the investigation of seasonal stability and transitions between temporal families of days. Such an extension would support a more comprehensive understanding of long-term PV–building energy matching dynamics and their implications for adaptive energy management strategies.

5. Conclusions

This study introduced a Dynamic Time Warping (DTW)-based framework for the analysis of temporal mismatch between photovoltaic (PV) generation and building energy demand, with a particular focus on the structural properties of daily time series rather than aggregated energy quantities. By constructing daily temporal signatures from normalized PV and load profiles, the proposed approach isolates temporal deformation effects and enables a consistent comparison of daily mismatch patterns across an entire month.
The results demonstrate that daily PV–building interactions exhibit pronounced temporal diversity that cannot be adequately captured using conventional energy-based indicators. The DTW distance matrix provides a compact representation of pairwise similarities between daily temporal signatures, while the ranking based on average DTW distance allows the identification of representative, transitional, and extreme operating days. Hierarchical clustering further reveals distinct families of days characterized by similar types of temporal deformation, highlighting the existence of recurrent operational regimes within the analyzed period.
Importantly, the identified clusters do not correspond to predefined calendar categories or simple thresholds of energy production or consumption. Instead, they emerge solely from the temporal geometry of PV–load interaction captured by the DTW metric, emphasizing that temporal mismatch is an intrinsic and structured property of building-integrated photovoltaic systems. Days grouped within the same cluster may differ substantially in absolute power levels while sharing comparable patterns of phase shifts, asymmetric ramps, or localized time compression and dilation.
From a methodological perspective, the proposed DTW-based analysis should be interpreted as a diagnostic layer that precedes control and optimization. By revealing the temporal structure underlying PV–building energy mismatch, the framework provides actionable insight into when and how mismatch occurs, rather than merely quantifying its magnitude. This time-aware perspective supports the design of advanced energy management and control strategies that explicitly address temporal misalignment, such as adaptive storage operation, demand-side management, or predictive scheduling.
The presented results confirm that shifting the focus from energy quantities to temporal structure enables a deeper understanding of PV–building interactions and offers a robust foundation for future research on time-structured energy diagnostics and control in building-integrated renewable energy systems.
Future work will examine the relationship between DTW-based temporal similarity and scalar energy indicators to quantify their complementarity and independence, using correlation analysis, matched-day comparisons, and regression-based approaches.

Author Contributions

Conceptualization, A.M. (Arkadiusz Małek) and A.M. (Andrzej Marciniak); methodology, A.M. (Andrzej Marciniak); software, M.G.-J.; validation, A.M. (Arkadiusz Małek), A.M. (Andrzej Marciniak), and K.P.; formal analysis, A.M. (Andrzej Marciniak); investigation, A.M. (Arkadiusz Małek); resources, A.M. (Arkadiusz Małek); data curation, A.M. (Arkadiusz Małek); writing—original draft preparation, A.M. (Arkadiusz Małek) and K.P.; writing—review and editing, A.M. (Arkadiusz Małek); visualization, A.M. (Andrzej Marciniak); supervision, A.M. (Andrzej Marciniak); project administration, M.G.-J.; funding acquisition, A.M. (Arkadiusz Małek) and K.P. All authors have read and agreed to the published version of the manuscript.

Funding

This research received no external funding.

Data Availability Statement

Original contributions presented in this study are included in the article; further inquiries can be directed to the corresponding author.

Conflicts of Interest

The authors declare no conflicts of interest.

Appendix A

Algorithm A1. DTW-based analysis of PV generation and building demand profiles
Input:
  P(t)—photovoltaic power time series sampled at Δt = 15 min
  L(t)—building load power time series sampled at Δt = 15 min
  D—set of days in the analyzed period
Output:
  M—DTW distance matrix between daily PV and load profiles
  C—clusters of days representing distinct operating regimes
Step 1:
Step 1: Data preprocessing
  For each day d ∈ D:
    Extract daily PV profile P_d = {P(t)} for t ∈ d
    Extract daily load profile L_d = {L(t)} for t ∈ d
Step 2: Construction of daily mismatch signature
  S_d(t) = P_d(t) − L_d(t)
  Normalization of S_d
  Compute DTW(S_d_i, S_d_j) for all pairs of days
Step 3: Distance matrix construction
  Construct DTW distance matrix M containing distances DTW(S_d_i, S_d_j) for all pairs of days in D
Step 4: Clustering
  Apply hierarchical clustering to matrix M
  Determine a meaningful number of clusters based on expert-driven interpretability
  Assign each day d ∈ D to a cluster C_k
Step 5: Interpretation
  Analyze cluster-specific temporal patterns
  Identify characteristic PV–load matching regimes and temporal mismatch structures
Return:
  Distance matrix M and cluster assignments C

References

  1. Tao, L.; Yang, M.; Shan, S.; Wang, X.; Wang, Y.; Zhang, H.; Sun, D. A High-Dimensional Spatio-Temporal Feature Extraction Method of Distributed PV and Load. In Proceedings of the 2024 IEEE/IAS Industrial and Commercial Power System Asia (I&CPS Asia), Pattaya, Thailand, 9 July 2024; pp. 391–396. [Google Scholar]
  2. Hou, Q.; Yang, L.; Hu, H. Comprehensive Evaluation Method for Source-Load Matching Based on Scenario Probability. Appl. Math. Nonlinear Sci. 2024, 9, 1–16. [Google Scholar] [CrossRef]
  3. Jing, S.; Xi, X.; Su, D.; Han, Z.; Wang, D. Spatio-Temporal Photovoltaic Power Prediction with Fourier Graph Neural Network. Electronics 2024, 13, 4988. [Google Scholar] [CrossRef]
  4. Gao, Q.; Yang, L.; Shu, Z.; He, J.; Huang, Y.; Gu, D.; Cai, Y. Numerical and Experimental Study on the Performance of Photovoltaic—Trombe Wall in Hot Summer and Warm Winter Regions: Energy Efficiency Matching and Application Potential. Buildings 2024, 14, 2919. [Google Scholar] [CrossRef]
  5. Afzalan, M.; Jazizadeh, F.; Eldardiry, H. Two-Stage Clustering of Household Electricity Load Shapes for Improved Temporal Pattern Representation. IEEE Access 2021, 9, 151667–151680. [Google Scholar] [CrossRef]
  6. Rana, S.; Jamil, U.; Asgari, N.; Hayibo, K.S.; Groza, J.; Pearce, J.M. Residential Sizing of Solar Photovoltaic Systems and Heat Pumps for Net Zero Sustainable Thermal Building Energy. Computation 2024, 12, 126. [Google Scholar] [CrossRef]
  7. Quiles, E.; Roldán-Blay, C.; Escrivá-Escrivá, G.; Roldán-Porta, C. Accurate Sizing of Residential Stand-Alone Photovoltaic Systems Considering System Reliability. Sustainability 2020, 12, 1274. [Google Scholar] [CrossRef]
  8. Peng, K.; Ma, M.; Zhao, W.; Zhang, R. Multi-Criteria Optimal Operation Strategy for Photovoltaic Systems in Large-Scale Logistics Parks Concerning Climate Impact. Buildings 2025, 15, 377. [Google Scholar] [CrossRef]
  9. Ali, S.; Bogarra, S.; Riaz, M.N.; Phyo, P.P.; Flynn, D.; Taha, A. From Time-Series to Hybrid Models: Advancements in Short-Term Load Forecasting Embracing Smart Grid Paradigm. Appl. Sci. 2024, 14, 4442. [Google Scholar] [CrossRef]
  10. Simeunović, J.; Schubnel, B.; Alet, P.-J.; Carrillo, R.E.; Frossard, P. Interpretable temporal-spatial graph attention network for multi-site PV power forecasting. Appl. Energy 2022, 327, 120127. [Google Scholar] [CrossRef]
  11. Rubasinghe, O.; Zhang, T.; Zhang, X.; Choi, S.S.; Chau, T.K.; Chow, Y.; Fernando, T.; Ho-Ching Iu, H. Highly accurate peak and valley prediction short-term net load forecasting approach based on decomposition for power systems with high PV penetration. Appl. Energy 2023, 333, 120641. [Google Scholar] [CrossRef]
  12. Robbert Claeys, R.; Cleenwerck, R.; Knockaert, J.; Desmet, J. Stochastic generation of residential load profiles with realistic variability based on wavelet-decomposed smart meter data. Appl. Energy 2023, 350, 121750. [Google Scholar] [CrossRef]
  13. Yerbury, L.W.; Campello, R.J.G.B.; Livingston, G.C., Jr.; Goldsworthy, M.; O’Neil, L. Comparing clustering approaches for smart meter time series: Investigating the influence of dataset properties on performance. Appl. Energy 2025, 391, 125811. [Google Scholar] [CrossRef]
  14. Catania, M.; Muliere, G.; Fattori, F.; Colbertaldo, P. The impact of temporal clustering on long-term energy system models. Appl. Energy 2025, 399, 126354. [Google Scholar] [CrossRef]
  15. Xu, J.; Ding, S.; Li, G.; Wang, Q. Arc Fault Detection for Photovoltaic Systems Using Independent Component Analysis Technique and Dynamic Time-Warping Algorithm. Sensors 2025, 25, 6094. [Google Scholar] [CrossRef]
  16. Shahbazkia, H.R.; Khosravani, H.R.; Pulatov, A.; Hajimani, E.; Kiazadeh, M. A Comprehensive Comparative Study of Quick Invariant Signature (QIS), Dynamic Time Warping (DTW), and Hybrid QIS + DTW for Time Series Analysis. Mathematics 2025, 13, 999. [Google Scholar] [CrossRef]
  17. Kim, M.; Firoozjaei, M.D.; Kim, H.; El-Hajj, M. Power Profiling of Smart Grid Users Using Dynamic Time Warping. Electronics 2025, 14, 2015. [Google Scholar] [CrossRef]
  18. Małek, A.; Piotrowska, K.; Gryniewicz-Jaworska, M.; Marciniak, A. Temporal Complementarity Analysis of Photovoltaic and Wind Power Generation Using Dynamic Time Warping. Appl. Sci. 2025, 15, 12119. [Google Scholar] [CrossRef]
  19. Fernandes, P.J.; Nagai, M. Mapping Rice Cropping Systems in Data-Scarce Regions Using NDVI Time-Series and Dynamic Time Warping Clustering: A Case Study of Maliana, Timor-Leste. Appl. Sci. 2025, 15, 12544. [Google Scholar] [CrossRef]
  20. Wang, T.; Li, L.; Wen, S.; Lv, Y.; Yu, Z.; He, C. Robust Phase Association and Simultaneous Arrival Picking for Downhole Microseismic Data Using Constrained Dynamic Time Warping. Sensors 2026, 26, 114. [Google Scholar] [CrossRef]
  21. Liu, Z.; Yu, P. A Novel Time-Frame Regional Collision Risk Model Based on Dynamic Time Warping. J. Mar. Sci. Eng. 2025, 13, 263. [Google Scholar] [CrossRef]
  22. Małek, A.; Caban, J.; Gryniewicz-Jaworska, M.; Marciniak, A.; Bednarczyk, T. A Method for Assessing the Selection of a Photovoltaic System for a Building’s Energy Needs Based on Unsupervised Clustering. Appl. Sci. 2025, 15, 9062. [Google Scholar] [CrossRef]
  23. Araújo, N.M.F.T.S.; Medeiros, S.E.L.; Abrahão, R. Variability and Sensitivity of Models Used to Estimate Photovoltaic Production. Energies 2024, 17, 4177. [Google Scholar] [CrossRef]
  24. Becerra-González, F.J.; Vera-Dimas, J.G.; Cisneros-Villalobos, L.; Martínez-Oropeza, A. Solar Energy in Buildings: Feasibility Analysis of Integrated and Conventional Photovoltaic Panels. Energies 2024, 17, 6367. [Google Scholar] [CrossRef]
  25. Zi, X.; Liu, F.; Liu, M.; Wang, Y. A Deep Learning Method for Photovoltaic Power Generation Forecasting Based on a Time-Series Dense Encoder. Energies 2025, 18, 2434. [Google Scholar] [CrossRef]
  26. Van der Does, F.; van Eeden, W.; Bringmann, L.F.; Lamers, F.; Penninx, B.W.J.H.; Riese, H.; Vermetten, E.; van der Wee, N.; Giltay, E. Dynamic time warp versus vector autoregression models for network analyses of psychological processes. Sci. Rep. 2025, 15, 11720. [Google Scholar] [CrossRef] [PubMed]
  27. Liu, Y.; Zhang, Y.A.; Zeng, M.; Zhao, J. A novel distance measure based on dynamic time warping to improve time series classification. Inf. Sci. 2024, 656, 119921. [Google Scholar] [CrossRef]
  28. Springer. Dynamic Time Warping. In Information Retrieval for Music and Motion; Springer: Berlin/Heidelberg, Germany, 2007. [Google Scholar] [CrossRef]
  29. Kopland, M.C.G.; Giltay, E.J. Dynamic Time Warp (DTW) as a scalable, data-efficient, and clinically relevant analysis of dynamic processes in patients with psychiatric disorders: A tutorial. J. Eat. Disord. 2025, 13, 230. [Google Scholar] [CrossRef] [PubMed] [PubMed Central]
  30. Burstyn, Y.; Gazit, A.; Dvir, O. Hierarchical Dynamic Time Warping methodology for aggregating multiple geological time series. Comput. Geosci. 2021, 150, 104704. [Google Scholar] [CrossRef]
  31. Herrmann, M.; Tan, C.W.; Webb, G.I. Parameterizing the cost function of dynamic time warping with application to time series classification. Data Min. Knowl. Disc. 2023, 37, 2024–2045. [Google Scholar] [CrossRef]
  32. Ma, R.; Ahmadzadeh, A.; Boubrahimi, S.F.; Angryk, R.A. Segmentation of Time Series in Improving Dynamic Time Warping. In Proceedings of the 2018 IEEE International Conference on Big Data (Big Data), Seattle, WA, USA, 10–13 December 2018; pp. 3756–3761. [Google Scholar] [CrossRef]
  33. Li, H.; Liu, J.; Yang, Z.; Liu, R.W.; Wu, K.; Wan, Y. Adaptively constrained dynamic time warping for time series classification and clustering. Inf. Sci. 2020, 534, 97–116. [Google Scholar] [CrossRef]
  34. Choi, W.; Cho, J.; Lee, S.; Jung, Y. Fast Constrained Dynamic Time Warping for Similarity Measure of Time Series Data. IEEE Access 2020, 8, 222841–222858. [Google Scholar] [CrossRef]
  35. Denkowska, A.; Wanat, S. Dynamic Time Warping Algorithm in Modeling Systemic Risk in the European Insurance Sector. Entropy 2021, 23, 1022. [Google Scholar] [CrossRef]
  36. An Illustrative Explanation to Dynamic Time Warping. Available online: https://towardsdatascience.com/an-illustrative-introduction-to-dynamic-time-warping-36aa98513b98/ (accessed on 1 January 2026).
  37. Bringmann, K.; Fischer, N.; van der Hoog, I.; Kipouridis, E.; Kociumaka, T.; Rotenberg, E. Dynamic Dynamic Time Warping. In Proceedings of the 2024 Annual ACM-SIAM Symposium on Discrete Algorithms (SODA); Society for Industrial and Applied Mathematics: Philadelphia, PA, USA, 2024; pp. 208–242. [Google Scholar] [CrossRef]
  38. Giannoula, A.; De Paepe, A.E.; Sanz, F.; Furlong, L.I.; Camara, E. Identifying time patterns in Huntington’s disease trajectories using dynamic time warping-based clustering on multi-modal data. Sci. Rep. 2025, 15, 3081. [Google Scholar] [CrossRef] [PubMed]
  39. Contreras, J.M.; Molina Portillo, E.; Fernández Luna, J.M. Evaluation of Hierarchical Clustering Methodologies for Identifying Patterns in Timeout Requests in EuroLeague Basketball. Mathematics 2025, 13, 2414. [Google Scholar] [CrossRef]
  40. Shor, O.; Benninger, F.; Khrennikov, A. Dendrographic Hologram Theory: Predictability of Relational Dynamics of the Event Universe and the Emergence of Time Arrow. Symmetry 2022, 14, 1089. [Google Scholar] [CrossRef]
Figure 1. Time series of photovoltaic production and building energy demand for March 2025, illustrating periods of temporal alignment and mismatch between PV generation and building load.
Energies 19 01107 g001
Figure 2. Data flow diagram: DTW-based analysis of temporal PV-Building energy matching.
Energies 19 01107 g002
Figure 3. Measurement data and calculation results for 23 March 2025: (a) Daily power profiles; (b) DTW local cost matrix and optimal warping path.
Energies 19 01107 g003
Figure 4. Measurement data and calculation results for 18 March 2025: (a) Daily power profiles; (b) DTW local cost matrix and optimal warping path.
Energies 19 01107 g004
Figure 5. DTW distance matrix between daily temporal signatures.
Energies 19 01107 g005
Figure 6. Hierarchical clustering of days based on DTW distances.
Energies 19 01107 g006
Figure 7. Ranking of days by average DTW distance.
Energies 19 01107 g007
Figure 8. Histogram of average DTW distances.
Energies 19 01107 g008
Disclaimer/Publisher’s Note: The statements, opinions and data contained in all publications are solely those of the individual author(s) and contributor(s) and not of MDPI and/or the editor(s). MDPI and/or the editor(s) disclaim responsibility for any injury to people or property resulting from any ideas, methods, instructions or products referred to in the content.