


Abstract
The spatial distribution of electric current is an important characteristic of the electrical state of electrolytic systems and influences the conditions under which an electromagnetic field is formed. In this paper, we investigate the spatially dependent electrical response of a laboratory electrolytic cell and evaluate its potential for characterizing the state of the electrode system. The probe current Iprobe was measured at nodes of a three-dimensional coordinate grid at interelectrode distances of 350, 200, and 150 mm. The resulting data sets were analyzed using spatial maps, coordinate profiles, and statistical indicators. Reducing the interelectrode distance from 350 to 200 mm led to an increase in the average Iprobe value from 260.68 to 361.85 mA, whereas a further reduction in the distance to 150 mm was accompanied by only a slight increase in the average value to 368.28 mA. At the same time, the coefficient of variation (CV) increased from 9.65% to 17.55% and 21.57%, respectively, indicating an increase in spatial heterogeneity. At interelectrode distances of 200 and 150 mm, persistent spatial asymmetry between the right and left parts of the electrode system was also observed. The results obtained show that integral current characteristics alone are insufficient to describe the electrical state of the electrode system. Spatially resolved measurements provide additional diagnostic information and can serve as an experimental basis for assessing the state of the electrodes and subsequent electromagnetic modeling.
1. Introduction
The production of primary aluminum by electrolysis is one of the most energy-intensive metallurgical processes [1,2]. The efficiency of an electrolyzer is determined by a combination of interrelated electrical, thermal, electrochemical, and hydrodynamic processes [3,4]. Electrical losses in aluminum production are associated with both the characteristics of the electrical regime and the resistance of the electrolytic cell components, including the electrolyte layer between the anode and cathode [5,6]. In this regard, reducing the interelectrode distance is considered one of the ways to reduce ohmic losses and improve the energy efficiency of the process [6]. However, changing this distance affects not only the electrical resistance but also the spatial distribution of current and the magnetohydrodynamic state of the cell; therefore, reducing it cannot be viewed solely as a means of reducing electrical losses [7,8].
In an industrial aluminum electrolyzer, electrical, thermal, and hydrodynamic processes are interrelated [4,9]. Changes in the electrical operating conditions affect the thermal state and motion of the melts, whereas changes in the geometry of the interelectrode space, the state of the electrodes, and the current-carrying elements, in turn, affect the distribution of electric current [7,9,10]. Spatial inhomogeneity in current distribution can lead to the formation of localized regions of increased electrical load and alter the conditions for stable operation of the electrolyzer [10,11]. Therefore, assessing not only the overall current level but also the characteristics of its spatial distribution is of interest when analyzing the electrical state of an electrolytic system [10,11].
Electric currents flowing through the anode system, the electrolyte, the liquid aluminum layer, the cathode blocks, and the current-leading elements form a spatially inhomogeneous magnetic field [12]. The interaction of the electric current with the magnetic field induces electromagnetic forces that act on the liquid phases of the electrolyzer [13]. Under unfavorable combinations of electric and magnetic fields, the circulation of melts and oscillations at the “electrolyte–metal” interface may be amplified [14]. As a result, magnetohydrodynamic stability becomes one of the factors limiting the permissible reduction in the interelectrode distance [15]. Therefore, analyzing changes in the spatial structure of the current distribution as the geometric parameters of the electrode system vary is important both for evaluating the energy regime and for characterizing the conditions under which the electromagnetic state of the electrolyzer is formed [16].
The spatial distribution of electric current in an aluminum electrolyzer is determined by a combination of electrical and geometric factors [17,18,19]. These include the magnitude of the applied current, the electrical conductivity of the materials and melts, the geometry of the electrode system, the arrangement of the current leads, the shape of the anode and cathode, contact resistances, and the local distance between conductive surfaces [20,21]. Changing the geometry of the anode and cathode systems can redistribute the vertical and horizontal components of the current and, consequently, alter the distribution of electromagnetic forces. However, the influence of the interelectrode distance is not isolated: its effect depends on the design features of the cell, the shape of the conductive surfaces, and the configuration of the current leads. Therefore, the interelectrode distance must be evaluated taking into account the spatial structure of the electric field in a specific electrolysis system.
One of the main tools for studying electrical and magnetohydrodynamic processes in aluminum electrolysers is mathematical modeling [22,23]. Modern three-dimensional models make it possible to calculate the distributions of electric potential, current density, magnetic induction, and electromagnetic forces, as well as to assess their impact on melt motion and the state of the interphase boundary [24]. However, the accuracy of such calculations depends significantly on the boundary conditions adopted, the electrophysical properties of the materials, contact resistances, and the correctness of the object’s geometric representation. When simplified boundary conditions and assumptions about current distribution are used, certain local features of the electric field may not be taken into account. Consequently, experimental data on the spatial inhomogeneity of the current are important not only for describing the electrical regime but also as a basis for subsequent comparison with the results of numerical simulations [25].
Obtaining spatially distributed experimental data in an industrial aluminum electrolyzer is complicated by the high-temperature and chemically aggressive environment, as well as by the limited ability to directly measure local parameters inside the cell [26]. Under industrial conditions, measurements of individual anode currents, cell voltage, and other electrical parameters are used to monitor and diagnose the state of the electrolyzer [27,28,29]. In this context, distributed anode currents can serve as a source of spatial information about differences in the state of individual regions of the electrolyzer [26,28]. Laboratory electrolytic cells, including setups that allow for visual observation of the interelectrode space, enable the study of individual physical processes under more controlled conditions [30,31]. However, obtaining comparable spatially distributed data on the dependent measurable current in laboratory electrolytic systems remains a distinct experimental challenge, especially when the geometric parameters of the electrode system are varied.
Spatially distributed measurements form a multidimensional data set in which each recorded value of an electrical parameter corresponds to a specific position within the volume of the system under study [32]. To correctly compare different configurations of the electrode system, it is necessary not only to obtain such data but also to ensure its spatial comparability, perform statistical analysis, and evaluate changes in the distribution structure [33]. In this regard, the analysis of current distribution involves both the physical interpretation of electrical processes and the task of processing spatially organized experimental data [34]. Of particular interest is determining whether integral statistical indicators can sufficiently characterize changes in the electrical state, or whether a joint analysis of spatial profiles and distribution maps is required for this purpose.
In the broader industrial and energy context, improving the efficiency of technological systems is considered in conjunction with the goals of rational resource use, reducing environmental impact, and improving approaches to the management of industrial facilities [35,36]. The importance of minimizing the environmental impact of industrial processes is also highlighted by studies of fluoride removal from wastewater, which demonstrate that treatment efficiency depends on the characteristics of mineral substrates and precipitation conditions [37]. For energy-intensive industrial facilities, it is also essential to comprehensively consider technological, operational, and economic factors when evaluating efficiency and making decisions [38]. The importance of comprehensive assessment has also been demonstrated in the energy sector, where multi-criteria approaches have been applied to evaluate solar energy projects by considering economic indicators alongside other investment-related factors [39]. In the aluminum industry, the importance of considering economic and resource-related factors has also been demonstrated in studies of raw-material diversification strategies and their implications for primary aluminum production [40].
The operating conditions and the technological solutions employed largely determine the operational reliability of complex technical and infrastructure facilities [41,42]. In electric power systems, electrical load management, monitoring of operating parameters, and the accuracy of electrical measurements take on additional importance [43,44]. These areas highlight the growing role of experimental and operational data in analyzing the condition of energy-intensive technological systems.
The studies discussed above address different aspects of industrial and energy systems, including technological efficiency, resource use, equipment reliability, and electrical measurements. Since these studies consider different technical problems, the selected publications are grouped in Table 1 according to their main research focus. This classification distinguishes four research areas and provides a broader context for the subsequent discussion of electrical processes and diagnostic methods in electrolytic systems.
Table 1.
Overview of selected research areas in industrial and energy systems.
Among the research areas summarized in Table 1, metallurgical processes, electrical systems, and monitoring and diagnostic methods are the most closely related to the present study. Accordingly, further consideration is given to research on aluminum electrolysis and spatially resolved electrochemical measurements, which provides a more specific basis for examining the electrical response of electrode systems.
Research on aluminum electrolysis includes numerical modeling of electrical and electromagnetic fields, monitoring of cell currents, and the development of diagnostic approaches [22,23,26,28]. Alongside these developments, spatially resolved electrochemical techniques have been increasingly applied to investigate electrode surface heterogeneity and localized corrosion processes. Scanning vibrating electrode and scanning electrochemical microscopy techniques have been used to map corrosion activity on coated steel surfaces and identify anodic and cathodic regions [95]. Combining scanning electrochemical cell microscopy with impedance spectroscopy has also enabled the spatial characterization of corrosion potential and charge-transfer resistance [96]. Further developments include the use of voltammetric scanning techniques to visualize copper dissolution under corrosion and inhibition conditions [97], as well as electrochemical mapping of differences in surface activity between Zn and Zn–Al alloy electrodes [98]. More recently, complementary scanning electrochemical techniques have been employed to investigate the relationship between microstructural inclusions and localized corrosion in high-strength steels [99].
These investigations demonstrate the capabilities of spatial electrochemical measurements for characterizing electrode surface heterogeneity. However, they primarily focus on local electrochemical processes at or near material surfaces. The present study considers a different measurement configuration in which the total current of an electrolytic circuit is recorded as a movable probe occupies successive positions within a three-dimensional measurement grid. Comparing the resulting spatial electrical responses at different interelectrode distances makes it possible to examine changes in current distribution and the persistence of spatial features, particularly left–right asymmetry. Although these features cannot be directly attributed to specific electrode defects, they may provide additional information relevant to assessing electrode surface condition.
The scientific novelty of this study lies in the combined analysis of three-dimensional probe-current measurements and changes in the spatial electrical response at different interelectrode distances. In addition to integral current characteristics, the proposed approach considers spatial profiles, localized deviations, and left–right asymmetry. Particular attention is paid to whether the direction of the observed asymmetry remains consistent when the geometric configuration of the electrode system changes. Such spatial features may provide additional diagnostic information about differences in electrode surface condition, although they cannot be directly associated with specific defects on the basis of the available measurements.
Thus, the objective of this study is to develop and experimentally evaluate an approach based on spatially resolved probe-current measurements for identifying electrical-response features potentially associated with heterogeneity in electrode surface condition. To achieve this goal, the probe current Iprobe was recorded at the nodes of a three-dimensional coordinate grid for various electrode spacings, while the remaining experimental conditions remained constant. The obtained data were used to construct spatial maps, coordinate profiles, and perform statistical comparisons of the configurations under study. Particular attention was paid to spatial asymmetry, localized regions with elevated or reduced Iprobe values, and the preservation of these characteristics as the geometry of the electrode system was varied.
2. Materials and Methods
2.1. Experimental Setup and Measurement System
This study was conducted to obtain and analyze the spatially resolved electrical response of a laboratory electrolytic cell in order to identify diagnostic features associated with the condition of the electrode plates. Measurements were performed at distances L between the plates of 350, 200, and 150 mm. In all experimental series, the composition and volume of the electrolyte, the geometry of the laboratory cell, the power supply mode, the orientation of the electrode plates, and the measurement coordinate grid remained constant. The change in interelectrode distance was used as a controlled variation in the geometric configuration of the system to assess whether the identified spatial diagnostic features persisted under changes in electrode geometry.
For configurations with interelectrode distances of 200 and 150 mm, measurements were taken in three characteristic regions: to the left of the first plate, between the plates, and to the right of the second plate (Figure 1). At L = 350 mm, the working range of the coordinate table covered only the interelectrode space; therefore, measurements in this series were performed exclusively between the plates. This measurement setup allowed for a direct comparison of the spatial distribution of the recorded current values in the overall interelectrode region for all three configurations and—for L = 200 and 150 mm—for an additional analysis of the outer regions.
Figure 1.
Schematic diagram showing the arrangement of the electrode plates and the regions of spatially distributed current measurements in a laboratory electrolytic cell, top view (compiled by the authors).
The main parameters of the experimental setup are presented in Table 2.
Table 2.
Main parameters of the experimental setup.
The experimental setup is a rectangular glass tank measuring 444 × 246 × 405 mm. The tank contained 21 L of electrolyte.
An aqueous solution of sodium chloride was used as the electrolyte. The solution was prepared by dissolving 21 g of NaCl in 21 L of distilled water, corresponding to a mass concentration of 1 g/L. A solution of identical composition was used in all experimental series. All experimental series were conducted under identical nominal external conditions.
The use of an aqueous NaCl solution provided an electrically conductive medium suitable for the experimental study of the spatially dependent electrical response under controlled laboratory conditions. However, this medium does not replicate the electrochemical, thermophysical, and hydrodynamic properties of an industrial cryolite-alumina melt. Consequently, the experimental setup was considered a physically simplified model of the electrical processes in an electrolytic cell, intended for the comparative analysis of the recorded electrical characteristics, rather than a scaled-down replica of an industrial aluminum electrolyzer [100].
The stationary part of the electrode system consisted of two parallel steel plates, P1 and P2, each measuring 125 × 170 × 2 mm and fully immersed in the electrolyte. The plates differed in their surface condition. Plate P1 exhibited visible corrosion, with rust covering approximately 70% of each of its two main surfaces, according to a visual estimate. Plate P2 was visually clean, with no visible signs of corrosion. The thickness and composition of the corrosion layer were not measured. Thus, the experiment involved electrode plates with different observed surface conditions rather than an artificially introduced defect with predefined dimensions and location. The orientation of the plates relative to the coordinate axes and their immersion depth remained constant across all experimental series. The distance L was defined as the distance between the facing surfaces of the plates. In this experimental setup, L characterized the distance between two stationary plates of the same polarity and was not a direct analogue of the anode–cathode distance in an industrial aluminum electrolyzer. As L was varied, the plates moved symmetrically relative to the geometric center of the bath, ensuring a constant position of the center of the interelectrode space and reducing the influence of the electrode system’s displacement relative to the cell boundaries.
To obtain spatially distributed experimental data, an automated measurement system was used, comprising a measuring probe, a programmable three-axis coordinate stage, an electronic current measurement module, and software for control and data acquisition. The measuring probe consisted of an electrically insulating glass tube with a spherical steel tip 5 mm in diameter. An electrical conductor passed through the glass tube and was connected to the steel tip. The spherical tip remained fully immersed in the electrolyte at all measurement positions. The coordinate stage ensured automatic positioning of the sensing element at specified nodes of the three-dimensional measurement grid. Current was measured using the shunt method, followed by digital signal conversion and transmission to a personal computer.
The experimental cell was powered by a laboratory power supply. In all experimental series, the source voltage was 15 V, and the current limit was set at 1 A. The two stationary electrode plates were electrically connected to each other and to the positive terminal of the power source, while the movable measuring probe was connected to the negative terminal via an electronic current-recording module. Thus, the electrical circuit was closed through the electrolyte between the stationary plates and the measuring probe. The electrical connection diagram of the experimental setup is shown in Figure 2.
Figure 2.
Schematic diagram of the electrical connection and current measurement in a laboratory electrolytic cell (compiled by the authors).
At each point of the measurement grid, the circuit current was recorded at a given spatial position of the measuring probe (X, Y, Z). Two stationary plates were electrically connected to each other and to the positive terminal of the power supply, while the measuring probe was connected to the negative terminal via an electronic current-recording module. Thus, the position of the probe determined the spatial configuration of the conductive path through the electrolyte. The recorded value is hereinafter referred to as the probe current Iprobe. This quantity represents the total current flowing through the measurement circuit at a specified spatial position (X, Y, Z) of the movable probe, rather than the local current density in the electrolyte.
A Cartesian coordinate system was used to describe the positions of the points:
- •
- the X-axis—along the length of the electrolytic cell.
- •
- the Y-axis—along its width.
- •
- the Z-axis—vertically.
Each recorded value of Iprobe was uniquely associated with a set of spatial coordinates (X, Y, Z).
The measurement points were located at the nodes of a three-dimensional coordinate grid with a pitch of 20 mm along the X and Y axes and 40 mm along the Z axis. The range of motion of the sensing element along the X-axis was from 0 to 260 mm, with the coordinate X = 130 mm corresponding to the geometric center of the tank along its length. When the interelectrode distance was changed, the plates moved symmetrically with respect to this coordinate. For configurations with distances of 200 and 150 mm, the measurement grid covered the left outer, interelectrode, and right outer regions, whereas at a distance of 350 mm, measurements were taken only between the plates. This limitation was due to the working range of the coordinate table installed above the laboratory tank. A single set of measurement point coordinates was used in all experimental series, ensuring the spatial comparability of the resulting data sets.
2.2. Experimental Procedure
For each value of the interelectrode distance, an electrolyte of a specified composition was prepared in a laboratory cell, after which the plates were positioned symmetrically relative to the geometric center of the bath. The electrical circuit was then connected, and the specified power supply mode was set. The measuring probe was sequentially positioned at nodes of a three-dimensional coordinate grid using a programmable coordinate stage.
After positioning the probe at each point, three consecutive measurements of the probe current Iprobe were taken; based on these results, the arithmetic mean was calculated and subsequently used as the measured current value for the corresponding node of the measurement grid. For each point, a data entry was created containing its spatial coordinates X, Y, and Z and the corresponding value of Iprobe. The obtained data were automatically saved in tabular format. The sequence of positioning, measurement, averaging, and data saving was repeated until measurements were completed at all specified nodes of the coordinate grid. The experiment was controlled, and the results were recorded using specially developed software written in Python (version 3.14.4).
2.3. Data Processing and Analysis
For each experimental configuration, we verified the completeness of the obtained data set, checked that the coordinates corresponded to the specified measurement grid, and checked for missing or duplicate points. The complete measurement grid consisted of 588 spatial points with coordinates X = 0–260 mm, Y = 0–120 mm, and Z = 0–200 mm.
For a quantitative comparison of the results across all investigated interelectrode distances, a common interelectrode region of X = 60–200 mm was identified, which was located between the plates in all three configurations. This region contained 336 measurement points for each interelectrode distance value. For configurations with distances of 200 and 150 mm, a separate comparison of the left outer, interelectrode, and right outer regions was additionally performed. Since the positions of the plates did not coincide with the nodes of the measurement grid, the boundaries of the individual regions were determined based on the nearest actually measured coordinates that did not intersect the surfaces of the plates.
Although the same measurement coordinates were used for all three configurations, the distances between the measuring probe and the electrode plates varied with the interelectrode spacing L. For example, at X = 60 mm, the distance along the X-axis from the center of the spherical probe tip to the plane of the facing surface of plate P1 was 105, 30, and 5 mm for L = 350, 200, and 150 mm, respectively. Due to the symmetric arrangement of the plates, the corresponding distances from the probe center at X = 200 mm to plate P2 were identical. Given the probe tip diameter of 5 mm, the nominal clearances along the X-axis between the spherical tip and the respective electrode planes were 102.5, 27.5, and 2.5 mm. These distances characterize the geometry along the X-axis and do not represent the full current path through the electrolyte. Therefore, the use of a common measurement grid enabled comparisons at identical spatial coordinates, although the probe-to-electrode distances differed between configurations. This geometric difference was taken into account when interpreting changes in the measured current. The left–right asymmetry observed at L = 200 and 150 mm, and the persistence of its direction across these configurations, were examined as potential indicators of differences in electrode surface condition, although the available data do not allow the observed asymmetry to be attributed unequivocally to corrosion.
To characterize the spatial variability of Iprobe, the minimum and maximum values, the arithmetic mean, the median, the standard deviation, and the coefficient of variation (CV) were determined. The standard deviation and CV were used to characterize the spatial heterogeneity of the recorded values and were not considered indicators of measurement error or repeatability. The statistical reproducibility of the results was not assessed, since no repeat experimental series were conducted.
The spatial distribution of Iprobe is presented as two-dimensional maps and one-dimensional profiles. To construct maps in the XY plane, the values were averaged over the Z coordinate; for maps in the XZ plane, over the Y coordinate; and for maps in the YZ plane, over the X coordinate. In addition, profiles of the spatial variation in Iprobe along the X, Y, and Z axes were generated by averaging the values over the other two coordinates.
In the diagnostic interpretation of spatial data, particular attention was paid to asymmetries in the Iprobe distribution relative to the geometric center of the electrode system, as well as to localized regions with elevated or reduced values. For configurations with L = 200 and 150 mm, the left and right outer regions were additionally compared. The persistence of the same direction of spatial asymmetry as the distance between the electrodes changed was considered a potential diagnostic indicator of electrode heterogeneity or the presence of defects. This criterion reflects the spatial structure of the electrical response and is not direct evidence of a specific type of defect.
3. Results
3.1. Comparative Analysis of the Iprobe Distribution at Various Interelectrode Distances
The spatial distribution of the measured probe current Iprobe was investigated at interelectrode distances of 350, 200, and 150 mm. A quantitative comparison of the three experimental configurations was performed in the general interelectrode region, defined in accordance with the methodology described in Section 2.3. The main parameters of the spatial distribution of Iprobe in this region are presented in Table 3.
Table 3.
Parameters of the spatial distribution of Iprobe in the general interelectrode region X = 60–200 mm.
A comparison of the total interelectrode area showed that when the distance was reduced from 350 to 200 mm, the average value of Iprobe increased from 260.68 to 361.85 mA, or by 38.8%. At a distance of 150 mm, the mean value was 368.28 mA, which was 41.3% higher than the corresponding value for a distance of 350 mm.
The difference between the mean probe current values at L = 200 and 150 mm was relatively small, amounting to 1.8%. At the same time, the median at L = 150 mm was 2.3% lower than at L = 200 mm, while the coefficient of variation increased from 17.55% to 21.57%. These results indicate that the further reduction in interelectrode distance was accompanied by changes in the spatial distribution of the measured current, even though its average value remained nearly unchanged. Since independent experimental series were not conducted, the reproducibility of the observed differences remains to be assessed in future studies.
As the interelectrode distance decreased, the spatial spread of the recorded Iprobe values increased. The CV increased from 9.65% at L = 350 mm to 17.55% at L = 200 mm and 21.57% at L = 150 mm. The standard deviation increased accordingly from 25.16 to 63.50 and 79.42 mA.
In all three configurations, the minimum values averaged over the horizontal coordinates were observed at Z = 0 mm. The highest average values were recorded in the middle part of the studied layer: at Z = 120 mm for distances of 350 and 150 mm, and at Z = 80 mm for a distance of 200 mm.
Comparative Iprobe profiles along the coordinate axes and changes in the descriptive parameters as the interelectrode distance decreases are shown in Figure 3.
Figure 3.
Comparison of the spatial distribution of Iprobe in the overall interelectrode region X = 60–200 mm: (a) profiles along the X-axis, averaged over the Y and Z coordinates; (b) profiles along the Y-axis, averaged over the X and Z coordinates; (c) profiles along the Z-axis, averaged over the X and Y coordinates; (d) average values of Iprobe; the vertical intervals correspond to the spatial standard deviation of the values across the nodes of the common region; the labels above the columns indicate the CV; the standard deviation is not an estimate of experimental error or reproducibility (compiled by the authors).
3.2. Spatial Distribution of Iprobe
At L = 350 mm, measurements were taken only in the space between the plates. Within the measurement region, Iprobe varied from 195.0 to 412.2 mA. The minimum value was recorded at coordinates X = 120 mm, Y = 0 mm, and Z = 0 mm, while the maximum value was recorded at X = 0 mm, Y = 120 mm, and Z = 160 mm.
Averaging the values along the Y and Z axes revealed a decrease in Iprobe from the boundaries of the studied range toward the central region. At X = 0 mm, the average value was 337.09 mA, after which it gradually decreased to 255.44 mA at X = 140 mm. As the X coordinate increased further, the current rose, reaching 318.98 mA at X = 260 mm.
The average value of Iprobe was 260.68 mA over the whole range of X = 60–200 mm, and the CV was 9.65%. The maximum value in this range was 299.8 mA and was observed at coordinates X = 60 mm, Y = 100 mm, and Z = 120 mm.
When averaged over the X and Y coordinates, the lowest value was recorded at Z = 0 mm and amounted to 216.79 mA. As the Z coordinate increased, the average current rose, reaching 280.24 mA at Z = 120 mm, after which it decreased to 247.03 mA at Z = 200 mm.
The spatial maps of Iprobe at an interelectrode distance of 350 mm are shown in Figure 4.
Figure 4.
Averaged spatial distributions of Iprobe at an interelectrode distance of L = 350 mm: (a) distribution in the XY plane, averaged over the Z coordinate; (b) distribution in the XZ plane, averaged over the Y coordinate; (c) distribution in the YZ plane, averaged over the X coordinate (compiled by the authors).
At L = 200 mm, measurements were taken in the left outer region, the interelectrode space, and the right outer region. Iprobe varied from 195.6 to 761.7 mA throughout the entire studied volume. The minimum value was recorded at coordinates X = 0 mm, Y = 0 mm, and Z = 0 mm. The maximum value was observed to the right of the second plate at X = 240 mm, Y = 60 mm, and Z = 120 mm.
In the overall interelectrode region, the mean value of Iprobe was 361.85 mA, the median was 367.30 mA, and the CV was 17.55%. The maximum value in the compared region was 615.8 mA and was recorded at coordinates X = 80 mm, Y = 20 mm, and Z = 80 mm.
The distribution of mean values along the X-axis was non-uniform. An elevated value was observed at X = 60 mm and amounted to 426.31 mA. In the central part of the studied range, at X = 120–180 mm, the mean current varied from 334.65 to 337.84 mA. Near the right plate and beyond its outer edge, the average values increased to 518.35 mA at X = 220 mm and 447.46 mA at X = 240 mm.
In the general interelectrode region, the minimum average value along the height was 286.84 mA at Z = 0 mm. The maximum value, equal to 403.82 mA, was observed at Z = 80 mm. At the upper level of Z = 200 mm, the average value decreased to 318.06 mA.
Spatial maps of Iprobe at an interelectrode distance of 200 mm are shown in Figure 5.
Figure 5.
Averaged spatial distributions of Iprobe at an interelectrode distance L = 200 mm: (a) distribution in the XY plane, averaged over the Z coordinate; (b) distribution in the XZ plane, averaged over the Y coordinate; (c) distribution in the YZ plane, averaged over the X coordinate. The dotted lines indicate the positions of plates P1 and P2 (compiled by the authors).
At L = 150 mm, the measurement grid also covered three characteristic regions. Iprobe varied from 155.6 to 670.0 mA throughout the entire studied volume. The minimum value was recorded at coordinates X = 0 mm, Y = 0 mm, and Z = 0 mm. The maximum value was observed in the interelectrode region at X = 180 mm, Y = 60 mm, and Z = 120 mm.
In the overall interelectrode region, the mean value of Iprobe was 368.28 mA, and the median was 359.00 mA. The CV reached 21.57%, which was the highest value among the three configurations studied.
The averaged distribution along the X-axis was characterized by two regions of elevated Iprobe values. At X = 80 mm, the mean value was 443.30 mA, and at X = 180 mm, it was 430.55 mA. In the central part of the interelectrode space at X = 120 and 140 mm, the mean values were 332.55 and 327.73 mA, respectively.
When analyzing the distribution with respect to height, the minimum average value in the entire interelectrode region was 275.18 mA at Z = 0 mm. The highest average value, equal to 402.31 mA, was observed at Z = 120 mm. At Z = 200 mm, the average value decreased to 348.81 mA.
Spatial maps of Iprobe at an interelectrode distance of 150 mm are shown in Figure 6.
Figure 6.
Averaged spatial distributions of Iprobe at an interelectrode distance L = 150 mm: (a) distribution in the XY plane, averaged over the Z coordinate; (b) distribution in the XZ plane, averaged over the Y coordinate; (c) distribution in the YZ plane, averaged over the X coordinate. The dotted lines indicate the positions of plates P1 and P2 (compiled by the authors).
3.3. Comparison of Spatial Regions and Assessment of Iprobe Asymmetry
For configurations with interelectrode distances of 200 and 150 mm, a separate comparison was performed of the left outer, interelectrode, and right outer regions. Unlike the comparison of the three configurations in Section 3.1, which was conducted in the general region of X = 60–200 mm, in this case, the entire available measurement region—including the left outer, interelectrode, and right outer regions—was examined for each interelectrode distance. The results presented in Table 4 were used primarily to compare spatial regions within each individual configuration.
Table 4.
Iprobe values in individual spatial regions.
At L = 200 mm, the highest average value of Iprobe was recorded to the right of the second plate and amounted to 400.73 mA. In the interelectrode region, the average value was 375.27 mA, and to the left of the first plate, it was 306.00 mA. The right outer region also exhibited the highest CV—24.21%.
At L = 150 mm, the highest average value was observed between the plates and amounted to 368.28 mA. In the right and left outer regions, the average values were 303.51 and 275.51 mA, respectively. The CV in the interelectrode region was higher than in the outer regions.
For both interelectrode distances studied, the average Iprobe value in the right outer region exceeded that in the left outer region: by approximately 31% at L = 200 mm and 10.2% at L = 150 mm. Thus, despite changes in the positions of the plates relative to the measurement grid, the direction of the observed spatial asymmetry remained consistent across both configurations. This consistency suggests that the observed asymmetry may reflect differences in the condition of the electrode plates and could serve as a potential diagnostic indicator of electrode surface heterogeneity. Further experimental studies would be useful to evaluate the reproducibility of this spatial pattern under repeated measurement conditions.
4. Discussion
The key finding of this study is that the spatial structure of the electrical response contains diagnostic information that cannot be obtained solely from integral current characteristics. Thus, spatial inhomogeneity, local deviations, and persistent asymmetry in the spatial distribution of the probe current can be considered potential diagnostic indicators related to the state of the electrode plates. In this context, a change in the interelectrode distance significantly affected the absolute value and spatial variation of Iprobe. The main increase in the average value of Iprobe was observed when the distance was reduced from 350 to 200 mm and amounted to 38.8%, whereas further bringing the plates closer together to 150 mm resulted in only an additional increase of 1.8%. This indicates that the influence of the electrode system’s geometric configuration must be taken into account when interpreting the spatial electrical response diagnostically.
Despite similar average Iprobe values obtained for L = 200 and 150 mm, the spatial characteristics of the electrical response differed appreciably between these configurations. For L = 150 mm, the median value was lower, while the maximum value and the CV were higher than for L = 200 mm. Thus, configurations with similar integral current levels can exhibit markedly different spatial structures. This result indicates that the average current value alone is insufficient for the diagnostic characterization of an electrode system and that spatially resolved data provide additional information about its electrical state.
The change in the recorded current as the plates were brought closer together may be related to a change in the geometry of the conductive path through the electrolyte and the corresponding equivalent resistance of the measuring circuit [101]. In this context, the specifics of the measurement setup must be taken into account: the movable probe served as one of the electrodes in the electrical circuit, and the value of Iprobe was recorded at its specified spatial position. Therefore, Iprobe(X, Y, Z) should be regarded as the spatially dependent electrical response of the experimental system, rather than as a direct measurement of the local current density in an undisturbed volume of the electrolyte.
As the interelectrode distance decreased, the spatial heterogeneity of the measured Iprobe values increased. The CV increased sequentially from 9.65% at L = 350 mm to 17.55% at L = 200 mm and 21.57% at L = 150 mm. Moreover, the configuration with L = 150 mm was characterized by the appearance of two regions with elevated average values on either side of the geometric center of the interelectrode space, whereas lower values were recorded directly in the central region. Thus, the further approach of the plates was accompanied not only by a change in the average Iprobe level but also by a change in the spatial structure of the electrical response. This confirms that diagnostic interpretation should account not only for integral statistical indicators but also for the spatial localization, magnitude, and persistence of regions with elevated or reduced electrical response.
The observed distribution structure of Iprobe may be due to the finite dimensions of the plates [102], their relative arrangement, and changes in the geometry of the conductive path between the joined positive plates and the movable negative probe. As the probe was moved, its distances from the surfaces and edges of the plates changed, as did its position relative to the walls, the bottom, and the free surface of the electrolyte. These factors could have altered the equivalent resistance of the measuring circuit and, consequently, the magnitude of the recorded current. Therefore, the local maxima of Iprobe should be interpreted as features of the electrical response specific to the geometry of the experimental setup, rather than as a direct measurement of local current line concentration in undisturbed electrolyte. The importance of accounting for geometric configuration when analyzing the operating characteristics of industrial equipment has also been demonstrated in studies of finned-tube cooling systems, where changes in tube inclination affected aerodynamic resistance and heat-transfer characteristics [103].
A comparison of the interelectrode and external regions revealed differences not only in the magnitude of Iprobe but also between the left and right parts of the distribution, indicating the presence of spatial asymmetry in the recorded values. At L = 200 mm, the average probe current to the right of the second plate was approximately 31% higher than the corresponding value to the left of the first plate. At L = 150 mm, the average value in the right outer region was also approximately 10.2% higher than the value in the left region. Thus, despite the change in the plates’ positions, the direction of the spatial asymmetry remained the same: higher average values were recorded on the right side of the electrode system. Given the symmetrical arrangement of the electrode plates relative to the center of the cell, the preservation of the same direction of asymmetry across two different geometric configurations is of particular interest as a potential diagnostic indicator related to the condition of the electrodes.
Within each experimental configuration, the left and right outer measurement regions occupied geometrically corresponding positions relative to the electrode plates. Their comparison therefore allowed the observed spatial asymmetry to be examined without changing the nominal interelectrode distance. However, differences in electrical connections, current paths, and electrode surface conditions could still contribute to the measured response. Thus, the comparison helps distinguish the effects of changing interelectrode spacing from the asymmetry observed within a given configuration, although it does not provide a complete quantitative separation of geometric and electrode-related contributions.
The observed asymmetry is of particular interest in view of the differences in the surface condition of the electrode plates. Plate P1, located on the left side of the system, exhibited visible corrosion covering approximately 70% of each of its two main surfaces, according to a visual estimate, whereas plate P2, located on the right side, showed no visible signs of corrosion. The lower average probe current values recorded in the left outer region at L = 200 and 150 mm are consistent with the hypothesis that differences in electrode surface condition may affect the spatial electrical response. However, the measured current also depends on other factors, including the geometry of the conductive paths, electrical connections, and the measurement sequence. Therefore, although the available data do not allow the observed asymmetry to be attributed unequivocally to corrosion, the persistence of its direction across different interelectrode distances suggests that spatial asymmetry may serve as a potential diagnostic indicator of electrode surface heterogeneity.
A localized defect in an electrode may produce a corresponding variation in the spatial electrical response. However, in the present experiment, corrosion was distributed over a substantial portion of the P1 surface rather than concentrated within a defect of known dimensions and location. Moreover, the measured probe current represents the electrical response of the entire measurement circuit, which depends on both electrode surface condition and the geometry of the conductive paths. At L = 150 mm, elevated average current values were observed at X = 80 and 180 mm, although plate P2 showed no visible signs of corrosion. Therefore, these regions cannot be directly associated with individual corrosion sites. Nevertheless, the observed spatial variations and the persistence of left–right asymmetry suggest that the proposed approach may be useful for identifying differences in electrode surface condition. Further experiments with localized defects of known geometry would allow this diagnostic capability to be evaluated more directly.
The distribution of the measured Iprobe along the height of the electrolyte was also non-uniform. In all series, the minimum average values were observed at Z = 0 mm, while the maximum values were located at intermediate levels. For distances of 350 and 150 mm, the maximum average value was observed at Z = 120 mm, and for a distance of 200 mm, at Z = 80 mm. As the Z coordinate increased further, the current decreased. Thus, the variation of the average value of Iprobe with height was not monotonic.
The vertical heterogeneity of the recorded values may be related to the relative positions of the probe and the upper and lower edges of the plates, as well as to changes in the geometry of the conductive path as the probe moves along the Z-axis. The results demonstrate the importance of three-dimensional analysis of the electrical response for diagnostic purposes, since conclusions drawn from data from a single horizontal slice may depend heavily on the chosen measurement height.
From an energy perspective, reducing the interelectrode distance is of interest due to the potential reduction in the ohmic component of the voltage in the electrolyte and the corresponding electrical losses [101]. At the same time, the results show that reducing the distance is accompanied by an increase in the spatial heterogeneity of the recorded Iprobe values. Thus, reducing the interelectrode distance should be considered not only as a potential means of lowering the resistance of the conductive layer but also as a factor capable of altering the system’s spatial electrical response. In the context of industrial electrolysis, the results obtained indicate the advisability of jointly considering the energy benefits of reducing the interelectrode distance and factors related to the spatial heterogeneity of the electrical state and magnetohydrodynamic stability [7,8].
The results characterize the change in the electrical response of the laboratory system as the interelectrode distance varies. Since the spatial distribution of electric currents is one of the factors determining the magnetic field [104], the experimentally determined dependencies can be used as initial data for subsequent electromagnetic simulations. At the same time, it is not possible to directly reconstruct the spatial distribution of current density or magnetic induction from the obtained values of Iprobe.
The magnetic field is determined by the complete three-dimensional distribution of currents, their directions of flow, the geometry of the current-carrying elements, and the relative positions of the conductive parts. Electromagnetic forces additionally depend on the vector interaction between current density and magnetic induction [105]. Therefore, the obtained Iprobe maps should be regarded as a characterization of the electrical response of the laboratory system and as an experimental basis for subsequent electromagnetic modeling, rather than as a direct measurement of the magnetic field.
The results obtained expand our understanding of the potential to use the spatially dependent electrical response of a laboratory electrolytic system to identify local features of the electrical state and can be used in further comparisons with the results of numerical simulations that reproduce the geometry and electrical circuit of the laboratory experiment. However, at this stage, the work does not constitute a quantitative verification of the mathematical model, since no direct comparison of calculated and experimental characteristics was performed.
The obtained spatially distributed experimental data can be considered not only as a basis for subsequent electromagnetic modeling but also as an information base for the development of methods for monitoring the electrical state of technological systems. Modern approaches to monitoring energy and infrastructure facilities are based on the automated collection and processing of measurement data [106,107], the diagnosis of technical condition, and the formulation of equipment maintenance decisions [108,109,110]. Similar principles are used in predictive diagnostics and the identification of equipment operating modes based on measured parameters [111,112], as well as in the development of systems for modeling and automated control of continuous technological processes [113,114,115,116]. In this context, the three-dimensional Iprobe datasets obtained during the study can serve as an information basis for developing an automated diagnostic method for assessing the condition of electrodes using spatial characteristics such as symmetry violations, localized deviations, and their stability as the system’s geometry changes.
When interpreting the results, it is necessary to take into account the laboratory scale of the setup and the model medium used. An aqueous NaCl solution was used as the electrolyte, which differs significantly from the industrial cryolite-alumina melt in terms of electrical conductivity, temperature, viscosity, and other physicochemical properties [117,118]. Therefore, the absolute Iprobe values cannot be directly applied to an industrial electrolyzer. The absence of repeated series does not allow for an assessment of the reproducibility of the measurements, and the calculated standard deviations and coefficients of variation characterize only the spatial dispersion of the values. In this regard, the absolute Iprobe values should be interpreted primarily in a comparative context among the configurations studied.
A significant methodological limitation is that the metal measuring probe was part of the electrical circuit and, consequently, contributed to the electrical state of the system under study. Therefore, the obtained values characterize the system’s electrical response at a given probe position and cannot be considered as an undisturbed local current distribution in the electrolyte. Furthermore, since the measured values were not normalized to the probe’s working surface area, they cannot be interpreted as current density. The total experimental uncertainty was not quantified due to the lack of a complete set of metrological data for the measuring system and the coordinate positioning system; this constitutes a limitation of the present study. The importance of accounting for measurement-system characteristics has also been demonstrated in other engineering diagnostic applications, where calibration-related effects can significantly influence the accuracy of measured parameters and their diagnostic interpretation [119]. Since the coordinate points were recorded sequentially, any possible temporal drift in the electrical response within a single experimental series was not separated from the spatial component.
Gas evolution during electrolysis of the aqueous NaCl solution may have influenced the measured electrical response. During the experiments, gas bubbles were visually observed on the surface of the negatively polarized measuring probe, whereas no visible bubble formation was observed on the positively polarized stationary steel plates. Bubble formation at the probe was consistent with cathodic hydrogen evolution, although the gas composition was not determined experimentally. The presence of gas bubbles on the probe surface could have temporarily reduced the effective electrode–electrolyte contact area and altered the electrical resistance of the measurement circuit, thereby affecting the recorded probe current. Since bubble formation, surface coverage, and their temporal variation were not quantitatively monitored, their contribution to the measured current variations could not be determined. Future investigations should include monitoring of bubble formation and its influence on current stability to distinguish electrochemical effects from those associated with electrode geometry and surface condition.
It should also be noted that at a distance of 350 mm, measurements were performed only between the plates due to the limited working range of the coordinate table. Therefore, a comparison of all three configurations was conducted only in the common interelectrode region, and a comparison of the outer zones was possible only for distances of 200 and 150 mm. In the future, it would be advisable to conduct additional experimental series with simultaneous recording of the actual source voltage and the measured current at each coordinate point, as well as monitoring of the electrolyte’s temperature and electrical conductivity. This will allow us to assess the reproducibility of the obtained spatial dependencies and additionally calculate the equivalent electrical resistance of the system, Req = U/I, for various probe positions and interelectrode distances.
5. Conclusions
An experimental study of the electrical response of a laboratory electrolytic cell was carried out with spatial resolution in an effort to develop and evaluate spatial diagnostic features that enable the assessment of the condition of electrode plates. Measurements were taken at interelectrode distances of 350, 200, and 150 mm on a three-dimensional coordinate grid. Varying the interelectrode distance made it possible to assess whether the identified diagnostic features remained consistent when the geometric configuration of the electrode system was altered.
Reducing the interelectrode distance from 350 to 200 mm was accompanied by an increase in the average Iprobe value from 260.68 to 361.85 mA, i.e., by 38.8%. Upon further reduction of the distance to 150 mm, the average value increased to 368.28 mA. The difference between the 200 mm and 150 mm configurations was only 1.8%, indicating that there was no comparable increase in the average Iprobe value when the interelectrode distance was further reduced from 200 to 150 mm.
As the plates moved closer together, the spatial heterogeneity of the recorded Iprobe values increased. The CV increased from 9.65% at a distance of 350 mm to 17.55% at 200 mm and 21.57% at 150 mm. Thus, a further reduction in the distance between the plates was accompanied primarily by an increase in the spatial heterogeneity of the measured electrical response and the appearance of regions with elevated Iprobe values, rather than a uniform increase across all measured coordinate points.
In all configurations studied, the vertical distribution of the measured Iprobe was non-monotonic. The minimum averaged values were observed at the lower measurement level, while the maximum values were observed in the middle part of the electrolyte layer. At distances of 200 and 150 mm, spatial asymmetry in the electrical response was observed between the left and right outer regions of the cell. The average Iprobe value in the right region exceeded the corresponding value in the left region by approximately 31% at L = 200 mm and by 10.2% at L = 150 mm. The fact that the same direction of spatial asymmetry was observed at both interelectrode distances studied is considered a potential diagnostic indicator related to the condition of the electrode plates.
The results show that a single average Iprobe value is insufficient for the diagnostic characterization of the electrode system. Additional diagnostic information is contained in the spatial structure of the electrical response, including symmetry violations, localized regions with elevated or reduced values, and the persistence of these characteristics when the electrode geometry is altered. Thus, the observed spatial asymmetry can be considered a potential indicator of electrode heterogeneity or the presence of defects, although it is not direct evidence of a specific type of defect.
The results of this study provide an experimental basis for the further development of methods for assessing electrode surface condition using spatially resolved electrical-response measurements. The obtained three-dimensional Iprobe datasets can also be used for subsequent numerical modeling of the electrical and electromagnetic state of the laboratory system. Future work should include repeated experimental runs, controlled changes in the state of the electrodes, and an assessment of the reproducibility of the detected spatial asymmetry in order to distinguish diagnostic features associated with electrode defects from effects related to the connection scheme, measurement sequence, and other experimental factors.
Author Contributions
Conceptualization, D.M.G.; methodology, Y.V.I.; software, E.A.B.; validation, D.M.G.; formal analysis, E.A.B.; investigation, E.A.B.; resources, Y.V.I.; data curation, D.M.G.; writing—original draft preparation, E.A.B.; writing—review and editing, E.A.B.; visualization, E.A.B.; supervision, Y.V.I.; project administration, Y.V.I.; funding acquisition, Y.V.I. All authors have read and agreed to the published version of the manuscript.
Funding
This research received no external funding.
Data Availability Statement
The data presented in this study are available on request from the corresponding author. The data are not publicly available because they are part of an ongoing research project and are subject to commercial and industrial confidentiality restrictions. Summary data supporting the findings of this study are presented in the article.
Conflicts of Interest
The authors declare no conflicts of interest.
Abbreviation
The following abbreviation is used in this manuscript:
| CV | Coefficient of variation |
References
- Lian, X.; Gao, H.; Shen, L.; Yu, Y.; Wang, Y.; Peng, Z. Life Cycle Assessment of Primary Aluminum Production. Processes 2025, 13, 419. [Google Scholar] [CrossRef] [Scilit]
- Li, X.; Liu, Y.; Zhang, T. A comprehensive review of aluminium electrolysis and the waste generated by it. Waste Manag. Res. J. A Sustain. Circ. Econ. 2023, 41, 1498–1511. [Google Scholar] [CrossRef] [Scilit] [PubMed]
- Wong, C.-J.; Yao, Y.; Bao, J.; Skyllas-Kazacos, M.; Welch, B.J.; Jassim, A.; Mahmoud, M.; Arkhipov, A. Modelling of Coupled Mass and Thermal Balances in Hall-Heroult Cells During Anode Change. J. Electrochem. Soc. 2021, 168, 123506. [Google Scholar] [CrossRef] [Scilit]
- Novozhilov, I.M.; Ilyushina, A.N.; Martirosyan, K.V. Coupled Electro-Thermal Modeling of the Temperature Field in an Aluminum Reduction Cell Using the Finite Difference Method. Processes 2026, 14, 1284. [Google Scholar] [CrossRef] [Scilit]
- Shklyarskiy, Y.E.; Shklyarskiy, A.Y.; Zamyatin, E.O. Analysis of distortion-related electric power losses in aluminum industry. Tsvetnye Met. 2019, 4, 84–91. [Google Scholar] [CrossRef] [Scilit]
- Padamata, S.K.; Singh, K.; Haarberg, G.M.; Saevarsdottir, G. Wettable TiB2 Cathode for Aluminum Electrolysis: A Review. J. Sustain. Metall. 2022, 8, 613–624. [Google Scholar] [CrossRef] [Scilit]
- Li, M.; Ma, S.; Li, H.; Hou, W.; Cheng, B.; Hu, T.; Wang, Y. Mode Coupling Analysis of Interfacial Stability and Critical Anode–Cathode Distance in a 500-kA Aluminum Electrolysis Cell. JOM 2021, 73, 2741–2751. [Google Scholar] [CrossRef] [Scilit]
- Gesell, H.; Janoske, U. Magnetohydrodynamic Analysis of Load Shifting in Hall-Héroult Cells. J. Sustain. Metall. 2023, 9, 459–467. [Google Scholar] [CrossRef] [Scilit]
- Ran, L.; Li, J.; Zou, Z.; Zhang, B.; Li, Q.; Yang, S.; Zhang, H. Fully-Coupled Electric-Thermal-Flow Modeling and Investigation of Dynamic Thermal-Ledge Behavior in Aluminum Electrolysis Cell. J. Electrochem. Soc. 2024, 171, 093507. [Google Scholar] [CrossRef] [Scilit]
- Hua, J.; Beckstein, P.; Manger, E.; Kolås, S.; Jensen, Ø.; Marholm, S. Numerical Modeling of Anode Changes and Their Effect on Current Distribution and Magnetohydrodynamic Behavior of an Aluminium Reduction Cell. In Light Metals 2024; Wagstaff, S., Ed.; Springer Nature: Cham, Switzerland, 2024; pp. 481–492. [Google Scholar] [CrossRef] [Scilit]
- Bojarevics, V.; Dupuis, M. MHD Stability of Aluminium Cells—Cathode Design Effects. In Light Metals 2024; Wagstaff, S., Ed.; Springer Nature: Cham, Switzerland, 2024; pp. 746–753. [Google Scholar] [CrossRef] [Scilit]
- Bojarevics, V.; Dupuis, M. Application and Adaptability of MHD Stability Computation for Modern Aluminium Reduction Cells at Extreme Conditions of Low ACD. In Light Metals 2021; Perander, L., Ed.; Springer International Publishing: Berlin/Heidelberg, Germany, 2021; pp. 565–571. [Google Scholar] [CrossRef] [Scilit]
- Mohammad, I.; Kelley, D.H. Stabilizing a Low-Dimensional Model of Magnetohydrodynamic Instabilities in Aluminum Electrolysis Cells. In Light Metals 2022; Eskin, D., Ed.; Springer International Publishing: Berlin/Heidelberg, Germany, 2022; pp. 512–519. [Google Scholar] [CrossRef] [Scilit]
- Jha, A.; Ranjan, A.; Karagadde, S.; Rajgire, S.; Gupta, A. Analysis of Multimodal Magnetohydrodynamic Instability at the Bath-Metal Interface in Aluminum Reduction Cells. JOM 2026, 78, 3504–3523. [Google Scholar] [CrossRef] [Scilit]
- Mohammad, I.; Dupuis, M.; Funkenbusch, P.D.; Kelley, D.H. Stabilizing Electrolysis Cells with Oscillating Currents: Amplitude, Frequency, and Current Efficiency. In Light Metals 2022; Eskin, D., Ed.; Springer International Publishing: Berlin/Heidelberg, Germany, 2022; pp. 551–559. [Google Scholar] [CrossRef] [Scilit]
- Jha, A.; Ranjan, A.; Karagadde, S.; Gupta, A. Magnetohydrodynamic instability with bichromatic perturbations in aluminum reduction cells. Phys. Fluids 2023, 35, 074104. [Google Scholar] [CrossRef] [Scilit]
- Hou, W.; Sun, K.; Sun, S.; Li, M. Numerical Investigation of Electro-Thermal Field Distribution Law of Busbar under Different Operating Conditions. Metals 2023, 13, 1361. [Google Scholar] [CrossRef] [Scilit]
- Wong, C.-J.; Bao, J.; Skyllas-Kazacos, M.; Welch, B.; Mahmoud, M.; Arkhipov, A.; Ahli, N. Studies on Power Modulation of Aluminum Smelting Cells Based on a Discretized Mass and Thermal Dynamic Model. Metall. Mater. Trans. B 2023, 54, 562–577. [Google Scholar] [CrossRef] [Scilit]
- Yang, Y.; Yi, Y.; Xia, C.; Yu, J.; Zhao, Q.; Wang, F.; Hu, X.; Wang, Z. Study on Inter-electrode Process of Aluminum Electrolysis: An Insight into Inter-electrode Phenomena Under Current Fluctuations. J. Sustain. Metall. 2024, 10, 1594–1607. [Google Scholar] [CrossRef] [Scilit]
- Parida, D.R.; Singh, R.; Kalo, N.; Ravikrishna, K.V.S. Effect of Using a Copper Insert on Stability and Energy Balance in an Aluminum Production Cell. Trans. Indian Inst. Met. 2021, 74, 487–498. [Google Scholar] [CrossRef] [Scilit]
- Luo, Y.; Li, S.; Chen, D.; Liu, X.; Ma, C.; Li, X. Evaluation of cathode quality and damage of aluminium electrolytic cell based on non-destructive technology. Trans. Nonferrous Met. Soc. China 2021, 31, 3929–3942. [Google Scholar] [CrossRef] [Scilit]
- Zhou, S.; Diop, M.A.; Gao, B.; Wang, Z.; Hu, X.; Yang, Y.; Tao, W. Enhancing Sustainability in Aluminum Reduction Cells Through Cathode Repair Optimization and Numerical Simulations Study on Current Distribution and Erosion Hole Impact. J. Sustain. Metall. 2024, 10, 658–673. [Google Scholar] [CrossRef] [Scilit]
- Liu, X.; Feng, Y.; Witt, P.J.; Diop, M.A.; Zhao, Z.; Schwarz, M.P.; Wang, Z. A Numerical Evaluation of the Lorentz Force Effect on CO2 Bubble Flow in the Aluminum Reduction Cell. JOM 2023, 75, 1639–1648. [Google Scholar] [CrossRef] [Scilit]
- Zhou, S.; Wang, C.; Diop, M.A.; Gao, B.; Wang, Z. Numerical and On-Site Validation of Current Fluctuations and Cathode Wear on Melt Flow Stability in Flexible Aluminum Electrolysis Cells. J. Electrochem. Soc. 2025, 172, 053503. [Google Scholar] [CrossRef] [Scilit]
- Vachaparambil, K.J.; Johansen, S.T.; Soncini, R.M.; Solheim, A.; Einarsrud, K.E.; Elstad, K.R.; Tessier, J. Modelling Alumina Feeding and Transport in an Industrial Aluminium Reduction Cell Using a Pragmatic Computational Model. Metall. Mater. Trans. B 2025, 56, 1272–1288. [Google Scholar] [CrossRef] [Scilit]
- Sun, Y.; Gui, W.; Chen, X.; Xie, Y.; Xie, S.; Zou, Z. A dynamic spatial distributed information clustering method for aluminum electrolysis cell. Eng. Appl. Artif. Intell. 2023, 126, 106793. [Google Scholar] [CrossRef] [Scilit]
- LaJambe, D.; Duchesne, C.; Poulin, É.; Tessier, J. Development and economic evaluation of multivariate anodic incident detection systems. Miner. Eng. 2021, 172, 107144. [Google Scholar] [CrossRef] [Scilit]
- Huang, Z.; Yang, C.; Chen, X.; Zhou, X.; Gui, W. Time series clustering method with cluster validation to identify unknown local cell conditions in the aluminum reduction cell. Comput. Ind. Eng. 2022, 174, 108790. [Google Scholar] [CrossRef] [Scilit]
- Cui, J.; Li, Z.; Li, X.; Liu, B.; Li, Q.; Yan, Q.; Huang, R.; Lu, H.; Cao, B. A Novel Method of Local Anode Effect Prediction for Large Aluminum Reduction Cell. Appl. Sci. 2022, 12, 12403. [Google Scholar] [CrossRef] [Scilit]
- Yang, Y.; Zhang, Y.; Yu, J.; Wang, Z.; Shi, Z. Study on the Inter-Electrode Process of Aluminum Electrolysis (II)—Digital Analysis of the Anode Gas Distribution Patterns on the Anode Surface Using a See-Through Cell. Appl. Sci. 2021, 11, 7702. [Google Scholar] [CrossRef] [Scilit]
- Gao, B.; Niu, H.; Guan, Y.; Wang, Z.; Liu, J.; Taylor, M.P.; Chen, J.J.J. Visualization of Anode Effect in Aluminum Electrolysis. J. Electrochem. Soc. 2022, 169, 013505. [Google Scholar] [CrossRef] [Scilit]
- Sun, Y.; Chen, X.; Cen, L.; Gui, W.; Yang, C.; Zou, Z. A dynamic graph structure identification method of spatio-temporal correlation in an aluminum electrolysis cell. Appl. Soft Comput. 2024, 157, 111536. [Google Scholar] [CrossRef] [Scilit]
- Kopylova, N.S.; Slobodkin, S.M. Assessing the territory geodetic coverage to develop and use the network by means of information systems. Geod. Cartogr. 2026, 1028, 23–32. [Google Scholar] [CrossRef] [Scilit]
- Sun, Y.; Gui, W.; Chen, X.; Cen, L.; Yang, C.; Zou, Z. A large-scale graph clustering method for cell conditions spatio-temporal localization in aluminum electrolysis. Inf. Sci. 2024, 671, 120651. [Google Scholar] [CrossRef] [Scilit]
- Tsvetkov, P.; Samuseva, P.; Nikolaychuk, L. The research of the impact of energy efficiency on mitigating greenhouse gas emissions at the national level. Energy Convers. Manag. 2024, 314, 118671. [Google Scholar] [CrossRef] [Scilit]
- Litvinenko, V.; Petrov, E.; Vasilevskaya, D.; Yakovenko, A.; Naumov, I.; Ratnikov, M. Assessment of the role of the state in the management of mineral resources. J. Min. Inst. 2022, 259, 95–111. [Google Scholar] [CrossRef] [Scilit]
- Pashkevich, M.A.; Povarov, V.G.; Borisova, D.D. Precipitation of F– Ions on the Mineral Surfaces in Water Purification Processes. Water 2026, 18, 1975. [Google Scholar] [CrossRef] [Scilit]
- Semenova, T.Y.; Sokolov, I.O.; Medvedeva, L.V.; Katysheva, E.G. Balanced Risk Assessment and Management in Development of Hard-To-Recover Reserves Using Example of Heavy Oil. Int. J. Eng. 2027, 40, 555–568. [Google Scholar] [CrossRef] [Scilit]
- Phuong, N.M.; Tatiana, P.; Konstantin, S. Economic evaluation of solar energy projects in Vietnam using multi-criteria analysis. Clean Energy Sci. Technol. 2026, 4, 593. [Google Scholar] [CrossRef] [Scilit]
- Ponomarenko, T.; Spivakov, K.; Romasheva, N. Key Strategies and Future Prospects for Raw Material Diversification in Global Aluminum Production: A Case Study of UC RUSAL. Mining 2025, 5, 70. [Google Scholar] [CrossRef] [Scilit]
- Trushko, V.; Trushko, O. Integrated development of iron ore deposits based on competitive underground geotechnologies. J. Min. Inst. 2021, 250, 569–577. [Google Scholar] [CrossRef] [Scilit]
- Pervuhin, D.A.; Trushnikov, V.E.; Abramkin, S.E.; Hloponina, V.S.; Talanov, N.A. Development of Methods to Improve Stability of Underground Structures Operation. Int. J. Eng. 2025, 38, 472–487. [Google Scholar] [CrossRef] [Scilit]
- Zhukovskiy, Y.L.; Lavrik, A.Y.; Buldysko, A.D. Energy demand side management in stand-alone power supply system with renewable energy sources. J. Phys. Conf. Ser. 2021, 1753, 012059. [Google Scholar] [CrossRef] [Scilit]
- Shklyarskiy, Y.E.; Skamyin, A.N.; Shklyarskiy, A.Y. Effect of higher harmonics on electric power metering in a steel maker’s power networks. Tsvetnye Met. 2020, (10), 64–69. [Google Scholar] [CrossRef] [Scilit]
- Novozhilov, I.; Ilyushina, A.; Andryushenkov, V.; Martirosyan, K. Temperature Field Monitoring of an Aluminum Electrolyzer for Lining Defect Diagnosis. Processes 2026, 14, 3299. [Google Scholar] [CrossRef] [Scilit]
- Kukharova, T.; Medvedeva, E.; Novozhilov, I. Modeling of a Temperature Field Control System for a Carburizing Shaft Furnace. Processes 2026, 14, 1406. [Google Scholar] [CrossRef] [Scilit]
- Fedorova, E.; Pupysheva, E.; Morgunov, V. Modelling of Red-Mud Particle-Solid Distribution in the Feeder Cup of a Thickener Using the Combined CFD-DPM Approach. Symmetry 2022, 14, 2314. [Google Scholar] [CrossRef] [Scilit]
- Buslaev, G.; Lavrik, A.; Lavrik, A.; Tcvetkov, P. Hybrid system of hydrogen generation by water electrolysis and methane partial oxidation. Int. J. Hydrogen Energy 2023, 48, 24166–24179. [Google Scholar] [CrossRef] [Scilit]
- Rastvorova, I.I.; Belitskiy, A.A.; Dobush, I.V. Optimization of induction devices for aluminium casting to electromagnetic crystallizer. In Proceedings of the 2018 IEEE Conference of Russian Young Researchers in Electrical and Electronic Engineering (EIConRus), Moscow and St. Petersburg, Russia, 29 January–1 February 2018; pp. 758–760. [Google Scholar] [CrossRef] [Scilit]
- Andryushenkova, O.M.; Andryushenkov, V.A. Ways for mining companies to participate in the development of Russia’s metallurgical industry in the first half of the 18th century. Ugol 2026, 9–13. [Google Scholar]
- Andryushenkova, O.M.; Andryushenkov, V.A. Private mining companies and Russian state policy in the first half of the 18th century. Ugol 2026, 18–22. [Google Scholar]
- Fedorova, E.R.; Pupysheva, E.A.; Morgunov, V.V. Settling parameters determined during thickening and washing of red muds. Tsvetnye Met. 2023, 77–84. [Google Scholar] [CrossRef] [Scilit]
- Rastvorova, I.I.; Ermolovich, V.S. Impact of Blade Icing on the Performance of the Kola Wind Power Plant: Modelling and Analysis. WSEAS Trans. Power Syst. 2026, 21, 93. [Google Scholar] [CrossRef] [Scilit]
- Skamyin, A.; Vasilkov, O. Static load characteristics in the presence of high harmonics. E3S Web Conf. 2019, 140, 10005. [Google Scholar] [CrossRef] [Scilit]
- Skamyin, A.; Shklyarskiy, Y.; Dobush, V.; Dobush, I. Experimental Determination of Parameters of Nonlinear Electrical Load. Energies 2021, 14, 7762. [Google Scholar] [CrossRef] [Scilit]
- Shklyarskiy, Y.E.; Skamyin, A.N. Compensation of the reactive power in the presence of higher voltage harmonics at coke plants. Coke Chem. 2016, 59, 163–168. [Google Scholar] [CrossRef] [Scilit]
- Belsky, A.A.; Dobush, V.S. Analysis of UPS impact on power quality at point of common coupling of consumers. In Proceedings of the 2015 International Conference on Mechanical Engineering, Automation and Control Systems (MEACS), Tomsk, Russia, 1–4 December 2015; pp. 1–4. [Google Scholar] [CrossRef] [Scilit]
- Vasilkov, O.S.; Dobysh, V.S. Features of Application Hybrid Energy Storage in Power Supply Systems. In Proceedings of the 2019 IEEE Conference of Russian Young Researchers in Electrical and Electronic Engineering (EIConRus), Saint Petersburg and Moscow, Russia, 28–31 January 2019; pp. 728–730. [Google Scholar] [CrossRef] [Scilit]
- Iakovleva, E.; Belova, M.; Soares, A.; Rassõlkin, A. On the Issues of Spatial Modeling of Non-Standard Profiles by the Example of Electromagnetic Emission Measurement Data. Sustainability 2022, 14, 574. [Google Scholar] [CrossRef] [Scilit]
- Iakovleva, E.; Belova, M.; Soares, A. Specific Features of Mapping Large Discontinuous Faults by the Method of Electromagnetic Emission. Resources 2020, 9, 135. [Google Scholar] [CrossRef] [Scilit]
- Nos, O.V.; Pudkova, T.V.; Nos, N.I. The sliding-mode observer for PMSM field-oriented sensorless control with adaptive filter and PLL. Sci. Tech. J. Inf. Technol. Mech. Opt. 2024, 24, 415–423. [Google Scholar] [CrossRef] [Scilit]
- Kryltcov, S.; Solovev, S. Efficient wind energy generation within Arctic latitudes. E3S Web Conf. 2019, 140, 11005. [Google Scholar] [CrossRef] [Scilit]
- Korolev, N.; Solovev, S. Monitoring the technical condition of autonomous electrical systems with electric drive. E3S Web Conf. 2019, 140, 04015. [Google Scholar] [CrossRef] [Scilit]
- Belsky, A.; Dobush, V.; Ivanchenko, D. Wind-PV-Diesel Hybrid System with flexible DC-bus voltage level. In Proceedings of the 2014 Electric Power Quality and Supply Reliability Conference (PQ), Rakvere, Estonia, 11–13 June 2014; pp. 181–184. [Google Scholar] [CrossRef] [Scilit]
- Skamyin, A.N.; Rastvorova, I.V. Consumed power regulation algorithm in the presence of high harmonics. J. Phys. Conf. Ser. 2021, 1753, 012042. [Google Scholar] [CrossRef] [Scilit]
- Solovev, S.V.; Kryltcov, S.B.; Voytyuk, I.N. Static load characteristics consideration for determination of transmission line power capacity. In Proceedings of the 2018 IEEE Conference of Russian Young Researchers in Electrical and Electronic Engineering (EIConRus), Moscow and St. Petersburg, Russia, 29 January–1 February 2018; pp. 803–806. [Google Scholar] [CrossRef] [Scilit]
- Talanov, N.A.; Khloponina, V.S.; Fedorov, M.C. Systematic and Analytical Research of Methods for Analysing and Identifying the Technical Condition of Complex Technical Systems. In Proceedings of the 2023 V International Conference on Control in Technical Systems (CTS), Saint Petersburg, Russia, 21–23 September 2023; pp. 92–95. [Google Scholar] [CrossRef] [Scilit]
- Rastvorova, I.; Trufanov, S. Data transmission technologies for the development of a drilling rig control and diagnostic system. Int. J. Electr. Comput. Eng. (IJECE) 2025, 15, 5506–5514. [Google Scholar] [CrossRef] [Scilit]
- Rastvorova, I.I.; Dvoynikov, V.M. Analysis of Mathematical Models for Developing a Methodology to Measure Energy and Spatial Characteristics of Axial Impact During Well Drilling. WSEAS Trans. Appl. Theor. Mech. 2025, 20, 130–137. [Google Scholar] [CrossRef] [Scilit]
- Rastvorova, I.; Smirnov, V. Research on Electronic Monitoring Systems for the Drilling Process in Antarctic Conditions. WSEAS Trans. Electron. 2025, 16, 189. [Google Scholar] [CrossRef] [Scilit]
- Filatov, V.; Rastvorova, I.; Chmilenko, F. Enhancing the Information Content of IR Spectroscopy of High-Viscosity Oil in the Field Using Ultrasonic Sample Preparation. Energies 2026, 19, 3042. [Google Scholar] [CrossRef] [Scilit]
- Rastvorova, I.; Kiseleva, A.; Filatov, V.; Chmilenko, F.; Perevalov, Y. A Comparative Analysis of Vivaldi Antenna Designs for Autonomous Ground-Penetrating Radar Sensing of Antarctic Glaciers. Electronics 2026, 15, 2581. [Google Scholar] [CrossRef] [Scilit]
- Syasko, V.; Musikhin, A.; Gnivush, I.; Stepanova, M.; Vinogradova, A. Rolled Waterproofing Coating Delamination Detection by High-Voltage Testing. Coatings 2026, 16, 648. [Google Scholar] [CrossRef] [Scilit]
- Tulyakov, T.F.; Afanaseva, O.V. Comparative Analysis of Image Segmentation Methods in Power Line Monitoring Systems. Int. J. Eng. 2026, 39, 1–11. [Google Scholar] [CrossRef] [Scilit]
- Tukeev, D.L.; Afanaseva, O.V.; Tulyakov, T.F. Realization of Statistical Models Based on Symmetric Unimodal Distributions. Int. J. Eng. 2026, 39, 407–419. [Google Scholar] [CrossRef] [Scilit]
- Afanaseva, O.; Pervukhin, D.; Khatrusov, A. Vibration-Based Condition Monitoring of Diesel Engines in Industrial Energy Applications: A Scoping Review. Energies 2025, 18, 5717. [Google Scholar] [CrossRef] [Scilit]
- Afanaseva, O.; Afanasyev, M.; Neyrus, S.; Pervukhin, D.; Tukeev, D. Information and Analytical System Monitoring and Assessment of the Water Bodies State in the Mineral Resources Complex. Inventions 2024, 9, 115. [Google Scholar] [CrossRef] [Scilit]
- Ignatenko, A.; Afanaseva, O. Application of system analysis methods for the research of mining enterprise activity. In Proceedings of the 2023 Sixth International Conference of Women in Data Science at Prince Sultan University (WiDS PSU), Riyadh, Saudi Arabia, 14–15 March 2023; pp. 180–184. [Google Scholar] [CrossRef] [Scilit]
- Afanaseva, O.V.; Bezyukov, O.K.; Ignatenko, A.A. Method for Assessing the Relationship Between the Characteristics of Vibroactivity and the Design Parameters of a Marine Diesel. Acad. J. Manuf. Eng. 2024, 22, 68–75. [Google Scholar] [CrossRef] [Scilit]
- Afanaseva, O.V.; Putilo, S.Y.; Chirtsov, V.V.; Demidov, A.A. Simulation of the Work of Structural Units of Industrial Enterprises Using the Theory of Queuing Systems. Acad. J. Manuf. Eng. 2024, 22, 115–125. [Google Scholar]
- Andryushenkova, O.; Talanov, N.; Trushnikov, V.; Montero Gongora, D.; Shlipikov, O. A Hybrid Eulerian-Lagrangian Probability Model for Predicting Paraffin Deposits in Ball Valves During High-Paraffin Oil Transportation. Int. J. Eng. 2027, 40, 1129–1144. [Google Scholar] [CrossRef] [Scilit]
- Eremeeva, A.M.; Chumachenko, Y.A.; Khasanov, A.F.; Oleynik, I.L. Advanced hydroprocessing technology for sustainable diesel: Hydrotreatment of renewable and fossil feedstocks. Bioresour. Technol. Rep. 2026, 33, 102499. [Google Scholar] [CrossRef] [Scilit]
- Eremeeva, A.M.; Marinets, A.R.; Oleynik, I.L.; Povarov, V.G. Recycling of Waste Cooking Oils into a Biodiesel Fuel: Kinetics and Analysis. Recycling 2026, 11, 41. [Google Scholar] [CrossRef] [Scilit]
- Eremeeva, A.M.; Khasanov, A.F.; Oleynik, I.L.; Kondrasheva, N.K.; Marinets, A.R. Development of Biofuel as Marine Low-viscosity Fuels with Environmentally Friendly Components. Int. J. Eng. 2025, 38, 273–279. [Google Scholar] [CrossRef] [Scilit]
- Khasanov, A.F.; Eremeeva, A.M. Creation of Artificial Aeration System to Improve Water Quality in Reservoirs. Hydrology 2025, 12, 48. [Google Scholar] [CrossRef] [Scilit]
- Martirosyan, A.; Ilyushin, Y.; Afanaseva, O.; Kukharova, T.; Asadulagi, M.; Khloponina, V. Development of an Oil Field’s Conceptual Model. Int. J. Eng. 2025, 38, 381–388. [Google Scholar] [CrossRef] [Scilit]
- Semenova, T.; Martínez Santoyo, J.Y. Economic Strategy for Developing the Oil Industry in Mexico by Incorporating Environmental Factors. Sustainability 2023, 16, 36. [Google Scholar] [CrossRef] [Scilit]
- Semenova, T.; Churrana, N. Assessment of the Projects’ Prospects in the Economic and Technological Development of the Oil and Gas Complex in the Republic of Mozambique. Resources 2025, 14, 106. [Google Scholar] [CrossRef] [Scilit]
- Yungmeister, D.A.; Urazbahtin, R.J.; Timofeev, M.I.; Lavrenko, S.A. Modeling and optimization of the use of tunneling complexes in the construction of auxiliary workings. Min. Informational Anal. Bull. 2025, 117–135. [Google Scholar] [CrossRef] [Scilit]
- Yungmeyster, D.A.; Urazbakhtin, R.Y.; Nguyen, K.L.; Timofeev, M.I. Tunneling complex for the construction of especially hazardous waste storage facilities: Justification of the design and parameters. Obogashchenie Rud 2023, 47–51. [Google Scholar] [CrossRef] [Scilit]
- Kopteva, A.V.; Voytyuk, I.N. The algorithm of measuring parameters of separate oil streams components. IOP Conf. Ser. Mater. Sci. Eng. 2017, 177, 012006. [Google Scholar] [CrossRef] [Scilit]
- Kopteva, A.V.; Starshaya, V.V.; Malarev, V.I.; Koptev, V.Y. Improving the efficiency of petroleum transport systems by operative monitoring of oil flows and detection of illegal incuts. In Topical Issues of Rational Use of Natural Resources 2019; CRC Press: Boca Raton, FL, USA, 2019; pp. 406–415. [Google Scholar] [CrossRef] [Scilit]
- Khaykin, M.M.; Priyma, K.A. Digital Transformation Management Issues: An Oil-and-Gas Industry Example. In Navigating Digital Transformation: Original Research Across Smart Cities, Sustainable Development and Beyond; Nova Science Publishers: New York, NY, USA, 2024; pp. 99–112. Available online: https://www.scopus.com/record/display.uri?eid=2-s2.0-85201999356&origin=resultslist (accessed on 10 September 2026).
- Kotov, D.D.; Pervukhin, D.A.; Davardoost, H.; Afanaseva, O.V. Prospects for the Use of Autonomous Underwater Vehicles (AUV) to Solve the Problems of the Mineral Resources Complex (MRC) of the Russian Federation. J. Marit. Res. 2024, 21, 309–317. [Google Scholar]
- Filotás, D.; Izquierdo, J.; Fernández-Pérez, B.M.; Nagy, L.; Nagy, G.; Souto, R.M. Contributions of Microelectrochemical Scanning Techniques for the Efficient Detection of Localized Corrosion Processes at the Cut Edges of Polymer-Coated Galvanized Steel. Molecules 2022, 27, 2167. [Google Scholar] [CrossRef] [Scilit] [PubMed]
- Prabhakaran, V.; Kalsar, R.; Strange, L.; Marina, O.A.; Prabhakaran, R.; Joshi, V.V. Understanding Localized Corrosion on Metal Surfaces Using Scanning Electrochemical Cell Impedance Microscopy (SECCIM). J. Phys. Chem. C 2022, 126, 12519–12526. [Google Scholar] [CrossRef] [Scilit]
- Hernández-Concepción, B.; Souto, R.M.; Izquierdo, J. Novel dynamic method based on CV-SECM and SWV-SECM for the in situ chemical imaging of reactive metal surfaces undergoing corrosion and corrosion inhibition illustrated with the case of copper corrosion inhibition by benzotriazole. Electrochim. Acta 2024, 474, 143538. [Google Scholar] [CrossRef] [Scilit]
- Park, I.; Durmus, Y.E.; Montiel Guerrero, S.S.; Kungl, H.; Tempel, H.; Eichel, R.-A.; Hausen, F. In-situ electrochemical mapping of local activity on Zn and Zn-Al alloy electrodes by scanning electrochemical microscopy. Electrochim. Acta 2024, 503, 144821. [Google Scholar] [CrossRef] [Scilit]
- Geevarghese, D.M.; Hakimian, S.; Mena-Morcillo, E.; Asare, E.; Sun, L.; De Medeiros, C.; Gateman, S.M. Resolving the mechanism of inclusion-controlled corrosion in advanced high-strength steels with scanning electrochemical probe microscopy. npj Mater. Degrad. 2026, 10, 112. [Google Scholar] [CrossRef] [Scilit] [PubMed]
- Hegde, P.; Gundrum, T.; Horstmann, G.M. A model experiment to study the metal pad roll instability under ambient conditions. Exp. Fluids 2025, 66, 76. [Google Scholar] [CrossRef] [Scilit]
- Saevarsdottir, G.; Magnusson, T.; Kvande, H. Reducing the Carbon Footprint: Primary Production of Aluminum and Silicon with Changing Energy Systems. J. Sustain. Metall. 2021, 7, 848–857. [Google Scholar] [CrossRef] [Scilit]
- Polyakov, A.A.; Gorlanov, E.S.; Mushihin, E.A. Analytical Modeling of Current and Potential Distribution over Carbon and Low-Consumable Anodes during Aluminum Reduction Process. J. Electrochem. Soc. 2022, 169, 053502. [Google Scholar] [CrossRef] [Scilit]
- Marshalova, G.S.; Sukhotsky, A.B.; Maksarov, V.V.; Sinyukov, M.S.; Danilchik, E.S.; Ostrovskaya, D.V.; Popov, V.A. The Effect of Pipe Inclination on the Thermal and Aerodynamic Characteristics of Finned Bundles in Air Cooling Devices. Int. J. Eng. 2027, 40, 206–215. [Google Scholar] [CrossRef] [Scilit]
- Bojarevics, V. MHD effects of the alumina dissolution in aluminium electrolysis cells. Magnetohydrodynamics 2023, 59, 335–346. [Google Scholar] [CrossRef] [Scilit]
- Horstmann, G.M.; Kuhn, J.; Dohnal, F. Suppression of magnetohydrodynamic interfacial wave instabilities by means of parametric anti-resonance. Nonlinear Dyn. 2025, 113, 14449–14469. [Google Scholar] [CrossRef] [Scilit]
- Afanaseva, O.V.; Tulyakov, T.F.; Shaimardanov, A.A. Deep Learning-Based Visual Analytics for Efficiency and Safety Optimization in Power Infrastructure. Eng 2026, 7, 135. [Google Scholar] [CrossRef] [Scilit]
- Afanaseva, O.V.; Tulyakov, T.F. A methodology to develop an information and control system to monitor the technical state of power transmission lines. Elektrotehniški Vestn. 2025, 92, 221–228. [Google Scholar]
- Nazarychev, A.; Tereshchenko, I. Power Quality Disturbances and Operating Regimes as Determinants of Reliability and Technical Condition of Industrial Electrical Equipment: A Comprehensive Review. Energies 2026, 19, 2685. [Google Scholar] [CrossRef] [Scilit]
- Nazarychev, A.; Iliev, I.; Manukian, D.; Beloev, H.; Suslov, K.; Beloev, I. Review of Operating Conditions, Diagnostic Methods, and Technical Condition Assessment to Improve Reliability and Develop a Maintenance Strategy for Electrical Equipment. Energies 2025, 18, 5832. [Google Scholar] [CrossRef] [Scilit]
- Nazarychev, A.; Iliev, I.; Manukian, D.; Beloev, H.; Suslov, K.; Beloev, I. Methodology for Developing a Maintenance Action Program for Power Units of Captive Power Plants Based on an Integrated Priority Indicator. Energies 2026, 19, 1584. [Google Scholar] [CrossRef] [Scilit]
- Tukeev, D.; Afanaseva, O.; Khatrusov, A. Synthesis of Decision Logic for Predictive Maintenance of a Marine Diesel Engine Based on Unconditional Control-Reliability Indicators. Eng 2026, 7, 190. [Google Scholar] [CrossRef] [Scilit]
- Zhukovskiy, Y.; Suslikov, P.; Rasputin, D. NILM-Based Feedback for Demand Response: A Reproducible Binary State-Detection Algorithm Using Active Power. Electricity 2026, 7, 23. [Google Scholar] [CrossRef] [Scilit]
- Martirosyan, A.V.; Romashin, D.V. Investigation of the Control Strategies for Enhancing the Efficiency of Natural Gas Separation and Purification Processes. Processes 2026, 14, 700. [Google Scholar] [CrossRef] [Scilit]
- Kukharova, T.; Maltsev, P.; Abramkin, S.; Novozhilov, I. Analysis of Modern Challenges and Technological Solutions in Natural Gas Production at Fields with Complex Geological Structure: A Review. Resources 2026, 15, 32. [Google Scholar] [CrossRef] [Scilit]
- Kukharova, T.; Maltsev, P.; Novozhilov, I. Development of a Control System for Pressure Distribution During Gas Production in a Structurally Complex Field. Appl. Syst. Innov. 2025, 8, 51. [Google Scholar] [CrossRef] [Scilit]
- Talanov, N.; Asadulagi, M.; Andryushenkova, O.; Shidlovskaya, K.; Sharifullina, A. Exploration and Synthesis of a Temperature Control System for an Underground Oil Storage Facility. Int. J. Eng. 2026, 39, 3144–3153. [Google Scholar] [CrossRef] [Scilit]
- Arkhipov, P.; Tkacheva, O. The Electrical Conductivity of Molten Oxide-Fluoride Cryolite Mixtures. Materials 2021, 14, 7419. [Google Scholar] [CrossRef] [Scilit] [PubMed]
- Tkacheva, O.; Arkhipov, P.; Kataev, A.; Rudenko, A.; Zaykov, Y. Electrolyte viscosity and solid phase formation during aluminium electrolysis. Electrochem. Commun. 2021, 122, 106893. [Google Scholar] [CrossRef] [Scilit]
- Shikhov, A.I.; Gromyka, D.S.; Umansky, A.S.; Kopytina, D.V.; Shakirzyanova, D.R.; Shmakov, A.M. Improving the Accuracy of Hardness Measurement using UCI Transducers for Inspecting the Heat-Affected Zone of Welded Joints in Steel Pipelines. Int. J. Eng. 2026, 39, 2500–2508. [Google Scholar] [CrossRef] [Scilit]
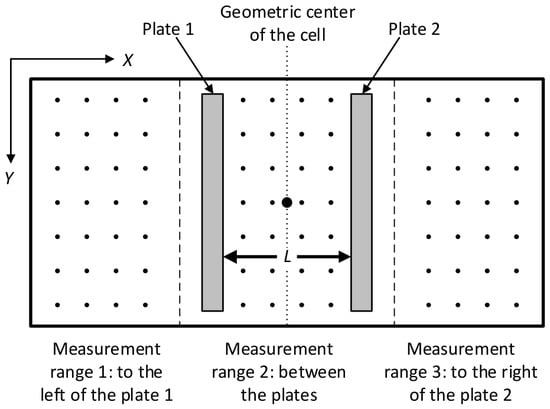
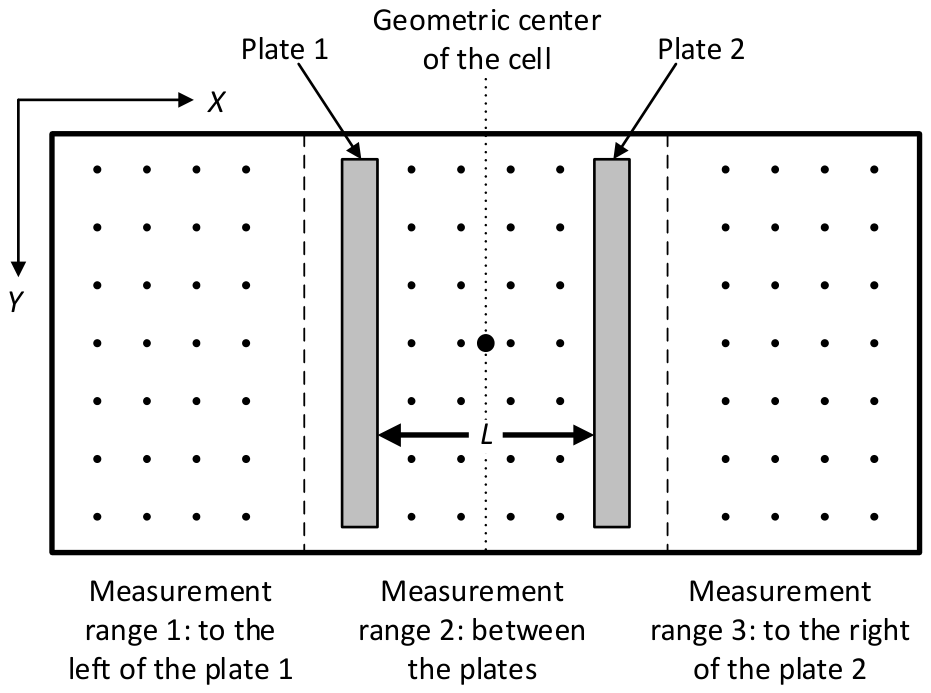
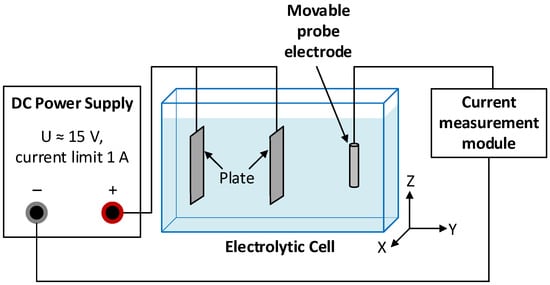
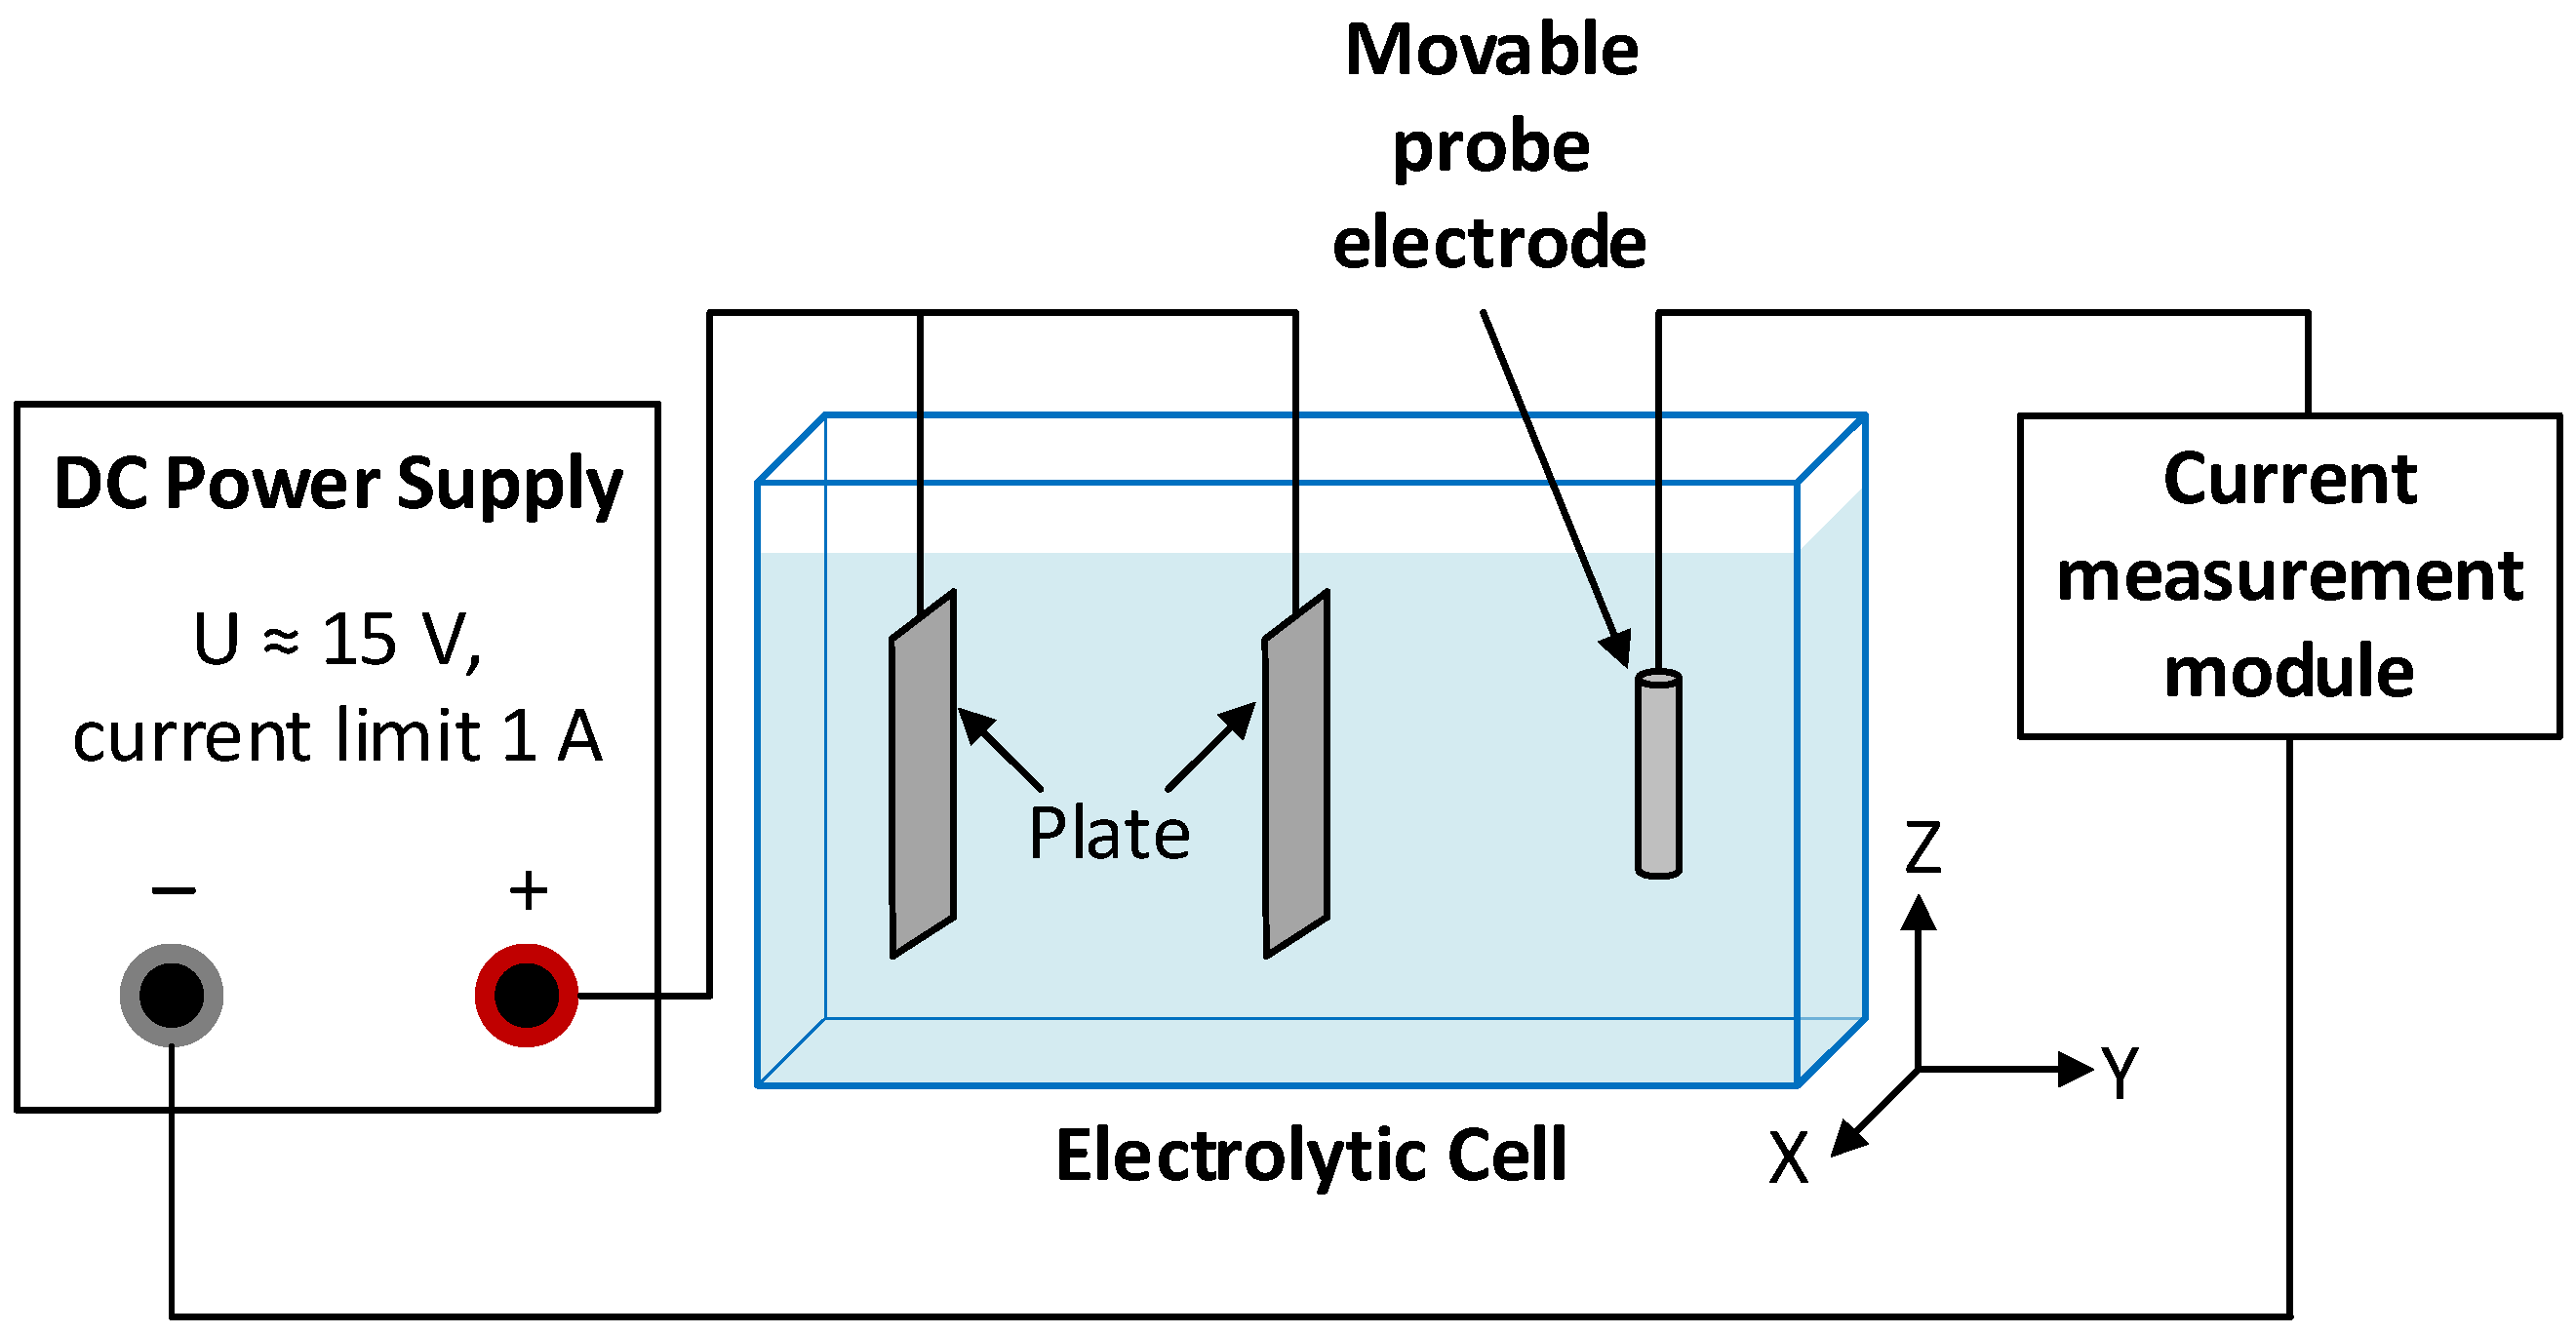
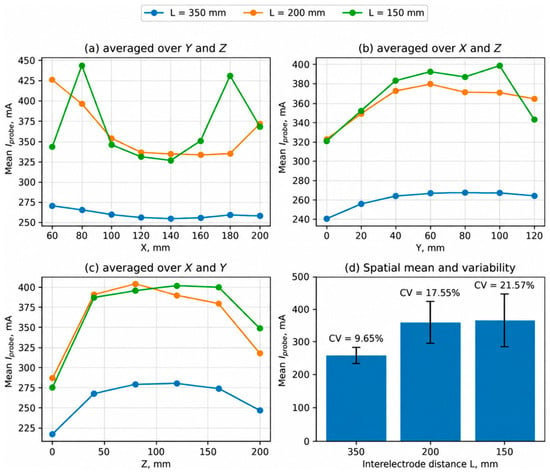
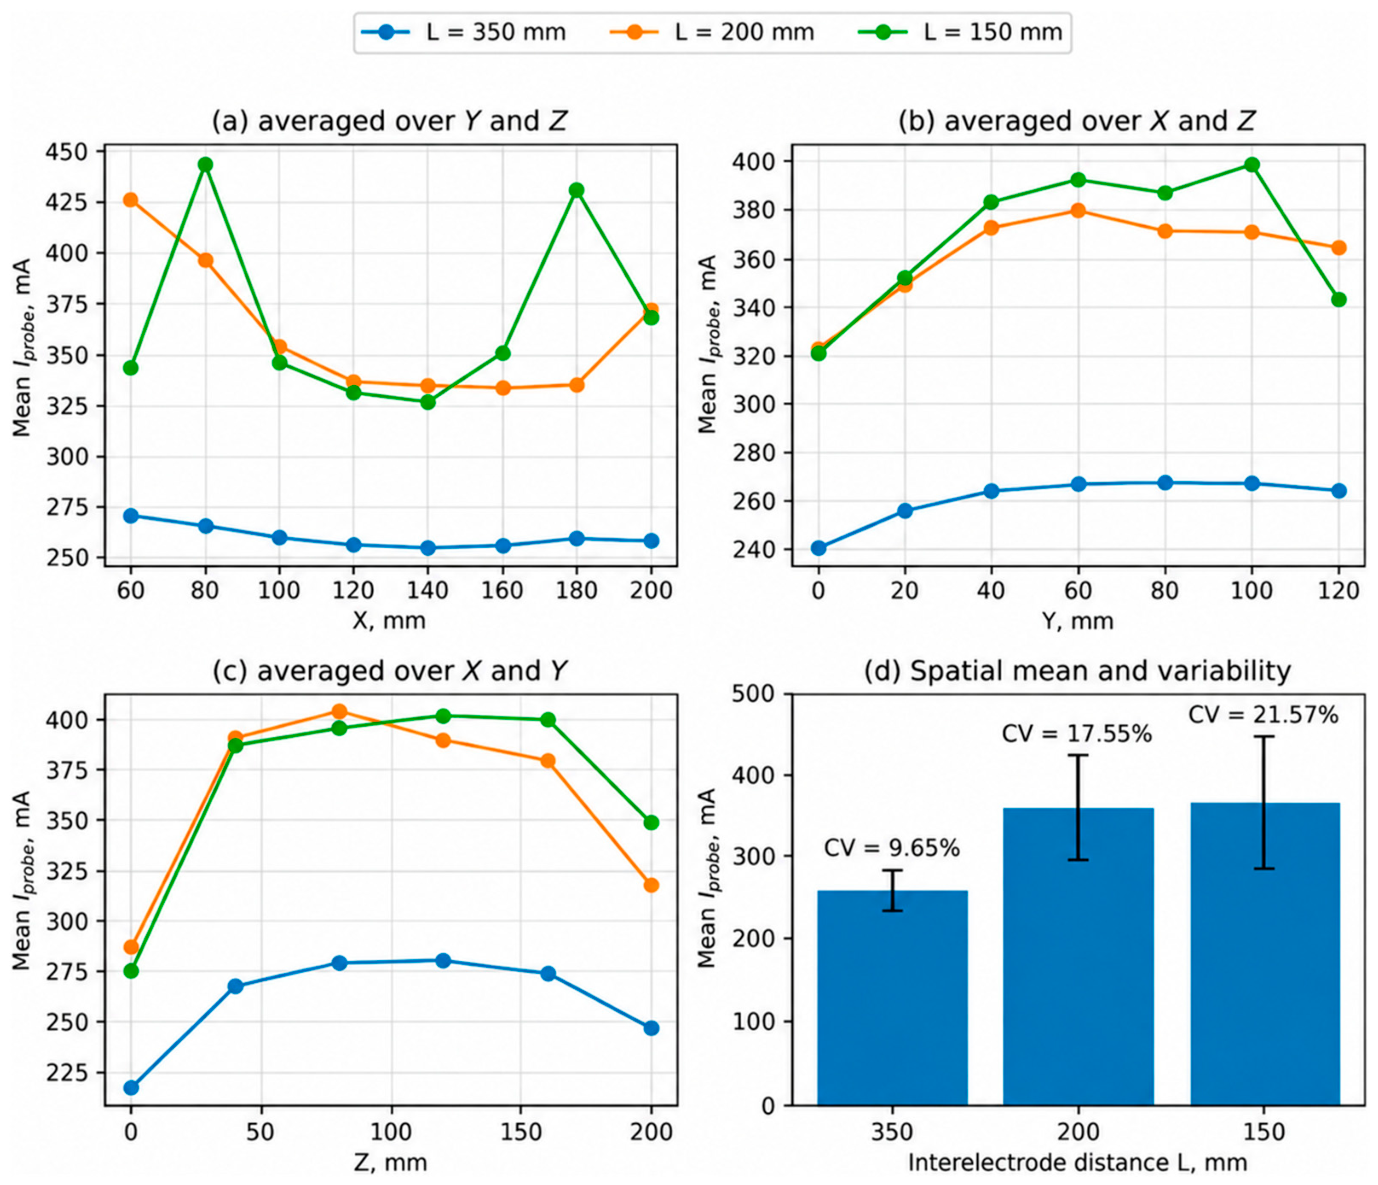
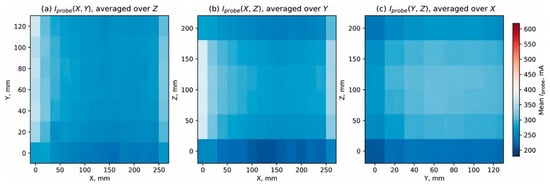
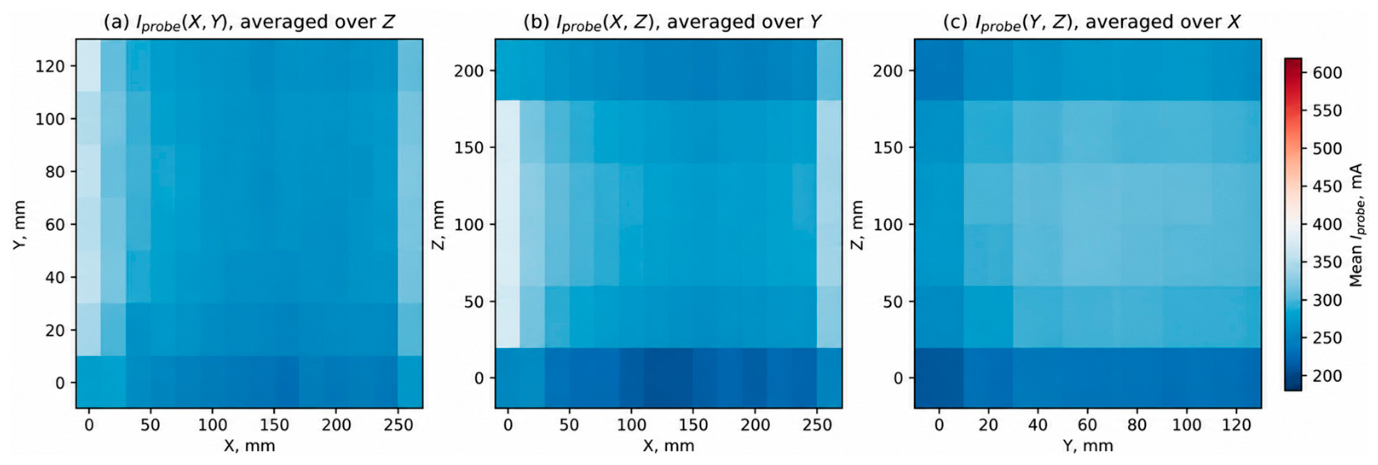
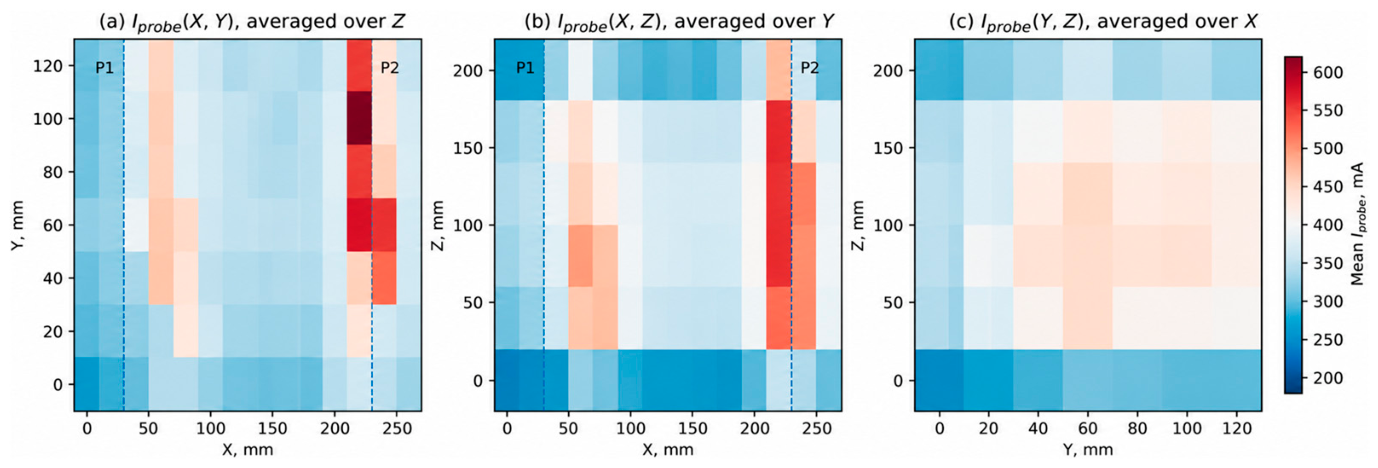
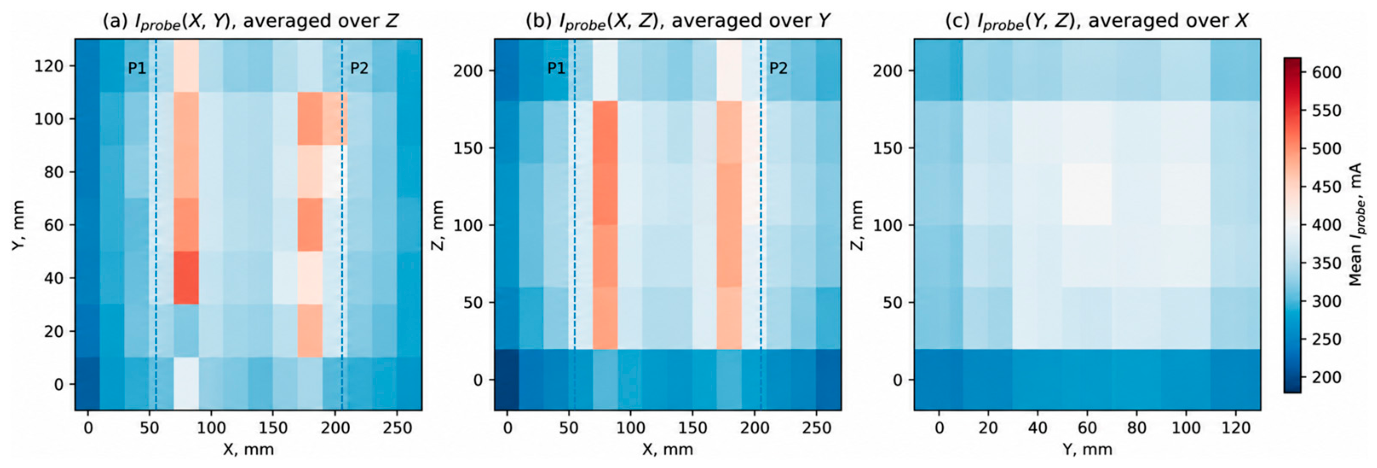

Disclaimer/Publisher’s Note: The statements, opinions and data contained in all publications are solely those of the individual author(s) and contributor(s) and not of MDPI and/or the editor(s). MDPI and/or the editor(s) disclaim responsibility for any injury to people or property resulting from any ideas, methods, instructions or products referred to in the content. |
© 2026 by the authors. Licensee MDPI, Basel, Switzerland. This article is an open access article distributed under the terms and conditions of the Creative Commons Attribution (CC BY) license.