


Abstract
This article presents an interregional analysis of the future of road transport powered by proton exchange membrane fuel cells (PEMFCs), considered as a system encompassing fuel-cell technology, vehicle segments, 70 MPa hydrogen refuelling infrastructure (H70), hydrogen supply and storage, economics, and policy support. The review synthesis draws on literature, documents, standards, regulations, and case studies from Asia, Europe, and North America. The results indicate that the development of fuel cell electric vehicles (FCEVs) is multi-segmental: passenger cars advance compact PEMFC integration and H70 operating experience, public and captive fleets stabilise demand, while logistics and heavy-duty transport increase infrastructure capacity and reliability requirements. Vehicle utility depends not only on station availability but also on scalability, redundancy, compression, cooling, and resilient hydrogen supply. Fuel and infrastructure costs depend on asset utilisation, demand stability, and market scale, while region-specific results should not be directly transferred to other markets. The contribution is a synthesis of three development scenarios: limited, fleet-based, and multi-segment. Rather than predicting market shares, these scenarios organise the conditions for transitioning from demonstration projects to a market. The role of FCEVs depends on coordinated development across vehicle segments, H70 infrastructure, hydrogen supply, economics, and policy, while maintaining complementarity with battery-electric mobility.
1. Introduction: Decarbonisation of Road Transport and the Role of Zero-Emission Powertrains
1.1. Road Transport as a Source of Emissions and Regulatory Pressure
Road transport is an important area of the energy and environmental transition because of its CO2 emissions and contribution to local air pollution in urban areas. Stricter emission requirements respond both to the need to protect public health and to long-term climate objectives. The future of vehicle powertrains should therefore be considered as part of the transformation of the entire transport system.
The impact of transport on air quality is particularly evident in large urban areas, where road-traffic emissions combine with emissions from industry, municipal sources, and the energy sector. In Shanghai, despite a substantial reduction in industrial emissions, transport remained an important factor affecting the composition of air pollution during winter periods. In 2019, nitrogen oxide emissions generated by road transport accounted for approximately 80% of total NOx emissions. At the same time, although industrial NOx emissions fell by approximately 88% between 2014 and 2019, total NOx emissions decreased by only approximately 54%; this was linked to growth in the vehicle fleet and the continuing importance of transport as the dominant source of these emissions [1]. Similar challenges occur in highly urbanised regions of Europe and the United States. In urban areas of the European Union, road transport accounts for 47% of NOx emissions [2]. In the United States, elevated traffic-related NO2 levels are concentrated along major highways and in the largest metropolitan areas [3]. Pressure to electrify road transport therefore arises not only from climate objectives but also from the need to reduce the direct effects of road-traffic emissions on air quality and public health.
At the beginning of the third decade of the twenty-first century, the principal automotive regions adopted targets for reducing CO2 emissions or the fuel consumption of new vehicles. The European Union established fleet-wide CO2 emission targets, the United States combined greenhouse-gas emission and fuel-efficiency requirements, while China and Japan adopted fuel-consumption targets. Different units, test procedures, and implementation periods reflect different regional starting points, but the common direction remains an increasing role for low- and zero-emission powertrains [4,5,6,7].
Measures aimed at improving the efficiency of internal combustion engines, including their use in hybrid powertrains, can reduce fuel consumption and emissions of pollutants and CO2, but are insufficient to achieve zero tailpipe emissions. If the objective is to eliminate exhaust emissions completely during vehicle operation, electric powertrains are required.
1.2. Two Pathways for the Electrification of Road Transport: BEVs and FCEVs
Two principal pathways for powertrain electrification can be distinguished in road transport. The first comprises battery electric vehicles (BEVs), in which electricity is stored in traction batteries and replenished by charging from the power grid. The second comprises fuel cell electric vehicles (FCEVs), in which electricity is generated on board through the electrochemical conversion of hydrogen. In both cases, the final element of the system is an electric powertrain; however, the architecture used to store or generate energy leads to different technical, infrastructural, and operational implications [8,9,10].
BEVs are directly connected to the power system and require charging infrastructure with appropriately selected power capacity, availability, and vehicle dwell time. FCEVs, by contrast, require infrastructure for hydrogen production, transport, storage, and refuelling, but offer short refuelling times, which are particularly important in intensive, fleet-based, and long-distance applications.
Battery-electric propulsion is not a new development in automotive history. Electric vehicles were already being developed in the late nineteenth century and, at the beginning of the twentieth century, constituted one of the significant vehicle categories, competing with steam-powered and internal combustion engine vehicles [11]. In subsequent decades, the role of electric vehicles declined as high-volume vehicle production developed around the internal combustion engine as the principal design solution. The growing availability of fuels and the longer range of internal combustion engine vehicles also supported the widespread adoption of this technology. Renewed interest in battery-electric powertrains became evident in development programmes implemented during the 1990s [11]. Fuel cell technology entered modern transport applications later than internal combustion engine and battery-electric powertrains. It should be assessed at the level of an integrated technical and energy system, rather than solely through direct comparisons between vehicles.
1.3. The Role of Passenger Cars and the Need for a System-Level Perspective
Proton exchange membrane fuel cell (PEMFC) powertrains were introduced to the market in mass produced passenger-car models. Vehicle packaging constraints required compact powertrain integration, the combination of high-pressure hydrogen tanks, safety, short refuelling times, durability, and production repeatability.
The current dynamics of market development do not necessarily correspond to its long-term structure. During the transition phase, vehicle fleets, buses, logistics, and heavy-duty road transport are particularly important, whereas achieving sufficient scale over the long term may once again increase the role of passenger cars, provided that cost, infrastructure, and fuel-supply conditions are met.
The analysis therefore distinguishes between the current situation, the transition phase, and a possible future market structure.
2. Scope and Method of the Literature-Based Technical Analysis
2.1. Aim and Structure of the Article
The aim of this article is to provide an interregional, system-level analysis of the potential development of PEMFC-powered road transport, encompassing technology, vehicle segments, refuelling infrastructure, hydrogen supply and storage, economics, and support policies. The analysis draws on scientific publications, technical documents, standards, and case studies from Europe, Asia, and North America, representing different levels of technological, infrastructural, and market maturity.
After defining the scope and method, the analysis addresses the maturity of PEMFC technology, vehicle segments, refuelling infrastructure and the hydrogen supply chain, economics, and market-development support instruments. The development scenarios and conclusions provide a synthesis of the findings.
2.2. Nature of the Article and Scope of the Analysis
The article is a review-based analytical study focused on identifying relationships between the maturation of PEMFC technology, its application across road-transport segments, and the development of hydrogen infrastructure and markets under diverse geographical, energy-system, and regulatory conditions.
The scope covers passenger cars, light commercial and commercial vehicles, city buses, and heavy-duty road transport, using sources and case studies from Asia, Europe, and North America. Battery-electric mobility serves as a reference point for operational, infrastructural, and energy-system requirements, rather than as a basis for ranking technologies.
The conclusions were formulated with due consideration of the assumptions and limitations of the sources used. The scenarios organise the identified relationships and do not constitute quantitative forecasts.
2.3. Selection and Classification of Source Material
The article is based on a narrative literature review aimed at identifying relationships between PEMFC technology, vehicle segments, refuelling infrastructure, the hydrogen supply chain, economics, and support policies. Sources published up to 5 November 2026 were considered. They were identified through scientific and technical publications, official repositories of public institutions and international organisations, standards databases, and documentation concerning demonstration projects and manufacturers.
The search combined scientific databases and publisher platforms with standards and institutional repositories. The principal sources consulted included Scopus, Web of Science, Google Scholar, ScienceDirect, and the official repositories of the International Energy Agency, the European Commission, the U.S. Department of Energy, ISO, SAE International, and relevant national administrations. Search terms were combined in thematic groups covering “PEM fuel cell” or “PEMFC”, “fuel cell electric vehicle” or “FCEV”, “hydrogen refuelling station” or “HRS”, “70 MPa hydrogen refuelling (H70)” or “hydrogen fuelling protocol”, “heavy-duty hydrogen vehicle”, “hydrogen supply chain”, “hydrogen storage”, “hydrogen infrastructure cost”, and “hydrogen transport policy”. The search was supplemented by backward reference checking and targeted searches for standards, policy documents, and documented deployment cases. The final analysis included 65 sources. As the study was designed as a narrative, system-level review rather than a systematic review conducted under a prospectively defined PRISMA protocol, the search and source-selection process was iterative and was not intended to produce a PRISMA-based record count. Methodological transparency is therefore provided through the specification of databases and repositories, thematic search-term groups, the search cut-off date, source-selection criteria, and the analytical classification applied to the sources included in the final synthesis.
Sources were included if they were directly related to the defined areas of analysis and contained technical data, analytical findings, normative requirements, model assumptions, or documented deployment examples. Priority was given to peer-reviewed publications, published standards, legal acts, institutional reports, and primary sources. Manufacturer-provided materials were used as supplementary sources to describe the manufacturers’ own solutions, parameters, and deployments, while secondary sources were used only when no publicly available primary document could be identified. Draft standards were considered exclusively as indications of the direction of technical standardisation. Sources were excluded if they duplicated evidence already represented by a primary source, fell outside the road-transport and associated hydrogen-system scope, lacked identifiable data, methods, normative requirements, or a documented deployment basis, or consisted only of unsupported promotional claims. Sources concerning non-road applications were retained only where they provided transferable evidence relevant to PEMFC technology, hydrogen storage or supply, infrastructure, safety, or system integration.
Scientific and technical publications were used to assess emissions, energy conversion, operation, and the industrialisation of PEMFC systems [8,12,13,14,15]; draft standards were used to identify the direction of technical standardisation [16]; published standards documents were used to describe refuelling and safety [17,18]; infrastructure and techno-economic analyses were used to assess stations and the supply chain [19,20,21,22,23,24]; and strategic and regulatory documents were used to identify market conditions and support mechanisms [25,26,27,28,29,30,31]. Regional case studies were used comparatively to identify different technological, infrastructural, and institutional configurations, rather than to transfer the findings from one market directly to other regions.
The simplified workflow used for source identification, assessment, analytical classification, and inclusion in the final narrative synthesis is presented in Figure 1.
Figure 1.
Simplified workflow for source identification, assessment, analytical classification, and inclusion in the narrative synthesis. Source: prepared by the author.
2.4. Environmental Assessment Framework
The environmental assessment of transport technologies requires consideration of the entire energy and fuel conversion chain, rather than only emissions at the point of vehicle use. For hydrogen, ISO/TS 19870:2023 covers emissions associated with production, conditioning, and transport to the consumption gate and refers to the principles of ISO 14044, ISO 14067, and the ILCD guidelines [32,33,34,35]. This enables attributional life-cycle assessment (ALCA) and consequential life-cycle assessment (CLCA) to be conducted within system boundaries appropriate to the objective of the study. For traction batteries, Regulation (EU) 2023/1542 establishes separate environmental requirements covering the entire battery life cycle; however, these requirements are being implemented progressively as detailed implementing legislation is adopted [36].
The purpose of these frameworks is not to establish a universal environmental ranking of BEVs and FCEVs, but to ensure that both pathways are assessed using transparent life-cycle boundaries and consistently defined energy and fuel supply chains. Dedicated methodologies for determining the life-cycle greenhouse-gas intensity of hydrogen supply chains are already available internationally and have been translated into operational national or regional approaches. Hydrogen pathways should therefore be characterised by their actual production, conditioning, transport, and electricity-supply conditions rather than solely by colour labels, because pathways assigned the same label may exhibit different life-cycle emissions. By contrast, harmonised whole-vehicle LCA, applicable consistently across powertrains and markets, remains under international development, although regional, national, and industry-specific methodologies already exist [37]. Comparative results remain conditional on the vehicle segment, duty cycle, assumed lifetime, system boundary, electricity mix, battery capacity and production, hydrogen production pathway, fuel conditioning and transport, maintenance, and end-of-life assumptions. Production-stage emissions associated with traction batteries and PEMFC systems should therefore be evaluated together with use-phase energy or fuel emissions, without interpreting either component as evidence of universal technological superiority. These dependencies preclude a universal BEV–FCEV ranking and require the results of each study to be interpreted within its stated geographical, technological, and methodological boundaries [38,39].
2.5. Limitations of the Analysis
The article is a review-based analytical study and does not present a forecast or a comprehensive economic model of the global hydrogen-transport market. The scenarios are intended to organise the relationships identified in the literature and do not specify future market shares, numbers of vehicles, numbers of stations, or the likelihood of realisation of individual variants.
The comparability of sources is limited by regional differences, system boundaries for hydrogen applications, energy prices, the cost of capital, production scale, infrastructure utilisation, the structure of the energy system, and regulatory conditions. The case studies serve to identify technological, infrastructural, and market mechanisms, rather than to produce universal projections.
The numerical data illustrate the scale and mechanisms of the phenomena within the assumptions adopted in the individual sources. The analysis identifies factors affecting FCEV development but does not determine its pace, geographical distribution, or ultimate scale.
2.6. Scenario-Construction Method
The three scenarios were constructed through a structured qualitative synthesis of the evidence reviewed in Section 3, Section 4, Section 5, Section 6 and Section 7. The analysis first identified recurring interdependencies among vehicle segments, hydrogen-refuelling infrastructure, hydrogen production and supply, economics, and support policy. These interdependencies were then organised using a common set of analytical dimensions: demand structure and predictability, intensity of policy intervention, pace of PEMFC technology improvement, scale and configuration of infrastructure investment, hydrogen-supply maturity, asset utilisation, and coordination among system actors.
The scenarios were developed as internally consistent qualitative system configurations rather than numerical forecasts. The same analytical dimensions were applied to all three scenarios to ensure a consistent comparison. The resulting configurations, assumptions, boundary conditions, and key variables are presented and discussed in Section 8.
The assumptions and boundary conditions were derived by distinguishing recurrent system-level relationships from region-specific observations. A relationship was incorporated into the scenario framework when it was supported across more than one category of evidence or when primary technical, normative, regulatory, or deployment sources demonstrated a direct system dependency. Region-specific numerical values were retained as contextual evidence and were not transferred directly between markets.
The reliability of the scenario construction was strengthened by applying the same analytical dimensions to all three configurations and by checking their internal consistency across vehicle demand, HRS configuration, hydrogen supply, infrastructure utilisation, economics, and policy support. The plausibility and traceability of the scenario construction were supported through triangulation among peer-reviewed studies, standards and technical documents, regulatory and institutional sources, and documented deployment cases.
The scenarios should therefore be interpreted as evidence-based analytical configurations rather than probabilistic forecasts. Their principal methodological limitations are the interpretative role of a single author, the heterogeneity of the underlying sources, uneven regional data availability, and the absence of quantitative probability assignments. These limitations were addressed by maintaining common analytical dimensions, explicitly stating assumptions and boundary conditions, preserving the geographical and methodological boundaries of the evidence, and avoiding numerical forecasts or claims of universal applicability.
3. Development of Fuel Cell Electric Road Vehicles
Available deployment data confirm that the FCEV market remains small and geographically concentrated. Data collected in early 2025 indicate a global fleet approaching 100,000 vehicles and 1302 hydrogen refuelling stations. Approximately 92% of FCEVs were operated in China, South Korea, the United States, and Japan. China accounted for 522 stations and dominated the commercial-vehicle segments, whereas passenger cars represented 69% of the global FCEV fleet. The most recent expansion has been stronger in heavy-duty trucks, whose global fleet increased by 72% compared with 2023 [40]. In Europe, the total FCEV fleet reached 7035 vehicles in 2025, including 874 buses and 535 trucks, while annual registrations declined from 1197 in 2024 to 1083 in 2025 [41]. In North America, deployment remained concentrated primarily in California, where 14,128 light-duty FCEVs were registered in April 2025 and 61 hydrogen refuelling stations were recorded in August 2025, of which 50 were available for retail operation [25]. These figures show that current deployment remains below the scale associated with the fleet-based and multi-segment scenarios, while also indicating a gradual shift towards buses, trucks, and other vehicles with concentrated and predictable demand. The divergent regional patterns reflect different combinations of industrial policy, vehicle-market priorities, and infrastructure organisation. In China, performance-based support for fuel-cell vehicle demonstration city clusters links technology industrialisation, hydrogen supply, standards, and commercial operating models, thereby favouring medium- and heavy-duty vehicles whose concentrated demand can support infrastructure utilisation [40,42]. In South Korea, centrally coordinated subsidies and a strong domestic automotive base supported an early passenger-car market, while current programmes extend deployment to buses and selected commercial and municipal vehicles and link support to technical performance and service capacity [29,40]. Japan likewise built an early technology and user base through passenger FCEVs, but is now promoting fuel-cell commercial vehicles in priority regions and coordinating their deployment with hydrogen hubs and long-term support for low-carbon hydrogen supply [27,28,31,40]. In Europe, deployment is shaped more strongly by regulatory network planning, including AFIR, and by fleet, bus, and corridor applications, but remains fragmented and below the scale required for high infrastructure utilisation [30,41]. California illustrates a passenger-car-led pathway in which market expansion depends directly on the availability and reliability of a public retail HRS network; station closures, limited fuel availability, and low network resilience therefore constrain vehicle usability and further adoption [25]. These differences explain why similar PEMFC technology has produced distinct regional market structures and provide an empirical basis for the limited-development, fleet-based, and multi-segment scenarios discussed in Section 8.
FCEV segments perform different, complementary functions: passenger cars advance compact system integration and series production, buses and fleets stabilise initial demand, while commercial and heavy-duty vehicles increase infrastructure throughput and reliability requirements [12,15,22,43].
FCEV development is multi-segmental, and the functions of the individual vehicle groups are summarised in Table 1.
Table 1.
Functions of selected FCEV segments in the maturation of the hydrogen transport system. Prepared by the author based on [12,15,22,43].
3.1. Passenger Cars as a Technological Development Platform
Mass-produced passenger cars have played an important role in the maturation of PEMFC technology because they simultaneously require compact packaging, high power density, safe hydrogen storage, durability, short refuelling times, and user-relevant performance. This segment became a demanding platform for integrating the fuel cell stack with the air-supply and hydrogen-supply systems, cooling system, power electronics, buffer battery, electric motor, and supervisory energy management [12,13,14,15].
Automotive duty cycles expose PEMFC systems to repeated changes in load, start–stop events, temperature, humidity, and reactant conditions. These variations can combine reversible performance losses with longer-term degradation of the catalyst layer and proton-exchange membrane, making a single steady-state indicator insufficient for assessing durability. Recent research has therefore applied multi-scale temporal feature extraction, a long short-term memory (LSTM) encoder–decoder, and an attention mechanism to distinguish degradation trends evolving over different time scales and to predict voltage decline under dynamic durability-test conditions. The reported results demonstrate the value of voltage-degradation prediction for condition monitoring and reliability management, although such data-driven accuracy remains dependent on the operating profile and dataset used for model development [44]. Under dynamic operation, part of the observed voltage loss may be reversible and can recover after polarisation-curve testing or other interventions, causing discontinuities in the apparent degradation trajectory. Lifetime prediction should therefore distinguish recoverable performance loss from irreversible degradation rather than extrapolating measured voltage decline directly [45].
For vehicular PEMFC stacks operating under dynamic conditions, state-of-health estimation can be combined with long-term durability prediction to distinguish the current degradation state from the expected remaining service trajectory. Such an approach is particularly relevant to fleet and heavy-duty applications, where variable loads, high cumulative operating hours, and limited tolerance for unplanned downtime require condition-based monitoring and maintenance planning rather than durability assessment based solely on steady-state measurements [46]. Deep-learning-based SOH estimation under dynamic conditions also shows that model performance depends on the architecture, sampling interval, proportion of training data, and physical condition of the fuel cell. Comparisons of LSTM, GRU, TCN, and transformer models indicate that shorter sampling intervals and larger training datasets can improve estimation accuracy, whereas crack-induced voltage fluctuations increase prediction errors [47].
Experience gained in the development of automotive PEMFC systems can be applied to commercial vehicles, buses, and heavy-duty road transport. This transfer does not involve the straightforward use of an identical system, but rather the application of shared expertise in PEMFC integration, industrialisation, energy management, safety, and standardisation, with power output, cooling, and auxiliary systems adapted to the operating profile of a given application [13,14,15,43].
Flow-field and stack design must balance uniform distribution of hydrogen and air with pressure losses, water removal, membrane hydration, and thermal uniformity. Dynamic passenger-car operation increases the importance of air-system response and control during rapid load changes, whereas prolonged high-load operation in heavy-duty vehicles can intensify local temperature and humidity gradients if gas and coolant distribution are insufficient. These operating differences also affect the balance-of-plant. Air compressors, pumps, valves, humidification devices, cooling circuits, sensors, and power converters are exposed to different duty cycles, numbers of start–stop events, and cumulative operating hours. Accordingly, durability evaluation must cover the complete fuel-cell system rather than the stack alone, including efficiency loss, wear, and failure of auxiliary components under the representative operating profile [12,13,14,15,48].
The technical priorities nevertheless differ substantially between passenger-car and heavy-duty applications. Passenger-car systems place particular emphasis on compact packaging, low mass, rapid transient response, quiet operation, and start–stop capability. Heavy-duty systems operate at higher continuous power and cumulative energy throughput, and therefore require longer service life, sustained high-load efficiency, greater heat-rejection capacity, and robust water management over extended operating periods. Scaling up is consequently not a simple increase in stack area or rated power. It changes the requirements for reactant distribution, pressure drop, humidification, cooling, and the coordination of multiple stacks or modules with the buffer battery and power electronics [12,13,14,15,48].
Experience gained in passenger-car PEMFC development has established a common technological basis at the level of cell and stack architecture, including membrane-electrode assemblies, bipolar plates, sealing, reactant distribution, cooling, and manufacturing processes. However, the dimensions, materials, operating conditions, and durability requirements of these components must be adapted to the power level and duty cycle of each vehicle segment.
Passenger cars therefore remain a source of technological solutions for other segments and a potential source of future market scale. The current concentration of deployments in fleets and heavy-duty road transport does not diminish the importance of the passenger-car segment as an earlier platform for the development of technology and H70 refuelling infrastructure [13,22,43].
The Role of Passenger Cars in the Structure of Transport Energy Consumption
Figure 2 presents the structure of final energy consumption in road transport by vehicle category in European countries in 2023. In most countries, the combined “Cars and Vans” category accounts for the largest share, typically approximately 70–80%. Heavy goods vehicles most often account for approximately 15–25%, while public transport represents only a few percent [49].
Figure 2.
Final energy consumption in road transport by vehicle category in European countries in 2023. Categories include cars and vans, heavy goods vehicles, public transport, and other road transport. Data for Greece and Finland were unavailable. Reproduced from Eurostat [49], licensed under CC BY 4.0.
The combined “Cars and Vans” category partly reflects similar integration requirements, although vans are more diverse in terms of mass, payload, and operating profile [12,15,49].
The chart indicates the dominant share of passenger cars and vans in final energy consumption in road transport, confirming the importance of light-duty segments for the potential scale of the market [49].
3.2. Buses and Anchor Fleets in the Current Market Phase
Regular routes, predictable daily mileage, and return to base enable the joint planning of bus fleets and refuelling infrastructure. This makes it possible to determine the number of vehicles, daily hydrogen demand, the refuelling schedule, and station throughput and redundancy requirements. Buses can therefore serve as an anchor fleet, providing recurring demand and improving infrastructure utilisation during the early market phase [22,43,50]. Bus operation in urban areas combines a predictable operating profile with zero tailpipe emissions and short refuelling times. This segment can thus support the development of the first operational hydrogen transport systems, without implying that the market will ultimately be limited to public transport.
3.3. Heavy-Duty and Commercial Vehicles as a Segment with Demanding Operational Requirements
Heavy-duty and commercial transport includes applications characterised by high vehicle mileage, intensive operation, short downtime, and demanding vehicle-availability requirements. Under these conditions, short refuelling times, long range, and the relationship between the mass of the energy-storage system and vehicle range are important, particularly when downtime represents an operating cost. BEVs and FCEVs may therefore perform different functions depending on the operating profile, infrastructure availability, and the ability to provide sufficient grid-connection capacity [22,23,43,50].
Contemporary heavy-duty vehicle deployments demonstrate the potential to transfer experience from automotive PEMFC systems to higher-power applications with more demanding operating profiles [22,43,50]. In a heavy-duty vehicle, as in a passenger car, the fuel cell stack operates with a buffer battery, power converter, and electric motor, enabling regenerative braking, coverage of transient power demand, and limitation of dynamic load transients of the fuel cell stack [12,48].
The larger quantities of hydrogen dispensed to heavy-duty vehicles increase infrastructure requirements concerning throughput, cooling, fuelling protocols, redundancy, and reliability. The operational rationale for this segment should therefore be assessed together with the ability to provide an adequate fuel volume and consistent station operation [18,22,43].
Mechanical vibration during vehicle operation is an additional system-level durability factor and should be considered when validating complete PEMFC vehicle systems under representative road conditions [51].
3.4. Platinum as a Material Factor in Scaling Up PEMFC Technology
The potential to scale up PEMFC production depends not only on the development of manufacturing capacity but also on demand for critical materials, particularly platinum. This metal acts as a catalyst for electrochemical reactions; however, its contribution to cost should not be analysed separately from the design of the overall system. System cost also depends on the design of the membrane electrode assembly (MEA) and bipolar plates, balance-of-plant components, durability, process automation, and production scale. Increasing catalyst activity and utilisation makes it possible to reduce the platinum-group metal (PGM) loading per unit of power. The U.S. Department of Energy reports a transportation electrocatalyst status value of 0.16 g PGM/kW and a target of 0.125 g PGM/kW at rated gross power [52].
The material significance of platinum is therefore being reduced through three parallel pathways. The first is a reduction in PGM loading through improvements in catalyst layers and MEA design. The second is more effective catalyst utilisation, resulting in greater power output from a given quantity of material. The third is the recovery of precious metals from end-of-life MEAs and their reintroduction into the material loop [52,53,54].
The development of fuel cell stack refurbishment and the recovery of precious metals from end-of-life MEAs indicates the possibility of reusing components and reducing demand for primary raw materials. An industrial technical note reports recovery of more than 95% of the precious metals contained in an MEA [53]. In the BEST4Hy project, laboratory-scale processes achieved platinum recovery rates of 80% for hydrometallurgical treatment, 90% for alcohol dissolution, and 95% for electro-leaching and electrodeposition [54]. These values relate to specific processes and material streams and should not be generalised to all PEMFC recycling processes.
Platinum remains an important functional material, but demand for it is being progressively reduced through lower material use, improved catalyst efficiency, and the development of recycling. From a market-development perspective, its significance should therefore be assessed in the context of advances in MEA design, power obtained per unit of PGM, fuel cell stack durability, and the degree to which the material loop is closed [52,53,54]. Platinum thus represents one of the challenges associated with scaling up PEMFC technology, but should not be regarded as a barrier to development.
4. Hydrogen Refuelling Infrastructure as a Prerequisite for FCEV Usability
The development of FCEV-based transport requires dedicated hydrogen refuelling infrastructure, whose scale and availability remain limited compared with the liquid-fuel distribution network developed over many decades. This creates an interdependence between vehicle-fleet development and station-network expansion: a limited number of FCEVs makes it difficult to achieve high infrastructure utilisation, while insufficient station availability reduces vehicle usability. FCEV usability depends not only on the presence of stations but also on the ability to refuel rapidly, safely, consistently, and reliably. A hydrogen refuelling station (HRS) integrates hydrogen receiving, buffer storage, compression, cooling, and dispensing, together with safety control systems and vehicle-to-station communication [17,18,20,21,23,30,50].
4.1. H70 and Refuelling Standards
Within the adopted perspective on transport-infrastructure development, compressed gaseous hydrogen is regarded as the principal fuel form for at least the next decade. The global direction of infrastructure standardisation is H70, corresponding to a nominal working pressure of 70 MPa. This standard, initially developed for passenger cars, is being extended to commercial vehicles, buses, and heavy-duty road transport, creating a common refuelling architecture covering temperature and pressure control, vehicle-to-station communication, and safety requirements [17,18,55]. From this perspective, H35 is treated as a solution of declining importance, retained mainly in some older bus installations and selected prototype projects.
Recent tests of a dual-nozzle high-flow configuration indicate the potential to reduce heavy-duty vehicle refuelling times. In one test, the complete procedure lasted six minutes and dispensed an amount of hydrogen reported as corresponding to a vehicle range of up to 600 km. These results relate to a test installation and require confirmation on a heavy-duty vehicle under real-world operating conditions [56].
In the proposed infrastructure concept, liquid hydrogen may be used for fuel delivery and storage at stations requiring large reserves and high capacity within a limited site area and subsequently dispensed to vehicles as high-pressure gaseous hydrogen. In parallel, prototype systems are being developed for the direct refuelling of liquid or subcooled liquid hydrogen into cryogenic tanks in heavy-duty vehicles, with the aim of increasing range and shortening refuelling time. This is, however, a development pathway rather than a solution with maturity comparable to gaseous H70. Solid-state storage materials offer an additional development pathway with potentially milder pressure and temperature conditions, but recent reviews conclude that material- and system-level performance is not yet mature for widespread industrial or automotive implementation [57].
The foundations of H70 and high-flow refuelling, safety, and infrastructure availability are summarised in Table 2 [16,17,18,55].
Table 2.
Selected standards and regulatory documents relevant to hydrogen refuelling infrastructure. Prepared by the author based on [16,17,18,30,55].
4.2. Refuelling Energy Requirements: Compression, Buffer Storage, and Cooling
The relationships between compression, buffer storage, cooling, the operating profile, and station control are presented in Figure 3.
Figure 3.
Functional arrangement of compression, buffer storage, and cooling systems at an H70 station. Increased refuelling intensity raises the requirements for compressor capacity, pressure-bank capacity, and consistent operation of the pre-cooling system. Source: prepared by the author based on [17,20,21,23].
4.3. Station Scalability, Redundancy, and Staged Development
As the number of vehicles served increases, a station must be prepared both for the repeated refuelling of multiple vehicles within a short period, such as buses or fleet vehicles, and for the single-event dispensing of a large quantity of hydrogen to a heavy-duty vehicle. Such operating profiles increase the loads on compression, buffer-storage, and cooling systems, while the failure of a single item of equipment may substantially reduce throughput or temporarily render the station unavailable. Ensuring adequate operational availability therefore requires redundancy of key subsystems.
On the basis of the operational requirements analysed, a configuration may be identified that comprises several compressors operating in parallel, dedicated cooling systems linked to individual dispensers, and at least two refuelling positions for the predominant pressure level. This arrangement may be supplemented by emergency refuelling directly from a tube trailer and an independent backup hydrogen supply route. These solutions limit the consequences of a single-subsystem failure or interruption of the primary supply and allow partial refuelling capability to be maintained.
In the proposed staged-expansion concept, the target configuration is considered during preparation of the initial design. This applies particularly to reserved site area, foundations, service ducts, cable penetrations, underground installations, pipe connections, and suitable electricity infrastructure. A modular approach increases expansion flexibility and limits the consequences of single equipment failures, but may result in higher capital and operating expenditure than an integrated solution. The choice of architecture should therefore account for the trade-off between staged expenditure, station operational availability, and total life-cycle cost.
Based on the relationships discussed above, a four-stage station-development concept is proposed, as presented in Table 3.
Table 3.
Author-developed concept for the staged development of a hydrogen refuelling station, based on assumptions concerning the scalability and redundancy of H2 infrastructure.
The logic of subsystem redundancy and the backup supply path is presented in Figure 4.
Figure 4.
Redundancy of the compression, buffer-storage, and cooling path at an H2 station: parallel compressors, high-pressure storage banks, and cooling systems limit the consequences of a single-subsystem failure. Source: prepared by the author.
Compression, buffer storage, cooling, scalability, and redundancy determine the transition from a demonstration station to operational infrastructure [17,18,20,21,23,30,55].
5. Hydrogen Infrastructure Within the Energy Ecosystem
Refuelling infrastructure is the final element of a broader energy ecosystem in which hydrogen links energy production, storage, and use in transport, industry, and the power sector. Hydrogen can be produced using electricity, including electricity from renewable energy sources, and subsequently stored, transported, and supplied to different groups of off-takers. This makes it possible to utilise part of the surplus electricity generation and increases flexibility in its use across sectors. Transport applications therefore do not form a separate system, but constitute part of an integrated value chain encompassing hydrogen production, storage, transport, distribution, and end use. FCEVs are one group of off-takers, and their usability depends on the ability of the entire energy and logistics system to provide hydrogen of the required quality, in the required quantity, and at the specific time [24,58,59].
5.1. Integration of Hydrogen with the Energy System
The integration of energy sectors, referred to as sector coupling, links the power sector with transport, industry, and heating, supporting decarbonisation and system balancing as the share of renewable energy sources increases [60]. Hydrogen can shift renewable energy over time and transport it across locations, separating the time of its production from its use in transport. This function, however, requires hydrogen production to be linked with storage, logistics, and refuelling infrastructure. HRS reliability depends not only on the parameters of the station itself, but also on fuel availability, supply-chain resilience, buffering capacity, and flexible balancing of supply and demand [24,58,59]. Hydrogen production, storage, logistics, the HRS, and the FCEV therefore form a single integrated value chain.
5.2. Hydrogen Storage and Transmission Infrastructure
Hydrogen storage enables the time of energy production to be separated from its use over both short-term and seasonal horizons [19,59]. Local buffers can stabilise station operation and limit the consequences of temporary supply disruptions, while large-scale storage facilities allow production and consumption to be balanced over longer periods [24,58,61]. Salt caverns are a particular solution, with their technical potential in Europe estimated at 84.8 PWh H2 [61]. Significant geological structures also occur in the US Gulf Coast region, where caverns are used to store hydrogen for industrial purposes [62]. Their use nevertheless depends on geological conditions, integrity, the safety of cyclic operation, and connections to hydrogen production, transmission, and off-takers [61].
The method of hydrogen delivery should correspond to the scale and structure of demand. During the early market phase, tube-trailer deliveries provide flexibility, enabling individual stations and local fleets to be launched without extensive transmission infrastructure [24,58]. As volumes increase, however, hubs, storage facilities, and pipelines connecting production, imports, industrial off-takers, and HRS become increasingly important. This infrastructure may also use energy from offshore wind farms to produce hydrogen that is subsequently supplied to ports and energy-intensive industrial clusters [24,58]. The functional relationship between these elements is presented in Figure 5.
Figure 5.
Functional relationship between hydrogen production and imports, hubs, seasonal storage, transmission infrastructure, and transport and industrial off-takers. Source: prepared by the author based on [24,58,61].
Linepack is an element that increases the short-term flexibility of a pipeline network by temporarily changing the quantity of hydrogen retained in the pipeline through adjustment of its operating pressure. This function can reduce short-term imbalances between supply and demand, but, because of its limited energy capacity, it does not replace long-term or seasonal storage [24]. The transition from tube-trailer deliveries and individual stations to a hub-and-pipeline model is presented in Figure 6.
Figure 6.
Transition from tube-trailer logistics to a hub-and-pipeline model with a linepack function. Source: prepared by the author based on [24,58].
5.3. Importance of the Hydrogen Ecosystem for Road Transport
A mature market requires coordination of the vehicle fleet, HRS network, supply, storage, and energy-system flexibility; without such coordination, even a properly designed station remains exposed to supply constraints [58,59]. The functions of the individual elements of this ecosystem are summarised in Table 4.
Table 4.
Functions of hydrogen-ecosystem elements for road transport. Prepared by the author based on [24,58,59,60,61].
The comparison indicates that the usability of hydrogen transport depends on the interaction of production, storage, logistics, transmission infrastructure, and HRS. Local storage facilities and linepack increase short-term flexibility, whereas salt caverns and other large-scale storage facilities may support seasonal balancing. The system can therefore develop from tube-trailer deliveries and local hubs towards pipeline infrastructure integrated with renewable energy sources, industry, and hydrogen storage [24,58,59,60,61].
6. Economics of Hydrogen Transport Development
The economics of hydrogen transport depend on the cost and utilisation of the entire value chain: hydrogen production, storage, transport, compression, cooling, buffer storage, and distribution.
Economic assessment requires the cost of the initial phase to be distinguished from the cost after scale has been achieved. Because fixed costs account for a substantial share, unit cost depends strongly on station utilisation, demand predictability, and delivery regularity [22,23,63,64].
6.1. Cost of Hydrogen and Refuelling Infrastructure
The price of hydrogen at the station includes production, purification, storage, transport, compression, cooling, distribution, and HRS CAPEX and OPEX [22,63,64,65]. The principal cost components and mechanisms are summarised in Table 5.
Table 5.
Principal cost components of hydrogen delivered to an FCEV. Prepared by the author based on [22,30,63,64,65].
Production cost depends on the technological pathway, energy price, plant utilisation, cost of capital, and certification requirements. In the case of electrolysis, low-cost energy does not guarantee low-cost hydrogen when operating hours are limited, while higher utilisation may require the purchase of more expensive energy [22,63,64].
Delivery cost depends on market scale. Tube trailers enable the first stations to be commissioned without a pipeline network, but as volumes increase, hubs, storage facilities, and pipeline transmission become more important [22,24,58].
The individual cost components are interdependent. The choice of production and delivery method affects storage requirements, while the required pressure level, throughput, and station reliability determine the costs of compression, cooling, redundancy, and maintenance. The final unit cost therefore depends not only on expenditure on individual items of equipment, but primarily on their utilisation. HRS CAPEX and OPEX include the site, utility connections, storage, compressors, cooling, dispensers, safety control systems, servicing, and the maintenance of operational readiness. Redundancy increases expenditure but reduces the risk of operational interruptions [20,21,22,23]. Its importance is particularly high for fleets, because station unavailability may disrupt the operation of many vehicles simultaneously. HRS economics should therefore not be assessed solely by minimising CAPEX, but through the relationship between cost, utilisation, and operational availability. At low demand, fixed costs are spread over a small hydrogen volume, whereas stable station utilisation reduces the unit cost of fuel [22,23,43,50,63,64].
6.2. Impact of Market Scale on Infrastructure Utilisation and Costs
The impact of market scale on the economics of hydrogen infrastructure is illustrated using scenarios for the German passenger-car market [23]. As the number of FCEVs increases, average station utilisation rises from approximately 29% at 0.1 million vehicles to approximately 71% at 20 million vehicles, reducing the share of fixed costs allocated to each unit of fuel. The results should, however, be interpreted within the boundaries of the adopted scenarios, which differ in their hydrogen production and storage assumptions [23].
At 0.1 million vehicles, infrastructure expenditure for FCEVs and BEVs is similar, whereas at 15 and 20 million vehicles the model indicates lower expenditure for hydrogen infrastructure. For 20 million vehicles, this expenditure is approximately EUR 40 billion, compared with approximately EUR 51 billion for the baseline BEV charging-infrastructure variant [23]. This indicates that, as market scale and station utilisation increase, the economic rationale for HRS development may strengthen. The results, however, relate to the assumptions of a model developed for the German passenger-car market and do not constitute a universal projection for other markets [23].
The hydrogen variant also included seasonal storage corresponding to 60 days of low renewable-energy production, whereas the BEV variant did not include analogous storage. The authors indicate that ensuring comparable security of supply for BEVs would require additional investment and would increase the cost of that pathway, but they do not quantify the scale of the increase [23].
6.3. Economies of Scale, Infrastructure Utilisation, and Anchor Demand
The economies of scale of infrastructure depend simultaneously on geographical accessibility for the end user and the intensity of station utilisation. The European regulation on the deployment of alternative fuels infrastructure creates a minimum backbone of HRS along the Trans-European Transport Network and in urban nodes, reducing the risk of insufficient infrastructure, but not guaranteeing the profitability of individual facilities [30].
Availability reduces user risk, whereas operator economics depend on the local refuelling volume. Network development should therefore be coordinated with the development of fleets and other hydrogen off-takers [22,30].
During the early market phase, buses, municipal vehicles, logistics fleets, and heavy-duty road transport can provide anchor demand. Their predictable mileage and fuel consumption facilitate supply planning, storage selection, and determination of the required compression and cooling capacity [22,43,50]. Concentrating initial deployments on such users can improve asset utilisation and reduce the unit cost of hydrogen, creating the infrastructure conditions for subsequent market expansion to less concentrated off-takers.
Cost assessment should take account of the stage of market maturity. High hydrogen prices, vehicle costs, a limited HRS network, and the risk of low utilisation are genuine barriers during the initial phase, but also reflect limited scale and high fixed costs [22,23,63,64]. Reducing these barriers requires demand stabilisation, repeatable investment, a lower cost of capital, and coordination of production, logistics, and infrastructure. Comparisons between BEVs and FCEVs should therefore account for differences in the maturity of the two pathways, rather than considering only their current unit costs.
Economies of scale also apply to vehicles and PEMFC systems. Their cost depends on production volume, design for mass production, automation, durability, and the use of critical materials [65]. Greater packaging space and a regular operating profile may facilitate initial deployments in heavier fleets, but do not eliminate the need to reduce costs. Long-term competitiveness therefore requires a simultaneous reduction in PEMFC system cost, an increase in durability, and a decrease in the price of hydrogen [13,65].
6.4. Economic Conclusions
The economics of hydrogen transport depend on market scale, infrastructure utilisation, and the coordination of fuel supply with demand. Vehicle cost is determined primarily by PEMFC industrialisation, whereas fuel and operating costs depend on matching production, storage, logistics, and HRS capacity to the refuelling volume [22,23,63,64,65]. The transition from anchor demand and highly utilised hubs to a broader supply network may reduce the high unit costs of the initial phase. These mechanisms do not, however, determine the pace or ultimate scale of market development [22,23,24,58].
7. The Role of Support Policy in the Initial Phase of Market Development
The initial phase of FCEV market development involves elevated investment risk resulting from limited demand and low infrastructure utilisation. During this period, coordination and public support can facilitate the launch of initial investments, the creation of a minimum HRS network, and the development of predictable demand. Its function should be transitional and should lead to increased infrastructure utilisation and progressively lower costs, rather than permanently replacing technological competitiveness. As the market matures, support instruments should be reduced or adjusted to address the remaining development barriers [31].
7.1. The Coordination Challenge: Vehicles, Stations, Fuel, and Demand
The FCEV market develops under conditions of interdependence among vehicles, hydrogen supply, HRS, service facilities, and users. Low demand results in poor infrastructure utilisation and high unit costs, whereas limited HRS availability reduces vehicle usability and willingness to purchase vehicles [22,23,30]. This challenge cannot be resolved by supporting only one element of the value chain.
Coordination policy should therefore combine instruments addressing vehicles, fuel, infrastructure, servicing, and off-takers [25,29,30,31]. Anchor demand generated by buses, municipal vehicles, logistics, and heavy-duty road transport can increase HRS utilisation and create the infrastructure conditions for users with a more dispersed refuelling profile [22,28,43,50].
7.2. Support Instruments for Hydrogen Supply and Infrastructure, Vehicles, Fleets, and End Users
Supply-side instruments include support for the production of low-emission hydrogen, its storage, transport, and distribution, and the development of HRS.
In Japan, support is in the form of programme combining a Contract for Difference (CfD) with the development of hydrogen hubs. A CfD is a financial mechanism that compensates for the difference between an agreed support price and a reference price, while the hub programme supports shared hydrogen transport and storage infrastructure. The programme provides for a budget of JPY 3 trillion and a 15-year period of operating support [27,31].
In the European Union, an example of a supply-side instrument is the IF25 Hydrogen Auction, which supports the production of renewable hydrogen and electrolytic low-carbon hydrogen through a fixed premium paid for verified production [26].
Another form of European Union support is the Alternative Fuels Infrastructure Regulation (AFIR), which establishes minimum requirements for the deployment of publicly accessible HRS by the end of 2030. AFIR creates a basic network backbone and specifies requirements concerning availability and interoperability; however, as a regulatory instrument, it does not provide funding or guarantee the profitability of individual stations [30].
In California, AB 126 provides the basis for public HRS funding of at least USD 15 million annually until 2030. The support is accompanied by annual assessments of FCEV fleet deployment and the refuelling network, allowing subsequent investments to be adjusted to changes in demand, prices, and fuel availability [25].
Demand-side instruments include vehicle subsidies, support for public fleets, public procurement, and the development of service facilities. They reduce the risk borne by early users and increase the number of vehicles using the developing infrastructure.
China adopted a city-cluster demonstration policy that replaced nationwide vehicle-purchase subsidies with performance-based rewards for selected groups of cities. The four-year programme links the industrialisation of key fuel cell technologies with vehicle deployment, hydrogen supply, standards, and commercial operating models. It gives particular attention to medium- and heavy-duty commercial vehicles and allocates central support according to the achievement of agreed demonstration targets [42].
An example is the Korean public hydrogen-vehicle subsidy programme for 2025, with a budget of KRW 721.8 billion. The programme supports 2000 buses, 11,000 passenger cars, 10 heavy-duty vehicles, and 10 street-cleaning vehicles, as well as service facilities. For buses, the subsidy level is linked to technical criteria, including fuel cell stack power and vehicle range. The programme therefore affects not only the number of vehicles introduced, but also the technical parameters and quality of the developing market [29].
The diversity of instruments applied in China, Japan, Korea, the European Union, and California, together with the corresponding market barriers, is summarised in Table 6.
Table 6.
Examples of support instruments for the hydrogen transport market. Prepared by the author based on [25,29,30,31,42].
7.3. Technology-Neutral Support for BEVs and FCEVs
Technology neutrality does not mean applying identical instruments to BEVs and FCEVs. Support should address the constraints specific to each pathway: access to power capacity and charging infrastructure for BEVs, and hydrogen production, storage, and supply and HRS development for FCEVs [22,30,31]. Comparisons of the two technologies should account for differences in market maturity and the extent of support provided to date, rather than producing a simplistic technology ranking [22,23,30].
The combination of supply-side, infrastructure, and demand-side instruments provides the basis for the assessment in the next section of possible scenarios for the transition from initial deployments to larger market scale [25,29,30,31,42].
8. Discussion: Possible Future Scenarios for Fuel Cell Electric Road Transport
Using the scenario-construction framework defined in Section 2.6, three FCEV development scenarios were identified from the synthesis of the findings presented in Section 3, Section 4, Section 5, Section 6 and Section 7: limited development, fleet-based, and multi-segment. They are distinguished by demand structure, the roles of individual vehicle segments, the utilisation and sharing of hydrogen refuelling stations (HRSs), the scale of hydrogen supply, and economic and institutional conditions. The original contribution lies in combining these interdependencies at the system level and organising them into three possible market configurations. The scenarios do not constitute quantitative forecasts or mandatory sequential stages of development. They may coexist regionally and change as technology, infrastructure, and the market mature.
In the adopted approach, FCEVs form an integrated technical and energy system comprising vehicles, refuelling infrastructure, hydrogen production, storage and supply, asset utilisation, and support policy. Each scenario was therefore assessed using the same framework: user structure, demand characteristics, HRS configuration, the supply chain, economics, the function of public support, and the relationship with battery electric mobility.
8.1. Analytical Framework and Basis for Distinguishing the Scenarios
The three scenarios differ primarily in the scale and predictability of demand and in the way infrastructure is utilised. In the limited-development scenario, individual projects do not establish a durable demand base, and stations remain underutilised. In the fleet-based scenario, demand is concentrated around buses, municipal vehicles, logistics, heavy-duty road transport, and intensively operated passenger-car fleets. In the multi-segment scenario, shared infrastructure serves light-duty, fleet, and heavy-duty segments in parallel, increasing throughput but also the requirements for capacity, redundancy, and supply coordination.
Passenger cars, buses, logistics, and heavy-duty road transport are not straightforward alternatives in this framework. Passenger cars advance compact PEMFC system integration and provide operational experience with H70; buses and fleets provide predictable refuelling demand; and heavy-duty road transport raises the requirements for infrastructure capacity and reliability [12,15,22,43]. The importance of each function nevertheless depends on the scenario and the geographical configuration of the market.
For each analytical dimension, the scenarios represent internally consistent configurations rather than numerical forecasts. Limited development assumes fragmented demand, restricted investment, and continued dependence on individual projects. The fleet-based scenario assumes predictable anchor demand and coordinated local or corridor infrastructure. The multi-segment scenario assumes broader demand, scalable shared H70 infrastructure, a more mature hydrogen supply chain, and closer integration with the energy system. Table 7 consolidates the core assumptions, driving factors, boundary conditions, key variables, and principal risks applied consistently across the three scenarios.
Table 7.
Analytical framework and comparison of the limited-development, fleet-based, and multi-segment FCEV market scenarios, including core assumptions, driving factors, boundary conditions, key variables, and principal risks. Prepared by the author based on the synthesis of the findings presented in Section 3, Section 4, Section 5, Section 6 and Section 7.
Internal consistency was assessed by verifying whether the demand structure assumed in each scenario was compatible with its HRS configuration, hydrogen-supply arrangement, infrastructure-utilisation level, economic conditions, and required policy intervention.
The framework differs from scenario studies that calculate market shares, deployment years, or optimisation outcomes from a single regional dataset. Its purpose is to compare system configurations across heterogeneous regional evidence while preserving the boundaries and assumptions of the underlying sources. The scenarios therefore do not assign probabilities, market volumes, or implementation dates.
8.2. Limited-Development Scenario: Technology Remaining in Niches
In the limited-development scenario, FCEVs remain a technology used in demonstration projects, individual fleets, or specialised applications. Vehicle and station numbers are low, and their distribution does not form a coherent network. Passenger cars mainly serve as an early technology platform, whereas buses, municipal vehicles, and heavy-duty vehicles are deployed at isolated locations without sufficient throughput to sustain infrastructure utilisation.
Demand is dispersed or dependent on a single project. This results in low HRS utilisation and a high share of fixed costs per kilogram of hydrogen. Stations have limited throughput and redundancy, while a compressor or cooling-system failure, or an interruption in fuel supply, may temporarily disable the entire local system. The infrastructure therefore does not progress from a demonstration function to an operational one [17,18,20,21,23,55].
Hydrogen supply relies primarily on local solutions or tube-trailer logistics. The absence of larger hubs, storage facilities, and pipeline connections limits the ability to balance supply and demand. Fuel costs remain high because of the limited scale of production, transport, and refuelling, while the lack of stable demand makes further investment difficult to justify [24,58,59,61,63,64].
Public support may sustain individual deployments, but without coordination among vehicles, fuel, HRSs, and service infrastructure, it does not resolve the problem of low asset utilisation [25,27,28,29,30,31]. This scenario becomes entrenched if projects remain isolated, hydrogen costs do not decline, and users do not obtain adequate refuelling accessibility and reliability. In such a configuration, BEVs serve most applications suitable for direct electrification, while FCEVs retain a niche role.
8.3. Fleet-Based Scenario: Development Based on Predictable Demand
In the fleet-based scenario, the market is underpinned by buses, municipal vehicles, logistics, and heavy-duty road transport, as well as taxis, passenger transport services, and company fleets with high daily utilisation. These applications share predictable routes, the possibility of refuelling at a depot or hub, high vehicle mileage, and a high economic value of short downtime [22,43,50]. Passenger cars participate primarily as intensively operated vehicles rather than as a dispersed private-vehicle market.
A repeatable operating profile makes it possible to estimate the number of vehicles, daily hydrogen demand, the refuelling schedule, and the required station throughput. The fleet generates anchor demand, allowing the fixed costs of an HRS to be distributed across a larger and more stable volume. Compared with the limited-development scenario, additional compressors, high-pressure storage banks, cooling systems, dispensers, and redundancy in key subsystems become easier to justify [17,18,20,21,23,55].
The infrastructure is local or corridor-based. It may include depot stations for buses and fleets, logistics hubs, and high-flow refuelling positions for medium- and heavy-duty vehicles. H70 remains the shared technical basis, although larger quantities of dispensed hydrogen require different flow profiles and higher capacity than in the light-duty segment.
The supply chain may continue to use tube trailers, but stable demand justifies the development of local hubs, larger storage facilities, and more resilient supply routes. Economic performance depends on matching fleet size to station capacity and limiting unused equipment capacity. Public support should coordinate vehicle procurement, HRS construction, fuel supply, and service infrastructure, and should subsequently be reduced as infrastructure utilisation increases [25,27,28,29,30,31].
The fleet-based scenario may constitute a durable market configuration rather than merely a transitional stage. Its limitation is demand concentration: the infrastructure serves specific depots and corridors effectively but may not provide the freedom of use associated with an extensive publicly accessible network. The complementarity between BEVs and FCEVs follows directly from the operating profile: BEVs suit applications with available charging time and power capacity, whereas FCEVs suit applications requiring high availability, rapid refuelling, and high daily energy demand [10,22,23].
8.4. Multi-Segment Scenario: A Shared Platform for Light- and Heavy-Duty Segments
In the multi-segment scenario, buses, logistics, municipal vehicles, and heavy-duty road transport continue to provide anchor demand, while the infrastructure is simultaneously used by taxis, car sharing, company fleets, high-utilisation users, and, gradually, the private-vehicle market. The passenger-car segment expands technology volumes and the user base, whereas heavier segments provide large and regular fuel demand. A prerequisite is the ability of a shared and scalable H70 architecture to serve different refuelling profiles.
Passenger cars have played an important role in the practical standardisation of H70, including control of temperature and pressure rise, vehicle-to-station communication, safety, and consistent refuelling time [15,17]. This experience provides a technical foundation for a broader system, while high-flow fuelling protocols extend hydrogen application to medium- and heavy-duty vehicles [16,18]. A common standard does not imply identical parameters for every refuelling event, but it enables the development of compatible equipment, procedures, and competencies.
Taxis, car sharing, company vehicles, and passenger transport fleets combine the compact platform of a passenger car with the predictability of fleet demand. They may increase HRS utilisation before mass sales to private users are achieved, because short refuelling time is particularly valuable in intensive operation [10,22,23]. They therefore form a bridge between the fleet market and more dispersed individual users.
Stations evolve from facilities dedicated to a single fleet into shared hubs. This requires staged increases in throughput, the number of dispensers, cooling and compression capacity, and redundancy. Parallel process trains limit the consequences of a single-subsystem failure, while reserving site area, connections, and utility capacity in the initial design facilitates expansion without complete reconstruction of the facility. Geographical accessibility must be combined with sufficient volume to ensure rational HRS utilisation [17,18,20,21,23,55].
A larger scale of demand justifies the development of hubs, storage facilities, and pipelines connecting production, imports, industry, and HRSs. Local buffer storage and linepack increase short-term flexibility, whereas large-scale storage facilities can support seasonal balancing [24,58,59,61]. Transport becomes one of the off-takers within a broader hydrogen ecosystem, increasing the scope for shared assets while simultaneously requiring multisector coordination.
The economic viability of this scenario depends on parallel reductions in PEMFC and hydrogen costs, high infrastructure utilisation, and supply stability. Support policy should address both hydrogen supply and HRS development and vehicle demand, but its objective must be a transition towards a market capable of sustaining its assets without permanent support [25,26,27,28,29,30,31,63,64,65]. The scenario does not imply equal market shares for BEVs and FCEVs or the automatic dominance of FCEVs. The role of each technology depends on the operating profile, infrastructure availability, energy costs, and the economic value of downtime.
8.5. Comparison of the Scenarios and Their Possible Coexistence
The scenarios differ in market structure but are based on the same system components. Their main differences are consolidated in Table 7. The comparison does not assign probabilities or a sequence of implementation to the scenarios. A region may retain a limited-development configuration, develop a fleet-based market at selected hubs, and simultaneously establish multi-segment infrastructure in areas with the highest demand concentration.
The regional evidence also indicates different, although not uniform, development configurations. Asian markets combine passenger-car deployment with strong public programmes and, particularly in China, an increasing role for commercial and heavy-duty vehicles [28,29,40,42]. Europe places greater emphasis on regulatory coordination, network availability, and integration with a broader hydrogen and energy system, while current deployment remains limited [30,41,58]. In North America, activity is concentrated mainly in California and selected heavy-duty and corridor applications [25,40]. These patterns should not be treated as fixed continental models, because deployment conditions differ substantially within each region; rather, they illustrate how the limited, fleet-based, and multi-segment configurations may emerge under different policy, demand, and infrastructure conditions.
The limited-development scenario may persist where demand is low and dispersed. The fleet-based scenario is feasible at depots and along corridors with predictable fuel demand. The multi-segment scenario requires the most extensive coordination but offers the broadest scope for infrastructure sharing. Transition between configurations is not automatic: it requires simultaneous growth in demand, HRS throughput, supply-chain resilience, and economic justification.
8.6. Energy-System Integration and Complementarity Between BEVs and FCEVs
The durability of fleet-based and multi-segment scenarios depends on linking transport with hydrogen production, storage, and transmission. Integrating hydrogen production with renewable energy sources enables renewable energy to be used in transport and temporally decouples its generation from consumption. In a developed system, transport interacts with the power sector, industry, and storage rather than operating as an isolated fuel off-taker [24,58,59,60,61]. Such links remain weak in the limited-development scenario, concern primarily local hubs in the fleet-based scenario, and encompass a more extensive ecosystem of suppliers and off-takers in the multi-segment scenario.
The system-level approach does not exclude battery electric mobility. BEVs and FCEVs may perform complementary functions: BEVs suit applications with access to charging and predictable dwell times, whereas FCEVs suit applications in which high availability, short refuelling times, and the concentration of large energy volumes at depots or hubs are important [10,22,23]. This does not imply equal market share. Technology selection should reflect the operating profile, infrastructure, energy costs, and the economic value of downtime.
8.7. Conditions for Scenario Realisation and Research Limitations
Scaling up the FCEV market requires parallel PEMFC industrialisation, lower hydrogen prices, increased infrastructure utilisation, staged HRS expansion and redundancy, and coordination of supply-side and demand-side support instruments [13,20,21,22,23,25,26,27,28,29,30,31,61,63,64,65]. Meeting a single condition does not ensure a transition to the fleet-based or multi-segment scenario because technological, infrastructural, fuel-related, economic, and regulatory constraints are interdependent.
The analysis also identifies areas requiring further research. Comparable long-term data on actual HRS utilisation and operational availability remain limited, particularly for high-flow stations serving different vehicle segments. Cost studies apply different system boundaries, energy prices, infrastructure utilisation rates, and approaches to seasonal storage. The durability and cost of redundancy in multi-segment stations, the conditions for infrastructure sharing among light-duty vehicles, buses, and heavy-duty road transport, and the benefits of sharing hydrogen infrastructure with industrial and energy-sector off-takers require further validation. These limitations restrict the transferability of findings from individual projects and models across regions but do not determine the superiority of a particular technology.
8.8. Future Prospects and Potential Application of the Scenario Framework
After identifying the conditions for scenario realisation and the associated limitations, it is necessary to indicate how the adopted analytical framework can be applied in the planning and implementation of hydrogen strategies.
The three scenarios were presented and used as a practical framework during a stakeholder workshop involving representatives of public administration, research institutions, local authorities, public-transport operators, vehicle manufacturers, hydrogen producers and suppliers, and organisations involved in hydrogen-refuelling infrastructure. The scenarios were positively received as a useful tool for structuring the discussion and were subsequently referred to during further stakeholder meetings. This practical use supports their relevance and plausibility. The detailed construction method, analytical dimensions, assumptions, boundary conditions, and comparative structure were not disclosed during the workshops and are formalised for the first time in the present article.
The analysis may support the preparation, updating, and implementation of hydrogen strategies at national, regional, and local levels. The proposed scenarios make it possible to identify the conditions for FCEV transport development and to assess the coherence of actions concerning vehicles, HRSs, hydrogen production, storage, and supply. They do not constitute quantitative forecasts but provide a framework for organising technological, infrastructural, economic, and regulatory interdependencies.
The system-level approach may be useful to entities responsible for developing an integrated hydrogen ecosystem at regional or national level. It facilitates linking transport needs with the power sector, renewable energy sources, industry, hydrogen storage, and transmission infrastructure, as well as planning hydrogen hubs and staged HRS expansion in line with the scale and structure of demand.
The findings may provide an analytical basis for national, regional, and local authorities and for companies involved in the hydrogen economy, particularly in transport and the associated infrastructure. The adopted framework may support the assessment of strategies, support programmes, and investment projects, as well as coordination among hydrogen producers and suppliers, HRS operators, transport operators, industry, and the energy sector.
9. Conclusions
The analysis indicates that FCEVs should be assessed as an integrated technical and energy system encompassing PEMFC technology, vehicles, hydrogen refuelling infrastructure, hydrogen supply and storage, economics, and support policy. The current sales volume therefore does not determine the long-term role of the technology.
PEMFC maturity depends on the industrialisation of the entire system, including design for high-volume manufacturing, durability, automation, integration of balance-of-plant components, power electronics, cooling, and energy management. Passenger cars have served in this process as a demanding integration platform and a source of H70 experience.
The market is multi-segmental. Buses, municipal vehicles, logistics, and heavy-duty road transport can create anchor demand, while taxis, car sharing, and passenger-car fleets provide a bridge towards greater HRS utilisation and a potentially broader private-vehicle market.
The usability of hydrogen transport depends on HRS throughput, reliability, redundancy, and staged expansion, as well as on a resilient chain of hydrogen production, storage, and supply. Pipelines, linepack, storage facilities, and integration with renewable energy sources give the technology a system-level dimension.
Economic competitiveness depends on scale, infrastructure utilisation, declining PEMFC costs, and stable demand. Support policy should temporarily coordinate hydrogen supply, the HRS network, and vehicle demand by selecting instruments that address specific barriers rather than positioning BEVs and FCEVs as opposing technologies.
The most important original contribution of this article is a scenario-based synthesis of the interdependencies among vehicle segments, hydrogen refuelling station infrastructure, the hydrogen supply chain, economic conditions, and support instruments. The proposed scenarios represent three possible market configurations. The limited-development scenario assumes that FCEVs remain confined to individual demonstration projects, specialised applications, and local fleets, with a small number of stations, low infrastructure utilisation, and continued dependence on public support. The fleet-based scenario builds on predictable demand generated by buses, municipal vehicles, logistics, heavy-duty road transport, and intensively operated passenger-car fleets, enabling station throughput to be better matched to demand, improving asset utilisation, and progressively reducing unit costs. The multi-segment scenario assumes that scalable infrastructure is shared by light-duty, fleet, and heavy-duty vehicles and connected to larger hydrogen production, storage, and distribution hubs, allowing the individual segments to perform complementary functions in building demand and utilising infrastructure. These scenarios do not constitute forecasts of market shares or assume a single development pathway. Instead, they enable a structured assessment of the conditions required for the transition from demonstration projects to a mature FCEV market, taking into account regional technological, infrastructural, energy-related, economic, and regulatory differences.
Funding
This research was funded by the Warsaw University of Technology within the framework of the “Excellence Initiative–Research University” (IDUB) programme.
Data Availability Statement
No new data were created or analysed in this study. Data sharing is not applicable to this article.
Acknowledgments
This work was carried out as part of the author’s scientific activities at the Warsaw University of Technology. During the preparation of this manuscript, the author used Microsoft Copilot (powered by GPT-5.6) for language editing and technical refinement of figures. The author reviewed and edited all outputs and takes full responsibility for the content of this publication.
Conflicts of Interest
The author is employed by Toyota Central Europe. Toyota Central Europe did not fund the research and had no role in the selection, analysis, or interpretation of sources; in the preparation of the manuscript; or in the decision to submit the manuscript for publication. Warsaw University of Technology, as the funder, had no role in the selection, analysis, or interpretation of sources; in the preparation of the manuscript; or in the decision to submit the manuscript for publication. The author declares no other conflicts of interest.
Abbreviations
The following abbreviations are used in this manuscript:
| AFIR | Alternative Fuels Infrastructure Regulation |
| ALCA | Attributional Life-Cycle Assessment |
| BEV | Battery Electric Vehicle |
| CAPEX | Capital Expenditure |
| CC BY | Creative Commons Attribution |
| CfD | Contract for Difference |
| CLCA | Consequential Life-Cycle Assessment |
| EU | European Union |
| FCEV | Fuel Cell Electric Vehicle |
| H35 | Hydrogen refuelling at a nominal working pressure of 35 MPa |
| H70 | Hydrogen refuelling at a nominal working pressure of 70 MPa |
| HRS | Hydrogen Refuelling Station |
| IDUB | Excellence Initiative–Research University |
| ILCD | International Reference Life Cycle Data System |
| ISO | International Organization for Standardization |
| LSTM | Long Short-Term Memory |
| MEA | Membrane Electrode Assembly |
| OPEX | Operating Expenditure |
| PEMFC | Proton Exchange Membrane Fuel Cell |
| PGM | Platinum-Group Metal |
| SAE | SAE International |
| TIR | Technical Information Report |
References
- Wang, R.; Ye, X.; Huang, W.; Lv, Z.; Yao, Y.; Yang, F.; Liu, Y.; Huo, J.; Duan, Y. Long-term trends of PM2.5 composition during cold seasons in Shanghai after releasing Clean Air Action Plan. Aerosol Air Qual. Res. 2024, 24, 240085. [Google Scholar] [CrossRef] [Scilit]
- European Commission, Directorate-General for Internal Market, Industry, Entrepreneurship and SMEs. Euro 7 Standards: New Rules for Vehicle Emissions; Publications Office of the European Union: Luxembourg, 2022. [Google Scholar] [CrossRef]
- Filonchyk, M.; Peterson, M.P. Analysis of air pollution from vehicle emissions for the contiguous United States. J. Geovis. Spat. Anal. 2024, 8, 16. [Google Scholar] [CrossRef] [Scilit]
- Suarez Corujo, J.; Komnos, D.; Ktistakis, M.; Fontaras, G. 2025 and 2030 CO2 Emission Targets for Light-Duty Vehicles; JRC133502; Publications Office of the European Union: Luxembourg, 2023; Available online: https://publications.jrc.ec.europa.eu/repository/handle/JRC133502 (accessed on 30 September 2026).
- National Highway Traffic Safety Administration; U.S. Environmental Protection Agency. NHTSA and EPA Set Standards to Improve Fuel Economy and Reduce Greenhouse Gases for Passenger Cars and Light Trucks for Model Years 2017 and Beyond; NHTSA: Washington, DC, USA, 2012. Available online: https://www.nhtsa.gov/sites/nhtsa.gov/files/cafe_2017-25_fact_sheet.pdf (accessed on 30 September 2026).
- TransportPolicy.net. China: Light-Duty Vehicle Fuel Consumption Standards. Available online: https://www.transportpolicy.net/standard/china-light-duty-fuel-consumption/ (accessed on 30 September 2026).
- Ministry of Land, Infrastructure, Transport and Tourism of Japan. Passenger Car Fuel Economy Standards for Fiscal Year 2030; MLIT: Tokyo, Japan, 2020. Available online: https://www.mlit.go.jp/report/press/jidosha10_hh_000228.html (accessed on 30 September 2026).
- Szałek, A. Energy conversion in motor vehicles. Combust. Engines 2020, 183, 50–57. [Google Scholar] [CrossRef] [Scilit]
- Szałek, A. Ogniwa Paliwowe i Hybrydowe Układy Napędowe w Motoryzacji, 1st ed.; Polskie Wydawnictwo Ekonomiczne: Warsaw, Poland, 2023; ISBN 978-83-208-2563-3. [Google Scholar] [CrossRef] [Scilit]
- Ajanovic, A.; Haas, R. Economic and environmental prospects for battery electric- and fuel cell vehicles: A review. Fuel Cells 2019, 19, 515–529. [Google Scholar] [CrossRef] [Scilit]
- Høyer, K.G. The history of alternative fuels in transportation: The case of electric and hybrid cars. Util. Policy 2008, 16, 63–71. [Google Scholar] [CrossRef] [Scilit]
- Sery, J.; Leduc, P. Fuel cell behavior and energy balance on board a Hyundai Nexo. Int. J. Engine Res. 2022, 23, 709–720. [Google Scholar] [CrossRef] [Scilit]
- Thompson, S.T.; James, B.D.; Huya-Kouadio, J.M.; Houchins, C.; DeSantis, D.A.; Ahluwalia, R.; Wilson, A.R.; Kleen, G.; Papageorgopoulos, D. Direct hydrogen fuel cell electric vehicle cost analysis: System and high-volume manufacturing description, validation, and outlook. J. Power Sources 2018, 399, 304–313. [Google Scholar] [CrossRef] [Scilit]
- Ozaki, H.; Yamazaki, K.; Ogawa, T.; Maniwa, S.; Miura, T.; Huston, T.W. Development of new fuel cell system. Honda R D Tech. Rev. 2025, 37, 12–18. [Google Scholar] [CrossRef]
- Takahashi, T.; Ikogi, Y.; Imanishi, H.; Kakeno, Y. Outline of the new fuel cell system in the second-generation MIRAI: Development of a fuel cell suitable for mass production. Toyota Tech. Rev. 2021, 66, 12–15. [Google Scholar]
- ISO/DIS 19885-3; Gaseous Hydrogen—Fuelling Protocols for Hydrogen Fuelled Vehicles—Part 3: Hydrogen Fuelling Protocols for Road Vehicles. [Draft International Standard]. ISO: Geneva, Switzerland, 2026. Available online: https://www.iso.org/standard/89206.html (accessed on 30 September 2026).
- SAE J2601_202005; Fueling Protocols for Light Duty Gaseous Hydrogen Surface Vehicles. SAE International: Warrendale, PA, USA, 2020.
- Report J2601/5_202502; High-Flow Prescriptive Fueling Protocols for Gaseous Hydrogen Powered Medium and Heavy-Duty Vehicles. SAE Technical Information. SAE International: Warrendale, PA, USA, 2025. [Google Scholar] [CrossRef] [Scilit]
- Cao, Y.; Yang, Y.; Zhao, X.; Li, Q. A review of seasonal hydrogen storage multi-energy systems based on temporal and spatial characteristics. J. Renew. Mater. 2021, 9, 1823–1842. [Google Scholar] [CrossRef] [Scilit]
- Elgowainy, A.; Reddi, K.; Lee, D.Y.; Rustagi, N.; Gupta, E. Techno-economic and thermodynamic analysis of pre-cooling systems at gaseous hydrogen refueling stations. Int. J. Hydrogen Energy 2017, 42, 29067–29079. [Google Scholar] [CrossRef] [Scilit]
- Gardiner, M. Energy Requirements for Hydrogen Gas Compression and Liquefaction as Related to Vehicle Storage Needs; DOE Hydrogen and Fuel Cells Program Record 9013; Approved 2009 October 26; U.S. Department of Energy: Washington, DC, USA, 2009. Available online: https://www.hydrogen.energy.gov/docs/hydrogenprogramlibraries/pdfs/9013_energy_requirements_for_hydrogen_gas_compression.pdf?Status=Master (accessed on 1 September 2026).
- International Energy Agency. Global Hydrogen Review 2025; International Energy Agency: Paris, France, 2025; Available online: https://www.iea.org/reports/global-hydrogen-review-2025 (accessed on 1 September 2026).
- Robinius, M.; Linßen, J.; Grube, T.; Reuß, M.; Stenzel, P.; Syranidis, K.; Kuckertz, P.; Stolten, D. Comparative Analysis of Infrastructures: Hydrogen Fueling and Electric Charging of Vehicles; Schriften des Forschungszentrums Jülich, Reihe Energie & Umwelt; Forschungszentrum Jülich GmbH, Zentralbibliothek, Verlag: Jülich, Germany, 2018; Volume 408, ISBN 978-3-95806-295-5. Available online: https://hdl.handle.net/2128/16709 (accessed on 1 September 2026).
- van Rossum, R.; Jens, J.; La Guardia, G.; Wang, A.; Kühnen, L.; Overgaag, M. European Hydrogen Backbone: A European Hydrogen Infrastructure Vision Covering 28 Countries; European Hydrogen Backbone: Utrecht, The Netherlands, 2022; Available online: https://www.ehb.eu/files/downloads/ehb-report-220428-17h00-interactive-1.pdf (accessed on 1 September 2026).
- California Air Resources Board. 2025 Annual Evaluation of Fuel Cell Electric Vehicle Deployment and Hydrogen Fuel Station Network Development; California Air Resources Board: Sacramento, CA, USA, 2025. Available online: https://ww2.arb.ca.gov/sites/default/files/2025-12/AB-126-Report-2025-Final.pdf (accessed on 1 September 2026).
- European Commission. IF25 Hydrogen Auction; European Commission, Directorate-General for Climate Action: Brussels, Belgium, 2025. Available online: https://climate.ec.europa.eu/areas-action/eu-funding-climate-action/innovation-fund/calls-proposals/if25-hydrogen-auction_en (accessed on 1 September 2026).
- International Energy Agency. 15-Year CfD Scheme to Close Cost Gap; International Energy Agency: Paris, France, 2025; Available online: https://www.iea.org/policies/28044-15-year-cfd-scheme-to-close-cost-gap (accessed on 1 September 2026).
- Ministry of Economy, Trade and Industry of Japan. First Selection of Priority Regions for Promoting the Deployment of Fuel-Cell Commercial Vehicles; METI: Tokyo, Japan, 2025. Available online: https://www.meti.go.jp/english/press/2025/0519_002.html (accessed on 1 September 2026).
- Ministry of Environment, Republic of Korea. Early Finalization of the 2025 Hydrogen Vehicle Subsidy Guidelines; Ministry of Environment: Sejong, Republic of Korea, 2025; Available online: https://me.go.kr/eng/web/board/read.do?pagerOffset=10&maxPageItems=10&maxIndexPages=10&menuId=461&boardId=1718330&boardMasterId=522 (accessed on 1 September 2026).
- European Parliament, Council of the European Union. Regulation (EU) 2023/1804 of the European Parliament and of the Council of 13 September 2023 on the deployment of alternative fuels infrastructure, and repealing Directive 2014/94/EU. Off. J. Eur. Union 2023, L234, 1–47. [Google Scholar]
- Suehiro, Y. Overview of Japan’s CfD Support Program; Japan Organization for Metals and Energy Security, Hydrogen Project Department: Tokyo, Japan, 2025. Available online: https://journal.jogmec.go.jp/content/300517125.pdf (accessed on 1 September 2026).
- European Commission, Joint Research Centre, Institute for Environment and Sustainability. International Reference Life Cycle Data System (ILCD) Handbook: General Guide for Life Cycle Assessment–Detailed Guidance, 1st ed.; EUR 24708 EN; Publications Office of the European Union: Luxembourg, 2010; ISBN 978-92-79-19092-6. [Google Scholar] [CrossRef]
- ISO 14044:2006; Environmental Management–Life Cycle Assessment–Requirements and Guidelines, 1st ed. Includes ISO 14044:2006/Amd 1:2017 and ISO 14044:2006/Amd 2:2020. ISO: Geneva, Switzerland, 2006.
- ISO 14067:2018; Greenhouse Gases–Carbon Footprint of Products–Requirements and Guidelines for Quantification, 1st ed. ISO: Geneva, Switzerland, 2018.
- ISO/TS 19870:2023; Hydrogen Technologies–Methodology for Determining the Greenhouse Gas Emissions Associated with the Production, Conditioning and Transport of Hydrogen to Consumption Gate. ISO: Geneva, Switzerland, 2023.
- European Parliament, Council of the European Union. Regulation (EU) 2023/1542 of the European Parliament and of the Council of 12 July 2023 concerning batteries and waste batteries. Off. J. Eur. Union 2023, L191, 1–117. [Google Scholar]
- United Nations Economic Commission for Europe. Consolidated Resolution No. 8 Concerning Automotive Life Cycle Assessment (A-LCA), Draft Prepared by the Informal Working Group on A-LCA, GRPE-92-53; UNECE: Geneva, Switzerland, 2025; Available online: https://unece.org/sites/default/files/2025-03/GRPE-92-53e_0.docx (accessed on 15 November 2026).
- Syré, A.M.; Shyposha, P.; Freisem, L.; Pollak, A.; Göhlich, D. Comparative Life Cycle Assessment of Battery and Fuel Cell Electric Cars, Trucks, and Buses. World Electr. Veh. J. 2024, 15, 114. [Google Scholar] [CrossRef] [Scilit]
- Lyu, R.; Wang, Z.; Zhang, Z. Life Cycle Assessment Based on Whole Industry Chain Assessment of FCEVs. Sustainability 2025, 17, 5431. [Google Scholar] [CrossRef] [Scilit]
- Grube, T.; Sander, M. Deployment of Fuel Cell Vehicles in Road Transport and the Expansion of the Hydrogen Refueling Station Network: 2025 Update; Schriften des Forschungszentrums Jülich, Reihe Energie & Umwelt; Forschungszentrum Jülich GmbH, Zentralbibliothek, Verlag: Jülich, Germany, 2025; Volume 678. [Google Scholar] [CrossRef]
- European Hydrogen Observatory. Hydrogen Fuel Cell Electric Vehicles: 2025 Market Data; Clean Hydrogen Partnership: Brussels, Belgium, 2026; Available online: https://observatory.clean-hydrogen.europa.eu/hydrogen-landscape/end-use/hydrogen-fuel-cell-electric-vehicles (accessed on 5 November 2026).
- Ministry of Finance of the People’s Republic of China; Ministry of Industry and Information Technology; Ministry of Science and Technology; National Development and Reform Commission; National Energy Administration. Notice on Carrying Out Fuel Cell Vehicle Demonstration Applications (Cai Jian [2020] No. 394); Ministry of Finance of the People’s Republic of China: Beijing, China, 2020. Available online: https://bj.mof.gov.cn/ztdd/czysjg/zcfg/202103/t20210325_3675910.htm (accessed on 5 November 2026).
- Toyota Motor Corporation. Six Companies Establish R&D Joint Venture for Commercial Vehicle Fuel Cell Systems for the Creation of a Hydrogen-Based Society in China; Toyota Motor Corporation: Toyota City, Japan, 2020; Available online: https://global.toyota/en/newsroom/corporate/32732372.html (accessed on 1 September 2026).
- Zhang, S.; Hao, W.; Zhao, K.; Shi, Z.; Mei, J.; Grigoriev, S.; Sun, C.; Meng, X. Multi-Scale Degradation Trend Perception for Voltage Degradation Prediction of Proton Exchange Membrane Fuel Cells. Batteries 2026, 12, 262. [Google Scholar] [CrossRef] [Scilit]
- Meng, X.; Sun, C.; Mei, J.; Tang, X.; Hasanien, H.M.; Jiang, J.; Fan, F.; Song, K. Fuel Cell Life Prediction Considering the Recovery Phenomenon of Reversible Voltage Loss. J. Power Sources 2025, 625, 235634. [Google Scholar] [CrossRef] [Scilit]
- Tang, X.; Shi, L.; Li, M.; Xu, S.; Sun, C. Health State Estimation and Long-Term Durability Prediction for Vehicular PEM Fuel Cell Stacks Under Dynamic Operational Conditions. IEEE Trans. Power Electron. 2025, 40, 4498–4509. [Google Scholar] [CrossRef] [Scilit]
- Zhang, Y.; Tang, X.; Xu, S.; Sun, C. Deep Learning-Based State-of-Health Estimation of Proton-Exchange Membrane Fuel Cells under Dynamic Operation Conditions. Sensors 2024, 24, 4451. [Google Scholar] [CrossRef] [Scilit]
- Hong, B.K.; Kim, S.H. Recent advances in fuel cell electric vehicle technologies of Hyundai. ECS Trans. 2018, 86, 3–11. [Google Scholar] [CrossRef] [Scilit]
- Eurostat. Final Energy Consumption in Road Transport by Category; Dataset; Data Code: Nrg_d_traq; European Commission, Eurostat: Luxembourg, 2023; Available online: https://ec.europa.eu/eurostat/web/products-eurostat-news/w/ddn-20251128-1 (accessed on 1 September 2026).
- Hyundai Motor Company. Hyundai Motor Joins Hands with Chinese Partners to Lead Hydrogen Mobility Ecosystem Development in China; Hyundai Motor Company: Seoul, Republic of Korea, 2020; Available online: https://www.hyundai.com/worldwide/en/newsroom/detail/0000000600 (accessed on 1 September 2026).
- Sedlar, D.; Tomac, I.; Sun, C.; Tolj, I. Vibration Phenomena in Hydrogen Energy Systems: A Review. Energies 2026, 19, 3757. [Google Scholar] [CrossRef] [Scilit]
- U.S. Department of Energy. DOE Technical Targets for Polymer Electrolyte Membrane Fuel Cell Components; U.S. Department of Energy: Washington, DC, USA, 2019. Available online: https://www.energy.gov/cmei/fuels/doe-technical-targets-polymer-electrolyte-membrane-fuel-cell-components (accessed on 1 September 2026).
- Ballard Power Systems. Recycling PEM Fuel Cells: End-of-Life Management, Fuel Cell Recycling and Platinum Recovery; Technical Note; Ballard Power Systems: Burnaby, BC, Canada, 2022; Available online: https://www.ballard.com/wp-content/uploads/2024/10/recycling-fuel-cells.pdf (accessed on 1 September 2026).
- Marchisio, A.; Dedeci, O. Lab Scale Optimization Results on the 3 PEMFC Recycling Technologies Report; BEST4Hy H2020 EU Project; 2021 December 30. Deliverable 1.1; Version 1. Available online: https://zenodo.org/records/6656097 (accessed on 1 September 2026).
- ISO 19880-1:2020; Gaseous Hydrogen–Fuelling Stations–Part 1: General Requirements. ISO: Geneva, Switzerland, 2020.
- Hydrogen Refueling Solutions. RHeaDHy Project Achieves New Breakthrough in Hydrogen Refueling Technology for Heavy-Duty Mobility; HRS: Grenoble, France, 2026; Available online: https://www.actusnews.com/en/download/hydrogen-refueling-solutions/2026/08/24/99878-hrs-cp-partenariat-rheadhy-vdef-eng.pdf (accessed on 5 November 2026).
- El Harrak, A.; Ait Ousaleh, H.; Mehmood, S.; Filali Baba, Y.; Bürger, I.; Linder, M.; Faik, A. An Analytical Review of Recent Advancements on Solid-State Hydrogen Storage. Int. J. Hydrogen Energy 2024, 52, 1182–1193. [Google Scholar] [CrossRef] [Scilit]
- Hydrogen Europe. Hydrogen Infrastructure Report: The Recipe for a Hydrogen Grid Action Plan; Hydrogen Europe: Brussels, Belgium, 2024; Available online: https://hydrogeneurope.eu/wp-content/uploads/2024/10/2024.10_HE_.Hydrogen-Infrastructure-Report.pdf (accessed on 1 September 2026).
- International Energy Agency. Technology Roadmap: Hydrogen and Fuel Cells; OECD/IEA: Paris, France, 2015; ISBN 978-92-64-23976-0. Available online: https://www.iea.org/reports/technology-roadmap-hydrogen-and-fuel-cells (accessed on 1 September 2026).
- Pyc, I.; Zimmermann, G. Coupling of Power, Fuels, Chemicals: Perspective for Hydrogen and E-Fuels Production. In Proceedings of the 1st Polish Conference on Hydrogen Technology, 25 October 2018, Poland; Conference Presentation; Siemens Power and Gas, Technology and Innovation: Orlando, FL, USA, 2018; Available online: https://klasterwodorowy.pl/images/pliki/aktualnosc_15_11_2018/siemens.pdf (accessed on 1 September 2026).
- Caglayan, D.G.; Weber, N.; Heinrichs, H.U.; Linßen, J.; Robinius, M.; Kukla, P.A.; Stolten, D. Technical potential of salt caverns for hydrogen storage in Europe. Int. J. Hydrogen Energy 2020, 45, 6793–6805. [Google Scholar] [CrossRef] [Scilit]
- Bureau of Economic Geology, The University of Texas at Austin. Hydrogen Storage Potential of Salt Domes in the U.S. Gulf Coast; The University of Texas at Austin: Austin, TX, USA; Available online: https://starr.beg.utexas.edu/digital-tools/hydrogen-storage (accessed on 30 September 2026).
- Hydrogen Council. Global Hydrogen Compass 2025: Industry Progress and Lessons Learned from the First Wave of Mature Clean Hydrogen Projects; Hydrogen Council: Brussels, Belgium, 2025; Available online: https://hydrogencouncil.com/en/global-hydrogen-compass/ (accessed on 1 September 2026).
- National Renewable Energy Laboratory; Argonne National Laboratory. 2024 Transportation Annual Technology Baseline: Hydrogen; National Renewable Energy Laboratory: Golden, CO, USA, 2024. Available online: https://atb.nlr.gov/transportation/2024/Hydrogen (accessed on 1 September 2026).
- James, B.D.; Huya-Kouadio, J. Fuel cell cost and performance analysis. In Proceedings of the DOE Hydrogen Program 2024 Annual Merit Review and Peer Evaluation Meeting, 2024 May 7; Conference Presentation; Project FC353; Strategic Analysis Inc.: Arlington, VA, USA, 2024. Available online: https://www.hydrogen.energy.gov/docs/hydrogenprogramlibraries/pdfs/review24/fc353_james_2024_o.pdf?sfvrsn=98c73f26_3 (accessed on 1 September 2026).


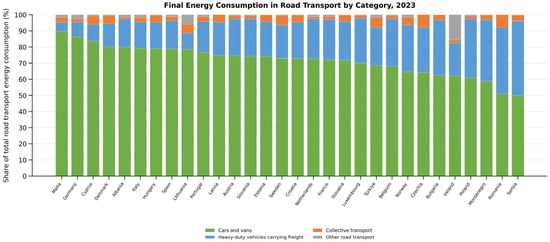
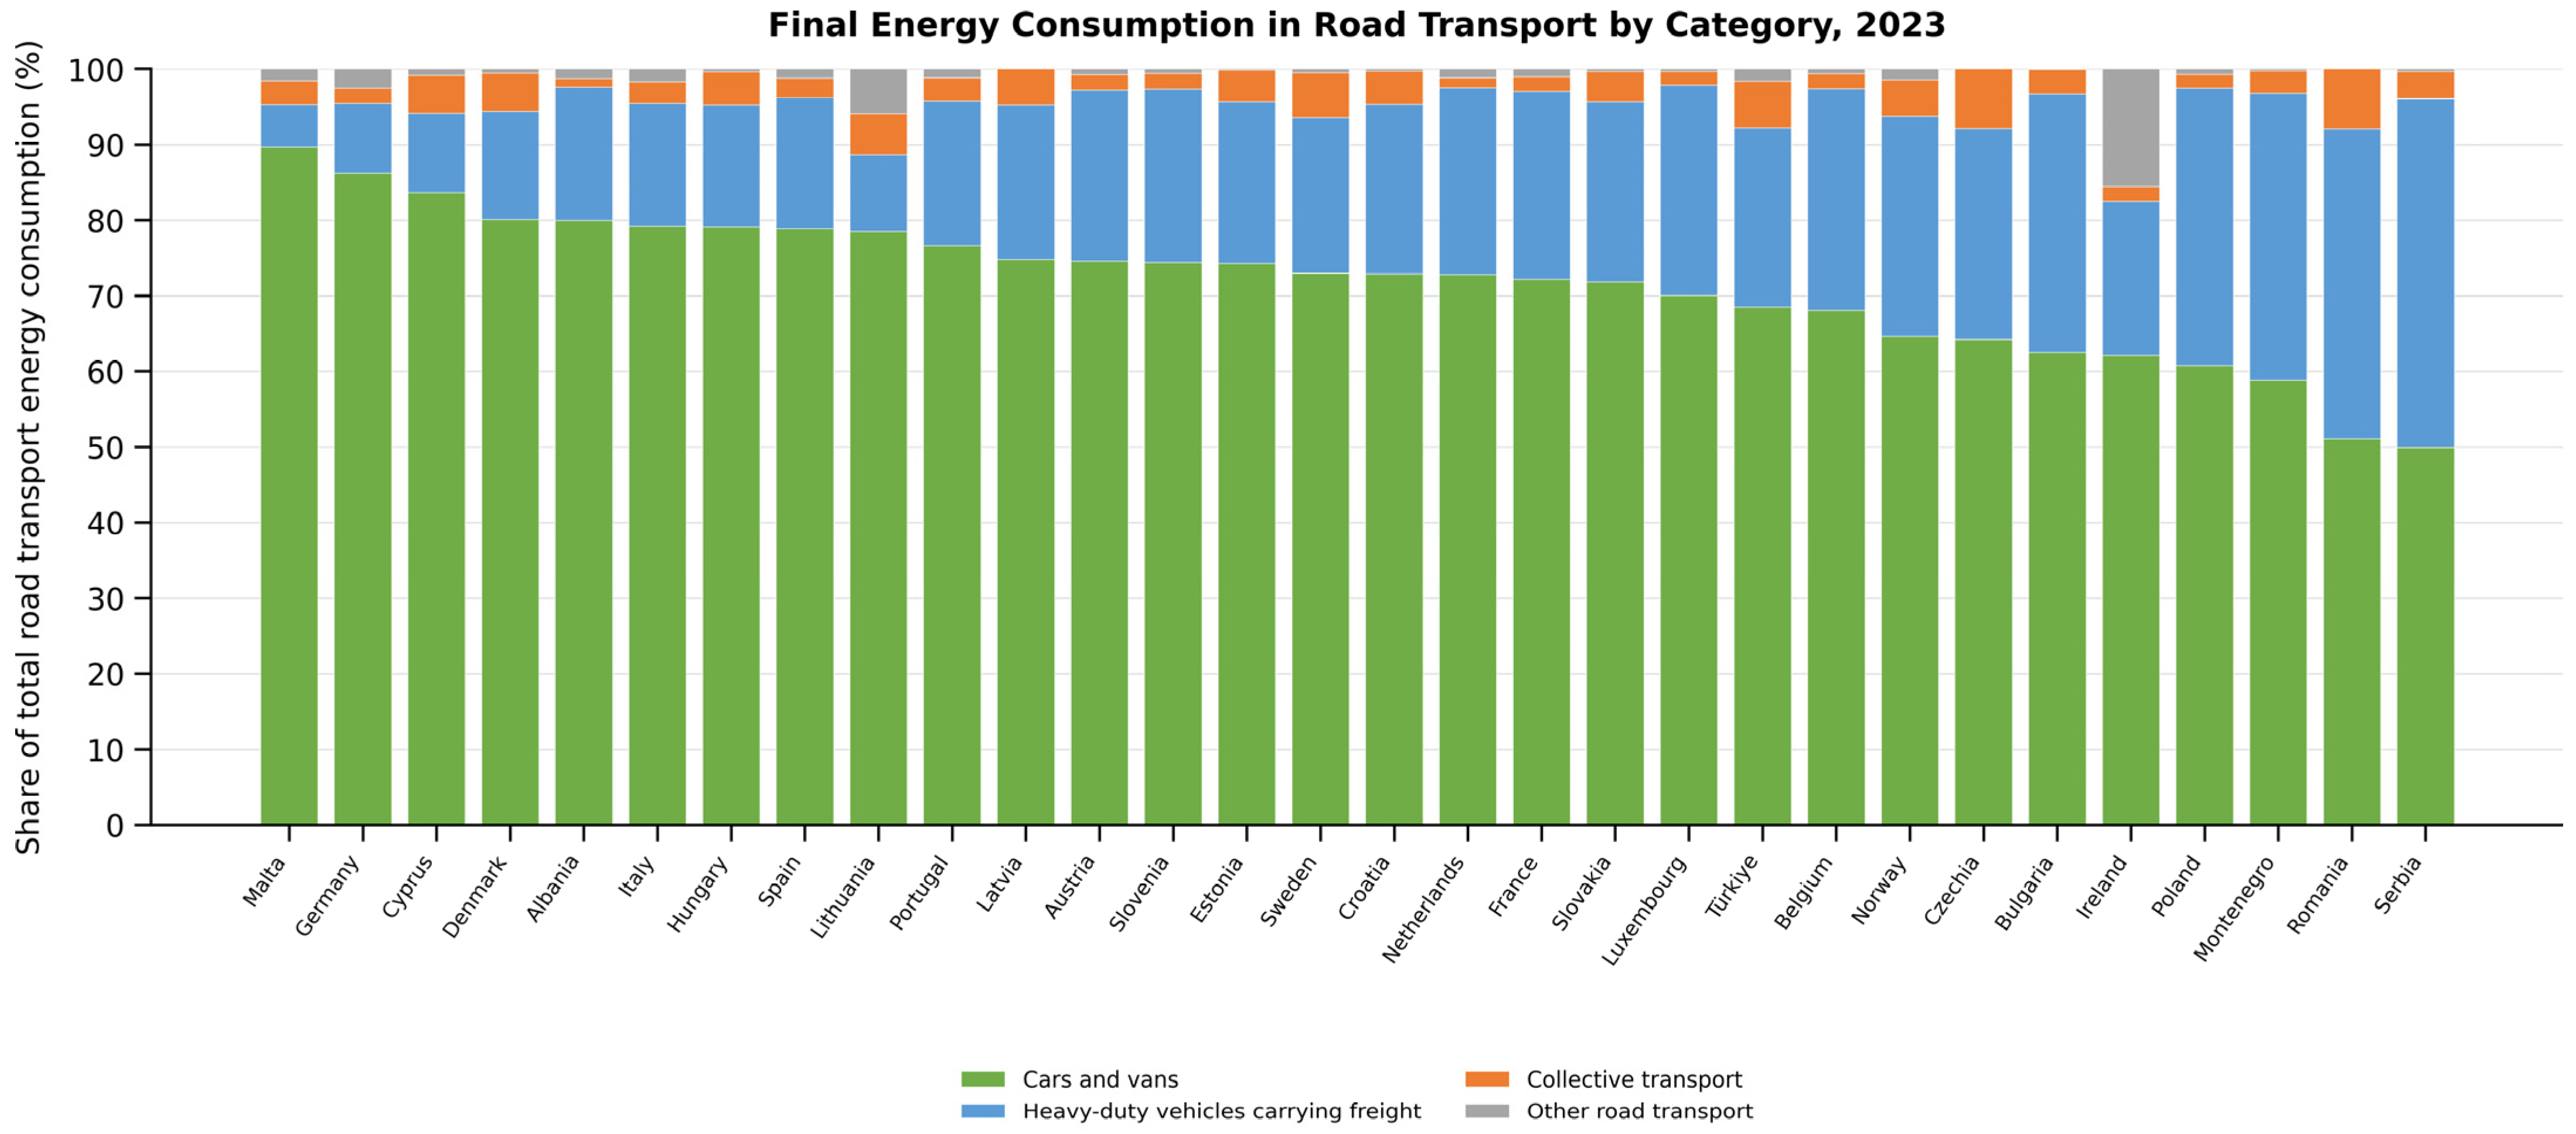
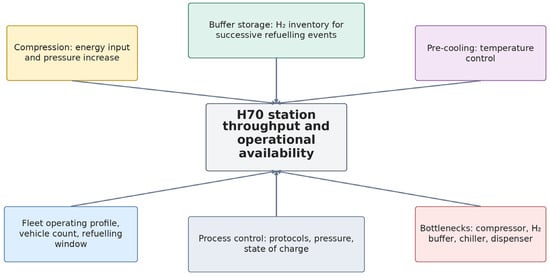
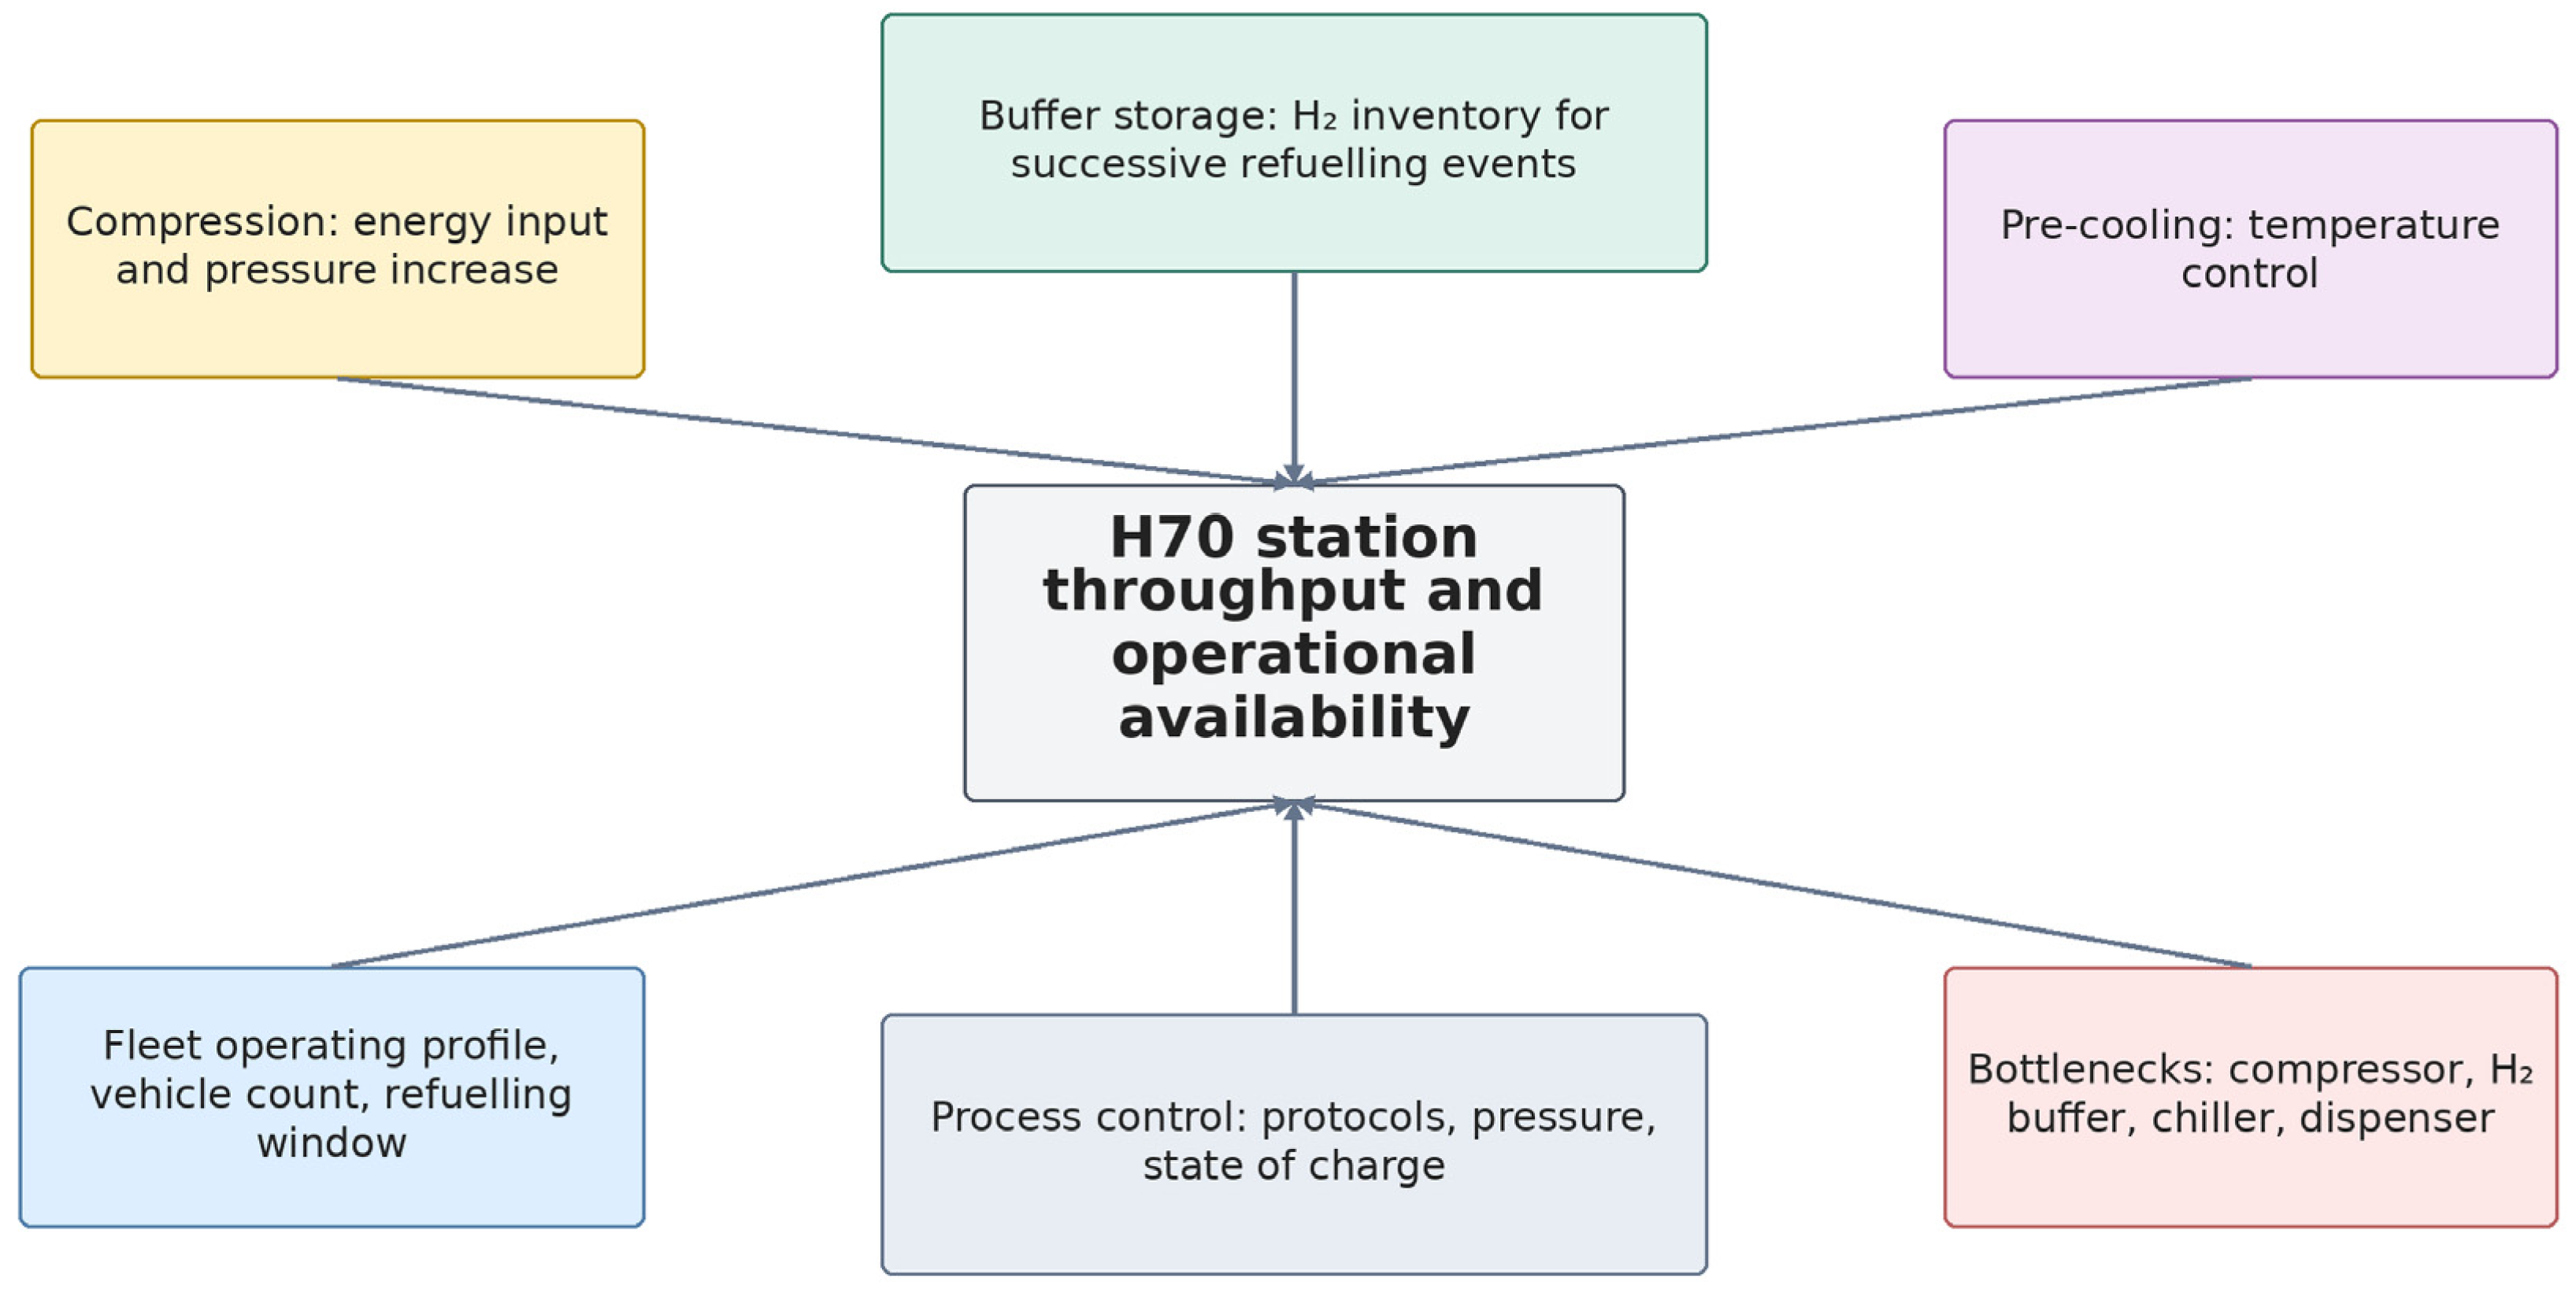
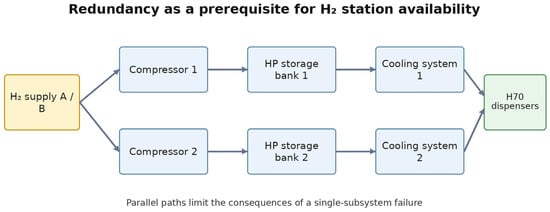
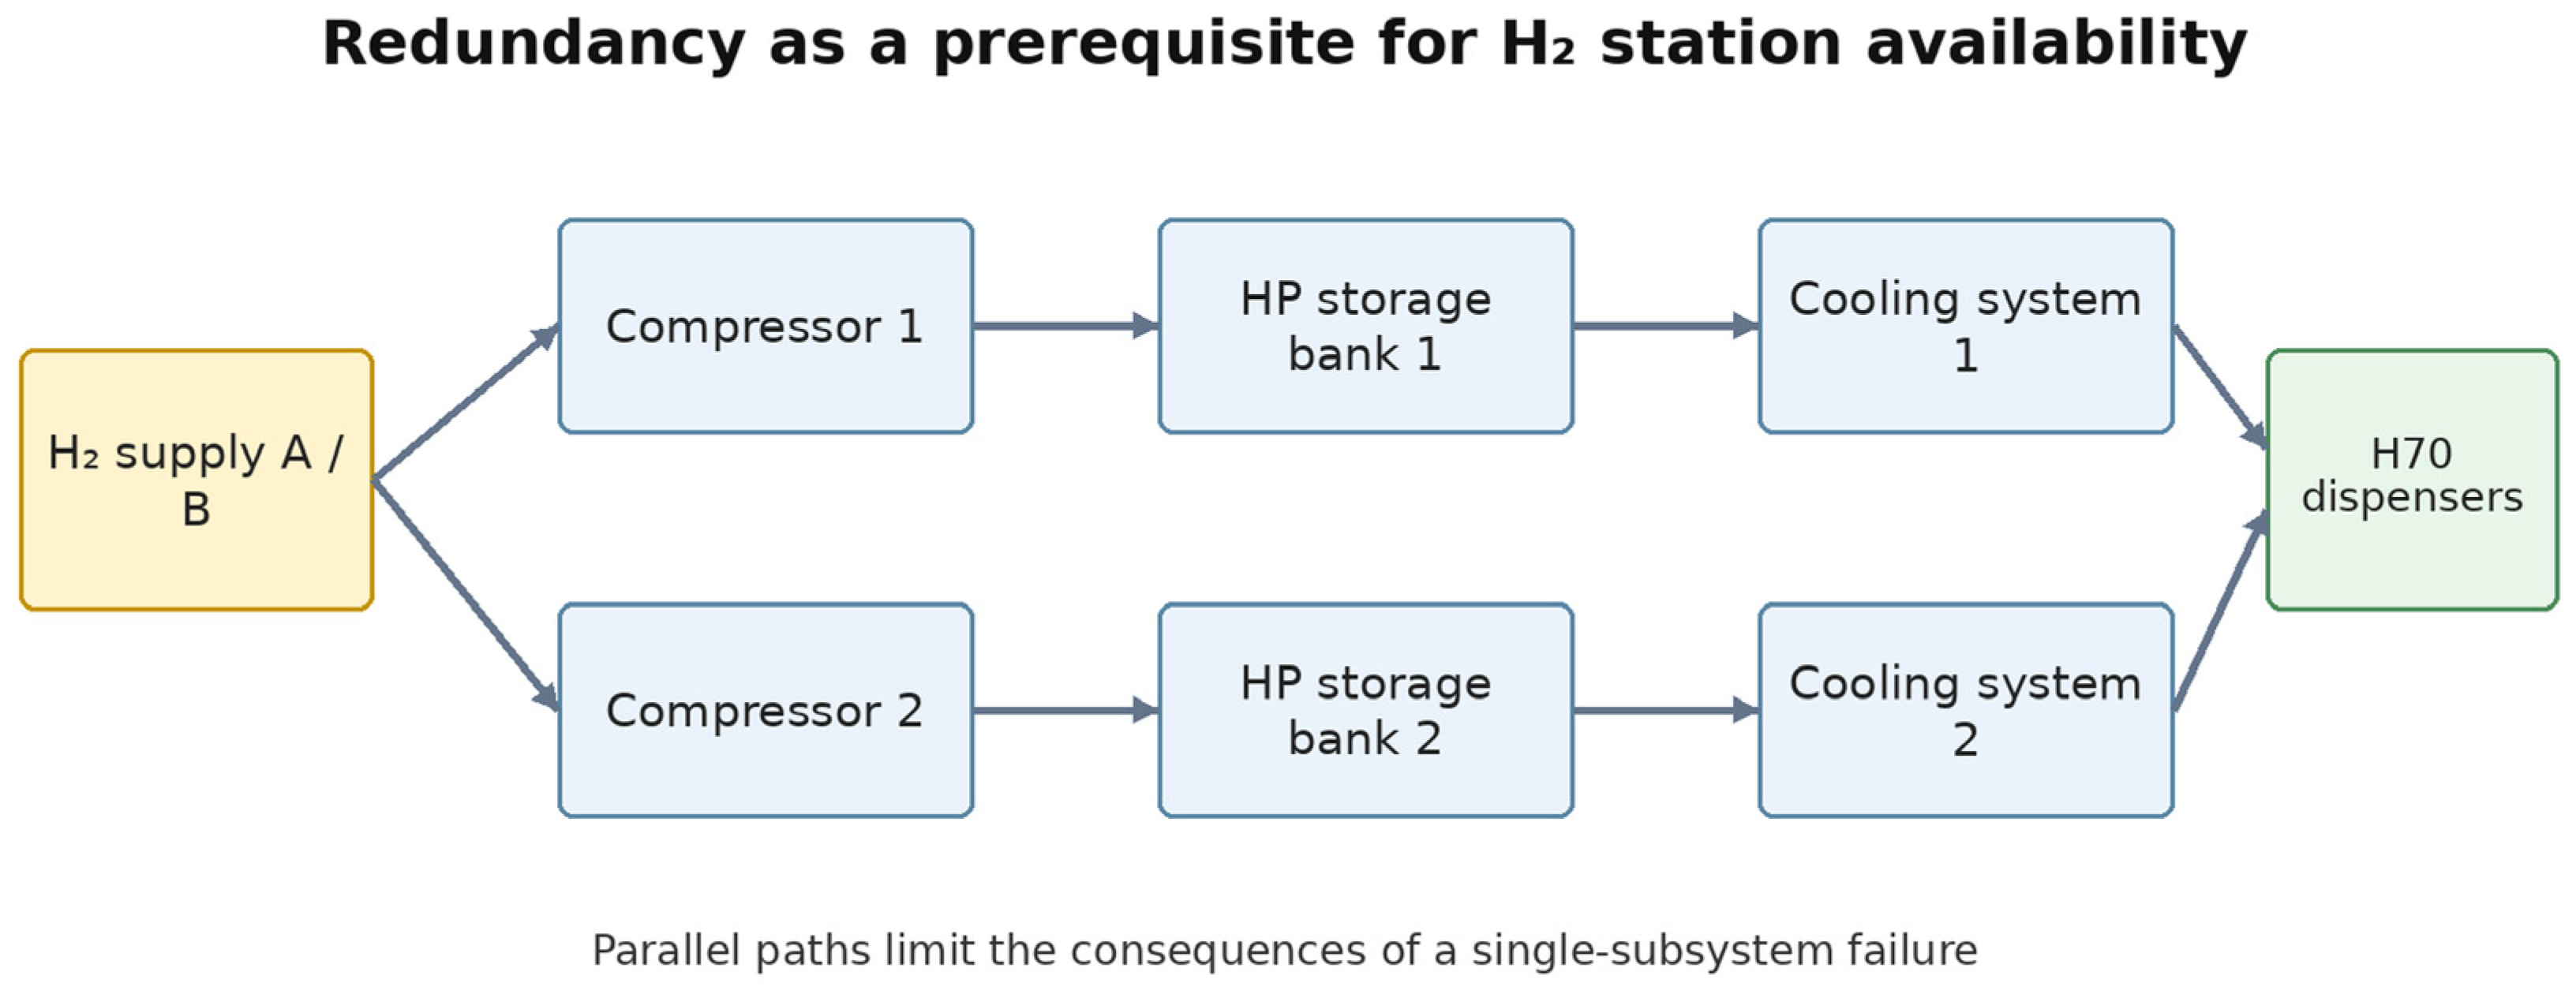
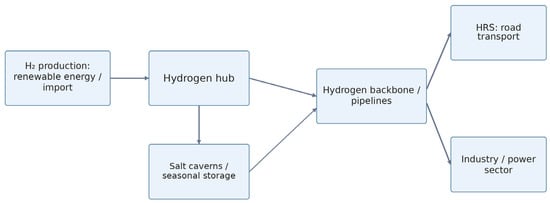
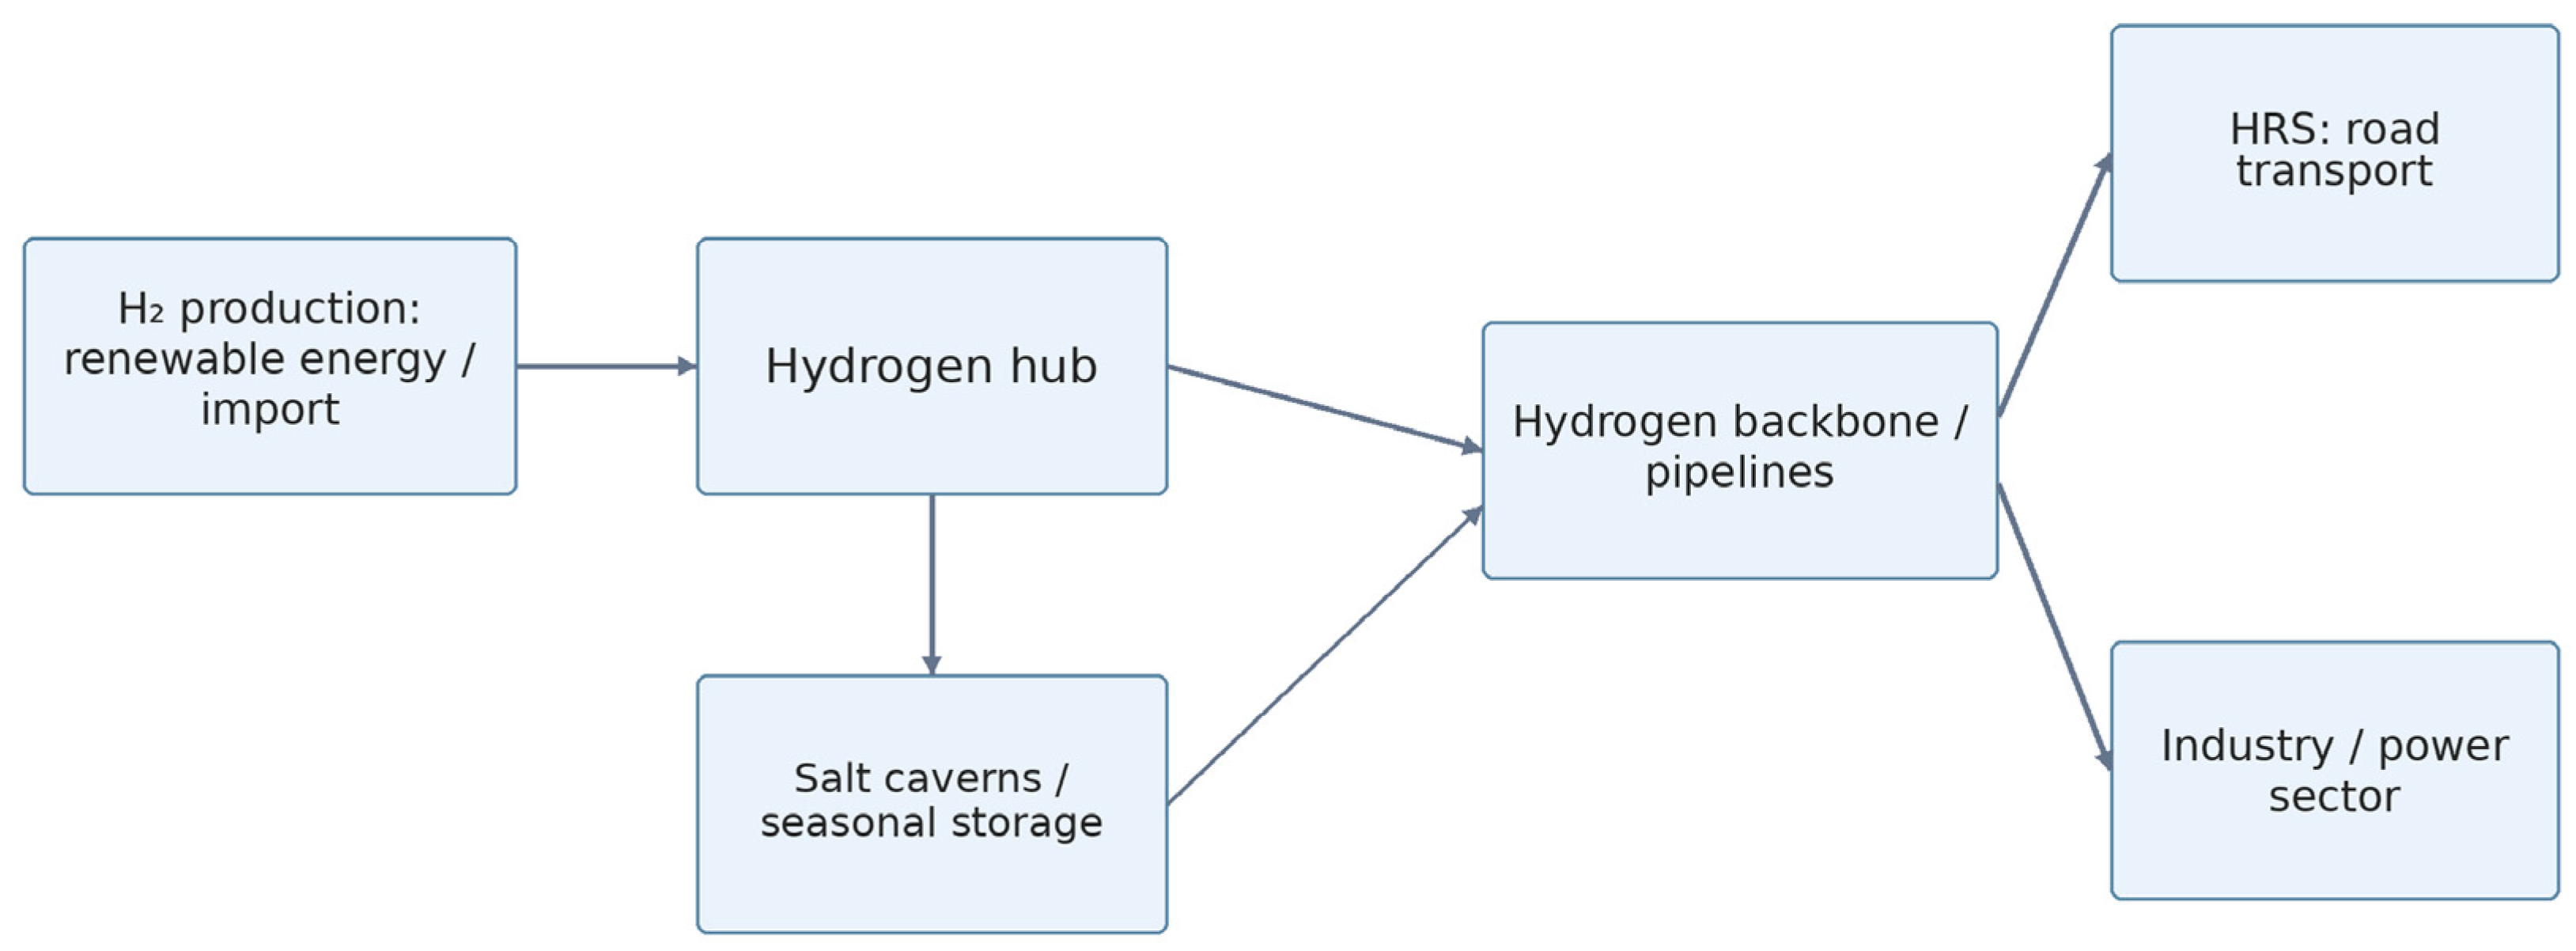
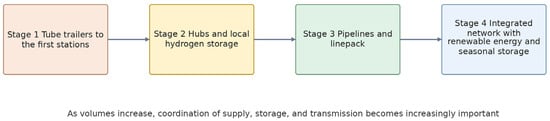
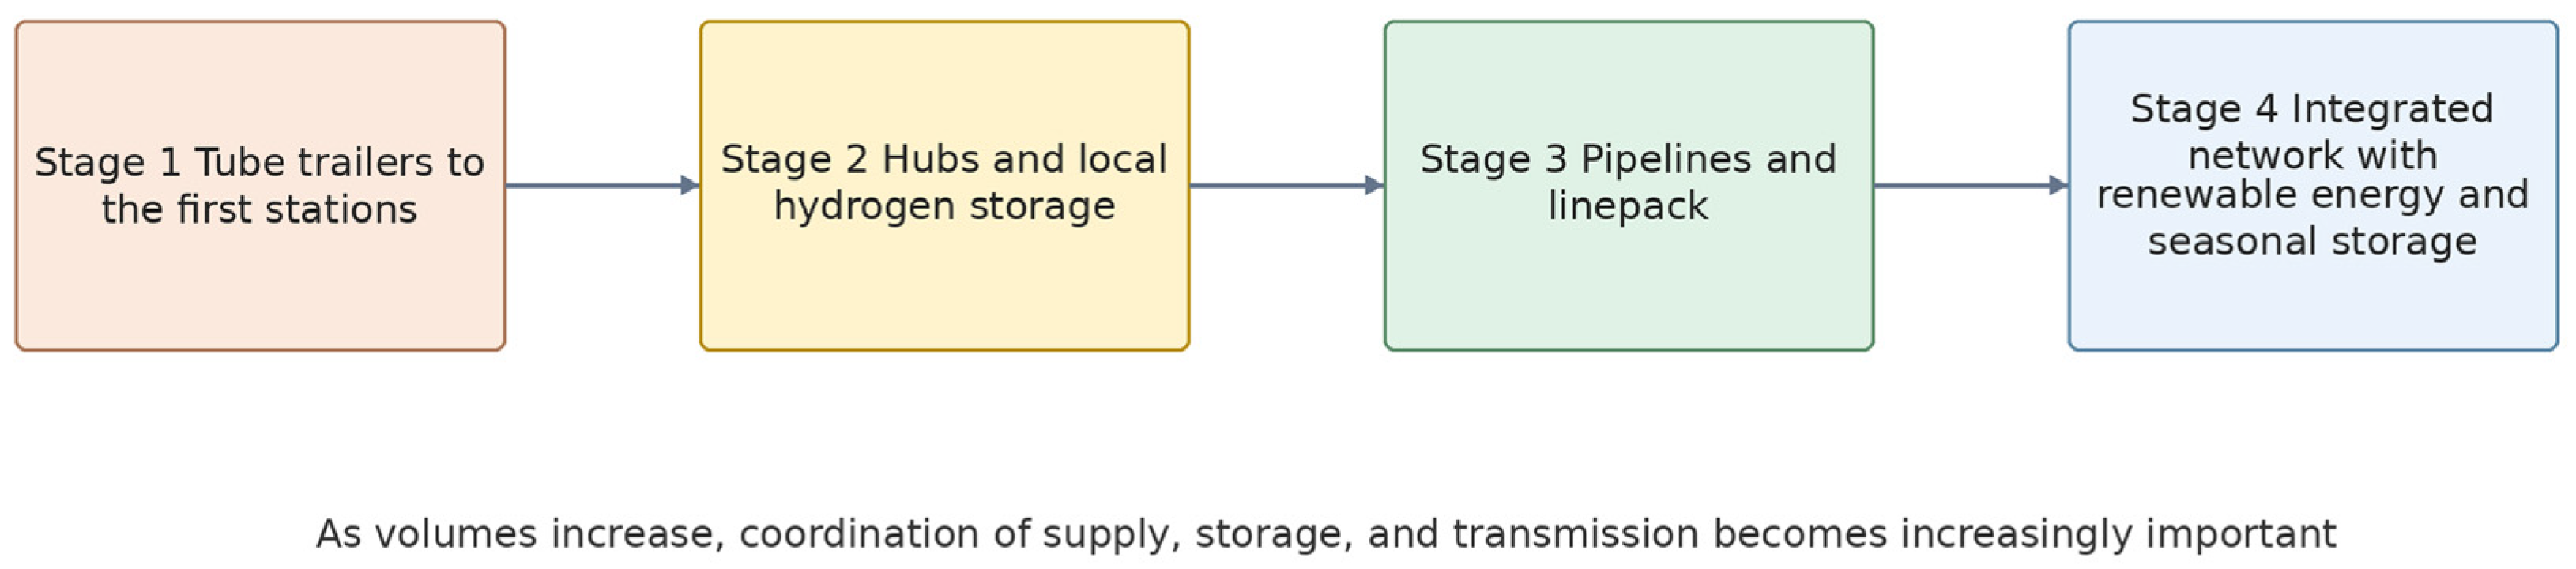

Disclaimer/Publisher’s Note: The statements, opinions and data contained in all publications are solely those of the individual author(s) and contributor(s) and not of MDPI and/or the editor(s). MDPI and/or the editor(s) disclaim responsibility for any injury to people or property resulting from any ideas, methods, instructions or products referred to in the content. |
© 2026 by the author. Licensee MDPI, Basel, Switzerland. This article is an open access article distributed under the terms and conditions of the Creative Commons Attribution (CC BY) license.