


Abstract
Electricity price caps are widely used to limit extreme price movements in China’s provincial spot markets, yet their regulatory performance varies across market environments. This study develops a multidimensional assessment framework for provincial electricity price cap regulation effects covering market operation, economic efficiency, system security and reliability, and social welfare. Nine indicators are weighted by combining the Best–Worst Method (BWM), which incorporates expert judgments, with the entropy weight method (EWM), which reflects observed indicator variation. A cloud model is then used to aggregate the indicators and classify regulatory performance while representing assessment uncertainty. The aggregation uses the indicator cloud parameters reported for three anonymized cases. On a 0–100 scale, Province B achieves the highest comprehensive cloud expectation (84.6637), followed by Province C (78.3319) and Province A (74.9839); all three expectations fall within the “good” score interval. The results reveal meaningful differences in the composite scores and in the balance of outcomes across evaluation dimensions. The proposed framework offers a structured basis for comparing multidimensional outcomes across provincial market cases and identifying dimensions that warrant closer regulatory attention.
1. Introduction
Price cap regulation is a core instrument in China’s electricity market reform. The 2019 pilot guidance advanced spot-market design [1], and the 2020 notice addressed continuous trial settlement [2]. The 2023 trial spot-market rules distinguish bid limits, which bound the prices that market participants may submit, from clearing-price limits, which bound the prices that may result from market clearing. Article 38 requires bid limits to lie within the clearing-price range [3]. The 2024 Basic Rules for Electricity Market Operation establish the broader operating and regulatory framework without setting a uniform national price band [4]. The 2025 renewable feed-in tariff reform calls for appropriately wider spot-market price limits. Provincial authorities are to consider local industrial and commercial peak tariffs when setting the bid ceiling and renewable generators’ revenues outside the electricity market when setting the bid floor [5]. The ceiling and floor described in the 2025 reform apply to submitted bids. Clearing-price limits govern a separate stage of the market. The case comparison does not estimate the effect of their adoption.
As a core supervision measure for China’s power marketization, provincial price cap regulation has become a hot research topic for scholars and industrial staff as spot markets are fully promoted. Constant updates of national spot rules and provincial differentiated limit schemes make it urgent to build an accurate multidimensional evaluation system for regulatory outcomes. Reliable assessment results can inform reviews of bid limits and clearing-price limits, rolling out differentiated supervision and building a unified national power market that matches new power systems and dual-carbon goals. Price cap policies have comprehensive impacts on spot trading, generator earnings, grid safety and end-user electricity costs, making quantitative evaluation of local policy outcomes a shared concern for researchers and regulators. In recent years, multi-attribute decision tools have been widely applied to energy policy assessment. Existing studies adopt BWM, entropy weight and cloud models to evaluate demand response, energy storage risks and grid compliance, offering solid method references. Previous papers also discuss price limit design, market power control and spot price fluctuation simulation. However, few works conduct systematic provincial assessments covering market operation, economic efficiency, power system security guarantee and social welfare via integrated multi-attribute frameworks. To fill this gap, this paper constructs an indicator system with the four above dimensions and establishes a hybrid model combining BWM, entropy weight method and cloud model to quantify and rank price-cap performance across provinces.
Research on electricity-market regulation has identified both the benefits and trade-offs of regulatory interventions. Sirin and Erten investigated temporary price caps and their welfare consequences in the Turkish wholesale electricity market [6], while Tashpulatov examined behavioral and structural remedies in England and Wales [7]. Brown analyzed wholesale pricing patterns and the role of market power [8], and Fabra and Imelda studied how renewable-energy pricing exposure affects market power [9]. The split-market debate further illustrates the distributional and pricing challenges of energy-market intervention [10]. Together, these studies suggest that price regulation should be assessed along several dimensions rather than solely through price stability.
The design of price constraints has also been examined using analytical and market-specific approaches. Nie et al. investigated price cap regulation in a duopoly setting [11], whereas Nálepová and Lampart analyzed the dynamics of regulation in oligopolistic energy markets [12]. Chen et al. discussed price cap setting and longer-term adjustment using market supply and demand [13], and Wu et al. proposed a data-analytics approach to electricity-market price-cap formulation [14]. In related electricity-market research, Song et al. used system dynamics to study renewable portfolio standards and coupled trading [15], while Xie et al. applied an evolutionary-game model to market-power risk prevention [16]. The latter two studies concern related policy and strategic behavior rather than direct empirical measurements of provincial price-cap performance. Accordingly, the present study evaluates multiple observable performance dimensions across its selected cases. Related distribution-network research by Le Thi Minh et al. [17] assesses photovoltaic penetration against engineering and economic criteria. That study addresses network design, whereas the present assessment compares provincial market outcomes. At the operational level, Wood et al. [18] tested a day-ahead electricity load forecasting method that combines long short-term memory with empirical mode decomposition across several datasets. Nguyen et al. [19] studied optimal power flow in transmission networks with nodal electricity prices and wind generation. These studies provide context for load forecasting and network operation, while the present study evaluates provincial market outcomes under price cap regulation.
In summary, existing studies have accumulated abundant theoretical frameworks and multidimensional analytical perspectives on electricity spot price cap design and market regulation, and yielded fruitful research outcomes regarding price constraint mechanisms and market power governance. Nevertheless, few systematic quantitative evaluations focus on the practical performance of provincial price cap policies, which comprehensively integrate market operation, economic efficiency, power system security guarantee and social welfare through integrated multi-attribute decision models. To fill this identified research gap, this paper compares outcomes across three anonymized provincial market cases under price cap regulation. The evaluation system is constructed around four core dimensions—namely market operation, economic efficiency, system security and reliability, and social welfare—and adopts a composite multi-attribute decision model that combines the Best–Worst Method, entropy weight approach and cloud model for empirical measurement.
Within the research field of electricity market policy assessment, multi-criteria decision tools are extensively adopted to resolve complicated evaluation issues with contradictory multi-index targets. How to properly quantify ambiguous, stochastic factors throughout assessment procedures has turned into a core research hotspot for power market regulatory analysis. Here, the cloud model summarizes the uncertainty represented by the indicator inputs.
Concurrently, the existing literature has carried out thorough discussions on the operating benefits of spot price constraints under diverse market environments including day-ahead trading, real-time balancing and auxiliary service markets, and underscores the decisive impact of price regulatory rules on generator revenue levels. As a core restraint mechanism supporting orderly spot market operation, the actual performance of provincial price cap policies can influence the profit opportunities of market participants. Accordingly, establishing a scientific multidimensional evaluation system to compare outcomes under these policies carries great practical value for building a balanced, long-term stable power market framework.
With the constant advancement of electricity market reform and the rapid construction of the new power system, establishing a standardized and holistic evaluation system to compare provincial market outcomes under price cap policies is practically meaningful for refining market regulatory means and promoting the steady operation of the whole power trading market. For this purpose, this study builds an integrated assessment system for provincial price cap regulation effects, which selects nine concrete indicators covering four dimensions: market operation, economic efficiency, system security and reliability, and social welfare. The contributions of the application are as follows:
- (1)
- The application brings nine indicators for market operation, economic efficiency, system security and social welfare onto a common evaluation scale. Reporting both dimension profiles and an overall score shows where cases with similar overall grades differ. BWM, entropy weighting and cloud aggregation are established tools used to make this comparison.
- (2)
- From the empirical perspective, three anonymized cases are used for the comparison. Province B has the highest Ex, followed by Provinces C and A. The ranking is conditional on the recorded indicator cloud parameters and the stated weighting and aggregation rules.
- (3)
- Repeating the aggregation with BWM weights and entropy weights separately tests whether the case ranking depends on the choice to average the two sets of weights.
2. Evaluation Index System Construction for Provincial Electricity Price Cap Regulation Effect in China
Provincial electricity price cap regulation, as the core carrier and critical regulatory tool of China’s power market reform, can influence several aspects of electricity market performance across the whole power industry. First, it reshapes the basic operation logic of power market transactions, turning disorderly price fluctuations under fully liberalized trading into controllable market price movement within standardized upper and lower limits, potentially affecting the operation ecology of electricity spot and medium–long-term markets. Market participants can form stable price expectations under unified price cap constraints, which guides all trading entities to carry out quotations and power transactions in a standardized manner, and may support trading activity and limit extreme price spikes or slumps that disrupt normal market order. This institutional design aims to stabilize market trading order and focuses on standardizing market trading behaviors to maintain sound market operation.
Second, price cap rules can affect profits and investment incentives. Power generation enterprises can no longer rely on extreme peak price surges to gain excess profits; instead, they need to improve operational management and cut power generation costs to secure reasonable returns within the set price range. Well-designed upper and lower price limits balance the profit space of generating units and the overall power purchase cost of industrial and commercial users, forming a stable cost transmission mechanism for the whole society. Meanwhile, differentiated price cap arrangements may preserve profit opportunities for flexible regulating power sources such as peak-shaving units and energy storage, forming long-term investment incentives for flexible resources and boosting the overall economic operation efficiency of the power industry.
Third, rationalized price cap arrangements lay a solid foundation for the safe and stable operation of the new power system. By avoiding excessive compression of peak-period generation returns, the price cap mechanism can help ensure that flexible generating units retain sufficient willingness to increase output during periods of tight power supply, with possible implications for load shedding and peak supply adequacy. In addition, the reserved low quotation interval for renewable energy units can be adapted to the low-cost output characteristics of wind and solar power, raising the actual accommodation level of new energy, mitigating the power balance risks brought by the random fluctuation of renewable energy output, and consolidating the overall security capacity of the power grid.
Finally, the nationwide rollout of standardized electricity price cap regulation increasingly highlights the coordinated promotion of public livelihood benefits and green low-carbon transformation. Stable price fluctuation ranges brought by price caps can limit drastic fluctuations in end-users’ electricity bills, improving users’ perceived fairness and affordability of electricity prices from the perspective of terminal power consumption. At the same time, differentiated price cap design gives priority to market access and grid-connected consumption of low-carbon renewable power, potentially reducing the carbon emission intensity of the whole power generation sector, and driving the steady advancement of the national dual-carbon goals, with implications for social welfare.
In this paper, the construction of an evaluation index system for provincial electricity price cap regulation effects comprehensively considers the above-mentioned multi-faceted practical influences, following the principles of “goal orientation, systematic comprehensiveness, scientific quantification and dynamic comparability”. Based on the diverse practical impacts of electricity price cap regulation on the operation order of the power market, economic operation efficiency of the power industry, stable operation security of the power system and public social welfare, this paper strictly adheres to the core regulatory framework of “market-oriented trading matched with price cap risk control” and aligns with the regulatory requirements of policy documents such as Administrative Measures for Power Market Price Competition. The research organically integrates the practical characteristics of price cap governance, the orientation of market supervision and the scientificity of comprehensive evaluation, and thus constructs an evaluation index system for the effectiveness of provincial electricity price cap regulation from four dimensions: market operation, economic efficiency, system security and reliability, and social welfare, as detailed in Table 1.
Table 1.
Evaluation index system for provincial electricity price cap regulation effects in China.
The market operation dimension evaluates the core role of price cap regulation in standardizing and guiding the orderly operation of the electricity market, including two indicators: market price volatility (C1) and market trading activity (C2). Market price volatility (C1) examines whether standardized price cap limits can effectively curb extreme electricity price spikes and violent fluctuations, which serves as a prerequisite for forming stable market expectations and sound resource allocation signals. Market trading activity (C2) directly reflects overall market liquidity and participants’ willingness to trade through the proportion of market-based electricity volume to total social power consumption, acting as a core indicator to track the implementation progress of China’s “regulate the intermediate, liberalize the two ends” power reform model. The market operation dimension covering C1 and C2 focuses on the stabilizing function of price cap rules for power market transactions. Extreme price swings in day-ahead markets constitute a major disturbance to normal trading order, and existing research on price cap design offers critical theoretical support for analyzing how upper and lower price bounds suppress abnormal price volatility, further verifying the rationality and practical relevance of the indicators selected for this dimension.
The economic efficiency dimension focuses on the incentive effects of electricity price cap regulation on power generators’ daily operation and long-term power investment efficiency, including three indicators: annual average gross profit per kWh of generating units (C3), comprehensive social electricity purchase cost (C4), and incentive level for power investment (C5). The annual average gross profit per kWh of generating units (C3) directly reflects how price cap intervals reshape power producers’ profit margins and overall industry cost transmission trends. The comprehensive social electricity purchase cost (C4) assesses the policy’s ability to control the aggregate power purchase expenditure of all market participants, a core metric for judging whether price constraints can ease the electricity cost burden of industrial and commercial end-users. The incentive level for power investment (C5) inspects the long-term guidance of price caps on power asset expansion under market-oriented pricing, which provides an important basis for evaluating whether the policy facilitates structural optimization of power supply investment and shifts away from blind capacity expansion.
The system security and reliability dimension addresses the maintenance and enhancement of power system safety and operational stability under price cap regulation, comprising two indicators: annual system load shedding hours (C6) and the renewable energy accommodation and utilization rate (C7). Annual system load shedding hours (C6) is the most intuitive metric of system power supply resilience, evaluating whether price cap settings retain sufficient profit space for peak generation units to guarantee uninterrupted power supply while imposing reasonable price constraints. The renewable energy accommodation and utilization rate (C7) not only mirrors the low-carbon transformation progress of the power sector but also indirectly reveals the system’s flexible regulation capacity and refined dispatching management level, serving as a key parameter to measure the safe and efficient operation of new-type power systems dominated by renewables.
The social welfare dimension comprehensively assesses the wide-ranging social impacts and green external benefits brought by price cap regulation, comprising two indicators: user satisfaction with the electricity price (C8) and carbon emission intensity of the power industry (C9). User satisfaction with the electricity price (C8) measures public recognition of the price cap policy from end-users’ perspectives, covering three key perceptions: electricity price affordability, transparency and distribution fairness. The carbon emission intensity of the power industry (C9) evaluates whether differentiated price cap mechanisms can boost grid connection and full consumption of wind and solar power, which is a vital standard to judge whether price cap policies support national dual-carbon targets and the overall green low-carbon transition of the power industry.
3. Evaluation Model Construction for Provincial Electricity Price Cap Regulation Effect in China
Based on the established evaluation index system, an evaluation model for provincial electricity price cap regulation effects is constructed by using the multi-attribute decision-making model, consisting of two parts: (1) determination of indicator weights, and (2) comprehensive integration of indicator weights and performance values using a cloud model to achieve an overall evaluation. This paper employs the arithmetic mean method to integrate the subjective weights derived from the Best–Worst Method (BWM) and the objective weights obtained from the entropy weight method (EWM). This fusion mode features low computation burden and strong interpretability for power policy analysis. Regarding the sensitivity analysis of the weights, it can be implemented via weight perturbation and alternative weight fusion verification, so as to further improve the robustness of evaluation outcomes.
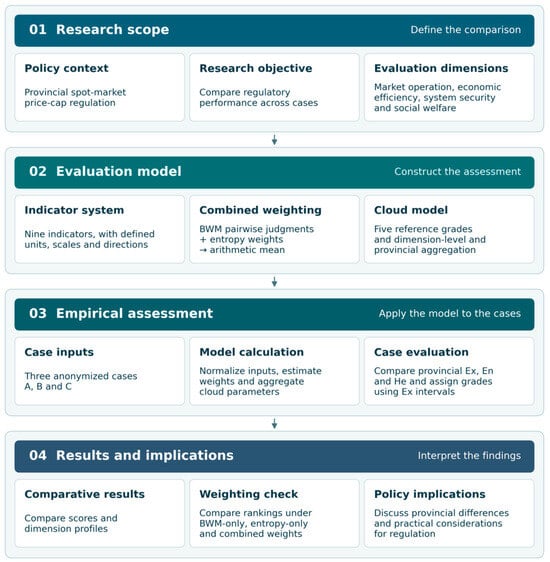
The framework applies BWM, EWM and cloud aggregation to four objectives of provincial electricity price cap regulation. The dimension-level results show which aspects account for differences across cases, and the weighting comparison shows whether those differences change the overall ranking. The overall research framework is presented in Figure 1. The evaluation uses the five-grade scoring scale reported by Liu et al. [20].
Figure 1.
Research framework [20].
3.1. Determination of Indicator Weights Based on Entropy Weight Method and Best–Worst Method
Multi-criteria weighting approaches offer complementary means of representing policy preferences and observed differences among alternatives. Rezaei introduced the Best–Worst Method (BWM) for deriving weights from structured pairwise comparisons [21], while Zou et al. demonstrated entropy-based indicator weighting in a water-quality evaluation setting [22]. Liang et al. examined measurement and thresholds for BWM consistency [23], and Mohammadi and Rezaei extended the method to group decisions through a Bayesian framework [24]. Subjective–objective weight integration has also been explored in fuzzy decision environments [25] and in the evaluation of commercial demand-response performance [26]. These studies motivate combining expert preference information with data-derived differentiation in the present indicator weighting framework.
3.1.1. Entropy Weight Method
The entropy weight method derives objective criterion weights from differences in observed indicator values; it has also been used in hybrid energy-efficiency decision-making approaches [27]. The steps below specify its implementation for the provincial evaluation indicators.
Step 1: Build the original evaluation index matrix. Suppose the evaluation set includes m provincial samples and n assessment indicators for electricity price cap regulation; the raw index matrix X is constructed as:
In the formula, xij represents the original numerical value of the j-th indicator of the i-th provincial object.
Step 2: Calculate the share coefficient and information entropy of each indicator. For any indicator j, the proportion fij of each sample under this indicator is calculated first:
Based on the above proportion value, the information entropy Hj corresponding to the j-th evaluation indicator is derived as follows:
Step 3: Calculate the objective weight of each evaluation indicator. 1 − Hj stands for the information surplus of indicator j. A larger surplus value means the indicator has stronger differentiation ability among different provinces. After normalization processing, the objective weight wj of the j-th indicator is obtained:
The core characteristic of the entropy weight method is that all weight results are only derived from the inherent numerical differences in sample data, without any subjective intervention from experts. It can objectively reflect the discrimination capacity of each indicator when measuring the implementation gap of provincial electricity price cap policies, and make up for the one-sidedness of purely subjective weighting approaches.
3.1.2. Best–Worst Method
The original BWM identifies the best and worst criteria and obtains criterion weights from comparisons involving these two reference criteria [21]. Rezaei subsequently proposed a linear BWM formulation with a unique solution [28]. Related applications combining BWM and cloud-based evaluation include assessments of electricity-retailer credit risk [29] and grid-enterprise power-purchase risk [30]. Combined-weighting approaches have also been employed in industrial energy-efficiency assessment [31]. These examples establish methodological precedents, although their application settings differ from provincial electricity price-cap evaluation. The present study adopts a linear BWM formulation for its subjective component.
Step 1: Select the optimal indicator cB and the worst indicator cW from the full indicator set {c1, c2, …, cn}. The screening standard solely relies on the relative importance of each criterion judged by industry specialists, irrelevant to the specific numerical values of sample indicators from each province. The optimal item refers to the criterion with the highest priority in policy evaluation, whereas the worst item stands for the index with the weakest distinguishing capacity among all dimensions.
Step 2: Assign preference scores with the standard 1–9 semantic scale to quantify the relative importance of the optimal indicator against every remaining criterion, so as to construct the Best-to-Others comparison vector AB = (aB1, aB2, …, aBn). The parameter aBi denotes the preference degree of the optimal indicator over the i-th indicator; larger values represent a wider priority gap, and the self-comparison term satisfies aBB = 1.
Step 3: Similarly, adopt the identical 1–9 scoring scale to measure how important each residual indicator is compared to the worst one, and establish the Others-to-Worst comparison vector AW = (a1W, a2W, …, anW). Here, aiW characterizes the priority level of the i-th indicator relative to the worst criterion; a higher score means stronger reference value of this index in evaluation, with aWW = 1 for self-comparison.
Step 4: Establish and solve the mathematical optimization model to acquire the optimal normalized weight vector (w1*, w2*, …, wn*). To obtain reasonable weight allocation for all indicators, the target function is designed to minimize the maximum value of two types of absolute deviation terms {|wB − aBiwi|,|wi − (aiWwW|} across all criteria. The primitive nonlinear optimization formula is written as Equation (5):
For the convenience of numerical calculation, the above nonlinear model is converted into an equivalent linear programming structure shown in Equation (6):
Step 5: Execute consistency inspection for expert judgment data. The consistency ratio CR can be calculated by combining the optimal deviation ξ* derived from linear programming solution and the fixed consistency index CI matched with BWM, as shown in Equation (7):
In this formula, CR represents the overall consistency level of all pairwise comparison results, and CI is the fixed coefficient corresponding to the BWM scoring system. A smaller solved ξ* will generate a lower CR value, which signifies more unified expert judgment logic and higher credibility of the obtained indicator weights.
3.2. Comprehensive Evaluation Based on the Cloud Model
Cloud models represent the joint uncertainty arising from fuzziness and randomness. Li et al. described the cloud model as a cognitive framework for such uncertainty [32]. Subsequent energy-sector applications include multidimensional cloud-based risk evaluation in green electricity markets [33] and analysis of renewable hybrid output characteristics [34]. These studies motivate the use of cloud-model parameters for expressing uncertainty in indicator-level and overall assessment results.
Step 1: Construct standard conceptual clouds corresponding to different performance grades. This study divides the implementation effect of provincial electricity price cap regulation into five tiers: very poor, relatively poor, moderate, good, and excellent. The three cloud characteristic parameters of each standard grade are solved via Equations (8)–(10):
where Vmax and Vmin separately denote the upper limit and lower limit of the scoring interval of a single evaluation grade. After calculating Ex, En and He of each grade, the forward cloud generator is adopted to generate standard reference clouds.
Step 2: Calculate the cloud expectation value of each primary evaluation dimension. The dimension-level comprehensive score Ki is obtained through weighted summation of standardized single-index scores and integrated combined weights, as shown in Equation (11): in this step, the weights of the indicators within each dimension are divided by their sum.
where ωij represents the combined weight of the j-th sub-index under the i-th dimension, and oij stands for the standardized performance value of the j-th indicator of each provincial sample. This step aggregates scattered single-indicator cloud information into unified dimensional cloud digital features.
The same within-dimension weighted average is applied separately to indicator En and He. Each dimension weight is the sum of the combined weights of the indicators within that dimension. Step 3: Fuse cloud parameters of all four dimensions to obtain the overall comprehensive cloud characteristics of each province. The weighted aggregation formulas for overall expectation Ex, total entropy En and overall hyper-entropy He are defined in Equations (12)–(14):
In the above formulas, Exg, Eng, Heg are the three cloud parameters of the g-th primary dimension, and ωg refers to the aggregated weight of each evaluation dimension. The evaluation grade is determined by identifying the grading interval that contains the unrounded overall expectation Ex.
Ex summarizes the score on the chosen evaluation scale. En and He summarize the dispersion and uncertainty represented by the cloud inputs. Their values alone do not establish temporal price volatility or the effect of external shocks.
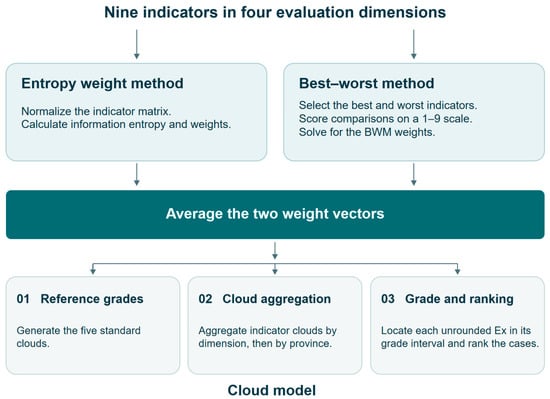
Figure 2 visually demonstrates the full evaluation procedure for the provincial electricity price cap supervision performance.
Figure 2.
Evaluation framework for provincial electricity price cap regulation.
4. Empirical Analysis
China’s provincial electricity price cap regulation has undergone a multi-stage evolution alongside the gradual rollout of spot market pilots, shifting from initial exploratory limit-setting to a more refined, regionally differentiated regulatory framework. Under the overarching principle of “stabilizing prices while invigorating competition,” most provincial spot markets have established upper and lower price bounds tailored to local supply–demand conditions, grid structure characteristics, and clean energy penetration levels. Despite this nationwide institutional convergence, substantial regional disparities persist in both the design parameters and operational outcomes of price cap rules. Eastern coastal provinces with advanced marketization advancement (e.g., Zhejiang, Shandong) generally feature tighter price bands paired with more sophisticated dynamic adjustment mechanisms. These regions benefit from deeper liquidity in medium- and long-term contracts, richer experience in market-based trading, and stronger regulatory capacity, enabling price caps to function as effective stabilizers without unduly suppressing market signals. Central provinces (e.g., Shanxi, Anhui) occupy an intermediate position, where price cap settings must reconcile the dual pressures of ensuring affordable industrial electricity costs and maintaining reasonable returns for coal-dominated generation fleets. Northern provinces (e.g., Inner Mongolia) face the most pronounced seasonal volatility, with winter heating demand and summer peak loads driving sharp swings in supply–demand balances, which complicates the calibration of static price cap thresholds. Western provinces rich in renewable resources (e.g., Qinghai) tend to adopt wider lower-limit intervals to accommodate zero-marginal-cost wind and solar output, yet grapple with challenges such as curtailment risks and limited transmission export capacity. The calculation uses three anonymized cases (A, B and C). The regional examples describe the policy setting for the framework.
4.1. Determination of Indicator Weights
Indicator weighting constitutes a foundational step in evaluating provincial price cap regulation effectiveness, as the assigned weights directly shape the ranking and grading of regulatory performance. This study adopts a combined weighting methodology that fuses expert-derived subjective judgments via the Best–Worst Method (BWM) with data-driven objective information extracted through the entropy weight method (EWM). The final integrated weights are computed as the arithmetic mean of the two sets, striking a deliberate balance between professional regulatory experience and empirical data characteristics.
4.1.1. Subjective Weight Calculation for Indicators
The retained BWM comparison vectors use annual average gross profit per kWh of generating units (C3) as the best indicator and annual system load shedding hours (C6) as the worst indicator. The Best-to-Others comparison vector is shown in Table 2.
Table 2.
Comparison results between the best indicator and other indicators.
Similarly, the Others-to-Worst comparison vector, anchored to the worst indicator C6, is presented in Table 3.
Table 3.
Comparison results between the worst indicator and other indicators.
Then, the Best-to-Others comparison vector and the Others-to-Worst comparison vector can be obtained as
AB = (3, 4, 1, 2, 5, 8, 6, 7, 9)
AW = (6, 5, 8, 7, 4, 1, 3, 2, 9)
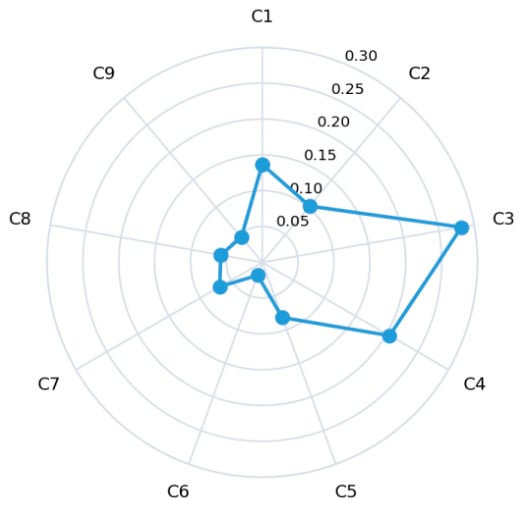
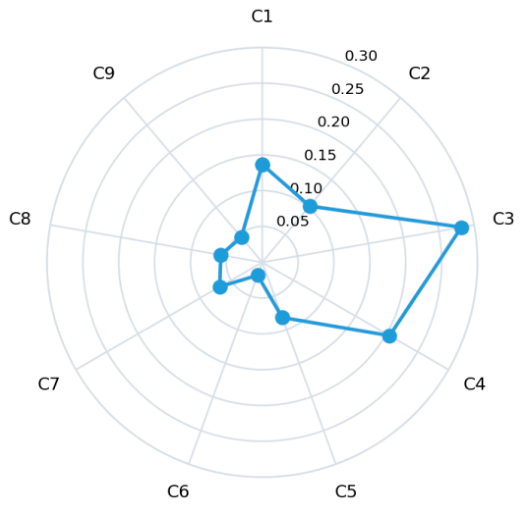
The subjective weights of all nine indicators were solved by linear programming using Equation (6) and the vectors in Table 2 and Table 3. The optimal maximum absolute deviation is 0.12790669. Figure 3 shows the resulting weights.
Figure 3.
Subjective weights of nine indicators.
4.1.2. Objective Weight Calculation for Indicators
The EWM calculation uses the three rows retained in the indicator worksheet, in C1–C9 order and in the worksheet scale. Row 1 is (0.28, 0.42, 0.085, 0.62, 1.15, 2.5, 96.2, 78, 0.48), row 2 is (0.35, 0.38, 0.072, 0.55, 1.08, 3.2, 94.5, 82, 0.52), and row 3 is (0.52, 0.31, 0.058, 0.48, 1.22, 4.8, 91.8, 85, 0.32). For C1, C4, C6 and C9, normalization subtracts the observation from the column maximum and divides by the range. For the other indicators, it subtracts the minimum and divides by the range. These normalized values enter Equation (2), with 0 ln 0 taken as zero in Equation (3). Entropy weights reflect variation across these three rows. The weighting step does not require matching the rows to individual cloud cases. Appendix A gives the indicator definitions, units and directions used to interpret these inputs.
Applying Equations (1) through (4), the entropy weight method yields the objective weight distribution for the nine indicators, as depicted in Figure 4. Notably, the carbon emission intensity of the power industry (C9) commands the highest objective weight among all indicators. This outcome aligns with the core logic of the entropy method, indicators exhibiting the greatest cross-province dispersion carry the strongest discriminatory power and thus receive higher objective weights.
Figure 4.
Objective weights of nine indicators.
4.1.3. Combined Weights for Indicators
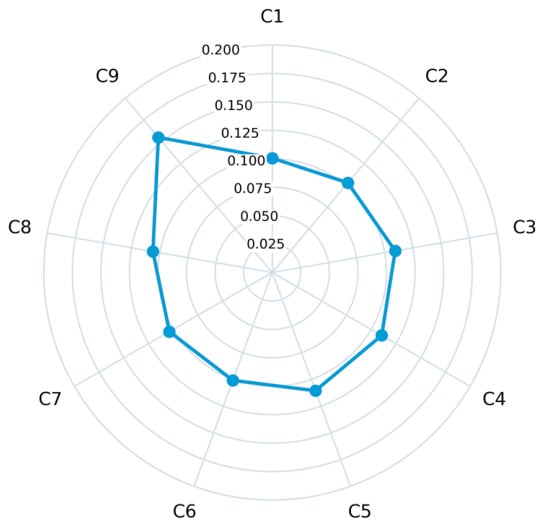
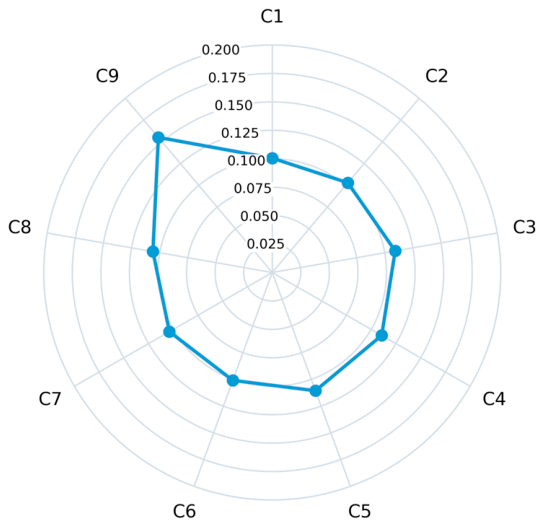
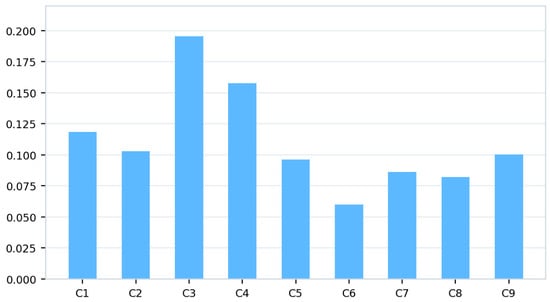
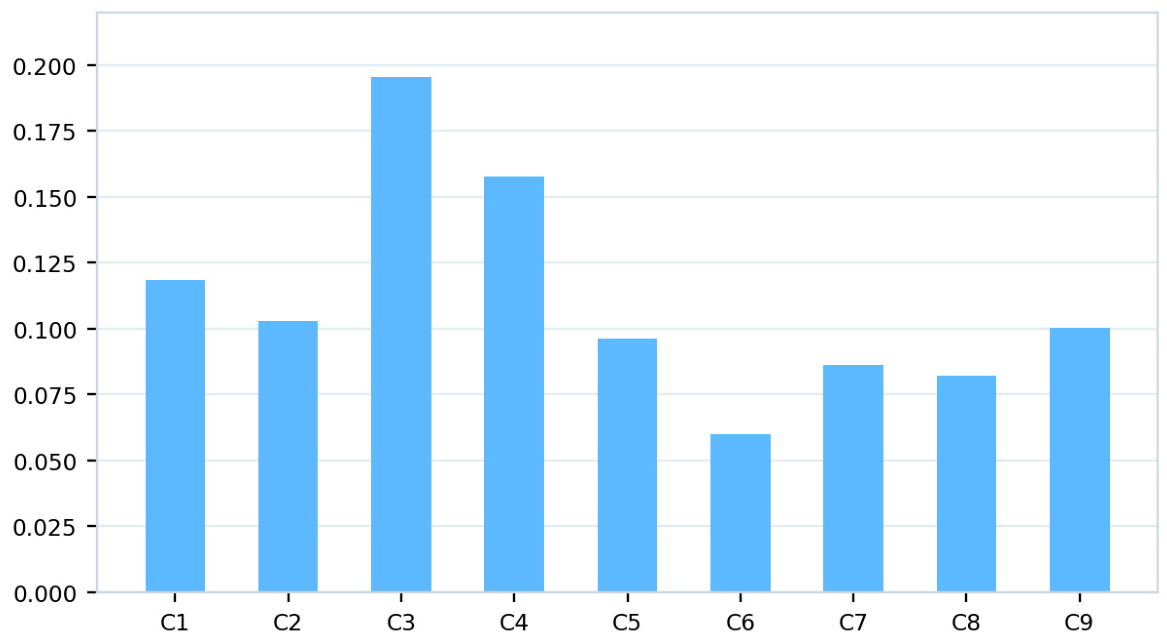
The final indicator weights are derived by averaging the subjective BWM weights and objective EWM weights, as shown in Figure 5. The choice of arithmetic mean fusion is justified on three grounds:
Figure 5.
Final combined weights of the nine evaluation indicators.
- (1)
- Methodological parsimony: The arithmetic mean represents a classical, transparent approach to combining subjective and objective weights. Its computational simplicity and intuitive interpretability fit the practical needs of regulatory evaluation, where stakeholders must readily understand how weights are derived without recourse to opaque optimization algorithms.
- (2)
- Convergence validation: For market trading activity (C2), the BWM and EWM weights are 0.1025 and 0.1030, respectively.
- (3)
- Research scope alignment: This investigation centers on characterizing regional heterogeneity in price cap regulation effects. The arithmetic mean fusion produces sufficiently differentiated weights to support the core comparative analysis, without necessitating more elaborate fusion techniques such as game-theoretic weighting or multiplicative aggregation. Section 4.2.3 compares the results with BWM-only and EWM-only weighting.
The detailed numerical values of the subjective, objective, and final weights are tabulated in Table 4.
Table 4.
Quantitative table of nine indicator weights.
The final weights of each indicator show obvious numerical differentiation, with values ranging from 0.0601 to 0.1957, which demonstrates substantial gaps in the contribution degree of different evaluation indicators when measuring the execution effect of provincial electricity price cap policies. All nine indicators can be split into three hierarchical groups based on their integrated weight magnitudes:
High-Importance Tier (final weight > 0.12): This group covers annual average gross profit per kWh of generating units (C3, 0.1957) and comprehensive social electricity purchase cost (C4, 0.1578). Together these two indicators account for 35.35% of the combined weight.
Medium-Importance Tier (0.09 < final weight ≤ 0.12): Four indicators fall within this range: market price volatility (C1), market trading activity (C2), incentive level for power investment (C5), and carbon emission intensity of the power industry (C9).
Low-Importance Tier (final weight ≤ 0.09): The remaining indicators are annual system load shedding hours (C6), the renewable energy accommodation and utilization rate (C7), and user satisfaction with the electricity price (C8).
For annual average gross profit per kWh of generating units (C3), the BWM weight is 0.2821 and the EWM weight is 0.1093. C3 has the largest BWM weight.
Carbon emission intensity of the power industry (C9) has the largest EWM weight, 0.1551, compared with a BWM weight of 0.0456. Its combined weight is 0.1003.
Market trading activity (C2) and user satisfaction with the electricity price (C8) receive combined weights of 0.1027 and 0.0823, respectively.
Annual system load shedding hours (C6) has the lowest combined weight (0.0601). Market price volatility (C1) receives 0.1186, placing it in the medium tier.
4.2. Evaluation of Provincial Electricity Price Cap Regulation Effects
4.2.1. Determination of Evaluation Grades
The adopted grading and aggregation procedure draws on applications of cloud-based decision evaluation to new-power-system investment [35], multi-period multi-criteria analysis in renewable-energy transitions [36], and economic appraisal of energy storage under electricity-market scenarios [37]. Related work on electricity–carbon market coupling [38] and electricity-retailer pricing strategies [39] provides further contextual examples of interacting objectives and market behavior. These sources motivate a multidimensional comparative assessment. Table 5 lists the grade intervals and corresponding cloud parameters [20].
Table 5.
Evaluation grades and standard cloud parameters [20].
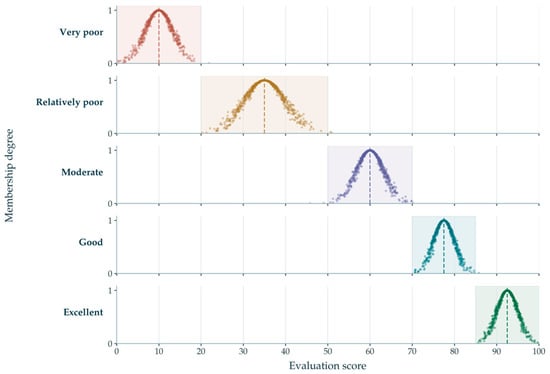
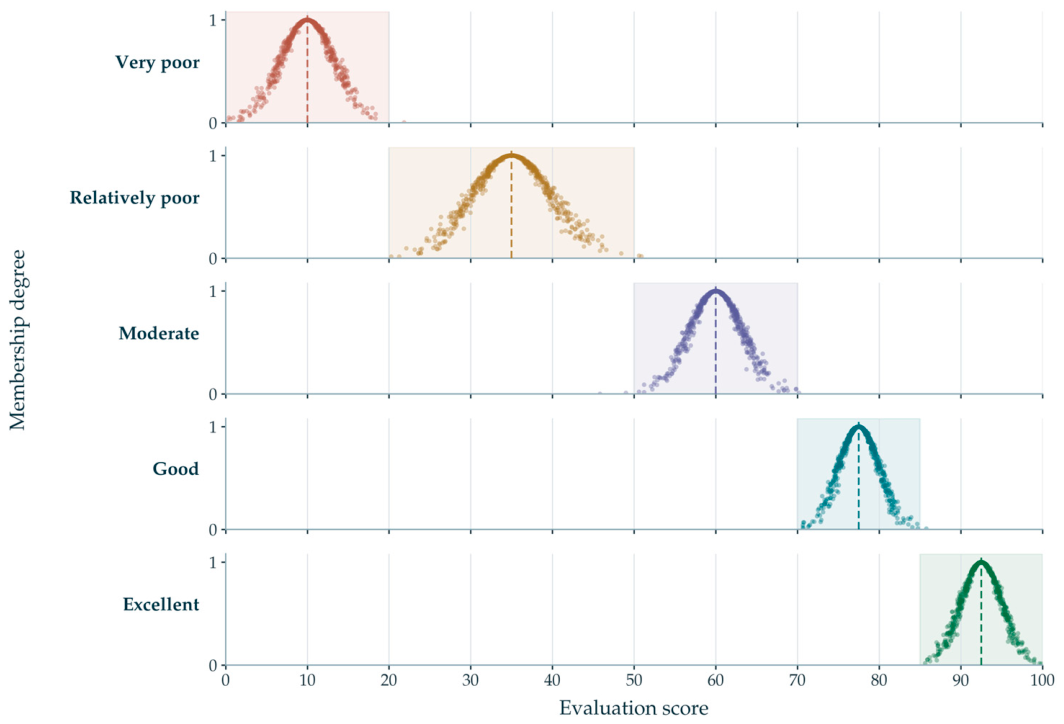
Figure 6 shows the five standard reference clouds simulated from the Ex, En and He values in Table 5. The shaded bands indicate the grade intervals used to classify the provincial Ex values. The vertical dashed lines mark the expectation (Ex) of each reference cloud.
Figure 6.
Standard reference clouds by evaluation grade.
4.2.2. Calculation of Indicator Cloud Results
The aggregation takes the indicator-level cloud parameters for cases A, B and C directly from Table 6, Table 7 and Table 8. The indicator weights come from Table 4. Table 9, Table 10 and Table 11 report the dimension parameters obtained by within-dimension weighted averaging, as described in Section 3.2. Calculations use unrounded weights and parameters until the results are displayed.
Table 6.
Cloud parameters corresponding to the indicators for Province A.
Table 7.
Cloud parameters corresponding to the indicators for Province B.
Table 8.
Cloud parameters corresponding to the indicators for Province C.
Table 9.
Cloud parameters corresponding to the four dimensions for Province A.
Table 10.
Cloud parameters corresponding to the four dimensions for Province B.
Table 11.
Cloud parameters corresponding to the four dimensions for Province C.
4.2.3. Comprehensive Cloud Evaluation Result
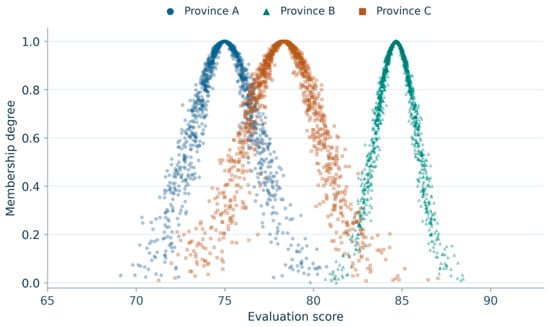
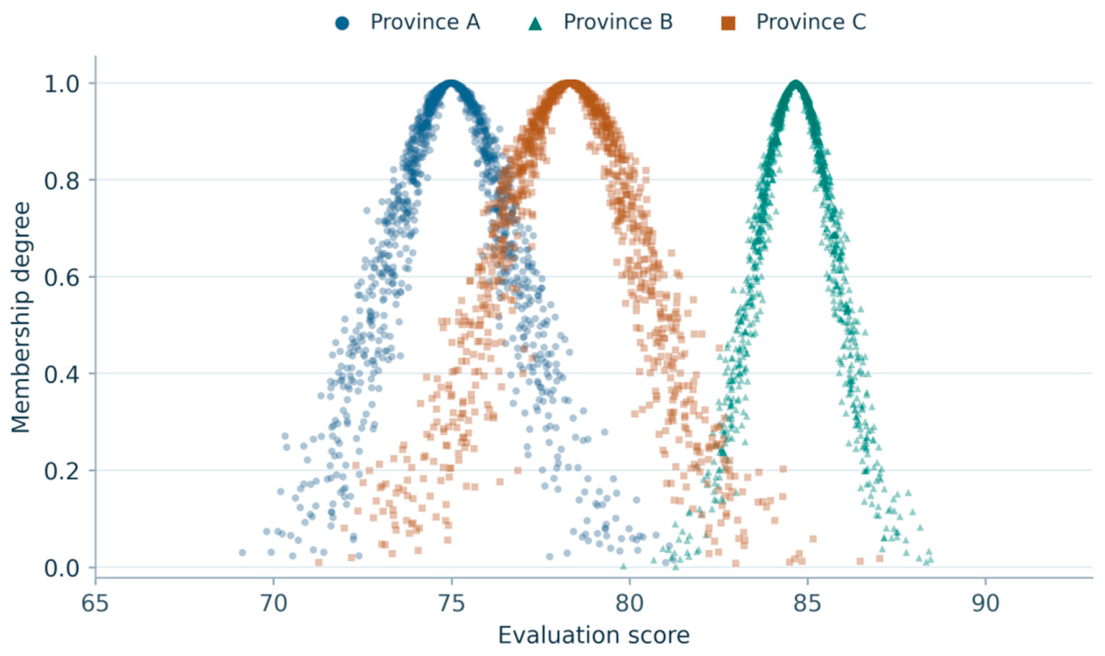
By substituting the dimension parameters and weights into Equations (12)–(14), the overall cloud parameters are obtained for Province A (Ex = 74.9839, En = 1.8768, He = 0.3544), Province B (Ex = 84.6637, En = 1.2135, He = 0.1627), and Province C (Ex = 78.3319, En = 2.1810, He = 0.4238). For Province A, the numerator and denominator of Equation (12) are 140.72680072 and 1.87675945, respectively. The three unrounded Ex values fall within the “good” interval in Table 5.
Province B presents the highest comprehensive Ex (84.6637) and the lowest En and He of the three cases. Province C ranks second on Ex (78.3319) and has the largest En and He. Province A ranks third on Ex (74.9839). Figure 7 compares the three aggregate cloud parameters for each province. The cloud drops in Figure 7 were simulated from the reported Ex, En and He parameters under the combined indicator weights.
Figure 7.
Comprehensive evaluation clouds by province.
For the weighting check, the same indicator cloud inputs were aggregated using the BWM and EWM weights separately. The BWM-only Ex values for A, B and C are 74.5482, 84.5790, and 77.9402; the EWM-only values are 75.4319, 84.7459, and 78.7341. The ranking B > C > A is the same for both alternatives and the combined weights.
The sensitivity analysis varies the indicator weights while holding the cloud parameters in Table 6, Table 7 and Table 8 fixed.
Market maturity, resource endowment and seasonal supply–demand conditions can also influence provincial market outcomes. The cloud comparison does not isolate their effects or the effects of price caps. The case profiles can therefore help identify issues for local review, such as whether existing clearing-price limits preserve incentives for flexible generation during tight supply.
5. Conclusions and Future Research
5.1. Conclusions
This paper constructs a complete multidimensional assessment system tailored to provincial electricity price cap governance, which sorts out nine quantifiable evaluation indicators distributed across market operation, economic efficiency, grid security and social welfare—four major dimensions. A composite multi-criteria evaluation framework is built by combining the BWM subjective weighting method, entropy weight objective weighting approach and uncertainty cloud model. The three anonymized cases are compared by aggregating the recorded indicator cloud parameters with the recalculated weights.
First, the established indicator system matches the institutional logic of domestic spot price cap supervision, and covers multi-layered governance goals without one-sided economic bias. Calculation of dimension aggregated weights shows economic efficiency takes up the largest share at 0.4498.
Second, annual average gross profit per kWh of generating units (C3) and comprehensive social electricity purchase cost (C4) receive the two largest combined weights. C3 and carbon emission intensity (C9), taken together, account for 29.60% of the total weight.
Third, the ranking of comprehensive cloud expectation is Province B > Province C > Province A under the combined weights and under either weighting method alone. All three expectations lie in the “good” interval under the combined weights. These results are conditional on the retained cloud inputs.
Before the winter heating season, a province could publish a rule for temporarily adjusting the clearing-price ceiling during periods of tight supply. A sustained forecast reserve shortfall would trigger review, with verified fuel costs and heat-constrained generating capacity informing the size of any adjustment. A fixed review schedule and a limit on each change would reduce repeated interventions. Any temporary clearing-price ceiling would expire once the reserve margin recovers for a specified period. Monitoring generator availability, demand response and consumer exposure would help determine whether the rule preserves scarcity signals without imposing undue costs.
5.2. Future Research
Targeting the three deficiencies above and combining the construction pace of the national unified power market and new energy system, this paper puts forward three clear expansion paths for future research.
First, expand the sample pool and carry out classified evaluation by regional clusters. The four evaluation dimensions can be retained, with locally appropriate indicators for seasonal water availability in hydropower-dominated provinces and transmission constraints and curtailment in offshore wind regions. Entropy weights should be recalculated for the enlarged sample because indicator dispersion can change. BWM judgments should also be reviewed if the regional priorities change. The three-case analysis does not establish the magnitude of these changes.
Second, introduce time-varying weight calculation and multi-stage dynamic cloud assessment. Gather consecutive multi-year indicator panel data, apply rolling window BWM-entropy hybrid weighting to calculate annual weight shifts. Build multi-cycle dynamic cloud generators to track long-term evolution of provincial price cap effects, and examine how market trading, generator profits and carbon emissions evolve around revisions to price limits.
Third, integrate stakeholder game analysis into the evaluation framework. Current research only conducts static horizontal comparisons from the regulator’s perspective. Follow-up works can construct an evolutionary game matrix covering power producers, purchasers and regulatory authorities. Simulate the long-term strategic choices of all market entities under different price limit parameters, then further optimize dynamic upper and lower bound adjustment formulas from the balance of multi-party interests.
Besides the three core expansion directions, subsequent research can also carry out comparative tests between this paper’s hybrid model and mainstream multi-attribute tools such as TOPSIS and VIKOR. Test the stability of regional performance rankings under different algorithm frameworks, and further improve the accuracy and credibility of the provincial price cap effect evaluation model.
Author Contributions
Conceptualization, X.M. and S.G.; methodology, X.M., Z.W. and Z.X.; software, Y.L. and Z.X.; validation, X.M. and H.G.; formal analysis, X.M., R.L. and Z.X.; investigation, Z.W.; resources, Y.L.; data curation, X.M.; writing—original draft preparation, X.M.; writing—review and editing, S.G.; visualization, X.M., Z.W. and Y.L.; supervision, S.G.; project administration, X.M. and Y.L.; funding acquisition, X.M. and Y.L. All authors have read and agreed to the published version of the manuscript.
Funding
This work was supported by a headquarters-managed science and technology project of State Grid Corporation of China, titled “Research on Price Cap, Supply Assurance and Price Stabilization Mechanisms in Electricity Markets for the New-Type Power System” (Project No. 52060025002D-197-ZN).
Data Availability Statement
The inputs used in the reported calculations are provided in Section 4.1.2 and Table 2, Table 3, Table 6, Table 7 and Table 8. The archived materials contain the comparison vectors and summary cloud parameters. They do not include individual elicitation or scoring records, observation dates, or primary-source documentation.
Acknowledgments
The authors thank the editors and reviewers for their work and suggestions.
Conflicts of Interest
Authors Xiang Ma, Zhaoheng Wang, Hang Gao and Rong Lin were employed by the company State Grid Electric Power Research Institute Co., Ltd. Author Yan Li was employed by the State Grid Shandong Electric Power Company. The funding sponsors had no role in the design of the study; in the collection, analyses, or interpretation of data; in the writing of the manuscript; or in the decision to publish the results.
Appendix A. Indicator Definitions and Input Scales
Table A1 presents the definitions specified in the indicator framework. Section 4.1.2 reports the numerical inputs as retained in the worksheet.
Table A1.
Definitions, units and normalization directions for C1–C9.
References
- General Office of the National Development and Reform Commission; General Department of the National Energy Administration. Notice on Deepening the Pilots for Electricity Spot Market Development; Fa Gai Ban Neng Yuan Gui [2019] No. 828. Available online: https://zfxxgk.ndrc.gov.cn/web/iteminfo.jsp?id=19420 (accessed on 5 November 2026).
- General Office of the National Development and Reform Commission; General Department of the National Energy Administration. Notice on Continuous Trial Settlement in Electricity Spot Market Pilots; Fa Gai Ban Neng Yuan Gui [2020] No. 245. Available online: https://zfxxgk.ndrc.gov.cn/web/iteminfo.jsp?id=16944 (accessed on 5 November 2026).
- National Development and Reform Commission; National Energy Administration. Basic Rules for the Electricity Spot Market (Trial); Fa Gai Neng Yuan Gui [2023] No. 1217. Available online: https://zfxxgk.ndrc.gov.cn/web/iteminfo.jsp?id=20272 (accessed on 5 November 2026).
- National Development and Reform Commission. Basic Rules for Electricity Market Operation; Order No. 20, 2024. Available online: https://zfxxgk.ndrc.gov.cn/web/iteminfo.jsp?id=20379 (accessed on 5 November 2026).
- National Development and Reform Commission; National Energy Administration. Notice on Deepening the Market-Oriented Reform of Renewable Energy Feed-in Tariffs and Promoting High-Quality Renewable Energy Development; No. 136, 2025. Available online: https://zfxxgk.ndrc.gov.cn/web/iteminfo.jsp?id=20482 (accessed on 5 November 2026).
- Sirin, S.M.; Erten, I. Price spikes, temporary price caps, and welfare effects of regulatory interventions on wholesale electricity markets. Energy Policy 2022, 163, 112816. [Google Scholar] [CrossRef] [Scilit]
- Tashpulatov, S.N. The Impact of Behavioral and Structural Remedies on Electricity Prices: The Case of the England and Wales Electricity Market. Energies 2018, 11, 3420. [Google Scholar] [CrossRef] [Scilit]
- Brown, D.P.; Eckert, A. Pricing Patterns in Wholesale Electricity Markets: Unilateral Market Power or Coordinated Behavior? J. Ind. Econ. 2022, 70, 168–216. [Google Scholar] [CrossRef] [Scilit]
- Fabra, N.; Imelda. Market Power and Price Exposure: Learning from Changes in Renewable Energy Regulation. Am. Econ. J. Econ. Policy 2023, 15, 323–358. [Google Scholar] [CrossRef] [Scilit]
- Weyman-Jones, T. Energy Price Decoupling and the Split Market Issue. Energies 2023, 16, 5910. [Google Scholar] [CrossRef] [Scilit]
- Nie, P.Y.; Wen, H.X.; Wang, C. Price cap regulation under duopoly. Manag. Decis. Econ. 2023, 44, 1376–1382. [Google Scholar] [CrossRef] [Scilit]
- Nálepová, V.; Lampart, M. Stabilizing energy markets: A dynamic analysis of price cap regulation in oligopolistic environments. Energy Econ. 2025, 151, 108879. [Google Scholar] [CrossRef] [Scilit]
- Chen, S.; Guo, M.; Qian, Y.; Lan, L.; Fu, C. Price Cap Setting and Long-Term Adjustment Strategy for Electricity Spot Market Based on Supply and Demand Relationship. In Proceedings of the 2024 4th International Conference on Energy Engineering and Power Systems (EEPS), Hangzhou, China, 9–11 August 2024; pp. 601–605. [Google Scholar]
- Wu, J.; Bao, M.; Sun, X.; Lin, J.; Ding, Y. A data-analytics approach for price cap formulation of electricity markets considering synergistic efficiency of generation and demand sides. Energy 2025, 339, 138511. [Google Scholar] [CrossRef] [Scilit]
- Song, X.H.; Han, J.J.; Zhang, L.; Zhao, C.P.; Wang, P.; Liu, X.Y.; Li, Q.C. Impacts of renewable portfolio standards on multi-market coupling trading of renewable energy in China: A scenario-based system dynamics model. Energy Policy 2021, 159, 112647. [Google Scholar] [CrossRef] [Scilit]
- Xie, J.; Guan, B.; Yao, Y.; Li, R.; Shi, Q. Market power risk prevention mechanism of China’s electricity spot market based on stochastic evolutionary game dynamics. Front. Energy Res. 2023, 11, 1270681. [Google Scholar] [CrossRef] [Scilit]
- Le Thi Minh, C.; Pham, H.H.; Nguyen, T.T.; Duong, M.Q.; Mussetta, M. Optimal Penetration Level of Photovoltaic Units in Distribution Networks Considering Engineering and Economic Performance Using the Pied Kingfisher Optimizer. Electronics 2026, 15, 1674. [Google Scholar] [CrossRef] [Scilit]
- Wood, M.; Ogliari, E.; Nespoli, A.; Simpkins, T.; Leva, S. Day Ahead Electric Load Forecast: A Comprehensive LSTM-EMD Methodology and Several Diverse Case Studies. Forecasting 2023, 5, 297–314. [Google Scholar] [CrossRef] [Scilit]
- Nguyen, T.T.; Nguyen, H.D.; Duong, M.Q. Optimal Power Flow Solutions for Power System Considering Electric Market and Renewable Energy. Appl. Sci. 2023, 13, 3330. [Google Scholar] [CrossRef] [Scilit]
- Liu, L.; Cheng, C.; Li, Q.; Zhang, J.; Guo, S. Evaluation of Provincial Transmission and Distribution Price Reform Effect in China Based on a Multi-Attribute Decision-Making Model. Sustainability 2026, 18, 5014. [Google Scholar] [CrossRef] [Scilit]
- Rezaei, J. Best-worst multi-criteria decision-making method. Omega 2015, 53, 49–57. [Google Scholar] [CrossRef] [Scilit]
- Zou, Z.H.; Yun, Y.; Sun, J.N. Entropy method for determination of weight of evaluating indicators in fuzzy synthetic evaluation for water quality assessment. J. Environ. Sci. 2006, 18, 1020–1023. [Google Scholar] [CrossRef] [Scilit] [PubMed]
- Liang, F.; Brunelli, M.; Rezaei, J. Consistency issues in the best worst method: Measurements and thresholds. Omega 2020, 96, 102175. [Google Scholar] [CrossRef] [Scilit]
- Mohammadi, M.; Rezaei, J. Bayesian best-worst method: A probabilistic group decision making model. Omega 2020, 96, 102075. [Google Scholar] [CrossRef] [Scilit]
- Chang, K.H. Combining subjective and objective weights considerations to solve the emergency location selection problems under spherical fuzzy environments. Appl. Soft Comput. 2024, 153, 111272. [Google Scholar] [CrossRef] [Scilit]
- Dong, J.; Huo, H.; Liu, D.; Li, R. Evaluating the Comprehensive Performance of Demand Response for Commercial Customers by Applying Combination Weighting Techniques and Fuzzy VIKOR Approach. Sustainability 2017, 9, 1332. [Google Scholar] [CrossRef] [Scilit]
- Banadkouki, M.R.Z. Selection of strategies to improve energy efficiency in industry: A hybrid approach using entropy weight method and fuzzy TOPSIS. Energy 2023, 279, 128070. [Google Scholar] [CrossRef] [Scilit]
- Rezaei, J. Best-worst multi-criteria decision-making method: Some properties and a linear model. Omega 2016, 64, 126–130. [Google Scholar] [CrossRef] [Scilit]
- Zhang, Y.; Zhao, H.; Li, B.; Zhao, Y.; Qi, Z. Research on credit rating and risk measurement of electricity retailers based on Bayesian Best Worst Method–Cloud Model and improved Credit Metrics model in China’s power market. Energy 2022, 252, 124088. [Google Scholar] [CrossRef] [Scilit]
- Huang, Q.; Jiang, M.; Bi, M.; Xue, B.; Liu, T.; Zhou, Y. Research on power purchase risk measurement and grading evaluation of grid enterprises based on improved BWM–Cloud model under agency mode. Int. J. Low-Carbon Technol. 2025, 20, 568–579. [Google Scholar] [CrossRef] [Scilit]
- Gu, R.; Tang, C.; Huang, H.; Deng, G.; Tan, C.; Hu, J.; Du, J.; Wang, H. Evaluating Copper Smelting Flue Gas Waste Heat Recovery Efficiency: A Game Theory-Based Combined Weighting Approach. Energies 2026, 19, 2173. [Google Scholar] [CrossRef] [Scilit]
- Li, D.; Liu, C.; Gan, W. A new cognitive model: Cloud model. Int. J. Intell. Syst. 2009, 24, 357–375. [Google Scholar] [CrossRef] [Scilit]
- Pan, W.W.; Qiao, S.B.; Ruan, T.T.; Luo, R.J.; Li, Z.Y. Risk evaluation and management mechanism of green electricity market based on multi-dimensional cloud model. Front. Energy Res. 2023, 11, 1203633. [Google Scholar] [CrossRef] [Scilit]
- Min, H.L.; He, P.K.; Li, C.L.; Yang, L.B.; Xiao, F. The Temporal and Spatial Characteristics of Wind–Photovoltaic–Hydro Hybrid Power Output Based on a Cloud Model and Copula Function. Energies 2024, 17, 1024. [Google Scholar] [CrossRef] [Scilit]
- Ma, S.; Chen, M.; Mei, S. Research on the optimal model for the evaluation of new power system investment projects based on the cloud model–DS evidence theory–TOPSIS method. Energy Sci. Eng. 2024, 12, 22–38. [Google Scholar] [CrossRef] [Scilit]
- Witt, T.; Klumpp, M. Multi-Period Multi-Criteria Decision Making under Uncertainty: A Renewable Energy Transition Case from Germany. Sustainability 2021, 13, 6300. [Google Scholar] [CrossRef] [Scilit]
- Wang, Z.; Wang, Y.; Ding, Q.; Wang, C.; Zhang, K. Energy Storage Economic Analysis of Multi-Application Scenarios in an Electricity Market: A Case Study of China. Sustainability 2020, 12, 8703. [Google Scholar] [CrossRef] [Scilit]
- Yang, Z.; Li, C.; Wang, H.; Yang, J. Dynamic evolution of electricity price transmission effects from electricity-carbon market coupling under tradable green certificate price regulation. Energy 2025, 334, 137861. [Google Scholar] [CrossRef] [Scilit]
- Xie, X.; Ying, L.; Cui, X. Price Strategy Analysis of Electricity Retailers Based on Evolutionary Game on Complex Networks. Sustainability 2022, 14, 9487. [Google Scholar] [CrossRef] [Scilit]

Disclaimer/Publisher’s Note: The statements, opinions and data contained in all publications are solely those of the individual author(s) and contributor(s) and not of MDPI and/or the editor(s). MDPI and/or the editor(s) disclaim responsibility for any injury to people or property resulting from any ideas, methods, instructions or products referred to in the content. |
© 2026 by the authors. Licensee MDPI, Basel, Switzerland. This article is an open access article distributed under the terms and conditions of the Creative Commons Attribution (CC BY) license.