


Abstract
Multi-well fracturing serves as a common technology to increase reservoir permeability for shale gas and oil recovery. The swarm-like fractures from multi-well fracturing are controlled by the stress shadows between fractures. By employing optical fiber to monitor stress shadow characteristics among multiple horizontal wells in real time during fracturing, this study investigates the morphology and underlying causes of swarm-like fractures under various fracturing sequences. Experimental results indicate that Zipper fracturing enhances fracture propagation uniformity, while Alternate fracturing increases the breakdown pressure. The hydraulic fracture exhibits a staged propagation pattern, inducing a rapid transition from tension to compression strain around the fracture associated with strain-energy release. The maximum values within both the compressive and tensile zones of the stress shadow emerge at fracture initiation. Upon the completion of fracture propagation, the region within 40 mm of the fracture surface constitutes the tensile zone, while the area spanning 100 mm from the fracture represents the primary compressive zone of the stress shadow. Compared to Zipper fracturing, fractures in Sequential fracturing induce pronounced tensile strain concentration, yielding a larger tensile strain zone and causing the stress shadow of subsequent fracturing wells to affect the already completed wells. These findings delineate how stress-shadow interference governs the propagation of fracture swarms across multiple horizontal wells under controlled laboratory conditions. The results indicate that sequencing protocols can effectively modulate localized stress interference to promote more balanced fracture network development, thereby offering mechanistic insights into fracturing sequence optimization for unconventional reservoirs.
1. Introduction
Multi-well fracturing originates from volume fracturing, as it involves drilling multiple horizontal wells within a reservoir and executing multi-stage perforations in each well for simultaneous stimulation, thereby forming a complex volume fracture network across the reservoir space. Multi-well fracturing significantly improves reservoir stimulation efficiency and increases the economic benefits of the oilfield.
Staged fracturing technology in horizontal wells was gradually implemented in North America during the late 1990s, increasing alongside the continuous expansion of unconventional oil and gas exploration and development [1]. Through continuous research and field tests, the current staged fracturing of horizontal wells no longer merely pursues increasing fracture length but rather strives to maximize the comprehensive stimulation of the near-wellbore reservoir. By fully shattering the reservoir, multi-well fracturing technology effectively increases the effective stimulated reservoir volume [2]. The factory fracturing model significantly improves the utilization rate of fracturing tools and reduces the frequency of equipment movement and assembly, thereby enhancing overall operational efficiency. Under this factory fracturing model, avoiding mutual interference between adjacent wells constitutes the key issue for achieving comprehensive and balanced reservoir stimulation [3]. During traditional Sequential fracturing, an already fractured or producing parent well may compromise the fracturing effectiveness of subsequent child wells, thereby negatively impacting the ultimate development benefits of the entire well pad. The Zipper fracturing method [4] is proposed to reduce inter-well interference in the Eagle Ford shale. Recent years have also seen the application of Alternate fracturing to enhance reservoir stimulation uniformity [5]. However, it remains unclear how stress shadows between wells affect the propagation morphology of the swarm-like fractures.
The process by which a hydraulic fracture alters the local stress field to influence subsequent fracture growth is defined as stress shadows [6,7]. While the propagation of an isolated hydraulic fracture has been widely evaluated under various geometries and boundary conditions [8,9], theoretical treatments of multi-fracture stress interference typically approximate the cluster as an equivalent single fracture [10]. In parallel, experimental investigations and numerical simulations have identified the principal parameters governing stress shadows [11,12,13,14,15,16]. Wang et al. [6] investigated the fracture morphology characteristics under hydraulic fracturing across multiple horizontal wells, discovering that well spacing alters the influence range of the stress shadow, thereby inducing morphological changes in the hydraulic fractures. Numerous numerical simulation studies demonstrate that an optimal well spacing allows for the formation of appropriate branch fractures between wells, significantly increasing the complexity of the fracture network [17,18,19]. Excessively small well spacing facilitates the interconnection of fractures between wells, which reduces the complexity of the fracture network, whereas excessively large well spacing leads to a lack of branch fractures, causing insufficient local reservoir stimulation [20]. Current physical simulation experiments similarly reveal that the stress shadow effect causes fractures to preferentially extend toward adjacent wells during the initial fracturing stage [21]. However, existing research primarily focuses on the final fracture morphology characteristics following multiple well fracturing, failing to uncover the evolutionary relationship in real time between stress shadows and multiple well swarm-like fractures.
Optical fiber represents an emerging technology for monitoring hydraulic fracture propagation behavior in real time, holding the potential to serve as a signal source for inverting the characteristics of swarm-like fractures. The lab-scale experiments utilizing optical fiber can reveal the effects of stress shadows and improve the interpretation of field data regarding swarm-like fracture propagation. Previous studies have verified the applicability of optical fiber in characterizing fracture propagation behavior [22], prompting its gradual application in the field monitoring of hydraulic fracturing operations in recent years [23,24]. During single-stage or multi-stage fracturing within an individual horizontal well, laboratory experiments employing optical fiber have achieved the dynamic monitoring of fractures throughout the fracturing process [25,26,27,28]. The geophysical data sets highlight the critical role of Zipper fracturing sequences in dictating hydraulic fracture behavior [29]. However, the existing research mainly focuses on single wells and single stages, simulating the fracturing design of up to three wells and three stages at most, without discussing the fiber optic response characteristics under different fracturing sequences for multiple wells and stages. Consequently, utilizing optical fiber to investigate the dynamic propagation behavior of swarm-like fractures across multiple horizontal wells promises to reveal the mechanisms by which stress shadows control the final morphology of swarm-like fractures under different fracturing sequences.
This study conducted a large-scale true triaxial hydraulic fracturing experiment to simulate multi-well fracturing. The fiber Bragg grating (FBG) optical fiber is used to monitor the strain induced by hydraulic fracturing in sequence-forming swarm-like fractures. The artificial cubic specimen (600 × 300 × 300 mm) with three simulated horizontal wells and two simulated perforations in each well is used. Two groups of FBG sensors are set between the three horizontal wells. Each group contains five FBG sensors to monitor the strain from stress shadows during the fracture propagation. During the experiment, the strain of the FBG and the injection pressure are monitored in real time. After the experiment, the specimens are sectioned to check the relative position of the hydraulic fracture propagation trajectory and the FBG.
2. Experimental Design
2.1. Experimental Samples
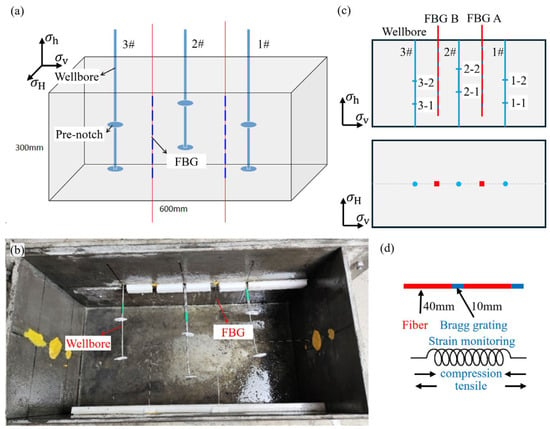
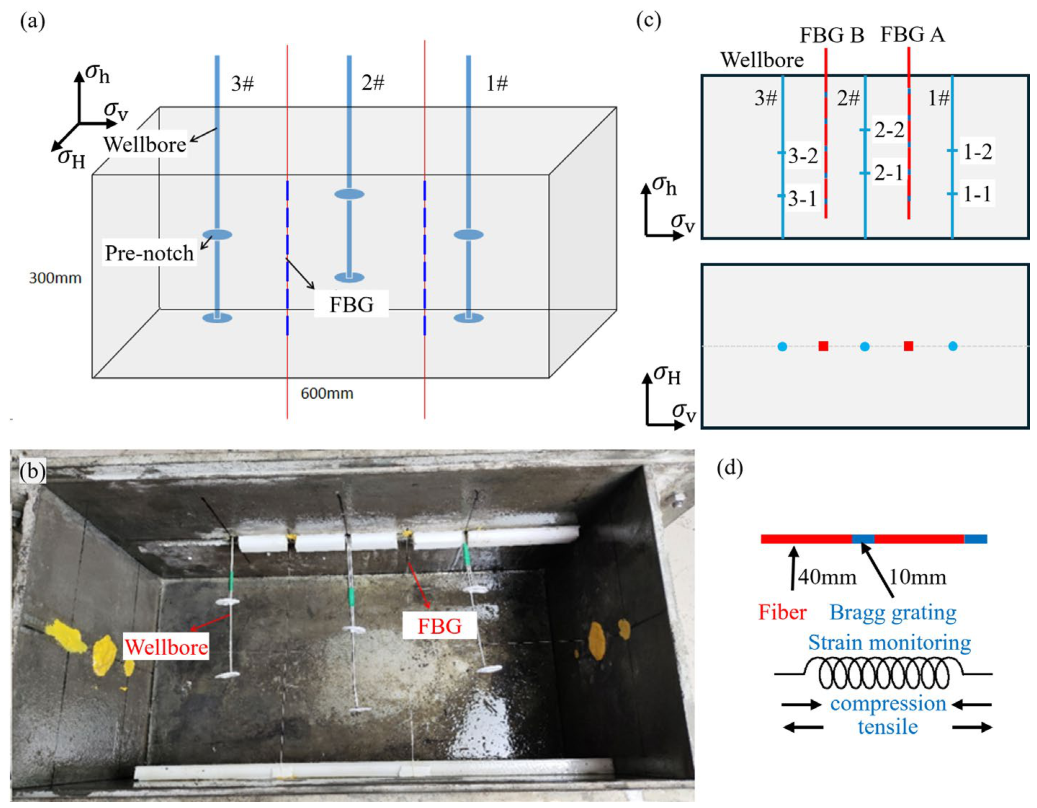
When the reservoir undergoes comprehensive stimulation utilizing multiple horizontal wells, deploying and simultaneously fracturing multiple wells on the same pad generates clustered hydraulic fractures within the reservoir. As Figure 1a illustrates, this experiment employs a large physical simulation specimen measuring 600 mm × 300 mm × 300 mm, prepared from Portland cement, quartz sand, and water at a mass ratio of 2:2:1, and subjected to an indoor curing period of 30 days. Following the ISRM-suggested methods [30], uniaxial compression and Brazilian disc tests were conducted on standard cylindrical and disc specimens to determine the elastic modulus, tensile strength, and Poisson’s ratio of the physical simulation specimen. The experimental samples exhibit an elastic modulus of 29.5 GPa, a tensile strength of 3.06 MPa, and a Poisson ratio of 0.23. The artificial samples have similar basic mechanical properties to Chang 7 sandstone [31], which shows an elastic modulus of 27.7 GPa, a tensile strength of 7.41 MPa, and a Poisson ratio of 0.241. In Figure 1a, the physical simulation specimen contains three horizontal wellbores aligned along the minimum principal stress direction, forcing the hydraulic fractures to propagate perpendicularly to the wellbores. As depicted in Figure 1c, wellbores 1#, 2#, and 3# lie within the same horizontal layer, with the well spacing set to 150 mm. The outer diameter of the injection well is 6 mm and the inner diameter is 3 mm. Simultaneously, each wellbore features two initiation points equipped with circumferential prefabricated cracks [5], thereby preventing differences in initiation angles from influencing the fracture propagation behavior. The initiation points across different wellbores remain mutually staggered, with the distance between initiation points within a single well consistently set to 80 mm.
Figure 1.
A sample setup for multi-horizontal well fracturing experiments under optical fiber monitoring. (a) The position of the FBG and wellbore for monitoring strain induced by hydraulic fracturing, (b) Wellbore and FBG placement before cement specimen pouring. (c) Fracture numbers of multiple horizontal wells. (d) FBG-monitoring strain induced by hydraulic fracturing.
In Figure 1c, optical fibers with a Bragg grating (FBG) are installed exactly between the horizontal wells, specifically deploying FBG A between wellbores 1# and 2#, and FBG B between wellbores 2# and 3#. The diameter of the FBG sensor is 1.5 mm. Placing the optical fibers and the horizontal well on the identical horizontal plane facilitates monitoring the strain characteristics induced by fracture initiation and propagation. According to Figure 1d, the optical fiber comprises a fiber segment and a Bragg grating segment measuring 40 mm and 10 mm in length respectively. Installing five equally long Bragg gratings on a single fiber yields a total of 10 measurement points within the physical simulation specimen, where the compressive and tensile deformations of the gratings reflect the internal compressive and tensile stresses of the specimen. As Figure 1b demonstrates, initially positioning the artificial wellbores and optical fibers inside the mold before pouring cement to cast the physical simulation specimen ensures excellent bonding among the wellbores, optical fibers, and the specimen, thereby guaranteeing the synchronous deformation of the optical fibers with the specimen while maintaining the fluid injection channel seal.
2.2. Experimental Procedure
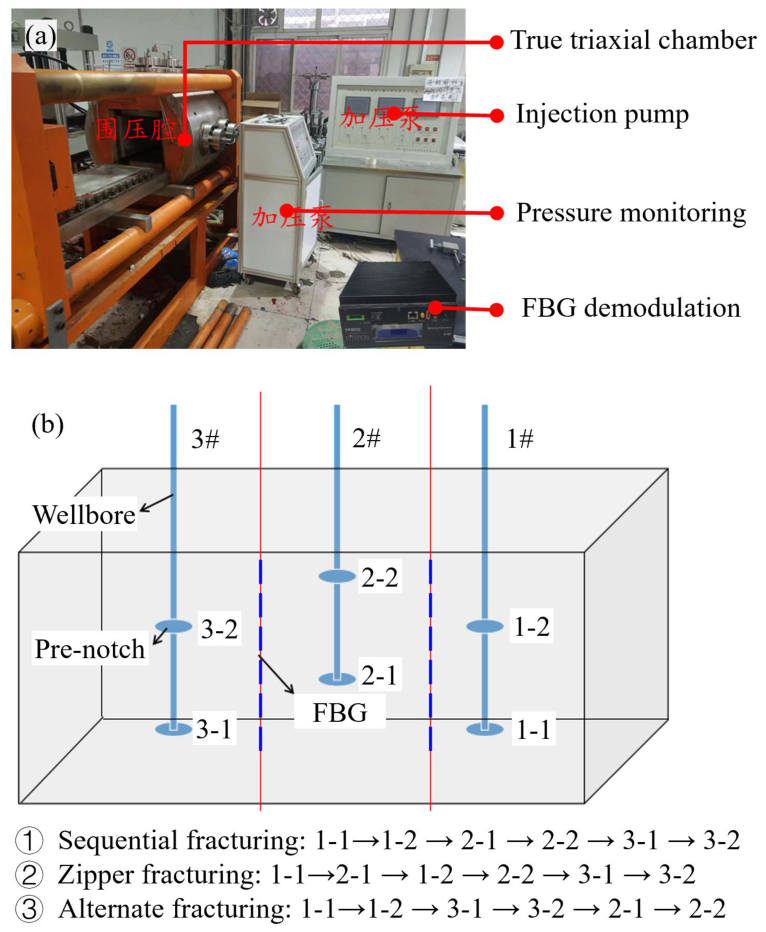
As Figure 2a illustrates, the physical simulation experiment takes place within a large-scale true triaxial hydraulic fracturing test system. This true triaxial hydraulic fracturing test system comprises a true triaxial loading chamber, a fracturing fluid injection pump, and a pressure monitoring module, while also featuring an MOI-S155 fiber Bragg grating modem. Table 1 details the parameter settings for the hydraulic fracturing physical simulation experiment across different fracturing sequences. Based on the in situ stress data from a fracturing pad in the Chang 7 reservoir of the Ordos Basin, the horizontal stress difference in this block concentrates between 3 MPa and 5 MPa, prompting the minimum horizontal principal stress σh to be set at 2 MPa, the maximum horizontal principal stress σH at 5 MPa, and the vertical principal stress σv at 10 MPa. Servo-hydraulic pumps control the three-dimensional stress loading individually within the true triaxial loading chamber at a loading rate of 0.1 MPa/min [32], since this relatively low loading rate prevents internal damage such as micro-cracks within the specimen. Maintaining the preset stress for 1 h ensures stress equilibration throughout the large-scale specimen, thereby achieving a uniform stress distribution internally. The experiment utilizes a fracturing fluid composed of a clear water-based fluid mixed with artificial guar gum at a 50:1 mass ratio to simulate the required viscosity, yielding a final prepared fracturing fluid viscosity of 100 mPa·s. The viscosity was measured using a rotational rheometer at a standardized shear rate of 170 s−1 under an ambient temperature of 25 °C. Employing this higher-viscosity fracturing fluid increases the hydraulic fracture width and enhances the fracture disturbance effect, which facilitates the characterization of the hydraulic fracture network. Furthermore, adding an appropriate amount of red dye to the fracturing fluid facilitates the observation of the hydraulic fracture morphology following the experiment.
Table 1.
Setup of physical simulation experiments.
Figure 2b designs three fracturing sequences, including Sequential fracturing, Zipper fracturing, and Alternate fracturing, to achieve clustered fracturing stimulation across multiple horizontal wells. In Sequential fracturing, the stimulation of wellbores 1#, 2#, and 3# proceeds sequentially by initially stimulating fractures 1-1 and 1-2 of wellbore 1#, subsequently targeting fractures 2-1 and 2-2 of wellbore 2#, and ultimately completing fractures 3-1 and 3-2 of wellbore 3#. For Zipper fracturing, the operation initially stimulates fracture 1-1 of wellbore 1# and subsequently targets fracture 2-1 of wellbore 2#, before returning to stimulate fracture 1-2 of wellbore 1#, ultimately completing fracture 2-2 of wellbore 2#, followed by fractures 3-1 and 3-2 of wellbore 3# in succession. In Alternate fracturing, the process returns to stimulate wellbore 2# only after completing wellbores 1# and 3#, specifically by initially executing fractures 1-1 and 1-2 of wellbore 1#, subsequently advancing to fractures 3-1 and 3-2 of wellbore 3#, and finally concluding with fractures 2-1 and 2-2 of wellbore 2#.
Following the three fracturing sequences, each experimental group executes the hydraulic fracturing process across three wellbores and six fractures. In this experiment, dedicated injection lines were employed to independently control the fluid injection for each individual fracture. For each fracture, the injection rate was maintained constant at 2 mL/min throughout the entire fracturing process. The total volume of fluid injected for a single fracture was strictly controlled at 15 mL, ensuring that the fluid volume retained within each fracture cavity remained consistent under the assumption of negligible fluid leak-off. Meanwhile, injecting a finite total volume of fluid helps prevent fractures from extending to the sample boundaries. Upon completion of fluid injection for each fracture, the inlet valve was shut in prior to pump cessation. Provided that the fracture did not communicate with the specimen boundaries, this procedure preserved internal fluid pressure and kept the fracture fully dilated. Upon completing the multiple horizontal well experiment according to the designed fracturing sequence, sectioning the test specimen along the plane of the horizontal wells extracts the distribution characteristics of the internal fracture network. Since the permeability of hydraulic fractures significantly exceeds that of intact regions, utilizing red water in fractures allows for the identification of hydraulic fractures, thereby enabling the mapping of their propagation trajectories.
During the hydraulic fracturing process, an MOI si155 interrogator records the strain data from the two optical fibers, featuring a measurement error of ±5 με and a sampling frequency of 1 Hz. The previous publication [33] details the specific analysis method for the optical fiber strain data. Fundamentally, an FBG sensor directly measures strain. The stress state is subsequently evaluated through the stress–strain constitutive relationship of the medium. The stress shadows induced by fracture propagation naturally manifest as coupled perturbation fields in both stress and strain around the fracture. Therefore, to reflect the direct physical response without introducing potential calculation uncertainties from assumed constitutive parameters, the subsequent discussions and analyses in this study are directly framed around the optical fiber strain response characteristics to characterize the stress shadow effects. Although one-dimensional optical fiber strain is difficult to reflect three-dimensional stress states, in this paper, the optical fiber is monitored in the direction perpendicular to the crack, where the stress shadow is most significant.
Figure 2.
Fiber optic monitoring multi-horizontal well fracturing experimental system and hydraulic fracturing design. (a) True triaxial hydraulic fracturing test system. (b) Sequential fracturing, Zipper fracturing, Alternate fracturing of multiple horizontal wells.
3. Results
3.1. Influence of Fracturing Sequence on Fracture Morphology
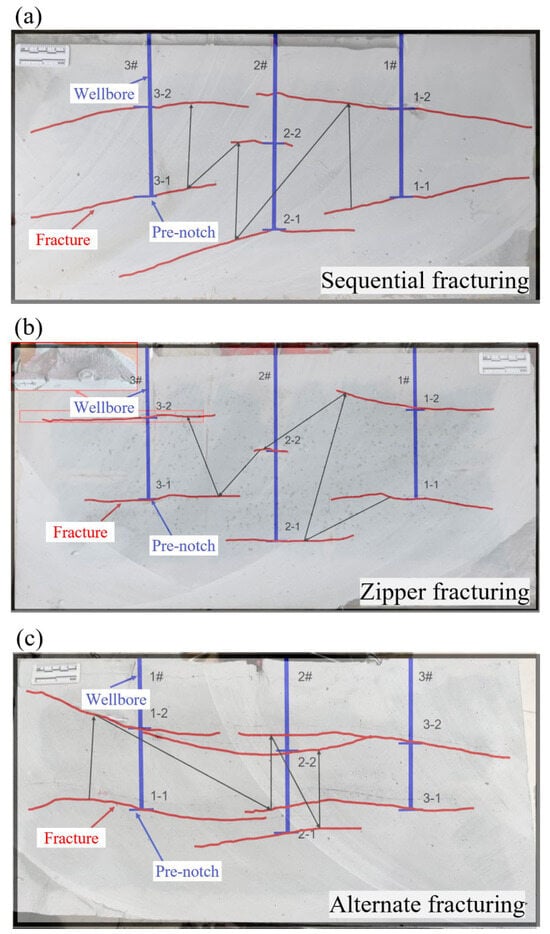
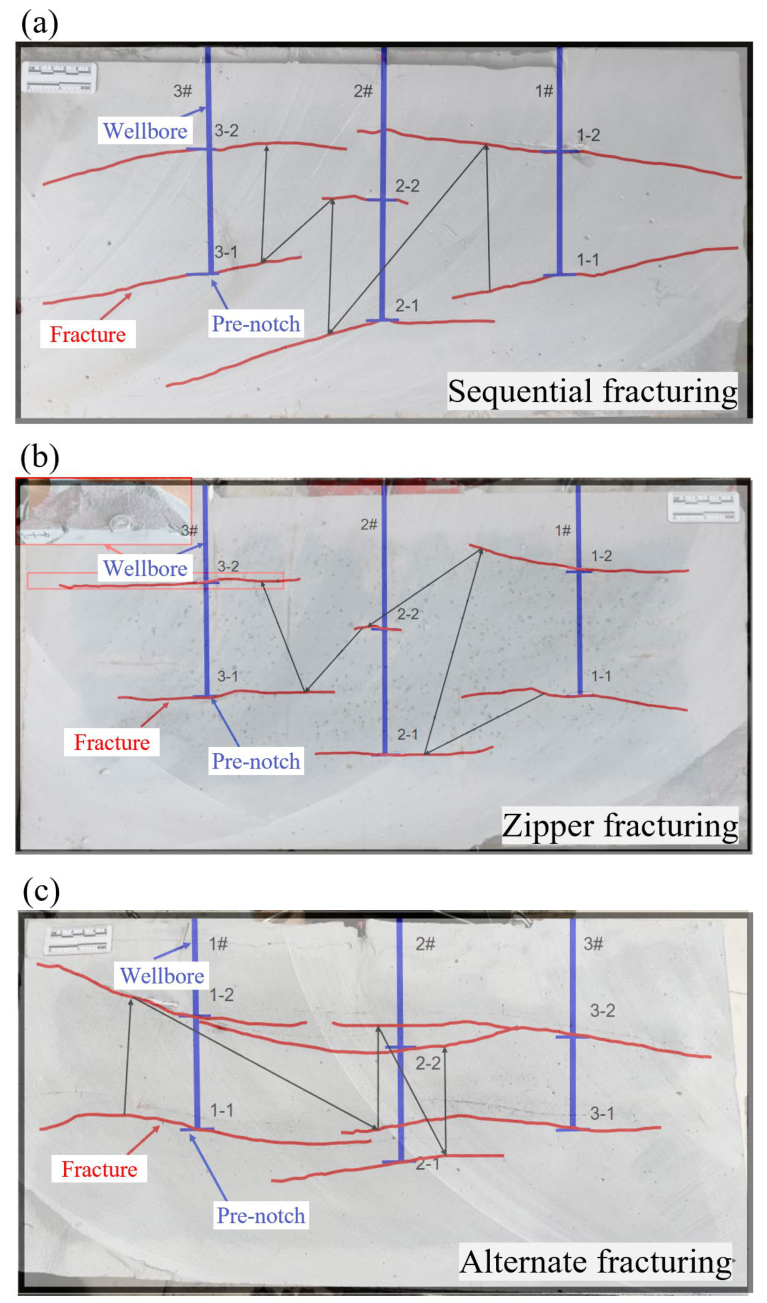
Figure 3 displays the cross-sectional photographs and fracture sketches of the specimens following stimulation under various fracturing sequences. Figure 3a shows that both Sequential fractures in wellbore 1# exhibit a relatively straight morphology. The fractures in wellbore 3# behave similarly to those in wellbore 1# but fail to reach the boundary. Fractures 2-1 and 2-2 of wellbore 2# display a substantial deflection angle, featuring asymmetrical propagation across both fracture wings. During Sequential fracturing, the prior stimulation of wellbore 1# influences one side of wellbore 2#, causing the fractures in wellbore 2# to deflect entirely toward the unstimulated side of wellbore 3#. Simultaneously, the propagation of fracture 2-2 of wellbore 2# experiences restriction, yielding an overall length significantly shorter than the other fractures. The propagation of fracture 1-1, fracture 1-2, and fracture 2-1 all exert an inhibitory effect on fracture 2-2. In contrast, within the ultimately fractured wellbore 3#, only fracture 3-1 exhibits asymmetrical length propagation under the preceding influence, whereas fracture 3-2 achieves ideal symmetrical propagation due to the limited development of the preceding fracture 2-2. Figure 3b illustrates the results of Zipper fracturing. Under the Zipper fracturing sequence, all fractures except fracture 2-2 demonstrate symmetrical propagation, maintaining essentially straight paths. Similar to Sequential fracturing, the completion of three previous fractures prior to the stimulation of fracture 2-2 restricts its propagation, rendering its fracture length far shorter than the others. Figure 3c depicts the results of Alternate fracturing. The two fractures in wellbore 1# reach the specimen boundary, remaining relatively straight overall. The subsequently stimulated fractures in wellbore 3# also achieve sufficient propagation. Unlike Sequential fracturing and Zipper fracturing, both fractures in wellbore 2# exhibit adequate propagation, even though the preceding fractures have already extended near the initiation points of wellbore 2#. Notably, in Figure 3c, the influence of the preceding fractures on subsequent fracture propagation manifests in two distinct outcomes. Fracture 2-2 experiences significant attraction from the preceding fractures 1-2 and 3-2, causing its propagation trajectory to curve clearly toward the existing fractures and ultimately interconnect with these previously stimulated fractures. Conversely, fracture 2-1 displays the opposite propagation characteristics, suffering repulsion from the preceding fractures 1-1 and 3-1, which forces its propagation trajectory to deflect away from these earlier fractures.
Figure 3.
Fracture morphology of multiple horizontal well fractures. (a) Sequential fracturing, (b) Zipper fracturing, (c) Alternate fracturing.
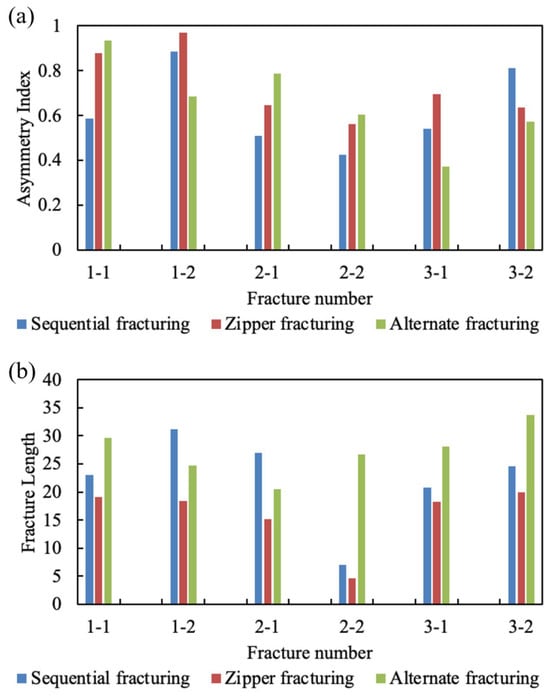
As presented in Figure 3, fracture propagation trajectories were captured across the sectioned specimen surfaces, and the curved fracture lengths were quantitatively evaluated via FracPaQ [34]. Specifically, the pixel path along each fracture trace was digitized and converted into real physical lengths using a calibrated scale bar. Benefiting from high-resolution digital imaging and rigorous spatial calibration, the measurement error associated with the fracture length is negligible in Figure 4. For each induced fracture, the length ratio between the fracture segments on both sides of the wellbore defines the asymmetry index. This asymmetry index evaluates the symmetrical characteristics of fracture propagation under various fracturing sequences, where a value approaching 1 indicates highly similar fracture lengths on both sides of the wellbore. In Figure 4a, most fractures associated with Well 1 demonstrated good symmetry under various fracturing sequences, while fracture 1-1 of Sequential fracturing exhibited poor symmetry because of specimen boundary interference. Comparing the different fracturing sequences reveals that the asymmetry index for Zipper fracturing generally remains within the highest range from 0.56 to 0.97. Especially during the initial stage, fracture 1-1 at 0.88 and fracture 1-2 at 0.97 display nearly perfect symmetrical propagation across both wings. Even upon entering wellbores 2# and 3#, which suffer interference from adjacent fractures, their symmetry stabilizes above 0.56, avoiding any obvious extreme unilateral imbalance. During Sequential fracturing, fracture 1-2 at 0.88 and fracture 3-2 at 0.81 possess excellent symmetry across both wings. However, the tendency toward unilateral propagation significantly intensifies for fractures located in the central region, with fracture 2-1 dropping to approximately 0.51, fracture 2-2 sliding further to roughly 0.42, and fracture 3-1 reaching only 0.54. Regarding Alternate fracturing, the initial fractures possess extremely high symmetry, where fracture 1-1 achieves an asymmetry index of approximately 0.94, and fracture 2-1 maintains a value of 0.79. Comparing the mean asymmetry indices of fractures under different fracturing sequences reveals that Zipper fracturing reached the highest value (0.73), whereas Alternate fracturing (0.65) and Sequential fracturing (0.62) exhibited comparable levels. Figure 4b indicates that although Zipper fracturing yields the most symmetrical propagation across both wings, its total length remains the lowest among the three modes, featuring conventional fracture lengths generally ranging from 15 to 20 cm, while fracture 2-2 suffers severe suppression below 5 cm. Alternate fracturing produces the highest overall fracture lengths that generally range from 20.5 to 33.5 cm, where the most significant breakthrough involves overcoming the stress shielding effect on fracture 2-2 to achieve a remarkable length of approximately 26.5 cm. Under Sequential fracturing, fracture 2-2 suffers a dual degradation, experiencing a precipitous drop in length to only about 7 cm alongside severely insufficient symmetry at just 0.42. Consequently, Alternate fracturing maximizes the fracture length while maintaining favorable symmetry for the majority of the fractures. Zipper fracturing achieves the highest fracture symmetry, yet it yields the lowest total length among the three fracturing sequences. The total fracture length was greatest for Alternate fracturing (163 mm), followed by Sequential fracturing (133 mm), while Zipper fracturing exhibited the lowest total length (95 mm).
Figure 4.
Fracture lengths and asymmetry index in different fracturing sequences.
3.2. Influence of Fracturing Sequence on Breakdown Pressure
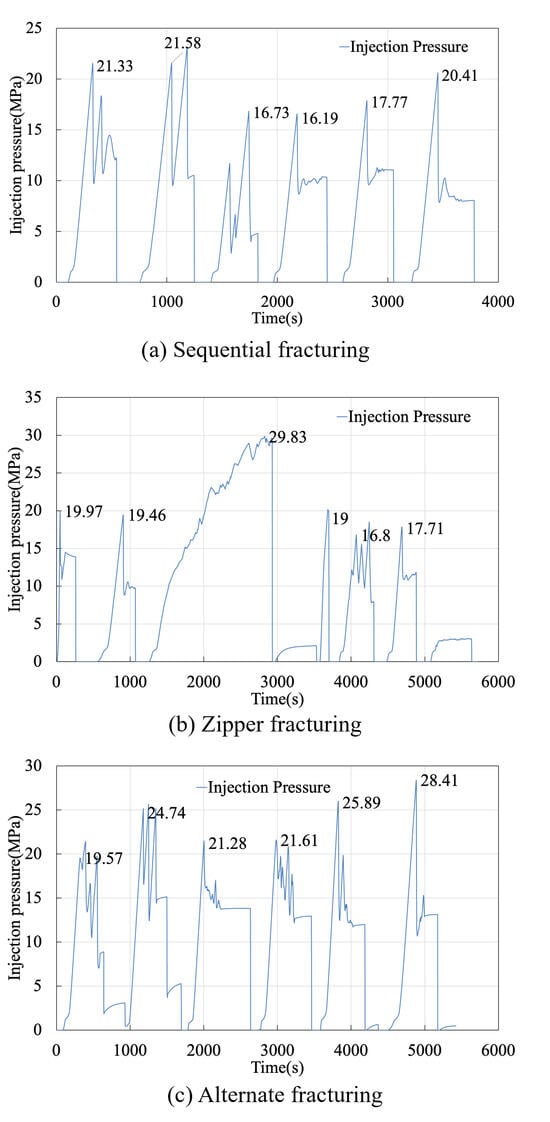
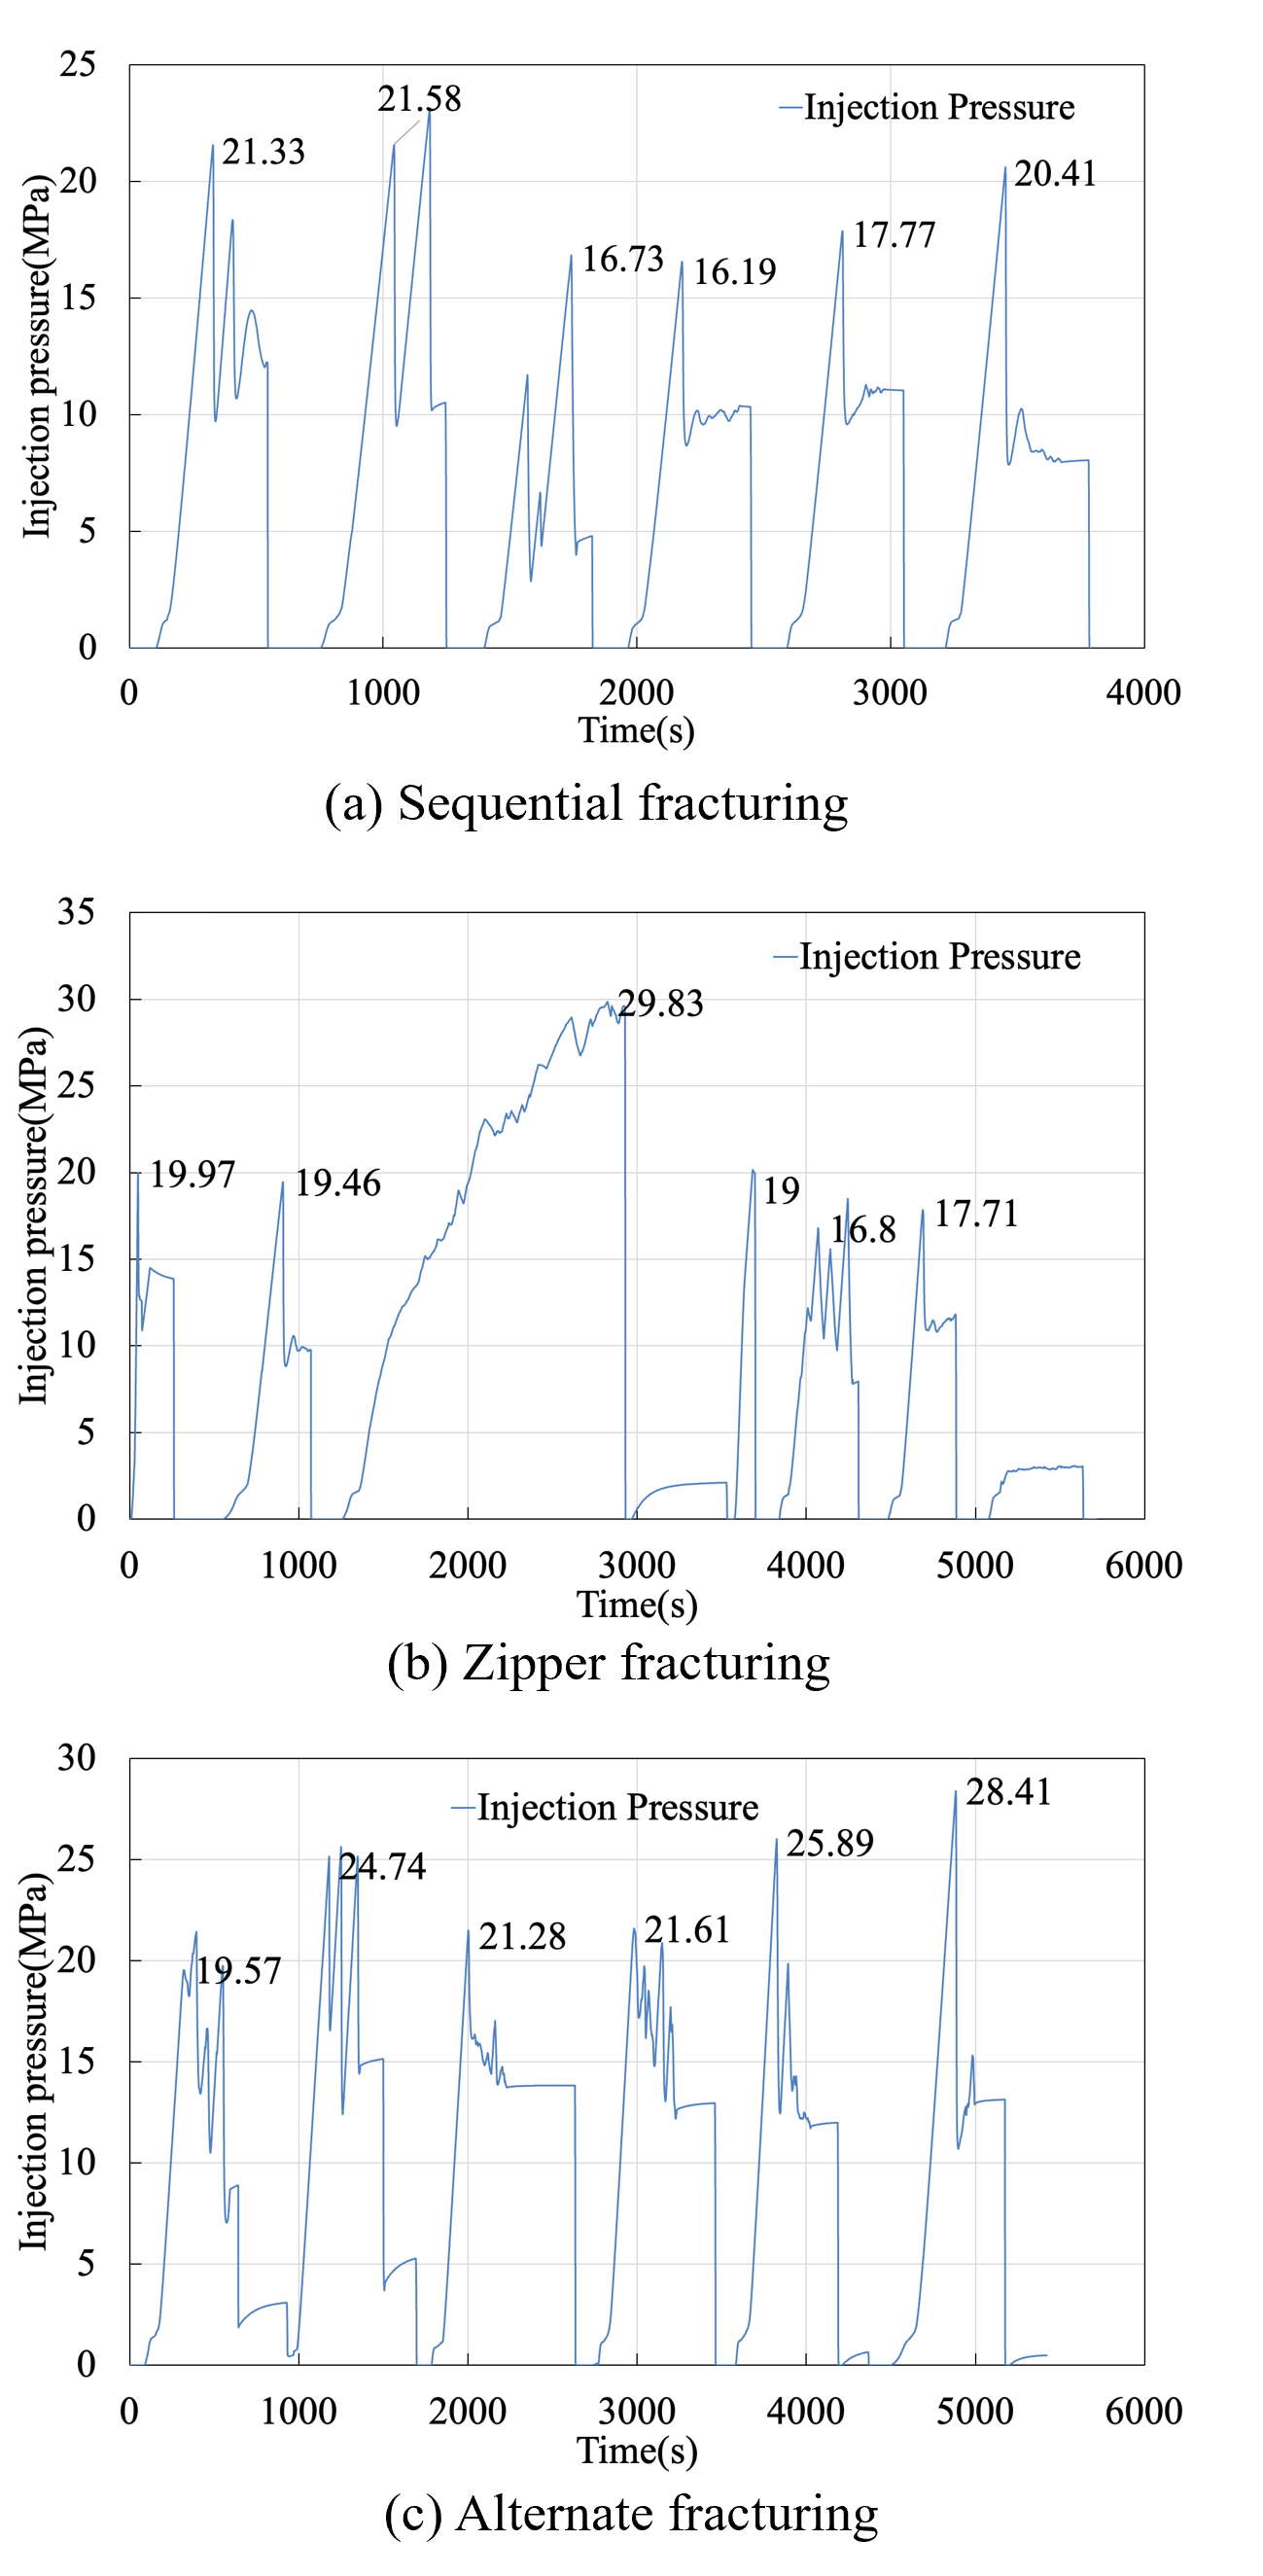
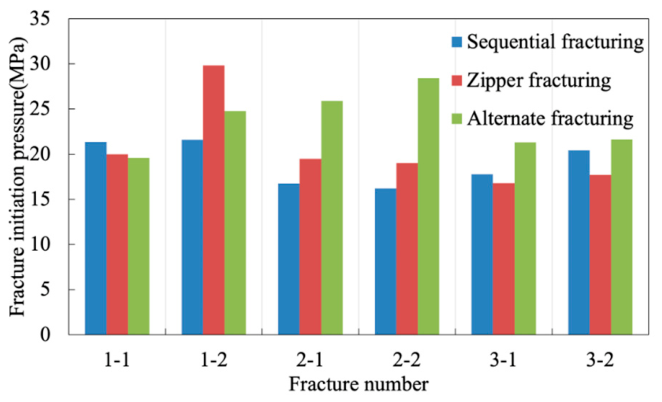
Figure 5 displays the injection pressure curves of the fractures under various fracturing sequences. Comparing the injection pressures of the first fractures across the three fracturing sequences reveals that the breakdown pressures range from 19.57 MPa to 21.33 MPa. The consistent materials and identical initial stress conditions across the three groups of experimental specimens produce fundamentally similar breakdown pressures for the first fracture (Figure 6), thereby verifying the reliability of the experimental design in this study. As Figure 5 indicates, the breakdown pressure of the second fracture during Sequential fracturing and Zipper fracturing remains essentially close to that of the first fracture. Figure 3a,b demonstrate that Sequential fracturing features an 80 mm spacing between the initiation point of the second fracture and the first fracture, whereas the initiation point of the second fracture during Zipper fracturing does not lie on either side of the initial fracture. While an 80 mm spacing effectively suppresses breakdown pressure interference for aligned planar fractures, this geometric threshold becomes insufficient when severe trajectory deflection occurs. Specifically, during Alternate fracturing, the breakdown pressure of the second fracture rose by 5.17 MPa at an 80 mm spacing due to localized stress reorientation and induced fracture deflection. Similarly, fracture 1-2 in Zipper fracturing exhibited a pronounced pressure elevation despite being more than 80 mm away from preceding fractures, confirming that stress-induced trajectory deflection overrides simple geometric distance in governing breakdown pressure behavior. The mean value of breakdown pressure indicates that Sequential fracturing (19 MPa) and Zipper fracturing (20 MPa) exhibit relatively similar breakdown pressures, both of which remain lower than the breakdown pressure observed during Alternate fracturing (23 MPa).
Figure 5.
Hydraulic fracturing injection pressure curve. (a) Sequential fracturing, (b) Zipper fracturing, (c) Alternate fracturing.
Figure 6.
The influence of fracturing sequence on the breakdown pressure.
The influence of preceding fractures on the breakdown pressure of subsequent fractures is remarkable. During Sequential fracturing, the first and second fractures open within the undisturbed native matrix. Conversely, the breakdown pressure for the third through fifth fractures drops by 3.6~5.4 MPa. Excluding the third fracture, the breakdown pressure during Zipper fracturing decreases by over 3 MPa after the fourth fracture. The Alternate fracturing curve reveals that the breakdown pressures of the first four fractures remain stable between 19.57 MPa and 24.74 MPa, whereas the final two fractures surge to the highest overall levels of 25.89 MPa and 28.41 MPa respectively, demonstrating an increase exceeding 8 MPa. As Figure 3a,b indicate, the initiation points of subsequent fractures primarily locate within the tip regions of the preceding fractures under Sequential fracturing and Zipper fracturing. A tensile damage zone exists at the hydraulic fracture tip [33,35], where micro-crack damage induced by high stress concentration at this tip reduces the initiation resistance for subsequent fractures. The even higher breakdown pressure of fracture 2-2 correlates directly with the deflection in its propagation direction.
4. Discussion
4.1. The Spatio-Temporal Distribution of Stress Shadows
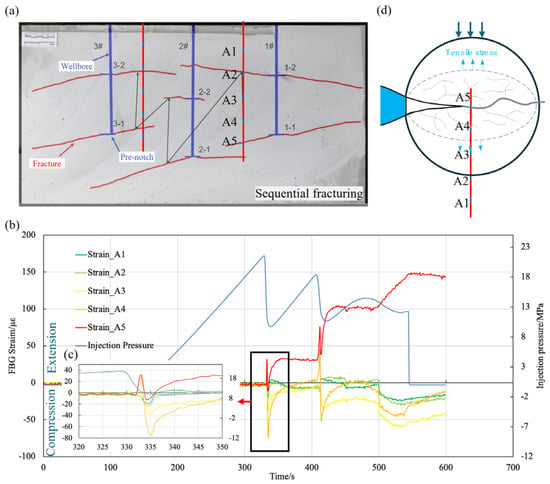
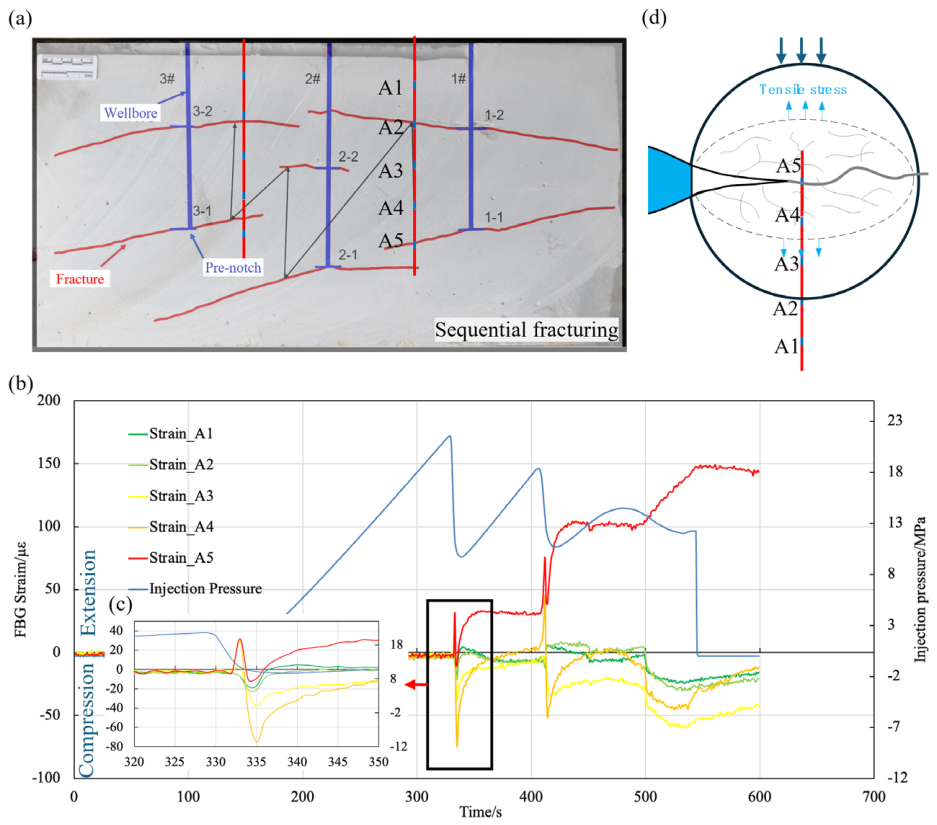
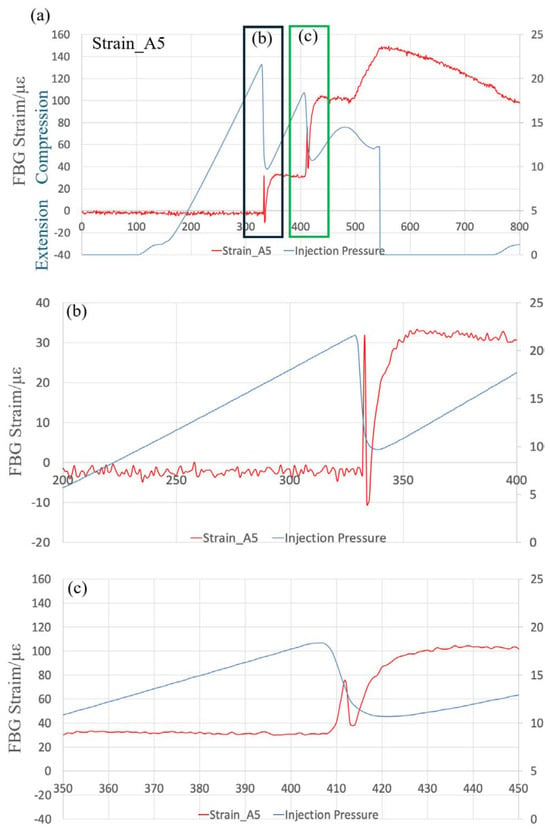
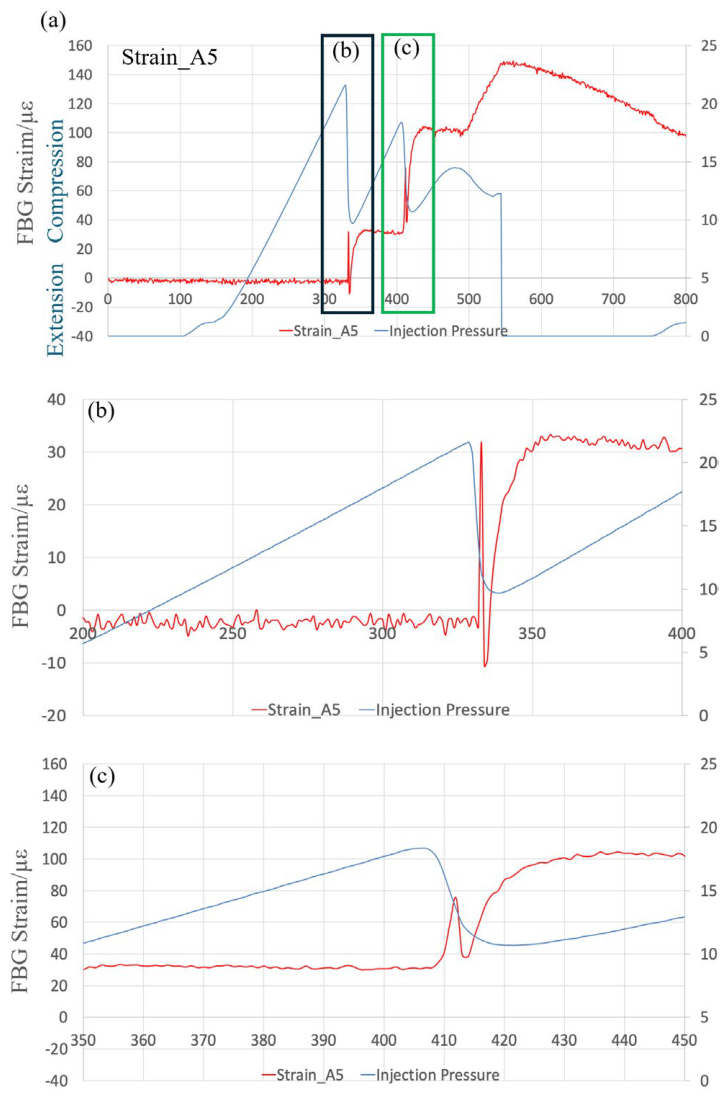
In Figure 7a, the relative positions of the fracture trajectory and the optical fiber measurement points on the specimen cross section clearly indicate that fracture 1-1 passes through grating measurement point A5 of FBG A. As Figure 7b shows, grating A5 correspondingly exhibits the maximum tensile strain when the injection pressure reaches its peak value at t = 320 s. FBG A4, adjacent to A5, similarly displays tensile strain during fracture initiation, possessing a tensile strain magnitude approximately equal to that of A5 (Figure 7c). However, following fracture initiation, the strain in A4 rapidly transitions from tension to compression, with its maximum compressive strain reaching 80 με. During the propagation of the hydraulic fracture, the injection pressure in Figure 7b exhibits stepwise fluctuations. Corresponding to the injection pressure fluctuations, the strains in A5 and A4 also undergo transitions from tension to compression, as Figure 8 illustrates. Figure 8b,c demonstrate that the strain transitions feature a magnitude of 30 με. The previous results also indicate a characteristic of elastic recovery after the fracture is generated [26]. The reported elastic recovery is about 37 με, which is close to our results. This indicates that the hydraulic fracture demonstrates an intermittent propagation behavior, inducing a rapid transition from tension to compression strain around the fracture associated with strain-energy release.
Figure 7.
Stress shadow induced by fracture propagation. (a) Fracture 1-1 propagated through sensing point Strain_A5 in the cross section, (b) the strain of the FBG sensor during the fracture propagation, (c) the strain of the FBG sensor for the fracture initiation, (d) tensile and compressive zones of a single fracture.
Figure 8.
Injection pressure fluctuations and elastic strain recovery correspond to staged fracture propagation. (a) The Strain of FBG A5 corresponds to injection pressure fluctuations, the enlarged view of first stage (b) and second stage (c) during the staged fracture propagation.
As Figure 7b indicates, during the intermittent fracture propagation stage where t ranges from 320 s to 500 s, the strains on both sides of the fracture primarily concentrate within FBG A3 through A5, rendering the strain responses of A1 and A2 negligible. At this moment, A5 and A4 exhibit tensile strain, whereas A1 through A3 display compressive strain. The strain types across the individual FBG measurement points identify A3 as the boundary separating the tensile and compressive zones of the stress shadow during the intermittent fracture propagation process. As illustrated in Figure 7d, dictated by the positions and dimensions of the FBG measurement points, the boundary between the tensile and compressive zones on both sides of the fracture falls within a 90 mm range from the fracture surface. Following the conclusion of the intermittent propagation stage where t > 500 s, the tensile strain of A5 continues to increase, indicating that the fracture process zone at this location keeps expanding after initiation, ultimately reaching a maximum strain of 150 με. In quasi-brittle geomaterials such as rock, macroscopic hydraulic fracturing is preceded by micro-crack nucleation and coalescence within a localized fracture process zone (FPZ). Physically, this displacement discontinuity of 1.5 μm represents the critical opening displacement at the onset of sub-critical micro-fracture opening prior to macroscopic hydraulic breakdown, rather than the final, fully pressurized macroscopic hydraulic fracture width. During this fracture width expansion process, FBGs A1 through A4 all exhibit compressive strain, among which the compressive strains of A1 and A2 located further from the fracture increase to 25 με. At this point, the boundary between the tensile and compressive zones on both sides of the fracture shrinks to within a 40 mm range from the fracture surface, while compressive strain appears as far as 200 mm away. Experimental studies on a single fracture have verified that the tensile zones on both sides of the crack are within a range of 20 mm from the fracture [33], which is lower than the monitoring results in this paper. This is related to the stress conditions applied. Within the compressive zone, the compressive strains of A3 and A4 approach 50 με, reaching twice the magnitude of those observed in A1 and A2. Therefore, the region spanning 100 mm from the fracture constitutes the primary compressive zone of the stress shadow.
During the experimental process of this study, the initiation of subsequent fractures across multiple horizontal wells consistently occurs only after the preceding fracture completes its propagation. When discussing the influence of the stress shadow from preceding fractures on subsequent ones, the analysis primarily considers the extent of the tensile and compressive zones after fracture propagation. The existing experiments mainly captured the inhibitory and turning effects of the compressive zones on both sides of the extended cracks on the newly extended cracks [25], but there was less discussion on the effects of the tensile zones. As Figure 7 clearly demonstrates, upon the completion of fracture propagation, the region within 40 mm of the fracture surface constitutes the tensile zone, whereas the area extending 100 mm from the fracture represents the primary compressive zone of the stress shadow. In the compressive zone of the stress shadow, micro-cracks remain under compressive closure, thereby increasing the resistance to macroscopic fracture propagation. Conversely, the dilation of micro-cracks within the tensile zone induces localized damage, which lowers the resistance to macroscopic crack growth. In Figure 3c for Alternate fracturing, the initiation locations of Fractures 2-1 and 2-2 lie within the compressive zones generated by preceding fractures, leading to a substantial escalation in breakdown pressure. The trajectory deflection of Fractures 2-1 and 2-2 is likewise dictated by stress-shadow interference. Because Fracture 2-1 experiences the compressive shadow on only one flank, it deflects toward the opposing side that is free from stress interference. For fracture 2-2, where both flanks are constrained by the compressive zones of preceding fractures, the crack path deflects toward the nearer tensile zone in accordance with the principle of minimum energy dissipation.
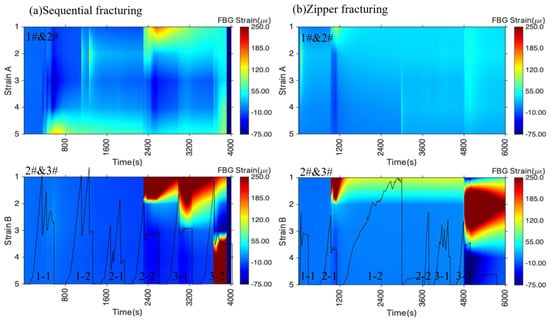
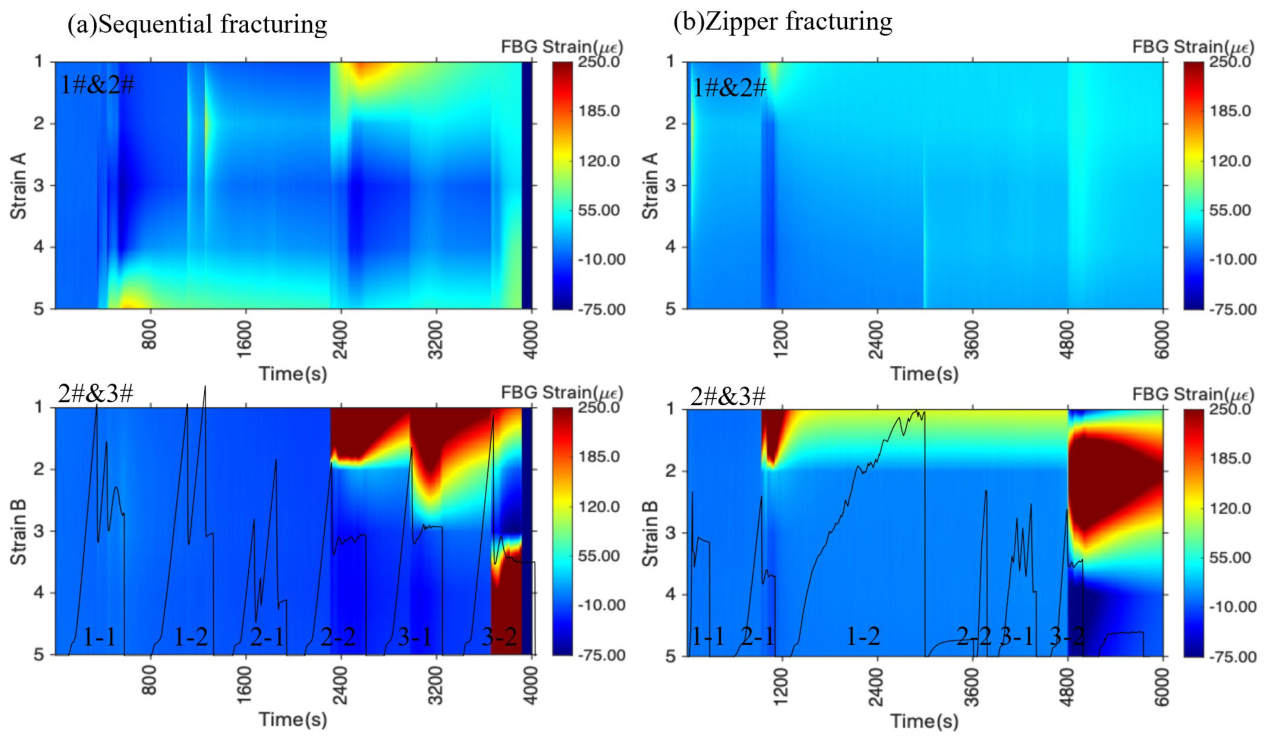
Converting the optical fiber monitoring data collected during Sequential fracturing and Zipper fracturing into waterfall plots yields Figure 9. Within these waterfall plots, the horizontal axis represents time, the vertical axis indicates the optical fiber measurement point number, and the color denotes the fluctuation amplitude of the optical fiber signal. Consistent with previous definitions, a positive optical fiber strain corresponds to tensile strain, whereas a negative value indicates compressive strain. The spatio-temporal response of the optical fiber strain corresponds to the stress shadow characteristics governing clustered fracture propagation under various fracturing sequences. Specifically, Strain A positions itself between wellbores 1# and 2#, while Strain B locates between wellbores 2# and 3#.
Figure 9.
The reconstructed spatio-temporal distribution of stress shadows in different fracturing sequences. (a) Sequential fracturing, (b) Zipper fracturing. Note: The continuous contour fields are reconstructed via two-dimensional numerical interpolation based on five discrete FBG sensors spaced at 50 mm intervals.
In Figure 9a, the stress shadow generated by the stimulation of wellbore 1# under Sequential fracturing fails to affect wellbore 3#, primarily forming tensile and compressive zones between wellbores 1# and 2#. As Figure 7b establishes, the maximum values within both the compressive and tensile zones of the stress shadow belonging to fracture 1-1 emerge at the fracture initiation, confining the tensile strain range within measurement point A5, which restricts the tensile zone to within 40 mm. Figure 9a further verifies that the other fractures also exhibit identical characteristics. Because Figure 3a demonstrates that the propagation trajectory of fracture 2-1 exceeds the optical fiber monitoring range, Figure 9a subsequently displays no strain response for this fracture. Conversely, fracture 2-2 of wellbore 2# simultaneously induces tensile strain across both Strain A and Strain B, achieving a tensile strain magnitude exceeding 250 με, which far surpasses the tensile strain of less than 50 με induced by the stimulation of wellbore 1#, yielding a tensile strain range approaching 50 mm. The tensile strain values induced by the subsequent stimulation of wellbore 3# similarly exceed 250 με, while simultaneously expanding the tensile strain range further to 100 mm. Although the tensile strain concentrates within Strain B during the stimulation of wellbore 3#, it simultaneously induces localized tensile strain within Strain A. Consequently, under Sequential fracturing conditions, the stress shadow of the previously stimulated well fails to affect the subsequently targeted well, whereas the stress shadow of the subsequently stimulated well clearly affects the previously completed well. Furthermore, the strain concentration regions in Figure 9a primarily feature tensile strain overall, exhibiting relatively small and uniformly distributed compressive strains induced by the fracturing process. Under Zipper fracturing, as shown in Figure 9b, the propagation of the remaining fractures fails to form strain concentration zones, with the sole exceptions being fracture 2-1 of wellbore 2# and fracture 3-2 of wellbore 3#, which induce significant tensile strain concentrations. Specifically, fracture 3-2 of wellbore 3# essentially traverses measurement point B2 of Strain B to form a symmetrical tensile strain concentration zone, which aligns with the heart-shaped tensile region [23] observed in field monitoring data. The unilateral extent of the tensile strain zone induced by fracture 3-2 remains within 50 mm. The tensile zone range induced by fracture 2-1 of wellbore 2# also falls within this identical interval. Comparing Figure 9a,b reveals that, relative to Zipper fracturing, the fractures in Sequential fracturing induce pronounced tensile strain concentrations featuring a larger tensile strain zone, while causing the stress shadow of the subsequently stimulated well to affect the previously completed wells. Therefore, Zipper fracturing achieves the most symmetrical propagation across both fracture wings, as depicted in Figure 3b [25].
4.2. Limitations and Field-Scale Implications
The dimensions of the experimental specimens in this study reached 600 mm × 300 mm × 300 mm, which is twice the size of those used in conventional physical simulation experiments (300 mm × 300 mm × 300 mm) [5,33]. However, when the hydraulic fractures propagated to the specimen boundaries, their propagation paths were altered due to size limitations, as observed in fractures 1-1 and 1-2 in Figure 3a,c. Although the fracture paths curved near the boundaries, these curved sections accounted for a small proportion of the total length, making their impact on the combined length of the six fractures negligible. For fractures 1-1 and 1-2, their extended lengths might be related to the bending of the induced fractures caused by the boundary effects. “It must be emphasized that the quasi-distributed FBG array used in this study features five discrete sensing nodes at a nominal pitch of 50 mm, defining the fundamental spatial resolution limit along the fiber. Consequently, characteristic zone boundaries such as 40, 90, 100, and 200 mm should be interpreted with caution. While 100 mm and 200 mm directly align with sensor nodes, zone boundaries below or between the 50 mm grid pitch (such as 40 mm and 90 mm) represent nominal threshold crossings derived from mathematical interpolation and theoretical attenuation trends rather than direct sub-gauge physical measurements. These spatial limits carry an inherent positioning uncertainty of approximately half the sensor spacing (±25 mm). Future research utilizing high-definition distributed optical fiber sensing (such as Rayleigh-based OFDR) will be instrumental in experimentally mapping these zone transitions at sub-millimeter resolution without spatial interpolation.
As shown in Figure 3, under the same total injection volume, Zipper fracturing yielded the minimum fracture length and the best symmetry, whereas Alternate fracturing and Sequential fracturing produced larger fracture lengths that were more influenced by the specimen boundaries. In future experiments, further increasing the specimen dimensions is expected to improve the accuracy of the laboratory results. Additionally, constrained by the number of experimental specimens, there are limitations to the observed influence patterns of stress shadows on the final fracture networks under different fracturing sequences. Nevertheless, the conclusion that the fracture networks formed by the three fracturing sequences exhibit significant differences is definitive, which aligns with the findings of other researchers [5,6,25,36].
Therefore, our laboratory observations provide a working hypothesis emphasizing that translating sequence optimization to field-scale development requires further systematic validation across varying geologic settings. Although the tension–compression zones on both sides of the hydraulic fractures quantified in our laboratory experiments cannot be directly correlated with field-scale fractures, they indicate that field fracturing designs should pay close attention to the extent of the stress shadow regions on both sides of the fractures. Building on this, it is promising to utilize stress shadows to enhance fracturing efficiency. Furthermore, the elastic recovery process of the tension–compression transition corresponding to fracture initiation provides valuable guidance for determining the optimal timing for proppant addition in the field.
5. Conclusions
Multi-well fracturing is a common technology to increase reservoir permeability for shale gas/oil recovery. The swarm-like fractures from multi-well fracturing are controlled by the stress shadows between fractures. By employing optical fiber to monitor stress shadow characteristics among multiple horizontal wells in real time during the fracturing process, this study investigates the morphology and underlying causes of swarm-like fractures under various fracturing sequences. The main conclusions are as follows.
(1) Alternate fracturing maximizes the fracture length while ensuring that the majority of fractures maintain favorable symmetry. Conversely, Zipper fracturing achieves the highest fracture symmetry, yet it yields the lowest total length among the three modes. Sequential fracturing produces relatively poor fracture symmetry and moderate fracture lengths. Sequential fracturing and Zipper fracturing exhibit relatively similar breakdown pressures, both remaining lower than the breakdown pressure observed during Alternate fracturing. Across all fracturing sequences, the influence of preceding fractures on the breakdown pressure of subsequent fractures is remarkable.
(2) The hydraulic fracture exhibits a staged propagation pattern, inducing a rapid transition from tension to compression strain around the fracture associated with strain-energy release. The maximum values within both the compressive and tensile zones of the stress shadow emerge at the breakdown pressure. Upon the completion of fracture propagation, the region within 40 mm of the fracture surface constitutes the tensile zone, whereas the area extending 100 mm from the fracture represents the primary compressive zone of the stress shadow.
(3) Under the specific true-triaxial experimental conditions tested in this study, fractures created during Sequential fracturing exhibited more pronounced tensile strain localization than those during Zipper fracturing. As fracturing progressed within the physical model, the tensile perturbation zone gradually expanded to surpass that of the Zipper configuration, indicating that stress shadows from subsequently stimulated stages exerted notable mechanical interference on prior stages.
Author Contributions
M.Z.: Conceptualization, Methodology, Investigation, Funding acquisition, Writing—original draft; Y.Z.: Data curation, Validation, Visualization; X.Z.: Data curation, Investigation; W.Z.: Writing—review and editing, Funding acquisition; Y.G.: Data curation, Validation. All authors have read and agreed to the published version of the manuscript.
Funding
The authors wish to acknowledge the support from China Postdoctoral Science Foundation (2026M793250), National Natural Science Foundation of China (U23B2083).
Data Availability Statement
The original contributions presented in this study are included in the article. Further inquiries can be directed to the corresponding author.
Conflicts of Interest
Author Yiwei Zhang was employed by the company PetroChina Changqing Oilfield Company. Author Xuelin Zheng was employed by the company Sinopec Shengli Oilfield Company. The remaining authors declare that the research was conducted in the absence of any commercial or financial relationships that could be construed as a potential conflict of interest.
References
- Rickman, R.; Mullen, M.; Petre, E.; Grieser, B.; Kundert, D. A practical use of shale petrophysics for stimulation design optimization: All shale plays are not clones of the Barnett Shale. In Proceedings of the SPE Annual Technical Conference and Exhibition, Denver, CO, USA, 21–24 September 2008; p. SPE–115258–MS. [Google Scholar]
- Thompson, J.; Franciose, N.; Schutt, M.; Hartig, K.; McKenna, J. Tank Development in the Midland Basin, Texas: A case study of super-charging a reservoir to optimize production and increase horizontal well densities. In Proceedings of the SPE/AAPG/SEG Unconventional Resources Technology Conference, Houston, TX, USA, 23–25 July 2018; p. D023S035R005. [Google Scholar]
- Gupta, I.; Rai, C.; Devegowda, D.; Sondergeld, C.H. Fracture hits in unconventional reservoirs: A critical review. SPE J. 2021, 26, 412–434. [Google Scholar] [CrossRef] [Scilit]
- Rafiee, M.; Soliman, M.Y.; Pirayesh, E. Hydraulic fracturing design and optimization: A modification to zipper frac. In Proceedings of the SPE Annual Technical Conference and Exhibition, San Antonio, TX, USA, 8–10 October 2012; p. SPE–159786–MS. [Google Scholar]
- Wang, W.; Zhang, G.; Cao, H.; Chen, L.; Zhao, C. Generation mechanism and influencing factors of fracture networks during alternate fracturing in horizontal wells. Theor. Appl. Fract. Mech. 2023, 127, 104082. [Google Scholar] [CrossRef] [Scilit]
- Wang, Y.; Liu, N. Unstable propagation of hydraulic fractures under varying well spacing and initiation sequence of multiple horizontal wells considering shear stress shadows. Eng. Comput. 2023, 40, 2483–2509. [Google Scholar] [CrossRef] [Scilit]
- Fisher, M.K.; Heinze, J.R.; Harris, C.D.; Davidson, B.M.; Wright, C.A.; Dunn, K.P. Optimizing Horizontal Completion Techniques in the Barnett Shale Using Microseismic Fracture Mapping. In Proceedings of the SPE Annual Technical Conference and Exhibition, Houston, TX, USA, 26–29 September 2004. [Google Scholar]
- Warpinski, N.R.; Branagan, P.T. Altered-Stress Fracturing. J. Pet. Technol. 1989, 41, 990–997. [Google Scholar] [CrossRef] [Scilit]
- Detournay, E. Mechanics of Hydraulic Fractures. Annu. Rev. Fluid Mech. 2016, 48, 311–339. [Google Scholar] [CrossRef] [Scilit]
- Bunger, A.P. Analysis of the power input needed to propagate multiple hydraulic fractures. Int. J. Solids Struct. 2013, 50, 1538–1549. [Google Scholar] [CrossRef] [Scilit]
- Taghichian, A.; Zaman, M.; Devegowda, D. Stress shadow size and aperture of hydraulic fractures in unconventional shales. J. Pet. Sci. Eng. 2014, 124, 209–221. [Google Scholar] [CrossRef] [Scilit]
- Wong, S.-W.; Geilikman, M.; Xu, G. Interaction of Multiple Hydraulic Fractures in Horizontal Wells. In Proceedings of the SPE Unconventional Gas Conference and Exhibition, Muscat, Oman, 28–30 January 2013. [Google Scholar]
- Tang, X.; Rutqvist, J.; Hu, M.; Rayudu, N.M. Modeling Three-Dimensional Fluid-Driven Propagation of Multiple Fractures using TOUGH-FEMM. Rock Mech. Rock Eng. 2019, 52, 611–627. [Google Scholar] [CrossRef] [Scilit]
- Thompson, L.G. Horizontal well fracture interference—Semi-analytical modeling and rate prediction. J. Pet. Sci. Eng. 2018, 160, 465–473. [Google Scholar] [CrossRef] [Scilit]
- Vidma, K.; Abivin, P.; Fox, D.; Reid, M.; Ajisafe, F.; Marquez, A.; Yip, W.; Still, J. Fracture geometry control technology prevents well interference in the Bakken. In Proceedings of the SPE Hydraulic Fracturing Technology Conference and Exhibition, The Woodlands, TX, USA, 5–7 February 2019; p. D011S001R003. [Google Scholar]
- Nagel, N.B.; Sanchez-Nagel, M. Stress shadowing and microseismic events: A numerical evaluation. In Proceedings of the SPE Annual Technical Conference and Exhibition, Denver, CO, USA, 30 October–2 November 2011; p. SPE–147363–MS. [Google Scholar]
- Liu, X.; Rasouli, V.; Guo, T.; Qu, Z.; Sun, Y.; Damjanac, B. Numerical simulation of stress shadow in multiple cluster hydraulic fracturing in horizontal wells based on lattice modelling. Eng. Fract. Mech. 2020, 238, 107278. [Google Scholar] [CrossRef] [Scilit]
- Chen, X.; Li, Y.; Zhao, J.; Xu, W.; Fu, D. Numerical investigation for simultaneous growth of hydraulic fractures in multiple horizontal wells. J. Nat. Gas. Sci. Eng. 2018, 51, 44–52. [Google Scholar] [CrossRef] [Scilit]
- Wu, K.; Wu, B.; Yu, W. Mechanism analysis of well interference in unconventional reservoirs: Insights from fracture-geometry simulation between two horizontal wells. SPE Prod. Oper. 2018, 33, 12–20. [Google Scholar] [CrossRef] [Scilit]
- Duan, K.; Li, Y.; Yang, W. Discrete element method simulation of the growth and efficiency of multiple hydraulic fractures simultaneously-induced from two horizontal wells. Geomech. Geophys. Geo-Energy Geo-Resour. 2020, 7, 3. [Google Scholar] [CrossRef] [Scilit]
- Wang, L.; Duan, K.; Zhang, Q.; Li, X.; Jiang, R. Study of the Dynamic Fracturing Process and Stress Shadowing Effect in Granite Sample with Two Holes Based on SCDA Fracturing Method. Rock Mech. Rock Eng. 2022, 55, 1537–1553. [Google Scholar] [CrossRef] [Scilit]
- Zhang, G.; Xing, Y.; Wang, L. Comprehensive sandstone fracturing characterization: Integration of fiber Bragg grating, digital imaging correlation and acoustic emission measurements. Eng. Geol. 2018, 246, 45–56. [Google Scholar] [CrossRef] [Scilit]
- Ugueto, G.; Wu, K.; Jin, G.; Zhang, Z.; Haffener, J.; Mojtaba, S.; Ratcliff, D.; Bohn, R.; Chavarria, A.; Wu, Y.; et al. A Catalogue of Fiber Optics Strain-Rate Fracture Driven Interactions. In Proceedings of the SPE Hydraulic Fracturing Technology Conference and Exhibition, The Woodlands, TX, USA, 31 January–2 February 2023. [Google Scholar]
- Leggett, S.; Chen, M. Evaluation of a Rapid Diagnostic Tool to Estimate Geometry Evolution of Multiple Simultaneously Propagating Fractures from Crosswell Fiber-Optic Strain Measurements. SPE J. 2024, 29, 5991–6003. [Google Scholar] [CrossRef] [Scilit]
- Guo, T.; Zhang, Y.; Chen, M.; Liu, Y.; Qu, Z.; Dai, C.; Zhang, B.; Hu, Z.; Xue, L. True Triaxial Laboratory Study of the Strain Patterns Measured by Distributed Fiber Optics for Hydraulic Fracturing of Multilevel Horizontal Wells. SPE J. 2024, 30, 665–677. [Google Scholar] [CrossRef] [Scilit]
- Hou, B.; Zhang, Q.; Lv, J. Distributed Fiber Optic Monitoring of Asymmetric Fracture Swarm Propagation in Laminated Continental Shale Oil Reservoirs. Rock Mech. Rock Eng. 2024, 57, 5067–5087. [Google Scholar] [CrossRef] [Scilit]
- Wang, S.; Chen, M.; Lv, J.-X.; Zhang, K.-P.; Hao, Y.-L.; Yao, B.-W. Study of the evolution characteristics of fiber-optic strain induced by the propagation of bedding fractures in hydraulic fracturing. Pet. Sci. 2024, 21, 4219–4229. [Google Scholar] [CrossRef] [Scilit]
- Zhang, Y.; Guo, T.; Chen, M.; Qu, Z.; Hu, Z.; Zhang, B.; Xue, L.; Wang, Y. Real-time monitoring of rock fracture by true triaxial test using fiber-optic strain monitoring in adjacent wells. J. Rock Mech. Geotech. Eng. 2024, 17, 3762–3772. [Google Scholar] [CrossRef] [Scilit]
- Jin, G.; Ning, Y.; Gale, M.; Simmons, J.; Tura, A. Impact of natural fractures on hydraulic fracture propagation in Denver-Julesburg Basin: Insights from a decade of research. Lead. Edge 2024, 43, 806–814. [Google Scholar] [CrossRef] [Scilit]
- Kuruppu, M.D.; Obara, Y.; Ayatollahi, M.R.; Chong, K.P.; Funatsu, T. ISRM-Suggested Method for Determining the Mode I Static Fracture Toughness Using Semi-Circular Bend Specimen. Rock Mech. Rock Eng. 2013, 47, 267–274. [Google Scholar] [CrossRef] [Scilit]
- He, J.-C.; Zhang, K.-S.; Liu, H.-B.; Tang, M.-R.; Zheng, X.-L.; Zhang, G.-Q. Laboratory investigation on hydraulic fracture propagation in sandstone-mudstone-shale layers. Pet. Sci. 2022, 19, 1664–1673. [Google Scholar] [CrossRef] [Scilit]
- Qiu, R.; Zhang, G.; Zheng, X.; Luo, S.; Chen, H.; Zhao, J. Stress transfer law in laboratory hydraulic fracturing experiments. Sci. Rep. 2024, 14, 17287. [Google Scholar] [CrossRef] [Scilit] [PubMed]
- Zhou, D.; Zhang, G.; Xie, P.; Zhu, L.; Jin, R.; Lu, M.; Zheng, X. Investigation of hydraulic fracture propagation subjected to crack-parallel compressive stress. Eng. Fract. Mech. 2025, 327, 111499. [Google Scholar] [CrossRef] [Scilit]
- Healy, D.; Rizzo, R.E.; Cornwell, D.G.; Farrell, N.J.; Watkins, H.; Timms, N.E.; Gomez-Rivas, E.; Smith, M. FracPaQ: A MATLAB™ toolbox for the quantification of fracture patterns. J. Struct. Geol. 2017, 95, 1–16. [Google Scholar] [CrossRef] [Scilit]
- Zhang, M.; Zhang, G.; Zhu, W.; Zhou, D. Crack-parallel stress effects on energy dissipation mechanisms across fracture process zone in shale. Theor. Appl. Fract. Mech. 2025, 139, 105125. [Google Scholar] [CrossRef] [Scilit]
- Guo, T.; Wang, Y.; Chen, M.; Qu, Z.; Tang, S.; Wen, D. Multi-stage and multi-well fracturing and induced stress evaluation: An experiment study. Geoenergy Sci. Eng. 2023, 230, 212271. [Google Scholar] [CrossRef] [Scilit]

Disclaimer/Publisher’s Note: The statements, opinions and data contained in all publications are solely those of the individual author(s) and contributor(s) and not of MDPI and/or the editor(s). MDPI and/or the editor(s) disclaim responsibility for any injury to people or property resulting from any ideas, methods, instructions or products referred to in the content. |
© 2026 by the authors. Licensee MDPI, Basel, Switzerland. This article is an open access article distributed under the terms and conditions of the Creative Commons Attribution (CC BY) license.